 Lie Li
 Ryusei Sugita
 Kampei Yamaguchi
 Hiroyuki Togawa
 Ichiro Terashima
 Wataru Yamori
- 1Institute for Sustainable Agro-ecosystem Services, The University of Tokyo, Nishitokyo, Japan
- 2Research & Development Division, Stanley Electric Co., Ltd., Hatano, Japan
- 3Institute of Molecular Biology, College of Life Sciences, National Chung Hsing University, Taichung, Taiwan
The optimization of plant productivity in indoor horticulture relies heavily on artificial light systems, which serve as the primary light source for plant growth. Although light-emitting diodes (LEDs) have been extensively studied in recent decades, there is limited research on laser diodes (LDs). LDs offer several advantages, including single-wavelength coherent light, remote illumination via optical fibers that minimizes heat accumulation at the canopy level, a compact and lightweight design, and enhanced energy efficiency at high input current densities. This study investigated the impact of red LD light on plant photosynthesis and growth, exploring its potential applications in indoor horticulture. The research examined the gas exchange of tobacco plants (Nicotiana tabacum L. cv. Wisconsin-38) under six red LED and LD light sources with varying spectral characteristics. Two specific light sources were selected for further study: LED 664 (emission peak at 664 nm, waveband of 625~678 nm) and LD 660 (emission peak at 660 nm, waveband of 657~664 nm) as they demonstrated the greatest gas exchange efficiency among the tested LED and LD light sources. These two light sources were then evaluated for their effects on photochemical efficiency, carbohydrate accumulation and plant growth. The present study showed that compared with LED 664, LD 660 significantly increased Y(II), qL, and starch accumulation in tobacco leaves. Additionally, after 12 d of continuous irradiation with LD 660, tobacco and Arabidopsis plants exhibited increased photosynthetic capacity. Furthermore, all three investigated species, tobacco, Arabidopsis, and lettuce, showed greater shoot dry weights and leaf areas compared to those under LED 664. These findings suggest that LDs present significant advantages over LEDs for indoor plant production.
1 Introduction
The global population is projected to reach 9.7 billion by 2050, with 70% living in urban areas, which increases food demand while decreasing the agricultural workforce (UN, 2018, UN, 2022). Simultaneously, extreme climate events and geopolitical conflicts are exacerbating the global food crisis (Binns et al., 2021; Vogel et al., 2019; Behnassi and Haiba, 2022; Qu et al., 2023). Owing to its advantages over traditional farming methods, indoor horticulture can play a pivotal role in sustainable food production if key challenges such as energy, labor, and production unit economics are solved. If these challenges can be overcome, indoor horticulture offers benefits such as year-round plant production, reduced labor requirements, no geographical or natural restrictions, high land use efficiency, and precise environmental control (Kozai, 2013; Bantis et al., 2018). Identifying an optimal artificial light source is essential, as artificial lighting systems often represent a major capital expenditure due to their high energy consumption (Levine et al., 2024).
Conventional artificial light sources, such as high-pressure sodium (HPS), metal halide (MH), incandescent (INC) lamps, and fluorescent tubes (FTs), have been widely used in greenhouses and plant growth chambers. However, these options are limited as horticultural lighting solutions because their broad emission spectra and low electricity-to-light energy conversion efficiencies limit their effectiveness. Since the 1990s, light-emitting diodes (LEDs) have been increasingly adopted for plant growth, offering advantages such as adjustable spectral composition, lower heat emission, and longer lifespan (Bula et al., 1991; Massa et al., 2008; Bantis et al., 2018; Van Delden et al., 2021).
Compared with traditional light sources and LEDs, laser diodes (LDs) offer distinct advantages such as single-wavelength coherent light, compact size and lightweight design, remote light delivery, less heat generation, and high power conversion efficiency at high input current densities (Wierer et al., 2013, Wierer et al., 2014; Ooi et al., 2016). “Laser” is an acronym for “light amplification by stimulated emission of radiation.” In the stimulated emission process, an incoming photon of a specific frequency interacts with an excited atom, electron, or molecule, prompting a transition to a lower energy level. The released energy then transfers to the electromagnetic field, generating a new photon with the identical frequency, polarization, and direction as the incident photon. Consequently, LD light is a single-wavelength, phase-aligned and very intense light (Fain and Milonni, 1987; Klimek-Kopyra et al., 2021). Over recent decades, numerous studies have focused primarily on how light wavelengths affect plant growth and development (Ouzounis et al., 2015), leading to the conclusion that red (600~700 nm) and blue (400~500 nm) light are optimal wavelengths for promoting plant production in indoor horticulture (Van Delden et al., 2021). However, how variation in waveband width impacts photosynthesis and growth remains unclear. While LEDs typically emit light across relatively broad wavebands of approximately 50 nm, LDs emit light within an extremely narrow, adjustable wavelength, typically less than 10 nm. This narrow spectral output allows LDs to closely match the peak light absorption of chlorophyll. Because the absorption efficiency of chlorophyll decreases as the wavelength deviates from its peak, we hypothesis that LDs are theoretically more effective at promoting plant photosynthesis and growth (Taiz and Zeiger, 2015).
LDs also have the outstanding feature of being compact and lightweight. The laser chip itself typically measures between 100 µm and 3 mm, and the packaging in which the chip is embedded is similarly small, often only a few millimeters in size. LDs can efficiently transmit light over long distances via optical fibers and expand the irradiation range using diffusers, reducing heat generation near plants and conserving space (Hitz et al., 2012; Ooi et al., 2016; Murase, 2015). Furthermore, LDs have the potential to achieve high electricity-to-light conversion efficiency, even at elevated input power densities (Wierer et al., 2013; Wierer et al., 2014). Consequently, LDs are anticipated to increase crop yields while promoting environmentally friendly and energy-efficient practices in plant production.
Various plant species have demonstrated increased seed germination rates and enhanced resistance to certain biotic and abiotic stresses following laser seed irradiation (Krawiec et al., 2012; Klimek-Kopyra et al., 2020; Nadimi et al., 2022; Metwally et al., 2014; Gao et al., 2015, Gao et al., 2018; Siyami et al., 2018; Ali et al., 2020). Although these studies provide valuable insights, most have utilized different types of laser lights, such as solid-state lasers, gas lasers and diode lasers, primarily as short-term biostimulants (Klimek-Kopyra et al., 2021). Therefore, further research is essential for the full application of laser light in plant production as a primary artificial light source in indoor horticulture. In addition, while the importance of red light wavelengths in plant development and growth is well established, the specific effects of emission peak and spectral bandwidth precision remain underexplored. This study aimed to evaluate both the instantaneous and acclimatory effects of red light with varying emission peaks and bandwidths on the photosynthetic performance and growth of Arabidopsis, tobacco, and lettuce plants, using LDs and LEDs as light sources. Six red light sources, four LDs and two LEDs, were employed.
2 Materials and methods
We conducted two experiments using tobacco (Nicotiana tabacum L. ‘Wisconsin-38’), Arabidopsis thaliana (L.) Heynh ‘Col-0’, and lettuce (Lactuca sativa L. ‘Red Fire’).
2.1 Experiment 1. Effects of different red light spectra on photosynthesis
2.1.1 Plant materials and cultivation conditions
Tobacco seeds were sown in a 1:1 mixture of vermiculite and peat with initial nutrition (Metro-Mix 350J, Hyponex, Japan) in black plastic trays (24.0 cm3, 25 x 15 mm, and 45 mm in height). After germination, the seedlings were thinned to one plant per pot. The plants were then grown in a growth chamber (LPH-411SPC, Nippon Medical & Chemical Instruments, Japan) with a 10 h light/14 h dark cycle at an air temperature of 25/22°C and a relative humidity of 60 ± 5%. Light was provided by white fluorescent tubes at a photosynthetic photon flux density (PPFD) of 120 μmol m-2 s-1 at the plant level. The CO2 concentration was 400 μmol mol-1. After 25 d of seedling growth, four fully expanded young leaves from different plants were selected to measure gas exchange, and another set of four different plants was used to measure chlorophyll fluorescence parameters.
2.1.2 Gas exchange measurements
The net photosynthetic rate (Pn, μmol CO2 m-2 s-1) and stomatal conductance (gs, mol H2O m-2 s-1) were measured in fully expanded tobacco leaves using a portable gas exchange instrument equipped with a transparent leaf chamber (LI-6400XT and 6400-8, LI-COR Biosciences, Lincoln, NE, USA) (Joshi et al., 2017). These measurements were performed under leaf chamber conditions set at an air temperature of 24°C, a CO2 concentration of 400 μmol mol-1, and a leaf-to-air vapor pressure deficit (VPD) of 0.7–1.0 kP. The light sources included an LED 629 (peak wavelength 629 nm, waveband of 597~645 nm) (ISLM-150X150-RB, CCS Inc., Japan), an LED 664 (peak wavelength 664 nm, waveband of 625~678 nm) (3LH-100DPS, Nippon Medical & Chemical Instruments, Japan), an LD 635 (peak wavelength 635 nm, waveband of 631~638 nm) (HL63283HD, Ushio Inc., Japan), an LD 660 (peak wavelength 660 nm, waveband of 657~664 nm) (HL65213HD, Ushio Inc., Japan), an LD 673 (peak wavelength 673 nm, waveband of 669~677 nm) (HL67203HD, Ushio Inc., Japan), and an LD 690 (peak wavelength 690 nm, waveband of 685~693 nm) (HL69203HD, Ushio Inc., Japan), each providing a PPFD of 150 μmol m-² s-¹. Each of these six light sources was applied to each of the four leaves in a random sequence, and the data were recorded once the values stabilized. The spectra of these light sources were determined using a spectroradiometer (LA-105, Nippon Medical & Chemical Instruments Co., Ltd., Japan) and are shown in Figure 1. The intrinsic water use efficiency (WUEi, μmol CO2 mol-1 H2O) was calculated by dividing the Pn by the gs.
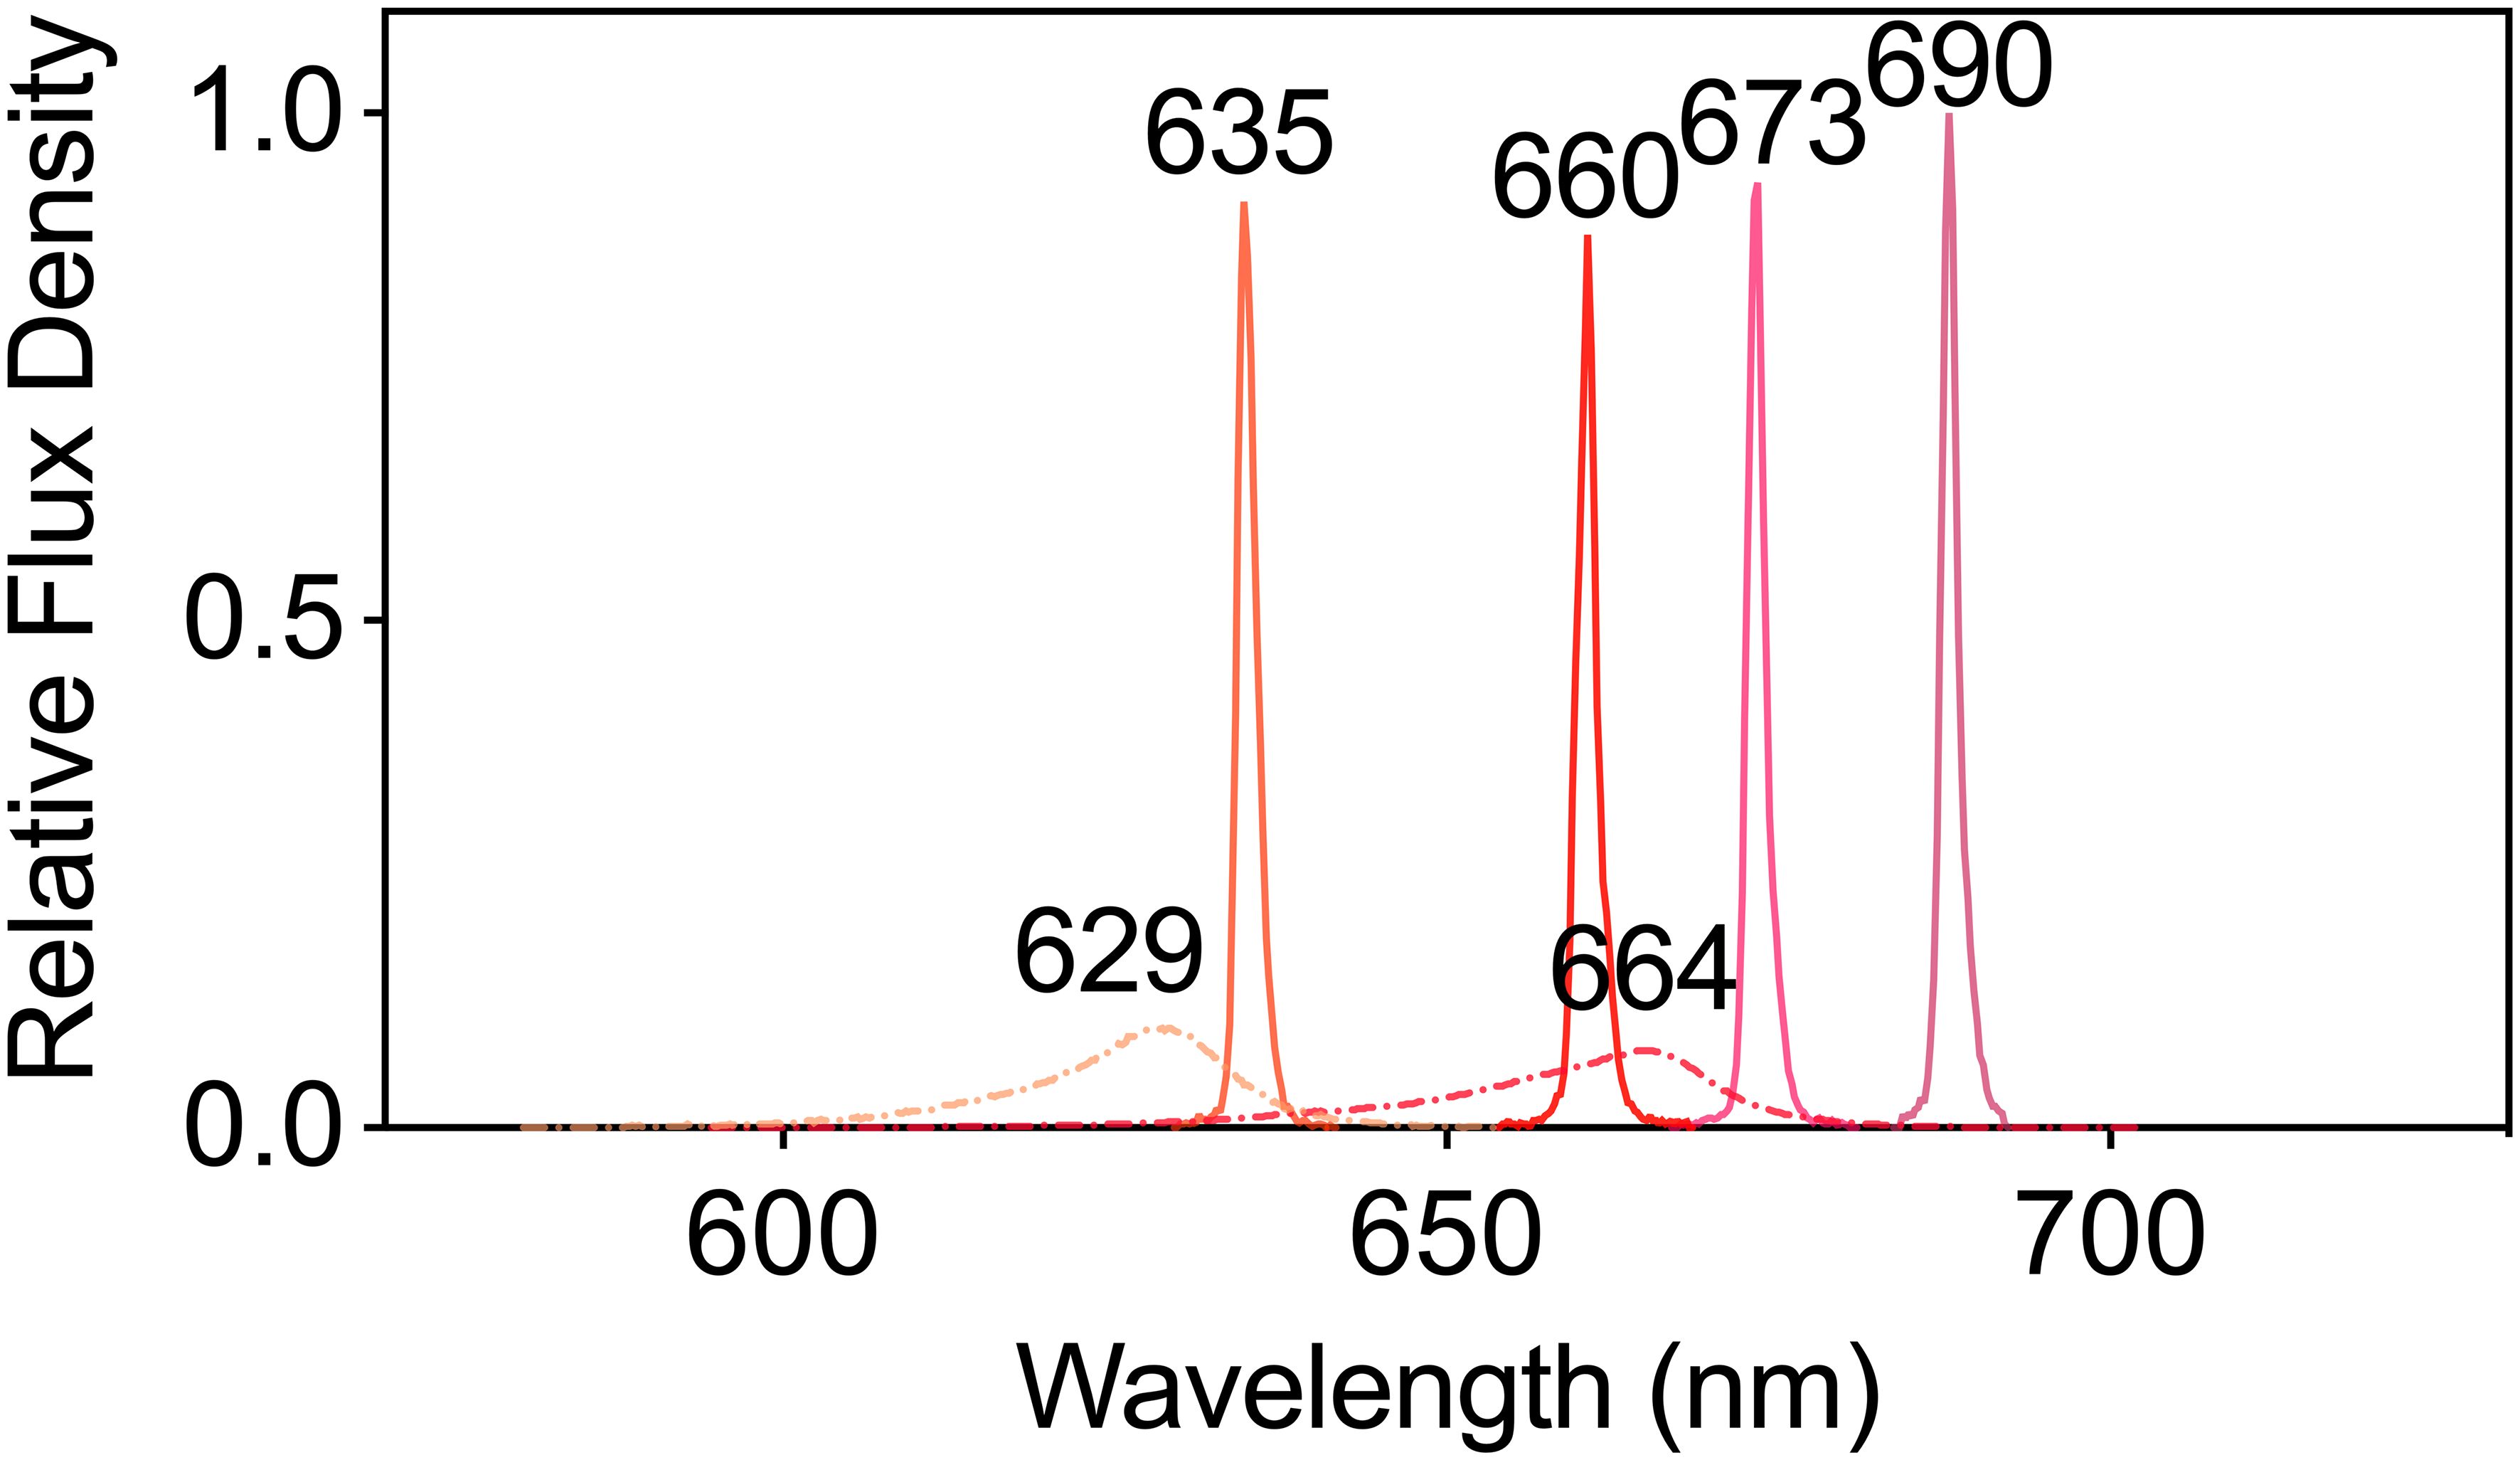
Figure 1. The spectra of plants subjected to six different LED and LD lights were used to test their photosynthetic performance. The dashed lines represent LED lights, whereas the solid lines represents LD lights.
2.1.3 Chlorophyll fluorescence analysis
We used LED 664 and LD 660 light sources to investigate the photochemical efficiency and redox state of PSII, as these light sources supported the highest photosynthetic rates reported in Section 2.1.2. The chlorophyll fluorescence parameters of fully expanded young leaves of tobacco plants were measured using a pulse amplitude modulation fluorometer (Junior-PAM, Heinz Walz GmbH, Germany) combined with fluorescence quenching analysis using saturation pulses. After the plant leaves were dark-adapted for approximately 30 min, the values of minimal fluorescence (Fo) and maximal fluorescence (Fm) were measured. Subsequently, either LED 664 or LD 660 at the same PPFD of 150 μmol m-² s-¹, was applied as the actinic light. Once a steady-state condition was reached, the steady-state fluorescence (Fs’) and maximum fluorescence in light (Fm’) were determined. Every four leaves from separate tobacco plants were applied in each actinic light condition. The minimum fluorescence in light (Fo’) was calculated as (Oxborough and Baker, 1997):
The quantum efficiency of PSII electron transport in light (Y(II)), nonphotochemical quenching (NPQ), and the estimated fraction of open PSII centers (qL) were calculated as follows (Hormann et al., 1994; Murchie and Lawson, 2013). The parameter Fo', used in the qL calculation, was determined using (Equation 1):
2.1.4 Carbohydrate accumulation
After 25 d of growth, as described in Section 2.1.1, the tobacco plants were illuminated with either of the light sources at a PPFD of 150 μmol m-2 s-1 for 8 h. The illumination was started at the same time each day. Leaves were detached from each plant and scanned with a scanner (CanoScan LiDE 220, Canon Inc., Japan), and their areas were measured using image analysis software (ImageJ 13.0.6, Wayne Rasband and contributors, National Institutes of Health, USA). The samples were placed into tin foil bags, quick-frozen in liquid nitrogen, and stored at –80°C until use.
The plant tissues were ground into powder in liquid nitrogen with a mortar and pestle. Each powdered sample was placed in a 2 mL tube. One milliliter of 80% EtOH was added, followed by vigorous vortexing. The samples were then heated to 80°C for 10 min in a block incubator to extract soluble sugars. The samples were subsequently centrifuged at 13,470 × g for 5 min at room temperature using a high-speed microcentrifuge (MX-307, Tomy Digital Biology Co., Ltd., Japan). The supernatant and pellet were separated for the determination of soluble sugars and starch, respectively. Starch degradation by glucoamylase and sucrose cleavage by invertase (β-fructosidase) were conducted according to the methods of Bergmeyer and Bernt (1974) and Schmidt (1961), respectively. The spectroscopic assays at 340 nm were conducted using a microplate reader (Synergy H1, BioTek Instruments, Inc., USA). The contents of soluble sugars and starch were then calculated based on these assays.
2.2 Experiment 2. Photosynthesis and plant growth under LED 664 and LD 660
2.2.1 Plant materials, light treatments, and cultivation conditions
We selected LED 664 and LD 660 for further experiments. Tobacco seeds were sown as described in Section 2.1.1. Arabidopsis seeds were sown in the substrate mix in plastic boxes (500 cm3, 95 x 80 mm and 65 mm in height), and the seedlings were thinned to three per box. Lettuce seeds were sown in rockwool cubes (40 x 30 mm and 40 mm in height), which were hydrated with distilled water and irrigated weekly with a 1/1000 strength nutrient solution with an NPK ratio of 6:10:5 (Hyponex, Hyponex, Japan). Seedlings of tobacco, Arabidopsis, and lettuce were grown under the conditions described in Section 2.1.1. When the plants developed three fully expanded true leaves (after 25 d for tobacco, 24~28 d for Arabidopsis, and 10 d for lettuce), we began continuous 24-h irradiation with LED 664 or LD 660 at a PPFD of 150 μmol m-2 s-1 for 12 d. The air temperature, relative humidity and ambient CO2 concentration were maintained at 24 ± 1°C, 60 ± 5%, and 400 μmol mol-1, respectively. We confirmed that temperature, humidity, and light intensity were identical in the cultivation environments of LED 664 or LD 660. To eliminate potential biases arising from positional differences, the plants were repositioned every day in a randomized manner to ensure uniform growth conditions. After 12 days of growth, the photosynthetic characteristics and growth indices were quantified using four pots per species and treatment, and pictures of the top surfaces of the plants were taken. This experiment was repeated three times.
2.2.2 Analysis of full width at half maximum, yield photon flux density, and phytochrome photoequilibria
The full width at half maximum (FWHM) is the horizontal distance (on the x-axis) between the two points where a spectral feature’s intensity equals half of its peak amplitude (Li et al., 2019).
The spectral photon distribution (SPD) of each treatment was determined using a spectroradiometer (LA-105, Nippon Medical & Chemical Instruments Co., Ltd., Japan), and the spectra are shown in Figure 1.
The yield photon flux density (YPFD) was calculated as follows:
where Nλ is the incident flux density of the SPD at wavelength λ, and RQE is the relative quantum efficiency at wavelength λ based on McCree (1972) and Sager et al. (1988).
The phytochrome photoequilibria (PPE) was calculated as follows:
where σrλ is the red absorbing state of phytochrome photochemical cross-sections at wavelength λ, and σfrλ is the far-red absorbing state.
2.2.3 Chlorophyll fluorescence analysis
The chlorophyll fluorescence parameters and canopy images of tobacco, Arabidopsis, and lettuce were measured using an imaging pulse amplitude modulation fluorometer equipped with a camera (Imaging PAM MAXI version, Heinz Walz GmbH, Germany) (Shimadzu et al., 2019). The actinic light source was blue light with a peak wavelength of 450 nm. After the plants were dark-adapted for approximately 30 min, the values of minimal fluorescence (Fo) and maximal fluorescence (Fm) were measured to determine the maximum quantum efficiency of PS II (Fv/Fm), which is equivalent to the Y(II) value at a PPFD of 0. The plants were subsequently illuminated at PPFDs of 37, 98, 189, 311, and 467 μmol m-2 s-1. After each PPFD was applied for 5 min, Fs’ and Fm’ were recorded. Y(II) and NPQ were calculated as described in Section 2.1.3. The Fv/Fm was calculated as follows (Hormann et al., 1994; Murchie and Lawson, 2013):
Images of the three plant species at each PPFD were captured. One representative image for each species and each treatment at a PPFD of 189 μmol m-2 s-1, which was the closest PPFD to the plant growth light condition.
2.2.4 Plant growth analysis
After treatment with LED 664 or LD 660 for 12 d, the tobacco, Arabidopsis, and lettuce plants were harvested, and the shoots (leaves) and roots were separated using sharp scalpels. The leaf area (cm2) was measured as described in 2.1.3. After that, the whole shoot was dried in an oven at 80°C for 72 h, and the shoot dry weight (mg) was determined. The leaf mass per area (mg cm-2) was calculated as the shoot dry weight divided by the leaf area.
2.3 Statistical analysis
To ensure the accuracy of the gas exchange statistical analyses and minimize the impact of individual differences, we analyzed the experimental data using a generalized linear mixed model (GLMM). Multiple comparisons of means were subsequently conducted with the Tukey–Kramer honest significant difference (HSD) test (P < 0.05) using R software version 4.2.2 (R Development Core Team, 2021). The gas exchange parameter data were visualized through box plots generated with GraphPad Prism 9 (GraphPad Software Inc., San Diego, CA, USA). In these plots, data dispersion was represented by the height of the box, whereas average values were indicated by the lines within the box. The maximum and minimum values are denoted by the highest and lowest points of the vertical line, respectively. The fitted PPFD response curves of the chlorophyll parameters were analyzed using nonlinear regression with GraphPad Prism 9, which employs the asymmetrical (five-parameter) equation. Additionally, comparisons of the data means, excluding gas exchange, were performed with a t test (*P < 0.05, **P < 0.01, and ***P < 0.001) using SPSS 26.0 statistical software (SPSS Inc., Chicago, IL, USA).
3 Results
3.1 Effects of different red light spectra on photosynthesis
The gas exchange parameters of tobacco leaves varied significantly with different red light sources (Figure 2). Among the LED and LD lights, the LED 664 and LD 660 lights presented the highest Pn values, with the rate of the LD 660 light being 19.1% higher than that of the LED 664 light. In contrast, leaves exposed to LED 629 and LD 635 had significantly lower Pn values than those exposed to LD 660 or LED 664. Leaves exposed to LD 673 and LD 690 showed the lowest photosynthetic rates (Figure 2A). For gs, tobacco leaves exposed to LD 660 and LED 664 exhibited high values, followed by slightly lower values in leaves irradiated with LED 629 and LD 635. The lowest gs was observed in leaves exposed to LD 673 and LD 690 (Figure 2B). The intrinsic water use efficiency (WUEi) was generally similar across the different light sources, with the highest efficiency observed under LD 660, followed by LED 664 (Figure 2C).
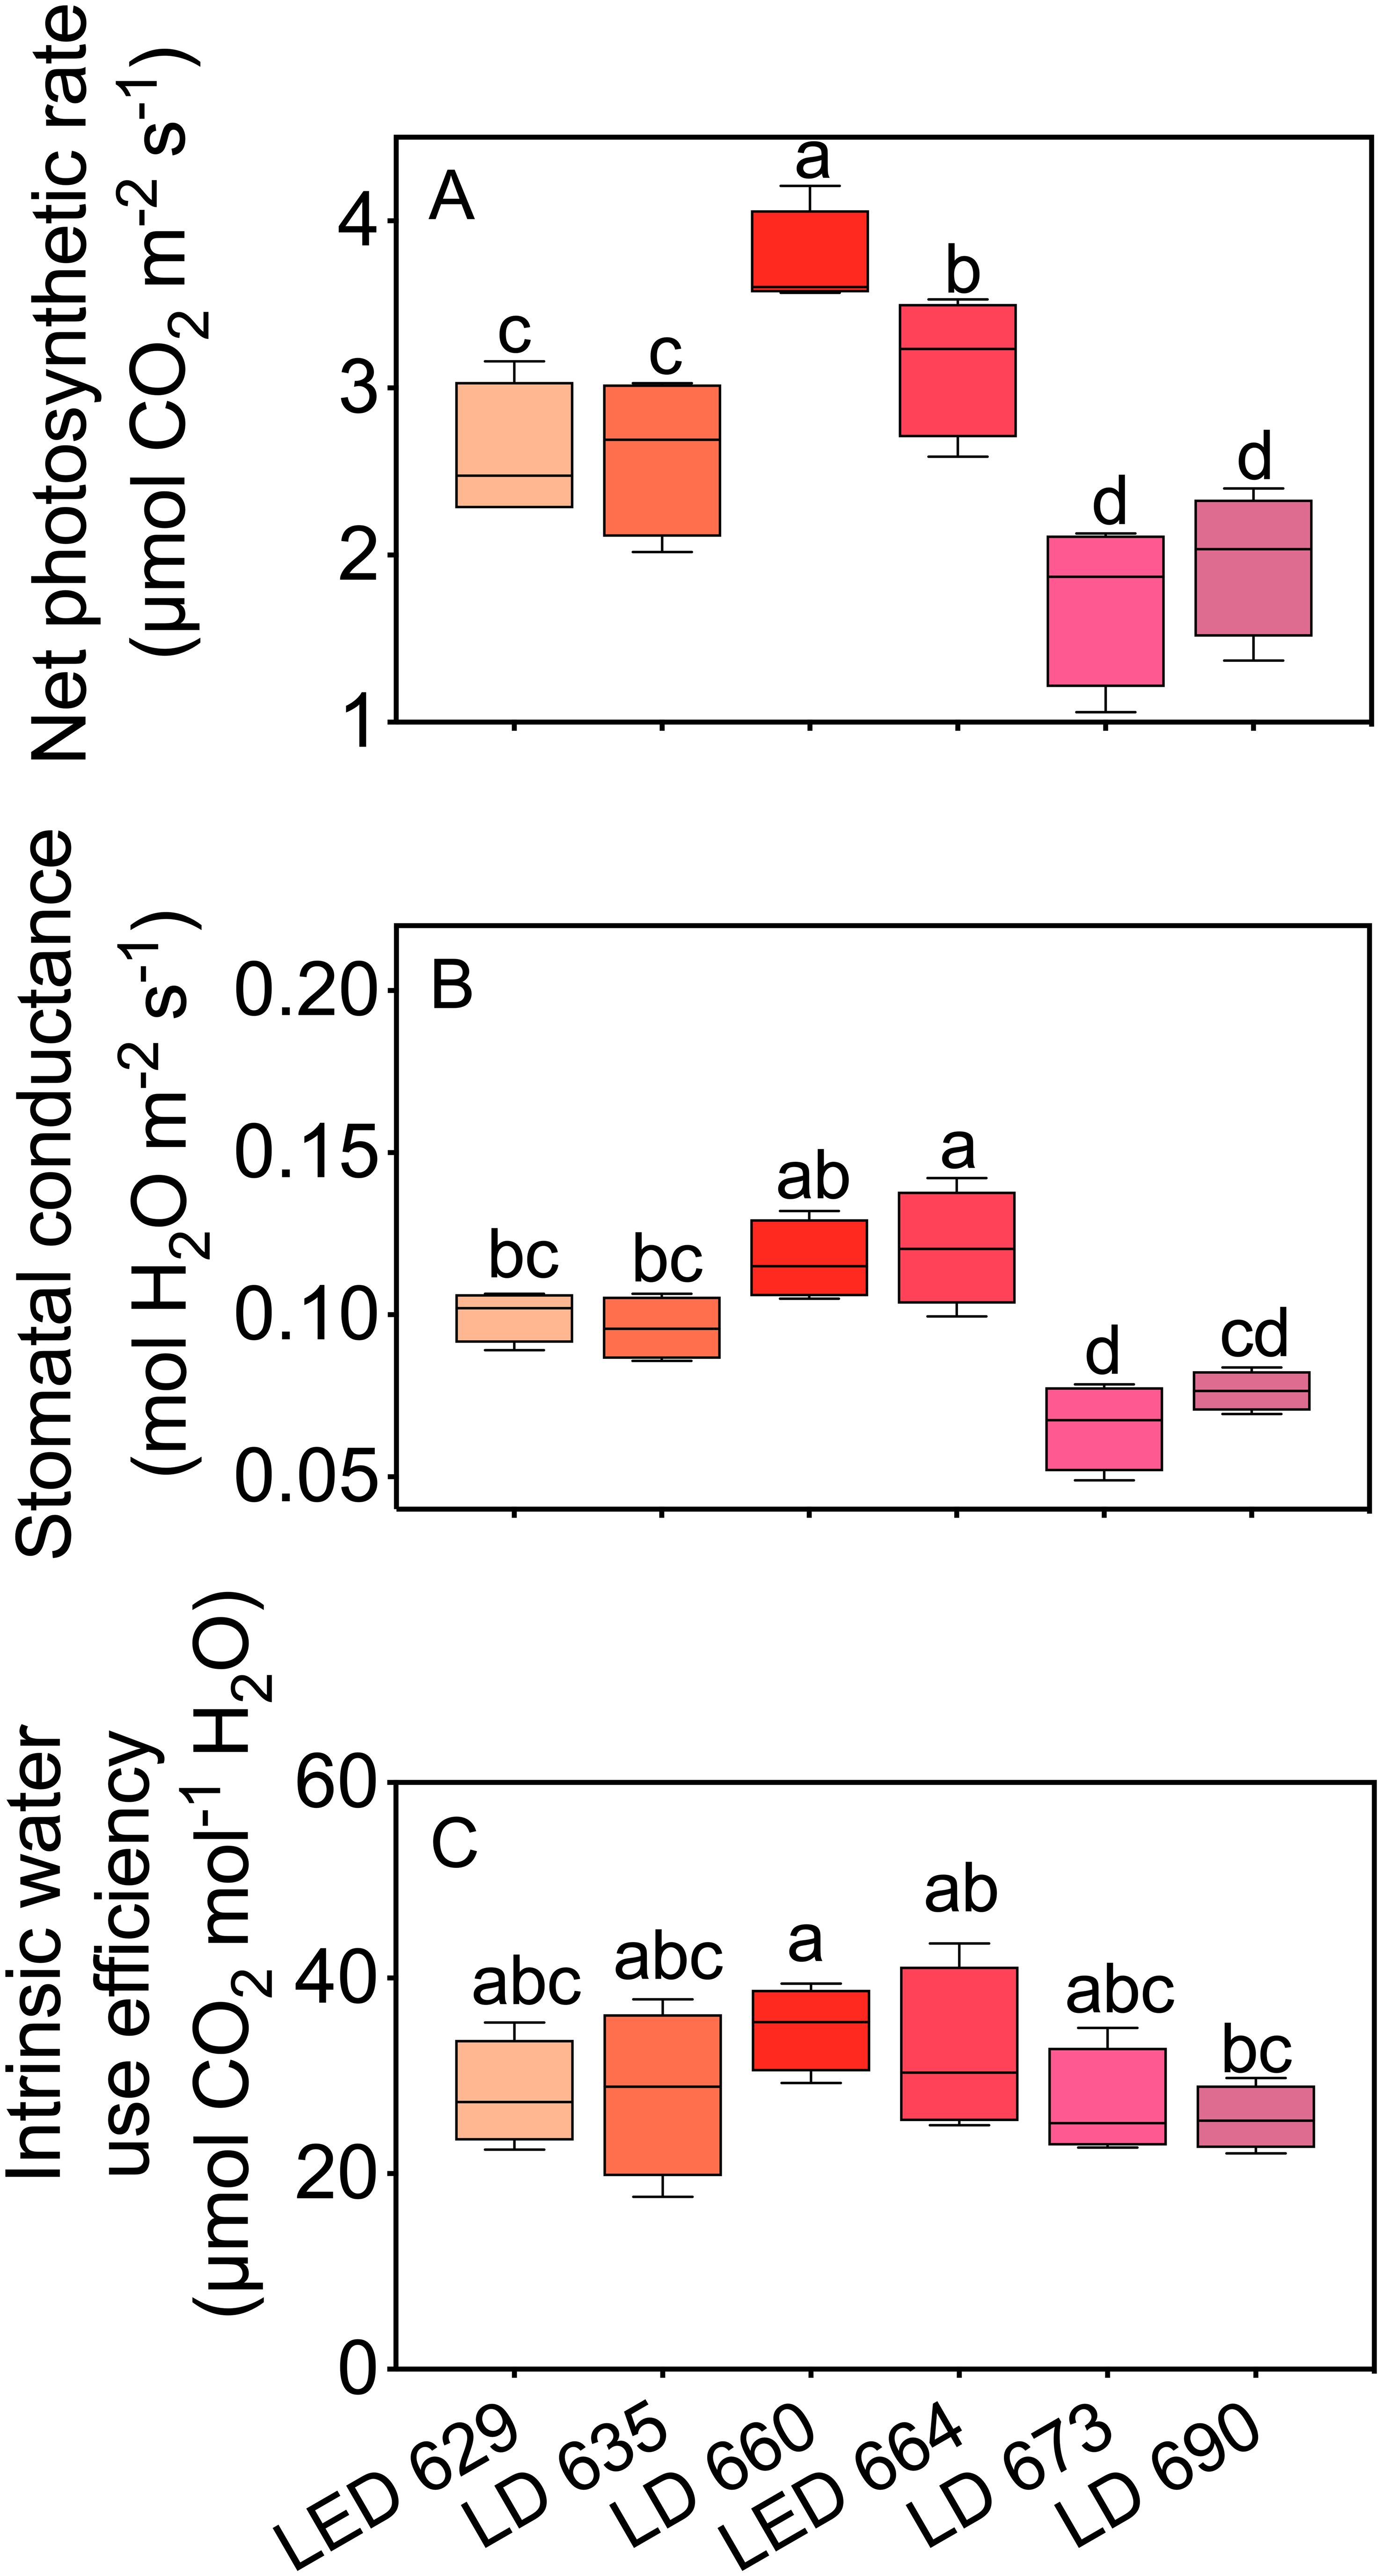
Figure 2. The net photosynthetic rate (A), stomatal conductance (B), and intrinsic water use efficiency (C) of tobacco leaves irradiated with different LED or LD lights. Different letters in each column indicate significant differences at P < 0.05, according to the Tukey–Kramer HSD test. The data are presented as the mean ± SE, n = 4.
The leaves of tobacco plants grown under identical environmental conditions were used to test the photochemical efficiency of PSII, represented by Y(II) (Equation 2) and NPQ (Equation 3), and the redox state of PSII, represented by qL (Equation 4), when irradiated with LED 664 and LD 660. Compared with those irradiated with LED 664, the leaves irradiated with LD 660 exhibited Y(II) and qL values that were 7.2% and 18.3% higher, respectively (Figures 3A, B). There was no significant difference in NPQ between the two light sources (Figure 3C).
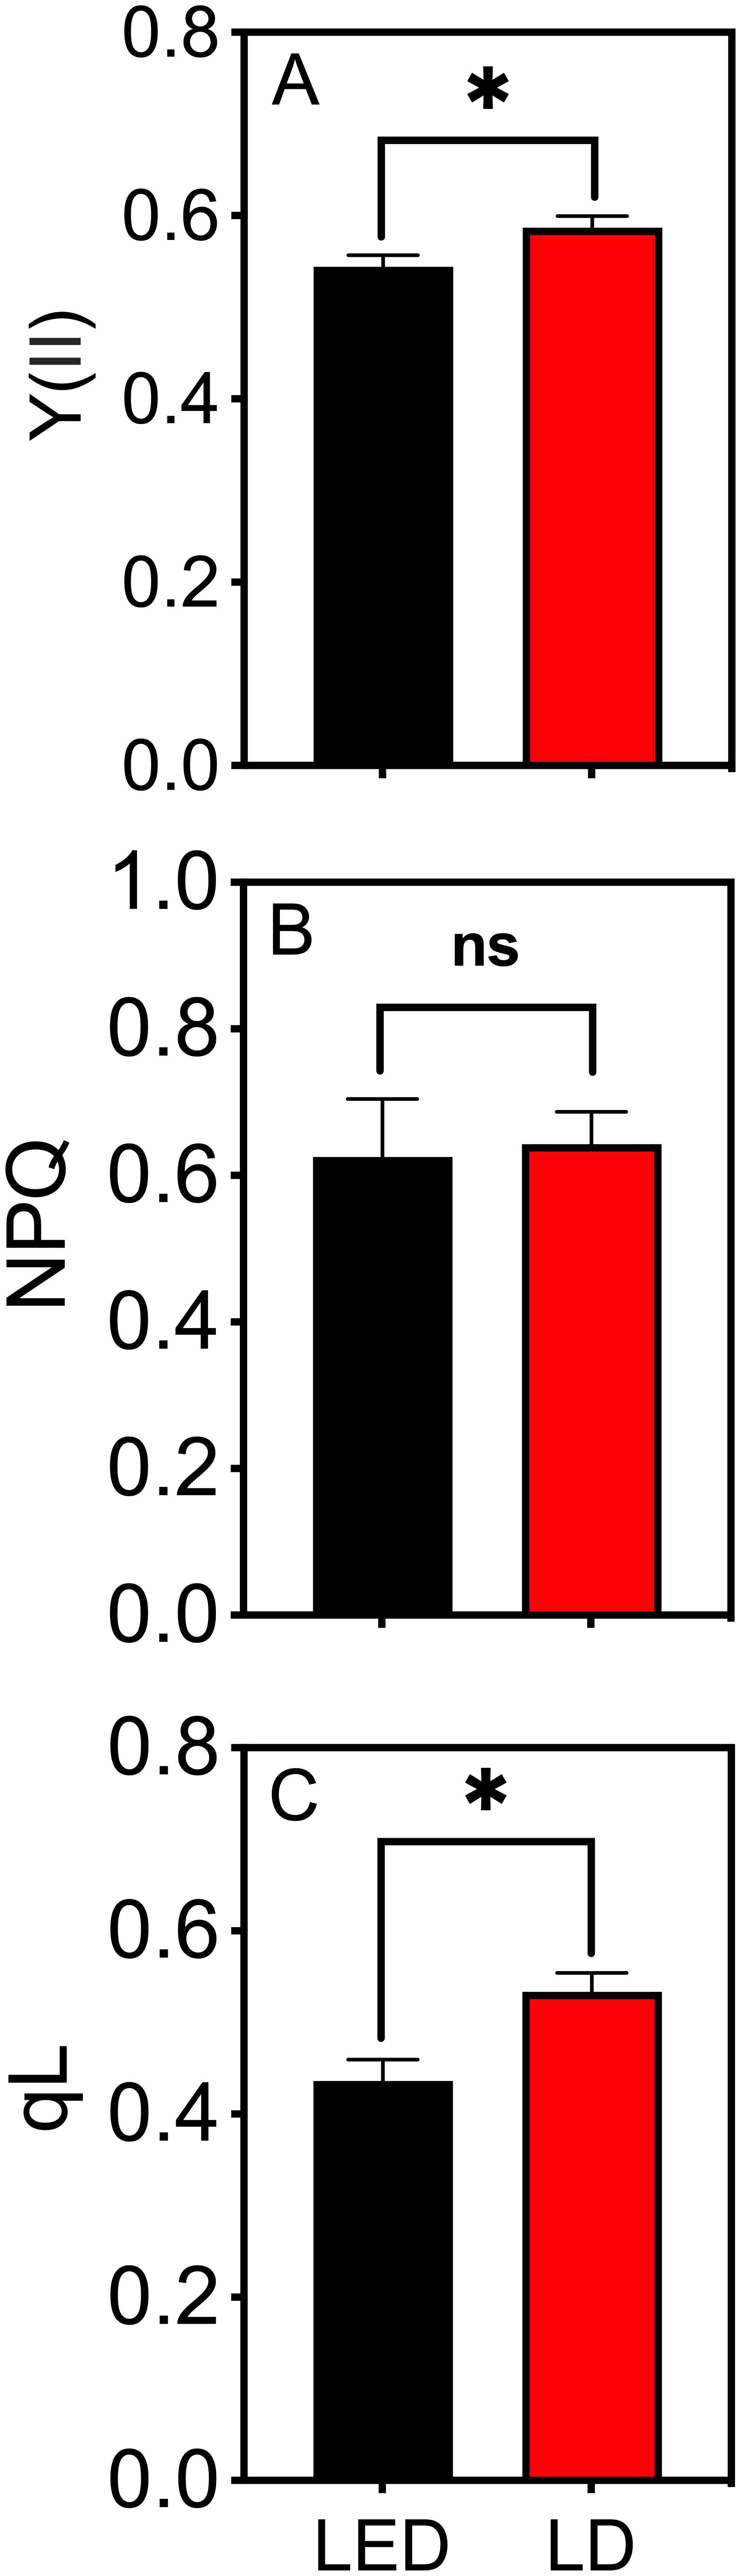
Figure 3. The quantum efficiency of PSII electron transport under light (Y(II)) (A), nonphotochemical quenching (NPQ) (B), and the estimated fraction of open PSII centers (qL) (C) of tobacco leaves irradiated with LED 664 or LD 660 with a PPFD of 150 μmol m−2 s−1. * indicates a significant difference at P < 0.05 according to a t test. The data are presented as the mean ± SE, n = 4. ns indicates no significant difference according to the t test.
3.2 Carbohydrate accumulation
The starch content in tobacco plants irradiated with LD 660 for 8 h was 18% higher than that in plants irradiated with LED 664 (Figure 4A). However, the sucrose, glucose, and fructose contents in plants under red LED and LD light were not significantly different (Figures 4B–D).
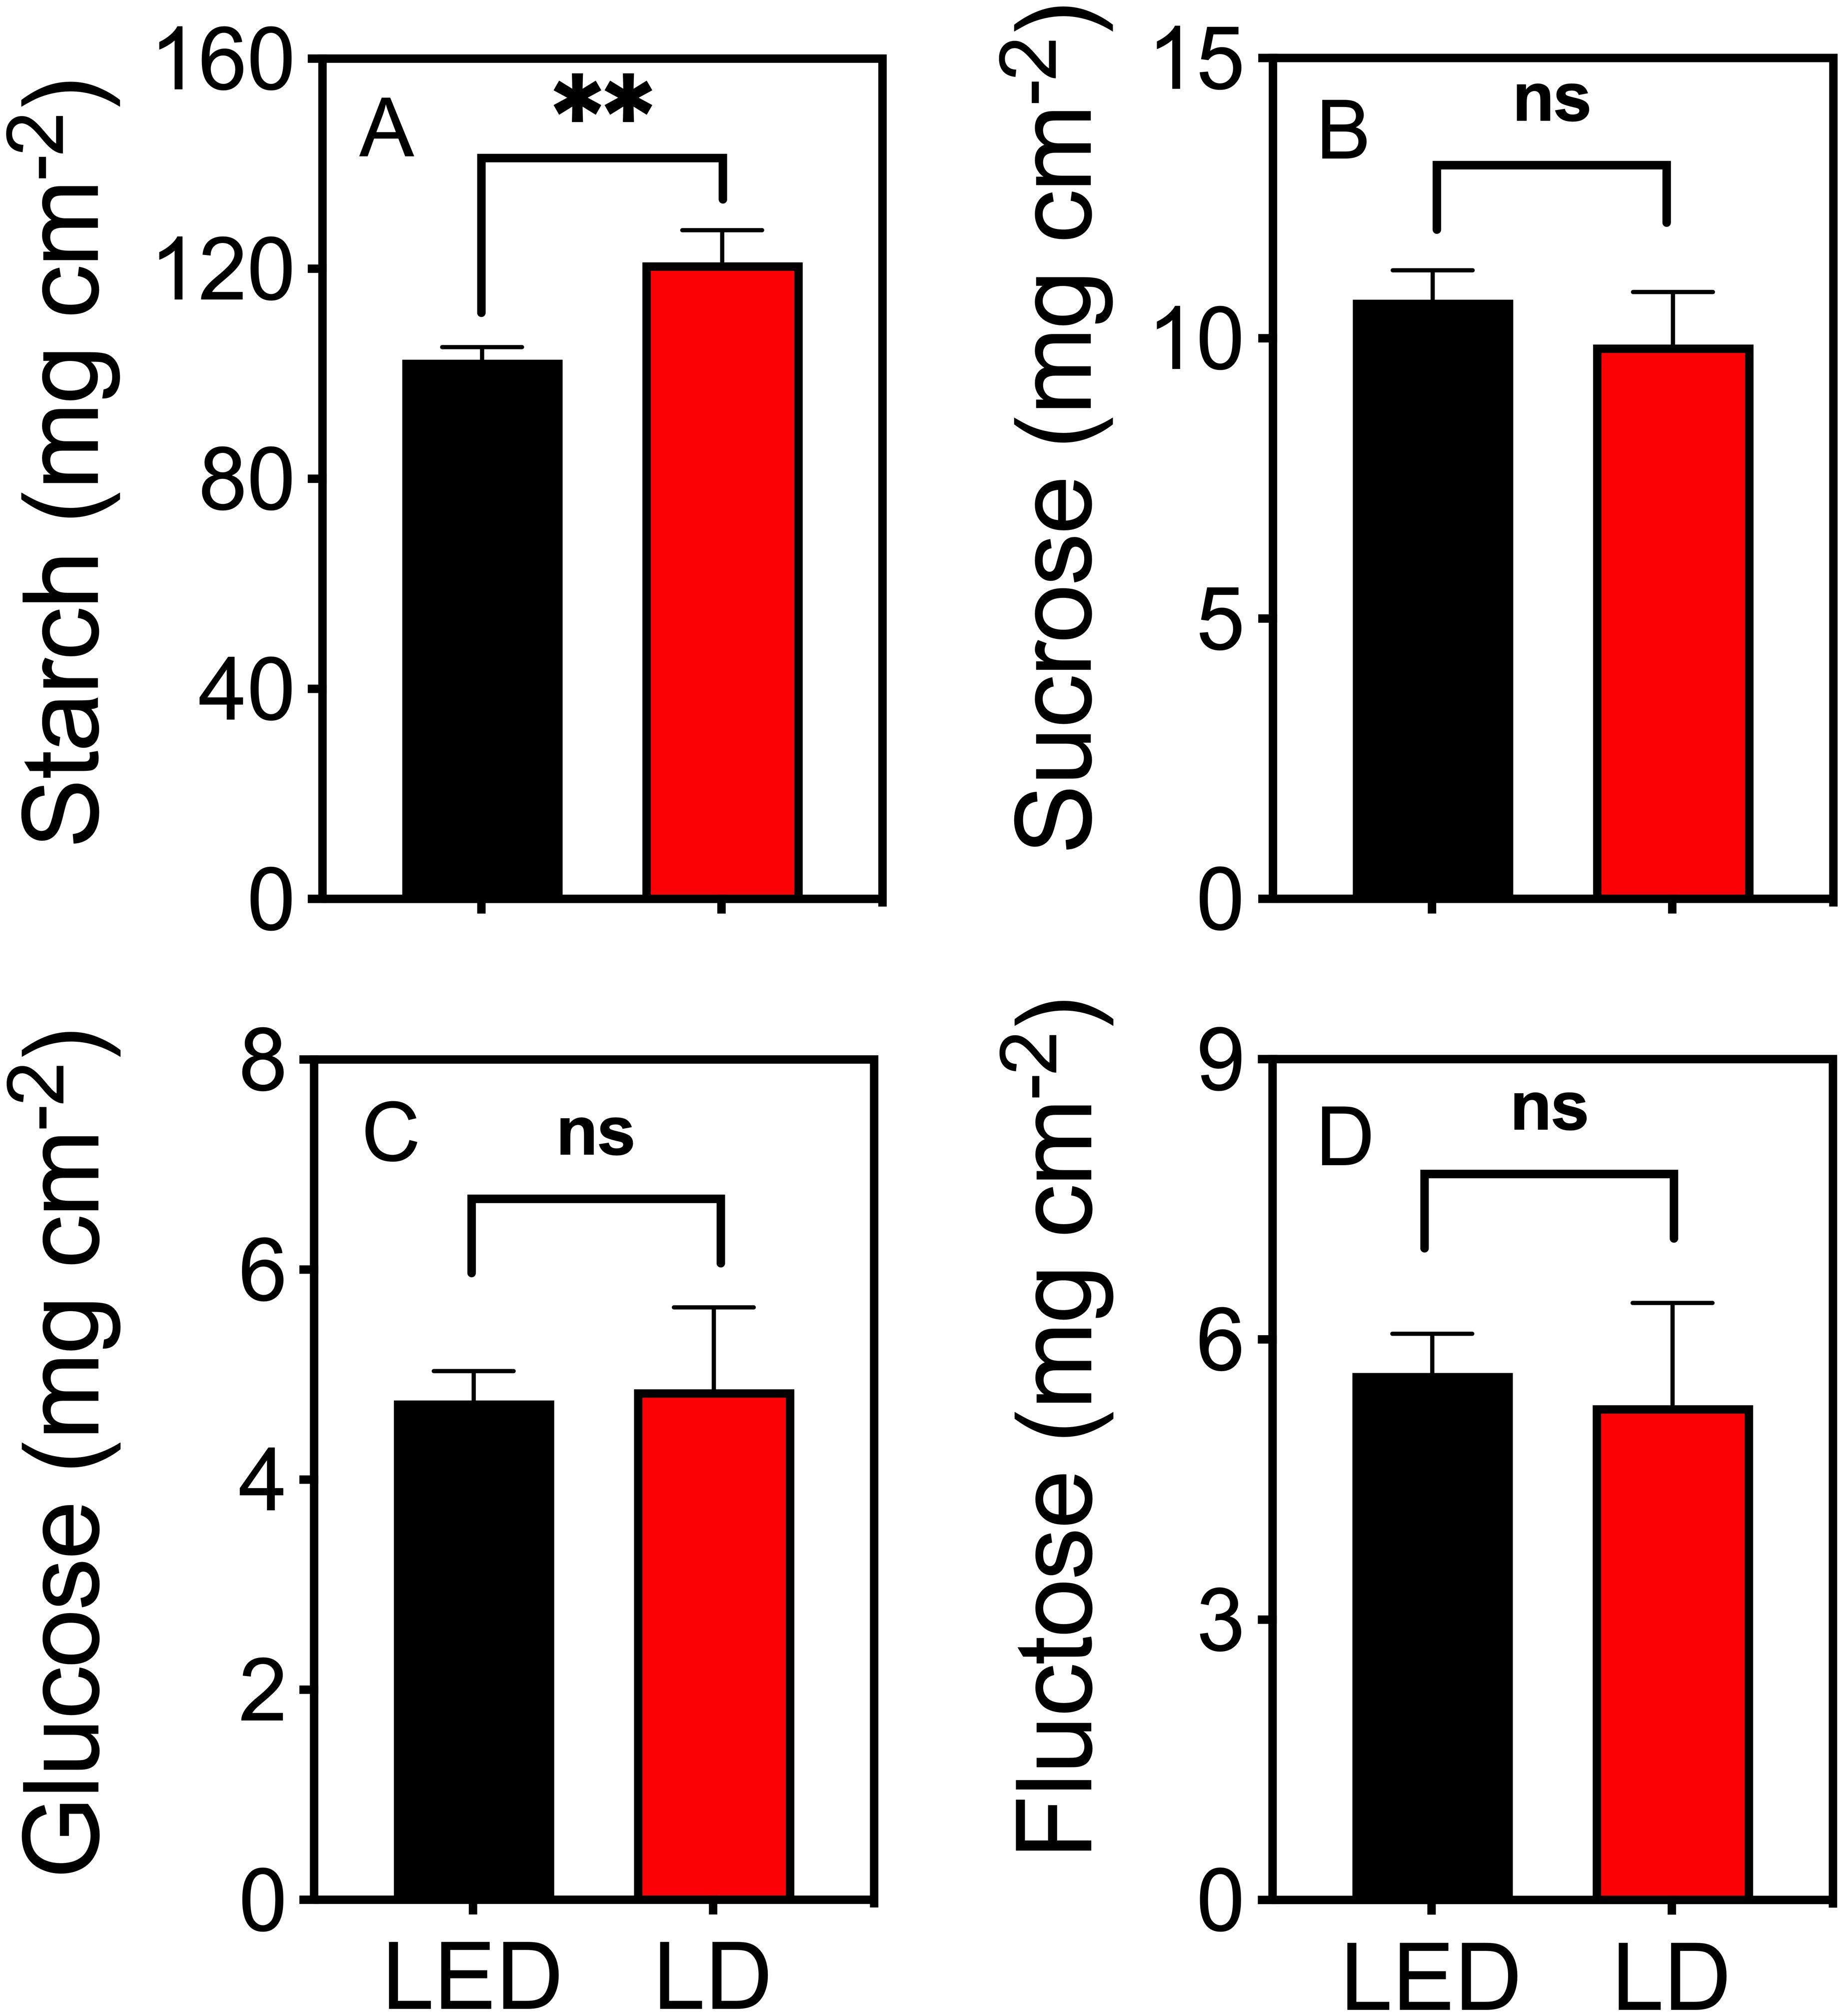
Figure 4. The contents of starch (A), sucrose (B), glucose (C), and fructose (D) in tobacco plants after irradiation with red LED 664 or LD 660 for 8 (h) ** indicates a significant difference at P < 0.01, ns indicates no significant difference according to the t test. The data are presented as the mean ± SE, n = 4.
3.3 Spectral characteristics of LED 664 and LD 660 lights
The full width at half maximum (FWHM) of LD 660 measured 1.6 nm, significantly narrower than the 17.6 nm FWHM observed in LED 664.The full width at half maximum (FWHM) of LD 660 is 1.6 nm, which is dramatically lower than that of LED 664, which is 17.6 nm. The values of the yield photon flux density (YPFD) (Equation 5) and the phytochrome photoequilibria (PPE) (Equation 6) for these two light sources were similar (Table 1), although the spectra of LED 664 and LD 660 differed (Figure 1).
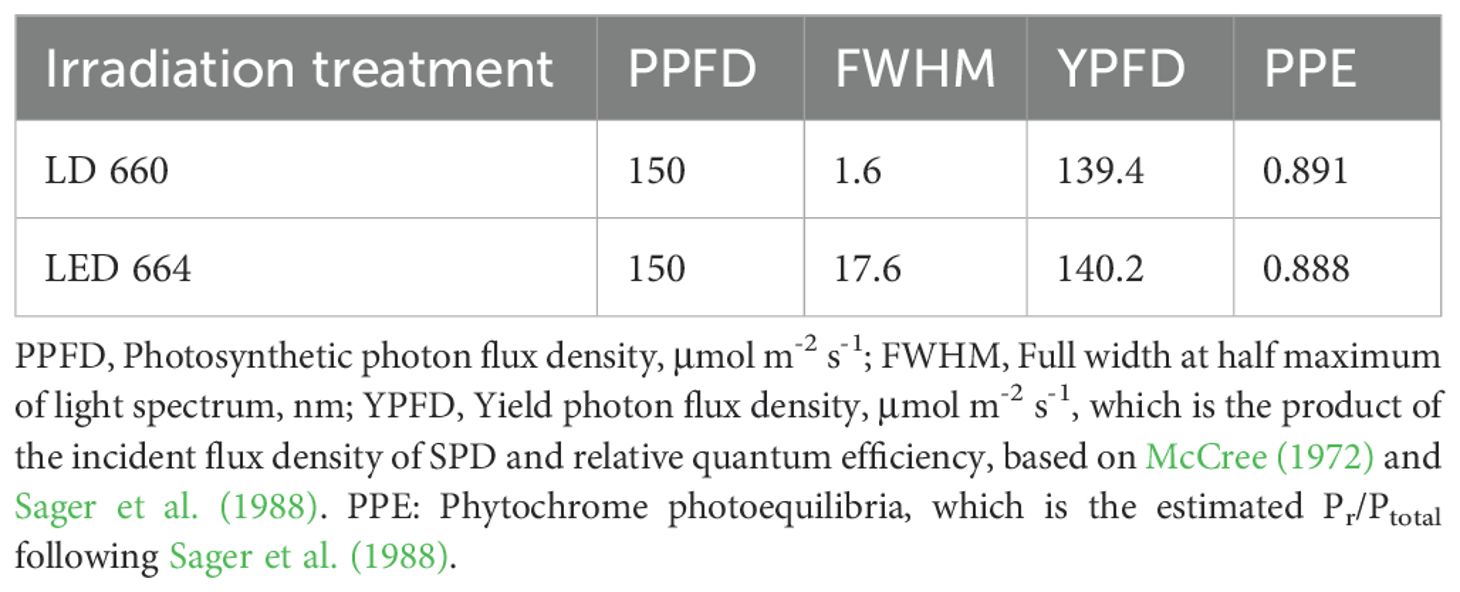
Table 1. Spectral characteristics of LED 664 and LD 660.
3.4 Chlorophyll fluorescence parameters at different PPFDs
The photosynthetic efficiency of PSII reaction centers (Y(II)) was examined in tobacco, Arabidopsis, and lettuce plants after being grown under continuous LED 664 or LD 660 for 12 d (Figure 5). One representative image for each species and each treatment at a PPFD of 189 μmol m-2 s-1, which was the closest PPFD to the plant growth light condition, was selected and is shown in Figure 5A. It was evident that tobacco and Arabidopsis thaliana plants grown under continuous LED 664 nm for 12 days exhibited more severe chlorosis and senescence compared to those under LD 660 nm treatment. In detail, the Y(II) value for tobacco plants grown under LD 660 started at 0.75 (Fv/Fm) (Equation 7) and gradually decreased to 61.3% of the maximum value as the PPFD increased from 0 to 467 μmol m-² s-¹. In contrast, for LED 664, the Y(II) began at 0.61 and sharply declined to 26.2% of the maximum value. Similar trends were observed in Arabidopsis plants with increasing light intensities. The Y(II) values for those grown under LD 660 started at 0.79 and gradually decreased to 54.5% of the maximum value, whereas for those grown under LED 664, Y(II) began at 0.63 and declined to 28.1% of the maximum value. The Y(II) values of tobacco and Arabidopsis plants grown under LD 660 at each PPFD significantly exceeded those grown under LED 664. Conversely, no significant difference was observed between the Y(II) values of lettuce plants grown under LD 660 and those grown under LED 664. The respective Y(II) values of lettuce grown under the LD 660 and LED 664 treatments started at 0.72 and 0.73 and gradually decreased to 0.36 and 0.38 as the PPFD increased (Figure 5B).
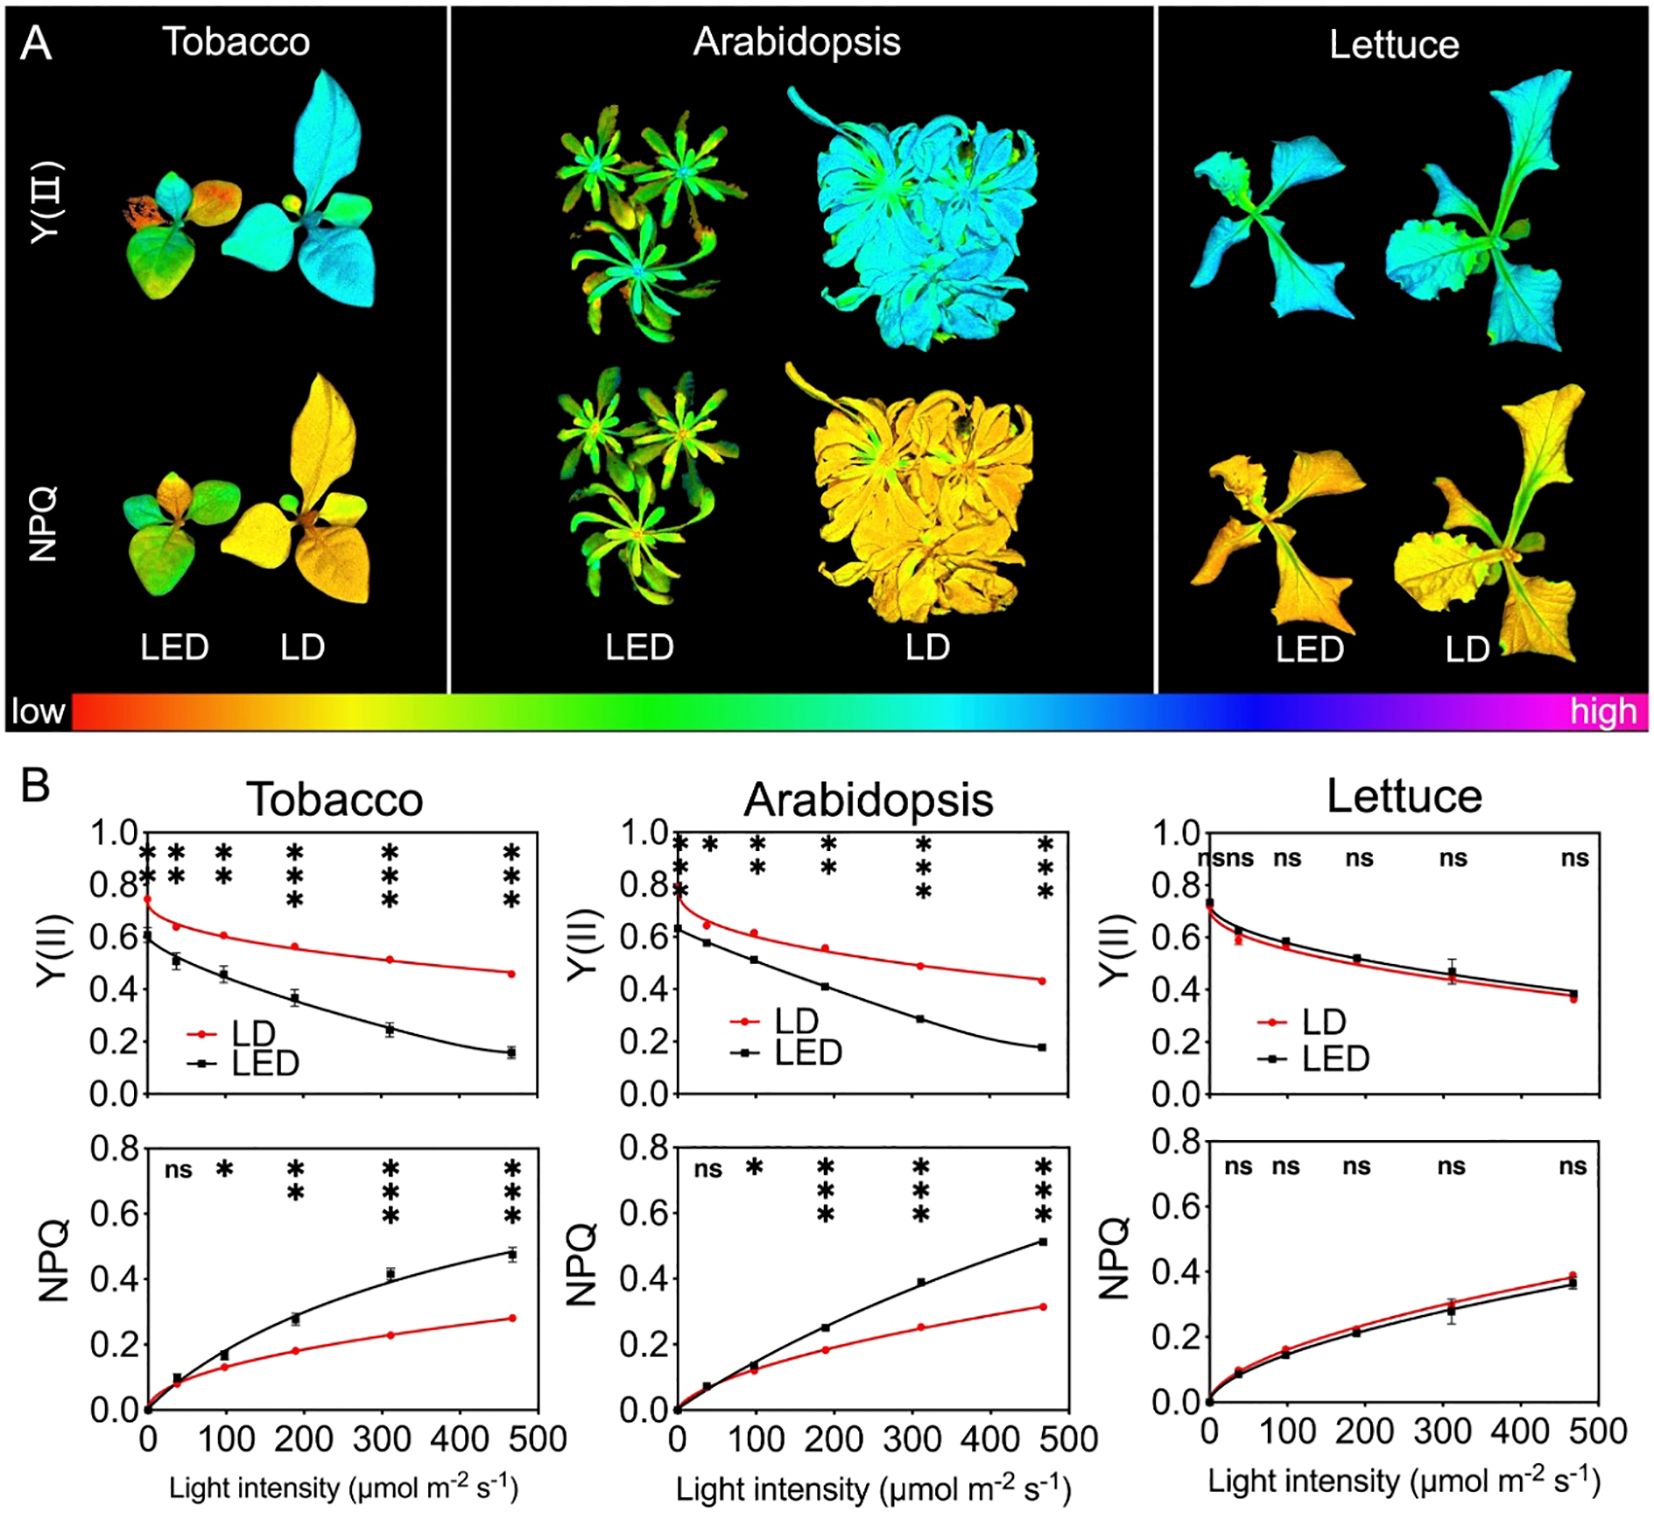
Figure 5. Chlorophyll fluorescence parameters of tobacco, Arabidopsis, and lettuce plants after 12 d of growth under continuous LED 664 or LD 660, with a PPFD of 150 μmol m−2 s−1. (A) Representative images of the quantum efficiency of PSII electron transport under light (Y(II) and nonphotochemical quenching (NPQ) in the three species of plants. (B) Response of Y(II) and NPQ to different PPFD curves of the three species of plants. *** indicates a significant difference at P < 0.001, ** indicates a significant difference at P < 0.01, * indicates a significant difference at P < 0.05, ns indicates no significant difference according to the t test. The data are presented as the mean ± SE, n = 4.
All plants exhibited an increase in NPQ values with increasing PPFD. Notably, compared with those grown under LD 660, the NPQ of tobacco and Arabidopsis plants grown under LED 664 increased more rapidly. For tobacco and Arabidopsis, the NPQ value was significantly lower under LD 660 than that under LED 664 when the PPFD exceeded 37 μmol m-² s-¹. In contrast, lettuce plants under both LD 660 and LED 664 exhibited a similar rate of increase in NPQ, with no significant differences observed between LD 660 and LED 664 at any PPFD (Figure 5B).
3.5 Biomass accumulation and morphology in plants
One representative picture for each plant species and each treatment was selected and is shown in Figure 6A. Compared with those grown under LED 664, tobacco plants grown under LD 660 displayed a greener color and greater overall size, with larger laminae and longer petioles (Figure 6A). Additionally, compared with those grown under LED 664, the lettuce plants grown under LD 660 presented elongated petioles, increased leaf areas, and a larger overall size (Figure 6A). Moreover, Arabidopsis plants grown under LED 664 exhibited severe chlorosis and anthocyanin pigmentation, along with a smaller overall size compared with plants grown under LD 660 (Figure 6A). Specifically, the shoot dry weights of tobacco, Arabidopsis, and lettuce grown under LD 660 were 1.75, 1.57, and 1.28 times greater, respectively, than that of plants grown under LED 664 (Figure 6B). Additionally, the respective leaf areas of these three plants under the LD 660 treatment were 2.10, 2.28, and 1.70 times greater than those grown under LED 664 (Figure 6B). Conversely, the leaf mass per area of tobacco, Arabidopsis, and lettuce under the LD 660 treatment was 0.84, 0.68, and 0.84 times lower, respectively, than that of plants grown under the LED 664 treatment, (Figure 6B).
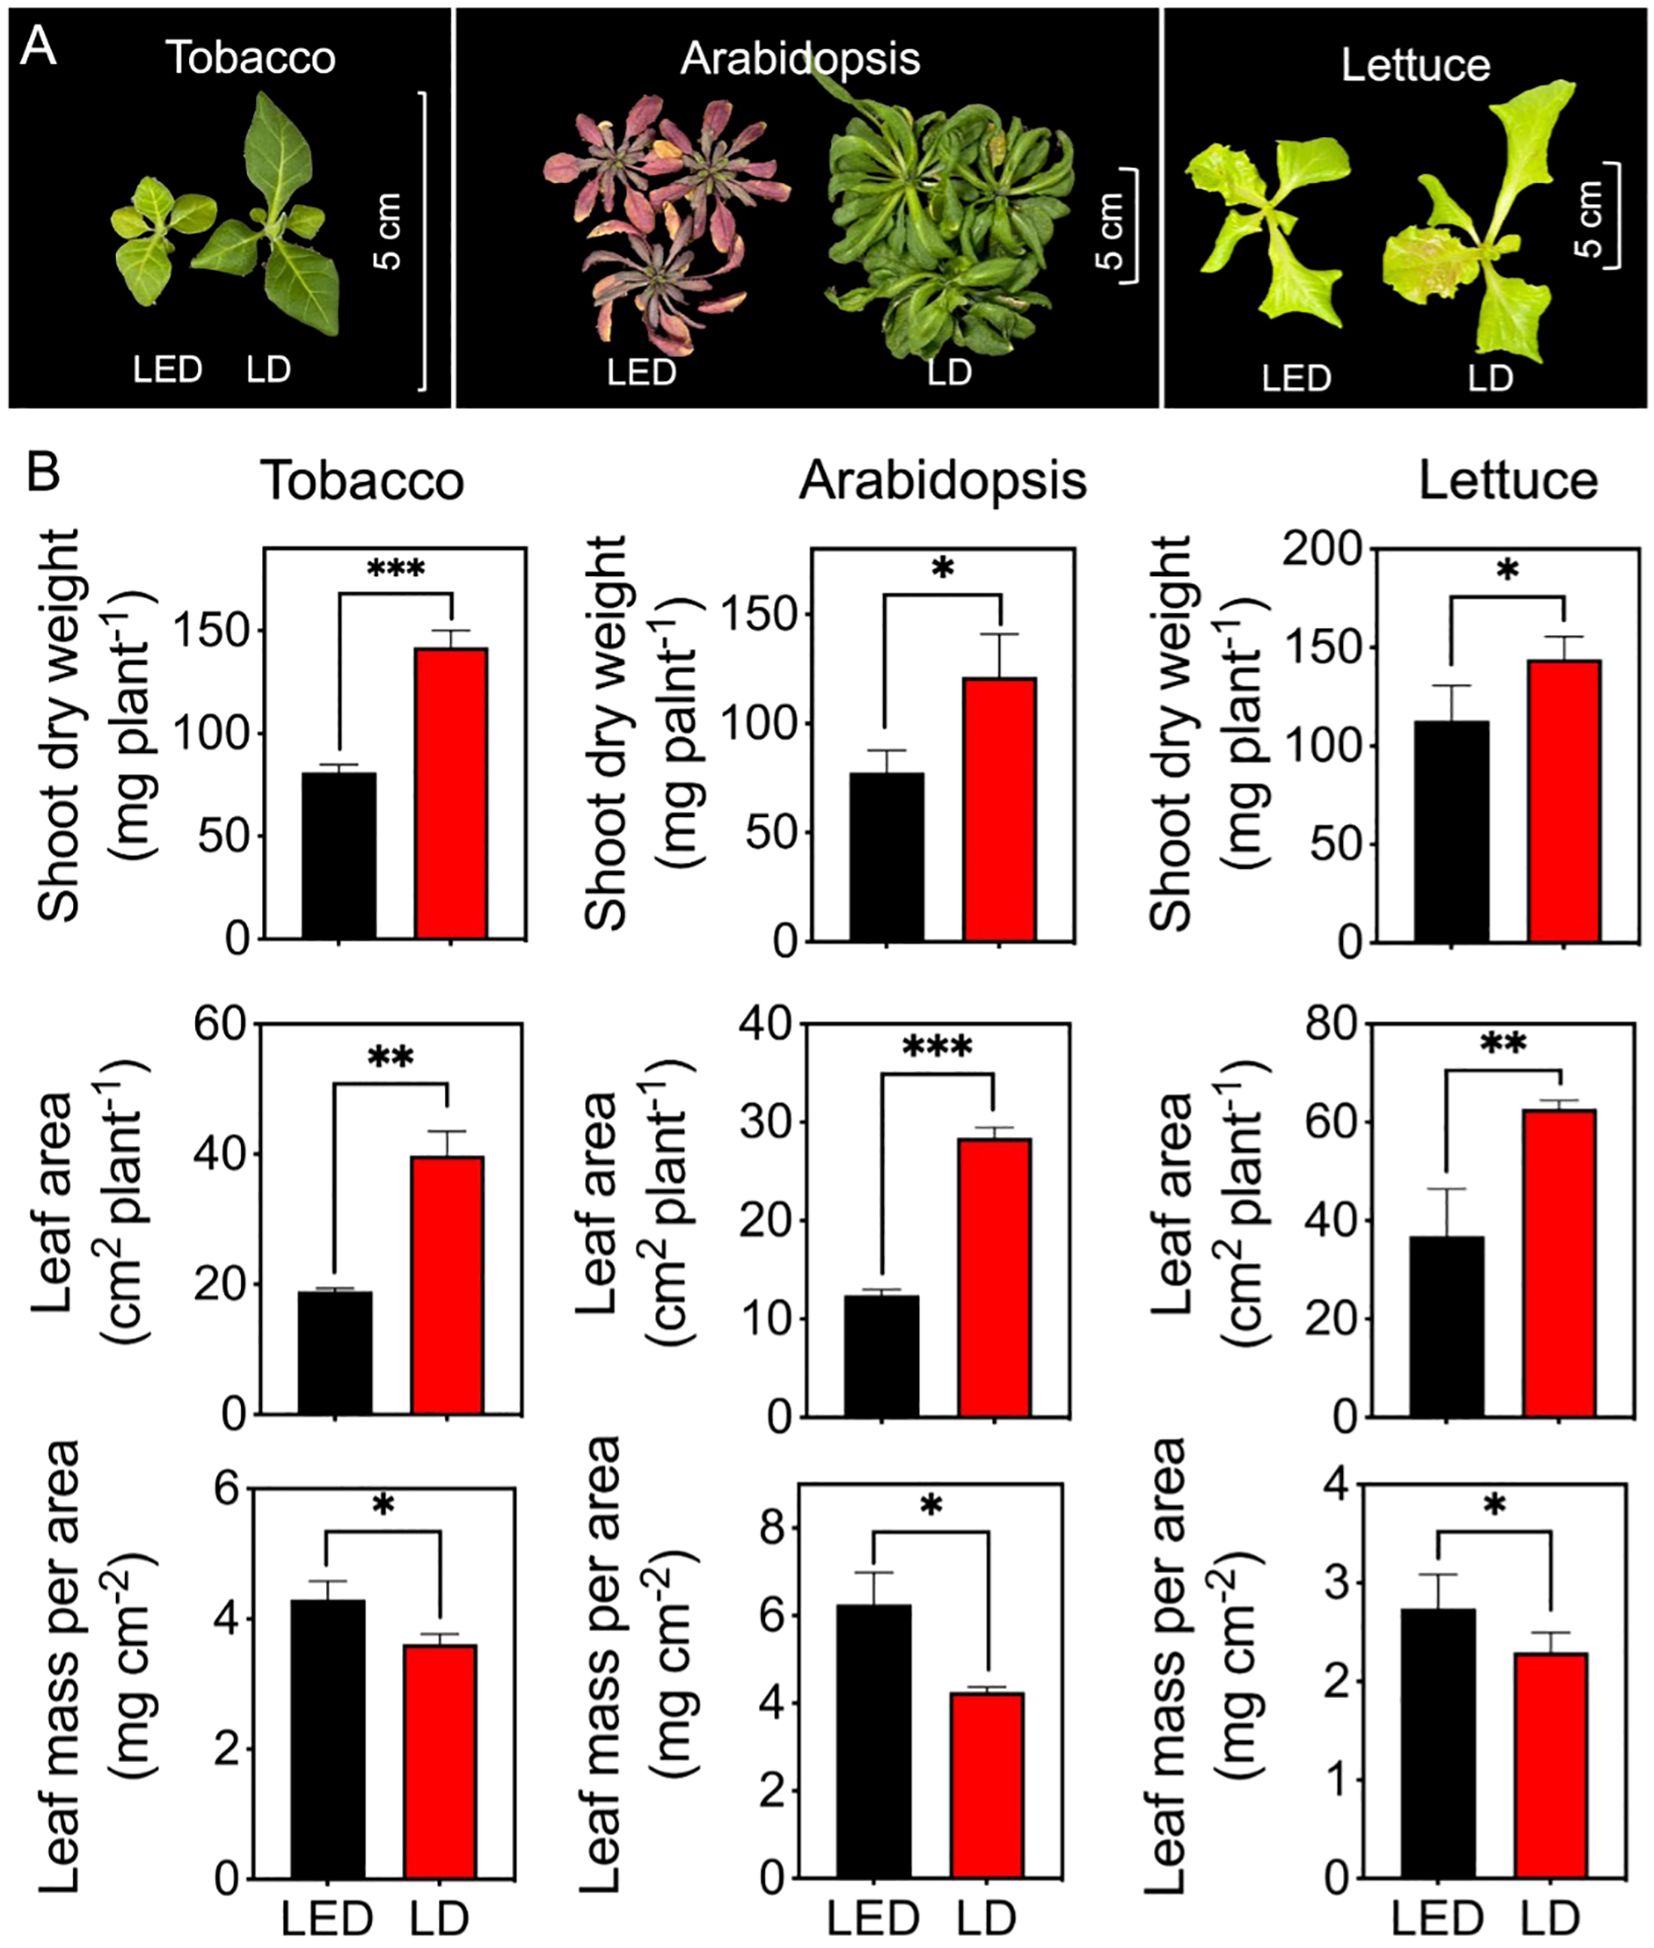
Figure 6. The growth indices of tobacco, Arabidopsis, and lettuce plants after 12 d of growth under continuous LED 664 or LD 660 with a PPFD of 150 μmol m−2 s−1 for 12 (d) (A) Representative images of the three species of plants. (B) The shoot dry weight, leaf area, and leaf mass per area of the three species of plants. *** indicates a significant difference at P < 0.001, ** indicates a significant difference at P < 0.01, * indicates a significant difference at P < 0.05 according to the t test. The data are presented as the mean ± SE, n = 4.
4 Discussion
To support the growing global population, researchers are increasingly adopting sustainable strategies. Indoor horticulture must also prioritize sustainability. Given that artificial light systems serve as the primary light source in indoor horticulture, ongoing investigations are aiming to optimize artificial lighting systems to support plant growth (Hogewoning et al., 2010; Ohtake et al., 2018; Li et al., 2021). While traditional light sources and LEDs have been extensively investigated (Van Delden et al., 2021), laser diodes (LDs), despite their unique advantages such as the emission of extremely narrow single-wavelength coherent light, remain underexplored in photosynthetic research. The present study clearly demonstrates that LDs enhanced photosynthesis and plant growth compared with LEDs with similar peak wavelengths, suggesting that LDs offer significant advantages over LEDs for indoor plant production.
4.1 Fine-tuning red light to explore wavelength-specific impacts on photosynthetic efficiency
Red light plays a crucial role in regulating plant growth and development because it is significantly absorbed by chlorophyll (Runkle, 2016). Previously, McCree (1972) demonstrated that red light with emission peaks at 600 or 625 nm provides the highest quantum yield for CO2 assimilation (mol CO2 assimilated per mol photons absorbed) across 22 plant species. Subsequent analysis by Inada (1976) identified 625, 650, and 675 nm as the optimal wavelengths for photosynthetic efficiency in red light. In this study, we demonstrated that the Pn values were ranked as follows: LD 660 > LED 664 > LED 629 ≈ LD 635 > LD 673 ≈ LD 690, where “>“ indicates a significant difference and “≈” indicates no significant difference (Figures 1, 2A). Furthermore, LD 660 and LED 664 exhibited relatively high gs, whereas LD 673 and LD 690 showed the lowest values, which aligns with trends in the Pn across the six light sources (Figures 2A, B).
These findings suggest that red light promotes stomatal opening by reducing intercellular CO2 (Ci) through red light-driven mesophyll photosynthesis (Shimazaki et al., 2007). However, the differences in gs across treatments were less pronounced than the differences in Pn values, implying that additional mechanisms influence stomatal behavior. For example, Messinger et al. (2007) reported that red light can stimulate stomatal opening even when Ci remains constant, whereas Kromdijk et al. (2019) and Taylor et al. (2024) proposed that red light may modulate the redox state of plastoquinone (PQ), potentially signaling beyond the chloroplast to regulate stomatal responses. In addition, Ando and Kinoshita (2018) suggested that red light can promote stomatal opening by inducing H+-ATPase phosphorylation in guard cells. These mechanisms, while promising, remain incompletely understood. Our results indicate that variations in red light wavelength and spectral width influence stomatal responses in ways that do not consistently align with net photosynthetic rates. Interestingly, LD 660 exhibited high Pn and gs but maintained a WUEi comparable to that of other treatments (Figure 2C). This finding indicates that LD 660 achieves efficient CO2 assimilation while conserving water (Lawson and Blatt, 2014).
This study provides nuanced insights into how specific red-light wavelengths affect Pn, gs, and WUEi. The superior performance of LD 660 and LED 664 highlights the importance of fine-tuning light spectra to optimize both photosynthetic efficiency and WUEi, in contrast to earlier studies emphasizing broader wavelength ranges (Klimek-Kopyra et al., 2021). These findings underscore the necessity for precision in controlled-environment agriculture, where spectral specificity plays a crucial role in optimizing photosynthetic performance. Overall, our results emphasize that red light with distinct spectral characteristics differentially influences photosynthetic processes and associated physiological responses.
4.2 Optimizing photosynthesis with narrowband red LD light for increased plant growth and yield
Our study demonstrated that plants illuminated with LD 660, a narrow-band light source (spectral waveband <10 nm, FWHM 1.6 nm), achieved a significantly higher Pn than those under LED 664, which features a broader spectral range (~50 nm, FWHM 17.6 nm) (Table 1), despite both light sources having identical PPFD levels and similar emission peak positions (Figures 1 and 2). This finding indicates that, even when spectra share similar peaks, differences in waveband width and FWHM can significantly affect photosynthetic efficiency. Because photosynthesis underpins plant growth and yield (Taiz and Zeiger, 2015; Yamori et al., 2016), the increased photosynthetic efficiency observed under red LD light likely plays a key role in promoting plant growth (Figure 5B). Furthermore, carbohydrates, the end products of CO2 assimilation during photosynthesis, accumulated at higher levels under red LD light than under LED light (Figure 4A). These findings highlight the effectiveness of red LD in promoting plant photosynthesis and yield compared with red LEDs, even with a comparable yield photon flux density (YPFD) (Table 1).
In addition to photosynthesis, plant morphology is crucial for the accumulation of dry matter (Li et al., 2021). In this study, plants exposed to red LD light developed a significantly larger total leaf area compared with that of plants exposed to LED light (Figure 5B). We hypothesized that the observed morphology might reflect characteristics of shade-avoidance syndrome (SAS), which is typically induced by a low red-to-far-red (R:FR) light ratio sensed by phytochromes. SAS is characterized by traits such as stem and petiole elongation and increased leaf expansion (Park and Runkle, 2017; Legris et al., 2019). However, calculations of the phytochrome photoequilibria (PPE), an estimate of the Pr/Ptotal ratio (Sager et al., 1988), yielded nearly identical values for LD 660 (0.891) and LED 664 (0.880) (Table 1). These findings suggest that the morphological differences between plants grown under LD 660 and LED 664 are not due to variation in far-red light absorption by phytochromes.
The redox balance between PSI and PSII may also influence plant physiological responses (Foyer and Noctor, 2005; Huner et al., 1998). Under identical growth conditions, the qL parameter of PSII was 18.3% higher in plants exposed to red LD light than that in plants exposed to LED light, with Y(II) being 7.2% higher (Figures 3A, C). This significant increase in qL suggests that LD light may increase the electron transport efficiency of PSII by more effectively activating PSI. Enhanced PSI activity likely facilitates more efficient electron flow, reducing bottlenecks in the electron transport chain and allowing more PSII reaction centers to remain open. As PSI is more frequently excited, it drives greater electron transfer toward NADP+, maintaining the electron transport system in a more oxidized state (Kramer et al., 2004; Nelson and Yocum, 2006). This oxidized state creates a signaling environment that enables plant acclimation. For example, under high temperatures and elevated CO2 concentrations, plants may develop “shade-type” characteristics such as thinner and larger leaves (Way and Yamori, 2014; Leakey et al., 2009). These adaptations optimize the leaf area for effective light and CO2 capture, reduce ROS accumulation, and prevent photoinhibition. In this study, the significantly increased leaf area and decreased leaf mass per area observed in tobacco, Arabidopsis, and lettuce plants grown under red LD light compared with those grown under LED light (Figure 6B) may be linked to changes in redox states within plant cells. The increased leaf area likely contributed to the increased shoot dry weight observed in these plants.
Based on our findings, LDs demonstrate remarkable potential for advancing agricultural practices. Their ability to optimize photosynthesis and support beneficial plant morphology positions them as valuable tools for future agricultural technology. Adopting LD-based systems could lead to higher yields, improved crop quality, and more sustainable food production practices.
4.3 Impact of continuous red light on photosynthesis and plant tolerance across species
Continuous light is often considered a strategy to increase plant productivity by extending the photoperiod, allowing photosynthetic organisms to assimilate more CO2 daily (Kalaitzoglou et al., 2019; Xu et al., 2021; Proietti et al., 2021). To evaluate this potential, we tested the effects of continuous LD 660 compared with continuous LED 664 on plant production. However, continuous light is also known to induce negative effects on plant growth and physiology (Velez-Ramirez et al., 2011; Demers et al., 1998). Consistent with these findings, tobacco and Arabidopsis plants exposed to continuous red LED light for 12 d presented reduced photosynthetic capacity (Figure 5). Our data showed a significant decline in Fv/Fm, with values falling below the acceptable range for normal plant growth (Murchie and Lawson, 2013). Additionally, as PPFD increased, Y(II) levels decreased sharply (Figure 5B), indicating photoinhibition of PSII and reduced photochemical efficiency. This likely impaired carbon fixation during photosynthesis (Demmig et al., 1987; Dodd et al., 1998).
The increased nonphotochemical quenching (NPQ) values across light intensities further support the notion that continuous red LED light resulted in inefficient light energy utilization (Figure 5B). Previous studies have reported that continuous light negatively affects photosynthetic performance by reducing photosynthetic capacity, quantum yield, Rubisco carboxylation rates, and electron transport efficiency (Murage et al., 1997; Kang et al., 2013; Zha et al., 2019a; Heyneke et al., 2013; Van Gestel et al., 2005). These effects are often attributed to excess light energy, leading to the accumulation of ROS and the accumulation of starch and sugars (Murage and Masuda, 1997; Golan et al., 2006; Heyneke et al., 2013; Van Gestel et al., 2005; Velez-Ramirez et al., 2011). These factors inhibit photosynthesis and contribute to chlorosis and tissue degradation, which were also observed in our study (Figures 5A and 6A).
The plants exposed to continuous red LED light also developed higher leaf mass per area (Figure 6B), suggesting structural adjustment to mitigate photoinhibition. This aligns with prior research indicating that plants acclimate to continuous light by thickening their leaves to dissipate excess energy and protect the photosynthetic apparatus (Arve et al., 2013; Zha et al., 2019b). Such acclimation may also reduce water loss and improve light utilization efficiency.
In contrast, tobacco and Arabidopsis plants exposed to continuous red LD light exhibited greater tolerance to continuous light. This was evidenced by higher Fv/Fm values, increased Y(II) values across light intensities, lower NPQ values at light intensities exceeding 37 μmol m-² s-¹, and reduced chlorosis compared with those of plants under red LED light (Figures 5 and 6A). These results are consistent with studies demonstrating the positive effects of laser light on plant photosynthesis. For example, Ooi et al. (2016) reported that compared with cool-white fluorescent light, continuous red and blue laser light reduced the expression of the light stress marker genes APX1 and GST6. Additionally, laser light has been shown to increase resistance to environmental stressors, such as salinity, drought, and oxidative stress, by modulating gene expression and increasing antioxidant enzyme activity, photosynthesis, and nutrient uptake (Ali et al., 2020; Qiu et al., 2013; Gao et al., 2015).
Interestingly, lettuce showed greater tolerance to continuous light than did tobacco and Arabidopsis, with no significant differences in chlorophyll fluorescence parameters between the continuous red LED and LD light treatments (Figure 5B). Furthermore, the lettuce did not exhibit any observable signs of continuous light-induced injury (Figures 5A and 6A). These results align with those of Zha et al. (2019a), who found that lettuce could maintain normal growth under continuous light at a PPFD of 200 μmol m-² s-¹ for 15 d, despite elevated ROS and antioxidant levels.
Environmental factors, such as the PPFD, can further influence plant responses to continuous light. Higher PPFD intensities exacerbate continuous light-induced damage, as shown by reductions in Fv/Fm and quantum yield in lettuce grown under continuous light with a PPFD of 300 μmol m-² s-¹ (Zha et al., 2019b). In a supplementary experiment, lettuce plants exposed to continuous red LED and LD light at a PPFD of 300 μmol m-² s-¹ exhibited a slightly lower Fv/Fm than that of plants grown at 150 μmol m-² s-¹. However, no significant differences were observed between the red LED and LD treatments in terms of chlorophyll fluorescence parameters (Supplementary Figure 1B). Notably, the anthocyanin content was significantly higher in lettuce under red LED light than that under red LD light at 300 μmol m-² s-¹ (Supplementary Figure 1C), indicating light stress. Anthocyanin synthesis is often triggered when the amount of radiation absorbed exceeds the capacity of the photosynthetic system (Smillie and Hetherington, 1999; Trojak and Skowron, 2017). Thus, the greater anthocyanin accumulation under continuous red LED light suggests a stress response greater than that under red LD light.
5 Conclusions
Our findings demonstrate that laser diode (LD) light with narrow waveband width and FWHM, offers distinct advantages over LED light for plant growth in indoor horticulture. The plants grown under LD 660 exhibited higher photosynthetic efficiency, increased carbohydrate accumulation, and greater tolerance to continuous light as well as improved morphological traits, including an expanded leaf area and increased biomass production. These benefits highlight the potential of LDs for optimizing resource use and improving adaptability in controlled-environment agriculture. The adoption of LD technology could contribute to sustainable urban agriculture and address the rising demand for food in an increasingly constrained agricultural landscape. Further research is needed to optimize LD applications and elucidate their underlying beneficial effects on physiological processes and secondary metabolism-linked quality attributes.
Data availability statement
The raw data supporting the conclusions of this article will be made available by the authors, without undue reservation.
Author contributions
LL: Data curation, Formal Analysis, Investigation, Writing – original draft. RS: Conceptualization, Investigation, Resources, Writing – review & editing. KY: Conceptualization, Resources, Writing – review & editing. HT: Conceptualization, Resources, Writing – review & editing. IT: Writing – review & editing. WY: Conceptualization, Funding acquisition, Investigation, Writing – review & editing.
Funding
The author(s) declare that financial support was received for the research and/or publication of this article. This work was supported by KAKENHI (18KK0170, 21H02171, and 24H02277 to WY) from the Japan Society for the Promotion of Science (JSPS).
Conflict of interest
Authors RS, KY, and HT were employed by Stanley Electric Co., Ltd.
The remaining authors declare that the research was conducted in the absence of any commercial or financial relationships that could be construed as a potential conflict of interest.
Generative AI statement
The author(s) declare that no Generative AI was used in the creation of this manuscript.
Publisher’s note
All claims expressed in this article are solely those of the authors and do not necessarily represent those of their affiliated organizations, or those of the publisher, the editors and the reviewers. Any product that may be evaluated in this article, or claim that may be made by its manufacturer, is not guaranteed or endorsed by the publisher.
Supplementary material
The Supplementary Material for this article can be found online at: https://www.frontiersin.org/articles/10.3389/fpls.2025.1589279/full#supplementary-material
Supplementary Figure 1 | Lettuce plants were grown under continuous LED 664 or LD 660 with a PPFD of 300 μmol m−2 s−1 for 12 d. (A) Representative image of a lettuce plant. (B) Response of the photosynthetic fluorescence parameters (Y(II) and NPQ) to different light intensities. (C) Accumulation of anthocyanin in the lettuce plants. ** indicates a significant difference at P < 0.01, ns indicates no significant difference according to the t test. The data are presented as the mean ± SE, n = 4.
References
Ali, S. I., Gaafar, A. A., Metwally, S. A., Habba, I. E., and Abdel Khalek, M. R. (2020). The reactive influences of pre-sowing He-Ne laser seed irradiation and drought stress on growth, fatty acids, phenolic ingredients, and antioxidant properties of Celosia argentea. Sci. Hortic. 261, 108989. doi: 10.1016/j.scienta.2019.108989
Ando, E. and Kinoshita, T. (2018). Red light-induced phosphorylation of plasma membrane H+-ATPase in stomatal guard cells. Plant Physiol. 178, 838–849. doi: 10.1104/pp.18.00544
Arve, L. E., Terfa, M. T., Gislerød, H. R., Olsen, J. E., and Torre, S. (2013). High relative air humidity and continuous light reduce stomata functionality by affecting the ABA regulation in rose leaves. Plant Cell Environ. 36, 382–392. doi: 10.1111/j.1365-3040.2012.02580.x
Bantis, F., Smirnakou, S., Ouzounis, T., Koukounaras, A., Ntagkas, N., and Radoglou, K. (2018). Current status and recent achievements in the field of horticulture with the use of light-emitting diodes (LEDs). Sci. Hortic. 235, 437–451. doi: 10.1016/j.scienta.2018.02.058
Behnassi, M. and Haiba, M. E. (2022). Implications of the Russia-Ukraine war for global food security. Nat. Hum. Behav. 6, 754–755. doi: 10.1038/s41562-022-01391-x
Bergmeyer, H. U. and Bernt, E. (1974). “Methods of enzymatic analysis,” in Verlag chemie weinheim. Ed. Bergmeyer, H. U. (Academy Press Inc., New York and London), 1176–1179.
Binns, C. W., Lee, M. K., Maycock, B., Torheim, L. E., Nanishi, K., and Duong, D. T. T. (2021). Climate change, food supply, and dietary guidelines. Annu. Rev. Public Health 42, 233–255. doi: 10.1146/annurev-publhealth-012420-105044
Bula, R. J., Morrow, R. C., Tibbitts, T. W., Barta, D. J., Ignatius, R. W., and Martin, T. S. (1991). Light-emitting diodes as a radiation source for plants. HortScience 26, 203–205. doi: 10.21273/HORTSCI.26.2.203
Demers, D. A., Dorais, M., Wien, C. H., and Gosselin, A. (1998). Effects of supplemental light duration on greenhouse tomato (Lycopersicon esculentum Mill.) plants and fruit yields. Sci. Hortic. 74, 295–306. doi: 10.1016/S0304-4238(98)00097-1
Demmig, B., Winter, K., Krüger, A., and Czygan, F. C. (1987). Photoinhibition and zeaxanthin formation in intact leaves: a possible role of the xanthophyll cycle in the dissipation of excess light energy. Plant Physiol. 84, 218–224. Available at: https://www.jstor.org/stable/4270609 (Accessed November 13, 2024).
Dodd, I. C., Critchley, C., Woodall, G. S., and Stewart, G. R. (1998). Photoinhibition in differently colored juvenile leaves of Syzgium species. J. Exp. Bot. 49, 1437–1445. doi: 10.1093/jxb/49.325.1437
Fain, B. and Milonni, P. W. (1987). Classical stimulated emission. J. Opt. Soc Am. B. 4, 78–85. doi: 10.1364/JOSAB.4.000078
Foyer, C. H. and Noctor, G. (2005). Redox homeostasis and antioxidant signaling: a metabolic interface between stress perception and physiological responses. Plant Cell. 17, 1866–1875. doi: 10.1105/tpc.105.033589
Gao, L. M., Li, Y. F., and Han, R. (2015). He-Ne laser preillumination improves the resistance of tall fescue (Festuca arundinacea Schreb.) seedlings to high saline conditions. Protoplasma. 252, 1135–1148. doi: 10.1016/j.plaphy.2012.06.003
Gao, L., Li, Y., Shen, Z., and Han, R. (2018). Responses of He-Ne laser on agronomic traits and the crosstalk between UVR8 signaling and phytochrome B signaling pathway in Arabidopsis thaliana subjected to supplementary ultraviolet-B (UV-B) stress. Protoplasma. 255, 761–771. doi: 10.1007/s00709-017-1184-y
Golan, T., Müller-Moulé, P., and Niyogi, K. K. (2006). Photoprotection mutants of Arabidopsis thaliana acclimate to high light by increasing photosynthesis and specific antioxidants. Plant Cell Environ. 29, 879–887. doi: 10.1111/j.1365-3040.2005.01467.x
Heyneke, E., Luschin-Ebengreuth, N., Krajcer, I., Wolkinger, V., Müller, M., and Zechmann, B. (2013). Dynamic compartment specific changes in glutathione and ascorbate levels in Arabidopsis plants exposed to different light intensities. BMC Plant Biol. 13, 104. doi: 10.1186/1471-2229-13-104
Hitz, C. B., Ewing, J. J., and Hecht, J. (2012). Introduction to laser technology (Hoboken, New Jersey, USA: John Wiley & Sons).
Hogewoning, S. W., Trouwborst, G., Maljaars, H., Poorter, H., van Ieperen, W., and Harbinson, J. (2010). Blue light dose-responses of leaf photosynthesis, morphology, and chemical composition of Cucumis sativus grown under different combinations of red and blue light. J. Exp. Bot. 61, 3107–3117. doi: 10.1093/jxb/erq132
Hormann, H., Neubauer, C., and Schreiber, U. (1994). On the relationship between chlorophyll fluorescence quenching and the quantum yield of electron transport in isolated thylakoids. Photosynth. Res. 40, 93–106. doi: 10.1007/BF00019048
Huner, N. P. A., Öquist, G., and Sarhan, F. (1998). Energy balance and acclimation to light and cold. Trends Plant Sci. 3, 224–230. doi: 10.1016/S1360-1385(98)01248-5
Inada, K. (1976). Action spectra for photosynthesis in higher plants. Plant Cell Physiol. 17, 355–365. doi: 10.1093/oxfordjournals.pcp.a075288
Joshi, J., Zhang, G., Shen, S., Supaibulwatana, K., Watanabe, C. K. A., and Yamori, W. (2017). A combination of downward lighting and supplemental upward lighting improves plant growth in a closed plant factory with artificial lighting. HortScience 52, 831–835. doi: 10.21273/HORTSCI11822-17
Kalaitzoglou, P., van Ieperen, W., Harbinson, J., van der Meer, M., Martinakos, S., Weerheim, K., et al. (2019). Effects of continuous or end-of-day far-red light on tomato plant growth, morphology, light absorption, and fruit production. Front. Plant Sci. 10. doi: 10.3389/fpls.2019.00322
Kang, J. H., KrishnaKumar, S., Atulba, S. L. S., Jeong, B. R., and Hwang, S. J. (2013). Light intensity and photoperiod influence the growth and development of hydroponically grown leaf lettuce in a closed-type plant factory system. Hortic. Environ. Biotechnol. 54, 501–509. doi: 10.1007/s13580-013-0109-8
Klimek-Kopyra, A., Ślizowska, A., and Dobrowolski, J. W. (2020). Impact of coherent laser irradiation on germination and mycoflora of soybean seeds—innovative and prospective seed quality management. Agriculture. 10, 1–14. doi: 10.3390/agriculture10080314
Klimek-Kopyra, A., Dobrowolski, J. W., Czech, T., Neugschwandtner, R. W., Gambuś, F., and Kot, D. (2021). “The use of laser biotechnology in agri-environment as a significant agronomical advance increasing crop yield and quality,” in Advances in agronomy. Ed. Sparks, D. L. (Amsterdam, Netherlands: Elsevier Inc.), 1–33. doi: 10.1016/bs.agron.2021.06.001
Kozai, T. (2013). Resource use efficiency of closed plant production systems with artificial light: Concept, estimation and application to plant factory. Proc. Jpn. Acad. Ser. B 89, 447–461. doi: 10.2183/pjab.89.447
Kramer, D. M., Johnson, G., Kiirats, O., and Edwards, G. E. (2004). New fluorescence parameters for the determination of QA redox state and excitation energy fluxes. Photosynth. Res. 79, 209–218. doi: 10.1023/B:PRES.0000015391.99477.0d
Krawiec, M., Dziwulska-Hunek, A., Kornarzyński, K., and Palonka, S. (2012). Effect of selected physical factors on radish (Raphanus sativus L.) seeds germination. Acta Agrophys. 19, 737–748.
Kromdijk, J., Głowacka, K., and Long, S. P. (2019). Predicting light-induced stomatal movements based on the redox state of plastoquinone: theory and validation. Photosynth. Res. 141, 83–97. doi: 10.1007/s11120-019-00632-x
Lawson, T. and Blatt, M. R. (2014). Stomatal size, speed, and responsiveness impact on photosynthesis and water use efficiency. Plant Physiol. 164, 1556–1570. doi: 10.1104/pp.114.237107
Leakey, A. D. B., Xu, F., Gillespie, K. M., McGrath, J. M., Ainsworth, E. A., and Ort, D. R. (2009). Genomic basis for stimulated respiration by plants growing under elevated carbon dioxide. Proc. Natl. Acad. Sci. U.S.A. 106, 3597–3602. doi: 10.1073/pnas.0810955106
Legris, M., Ince, Y.Ç., and Fankhauser, C. (2019). Molecular mechanisms underlying phytochrome-controlled morphogenesis in plants. Nat. Commun. 10, 5219. doi: 10.1038/s41467-019-13045-0
Levine, C. P., Li, L., and Yamori, W. (2024). “The next evolution of agriculture: A review of innovations in plant factories,” in Handbook of photosynthesis, 4th Edition (Boca Raton, Florida, USA: CRC Press), 740–758. doi: 10.1039/c8tc06115g
Li, L., Tong, Y. X., Lu, J. L., Li, Y. M., Liu, X., and Cheng, R. F. (2021). Morphology, photosynthetic traits, and nutritional quality of lettuce plants as affected by green light substituting proportion of blue and red light. Front. Plant Sci. 12. doi: 10.3389/fpls.2021.627311
Li, M., Zhang, X., Zhang, H., Chen, W., Ma, L., Wang, X., et al. (2019). Highly efficient and dual broad emitting light convertor: an option for next-generation plant growth LEDs. J. Mater. Chem. C. 7, 3617–3622. doi: 10.1039/C8TC06115G
Massa, G. D., Kim, H. H., Wheeler, R. M., and Mitchell, C. A. (2008). Plant productivity in response to LED lighting. HortScience 43, 1951–1956. doi: 10.21273/HORTSCI.43.7.1951
McCree, K. J. (1972). The action spectrum, absorptance and quantum yield of photosynthesis in crop plants. Agric. Meteorol. 9, 191–216. doi: 10.1016/0002-1571(71)90022-7
Messinger, S. M., Buckley, T. N., and Mott, K. A. (2007). Evidence for involvement of photosynthetic processes in the stomatal response to CO2. Plant Physiol. 140, 771–778. doi: 10.1104/pp.105.073676
Metwally, S. A., Mohamed, S. L. M., Abou-leila, B. H., and Aly, M. S. (2014). Effect of drought stress and helium neon (He-Ne) laser rays on growth, oil yield and fatty acids content in Caster bean (Ricinus communis L.). Agric. For. Fish. 3, 203–208. doi: 10.11648/j.aff.20140303.20
Murage, E. N. and Masuda, M. (1997). Response of pepper and eggplant to continuous light in relation to leaf chlorosis and activities of antioxidative enzymes. Sci. Hortic. 70, 269–279. doi: 10.1016/S0304-4238(97)00078-2
Murage, E. N., Watashiro, N., and Masuda, M. (1997). Influence of light quality, PPFD and temperature on leaf chlorosis of eggplants grown under continuous illumination. Sci. Hortic. 68, 73–82. doi: 10.1016/S0304-4238(96)00953-3
Murase, H. (2015). The latest development of laser application research in plant factory. Agric. Agric. Sci. Proc. 3, 4–8. doi: 10.1016/j.aaspro.2015.01.003
Murchie, E. H. and Lawson, T. (2013). Chlorophyll fluorescence analysis: a guide to good practice and understanding some new applications. J. Exp. Bot. 64, 3983–3998. doi: 10.1093/jxb/ert208
Nadimi, M., Sun, D. W., and Paliwal, J. (2022). Effect of laser biostimulation on germination of wheat. Appl. Eng. Agric. 38, 77–84. doi: 10.13031/aea.14772
Nelson, N. and Yocum, C. F. (2006). Structure and function of photosystems I and II. Annu. Rev. Plant Biol. 57, 521–565. doi: 10.1146/annurev.arplant.57.032905.105350
Ohtake, N., Ishikura, M., Suzuki, H., Yamori, W., and Goto, E. (2018). Continuous irradiation with alternating red and blue light enhances plant growth while keeping nutritional quality in lettuce. HortScience 53, 1804–1809. doi: 10.21273/HORTSCI13469-18
Ooi, A., Wong, A., Ng, T. K., Marondedze, C., Gehring, C., and Ooi, B. S. (2016). Growth and development of Arabidopsis thaliana under single-wavelength red and blue laser light. Sci. Rep. 6, 33885. doi: 10.1038/srep33885
Ouzounis, T., Rosenqvist, E., and Ottosen, C. (2015). Spectral effects of artificial light on plant physiology and secondary metabolism: A review. HortScience 50, 1128–1135. doi: 10.21273/HORTSCI.50.8.1128
Oxborough, K. and Baker, N. R. (1997). Resolving chlorophyll a fluorescence images of photosynthetic efficiency into photochemical and non-photochemical components – calculation of qP and Fv’/Fm’ without measuring Fo’. Photosynth. Res. 54, 135–142. doi: 10.1023/A:1005936823310
Park, Y. and Runkle, E. S. (2017). Far-red radiation promotes growth of seedlings by increasing leaf expansion and whole-plant net assimilation. Environ. Exp. Bot. 136, 41–49. doi: 10.1016/j.envexpbot.2016.12.013
Proietti, S., Moscatello, S., Riccio, F., Downey, P., and Battistelli, A. (2021). Continuous lighting promotes plant growth, light conversion efficiency, and nutritional quality of Eruca vesicaria (L.) Cav. in controlled environment with minor effects due to light quality. Front. Plant Sci. 12. doi: 10.3389/fpls.2021.730119
Qiu, Z., Li, J., Zhang, M., Bi, Z., and Li, Z. (2013). He-Ne laser pretreatment protects wheat seedlings against cadmium-induced oxidative stress. Ecotoxicol. Environ. Saf. 88, 135–141. doi: 10.1016/j.ecoenv.2012.11.001
Qu, Y., Mueller-Cajar, O., and Yamori, W. (2023). Improving plant heat tolerance through modification of Rubisco activase in C3 plants to secure crop yield and food security in a future warming world. J. Exp. Bot. 74, 591–599. doi: 10.1093/jxb/erac340
Runkle, E. S. (2016). Red light and plant growth (Michigan State University Extension Floriculture Team). Available at: http://flor.hrt.msu.edu/assets/Uploads/Redlight3.pdf (Accessed September 10 2024).
Sager, J. C., Smith, W. O., Edwards, J. L., and Cyr, K. L. (1988). Photosynthetic efficiency and photochrome photoequilibria determination using spectral data. Trans. ASAE 31, 1882–1889. doi: 10.13031/2013.30952
Schmidt, F. H. (1961). Die enzymatische Bestimmung von Glucose und Fructose nebeneinander. Klin. Wochenschr. 39, 1244–1247. doi: 10.1007/BF01506150
Shimadzu, S., Seo, M., Terashima, I., and Yamori, W. (2019). Whole irradiated plant leaves showed faster photosynthetic induction than individually irradiated leaves via improved stomatal opening. Front. Plant Sci. 10. doi: 10.3389/fpls.2019.01512
Shimazaki, K., Doi, M., Assmann, S. M., and Kinoshita, T. (2007). Light regulation of stomatal movement. Annu. Rev. Plant Biol. 58, 219–247. doi: 10.1146/annurev.arplant.57.032905.105434
Siyami, R., Mirshekari, B., Farahvash, F., Rashidi, V., and Tarinejad, A. (2018). The effect of physical priming of seed on traits and yield of corn (Zea mays L.) under water deficit conditions in Iran. Appl. Ecol. Environ. Res. 16, 617–627. doi: 10.15666/aeer/1601_617627
Smillie, R. and Hetherington, S. (1999). Photoabatement by anthocyanin shields photosynthetic systems from light stress. Photosynthetica 36, 451–463. doi: 10.1023/A:1007084321859
Taiz, L. and Zeiger, E. (2015). Plant Physiology, fifth ed (Sunderland, MA: Sinauer Associates Inc.).
Taylor, G., Walter, J., and Kromdijk, J. (2024). Illuminating stomatal responses to red light: establishing the role of Ci-dependent versus -independent mechanisms in control of stomatal behaviour. J. Exp. Bot. 75, 6810–6822. doi: 10.1093/jxb/erae093
Trojak, M. and Skowron, E. (2017). Role of anthocyanin in high-light stress response. World Sci. News 81, 150–168. Available at: https://worldscientificnews.com/wp-content/uploads/2024/02/WSN-812-2017-145-163.pdf (Accessed November 4, 2024.
United Nations, Department of Economic and Social Affairs, and Population Division (2018). World urbanization prospects 2018: highlights (ST/ESA/SER.A/421). Available online at: https://www.un.org/development/desa/pd/content/world-urbanization-prospects-2018-highlights (Accessed September 01, 2024).
United Nations, Department of Economic and Social Affairs, and Population Division (2022). World population prospects 2022: summary of results. UN DESA/POP/2022/TR/NO. 3. Available online at: https://www.un.org/development/desa/pd/sites/www.un.org.development.desa.pd/files/wpp2022_summary_of_results (Accessed September 01, 2024).
Van Delden, S. H., SharathKumar, M., Butturini, M., Graamans, L., Heuvelink, E., Kacira, M., et al. (2021). Current status and future challenges in implementing and upscaling vertical farming systems. Nat. Food 2, 944–956. doi: 10.1038/s43016-021-00402-w
Van Gestel, N. C., Nesbit, A. D., Gordon, E. P., Green, C., Paré, P. W., Thompson, L., et al. (2005). Continuous light may induce photosynthetic downregulation in onion - consequences for growth and biomass partitioning. Physiol. Plant 125, 235–246. doi: 10.1111/j.1399-3054.2005.00560.x
Velez-Ramirez, A. I., van Ieperen, W., Vreugdenhil, D., and Millenaar, F. F. (2011). Plants under continuous light. Trends Plant Sci. 16, 310–318. doi: 10.1016/j.tplants.2011.02.003
Vogel, E., Donat, M. G., Alexander, L. V., Meinshausen, M., Ray, D. K., Karoly, D., et al. (2019). The effects of climate extremes on global agricultural yields. Environ. Res. Lett. 14, 054010. doi: 10.1088/1748-9326/ab154b
Way, D. A. and Yamori, W. (2014). Thermal acclimation of photosynthesis: on the importance of adjusting our definitions and accounting for thermal acclimation of respiration. Photosynth. Res. 119, 89–100. doi: 10.1007/s11120-013-9873-7
Wierer, J. J., Tsao, J. Y., and Sizov, D. S. (2013). Comparison between blue lasers and light-emitting diodes for future solid-state lighting. Laser Photonics Rev. 7, 963–993. doi: 10.1002/lpor.201300048
Wierer, J. J., Tsao, J. Y., and Sizov, D. S. (2014). The potential of III-nitride laser diodes for solid-state lighting. Phys. Status Solidi C. 11, 674–677. doi: 10.1109/IPCon.2013.6656490
Xu, W., Lu, N., Kikuchi, M., and Takagaki, M. (2021). Continuous lighting and high daily light integral enhance yield and quality of mass-produced nasturtium (Tropaeolum majus L.) in plant factories. Plants 10, 1203. doi: 10.3390/plants10061203
Yamori, W., Kondo, E., Sugiura, D., Terashima, I., Suzuki, Y., and Makino, A. (2016). Enhanced leaf photosynthesis as a target to increase grain yield: insights from transgenic rice lines with variable Rieske FeS protein content in the Cytochrome b6/f complex. Plant Cell Environ. 39, 80–87. doi: 10.1111/pce.12594
Zha, L., Liu, W., Zhang, Y., Zhou, C., and Shao, M. (2019b). Morphological and physiological stress responses of lettuce to different intensities of continuous light. Front. Plant Sci. 10. doi: 10.3389/fpls.2019.01440
Keywords: indoor horticulture, red light, laser diode (LD), photosynthesis, LED
Citation: Li L, Sugita R, Yamaguchi K, Togawa H, Terashima I and Yamori W (2025) High-precision lighting for plants: monochromatic red laser diodes outperform LEDs in photosynthesis and plant growth. Front. Plant Sci. 16:1589279. doi: 10.3389/fpls.2025.1589279
Received: 07 March 2025; Accepted: 21 April 2025;
Published: 20 May 2025.
Edited by:
Antonio Ferrante, Sant’Anna School of Advanced Studies, ItalyReviewed by:
Violeta Peeva, Bulgarian Academy of Sciences (BAS), BulgariaMojtaba Delshad, University of Tehran, Iran
Copyright © 2025 Li, Sugita, Yamaguchi, Togawa, Terashima and Yamori. This is an open-access article distributed under the terms of the Creative Commons Attribution License (CC BY). The use, distribution or reproduction in other forums is permitted, provided the original author(s) and the copyright owner(s) are credited and that the original publication in this journal is cited, in accordance with accepted academic practice. No use, distribution or reproduction is permitted which does not comply with these terms.
*Correspondence: Wataru Yamori, eWFtb3JpQGcuZWNjLnUtdG9reW8uYWMuanA=