 Xiang Guo1†
 Xiaoyan Li
- 1Shanxi Bethune Hospital, Shanxi Academy of Medical Sciences, Third Hospital of Shanxi Medical University, Tongji Shanxi Hospital, Taiyuan, China
- 2Department of Radiation Oncology, Shanxi Province Cancer Hospital, Taiyuan, China
- 3Department of Oncology, Taiyuan Central Hospital, Taiyuan, China
- 4Guizhou medical university pharmacy college Pharmacy (Chinese-foreign cooperation in running schools), Guiyang, China
- 5Department of Pathology, Shanxi Provincial People’s Hospital, Taiyuan, China
- 6Department of Geriatrics, Shanxi Provincial People’s Hospital, Taiyuan, China
- 7Department of Gastrointestinal Surgery, Shanxi Province Cancer Hospital, Taiyuan, China
- 8Department of Clinical Laboratory, Heping Branch, Shanxi Provincial People’s Hospital, Taiyuan, China
- 9Department of Blood Transfusion, Shanxi Provincial People’s Hospital, Taiyuan, China
Introduction: Global climate change has profound impacts on alpine ecosystems, and with climate warming, alpine plants often face a substantial risk of habitat loss. Saussurea medusa Maxim., known for its significant medicinal value, is a typical alpine plant predominantly found in the high-altitude regions of Southwest China. However, the impacts of climate change on the habitat suitability of S. medusa have not been fully understood.
Methods: We simulated ensemble species distribution models to assess the spatiotemporal habitat distribution pattern of S. medusa under different climate scenarios (ssp126 and ssp585) for the periods 2040s, 2060s, and 2070s.
Results and Discussion: The results show that the suitable habitats, under near current condition, are mainly distributed in the Qinghai-Xizang Plateau of China, covering the border regions of four provinces: Xizang, Qinghai, Sichuan, and Yunnan, with a total area of 14.06×10⁴ km2. Under future climate change scenarios, the area of suitable habitats, particularly the highly suitable habitats, is projected to contract significantly by 80.65%, accompanied by shifts in distribution centroids towards the southwest and higher altitudes in Xizang. These results indicate that the risk of S. medusa survival due to the loss of suitable habitats would persist in the future. Among the environmental factors analyzed, elevation and three bioclimatic predictors, BIO18 (precipitation of the warmest quarter), BIO12 (annual precipitation) and BIO4 (temperature seasonality), exhibit significant impacts on the potential distribution of suitable habitats for S. medusa. Our study provides an improved understanding of the potential habitat distribution dynamics of the endangered S. medusa, thereby offering a crucial reference for its conservation and sustainable management.
1 Introduction
Understanding the geographic distribution patterns of a species is imperative for comprehending its biogeography, evolution, and conservation concerns. Species distribution patterns can be influenced by various factors, such as climate, habitat availability, and interspecies interactions. Among these factors, climate-associated temperature and precipitation have been identified as significant factors (Song et al., 2023; Thomas et al., 2004; Trisos et al., 2020), potentially because of their close correlation with energy and water availability, which are crucial for species survival (Barbet-Massin and Jetz, 2014; Bell et al., 2014). With climate change, particularly climate warming, it is predictable that the distribution range of species is spatially dynamic and often shifts towards higher elevations and latitudes to track suitable habitats (Parmesan, 2007; Lenoir and Svenning, 2015; Thuiller et al., 2011).
To understand species distribution spatiotemporally, one of the most popular methods is the use of species distribution models (SDMs). These models link the ecological requirements of a species, based on its known occurrence points, to layers of environmental predictor data. Consequently, the potential distribution of the species across various habitats is projected based on similar environmental conditions (Elith and Leathwick, 2009; Neupane et al., 2024; Zhu et al., 2013). There are a series of modeling algorithms, such as generalized linear model (GLM, Nelder and Wedderburn, 1972), random forest (RF, Breiman, 2001), and the maximum entropy model (MaxEnt, Phillips et al., 2006). Nevertheless, an ensemble modeling approach, which combines a set of diverse SDMs to estimate habitat suitability through consensus, is increasingly recommended and widely applied (Duffy et al., 2017; Gan et al., 2025; Li et al., 2024a, 2024b; Song et al., 2023; Zhang et al., 2017). This is because the ensemble method offers a more robust approach than relying on a single SDM algorithm and mitigates the effects of individual model biases (Araújo and New, 2007; Grenouillet et al., 2011; Thuiller et al., 2009).
Saussurea medusa Maxim., a member of the Asteraceae family, is an alpine plant predominantly found in the high-altitude regions of Southwest China, including Qinghai, Gansu, Yunnan, Sichuan, and Xizang, at elevations between 3000 and 5600 meters (Liu, 1996). S. medusa has been widely utilized as a traditional Tibetan medicine for thousands of years, and has significant medicinal value because of its extensive pharmacological activities including anti-inflammation, anti-tumor, anti-aging, anti-hypoxia, and others (Bo et al., 2013; Fan et al., 2015; Guo et al., 2024; Qiu et al., 2010; Takasaki et al., 2000). In recent years, the population density of S. medusa has declined due to habitat loss caused by climate warming and over-harvesting by humans, and it has been listed as a second-class endangered plant in China. Consequently, it is crucial for conservation efforts to evaluate the distribution patterns of S. medusa and its response to climate change using the SDM methods. Peng et al. (2019) employed MaxEnt algorithm to predict the distribution range of S. medusa habitats, and found that the potential suitable areas would be reduced under future climate change scenarios. However, this study was conducted with a single model algorithm and limited distribution points, and a comprehensive investigation into the distribution dynamics of S. medusa, based on an ensemble model, is still needed.
In the present study, we simulated ensemble species distribution models to assess the spatiotemporal distribution pattern of S. medusa under climate change scenarios, as well as to identify the underlying driving factors. Furthermore, we discussed the conservation implications for S. medusa by comparing our predictive results with the existing distribution of National Nature Reserves in China. Our objectives were to enhance our understanding of the spatiotemporal distribution patterns of S. medusa under current and future environmental conditions, assess its endangered status, and thereby provide a reference for its conservation and sustainable management.
2 Material and methods
2.1 Occurrence records
Initially, a total of 209 occurrence records (Supplementary Figure S1, Supplementary Table S1), almost covering the whole known distribution range of S. medusa, were gathered from four sources: the global biodiversity information facility database (GBIF, https://www.gbif.org/species/5404320), iPlant (https://www.plantplus.cn/info/Saussurea%20medusa), Tropicos (https://www.tropicos.org/name/50056617), and the published literature searched in China National Knowledge Infrastructure (CNKI, https://www.cnki.net). For distribution information in the literature that was recorded with only detailed localities, the website https://api.map.baidu.com/lbsapi/getpoint/ was used to convert this information into coordinate form. Given that sampling bias could lead to model overfitting (Phillips et al., 2009; Zhu et al., 2014), the R package “spThin” (Aiello-Lammens et al., 2015) was employed to thin the occurrence points, ensuring that only one occurrence record appears in each raster cell (about 4.5 km2). Furthermore, where occurrence points remained densely clustered, additional manual adjustments were made. Ultimately, 131 occurrence records were implemented in the models (Figure 1; Supplementary Table S2).
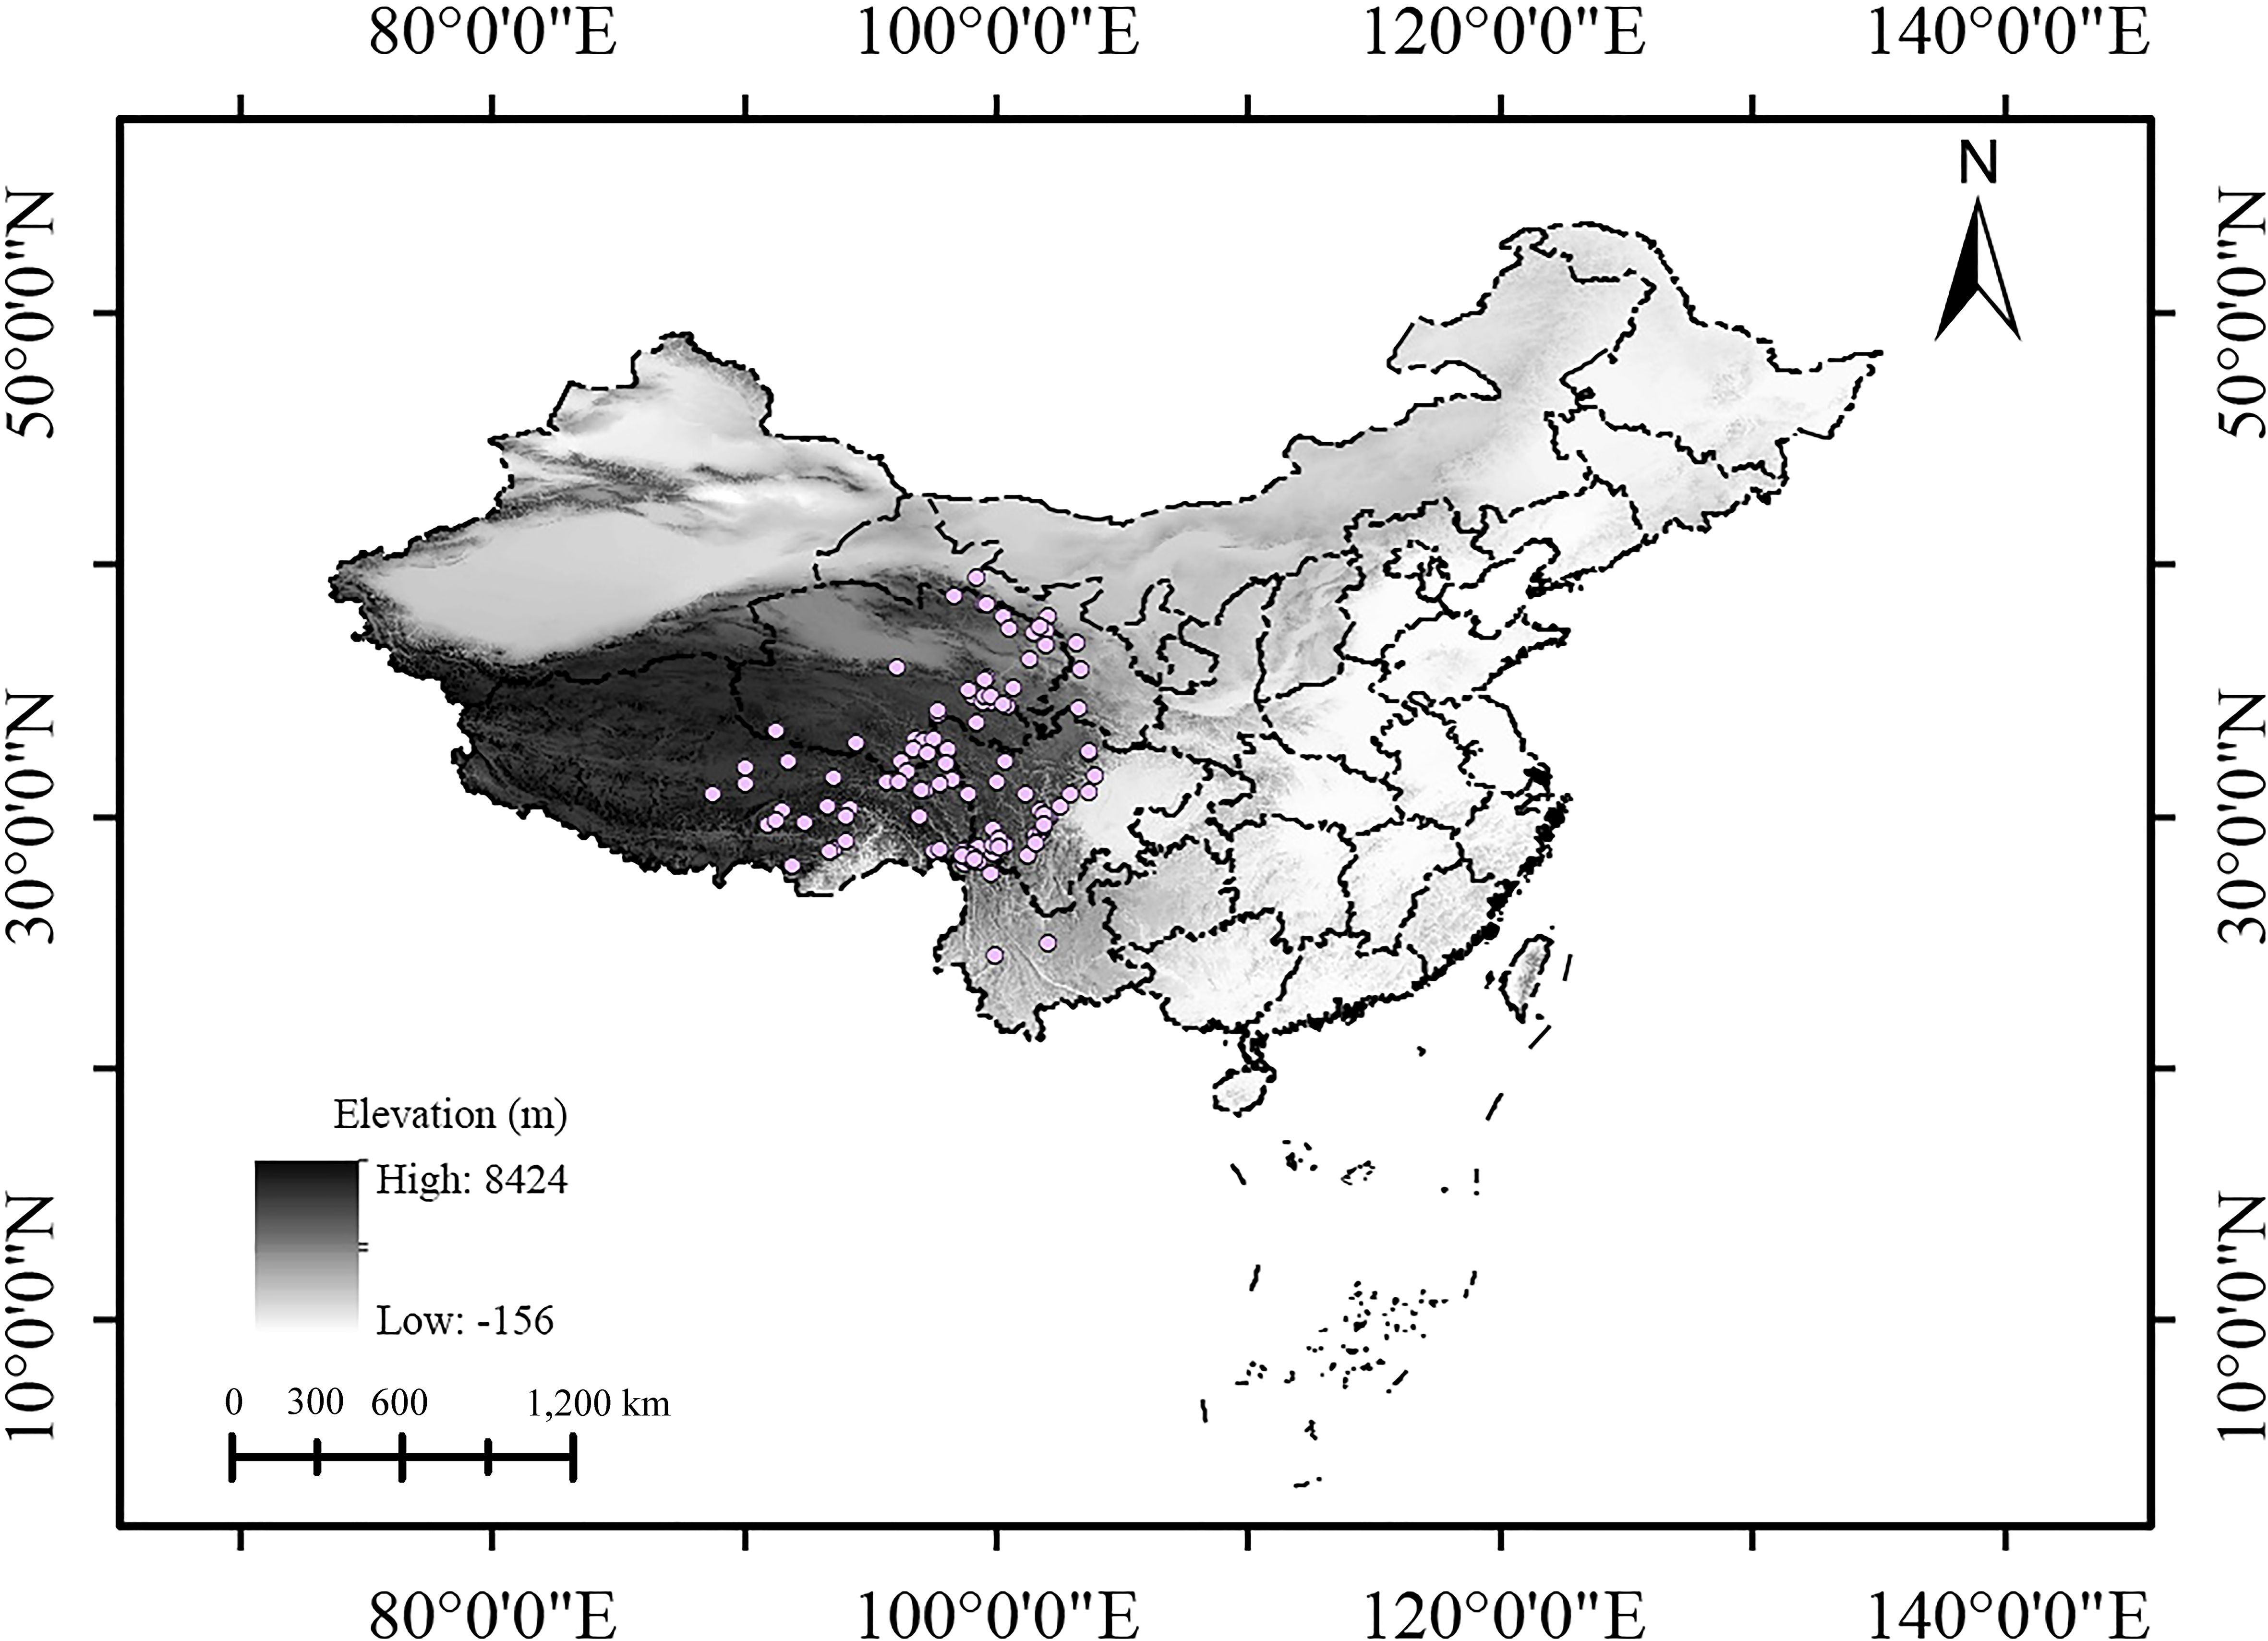
Figure 1. Occurrence data of Saussurea medusa used in the models.
2.2 Environmental variables
The 19 bioclimatic and elevation layers were downloaded from WorldClim 2.1 (https://www.worldclim.org/) (Fick and Hijmans, 2017). The bioclimatic data for near current conditions represented the period from 1970 to 2000. For future projections, the bioclimatic data we utilized represented three periods: 2021–2040, 2041–2060, and 2061–2080, under both low (ssp126) and high (ssp585) greenhouse gas emission scenarios from the Coupled Model Intercomparison Project 6 (CMIP6) version. For each period, the Beijing Climate Center Climate System Model (BCC-CSM2-MR) developed at the National Climate Center (Wu et al., 2019), was selected due to its extensive use in SDM studies focused on China (Gan et al., 2025; Li et al., 2024a; Zhang et al., 2021). For bioclimatic variables, the R package “corrplot” (Wei and Simko, 2021) was used to perform a Pearson’s correlation analysis, and for the two variables with a correlation coefficient |r| > 0.8, the one with a lower contribution in the initial ensemble model was removed to minimize multicollinearity among variables (Dormann et al., 2013; Zhang et al., 2022). The environmental layers selected were used in the subsequent modeling at a resolution of 2.5 arc-minutes.
2.3 Species distribution modeling
An ensemble model was developed using the R package “sdm” (Naimi and Araujo, 2016). Initially, an ensemble model was constructed with twelve commonly used models from the “sdm” package, namely BIOCLIM (Busby, 1991), classification and regression trees (CART, Loh, 2011), Domain (Reinhartz-Berger, 2010), flexible discriminant analysis (FDA, Hastie et al., 1994), generalized additive model (GAM, Hastie and Tibshirani, 1987), generalized linear model (GLM, Nelder and Wedderburn, 1972), Glmnet (Engebretsen and Bohlin, 2019), maximum entropy (MaxEnt, Phillips et al., 2006), Maxlike (Royle et al., 2012), multivariate adaptive regression spline (MARS, Friedman, 1991), support vector machine (SVM, Hearst et al., 1998), and random forests (RF, Breiman, 2001). In this analysis, the following parameters were implemented: the “gRandom” method of the ‘sdmData’ function to randomly generate 1000 pseudoabsence points (Barbet-Massin et al., 2012), with 75% of the distribution data used as training data and the remaining 25% as test data, employing a ten-fold cross validation approach. The maximum iterations were set to 5000 (Li et al., 2024a; Peng et al., 2019; Ran et al., 2024; Zhang et al., 2022). Consequently, the 12 single models were initially developed with the values of the area under a receiver operating characteristic (ROC) curve (AUC) (Lobo et al., 2008) and the true skill statistic (TSS) (Allouche et al., 2006). Based on the AUC and TSS values, the five top-performing single models were selected to jointly create the final ensemble models.
In the final modeling phase, the “ensemble” function was utilized to combine the output results of the selected individual models using a weighted average approach. The “roc” and “rcurve” functions were employed to generate the ROC curves for single models and response curves for each variable, respectively. To assess the impact of non-climate variables on projections, two variable combinations were independently used to develop ensemble models under current conditions: one with only bioclimatic variables (BIOs) and another with bioclimate plus elevation. For future projections, only BIOs were used, and the “ensemble” function with a weighted average approach was applied as well.
2.4 Model evaluation and analyses
In the ensemble model, average AUC and TSS values were generated to evaluate model performance. According to Peterson et al. (2008) and Hand and Anagnostopoulos (2013), an AUC value of 0.7–0.8 is considered acceptable, 0.8–0.9 is deemed great, and a value greater than 0.9 is remarkable. Conversely, a value less than 0.5 indicates that the model’s performance is no better than random. Additionally, the TSS value was considered because the AUC criterion can be misleading due to its equal weighting of sensitivity and specificity (Zhu et al., 2017). The TSS value ranges from −1 to +1, where +1 signifies perfect prediction, and values of zero or less indicate that the model’s performance is no better than random (Allouche et al., 2006; Pearce and Ferrier, 2000).
From the modeling, the habitat suitability was originally generated as continuous values. To characterize and compare the distribution patterns of different projections, the habitat suitability was defined into four classes using DIVA-GIS (Hijmans et al., 2001): “highly suitable” (0.6–1), “moderately suitable” (0.4–0.6), “minimally suitable” (0.2–0.4), and “unsuitable” (< 0.2) (Li et al., 2024a; Liu et al., 2022; Zhang et al., 2018). The R package “ggplot2” (Wickham, 2016) was used to visualize the response curves depicting the probability of S. medusa presence as environmental variable changes. OriginPro version 2021 (OriginLab Corporation, Northampton, MA, USA) was employed to visualize the percent contribution of each variable and the values of AUC and TSS generated in the models. Furthermore, the distribution data of National Nature Reserves from National Specimen Information Infrastructure (http://bhq.papc.cn/specimen.html) were mapped onto the prediction results to reflect the overlapping state, offering insights for conservation efforts.
3 Results
3.1 Variable selection, model selection and evaluation
Following a Pearson’s correlation analysis (Supplementary Figure S2) and initial model evaluation (Figure 2), eight of the 19 bioclimate variables (BIO2, BIO4–BIO5, BIO12, BIO15, and BIO17–BIO19) were retained, and plus one elevation, totally ten predictors were implemented in the ensemble models (Table 1). According to the values of AUC and TSS, the five single models (MARS, GAM, RF, SVM, and Maxent) were selected to develop ensemble models for both variable combinations of BIOs and BIOs + elevation (Figure 2). In the ensemble models, the average AUC and TSS values were 0.97 and 0.91 respectively, for the BIOs (Figure 3), and 0.97 and 0.90 for the BIOs + elevation (Supplementary Figure S3). This indicated that the model performances for both ensemble models were excellent and the predicted habitat suitability was reliable.
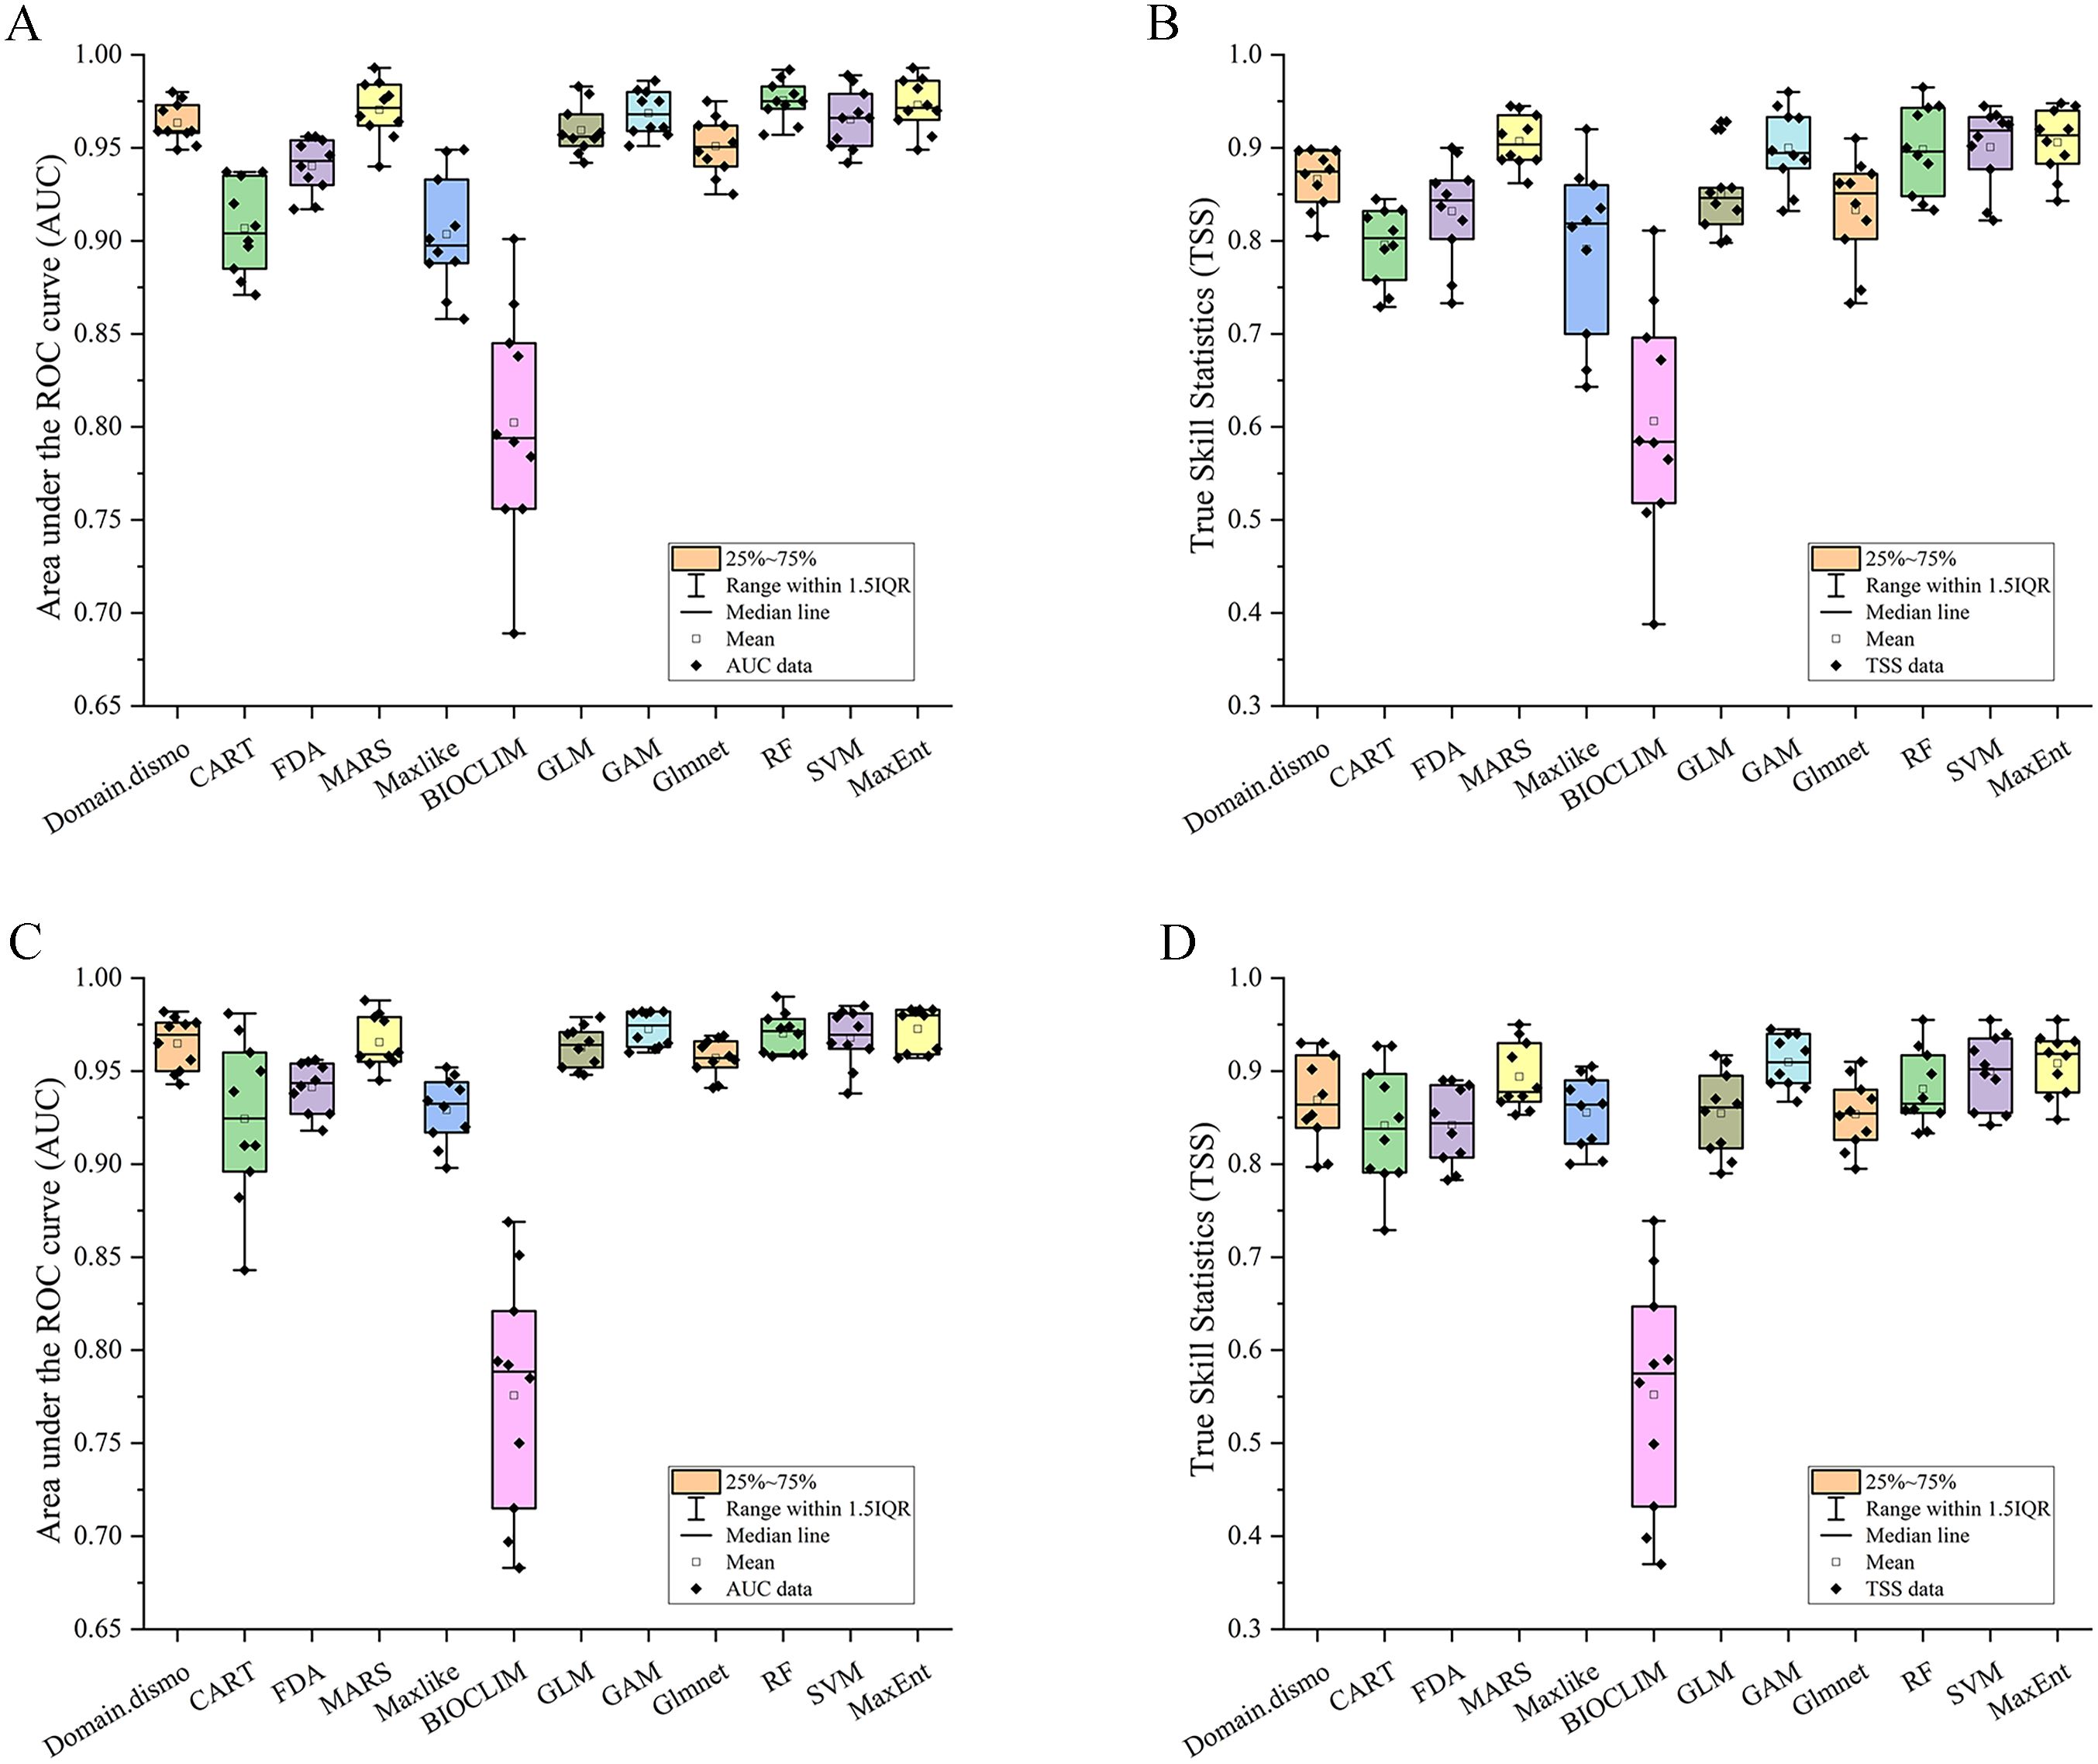
Figure 2. The area under the receiver operating characteristic curve (AUC) and true skill statistics (TSS) values of the twelve models. (A) AUC values under BIOs; (B) TSS values under BIOs; (C) AUC values under BIOs + elevation; (D) TSS values under BIOs + elevation.
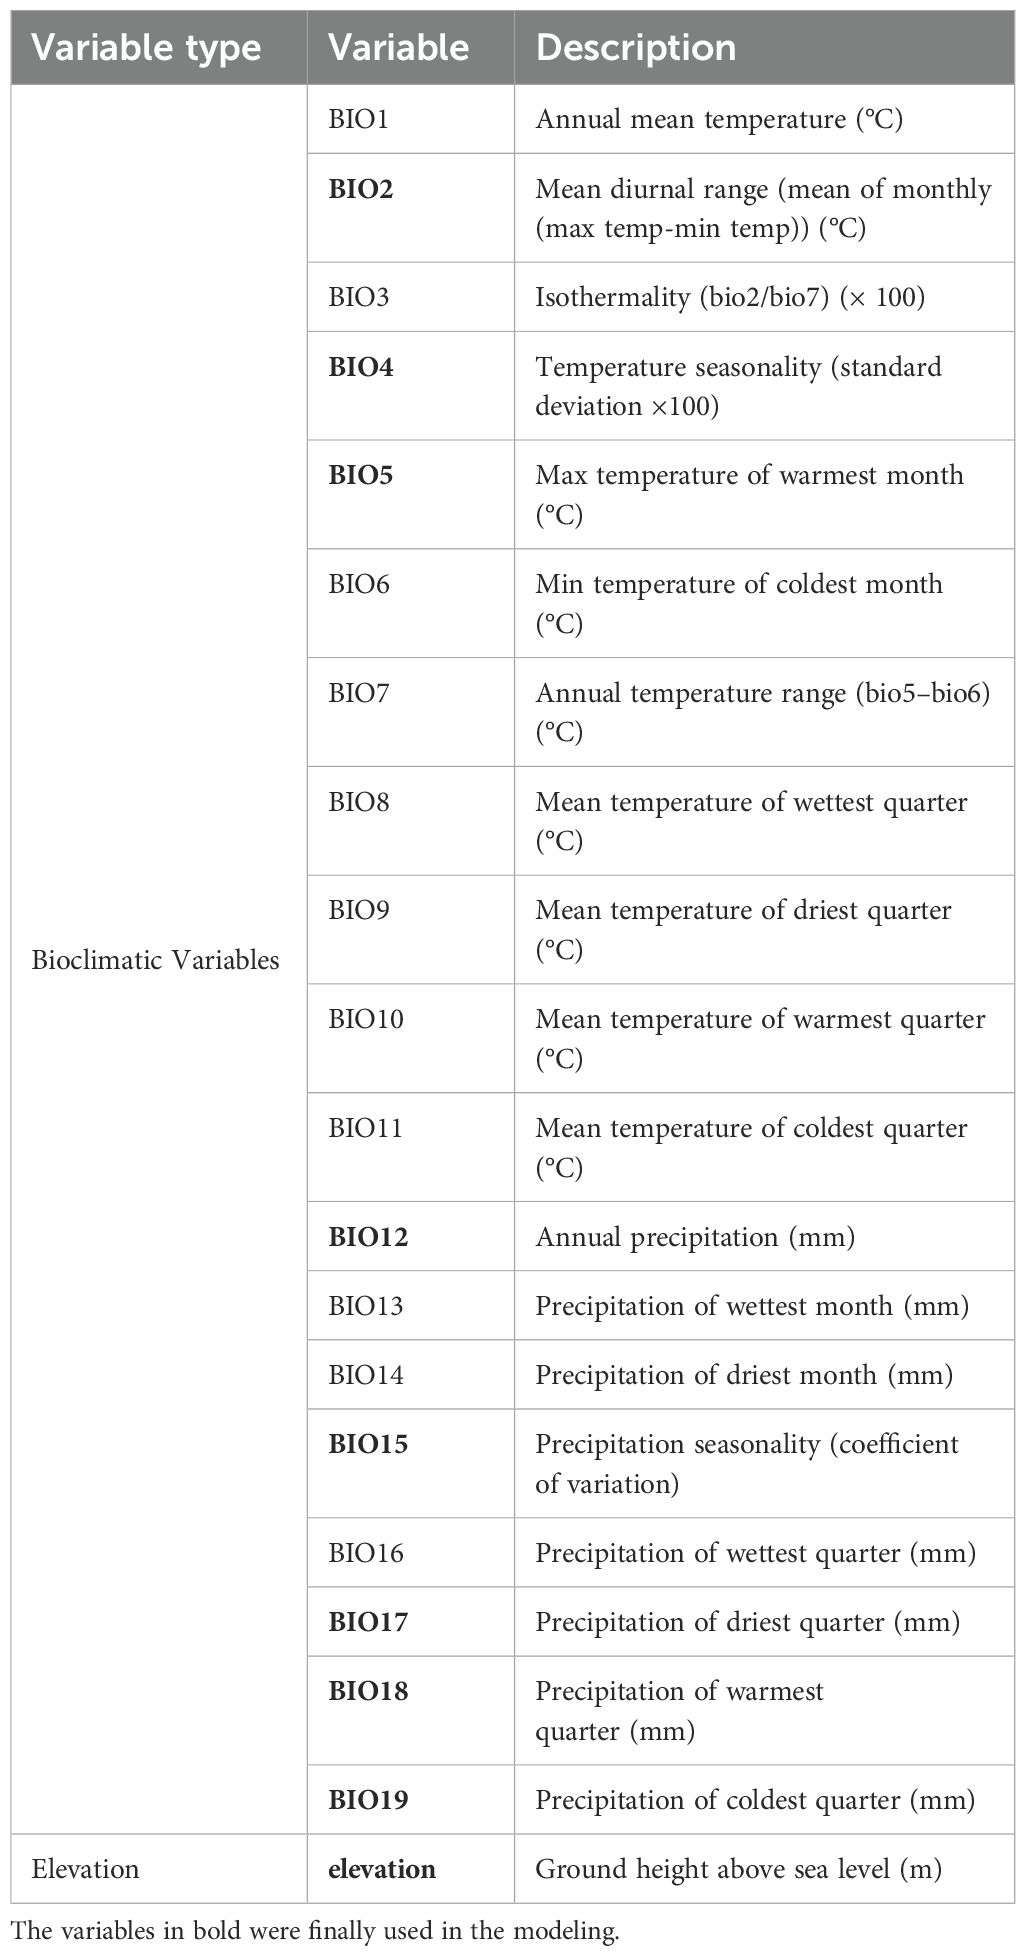
Table 1. The environmental variables considered in this study.
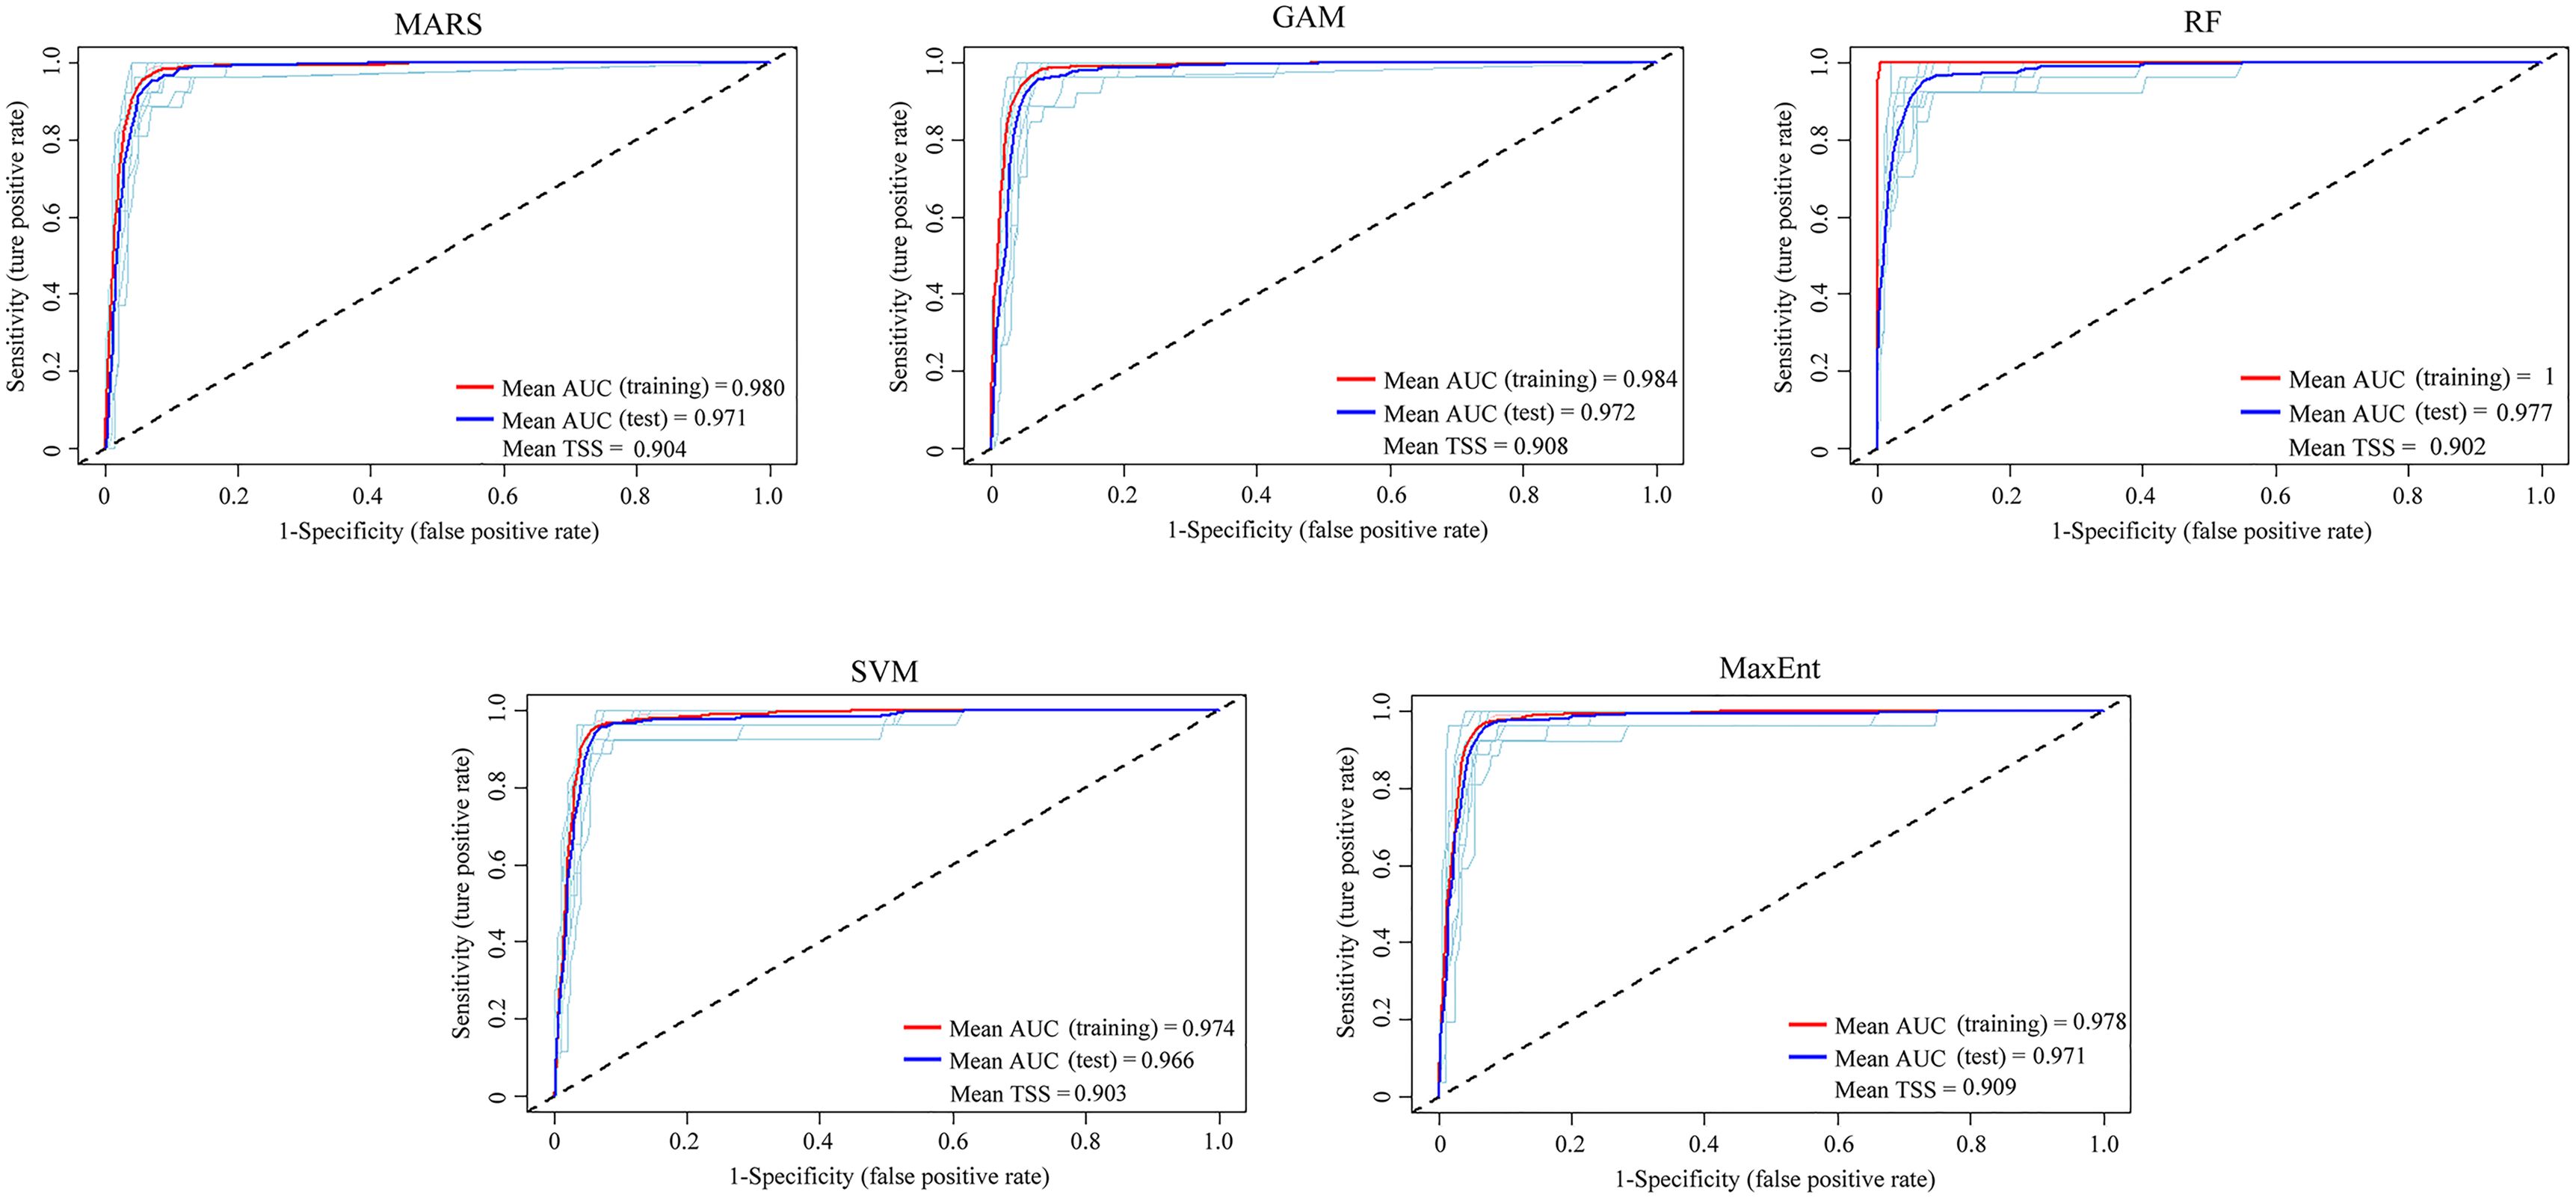
Figure 3. The area under the receiver operating characteristic curve (AUC) and true skill statistics (TSS) values for five single models of the ensemble models under BIOs.
3.2 Variables importance in the modeling
The percentage contribution of each variable in two ensemble models under two variable combinations is shown in Figure 4. Under the BIOs scenario (Figure 4A), BIO4 was the most significant contributor to the projection, with a contribution of 30.81%, followed by BIO18 at 24.96%, BIO12 at 19.84%, BIO5 at 8.65%, and BIO2 exhibited the lowest contribution at 0.94%. None of the nine factors used were revealed to be predominant predictors (>50%) in terms of contributing to the model. In the model under BIOs + elevation (Figure 4B), elevation exhibited the highest contribution at 33.18%, followed by BIO18 at 19.90% and BIO12 at 19.63%, while BIO2 had the lowest contribution at 0.89%.
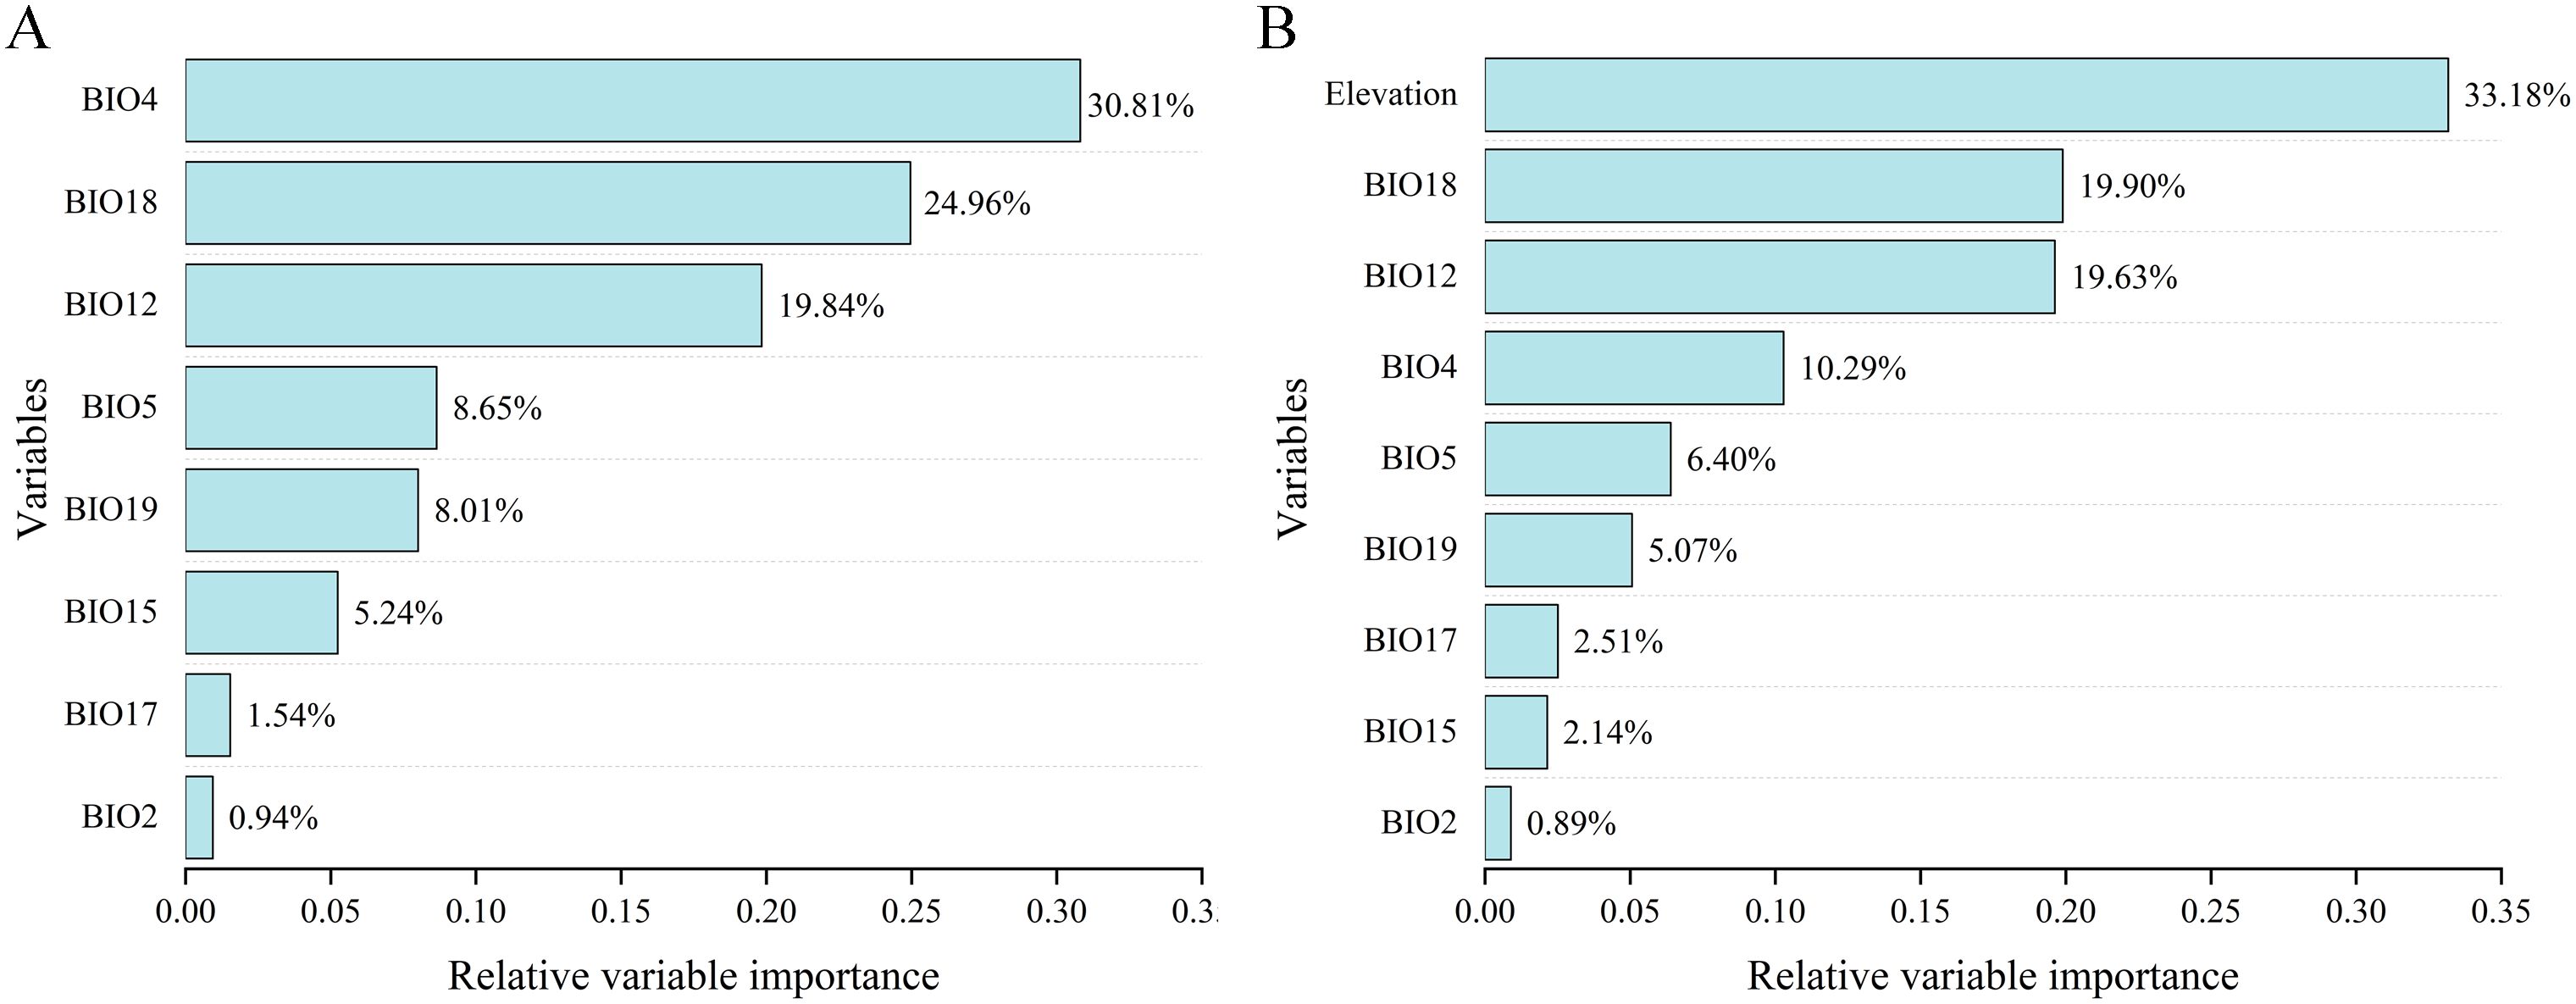
Figure 4. Percent contribution of environmental variables used in the models under different two variable combinations. (A) BIOs; (B) BIOs + elevation.
3.3 Response curves of the variables on presence probability of S. medusa habitat
To understand the probability of S. medusa presence as variable change, the response curves of the top three variables contributing to the ensemble model under BIOs + elevation are illustrated in Figure 5. From sea level, the probability of S. medusa presence increased and reached its highest value of 0.41 at an elevation of 4600 meters above sea level, after which it sharply declined with further increases in elevation. For BIO18 (precipitation of the warmest quarter), the probability sharply increased from 10 mm to 0.27 at 674 mm of precipitation, and then tended to increase very slowly. At 16 mm of BIO12 (annual precipitation), the probability reached its highest value of 0.30, initially declined sharply, and then generally remained at 0.01 as the annual precipitation increased.
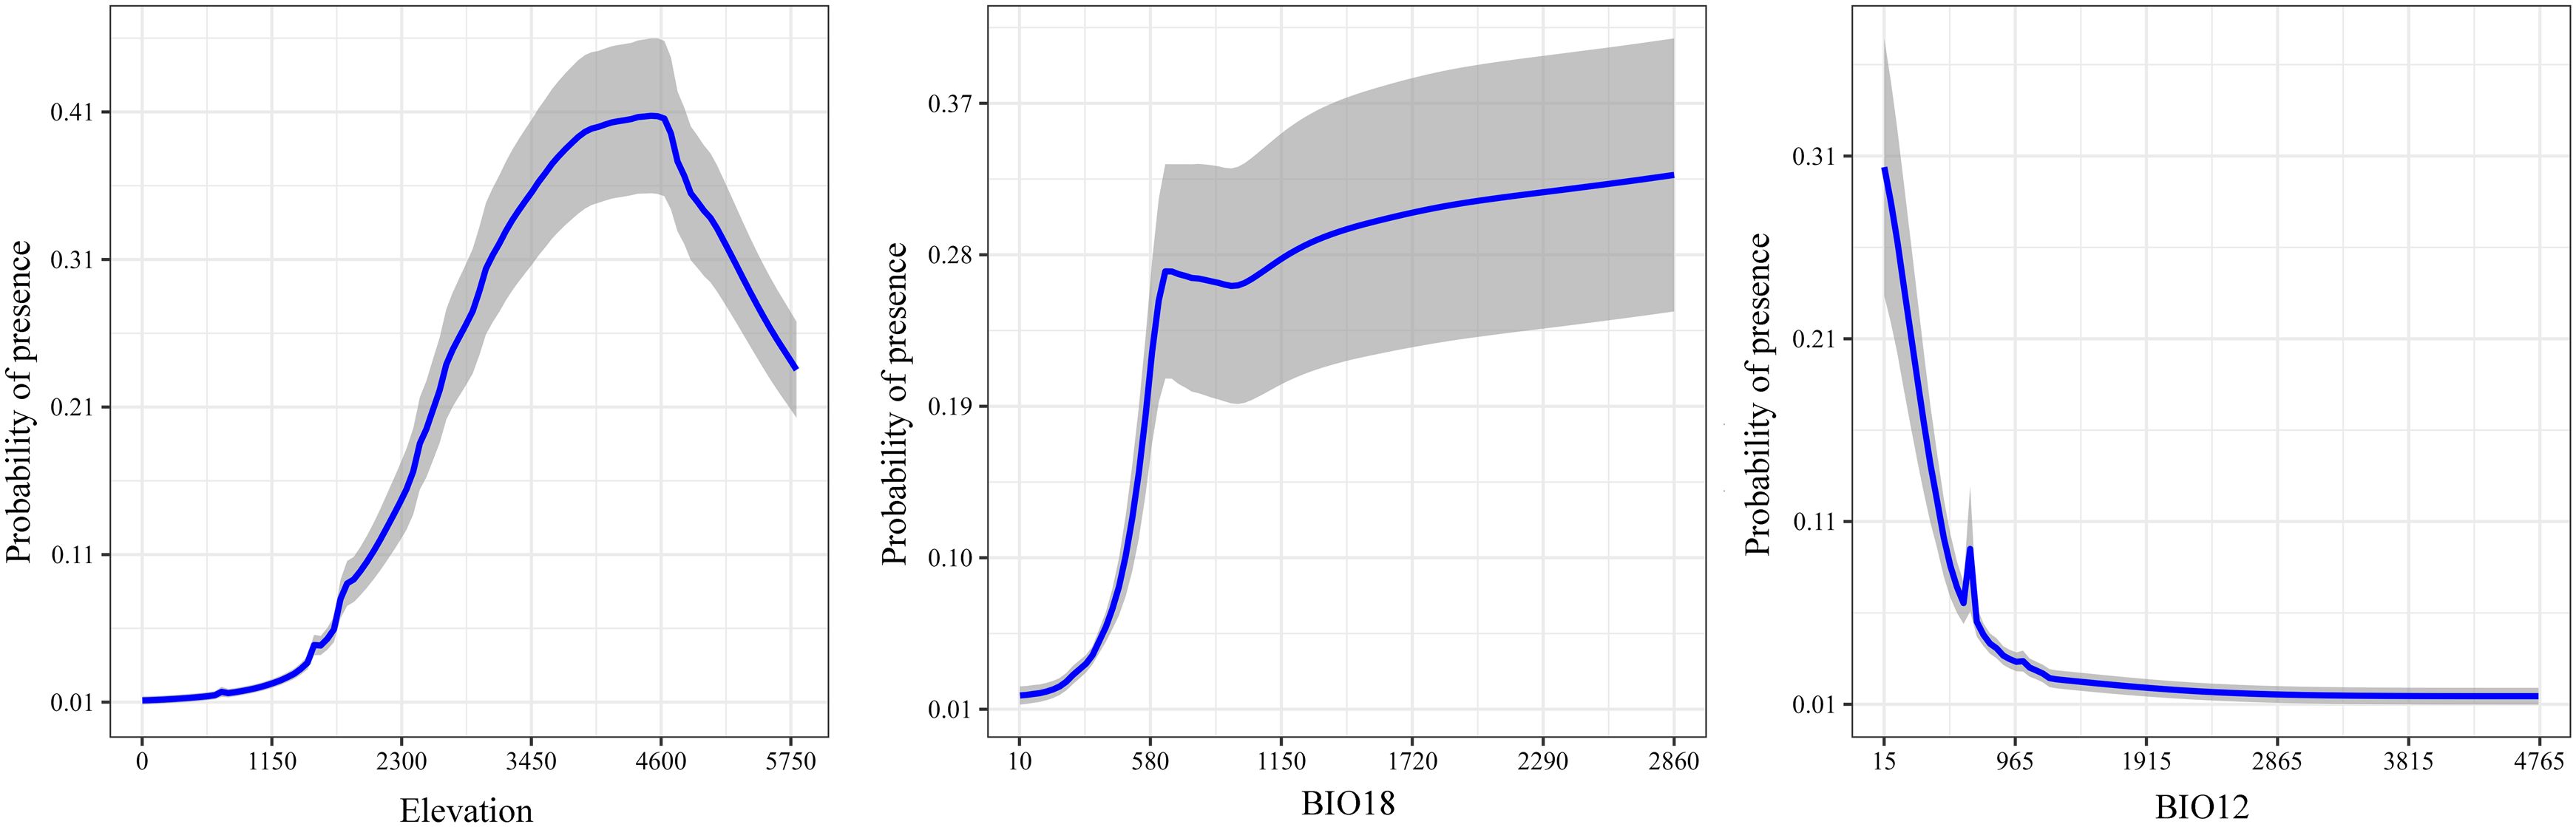
Figure 5. Response curves of the top three environmental variables in the modeling under BIOs + elevation.
3.4 The current potential distribution of S. medusa habitats
Two projections for the current potential distributions of S. medusa were conducted based on different combinations of variables. Suitable habitats (Figure 6A), inferred under only bioclimatic variables, were widely distributed in Southwest China, mainly including East Xizang, South Qinghai, West Sichuan, and North Yunnan. The suitable habitats had a total area of 14.06×10⁴ km2, with the minimally, moderately, and highly suitable habitats being 4.09×10⁴ km2, 3.20×10⁴ km2, and 6.77×10⁴ km2, respectively (Table 2). When the elevation layer was added, the distributions of the suitable habitats (Figure 6B) predicted were generally identical to those predicted with bioclimatic variables for all three levels of suitability.
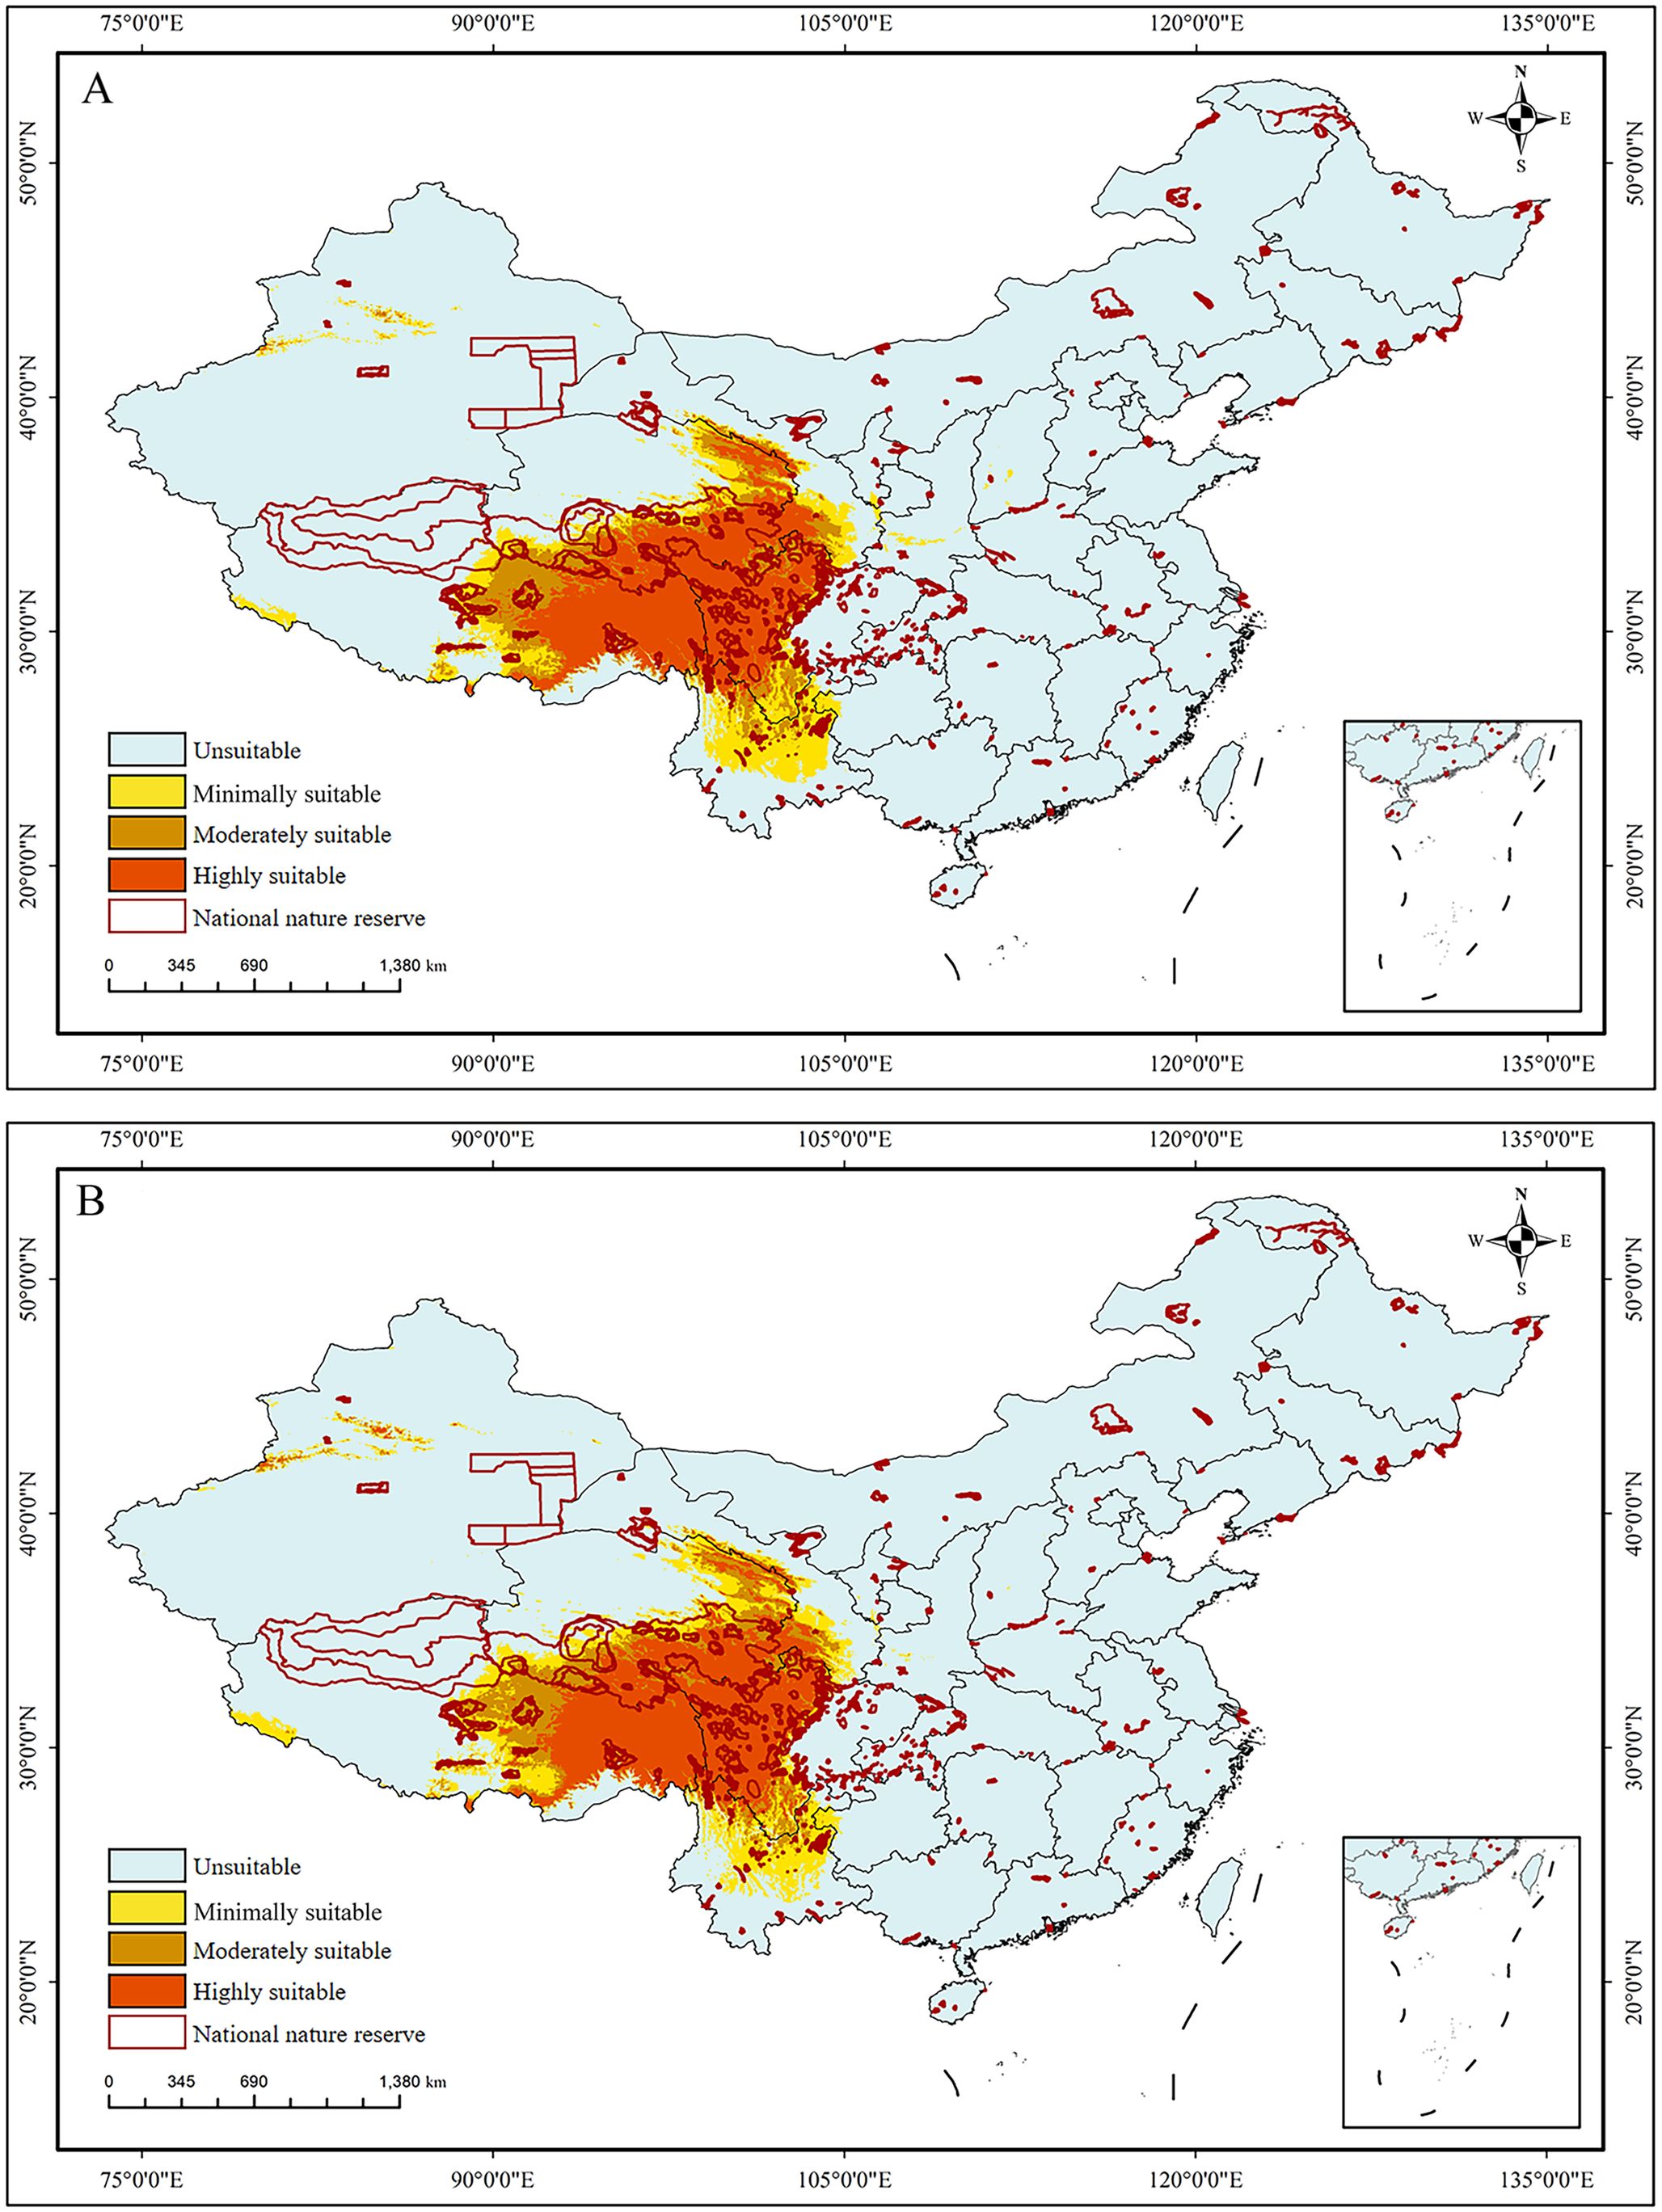
Figure 6. The predicted habitat suitability of Saussurea medusa under current environmental conditions. (A) BIOs; (B) BIOs + elevation. 0–0.2: unsuitable, 0.2–0.4: minimally suitable, 0.4–0.6: moderately suitable, 0.6–1: highly suitable.
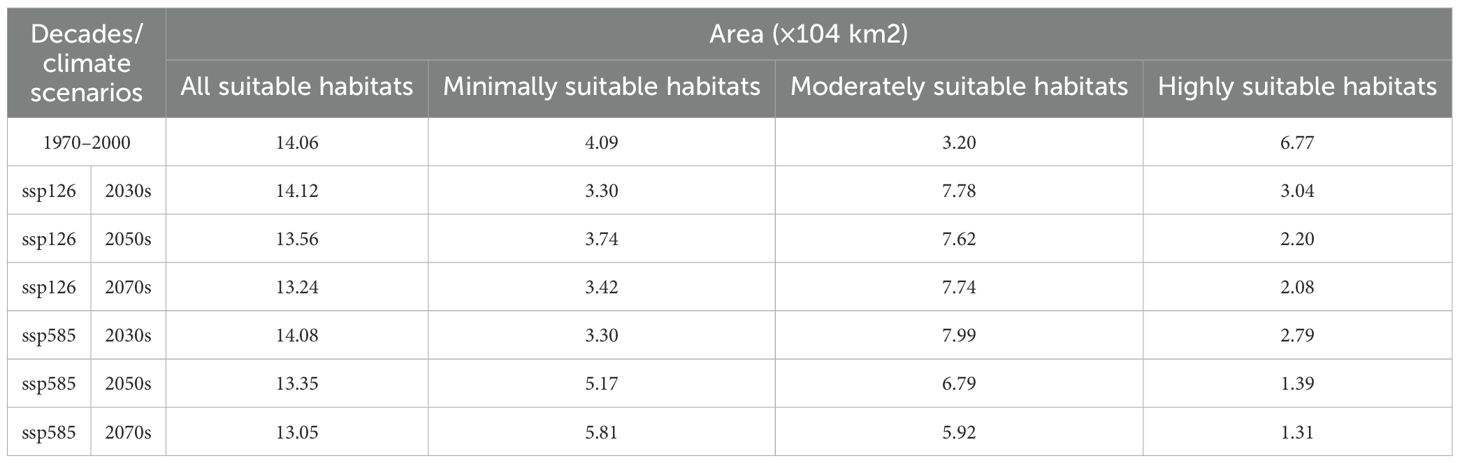
Table 2. The change of suitable areas of Saussurea medusa under current conditions and future climate change scenarios.
3.5 The future potential distribution of S. medusa habitats
Under the BIOS, six future prediction maps (Figure 7) were processed using variables representing three periods and two greenhouse gas emission scenarios. In future projections, the distribution range of suitable habitats exhibited an overall movement towards the west, primarily in East Xizang, Southeast Qinghai, and West Sichuan, resulting in almost no suitable habitats in North Yunnan. Particularly, when compared to the current near-future conditions, the distribution of highly suitable habitats would undergone a significant change, only found in Southeast Xizang. Overall, the area of suitable habitats for S. medusa would slightly decrease under future climate change scenarios, with an average of 13.57×10⁴ km2, compared to the 14.06×10⁴ km2 under near current condition. However, the proportions of minimally, moderately, and highly suitable habitats would differ significantly (Table 2). In comparison to the 6.77×10⁴ km2 under near current condition, the highly suitable habitats would have a significant contraction. At ssp585 of 2070s, there was only 1.31×10⁴ km² distributed in Southeast Xizang. Conversely, the area of moderately suitable habitats were expanded in all future climate change scenarios (7.31×10⁴ km2 on average). For the minimally suitable habitats, the areas were expanded at ssp585 of 2070s and 2050s, and contracted under other future climate change scenarios.
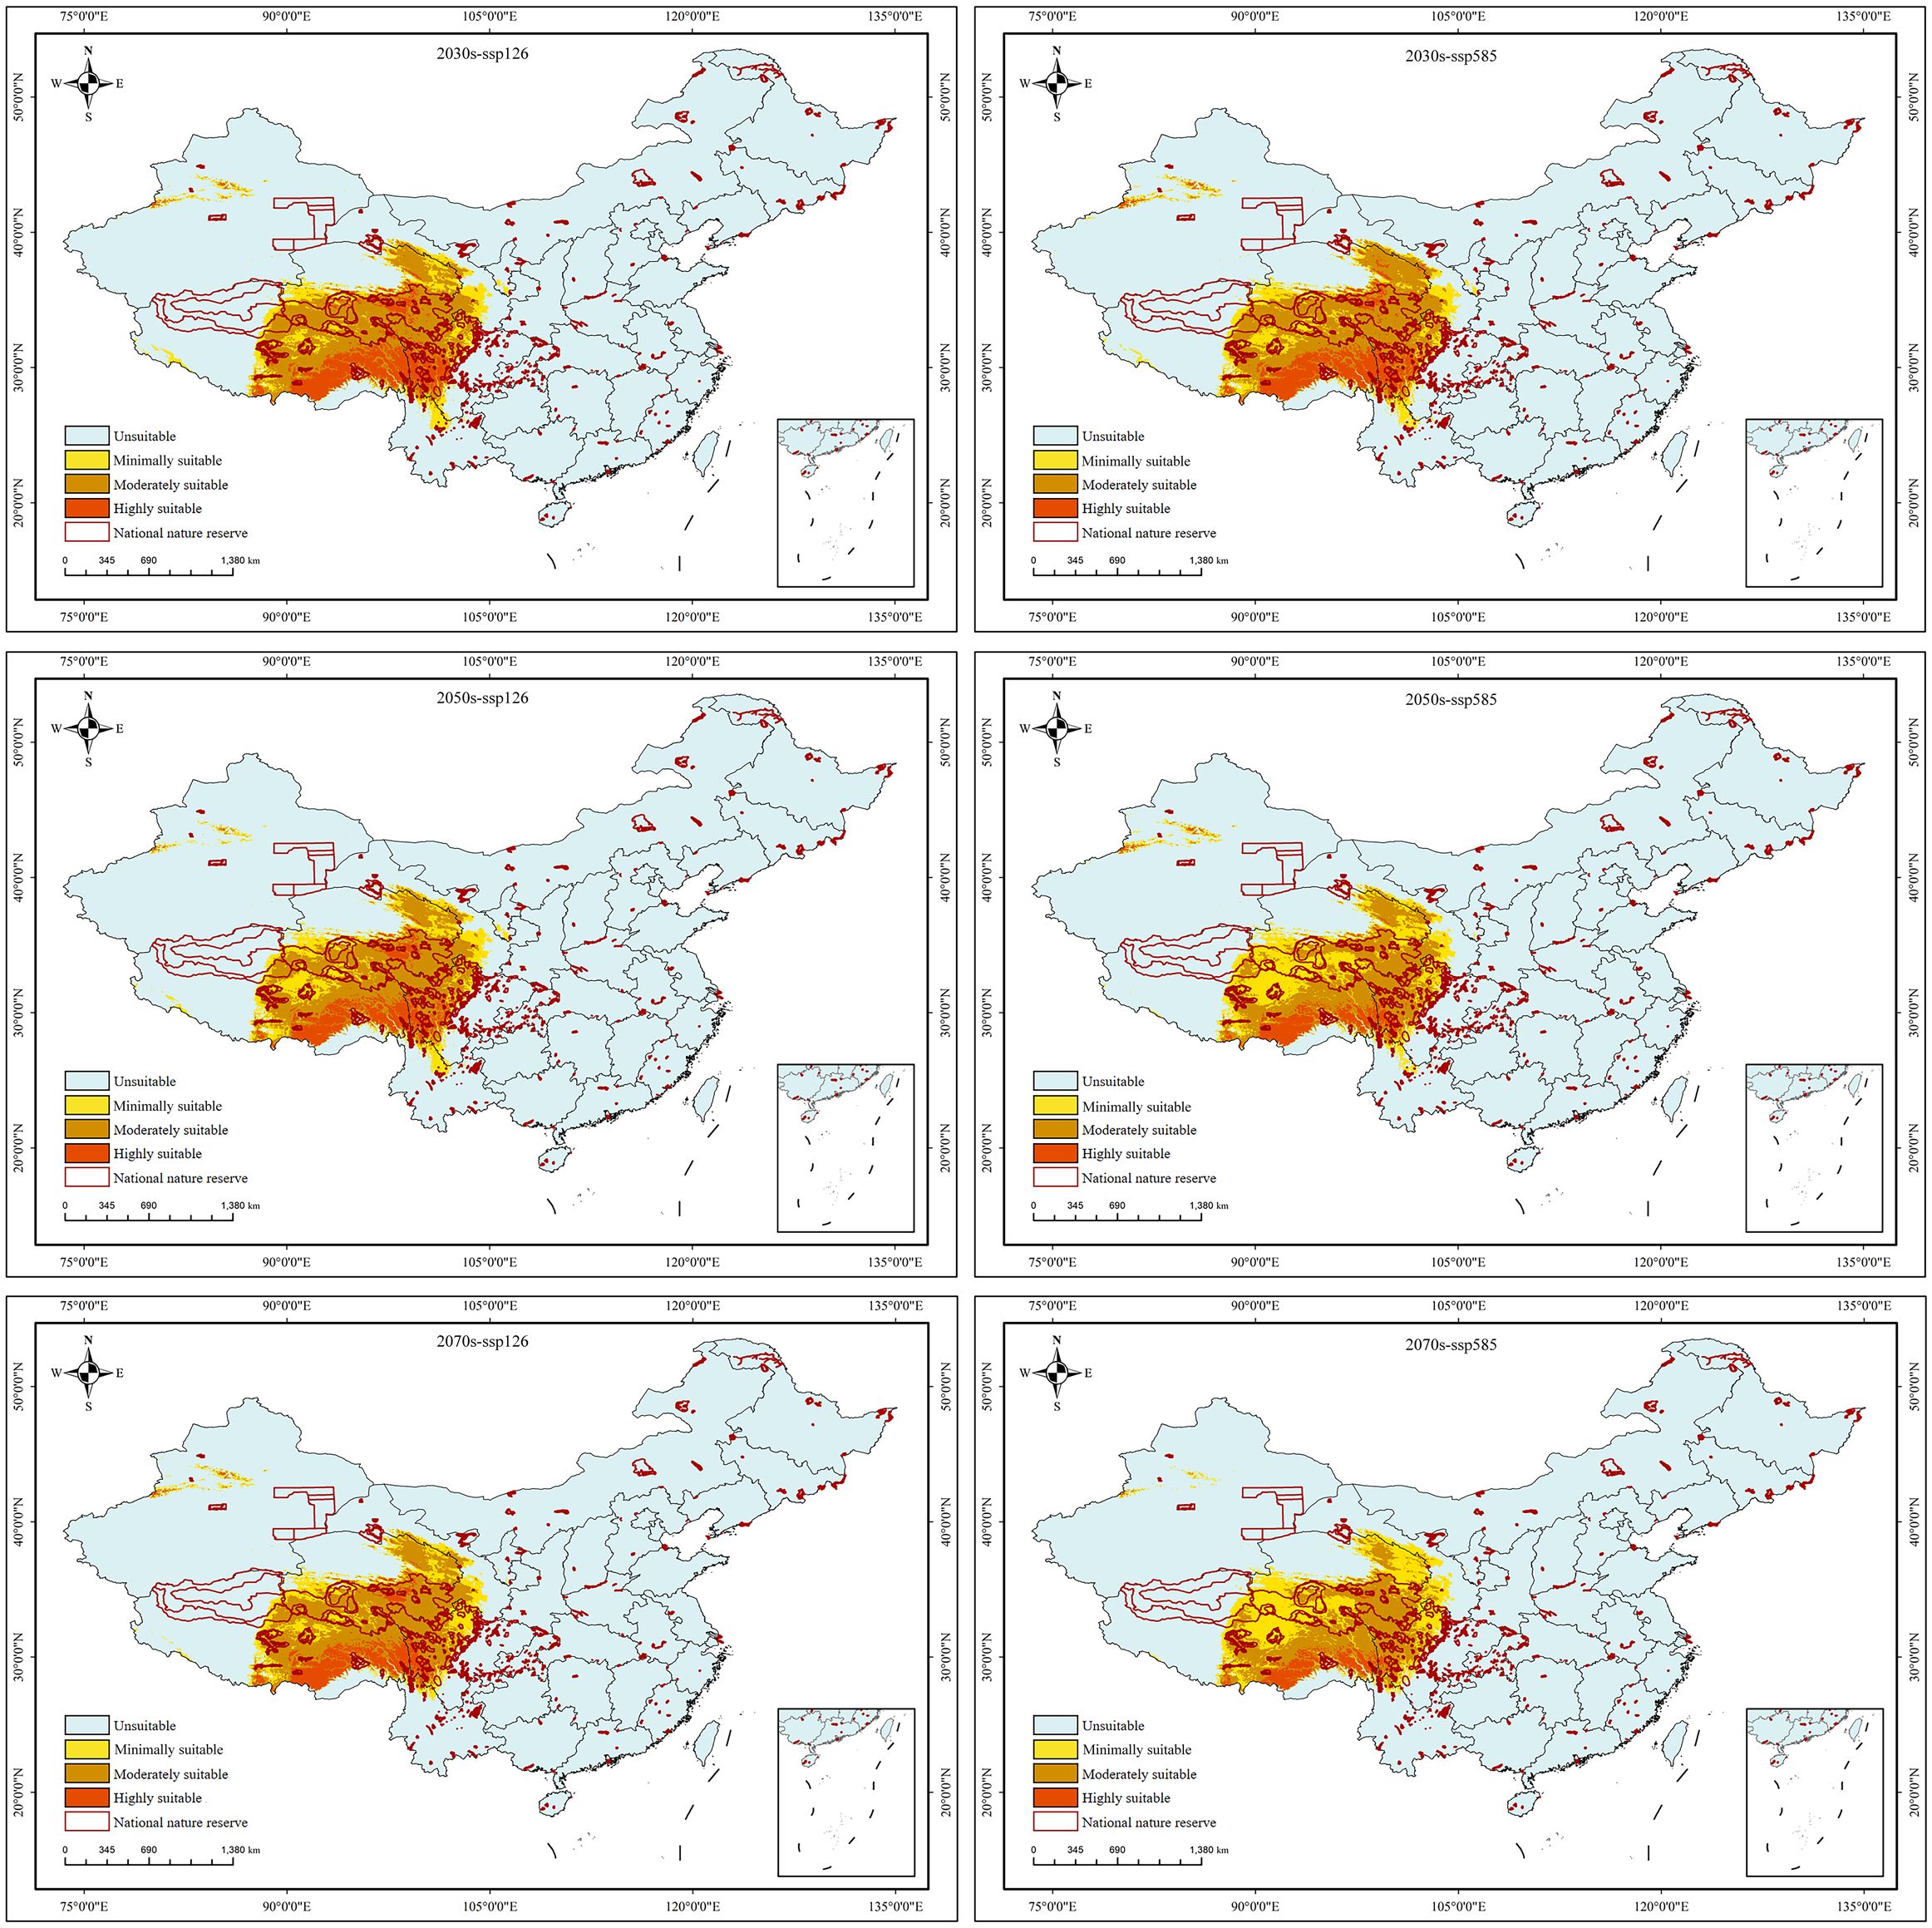
Figure 7. The predicted habitat suitability of Saussurea medusa under future climate change scenarios. 0–0.2: unsuitable, 0.2–0.4: low suitable, 0.4–0.6: moderately suitable, 0.6–1: highly suitable.
3.6 Centroid shifts of Saussurea medusa in future climatic scenarios
To obviously compare the distribution dynamics of the highly suitable habitats of S. medusa, the shifts of distribution centroids among different periods and climate scenarios were analyzed and shown in Figure 8. In the current projection, the is located in East Xizang near Sichuan, at coordinates 98.191°E, 31.748°N, with an elevation of 4125 meters. In the ssp126 scenario, the distribution centroids were projected to always shift southwestward from 2030s to 2070s. The distances were 235 km, 28 km, and 96 km, representing the three period stages, respectively. At the 2070s, the coordinates of distribution centroid was 95.047°E, 30.214°N, with an elevation of 4116 meters. In the ssp585 scenario, the distribution centroids were projected to always shift southwestward from 2030s to 2070s as well. The distances were 248 km, 189 km, and 45 km, representing the three period stages, respectively. At the 2070s, the coordinates of distribution centroid was 95.166°E, 29.298°N, with an elevation of 4539 meters.
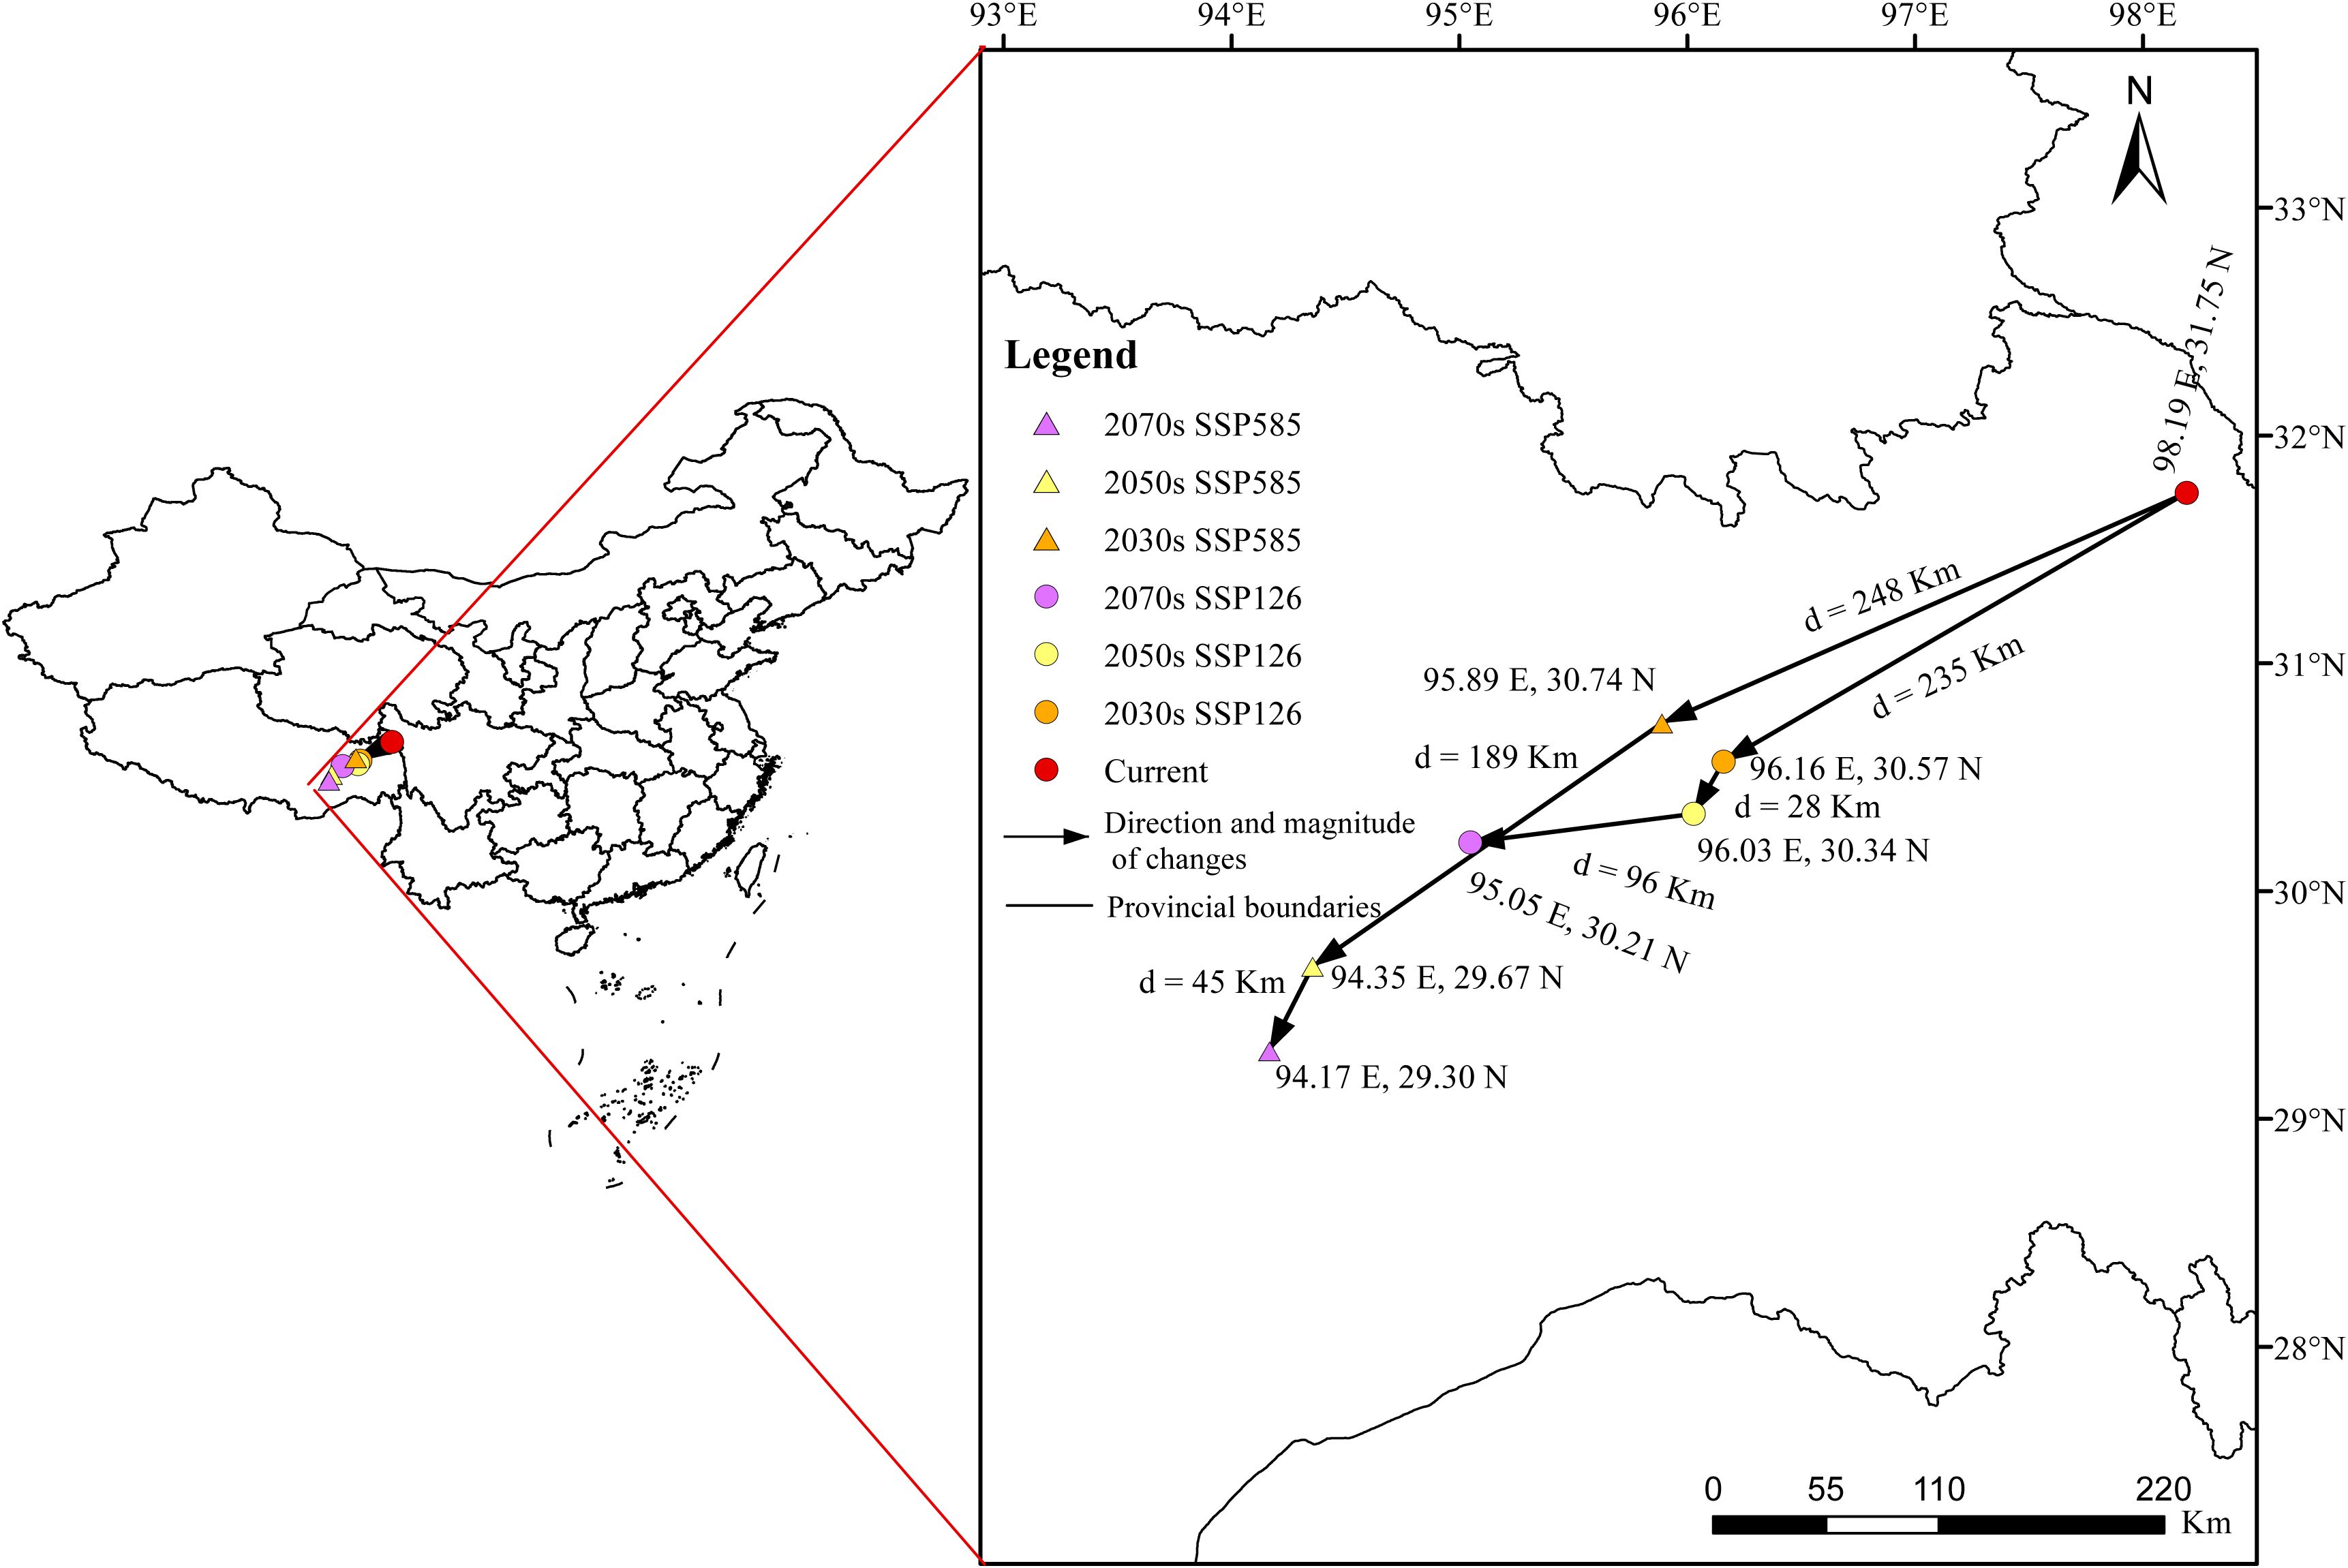
Figure 8. Centroids shifts of Saussurea medusa under future climate change scenarios.
4 Discussion
4.1 Potential distribution dynamics of S. medusa under near current and future conditions
Saussurea medusa is a valuable medicinal plant with various pharmacological activities and holds great potential for widespread application in human medicine (Fan et al., 2015). However, this alpine plant faces a survival crisis primarily due to climate change and anthropogenic activities, such as over-harvesting (Zhao et al., 2024). This study, for the first time, predicted the potential distributions of S. medusa habitats and identified the underlying driving factors using ensemble models. The potential distribution range of suitable habitats generally covers or even exceeds the sampling points recorded from previous field observations, suggesting that the distribution pattern of S. medusa habitat predicted in the present study is reliable.
Under the current climatic conditions, S. medusa is primarily distributed across the Qinghai-Xizang Plateau of China, covering the border regions of four provinces: Xizang, Qinghai, Sichuan, and Yunnan. Overall, the predicted suitable regions for S. medusa habitats align with those identified by Peng et al. (2019) using the MaxEnt modeling method. However, significant difference was present in the range size. Our findings showed a larger coverage, and even the highly suitable area revealed herein is comparable to the whole suitable area of Peng et al. (2019) in size. Under future climate change scenarios, the entire suitable area is projected to significantly contract, which is consistent with the highly suitable habitats recovered herein. We attribute these differences primarily to variations in model methods and parameters. Firstly, the models used in the studies are different, despite the Maxent method used in Peng et al. (2019) being one of the ensemble models used our study. Secondly, the threshold values defining suitable and unsuitable habitats vary. We adopted the 0.2 threshold value, which is widely used in ensemble models (e.g., Li et al., 2024a; Liu et al., 2022; Zhang et al., 2018), whereas Peng et al. (2019) used the 10 percentile training presence threshold. Thirdly, the different occurrence point datasets for S. medusa may also explain the discrepancies. The integrity of input occurrence records within the known distribution range of the modeled species significantly affects the projection results (Sillero et al., 2021; Thibaud et al., 2014). In our analysis, we used 131 occurrence records generally covering the known distribution range of S. medusa, compared to the 36 records used in Peng et al. (2019). In summary, our results, derived from ensemble models with more sampling points, may be more effective in revealing the distribution patterns of S. medusa.
4.2 Impacts of climate and elevation on the distribution of S. medusa
Among the ecological factors, climate exerts direct effects on the growth and development of vegetation and is often regarded the dominant factor influencing their geographical distribution of them (Kling et al., 2020; Huang et al., 2024; Li et al., 2024b). In our analyses, eight bioclimatic factors were selected, with three related to temperature and the remaining five to precipitation. Among them, BIO4, BIO18 and BIO12 consistently represent the three top bioclimatic variables contributing to the models, irrespective of whether elevation is included in the variable combinations, indicating that both temperature and precipitation have significant impacts on the distribution of S. medusa.
The elevation factor, frequently associated with temperature and water availability, can act as a dispersal barrier and is crucial in shaping the distribution of species (Azrag et al., 2018; Chardon et al., 2015; Zhang et al., 2022). Alpine plants, for instance, often display a “sky island” distribution model, where populations are isolated by steep valleys due to adaptations to extreme environments such as cold temperatures, high UV radiation, and low oxygen levels (Wang et al., 2009; Zhang et al., 2023). Furthermore, they are considered particularly sensitive to the effects of global warming (Korner, 2003). With climate warming, the suitable range for Saussurea species shifts to higher elevations, but the restricted space in alpine regions often increases the risk of extinction (Peng et al., 2019; Zhao et al., 2024). In our analysis, elevation was the most significant factor in the modeling, accounting for up to 33.18%, which aligns with Zhao et al. (2024), who modeled other Saussurea species using the MaxEnt algorithm. Additionally, the optimal threshold for elevation was 2580–5600 meters, generally consistent with Liu (1996) based on field observations. Moreover, under future climate change scenario, our analysis also revealed shifts in the distribution range to higher elevations as founded in other Saussurea species (Zhao et al., 2024). The distribution centroid of the highly suitable habitats in the current projection is located in East Xizang near Sichuan, at coordinates 98.191°E, 31.748°N, with an elevation of 4125 meters. For both two climatic scenarios, the distribution centroids would shift southwestward in Xizang. At ssp126 and ssp585 of 2070s, the coordinates of distribution centroids were 95.047°E, 30.214°N, with an elevation of 4116, and 95.166°E, 29.298°N, with an elevation of 4539 meters, respectively.
4.3 Implications for S. medusa conservation
The shrinking of suitable habitats, especially the highly suitable habitats, under climate warming indicates effective protection should be consistently conducted. Overall, the National Nature Reserves established before exhibit a relatively high coverage with the suitable habitats of S. medusa, such as those in West Sichuan and Southeast Qinghai, suggesting they could provide extensive protection for S. medusa. However, there is a significant gap in most of East Xizang, where there are few National Nature Reserves but which represent the highly suitable habitats of S. medusa for both current and future periods. This suggests a need for enhanced protection measures, especially in this region. On one hand, designating protected areas in this region, also based on comprehensive investigations on the diversity and conservation needs of other Saussurea species or alpine plantss (Zhao et al., 2024). On the other hand, long-term ecological monitoring on the population dynamics of S. medusa should be conducted, providing a scientific basis for targeted conservation measures (Zhao et al., 2024). Finally, considering that over-harvesting by humans is a primary cause of the decline in the S. medusa population, it is crucial to enhance public education and increase awareness about the protection of S. medusa and its sustainable development.
4.4 Limitations and future prospects
Using the ensemble models that has never been used before for the important medicinal plant S. medusa, we predicted the spatiotemporal distribution patterns and further proposed the preliminary conservation strategies. Our findings are reliable, as evidenced by model evaluation and comparison with results from other studies (e.g., Peng et al., 2019; Zhao et al., 2024). In the present study, although climate-associated variables and elevation are considered, biological factors such as species interactions and human activities were not included. Given that the distribution patterns of a species are shaped by multiple factors, some biotic and abiotic factors are increasingly suggested to be jointly considered with traditionally used climate variables in SDM studies (Li et al., 2024a; Liu and Chen, 2024; Neupane et al., 2024). Future predictions should incorporate additional factors (e.g., human footprint and soil properties) that influence S. medusa growth to refine the distribution pattern, potentially providing more accurate guidance for S. medusa conservation.
5 Conclusions
This study simulated an ensemble model to predict the potential spatiotemporal distribution patterns of an endangered medicinal plant, S. medusa, and identified its underlying driving factors. The findings show that the current suitable habitats of S. medusa are primarily distributed across the Qinghai-Xizang Plateau in China. Under future climate warming scenarios, the area of suitable habitats, especially the highly suitable ones, is projected to contract significantly by 80.65%, accompanied by shifts in distribution centroids towards southwest and higher altitudes. Among the ecological factors analyzed, elevation and precipitation play a significant role in influencing the habitat distribution of S. medusa. The results imply that the risk to the survival of S. medusa would persist in the future, and conservation efforts for S. medusa, such as the establishment of protected areas and public education, should be undertaken.
Data availability statement
The original contributions presented in the study are included in the article/Supplementary Material. Further inquiries can be directed to the corresponding authors.
Author contributions
XG: Conceptualization, Data curation, Funding acquisition, Writing – original draft. WB: Data curation, Writing – original draft. YW: Data curation, Writing – original draft. SH: Investigation, Writing – review & editing. LZ: Investigation, Methodology, Writing – review & editing. XL: Funding acquisition, Methodology, Writing – review & editing. ZG: Conceptualization, Data curation, Writing – review & editing. XyL: Conceptualization, Funding acquisition, Writing – review & editing.
Funding
The author(s) declare that financial support was received for the research and/or publication of this article. This work was supported by the grants from the Fundamental Research Program of Shanxi Province (202203021222348, 202203021211058), Scientific research project of Shanxi Traditional Chinese Medicine Administration (2024ZYY2B023), Scientific research start-up fund project for talent introduction of Shanxi Bethune Hospital (2023RC22), Youth Research Project of Shanxi Natural Science Foundation (202303021212349).
Acknowledgments
We thank Associate Professor Mingsheng Yang of Zhoukou Normal University for his assistance with data analysis.
Conflict of interest
The authors declare that the research was conducted in the absence of any commercial or financial relationships that could be construed as a potential conflict of interest.
Generative AI statement
The author(s) declare that no Generative AI was used in the creation of this manuscript.
Publisher’s note
All claims expressed in this article are solely those of the authors and do not necessarily represent those of their affiliated organizations, or those of the publisher, the editors and the reviewers. Any product that may be evaluated in this article, or claim that may be made by its manufacturer, is not guaranteed or endorsed by the publisher.
Supplementary material
The Supplementary Material for this article can be found online at: https://www.frontiersin.org/articles/10.3389/fpls.2025.1590206/full#supplementary-material
Supplementary Figure 1 | The initial occurrence records of Saussurea medusa Maxim gathered from four sources.
Supplementary Figure 2 | The Pearson’s correlation analysis among 19 bioclimatic variables.
Supplementary Figure 3 | The area under the receiver operating characteristic curve (AUC) and true skill statistics (TSS) values for six single models under BIOs + elevation.
Supplementary Table 1 | The initial occurrence records of Saussurea medusa gathered from four sources.
Supplementary Table 2 | The occurrence records of Saussurea medusa used in the models.
References
Aiello-Lammens, M. E., Boria, R. A., Radosavljevic, A., Vilela, B., and Anderson, R. P. (2015). spThin: an r package for spatial thinning of species occurrence records for use in ecological niche models. Ecography 38, 1–35. doi: 10.111/ecog.01132
Allouche, O., Tsoar, A., and Kadmon, R. (2006). Assessing the accuracy of species distribution models: prevalence, kappa and the true skill statistic (TSS). J. Appl. Ecol. 43, 1223–1232. doi: 10.1111/j.1365-2664.2006.01214.x
Araújo, M. B. and New, M. (2007). Ensemble forecasting of species distributions. Trends Ecol. Evol. 22, 42–47. doi: 10.1016/j.tree.2006.09.010
Azrag, A. G. A., Pirk, C. W., Yusuf, A. A., Pinard, F., Niassy, S., Mosomtai, G., et al. (2018). Prediction of insect pest distribution as influenced by elevation: Combining field observations and temperature dependent development models for the coffee stink bug, Antestiopsis thunbergii (Gmelin). PloS One 13, 18. doi: 10.1371/journal.pone.0199569
Barbet-Massin, M. and Jetz, W. (2014). A 40-year, continent-wide, multispecies assessment of relevant climate predictors for species distribution modelling. Divers. Distrib. 20, 1285–1295. doi: 10.1111/ddi.12229
Barbet-Massin, M., Jiguet, F., Albert, C. H., and Thuiller, W. (2012). Selecting pseudo-absences for species distribution models: how, where and how many? Methods Ecol. Evol. 3, 327–338. doi: 10.1111/j.2041-210X.2011.00172.x
Bell, D. M., Bradford, J. B., and Lauenroth, W. K. (2014). Early indicators of change: divergent climate envelopes between tree life stages imply range shifts in the western United States. Glob. Ecol. Biogeogr. 23, 168–180. doi: 10.1111/geb.12109
Bo, Y., Yundai, C., and Min, L. (2013). Effects of cell cultures of Saussurea medusa in regulating blood lipid of hyperlipidemic rats. Heart 99, 66. doi: 10.1136/heartjnl-2013-304613.182
Chardon, N. I., Cornwell, W. K., Flint, L. E., Flint, A. L., and Ackerly, D. (2015). Topographic, latitudinal and climatic distribution of Pinus coulteri: geographic range limits are not at the edge of the climate envelope. Ecography 38, 590–601. doi: 10.1111/ecog.00780
Dormann, C. F., Elith, J., Bacher, S., Buchmann, C., Carl, G., Carré, G., et al. (2013). Collinearity: a review of methods to deal with it and a simulation study evaluating their performance. Ecography 36, 27–46. doi: 10.1111/ecog.00780
Duffy, G. A., Coetzee, B. W., Latombe, G., Akerman, A. H., McGeoch, M. A., and Chown, S. L. (2017). Barriers to globally invasive species are weakening across the Antarctic. Divers. Distrib. 23, 982–996. doi: 10.1111/ddi.12593
Elith, J. and Leathwick, J. R. (2009). Species distribution models: ecological explanation and prediction across space and time. Annu. Rev. Ecol. Evol. Syst. 40, 677–697. doi: 10.1146/annurev.ecolsys.110308.120159
Engebretsen, S. and Bohlin, J. (2019). Statistical predictions with glmnet. Clin. Epigenet. 11, 123. doi: 10.1186/s13148-019-0730-1
Fan, J. Y., Chen, H. B., Zhu, L., Chen, H. L., Zhao, Z. Z., and Yi, T. (2015). Saussurea medusa, source of the medicinal herb snow lotus: A review of its botany, phytochemistry, pharmacology and toxicology. Phytochem. Rev. 14, 353–366. doi: 10.1007/s11101-015-9408-2
Fick, S. E. and Hijmans, R. J. (2017). Worldclim 2: New 1-km spatial resolution climate surfaces for global land areas. Int. J. Climatol. 37, 4302–4315. doi: 10.1002/joc.5086
Friedman, J. H. (1991). Multivariate adaptive regression splines. Ann. Statist. 19, 1–67. doi: 10.1214/aos/1176347963
Gan, T., He, Z., Xu, D., Chen, J., Zhang., H., Wei, X., et al. (2025). Modeling the potential distribution of Hippophae rhamnoides in China under current and future climate scenarios using the biomod2 model. Front. Plant Sci. 16. doi: 10.3389/fpls.2025.1533251
Grenouillet, G., Buisson, L., Casajus, N., and Lek, S. (2011). Ensemble modelling of species distribution: the effects of geographical and environmental ranges. Ecography 34, 9–17. doi: 10.1111/j.1600-0587.2010.06152.x
Guo, Y., Kong, Y., Sun, J., Jiao, Y., Hong, Y., and Wang, Y. (2024). Alleviation of ultraviolet-B radiation-induced photoaging using Saussurea medusa Maxim polysaccharide. Photochem. Photobiol. 100, 622–632. doi: 10.1111/php.13855
Hand, D. J. and Anagnostopoulos, C. (2013). When is the area under the receiver operating characteristic curve an appropriate measure of classifier performance? Pattern Recogn. Lett. 34, 492–495. doi: 10.1016/j.patrec.2012.12.004
Hastie, T. and Tibshirani, R. (1987). Generalized additive models: some applications. J. Am. Stat. Assoc. 398, 371–386. doi: 10.1002/joc.5086
Hastie, T., Tibshirani, R., and Buja, A. (1994). Flexible discriminant analysis by optimal scoring. J. Am. Stat. Assoc. 89, 1255–1270. doi: 10.1080/01621459.1994.10476866
Hearst, M. A., Osuna, S. T., Platt, J., and Scholkopf, B. (1998). Support vector machines. IEEE Intell. Syst. App. 13, 18–28. doi: 10.1109/5254.708428
Hijmans, R. J., Guarino, L., Cruz, M., and Rojas, E. (2001). “Computer tools for spatial analysis of plant genetic resources data: 1. DIVA-GIS,” in Plant Genetic Resources Newsletter (Alliance of Bioversity International and CIAT, Rome, Italy), 15–19.
Huang, Q., Liu, H., Li, C., Zhu, X., Yuan, Z., Lai, J., et al. (2024). Predicting the geographical distribution and niche characteristics of cotoneaster multiflorus based on future climate change. Front. Plant Sci. 15. doi: 10.3389/fpls.2024.1360190
Kling, M. M., Auer, S. L., Comer, P. J., Ackerly, D. D., and Hamilton, H. (2020). Multiple axes of ecological vulnerability to climate change. Glob. Change Biol. 26, 2798–2813. doi: 10.1111/gcb.15008
Korner, C. (Ed.) (2003). Alpine Plant Life -Functional Plant Ecology of High Mountain Ecosystems, second ed (Berlin: Springer).
Lenoir, J. and Svenning, J. C. (2015). Climate-related range shifts - a global multidimensional synthesis and new research directions. Ecography 38, 15–28. doi: 10.1111/ecog.00967
Li, W. B., Teng, Y., Zhang, M. Y., Shen, Y., Liu, J. W., Qi, J. W., et al. (2024a). Human activity and climate change accelerate the extinction risk to non-human primates in China. Glob. Change Biol. 30, e17114. doi: 10.1111/gcb.17114
Li, X., Wu, T., Kang, C., Zhang, X., Zhang, J., Yang, C., et al. (2024b). Simulation of Pseudostellaria heterophylla distributionin China: assessing habitat suitability and bioactive component abundance under future climate change scenariosplant components. Front. Plant Sci. 15. doi: 10.3389/fpls.2024.1498229
Liu, S. W. (1996). “Compositae: saussurea DC,” in Flora Qinghaiica. Eds. Ho, T. N. and Liu, S. W. (Qinghai People’s Publishing House, Xining, China), 443–482.
Liu, Y. and Chen, L. (2024). Predicting the impact of climate change on corylus species distribution in China: integrating climatic, topographic, and anthropogenic factors. Ecol. Evol. 14, e70528. doi: 10.1002/ece3.70528
Liu, T., Liu, H., Tong, J., and Yang, Y. (2022). Habitat suitability of neotenic net-winged beetles (Coleoptera: Lycidae) in China using combined ecological models, with implications for biological conservation. Divers. Distrib. 28, 2806–2823. doi: 10.1111/ddi.13545
Lobo, J. M., Jiménez-Valverde, A., and Real, R. (2008). AUC: a misleading measure of the performance of predictive distribution models. Global Ecol. Biogeogr. 172, 145–151. doi: 10.1111/j.1466-8238.2007.00358.x
Loh, W. Y. (2011). Classification and regression trees. Wires Data Min. Knowl. 1, 14–23. doi: 10.1002/widm.8
Naimi, B. and Araujo, M. B. (2016). sdm: a reproducible and extensible R platform for species distribution modelling. Ecography 39, 368–375. doi: 10.1111/ecog.01881
Nelder, J. A. and Wedderburn, R. W. (1972). Generalized linear models. J. R. Stat. Soc A. Stat. 135, 370–384. doi: 10.2307/2344614
Neupane, N., Larsen, E. A., and Ries, L. (2024). Ecological forecasts of insect range dynamics: a broad range of taxa include winners and losers under future climate. Curr. Opin. Insect Sci. 62, 101159. doi: 10.1016/j.cois.2024.101159
Parmesan, C. (2007). Influences of species, latitudes and methodologies on estimates of phenological response to global warming. Glob. Change Biol. 13, 1860–1872. doi: 10.1111/j.1365-2486.2007.01404.x
Pearce, J. and Ferrier, S. (2000). An evaluation of alternative algorithms for fitting species distribution models using logistic regression. Ecol. Model. 128, 127–147. doi: 10.1016/S0304-3800(99)00227-6
Peng, D., Sun, L., Pritchard, H. W., Yang, J., Sun, H., and Li, Z. (2019). Species distribution modelling and seed germination of four threatened snow lotus (Saussurea), and their implication for conservation. Global Ecol. Conserv. 17, e00565. doi: 10.1016/j.gecco.2019.e00565
Peterson, A. T., Papes, M., and Soberon, J. (2008). Rethinking receiver operating characteristic analysis applications in ecological niche modelling. Ecol. Model. 213, 63–72. doi: 10.1016/j.ecolmodel.2007.11.008
Phillips, S. J., Anderson, R. P., and Schapire, R. E. (2006). Maximum entropy modelling of species geographical distributions. Ecol. Model. 190, 231–259. doi: 10.1016/j.ecolmodel.2005.03.026
Phillips, S. J., Dudík, M., Elith, J., Graham, C. H., Lehmann, A., Leathwick, J., et al. (2009). Sample selection bias and presence-only distribution models: implications for background and pseudo-absence data. Ecol. Appl. 19, 181–197. doi: 10.1890/07-2153.1
Qiu, J., Xue, X. F., Chen, F. D., Li, C. H., Bolat, N., Wang, X. J., et al. (2010). Quality evaluation of snow lotus (Saussurea): Quantitative chemical analysis and antioxidant activity assessment. Plant Cell Rep. 29, 1325–1337. doi: 10.1007/s00299-010-0919-4
Ran, W. W., Luo, G. M., Zhao, Y. Q., Li, C., Dietrich, C. H., and Song, Y. H. (2024). Climate change may drive the distribution of tribe Zyginelline pests in China and the Indo-China Peninsula to shift towards higher latitude river-mountain systems. Pest Manage. Sci. 80, 613–626. doi: 10.1002/ps.7788
Reinhartz-Berger, I. (2010). Towards automatization of domain modelling. Data Knowl. Eng. 69, 491–515. doi: 10.1016/j.datak.2010.01.002
Royle, J. A., Chandler, R. B., Yackulic, C., and Nichols, J. D. (2012). Likelihood analysis of species occurrence probability from presence-only data for modelling species distributions. Methods Ecol. Evol. 3, 545–554. doi: 10.1111/j.2041-210X.2011.00182.x
Sillero, N., Arenas-Castro, S., Enriquez-Urzelai, U., Vale, C. G., Sousa-Guedes, D., Martínez-Freiría, F., et al. (2021). Want to model a species niche? A step-by-step guideline on correlative ecological niche modelling. Ecol. Model. 456, 109671. doi: 10.1016/j.ecolmodel.2021.109671
Song, H., Zhang, X., Wang, X., Wang, Y., Li, S., and Xu, Y. (2023). Not the expected poleward migration: Impact of climate change scenarios on the distribution of two endemic evergreen broad-leaved Quercus species in China. Sci. Total Environ. 889, 164273. doi: 10.1016/j.scitotenv.2023.164273
Takasaki, M., Konoshima, T., Komatsu, K., Tokuda, H., and Nishino, H. (2000). Anti-tumor-promoting activity of lignans from the aerial part of Saussurea medusa. Cancer Lett. 158, 53–59. doi: 10.1016/S0304-3835(00)00499-7
Thibaud, E., Petitpierre, B., Broennimann, O., Davison, A. C., and Guisan, A. (2014). Measuring the relative effect of factors affecting species distribution model predictions. Meth. Ecol. Evol. 5, 947–955. doi: 10.1111/2041-210X.12203
Thomas, C. D., Cameron, A., Green, R. E., Bakkenes, M., Beaumont, L. J., Collingham, Y. C., et al. (2004). Extinction risk from climate change. Nature 427, 145–148. doi: 10.1038/nature02121
Thuiller, W., Lafourcade, B., Engler, R., and Araújo, M. B. (2009). BIOMOD–A platform for ensemble forecasting of species distributions. Ecography 32, 369–373. doi: 10.1111/j.1600-0587.2008.05742.x
Thuiller, W., Lavergne, S., Roquet, C., Boulangeat, I., Lafourcade, B., and Araujo, M. B. (2011). Consequences of climate change on the tree of life in Europe. Nature 470, 531–534. doi: 10.1038/nature09705
Trisos, C. H., Merow, C., and Pigot, A. L. (2020). The projected timing of abrupt ecological disruption from climate change. Nature 580, 496–501. doi: 10.1038/s41586-020-2189-9
Wang, Y. J., Susanna, A., Von Raab-Straube, E., Milne, R., and Liu, J. Q. (2009). Island-like radiation of Saussurea (Asteraceae: Cardueae) triggered by uplifts of the Qinghai–Tibetan Plateau. Biol. J. Linn. Soc 97, 893–903. doi: 10.1111/j.1095-8312.2009.01225.x
Wei, T. Y. and Simko, V. (2021). R package ‘corrplot’: Visualization of a Correlation Matrix (Version 0.92). Available online at: https://github.com/taiyun/corrplot (Accessed November 10, 2023).
Wickham, H. (2016). Data analysis 189–201 (Cham: Springer International Publishing). doi: 10.1007/978-3-319-24277-4_9
Wu, T., Lu, Y., Fang, Y., Xin, X., Li, L., Li, W., et al. (2019). The Beijing Climate Center Climate System Model (BCC-CSM): The main progress from CMIP5 to CMIP6. Geoscientific Model. Dev. 12, 1573–1600. doi: 10.5194/gmd-12-1573-2019
Zhang, X., Kuang, T., Dong, W., Qian, Z., Zhang, H., Landis, J. B., et al. (2023). Genomic convergence underlying high-altitude adaptation in alpine plants. J. Integr. Plant Biol. 65, 1620–1635. doi: 10.1111/jipb.13485
Zhang, S., Liu, X., Li, R., Wang, X., Cheng, J., Yang, Q., et al. (2021). AHP-GIS and MaxEnt for delineation of potential distribution of Arabica coffee plantation under future climate in Yunnan, China. Ecol. Indic. 132, 108339. doi: 10.1016/j.ecolind.2021.108339
Zhang, J., Nielsen, S. E., Chen, Y., Georges, D., Qin, Y., Wang, S. S., et al. (2017). Extinction risk of North American seed plants elevated by climate and landuse change. J. Appl. Ecol. 54, 303–312. doi: 10.1111/1365-2664.12701
Zhang, H., Wang, Y., Wang, Z., Ding, W., Xu, K., Li, L., et al. (2022). Modelling the current and future potential distribution of the bean bug Riptortus pedestris with increasingly serious damage to soybean. Pest Manage. Sci. 78, 4340–4352. doi: 10.1002/ps.7053
Zhang, K., Yao, L., Meng, J., and Tao, J. (2018). Maxent modelling for predicting the potential geographical distribution of two peony species under climate change. Sci. Total Environ. 634, 1326–1334. doi: 10.1016/j.scitotenv.2018.04.112
Zhao, R., Wang, S., and Chen, S. (2024). Predicting the potential habitat suitability of Saussurea species in China under future climate scenarios using the optimized maximum entropy (maxent) model. J. Cleaner Prod. 474, 143552. doi: 10.1016/j.jclepro.2024.143552
Zhu, G. P., Fan, J. Y., Wang, M. L., Chen, M., and Qiao, H. J. (2017). The importance of the shape of receiver operating characteristic (ROC) curve in ecological niche model evaluation—case study of Hlyphantria cunea. J. Biosafety 26, 184–190. doi: 10.3969/j.issn.2095-1787.2017.03.002
Zhu, G. P., Liu, G. Q., Bu, W. J., and Gao, Y. B. (2013). Ecological niche modelling and its applications in biodiversity conservation. Biodivers. Sci. 21, 90–98. doi: 10.3724/SP.J.1003.2013.09106
Keywords: Saussurea medusa, species distribution modeling, habitat distribution, climate change, medicinal plants
Citation: Guo X, Bai W, Wang Y, Hao S, Zhao L, Li X, Guo Z and Li X (2025) Predicting habitat suitability for an endangered medicinal plant, Saussurea medusa: insights from ensemble species distribution models. Front. Plant Sci. 16:1590206. doi: 10.3389/fpls.2025.1590206
Received: 25 March 2025; Accepted: 06 June 2025;
Published: 24 June 2025.
Edited by:
Yuanrun Zheng, Chinese Academy of Sciences (CAS), ChinaReviewed by:
Xiaohui He, Baotou Teachers’ College, ChinaJong Bin Jung, Mokpo National University, Republic of Korea
Copyright © 2025 Guo, Bai, Wang, Hao, Zhao, Li, Guo and Li. This is an open-access article distributed under the terms of the Creative Commons Attribution License (CC BY). The use, distribution or reproduction in other forums is permitted, provided the original author(s) and the copyright owner(s) are credited and that the original publication in this journal is cited, in accordance with accepted academic practice. No use, distribution or reproduction is permitted which does not comply with these terms.
*Correspondence: Zongliang Guo, MzcyMDI0ODZAcXEuY29t; Xiaoyan Li, enl5MjAyMjA1MjhAMTYzLmNvbQ==
†These authors have contributed equally to this work