 Fan Wei
 Yang Lin
 Danfeng Tang
 Ying Liang
 Shuangshuang Qin
- 1Guangxi Key Laboratory of Medicinal Resources Protection and Genetic Improvement, Guangxi Botanical Garden of Medicinal Plants, Nanning, China
- 2National Engineering Research Center for Southwest Endangered Medicinal Materials Resources Development, Guangxi Botanical Garden of Medicinal Plants, Nanning, China
Flemingia prostrata and Flemingia macrophylla, belonging to the genus Flemingia, are ethnomedicinal plants that contain valuable medicinal and nutritional compounds. However, their medicinal materials are frequently confused in the Chinese medicinal materials market. Moreover, molecular genomic resources for this genus remain limited, which hinders phylogenetic studies. In this study, the complete chloroplast (cp) genomes of F. macrophylla and F. prostrata were sequenced to enable genome comparison and phylogenetic analysis. Both cp genomes exhibited typical quadripartite structures, with genome sizes of 152,937 bp for F. macrophylla and 153,033 bp for F. prostrata. Each genome consisted of a large single copy (LSC) region (83,594 and 83,701 bp, respectively), a small single copy (SSC) region (17,773 and 17,776 bp, respectively), and two inverted repeats (IR) regions (50,570 and 51,556 bp, respectively). A total of 129 genes were annotated in each cp genome, including 8 ribosomal RNAs, 83 protein-coding genes, and 37 transfer RNAs. Comparative analysis revealed that although the overall genome structure, codon usage bias, simple sequence repeats (SSRs), and dispersed repetitive sequences were relatively conserved between the two cp genomes, certain genomic variations were present. Specifically, 286 SNPs and 104 indels were identified, and psaJ-rps18 showed the highest variability and could serve as potential DNA barcode regions. Furthermore, phylogenetic analysis supported a close evolutionary relationship between the genus Flemingia and Cajanus. Divergence time estimation suggested that F. macrophylla and F. prostrata diverged approximately 0.26 million years ago (Mya). Finally, we successfully distinguished the two species using SSR markers. This study lays the foundation for enriching the molecular data and phylogenetic insights of this genus, as well as for the safe application of its medicinal materials.
1 Introduction
Flemingia Roxb. ex W. T. Ait. belongs to Papilionoideae, a subfamily of the Fabaceae. There are approximately 40 species of Flemingia widely distributed in the tropics of Asia, Africa, and Oceania of the world. China has 16 species and 1 variety, mainly distributed in Southwest, Southeast, and Central South China (Flora Reipublicae Popularis Sinicae, http://www.iplant.cn/frps). Most plants of Flemingia have medicinal values, and 6 species of Flemingia are native to China, which has a long history of use in folk medicine (Jia and Li, 2005). For example, Flemingia prostrata (F. prostrata) and Flemingia involucrata (F. involucrata) have the original recordings in “Zhiwu Mingshi Tukao”, written by Wu Qi-jun in the Qing Dynasty of China (Wu, 2003, 1991). F. prostrata is documented in “Annals of Chinese Ethnic Medicine” (China Institute for the Control of Pharmaceutical and Biological Products and Yunnan Institute for Drug Control, 1990), and Flemingia macrophylla (F. macrophylla) is included in “Annals of Zhuang Nationality Medicine in China” (Zhu and Wang, 2003).
To date, a total of 197 compounds have been successfully separated and identified from Flemingia, including flavonoids, saponins, anthraquinones, triterpenes, volatile foril, etc. Furthermore, contemporary pharmacological research has revealed numerous pharmacological properties associated with the extracts and individual compounds (primarily flavonoids). These properties include analgesic and anti-inflammatory effects, antibacterial and antifungal activities, estrogenic effects, skin protection, neuroprotection, and hepatoprotective effects (Ho et al., 2011; Yan et al., 2016).
Currently, certain Flemingia species are sold as mixtures in herbal markets for use in Traditional Chinese Medicine (TCM), adversely affecting their efficacy and safety. Moreover, there are currently no national quality standards for Flemingia medical plants, with only F. prostrata, F. macrophylla, and Flemingia ferruginea (F. ferruginea) listed in the appendix of “The 2020 edition of the Pharmacopoeia of the People’s Republic of China (China Pharmacopoeia Committee, 2020). Of these, F. prostrata and F. macrophylla are widely distributed in southwest of China, such as Yunnan, Guangxi, Guangdong, Jiangxi, Fujian, Taiwan, Hubei, Hunan, and Sichuan provinces, with Guangxi and Yunnan being particularly notable. The dried roots of these plants exhibit efficacy in alleviating rheumatism, arthritis, and gynecological pain, and possess hepatoprotective, estrogenic, neuroprotective, cytotoxic, and antitumor activities (Lai et al., 2013; Niu et al., 2021). They are also widely used by Hani, Dai, Zhuang, and Yao ethnic minorities in China (Song et al., 2001). Although both F. prostrata and F. macrophylla are listed in the Chinese Pharmacopoeia, they differ in practical applications. For instance, F. macrophylla is primarily used in Qianjin Pharmaceutical’s Fuke Qianjin Pian (Gynecological Qianjin Tablet), while F. prostrata is mainly utilized in ethnic medicines in Hunan Province (Zheng et al., 2022; She et al., 2022). Moreover, the use of F. prostrata and F. macrophylla also differs in various ethnic medicines in China. For example, F. prostrata is primarily used in Yao medicine and Dong medicine, while F. macrophylla is mainly utilized in Zhuang medicine and Dai medicine. Nevertheless, due to their similar characteristics, especially the roots, the medicinal materials of F. prostrata and F. macrophylla are often confused in the Chinese medicinal materials market (Figure 1). Therefore, ensuring the authenticity of these herbs is crucial for their effective use. However, it is challenging to visually differentiate F. prostrata from F. macrophylla based on macroscopic characteristics. Hence, there is an urgent need for robust and advanced DNA technology to differentiate F. prostrata from F. macrophylla.
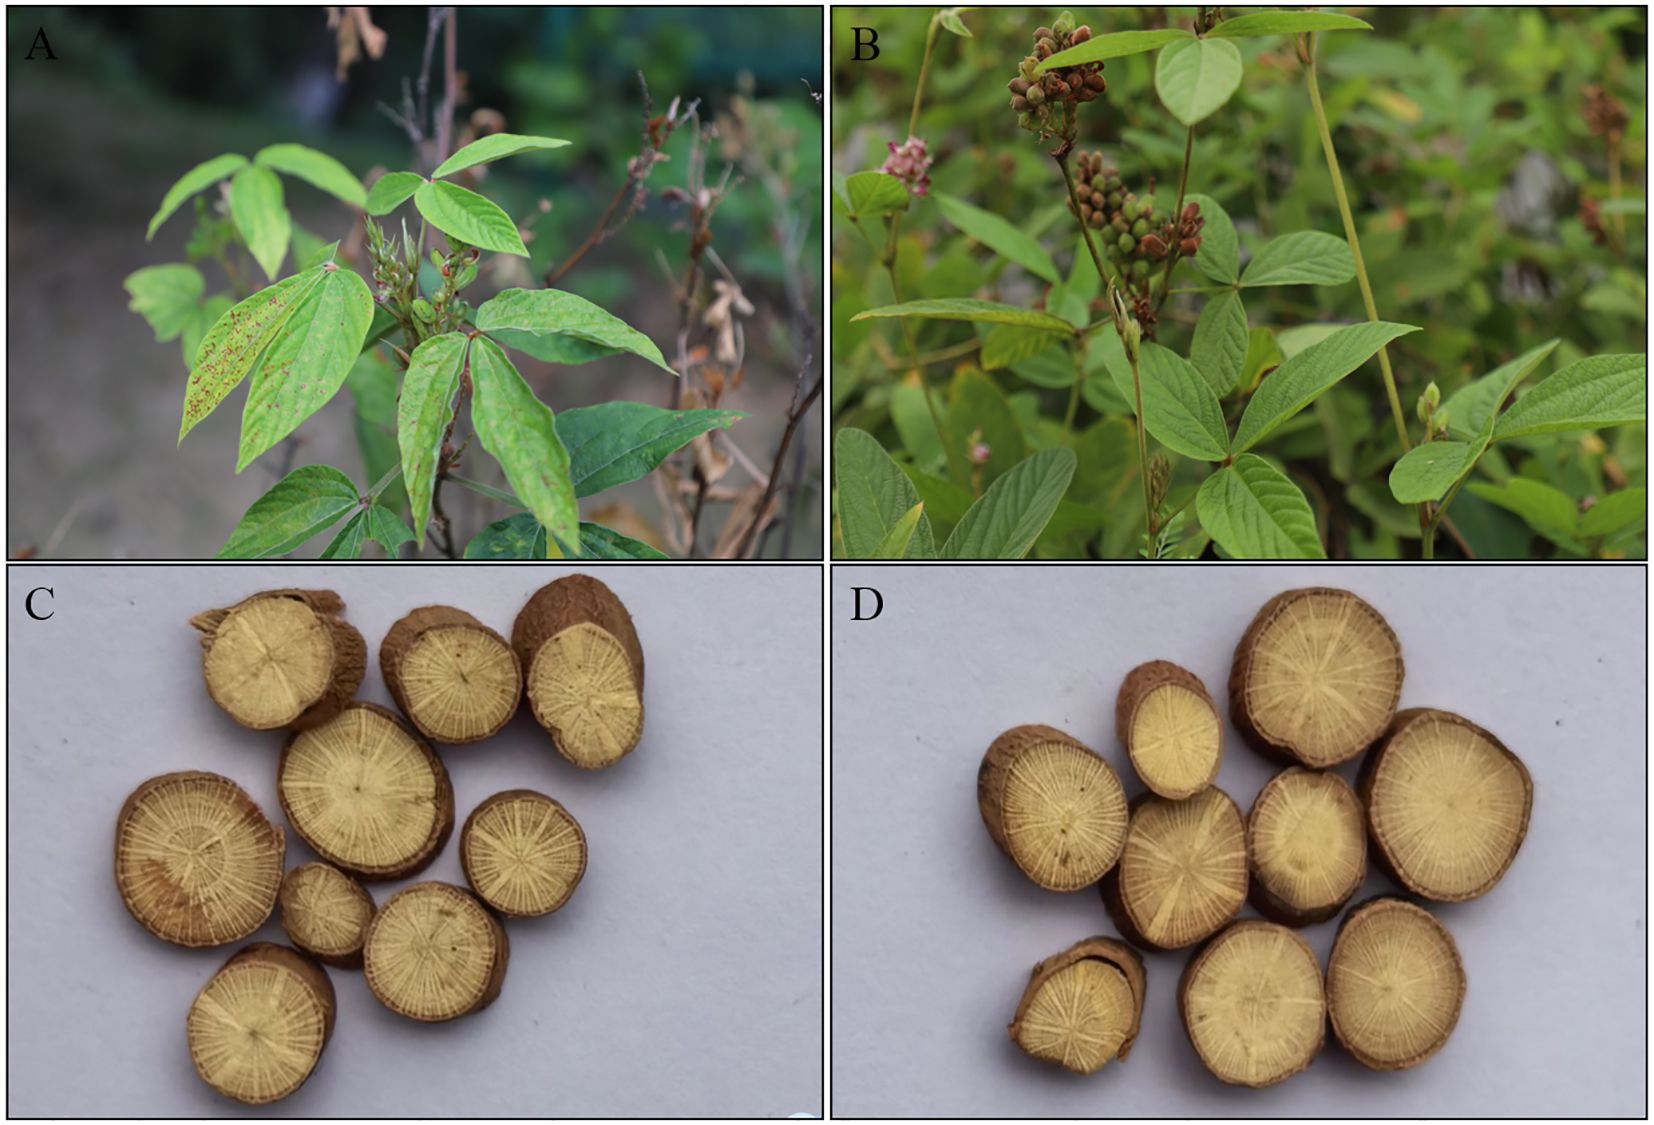
Figure 1. Plant morphology of F. macrophylla and F. prostrata. (A, C) The plant morphology and root cross section of F. macrophylla. (B, D) The plant morphology and root cross section of F. prostrata.
DNA barcoding is a molecular technique for species identification that utilizes a standardized, short segment of DNA sequence (Kress et al., 2005; Schindel and Miller, 2005). The chloroplast (cp) genome is shorter and easier to amplify than traditional DNA barcodes, and it contains more information on variable sites. This makes it a powerful molecular marker capable of deeply resolving subtle but crucial genetic differences among different species. Chloroplast non-coding regions have been established as DNA barcodes in plants for conservation and mutation studies (Dong et al., 2012, 2014). Thus, genomic information from the chloroplasts of F. prostrata and F. macrophylla can serve as candidate DNA barcodes for distinguishing between these species. Additionally, to date, there have been few reports on the cp genome information of F. prostrata and F. macrophylla, especially regarding the comparative analysis of their cp genomes.
In this study, we employed high-throughput sequencing technology to sequence the cp genomes of F. prostrata and F. macrophylla, and conducted characterization and comparative analysis of their cp genomes. The aim was to conduct species identification and differentiation of F. prostrata and F. macrophylla at the molecular level, thereby enhancing the safety of their medicinal use.
2 Materials and methods
2.1 DNA extraction and sequencing
The F. prostrata and F. macrophylla plants were identified by associate researcher Ying Hu and the voucher specimens were preserved in Guangxi Botanical Garden of Medicinal Plants. Fresh leaves of F. macrophylla and F. prostrata were obtained from the Guangxi Botanical Garden of Medicinal Plants (Nanning, China). The genomic DNA extraction Kit (TIANGEN, Beijing, China) was employed for extracting the complete genomes of two Flemingia species. The sequencing library was constructed after genomic DNA quality assessment and PCR amplification. After qualifying the library, we performed sequencing using the Illumina Novaseq 6000 platform, and the read length for pairwise sequencing (PE) was 150 bp.
2.2 Chloroplast genome assembly and annotation analyses
First, Fastp (v 0.20.0) (https://github.com/OpenGene/fastp) was utilized to obtain clean reads by removing the joint sequences, adapters, and low-quality reads from the raw data. After quality control, the core module of the cp genomes for two Flemingia species was assembled using the SPAdes-3.13.0 (http://cab.spbu.ru/software/spades/) software with kmers of 55, 87, and 122. The assembly process was not dependent on a reference genome, highlighting its independent and original nature.
After de novo assembly, we carried out three methods to improve the annotation accuracy. First, we compared the reads to the genomes, calculating the genome coverage, inserted fragment size, and other information. Then, the target genomes were compared with the reference sequence genomes and analyzed for genome conservation and rearrangement. Finally, we compared the differences in structure between target genomes and the reference sequences.
To enhance the annotation efficiency, two approaches were employed for annotating the cp genomes. Initially, Prodigal v2.6.3 (https://www.github.com/hyattpd/Prodigal) was utilized for annotating the coding sequences within the cp genomes. Further, the ribosomal RNAs and transfer RNAs were predicted using Hmmer v3.1b2 (http://www.hmmer.org/) and Aragorn v1.2.38 (http://130.235.244.92/ARAGORN/) software, respectively. Subsequently, the gene sequences were obtained from the NCBI database using homolog sequences from similar species as a reference. Afterward, the assembled sequence was compared to the gene sequences using Blast v2.6 (https://blast.ncbi.nlm.nih.gov/Blast.cgi). Finally, the genes identified in both sets of annotations were manually reviewed, with any inaccurate or duplicate entries removed, the multiexon boundary established and the annotation conducted. The circular cp genome maps were annotated using the online tool OGDRAW (https://chlorobox.mpimp-golm.mpg.de/OGDraw.html).
2.3 Scattered repeat sequence analysis
Four repeat sequence types in two Flemingia species, including forward, palindromic, reverse, and complement, were found utilizing Vmatch v2.3.0 (http://www.vmatch.de/) combined Perl script and set a minimum repeat size of 30 bp and hamming distance of 3. The analysis of SSRs was conducted on the cp genomes of two Flemingia species using MISA v1.0 (MIcroSAtellite identification chloroplasttool, http://pgrc.ipk-gatersleben.de/misa/misa.html) with the parameter that the minimum number of repeats required for identification being 8, 5, 3, 3, 3, and 3 for mono-, di-, tri-, tetra-, penta-, and hexanucleotides, respectively.
2.4 Codon usage analysis
For the identification of codon usage patterns, all coding sequences (CDSs) were analyzed to calculate the relative synonymous codon usage (RSCU) and the effective number of codons (ENC) using CodonW (Peden, 1999). GC3s refers to the G+C content at the third position of synonymous codons in CDS sequences, normalized by the total number of such bases excluding Met and Trp codons, and was computed using the CUSP program in EMBOSS Explorer (https://www.bioinformatics.nl/embossexplorer/). An ENC-plot was plotted with GC3s as the horizontal coordinate and ENC as the vertical coordinate to elucidate the factors influencing codon usage bias within a gene or genome.
2.5 Genome comparative analysis
For comparative analysis, the chloroplast genome sequences of three other Flemingia species: Flemingia stricta (NC086853.1), Flemingia sp. (OR733289) and Flemingia philippinensis (PV464028.1) were obtained from the NCBI database. To assess the genome divergence among the five Flemingia cp genomes (F. macrophylla, F. prostrata, Flemingia stricta, Flemingia sp. and Flemingia philippinensis), the MAUVE (Darling et al., 2004) program was employed using F. macrophylla as the reference. Additionally, IRscope (https://irscope.shinyapps.io/irapp/) was utilized to examine variations in the boundary regions between the LSC, IRB, SSC, and IRA regions across the five Flemigia species.
2.6 Nucleotide diversity and gene selective pressure analyses
The nucleotide diversity (Pi) of the five Flemingia species cp genomes was carried out utilizing the DnaSP (v6) (Rozas et al., 2017), on a 200 bp window length and 50 bp step size. The KaKs_Calculator v2.0 (Zhang et al., 2006) was used to calculate the rates of synonymous (Ks) and nonsynonymous (Ka) substitutions to determine the selective pressure for the shared protein-coding genes.
2.7 Phylogenetic relationship analysis and divergence time estimation
The cp genomes of thirty-four species, representing six subfamilies of Fabaceae (Caesalpinioideae, Papilionoideae, Cercidoideae, Duparquetioideae, Detarioideae, and Dialioideae), including those of F. stricta, Flemingia sp. and F. philippinensis, as well as two outgroup cp genomes from Cannabis and Morus, were obtained from the NCBI database for analysis (Supplementary Table S1). To directly compare the phylogenetic resolution offered by a broad chloroplast dataset versus a four-gene barcode set, we first extracted and concatenated the coding sequences of 57 chloroplast genes into a single alignment and, in parallel, concatenated the rbcL, matK, trnL-trnF and ndhF regions. Both datasets were aligned using MAFFT v7.310, after which we inferred maximum-likelihood (ML) phylogenies in RAxML v8.2.12 under the GTR+GAMMA model with 1,000 rapid bootstrap replicates (Katoh and Standley, 2013, Alexandros Stamatakis, 2014). Finally, we employed the tanglegram function in the R package phytools (Revell, 2012) to visually juxtapose and evaluate the topological congruence between the two trees.
The ML tree constructed from the CDS of 57 chloroplast genes of Fabaceae was used as a starting tree for MCMC run. MCMC run was set 1,000,000 generations, sampling every 100 generations, and removing the first 10% generations as burn in. Divergence time estimation was calculated by parameters of clock = 2 and model = 0, with 95% highest posterior density (HPD) intervals.
2.8 cpSSR molecular identification
By comparing the cp genome sequences of F. prostrata and F. macrophylla, 75 differential cpSSR loci were identified. Ten of these loci were randomly selected for cpSSR primer design, and the corresponding primers are listed in Supplementary Table S2. DNA was extracted from five individual plants of each specie (F. prostrata and F. macrophylla), and PCR amplification was performed using the following reaction system: 2×Taq PCR MasterMix 10 µL, forward primer 2 µL (10 µmol/L), reverse primer 2 µL (10 µmol/L), DNA 1 µL, and ddH2O 5 µL. The PCR amplification procedure consisted of an initial denaturation at 95°C for 2 min, followed by 26 cycles of denaturation at 94°C for 40 s, annealing at 56°C for 45 s, and extension at 72°C for 1 min. A final extension step was carried out at 72°C for 7 min. The PCR products were subjected to electrophoresis on an 8% non-denaturing polyacrylamide gel at 120 V, 400 mA for 30 min and then 180 V, 400 mA for 1 h 15 min, followed by staining with silver nitrate.
3 Results
3.1 Complete cp genome features of F. macrophylla and F. prostrata
The cp genome sequences of F. macrophylla and F. prostrata have been deposited in the National Center for Biotechnology Information (Flemingia macrophylla, NC_065865.1; Flemingia prostrata, NC_065863.1). The cp genomes of F. macrophylla and F. prostrata were 152,937 bp and 153,033 bp in length, respectively. Both genomes exhibited a complete circular structure composed of four-segment structure: a pair of inverted repeats (IRs) that segregated the genome into large single copy (LSC) and small single copy (SSC) regions (Figure 2). The LSC regions were 83,594 bp and 83,701 bp in length, while the SSC regions were 17,773 bp and 17,776 bp in length, respectively. The IRs were 50,570 bp and 51,556 bp in length. The two Flemingia species exhibited nearly identical GC contents across their LSC, SSC, and IR regions (Table 1). However, within each species, the IR region exhibited a higher GC content t compared to the LSC and SSC regions. The cp genomes of both Flemingia species contained a total of 129 genes, including 8 ribosomal RNA genes, 83 protein-coding genes, 37 transfer RNAs, and 1 pseudogene (Table 2). Among these genes, 19 contained one intron, 4 contained two introns, and 18 had two copies.
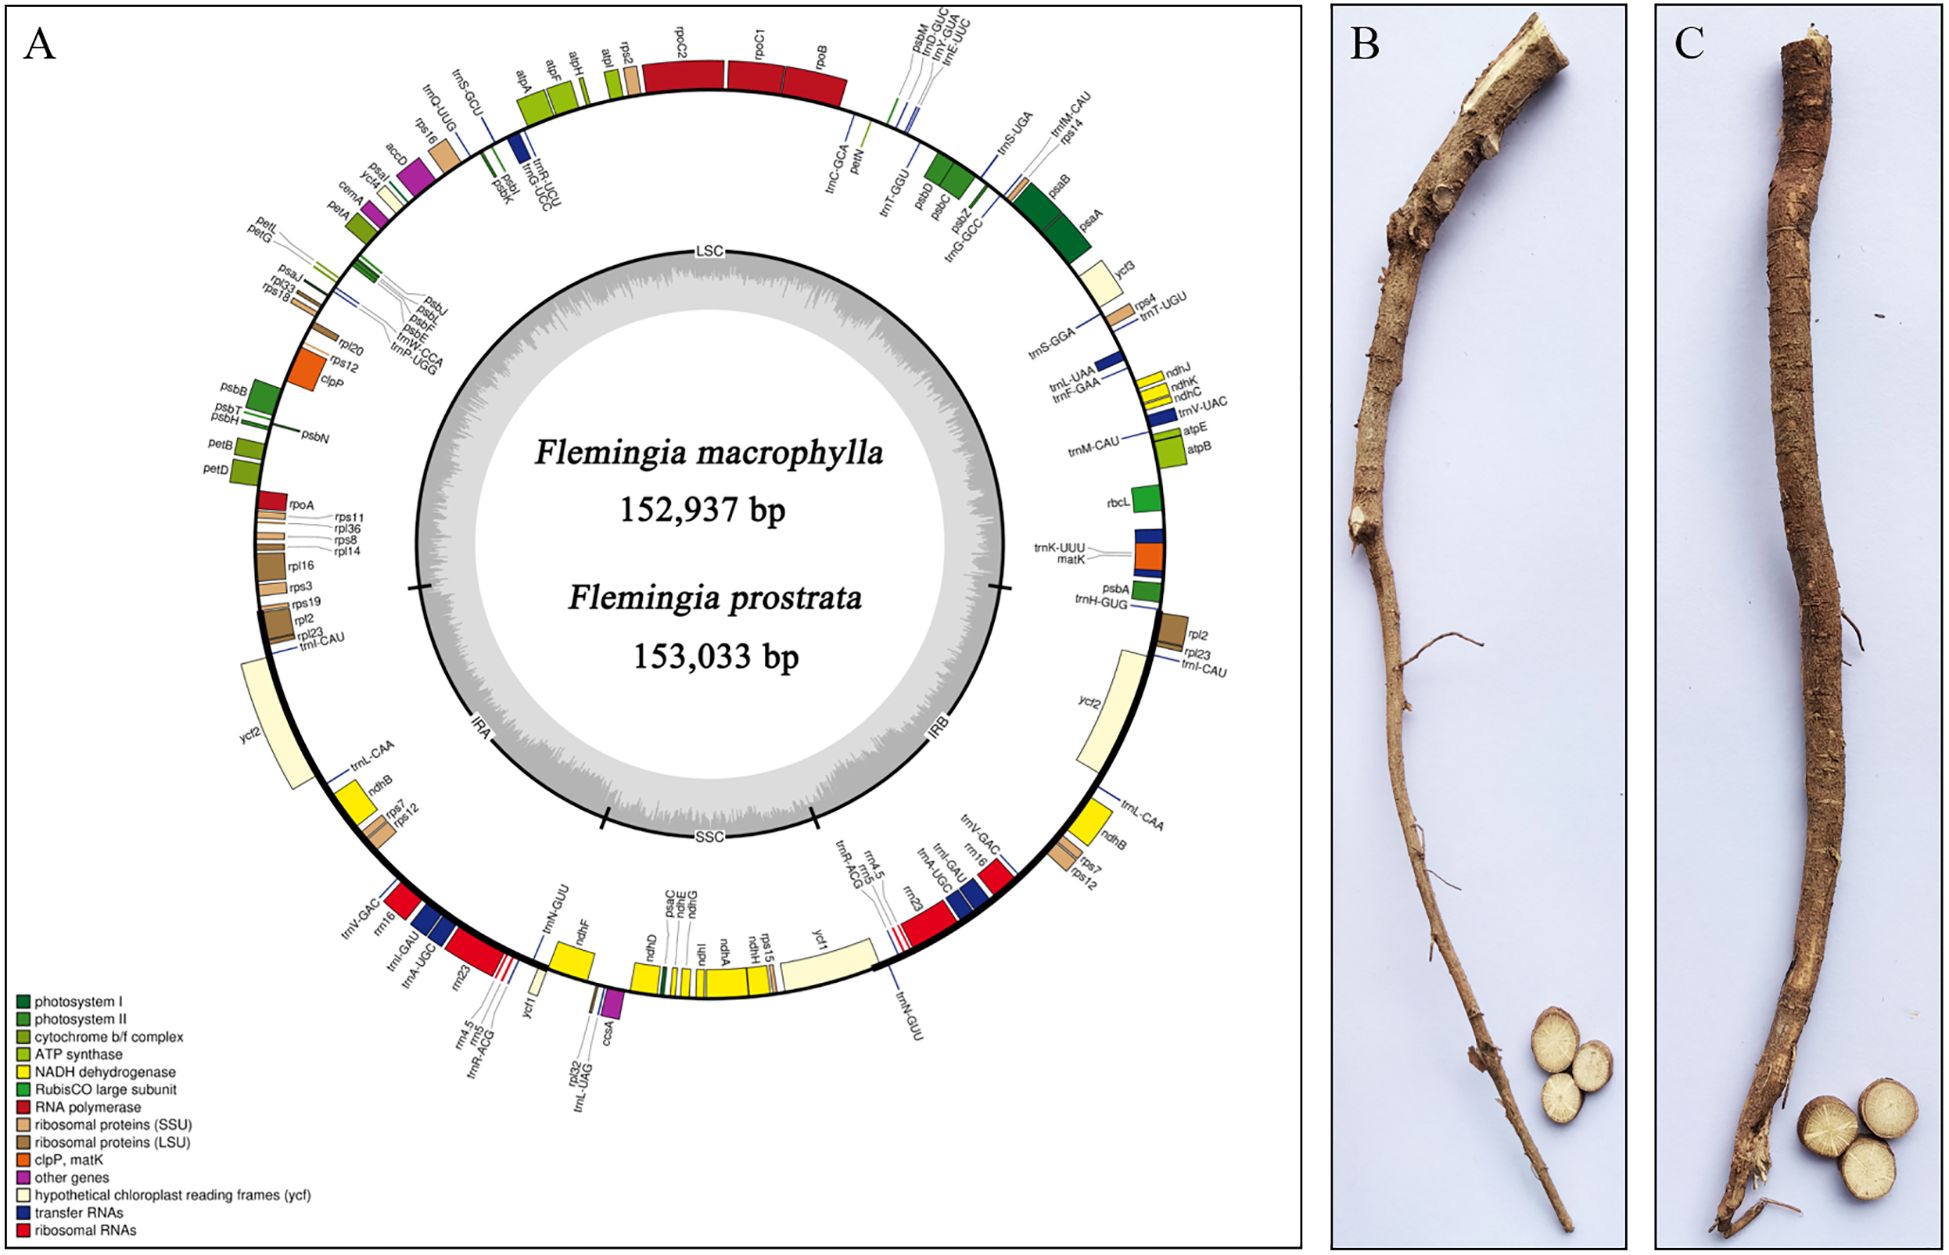
Figure 2. (A) Maps of the chloroplast genome of F. macrophylla and F. prostrata. The genes in the clockwise direction fill the inner circle, and the outer circle contains genes in the counterclockwise direction. Different colours represent different genes in different functional groups. The lighter grey shows the A + T content, and the darker grey in the inner circle indicates the G + C content. (B) The root of F. macrophylla. (C) The root of F. prostrata.
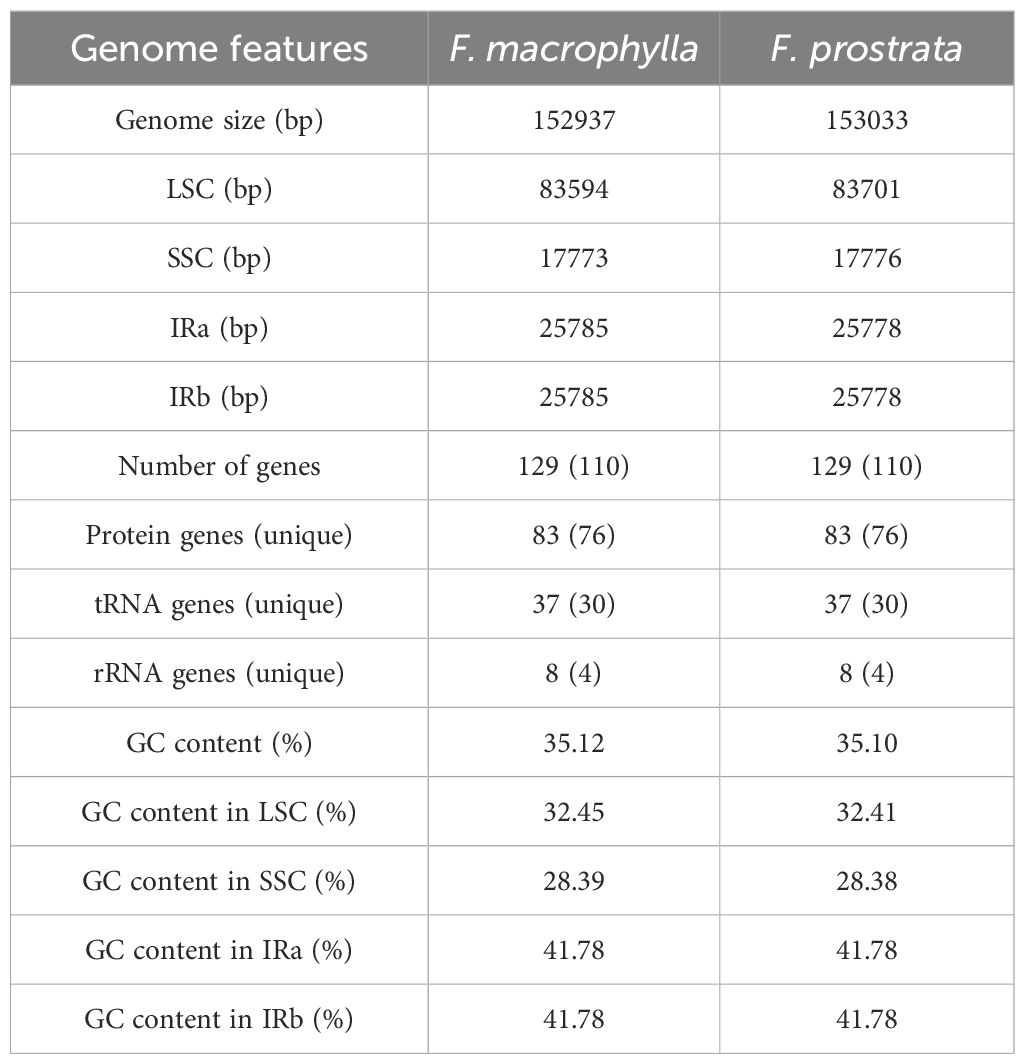
Table 1. Summary statistics for the assembly of two Flemingia species chloroplast genomes.
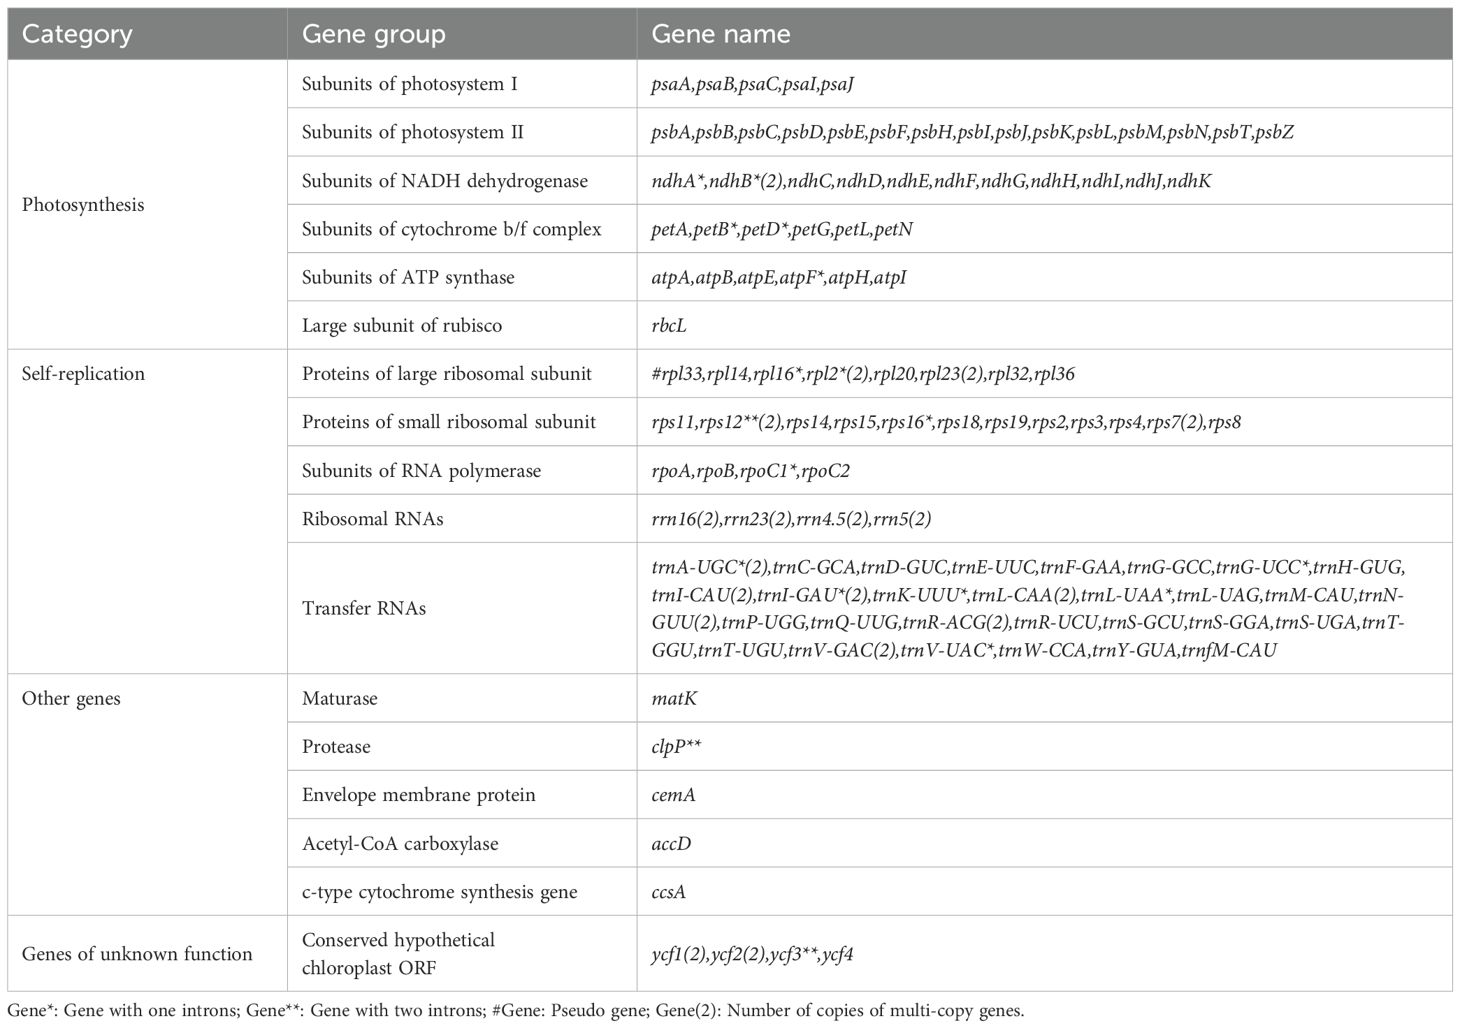
Table 2. List of annotated genes in F. macrophylla and F. prostrata chloroplast genomes.
3.2 Repeated sequence analysis
In this study, four types of simple sequence repeats (SSRs) (mono-, di-, tri, and tetra) were identified in the chloroplast genomes of two medicinal Flemingia species. A total of 337 SSRs (219 mono-, 28 di-, 82 tri, and 8 tetra) were found in the cp genome of F. macrophylla, while 332 SSRs (213 mono-, 27 di-, 82 tri, and 10 tetras) were identified in F. prostrata (Figure 3A; Supplementary Table S3). Compared to F. prostrata, F. macrophylla contained six additional mono-SSRs, one more di-SSRs, and two fewer tri-SSRs. Furthermore, SSRs were predominantly distributed in the LSC region, accounting for 63.7% and 63.2% of the total SSRs in F. macrophylla and F. prostrata, respectively. In contrast, 17.0% and 17.2% were in the SSC region, and 18.9% and 19.1% in the IR region for the two species, respectively (Figure 3B). Specifically, within the LSC region, 51, 35, and 118 SSRs were found in the exon, intron, and intergenic regions of F. macrophylla, compared to 53, 34, and 113 in F. prostrata. Both species exhibited 37, 2, and 15 SSRs in the exon, intron, and intergenic regions of the LSC, respectively, and 31, 6, and 23 SSRs in the corresponding regions of the IR (Figure 3C). Additionally, a total of 60 and 64 scattered repeat sequences (including forward, palindromic, reverse, and complement) were identified in the cp genomes of F. macrophylla and F. prostrata, respectively. Notably, F. macrophylla lacked complementary repeats, while F. prostrata contained one. Specifically, F. macrophylla harbored 19 forward, 38 palindromic, and 3 reverse repeats, whereas F. prostrata had the same number of forward repeats, two more palindromic repeats, and one fewer reverse repeat (Figure 4).
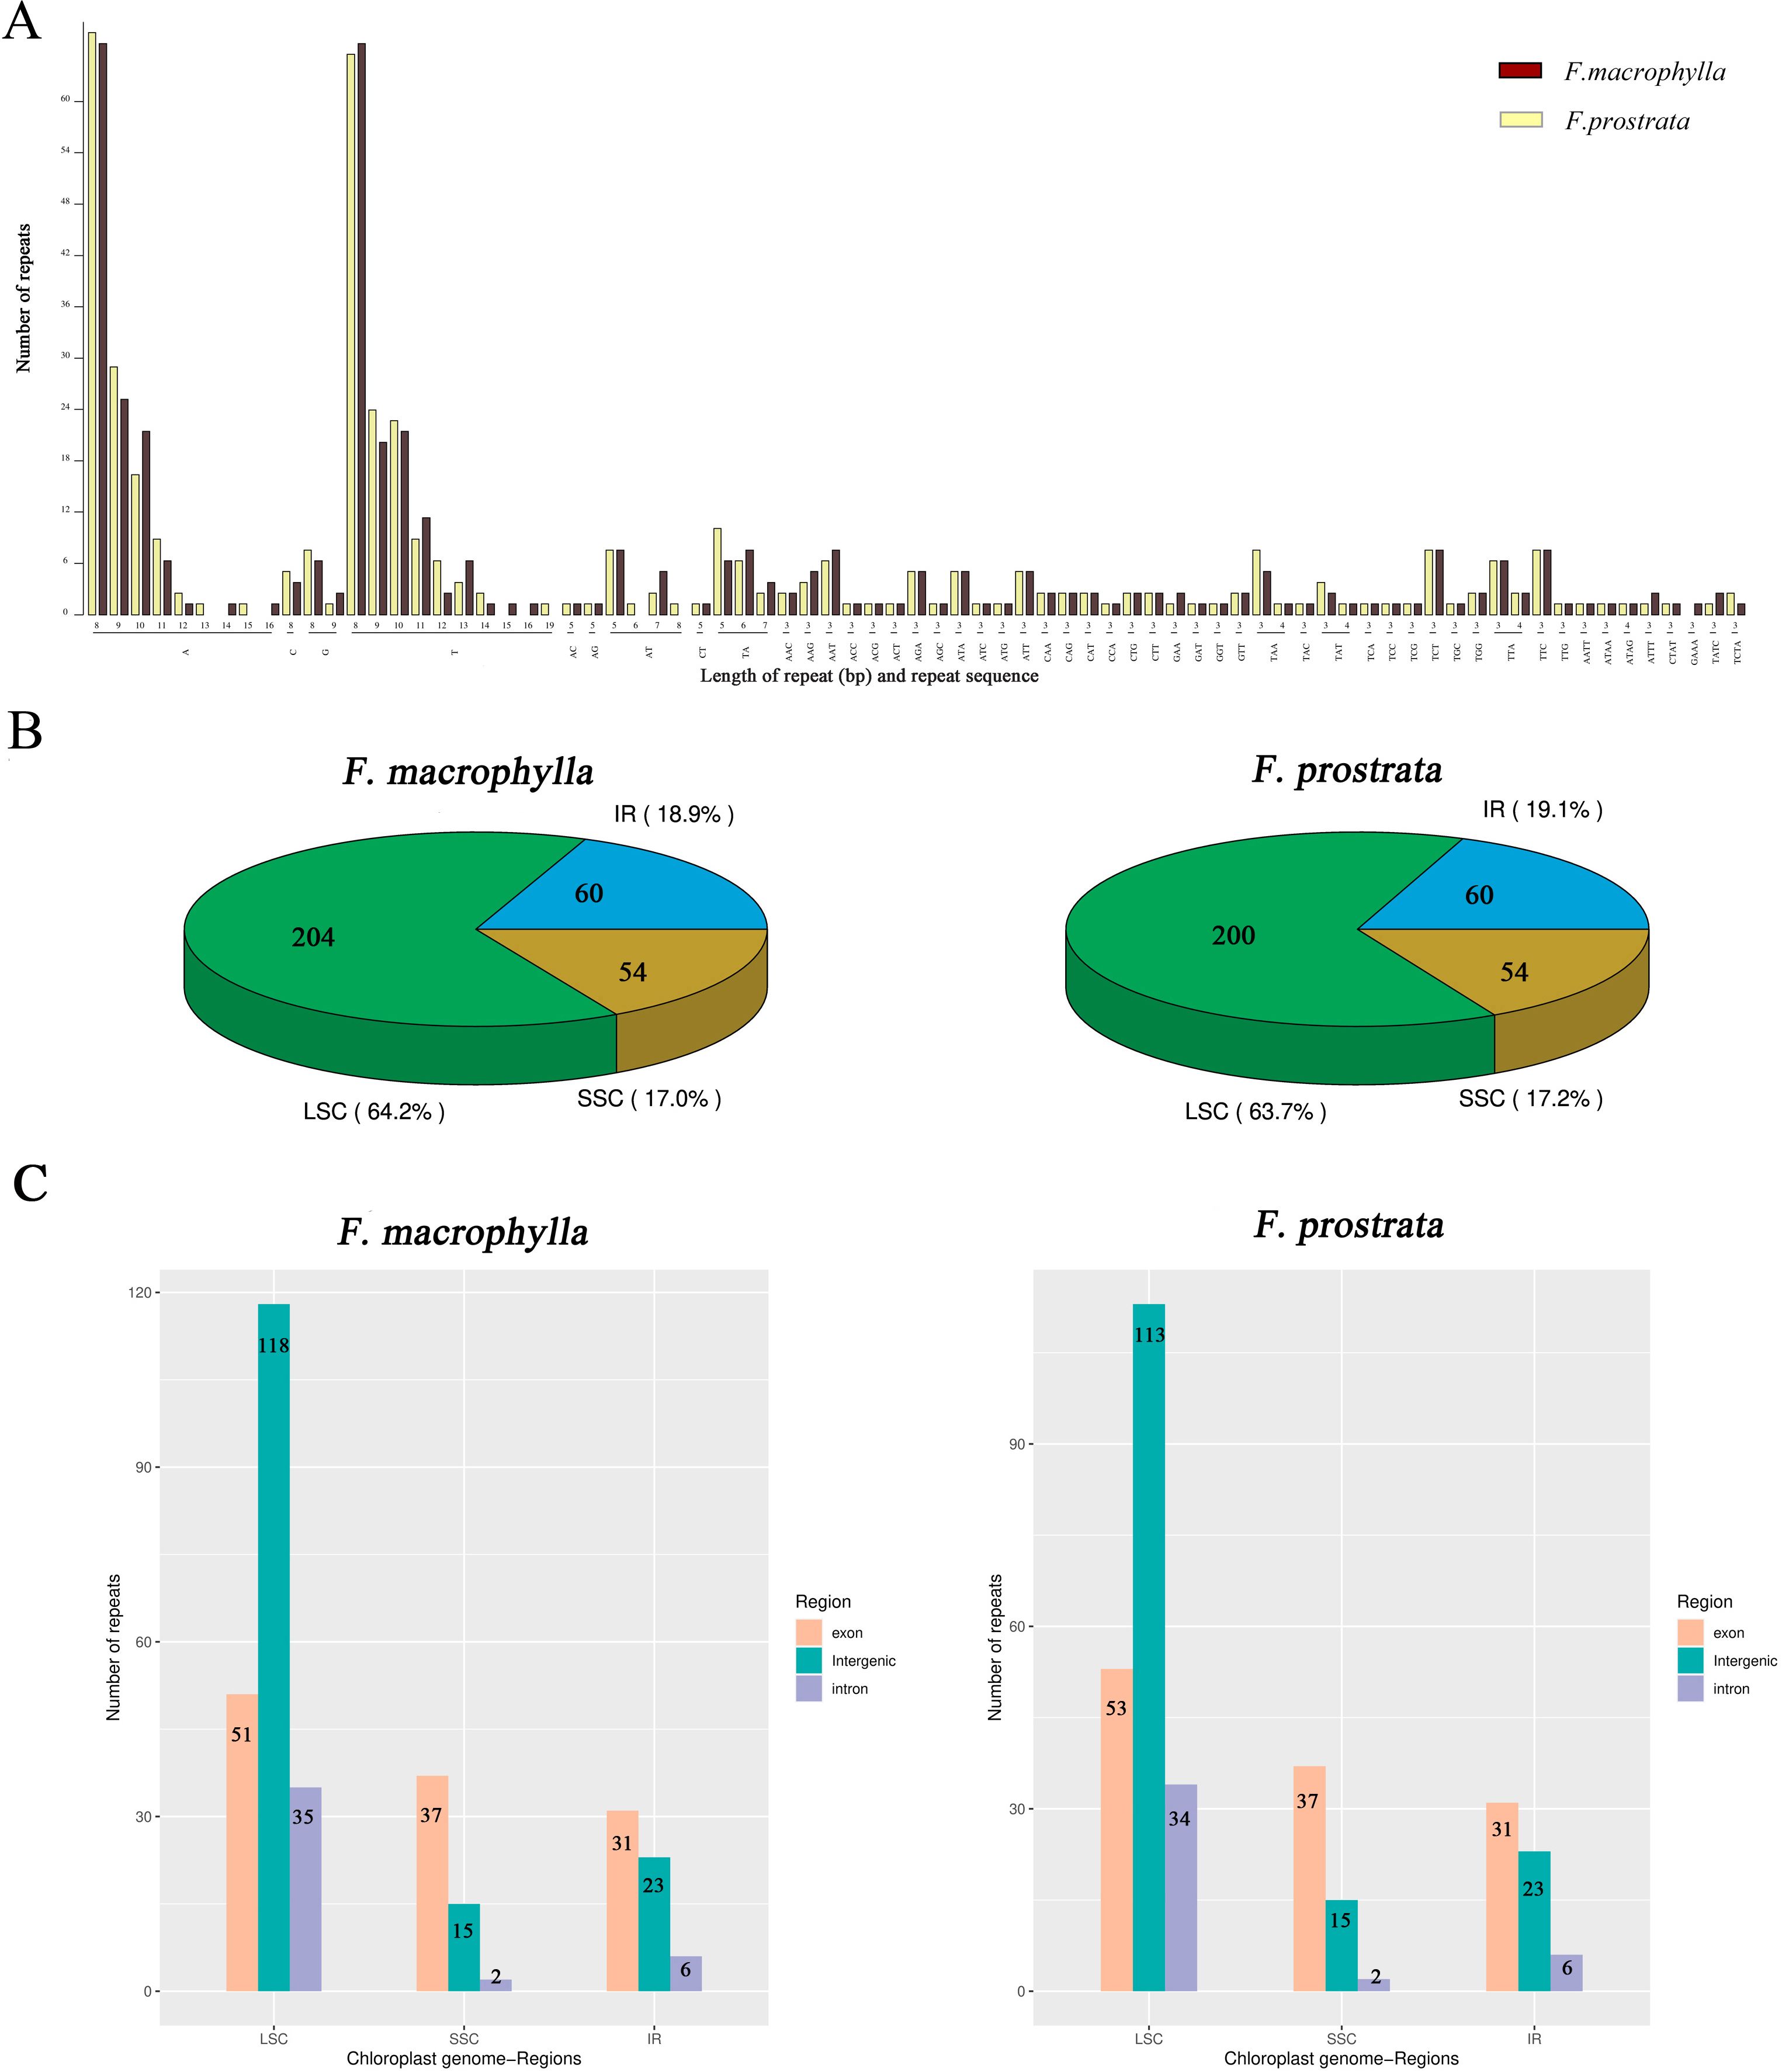
Figure 3. Analysis of SSRs in the chloroplast genomes of F. macrophylla and F. prostrata. (A) Distribution statistics of SSRs based on type and length. (B) Proportional distribution of SSRs in the LSC, SSC, and IR regions. (C) Frequency of SSRs in exon, intergenic, and intron regions across the LSC, SSC, and IR regions.
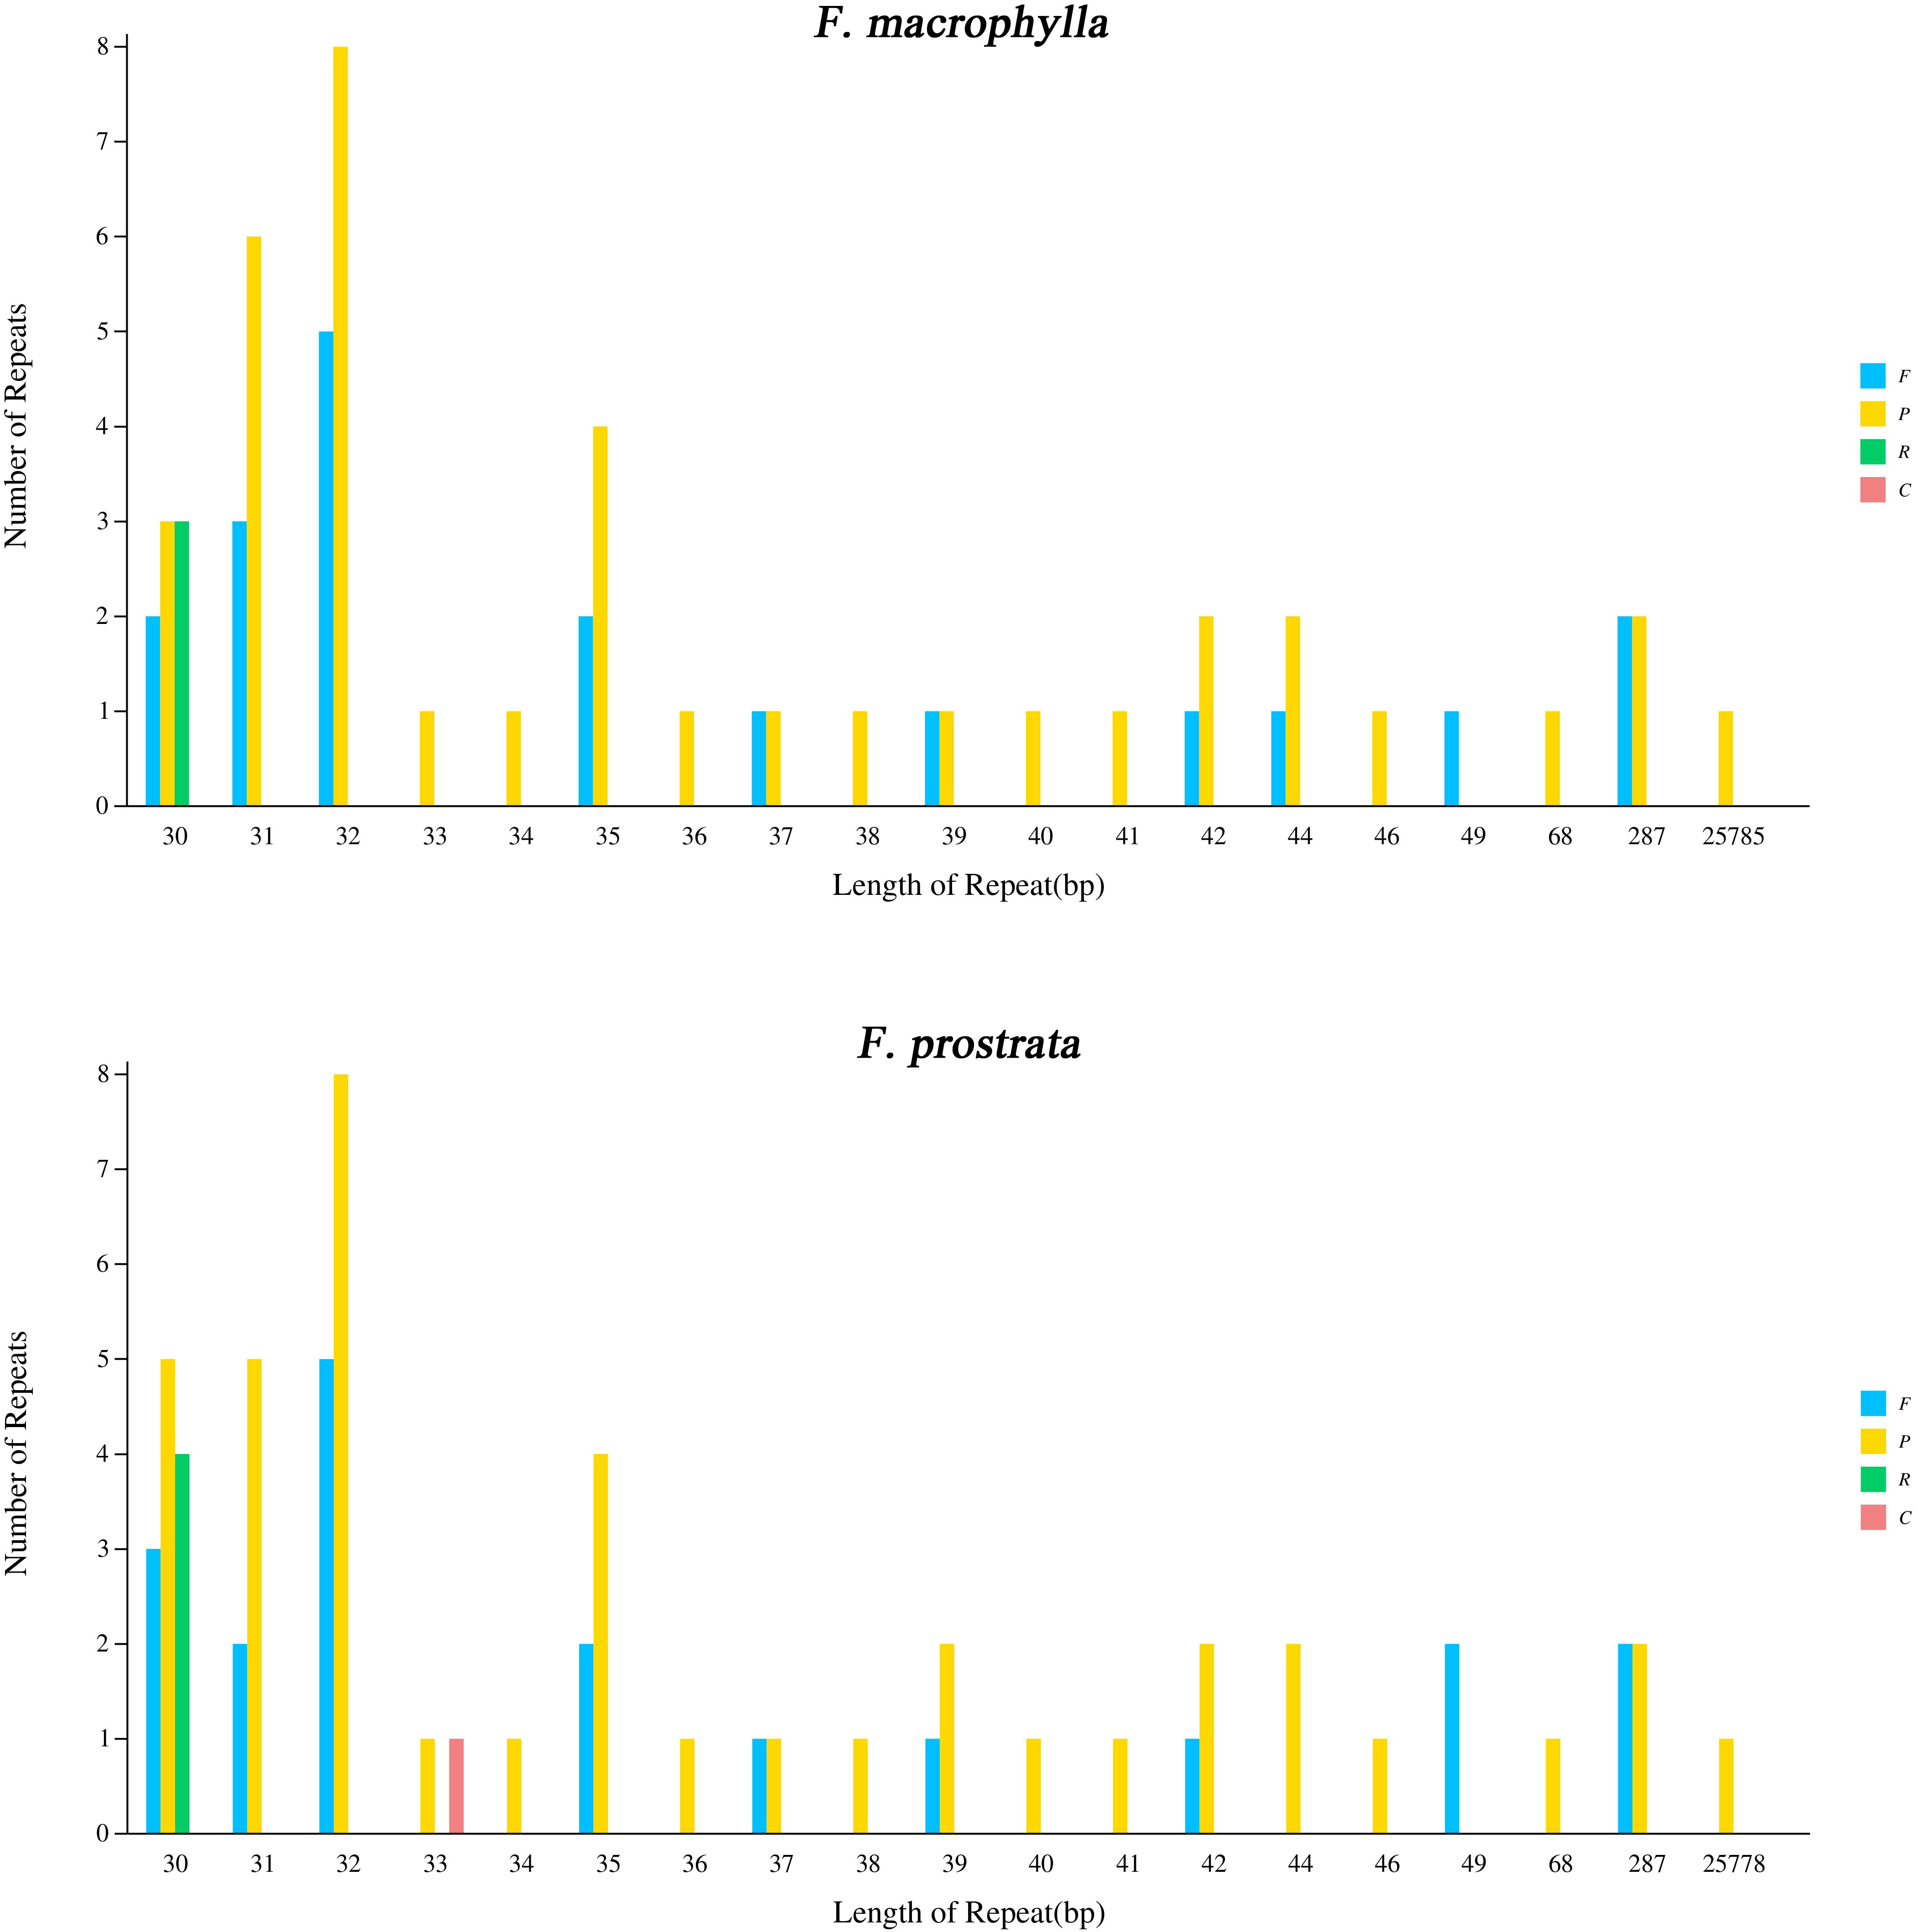
Figure 4. Analysis of scattered repeat sequences in the chloroplast genome of F. macrophylla and F. prostrata. F, forward; P, palindromic; R, reverse; C, complement.
3.3 Analysis of codon preference
At the molecular level, within the genetic code, multiple codons can code for the same amino acid, these are known as synonymous codons. The relative synonymous codon usage (RSCU) value serves as a quantitative indicator of the preference or bias for specific synonymous codons within a gene or genome. In this study, RSCU values were calculated based on the protein-coding sequences of the cp genomes of F. macrophylla and F. prostrata. The protein sequences of these two species comprised 26,146 and 26,151 codons, respectively, including termination codon. As shown in Figure 5A and Supplementary Table S4, both Flemingia species utilized 64 codon types to encode 21 amino acid types. The codon counts ranged from 1 to 1,195 in F. macrophylla and from 1 to 1,190 in F. prostrata. The amino acid tryptophan (Trp) was encoded by only one codon, whereas the remaining amino acids were encoded by 2–6 codons. In both F. macrophylla and F. prostrata, leucine exhibited the highest codon usage (10.522% and 10.523%, respectively), while cysteine showed the lowest (1.132% and 1.120% of the total number of codons, respectively). Moreover, codon usage was nearly identical between the cp genomes of the two species, with RSCU values ranging from 0.0085 to 4.9655. Several amino acids exhibited codon bias, except for tryptophan (UGG), which had an RSCU value of exactly 1, indicating no codon preference. Overall, these results suggest a high degree of conservation in the cp genomes of F. macrophylla and F. prostrata.
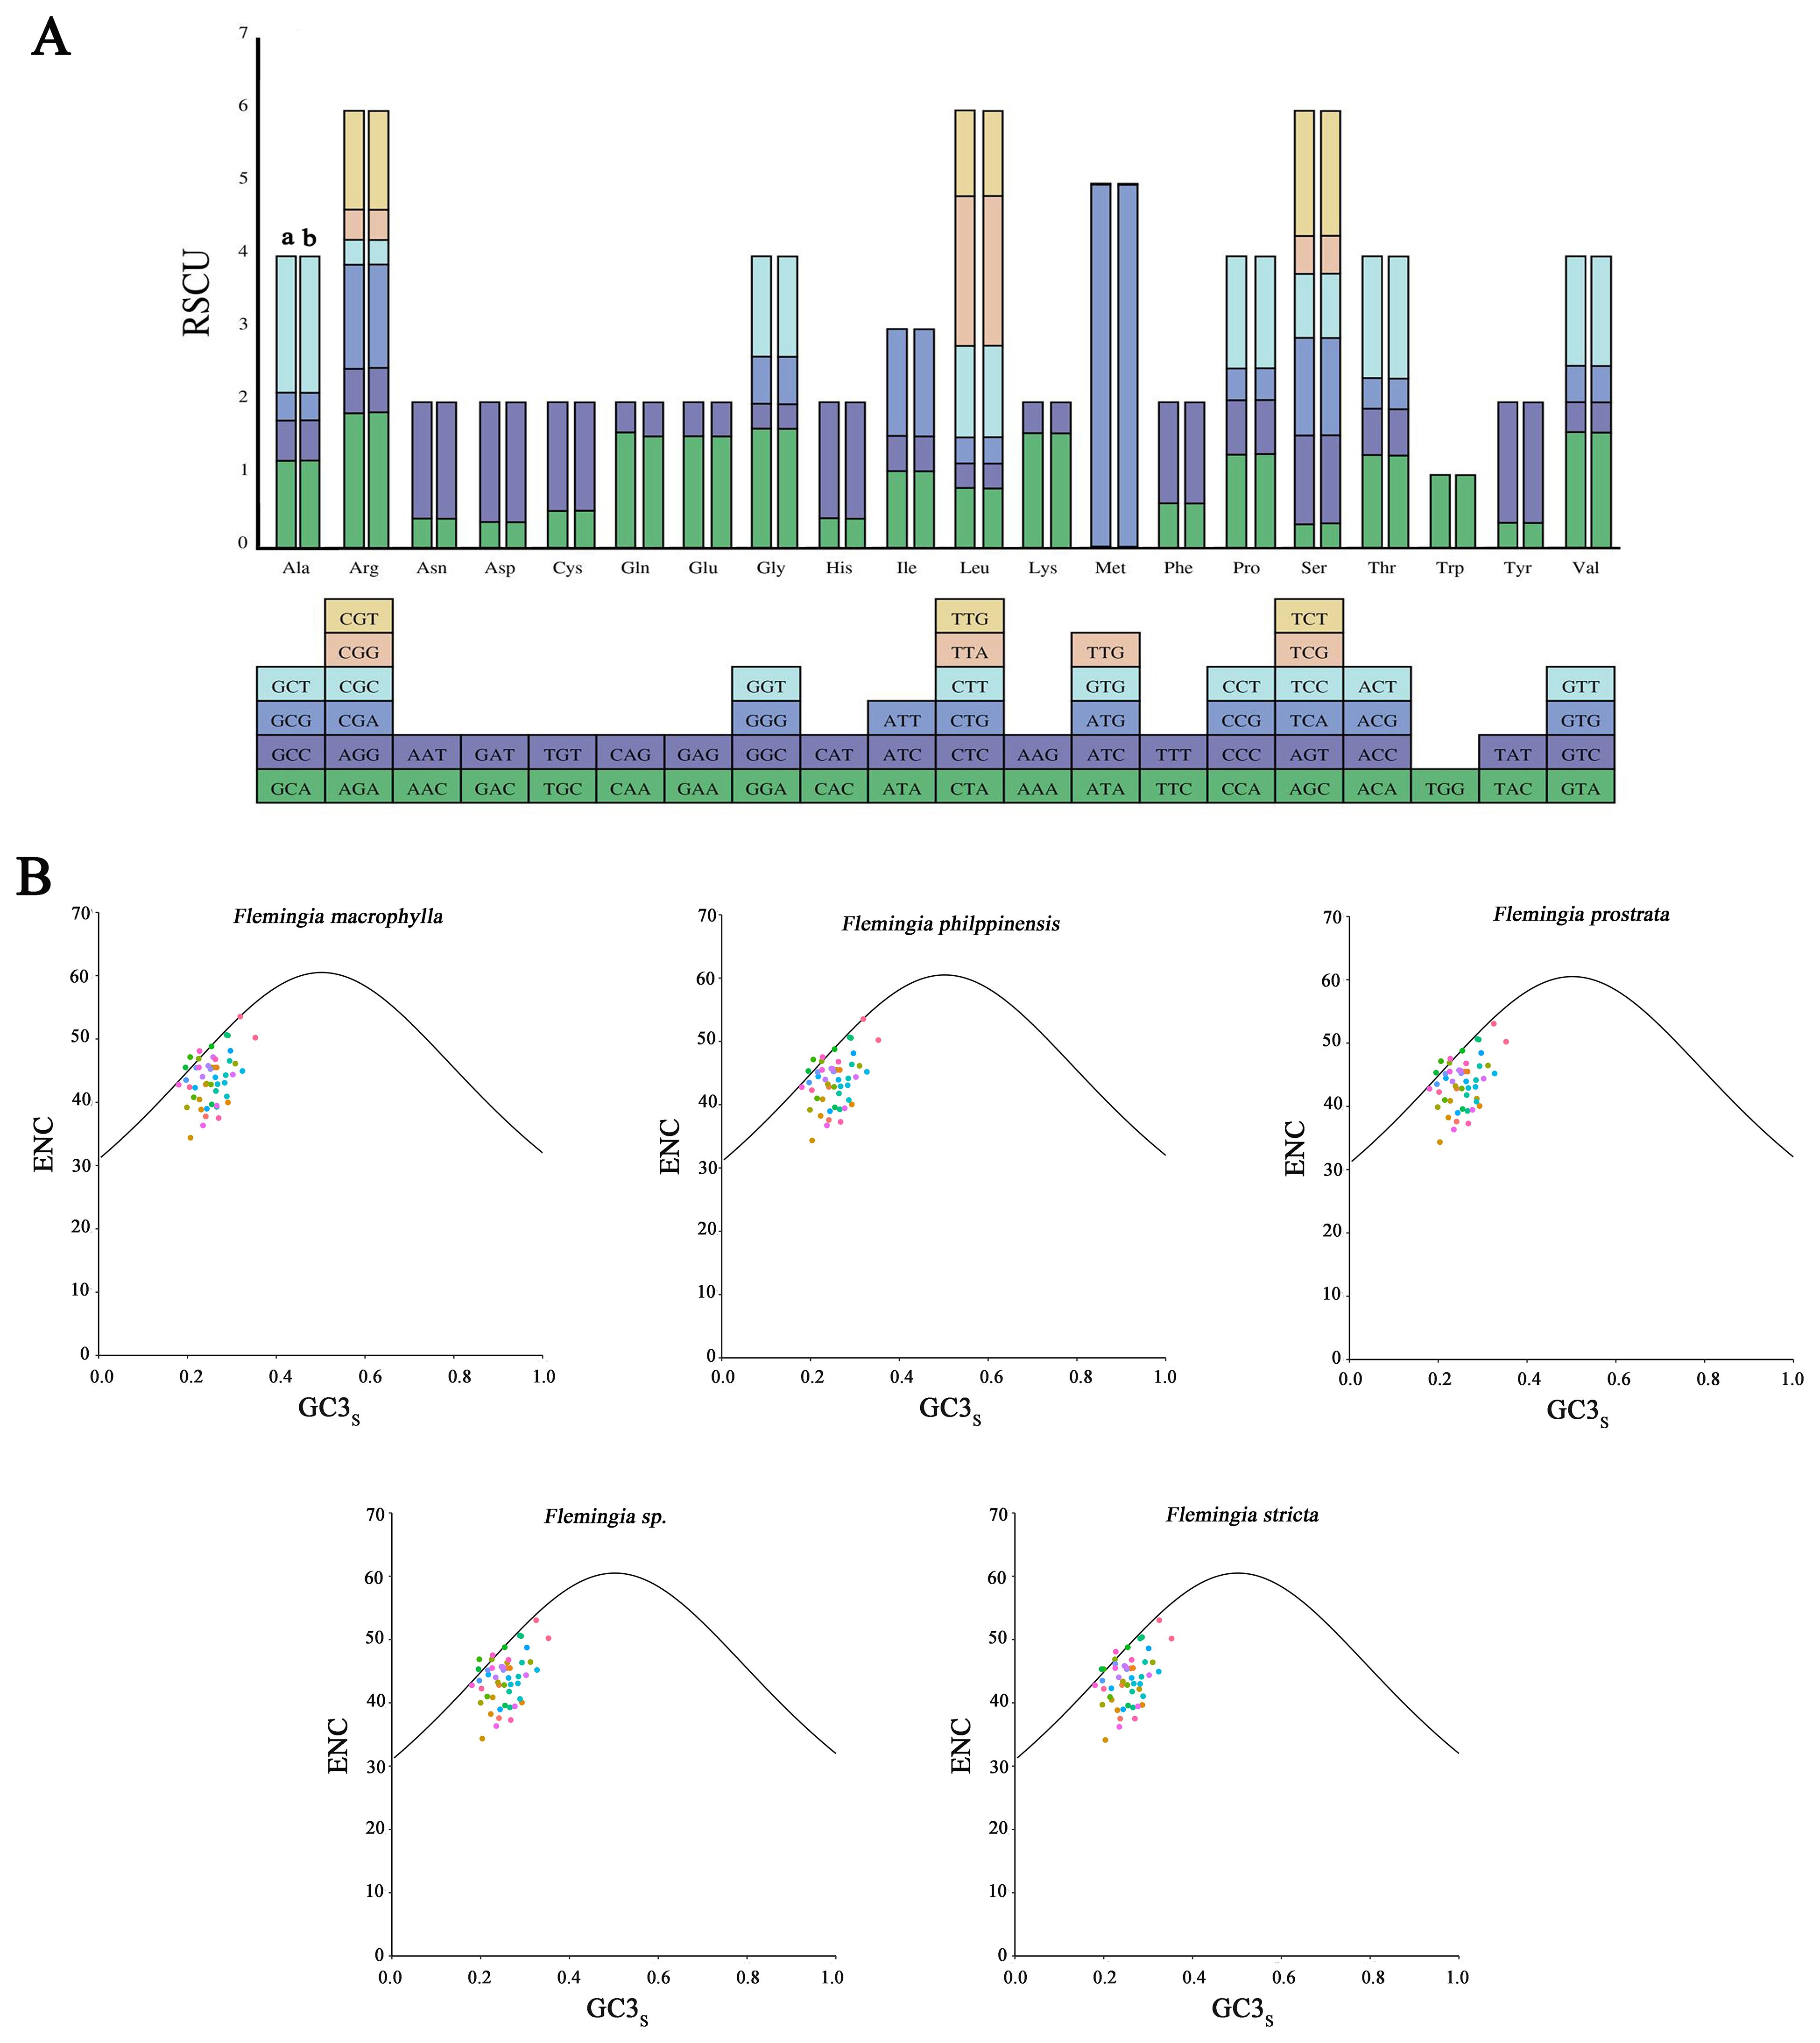
Figure 5. Analysis of codon usage. (A) Relative synonymous codon usage (RSCU) of 20 amino acid codons in all protein-coding genes of the chloroplast genome of F. macrophylla and F. prostrata. a: F. macrophylla, b: F. prostrata. (B) Analysis of ENC-plot of F. macrophylla, F. philippinensis, F. prostrata, F. stricta, and Flemingia sp.
To further investigate the factors influencing codon usage bias, ENc and GC3s plots were employed. As illustrated in Figure 5B, the ENc-GC3 patterns in the two genomes and those of three other Flemingia species exhibit notable similarities. The ENc values ranged from 34.14 to 53.52, reflecting diverse trends in codon preference. As indicated by the average ENc values (43.61-43.76) in Supplementary Table S5, most coding sequences displayed only weak codon bias. While a limited number of genes were located above or near the expected curve, the majority fell within the lower region of the curve. This suggests that, although mutation pressure influences codon usage patterns, other factors, particularly natural selection, also play a significant role.
3.4 Comparative analysis of five complete chloroplast genomes within Flemingia
The contraction and expansion of the IR region boundaries are major factors contributing to variances in cp genome size, illustrating critical roles in evolution processes (Wang et al., 2008). A comparison was conducted between the IR/LSC and IR/SSC junction regions of F. macrophylla, F. prostrata, F. stricta, Flemingia sp. and F. philippinensis to identify potential instances of IR boundary expansion or contraction (Figure 6). Among the five cp genomes, the genes rps19, ycf1/ndhF, and ycf1 were found at the LSC/IRb (JLB), IRb/SSC (JSB), and SSC/IRa (JSA) junctions, respectively. The rpl2 gene is entirely located within the IR regions, positioned 103 bp from JLB junction. The rps19 gene is primarily located in the LSC region and spans 49 bp into the JLB junction. Furthermore, in the cp genomes of F. prostrata, Flemingia sp., and F. philippinensis, the distance between trnH and the JLA junction is 29 bp, whereas it is 18 bp in F. macrophylla and 26 bp in F. stricta. In F. macrophylla, trnN is located 851 bp from the JSA junction, while in the other four species, this distance remains consistent at 849 bp. The ndhF gene is predominantly located in the SSC region but extends into the JSB junction by 2 bp in F. macrophylla and by 3 bp in the remaining four Flemingia species. The ycf1 gene spans both the JSA and JSB junctions across all analyzed genomes. Within the IRb region, the ycf1 gene spans the JSB junction by 25 bp in F. macrophylla and by 27 bp in the other four species. Within the IRa, region, the ycf1 gene spans the JSA junction by 4,875 bp in F. prostrata, Flemingia sp., and F. philippinensis, and by 4,855 and 4,848 in F. macrophylla and F. macrophylla, respectively. In conclusion, the IR/LSC borders of these five chloroplast genomes of Flemingia were relatively conserved and similar, but the IR/SSC borders exhibited variations.
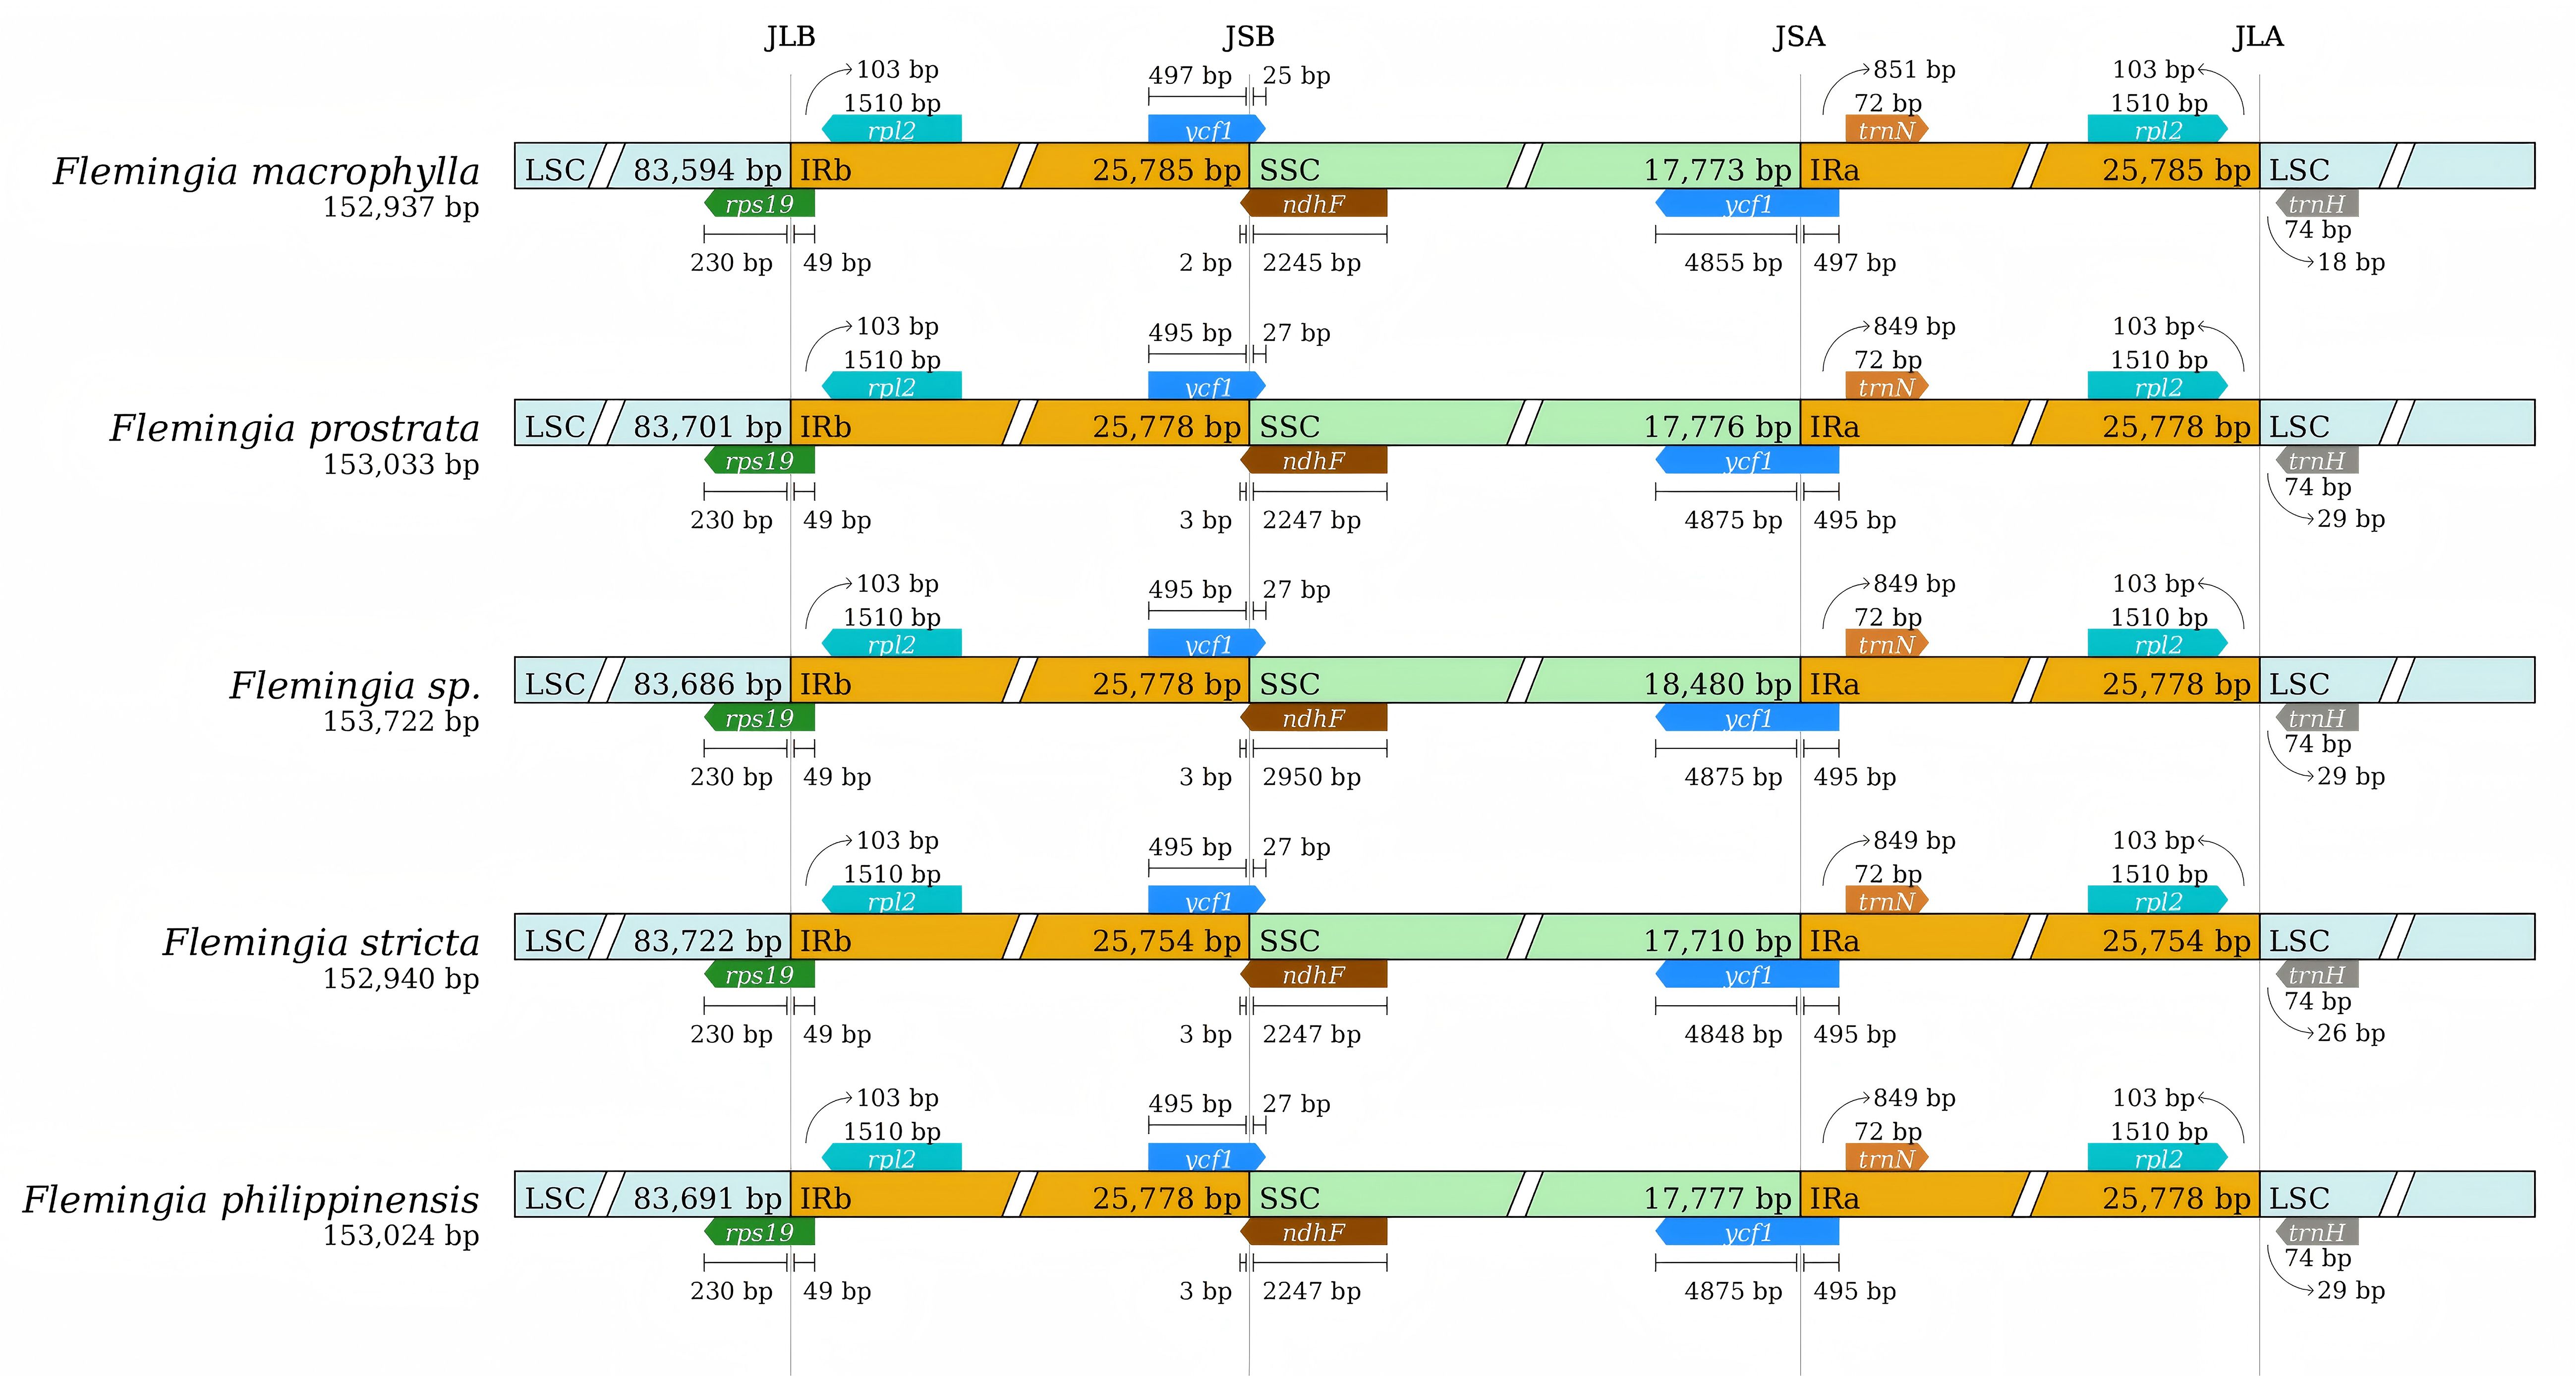
Figure 6. Comparison of the large single copy (LSC), small single copy (SSC), and inverted repeat (IR) regions in chloroplast genomes of F. macrophylla, F. prostrata, F. stricta, Flemingia sp. and F. philippinensis. Genes are denoted by colored boxes. The gaps between the genes and the boundaries are indicated by the base lengths (bp).
To verify the possibility of genome divergence, sequence identity was calculated for the five Flemingia cp genomes using the program MAUVE with F. macrophylla as a reference (Figure 7). The results indicated that the five cp genomes exhibited a high degree of consistency and conservation of gene order, although there were also certain levels of sequence variation.
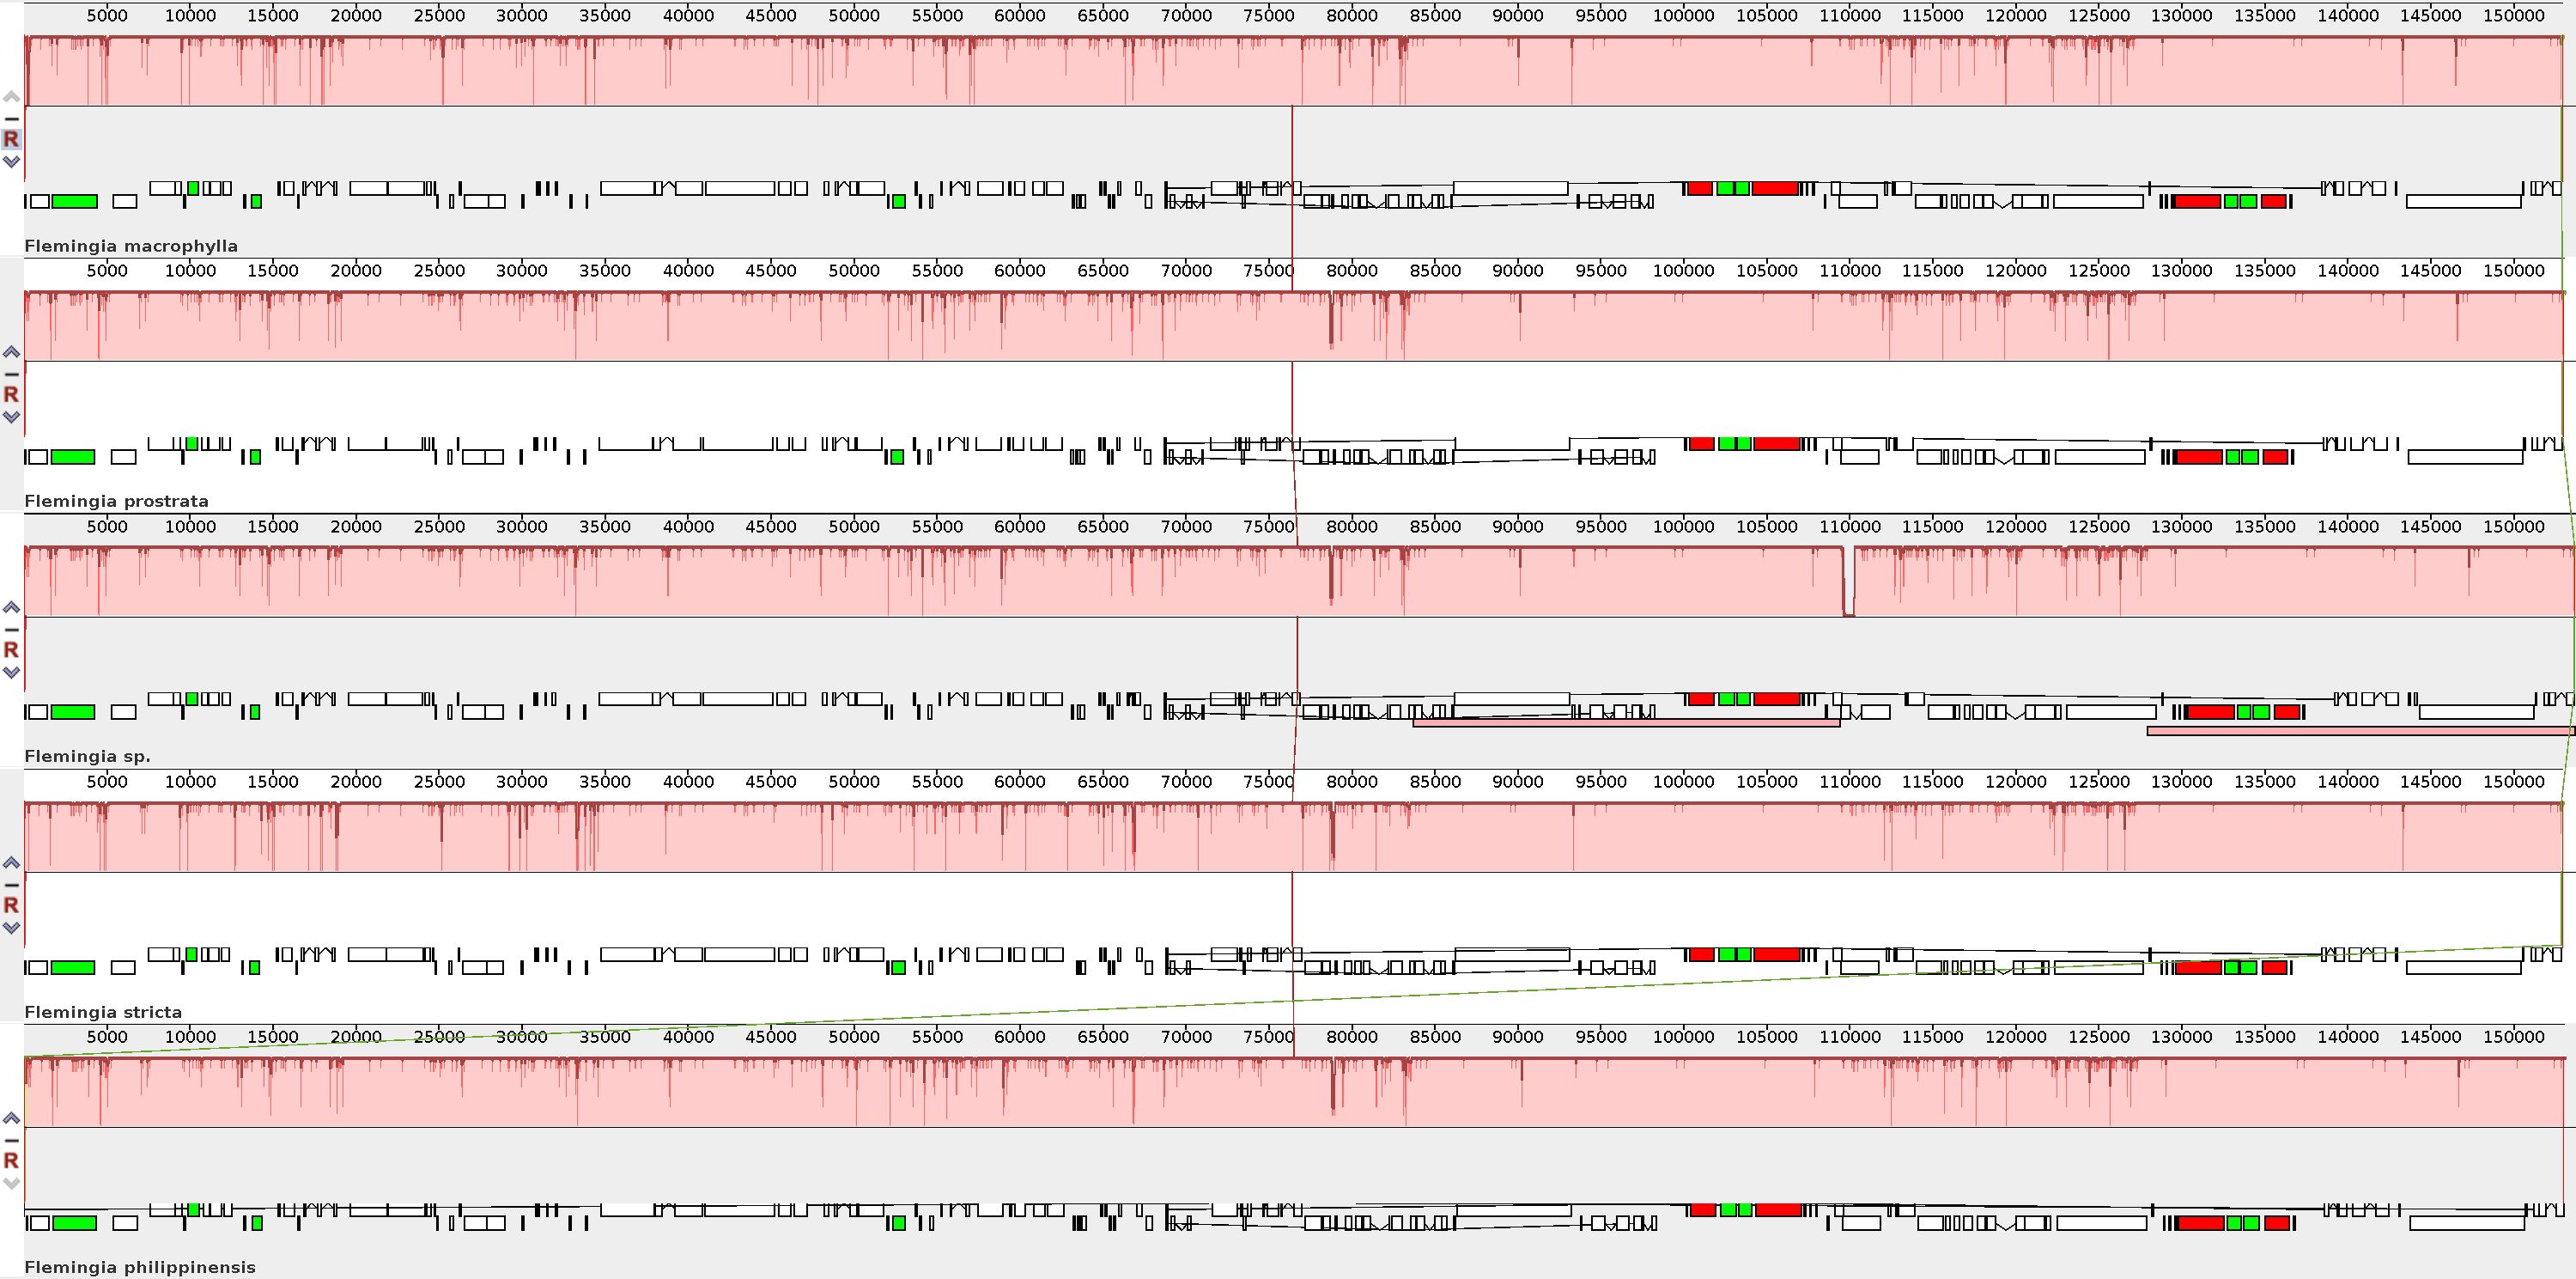
Figure 7. Comparison of the chloroplast genome structures among F. macrophylla, F. prostrata, F. stricta, Flemingia sp. and F. philippinensis based on the Mauve alignment analysis. The chloroplast genome of F. macrophylla is used as the reference and displayed at the top. Consistently colored bars connected with lines in the figure indicate locally collinear blocks (LCBs), which represent clusters of homologous genes. The vertical lines of color of the bar structure indicate the relative conservation of the position, i.e. similarity. The small boxes below each chloroplast genome indicate genes; upper and lower boxes are transcribed counterclockwise and clockwise, respectively. White green box indicate CDS, red boxes indicate iRNA, green box indicate tRNA.
3.5 Highly divergence regions and selective pressure analysis of Flemingia
The DnaSP software was employed to perform sliding window analyses aimed at identifying mutational regions across the complete chloroplast genomes of F. macrophylla, F. prostrata, F. stricta, Flemingia sp. and F. philippinensis. A total of 561 polymorphic sites were identified among the five plastomes, yielding nucleotide diversity (Pi) values ranging from 0 to 0.061, with an average of 0.00167. As illustrated in Figure 8, four divergent hotspots exhibiting high Pi values (>0.025) were detected among the five Flemingia species: trnK/rbcL, psaJ-rps18, rps3-rps19, and rps15/ycf1. All these regions were intergenic spacers, suggesting that intergenic regions are more variable than coding regions. Overall, the LSC and SSC regions exhibited higher divergence compared to the IR regions.
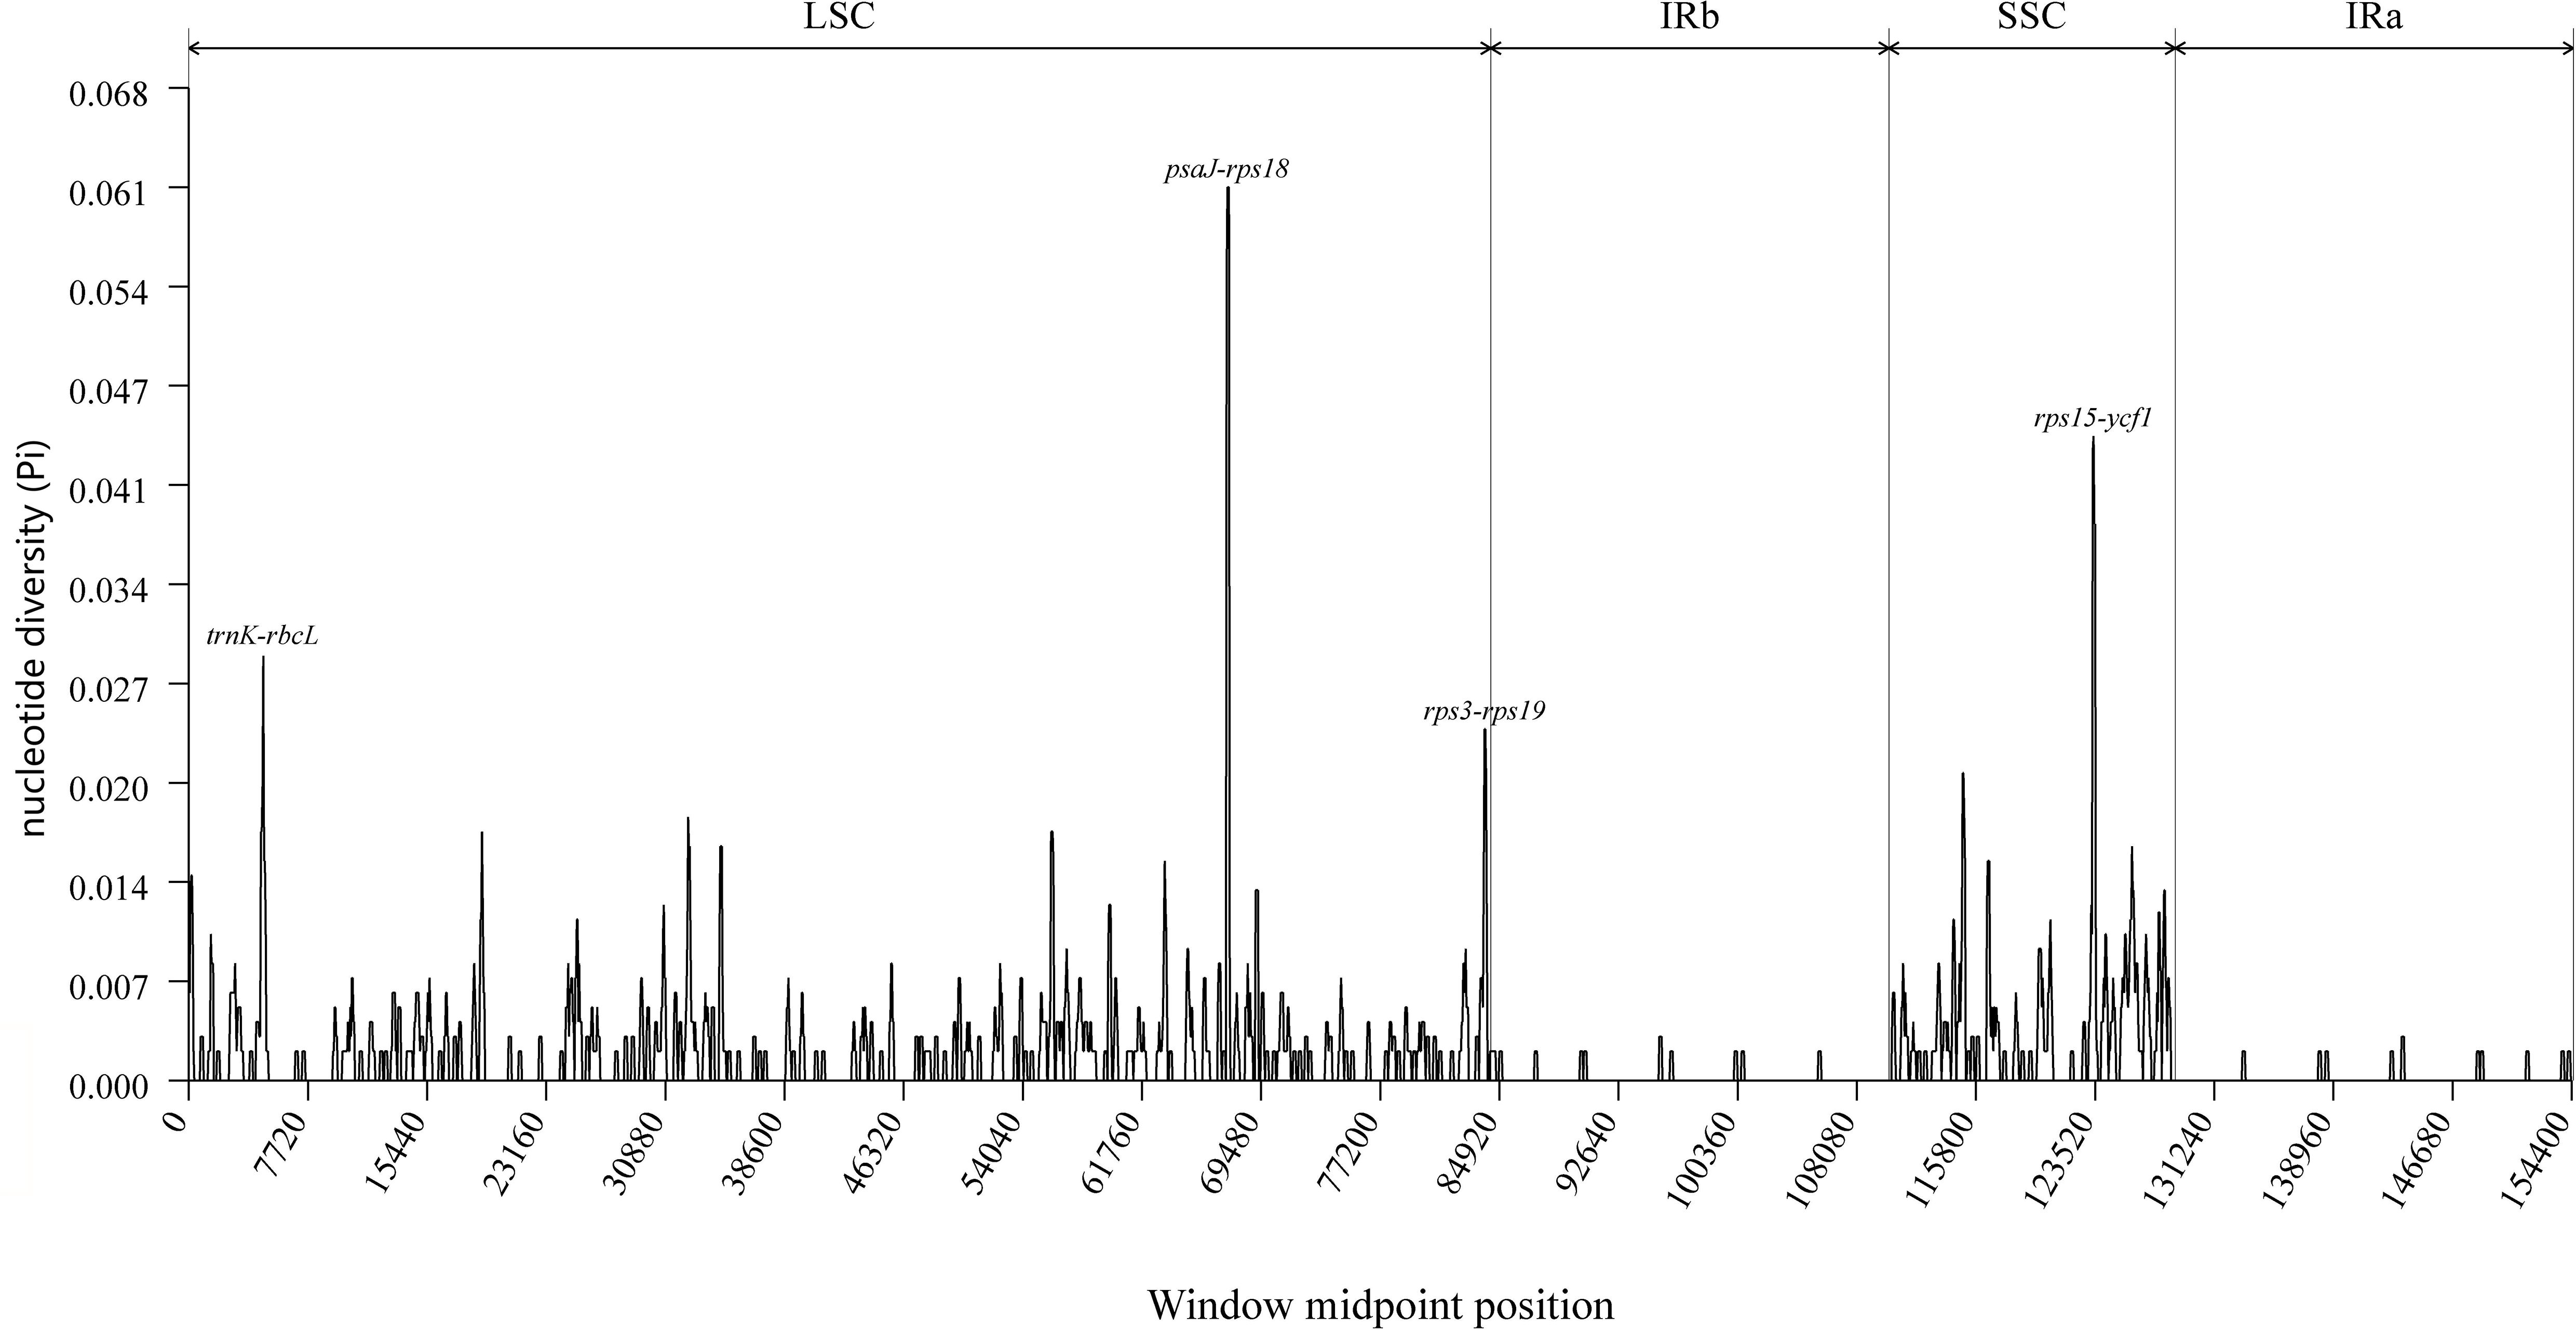
Figure 8. Nucleotide diversity across the complete chloroplast genomes of F. macrophylla, F. prostrata, F. stricta, Flemingia sp. and F. philippinensis, analyzed using a sliding window approach (window length: 200 bp; step size: 50 bp). The x-axis represents the midpoint position of each window along the genome, while the y-axis indicates the nucleotide diversity (Pi) value for that window.
To identify selection patterns in the protein-coding genes, we compared non-synonymous (Ka) and synonymous (Ks) substitution rates across the five Flemingia cp genomes, using F. macrophylla as the reference species.The Ka/Ks ratios were calculated for all 76 protein-coding genes. The Ka values for F. prostrata, F. stricta, Flemingia sp., and F. philippinensis ranged from 0.00035 to 0.00582, while the Ks values ranged from 0.00169 to 0.05368. The accD and ndhB genes showed differential selection patterns: accD was under positive selection in the F. stricta vs F. macrophylla comparison (Ka/Ks >1), but under purifying selection in the other three comparisons (Ka/Ks < 1). In contrast, ndhB showed no significant difference in the F. prostrata vs F. macrophylla comparison, was under purifying selection in the F. philippinensis vs F. macrophylla and Flemingia sp. vs F. macrophylla comparisons, and also under purifying selection in the F. stricta vs F. macrophylla comparison. Protein-coding genes inferred to be under purifying selection (Ka/Ks < 1) across all five Flemingia chloroplast genomes include ccsA, ycf1, nadhF, rpoB, matK, and rpoC2 (Figure 9; Supplementary Table S6).
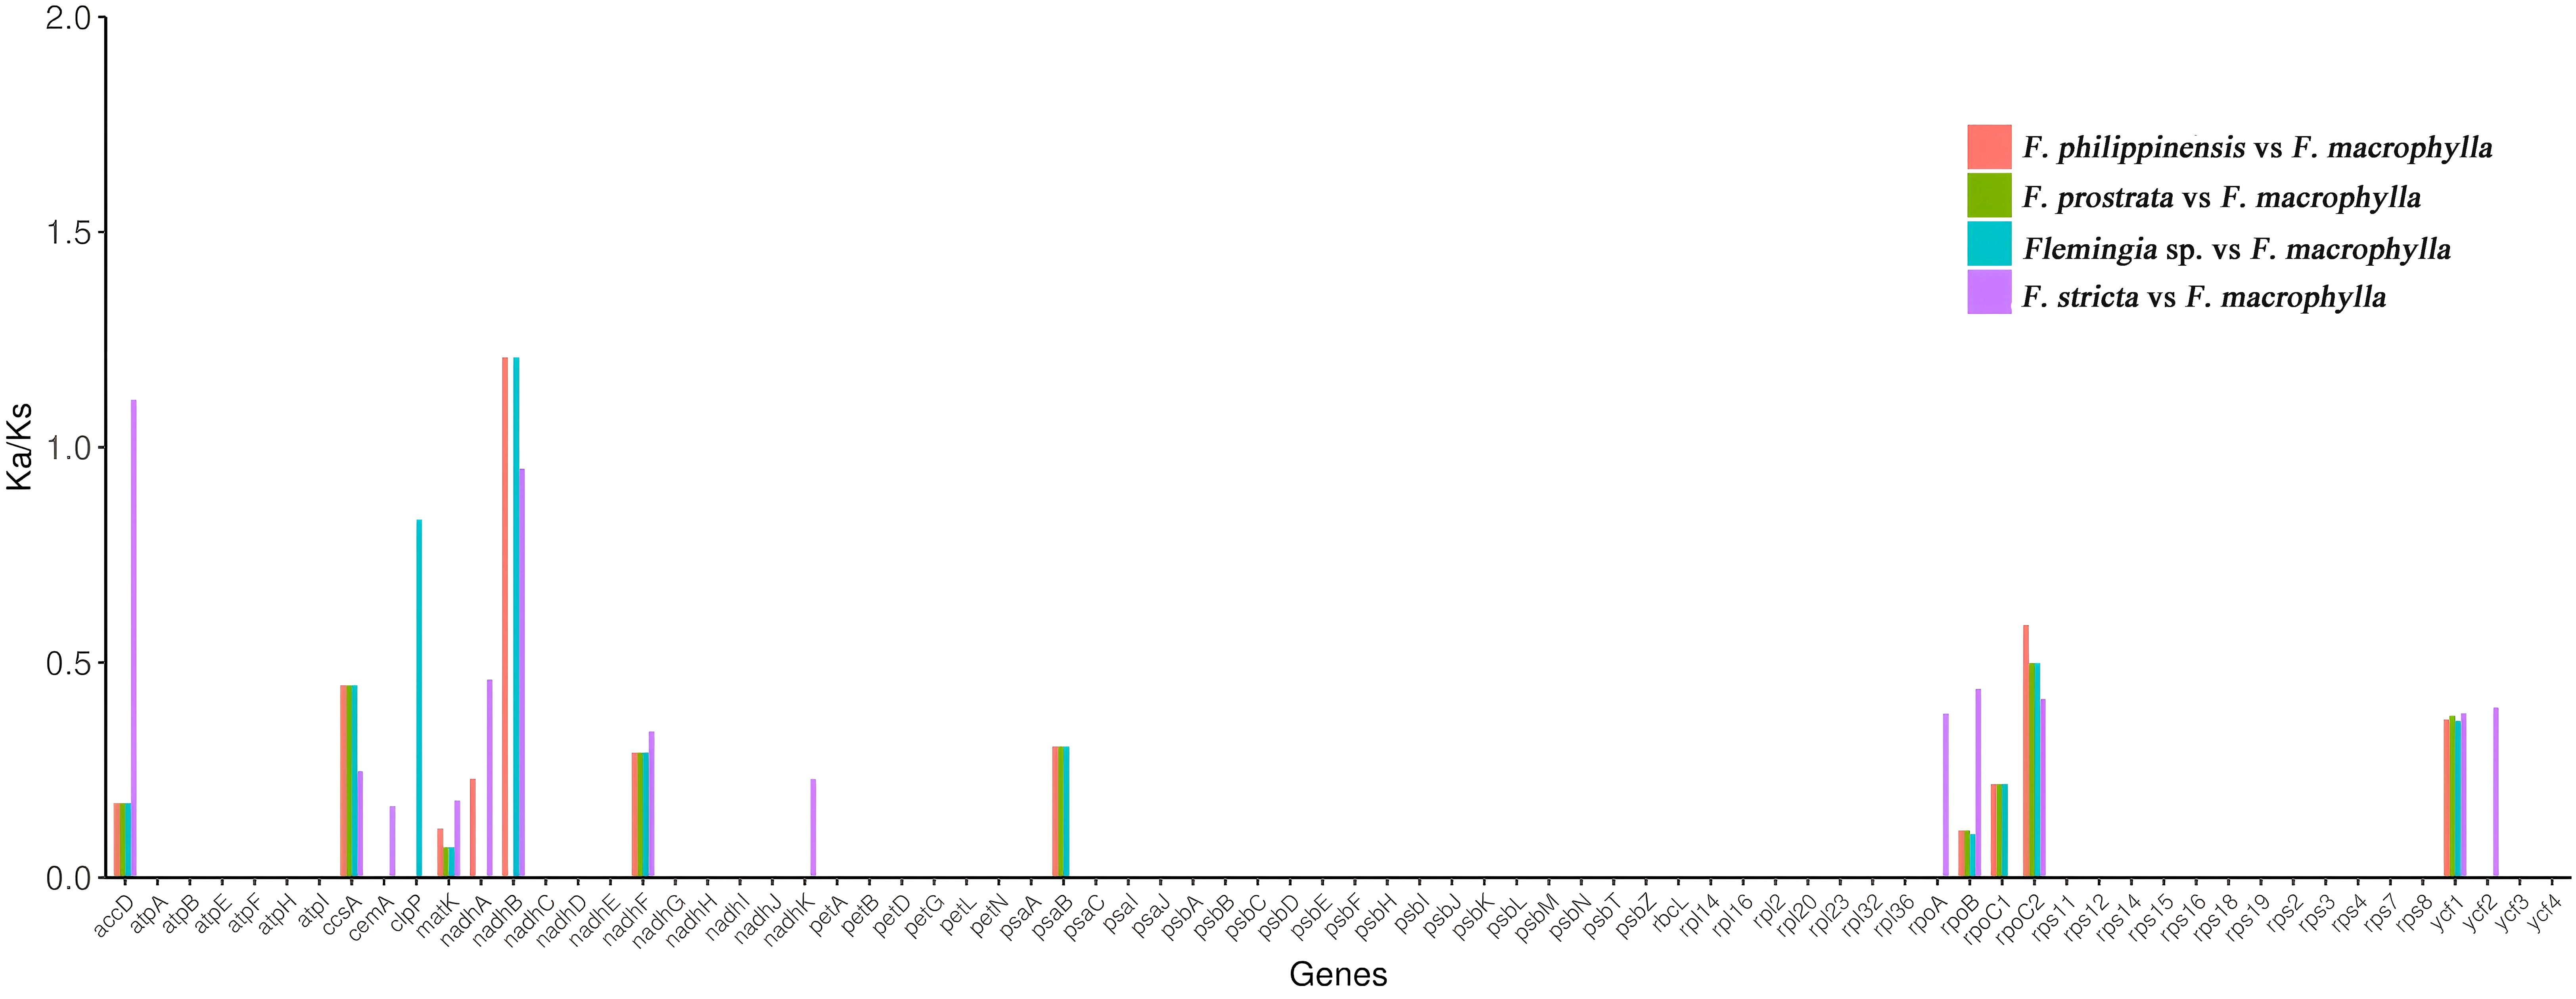
Figure 9. Ka/Ks values of 76 protein-coding genes in the F. prostrata vs F. macrophylla, F. stricta vs F. macrophylla, Flemingia sp. vs F. macrophylla, and F. philippinensis vs F. macrophylla comparisons.
3.6 SNP and indel in F. prostrata and F. macrophylla
Comparative analysis of SNPs and indels in the F. prostrata cp genome relative to F. macrophylla identified 286 SNPs. Among these, 223 were transversional (Tv) and 63 were transitional (Ts), yielding a Ts/Tv ratio of 0.28. The predominant substitution types were G→T (47) and A→C (43), followed by T→A (34), T→G (34), and C→A (31) (Supplementary Table S7). Additionally, 104 indels (51 insertions, 53 deletions) were detected. Most indels (68.3%) were 1–5 bp in length, constituting the primary length variation between the two Flemingia genomes (Supplementary Table S8). These variant sites may serve as candidate molecular markers for species identification and phylogenetics.
3.7 Phylogenetic relationships of Flemingia
The two phylogenetic tree indicated that all five Flemingia species formed a monophyletic clade, showing a close evolutionary relationship with Cajanus cajan, supported by a bootstrap value of 100%. This clade was further grouped with another clade comprising Glycine canescens, Cyamopsis tetragonoloba, Pachyrhizus erosus, Haymondia wallichii, Phaseolus vulgaris, Butea monosperma, and Spatholobus pulcher (Figures 10A, B).
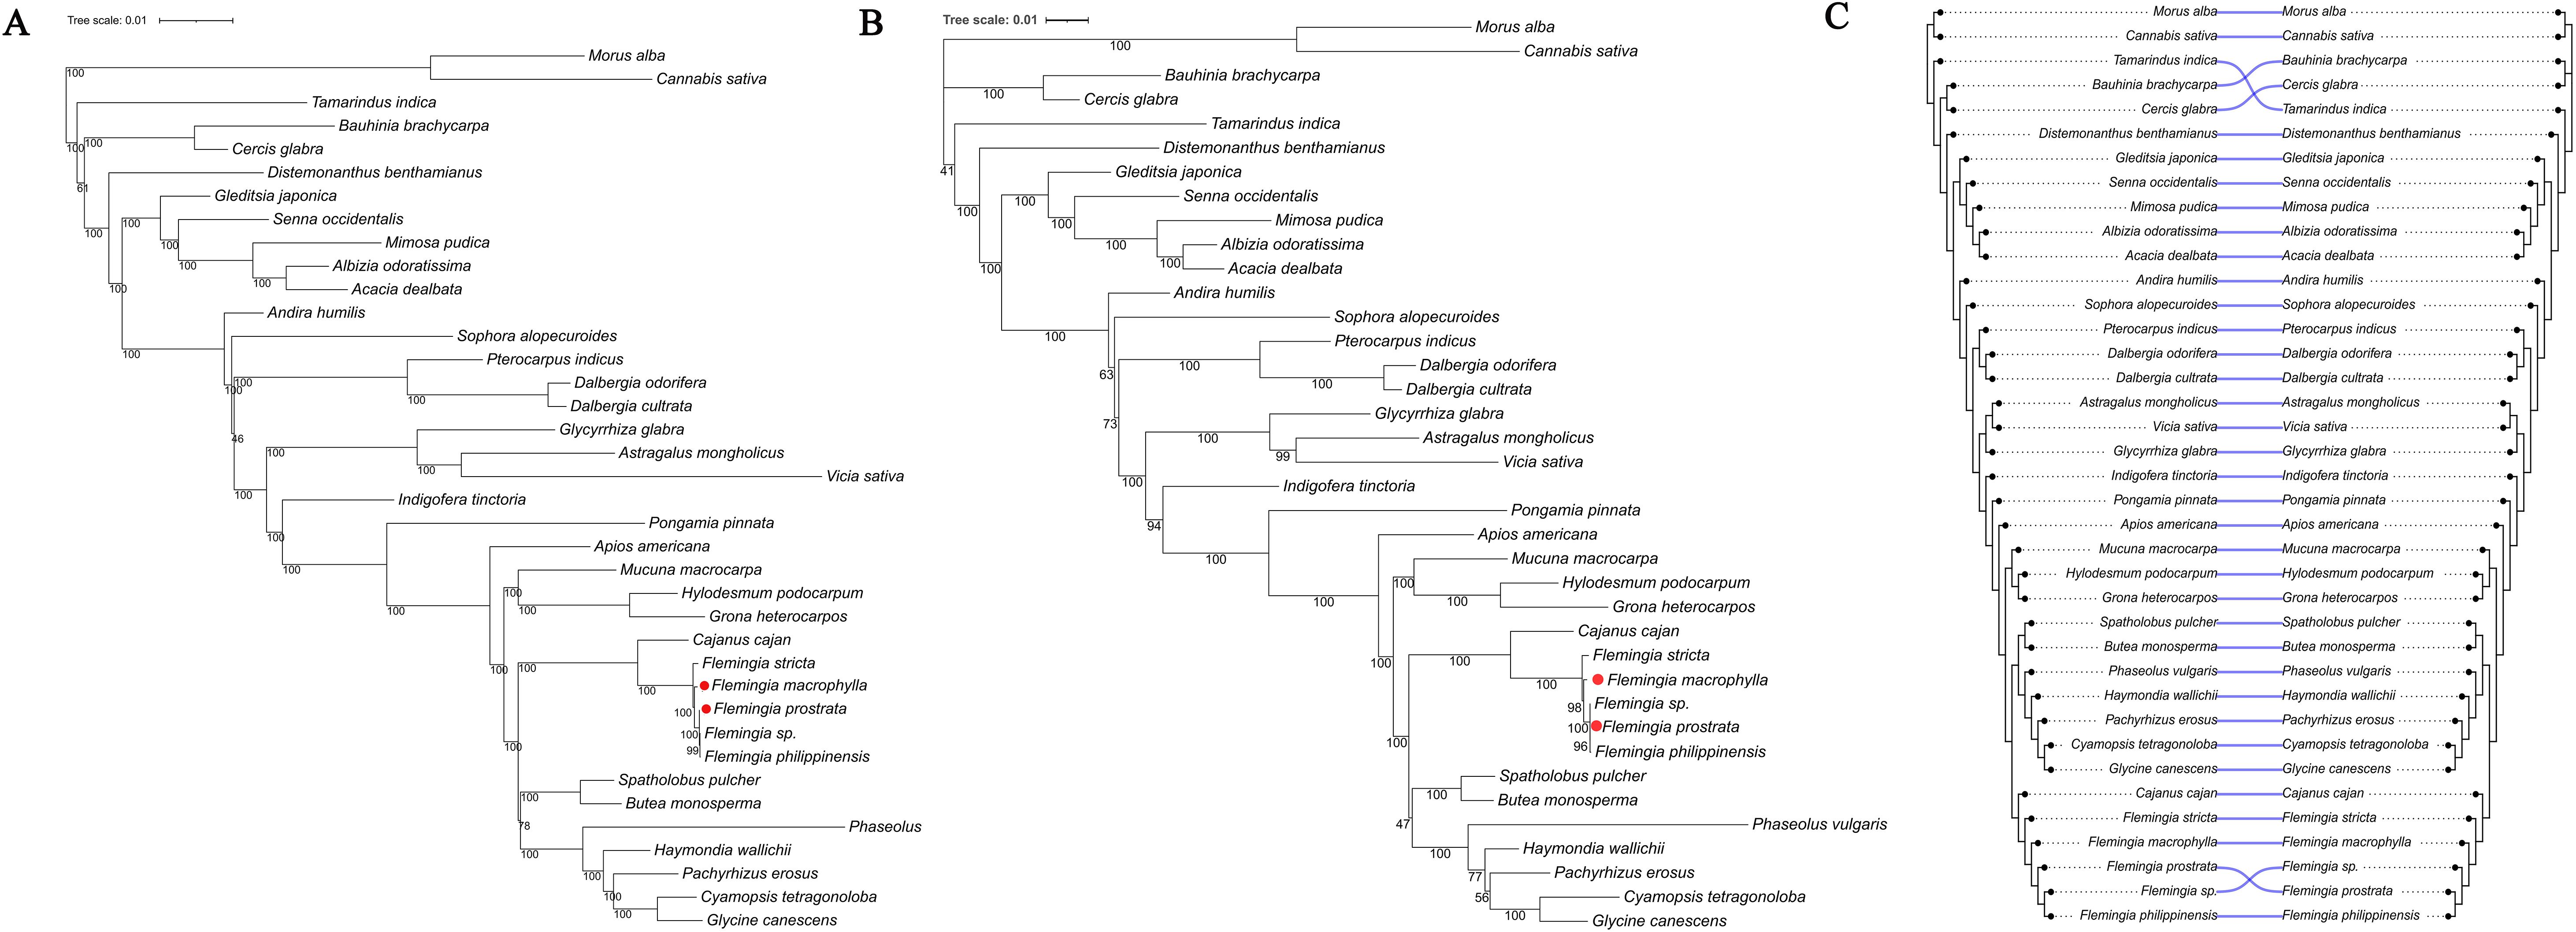
Figure 10. Phylogenetic relationship of the family Fabaceae. (A) ML tree based on the CDS of 57 chloroplast genes. (B) ML tree based on rbcL + matK + trnL–trnF + ndhF regions. (C) The tanglegram compares the two phylogenies, with all branch lengths standardized. Semi−transparent blue curved connectors link each taxon across the two trees; the near−absence of crossing lines indicates a high degree of topological concordance between these datasets.
The tanglegram showed that the vast majority of taxa—including Morus alba, Cannabis sativa, Distemonanthus benthamianus, Senna occidentalis, Glycyrrhiza glabra and Phaseolus vulgaris—were linked by straight, non−crossing semi−transparent blue lines, reflecting identical placements in both the 57−gene CDS tree and the concatenated rbcL + matK + trnL–trnF+ ndhF tree. Only two small regions displayed minor topological discordance: within the clade comprising Bauhinia, Cercis and Tamarindus, the relative positions of Tamarindus indica, Bauhinia brachycarpa and Cercis glabra were permuted between the two phylogenies; and at the base of the Flemingia clade, an unassigned Flemingia sp. and Flemingia prostrata swapped places, producing a pair of crossing connectors (Figure 10C). Overall, although fewer than 10% of terminals were affected and the two datasets exhibited high concordance, the 57−gene dataset showed higher node support, further underscoring the necessity of including more genes in phylogenetic analyses.
3.8 Divergence time estimation of Flemingia
Divergence time estimation was conducted using thirty-six chloroplast genomes from Fabaceae species, along with two outgroup genomes from Cannabis and Morus. The results indicate that the initial divergence of Fabaceae lineages occurred during the Cretaceous period. Within the genus Flemingia, divergence times range from 2.72 to 0.10 million years ago (Mya), suggesting that all speciation events took place during the Neogene period. Notably, a rapid divergence occurred within a relatively short evolutionary timeframe. Specifically, F. macrophylla and F. prostrata diverged approximately 0.26 Mya (Figure 11).
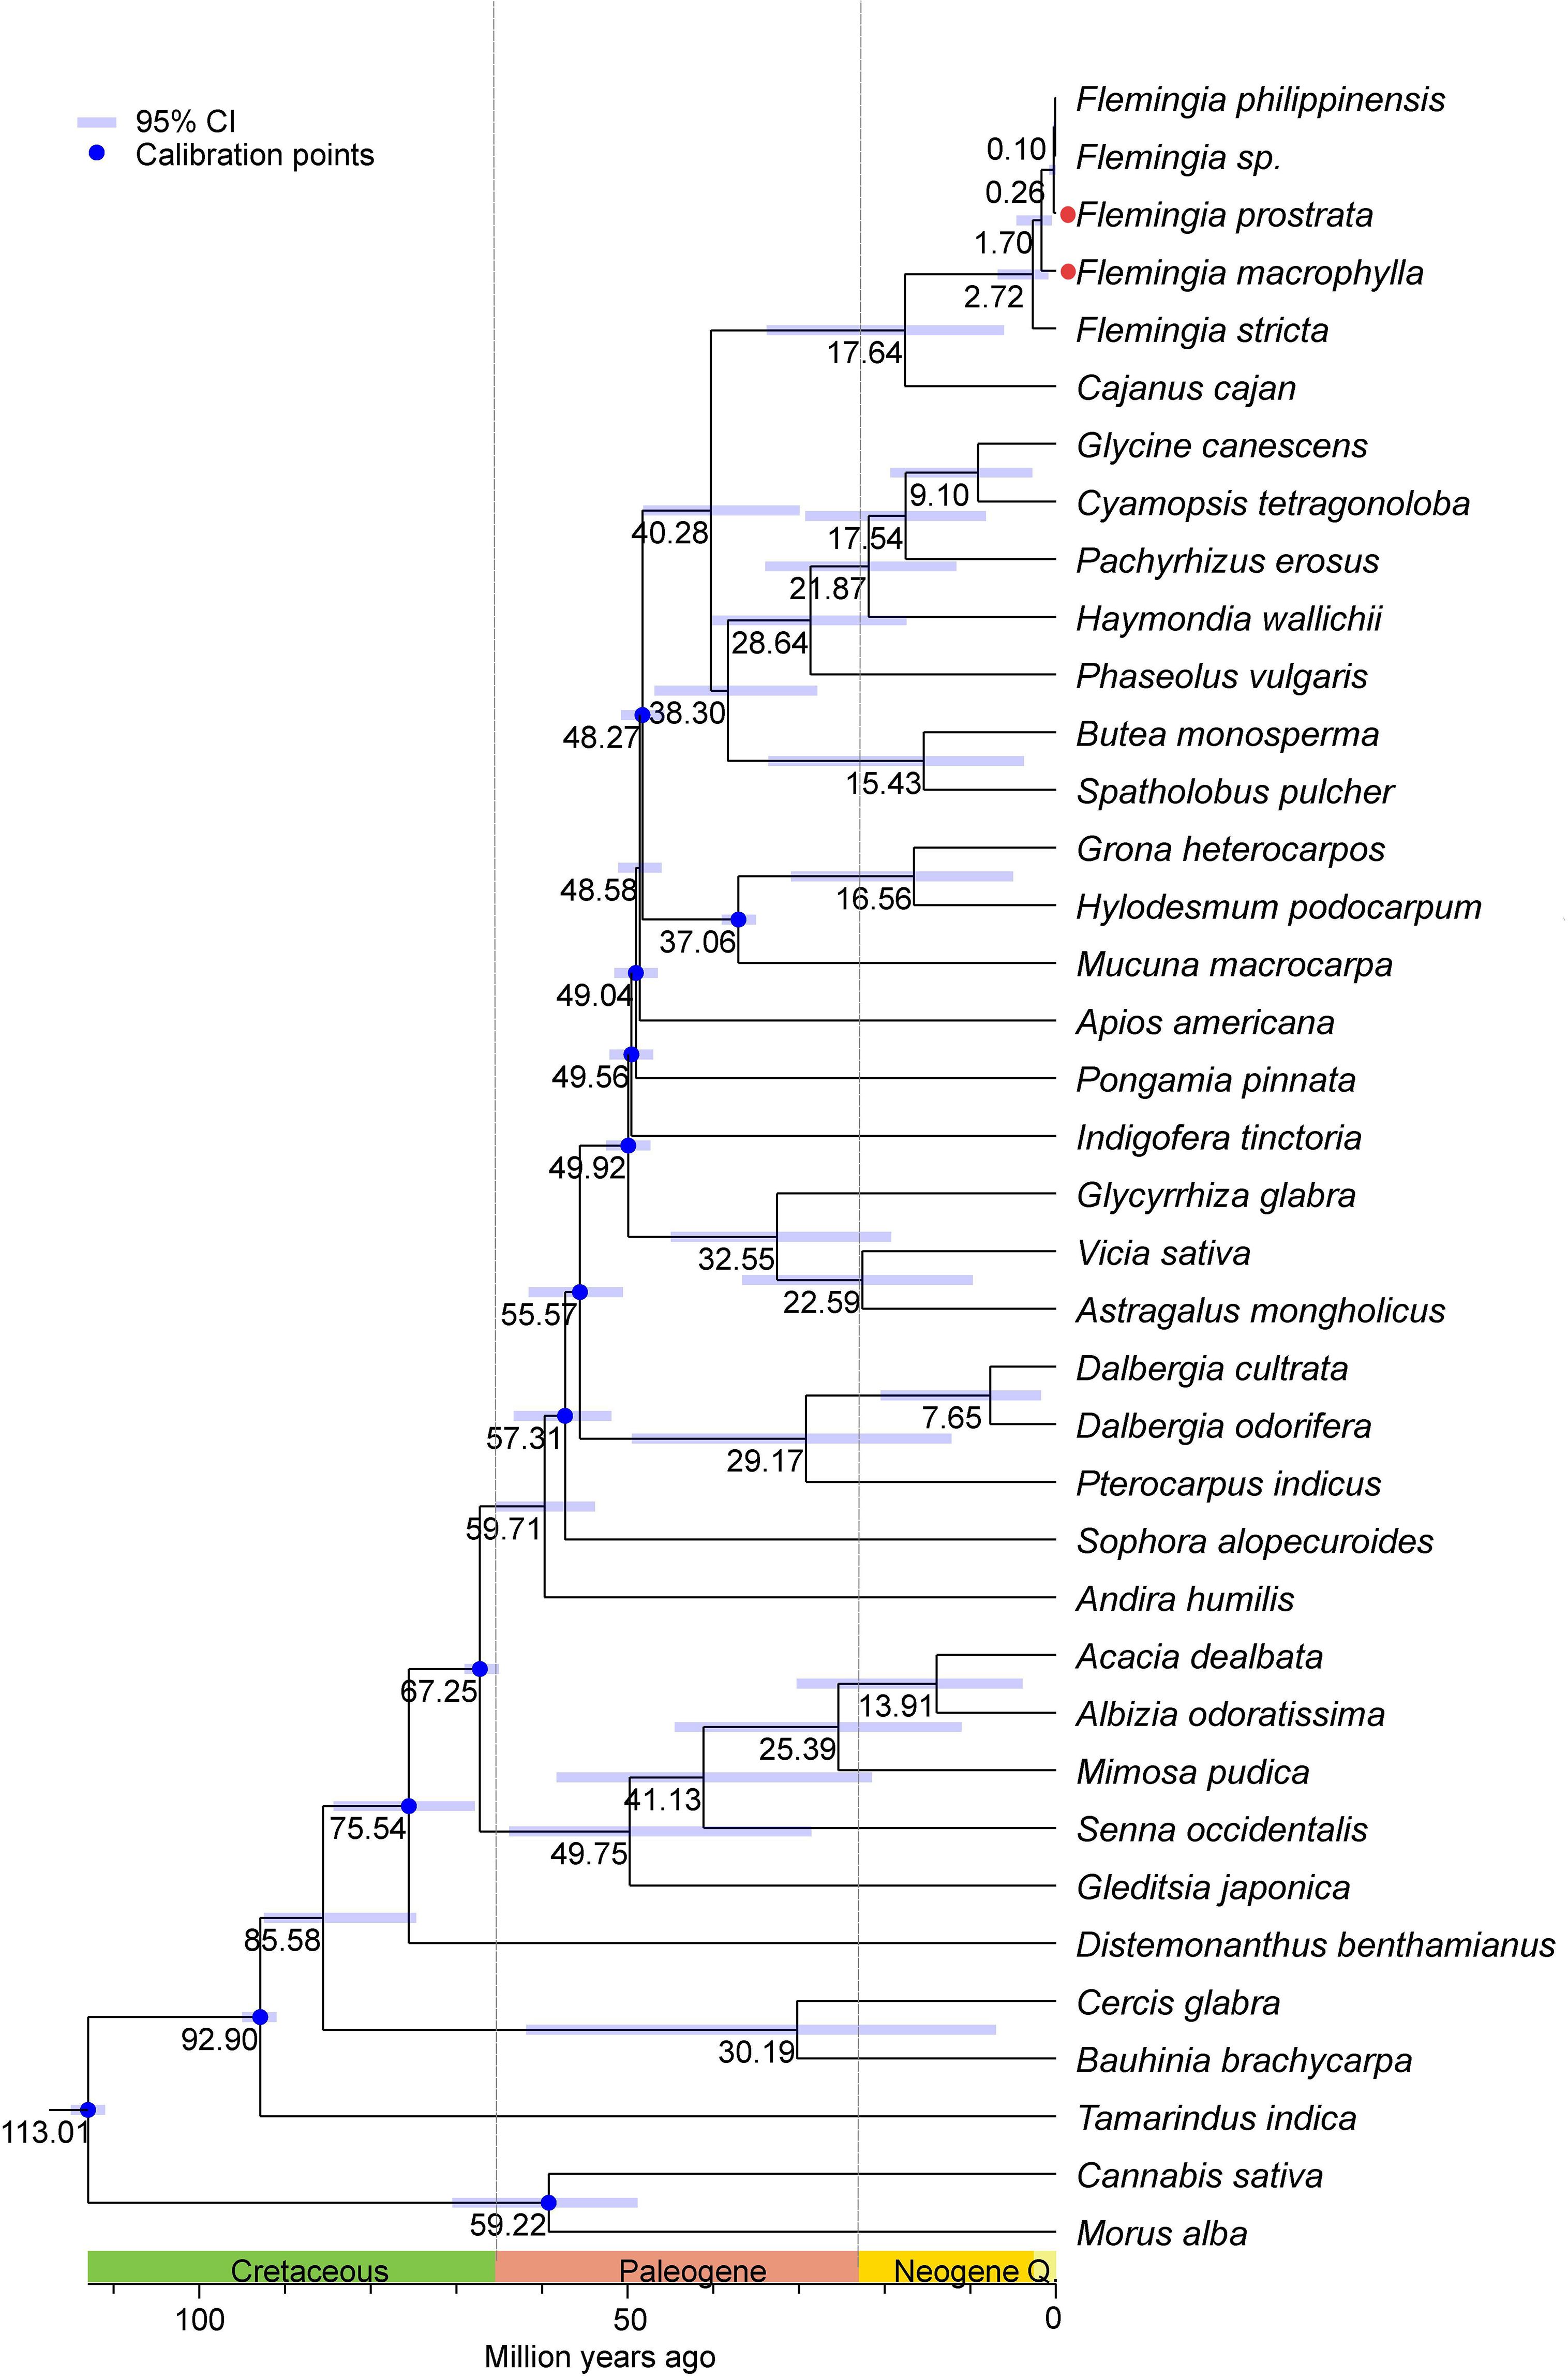
Figure 11. Divergence times estimation based on the 38 complete chloroplast genomes. The numbers near the nodes represent the divergence time (Mya: millions of years ago). Blue indicates the node used to correct the clock. divergence time of the nodes is shown at the nodes with black. The blue bars correspond to 95% HPD of estimated divergence time, with minimum and maximum values, respectively.
3.9 SSR molecular identification of F. macrophylla and F. prostrata
To effectively distinguish between the two target species (F. macrophylla and F. prostrata), ten primer pairs were designed and synthesized based on chloroplast SSR (cpSSR) information. Subsequently, PCR amplification and gel electrophoresis were conducted. The results indicated that six primer pairs (Primer 3, Primer 4, Primer 5, Primer 6, Primer 8, and Primer 10) successfully differentiated the two species (Figure 12).
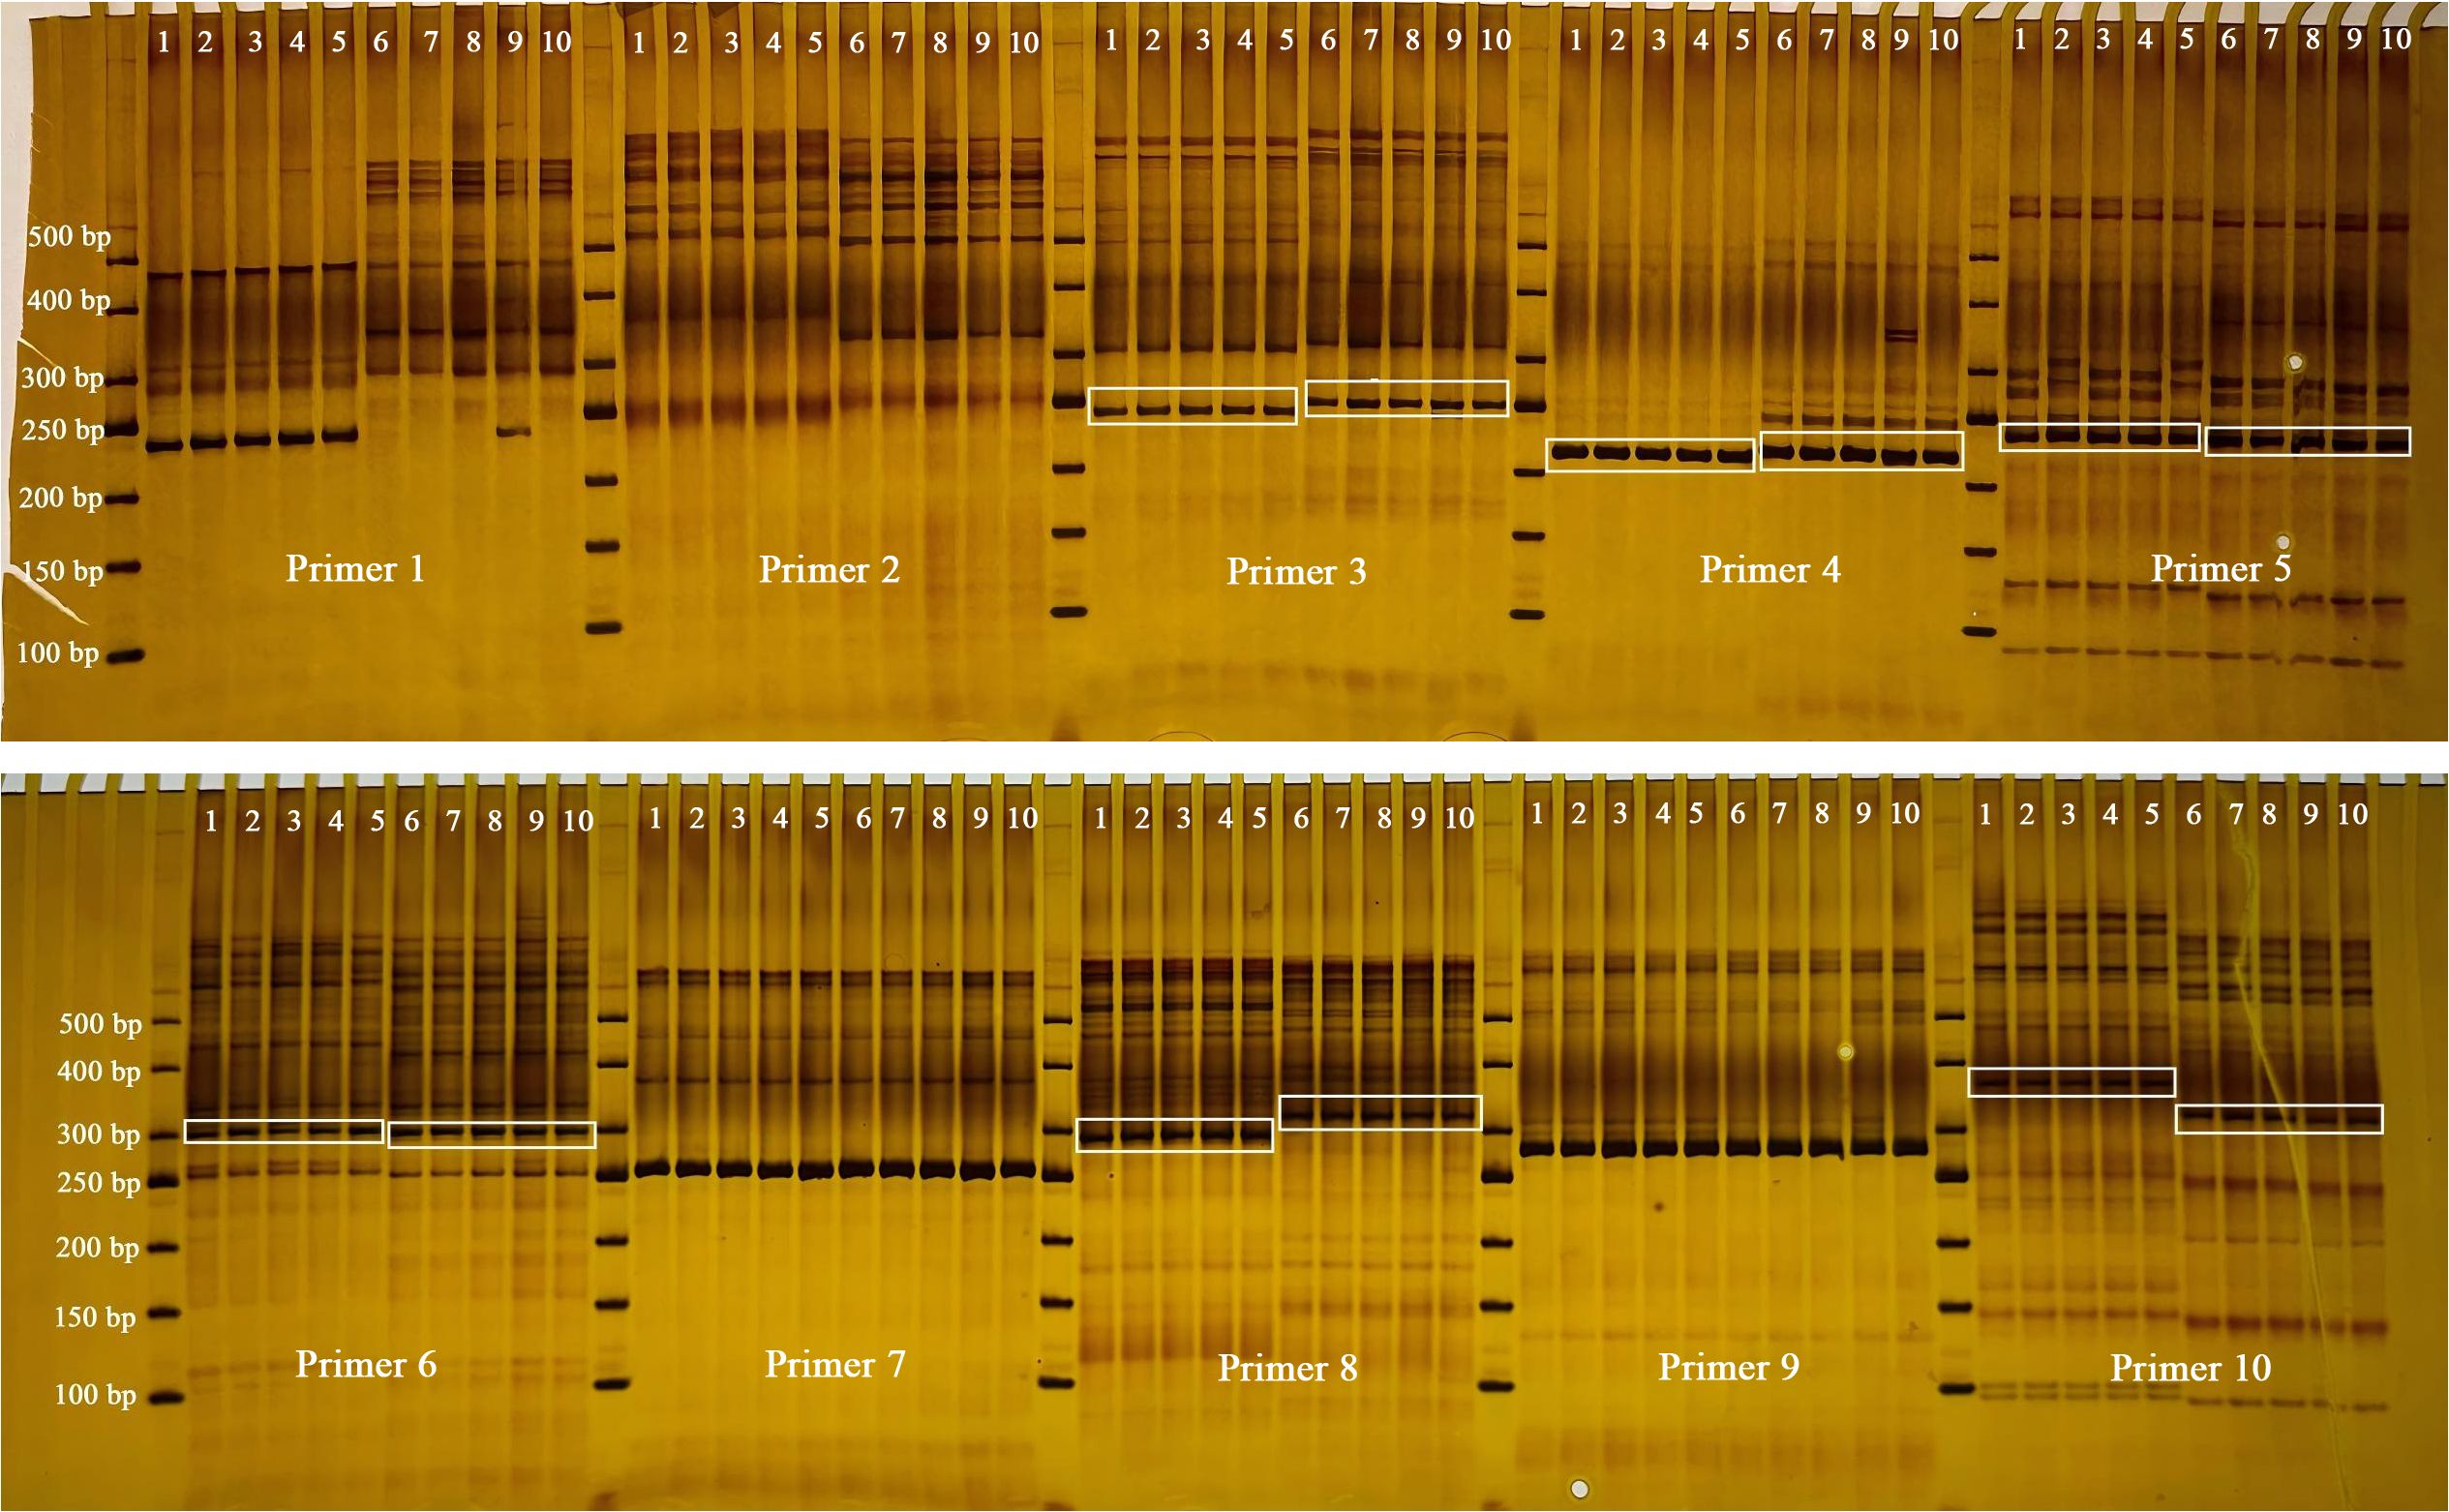
Figure 12. cpSSR electrophoresis results. Lane 1-5: Individual plants of F. prostrata; Lane 6-10: Individual plants of F. macrophylla.
4 Discussion
In this study, the cp genomes of F. macrophylla and F. prostrata, with lengths ranging from 152,937 to 153,033 bp (Table 1), were sequenced using the Illumina NovaSeq 6000 platform. Both cp genomes showed a typical quadripartite structure, and this was consistent with previous studies on other angiosperms (Liu et al., 2022). Moreover, each Flemingia species cp genome encoded 129 genes (8 ribosomal RNAs, 83 coding sequences, 37 transfer RNAs, and 1 pseudogene) (Table 2). The genome features, including genome length, gene count, GC content, and SSR patterns, were similar to those of other Fabaceae members (Feng et al., 2022).
Studies on cp genomes have demonstrated the important role of repetitive sequences in events such as duplication, deletion, and rearrangement, and have also investigated phylogeny and genome recombination in Schisandraceae (Li and Zheng, 2018). Here, the repeat sequence analysis showed that a total of 60 and 64 repeat sequences were identified in F. macrophylla and F. prostrata, respectively, both predominantly ranging from 30–35 bp in length. The differences in repeat sequences may offer valuable insights for the development of molecular markers and the phylogenetic differentiation of the two Flemingia species. cpSSRs, as significant molecular markers, exhibit a greater classification distance than nuclear and mitochondrial microsatellites. This feature has been extensively utilized in studies concerning plant population genetics, polymorphism, and evolution (Yue et al., 2023). At present, the application of cpSSR has been reported in Liriodendron chinense (Li et al., 2020), Panicum virgatum (Zalapa et al., 2011), and Mimosa scabrella (Saiki et al., 2017). In this study, 669 SSRs were identified, including mono-, di-, tri-, and tetranucleotide repeats, and these SSRs in cp genomes frequently contained mononucleotide repeats of A/T bases. It was consistent with previously published cp genomes of other plants (Huang et al., 2022). Furthermore, we also analyzed the distribution of SSRs in the cp genomes of two Femingia species. Most SSRs were identified in the intergenic regions of the LSC regions, whereas they were predominantly located in the exon of the IR region, suggesting an uneven distribution of SSRs and demonstrating that the non-coding region exhibited greater variability than the coding region in the cp genomes of two Femingia species. This aligns with previous reports on the variability of non-coding regions in cp genomes of other angiosperms (Chen et al., 2015).
The expansion and contraction of the IR, LSC, and SSC regions, which are common phenomena for the evolution process, result in variations in the length of cp genomes (Gu et al., 2020). Here, within the five Flemingia species, rps19, ycf1/ndhF, and ycf1 were present at the junction of JLB, JSB, and JSA regions, respectively, while rpl2 and trnH were nearly located on both sides of JLA (Figure 6). It was indicated that the boundary of IR, LSC, and SSC regions of five Flemingia species was relatively conservative. Meanwhile, we also observed some variations in the boundary between IR and LSC or SSC of the cp genomes of five Flemingia species, suggesting differences in their genome lengths.
Codon bias is recognized as an outcome of natural selection, mutation, and genetic drift in diverse organisms (Hong et al., 2020). Two Flemingia species showed the same codon, however, variations were observed in the quantity and composition of codons, with distinct preferences among them. Most amino acids exhibited a preference for codons with A/U as the third nucleotide (Supplementary Table S4). It was consistent with the research findings of Tang et al. (2022). In addition, our findings indicated significant similarity in the RSCU values between the two Flemingia species, suggesting that they may undergo similar environmental pressures.
The cp genomes contain extensive genetic information, offering valuable insights into plant phylogenetic relationships (Jansen et al., 2007). Advances in complete cp genome sequencing have established new platforms and frameworks for systematic studies of medicinal plants. In recent years, publications of cp genomes from multiple Fabaceae subfamilies, including Caesalpinioideae, Papilionoideae, Cercidoideae, Duparquetioideae, Detarioideae, and Dialioideae, have generated critical data for reconstructing the evolution and phylogeny of medicinal Fabaceae species. Our cp genome-based phylogeny groups F. macrophylla and F. prostrata (both documented medicinal plants in the Chinese Pharmacopoeia) within Caesalpinioideae, with Cajanus cajan as their closest relative (Figure 10). This aligns with prior nuclear gene analyses of 333 Fabaceae genera, which proposed a close relationship between F. macrophylla and a clade containing Dolichos, Dunbaria, Cajanus, and Rhynchosia (Zhao et al., 2021). Our study demonstrated that the phylogenetic results based on the CDS of 57 chloroplast genes were robust, providing an important reference for molecular phylogenetic studies of Fabaceae at the generic level, and also indicating the necessity of including additional molecular markers in phylogenetic analyses within the genus Flemingia. The results obtained here can serve as a valuable reference for molecular phylogeny research in the Fabaceae family, specifically about the contributions of F. macrophylla and F. prostrata to plant systematics and evolution. These results provide a robust molecular phylogenetic reference for Fabaceae research, particularly regarding the systematic and evolutionary significance of F. macrophylla and F. prostrata.
Despite clear morphological distinctions between F. macrophylla and F. prostrata, their dried medicinal materials are challenging to identify in commercial markets. Moreover, their chloroplast genomes remain uncharacterized. Thus, we performed de novo assembly of chloroplast genomes via high-throughput sequencing and developed species-specific authentication markers using identified SSR loci. Six cpSSR primer pairs successfully discriminated the two species (Figure 12). This study lays the foundation for enriching the molecular data and phylogenetic insights of this genus, as well as for the safe application of medicinal materials.
5 Conclusions
In this study, the cp genomes of F. prostrata and F. macrophylla were sequenced and analyzed. The results revealed that both cp genomes exhibited conserved genome structures, gene information, GC content, codon usage patterns, SSRs, and long repeats. A total of 669 SSRs and 124 scattered repeats were identified across the cp genomes of the two Flemingia species, while 286 SNPs and 104 indels were detected between the two cp genomes. Selection pressure analysis indicated that nine genes were under purifying selection. Nucleotide variability analysis revealed that the psaJ-rps18 displayed the highest level of variation. Phylogenetic analyses supported a close evolutionary relationship between Flemingia and Cajanus. Divergence time estimation suggested that F. macrophylla and F. prostrata diverged approximately 0.26 Mya. Six cpSSR primer pairs effectively differentiated the two species. This study provides molecular evidence for distinguishing F. prostrata and F. macrophylla, contributing to the enrichment of molecular resources and phylogenetic understanding of the genus Flemingia, and supporting the accurate identification and safe use of its medicinal materials.
Data availability statement
The datasets presented in this study can be found in online repositories. The names of the repository/repositories and accession number(s) can be found in the article/Supplementary Material.
Author contributions
FW: Data curation, Funding acquisition, Writing – original draft. YaL: Investigation, Resources, Writing – original draft. DT: Conceptualization, Data curation, Formal analysis, Writing – review & editing. YiL: Supervision, Conceptualization, Investigation, Funding acquisition, Writing – review & editing. SQ: Supervision, Conceptualization, Investigation, Funding acquisition, Writing – review & editing.
Funding
The author(s) declare financial support was received for the research and/or publication of this article. This research was funded by the National Natural Science Foundation of China (82260749), the Natural Science Foundation of Guangxi Zhuang Autonomous Region (2023GXNSFAA026487), Scientific Research Funding Project of Guangxi Botanical Garden of Medicinal Plants (GuiYaoJi202102), and Guangxi Science and Technology Project (GuiKe ZY20198018).
Conflict of interest
The authors declare that the research was conducted in the absence of any commercial or financial relationships that could be construed as a potential conflict of interest.
Generative AI statement
The author(s) declare that no Generative AI was used in the creation of this manuscript.
Any alternative text (alt text) provided alongside figures in this article has been generated by Frontiers with the support of artificial intelligence and reasonable efforts have been made to ensure accuracy, including review by the authors wherever possible. If you identify any issues, please contact us.
Publisher’s note
All claims expressed in this article are solely those of the authors and do not necessarily represent those of their affiliated organizations, or those of the publisher, the editors and the reviewers. Any product that may be evaluated in this article, or claim that may be made by its manufacturer, is not guaranteed or endorsed by the publisher.
Supplementary material
The Supplementary Material for this article can be found online at: https://www.frontiersin.org/articles/10.3389/fpls.2025.1591427/full#supplementary-material
References
Chen, J., Hao, Z., Xu, H., Yang, L., Liu, G., Sheng, Y., et al. (2015). The complete chloroplast genome sequence of the relict woody plant Metasequoia glyptostroboides Hu et Cheng. Front. Plant Sci. 6, 447. doi: 10.3389/fpls.2015.00447
China Institute for the Control of Pharmaceutical and Biological Products and Yunnan Institute for Drug Control (1990). Ethnography of Chinese Medicine (Volume 2) (Beijing: People's Medical Publishing House).
China Pharmacopoeia Committee (2020). Pharmacopoeia of the People's Republic of China (Vol.IV) (Beijing: Medicinal Science and Technology of China Press).
Darling, A., Mau, B., Blattner, F. R., and Perna, N. (2004). Mauve: multiple alignment of conserved genomic sequence with rearrangements. Genome Res. 14, 1394–1403. doi: 10.1101/gr.2289704
Dong, W., Liu, H., Xu, C., Zuo, Y., Chen, Z., and Zhou, S. (2014). A chloroplast genomic strategy for designing taxon specific DNA mini-barcodes: a case study on ginsengs. BMC Genet. 15, 138. doi: 10.1186/s12863-014-0138-z
Dong, W., Liu, J., Yu, J., Wang, L., and Zhou, S. (2012). Highly variable chloroplast markers for evaluating plant phylogeny at low taxonomic levels and for DNA barcoding. PloS One 7, e35071. doi: 10.1371/journal.pone.0035071
Feng, Y., Gao, X. F., Zhang, J. Y., Jiang, L. S., Li, X., Deng, H. N., et al. (2022). Complete chloroplast genomes provide insights into evolution and phylogeny of Campylotropis (Fabaceae). Front. Plant Sci. 13, 895543. doi: 10.3389/fpls.2022.895543
Gu, L., Su, T., An, M. T., and Hu, G. X. (2020). The complete chloroplast genome of the vulnerable Oreocharis esquirolii (Gesneriaceae): structural features, comparative and phylogenetic analysis. Plants-Basel 9, 1692. doi: 10.3390/plants9121692
Ho, H. Y., Wu, J. B., and Lin, W. C. (2011). Flemingia macrophylla extract ameliorates experimental osteoporosis in ovariectomized rats. Evid. Based. Complement. Alternat. Med. 2011, 752302. doi: 10.1093/ecam/nep179
Hong, Z., Wu, Z., Zhao, K., Yang, Z., Zhang, N., Guo, J., et al. (2020). Comparative analyses of five complete chloroplast genomes from the genus Pterocarpus (Fabacaeae). Int. J. Mol. Sci. 21, 3758. doi: 10.3390/ijms21113758
Huang, Y., Li, J., Yang, Z., An, W., Xie, C., Liu, S., et al. (2022). Comprehensive analysis of complete chloroplast genome and phylogenetic aspects of ten Ficus species. BMC Plant Biol. 22, 253. doi: 10.1186/s12870-022-03643-4
Jansen, R. K., Cai, Z., Raubeson, L., Daniell, H., Depamphilis, C. W., Leebens-Mack, J., et al. (2007). Analysis of 81 genes from 64 plastid genomes resolves relationships in angiosperms and identifies genome-scale evolutionary patterns. Proc. Natl. Acad. Sci. U. S. A. 104, 19369–19374. doi: 10.1073/pnas.0709121104
Jia, M. R. and Li, X. W. (2005). Ethno-medicine records of China (Beijing: China Medicine and Technology Publishing House), 216–217.
Katoh, K. and Standley, D. M. (2013). MAFFT multiple sequence alignment software version 7: improvements in performance and usability. Mol. Biol. Evolution. 30, 772–780. doi: 10.1093/molbev/mst010
Kress, W. J., Wurdack, K. J., Zimmer, E., Weigt, L. A., and Janzen, D. H. (2005). Use of DNA barcodes to identify flowering plants. Proc. Natl. Acad. Sci. U S A. 102, 8369–8374. doi: 10.1073/pnas.0503123102
Lai, W. C., Tsui, Y. T., Singab, B. A., El-Shazly, M., Du, Y. C., Hwang, T., et al. (2013). Phyto-SERM constitutes from Flemingia macrophylla. Int. J. Mol. Sci. 14, 15578–15594. doi: 10.3390/ijms140815578
Li, B., Lin, F., Huang, P., Guo, W., and Zheng, Y. (2020). Development of nuclear SSR and chloroplast genome markers in diverse Liriodendron chinense germplasm based on low-coverage whole genome sequencing. Biol. Res. 53, 21. doi: 10.1186/s40659-020-00289-0
Li, B. and Zheng, Y. (2018). Dynamic evolution and phylogenomic analysis of the chloroplast genome in Schisandraceae. Sci. Rep-Uk. 8, 9285. doi: 10.1038/s41598-018-27453-7
Liu, Y., Li, Y., Feng, S., Wang, J., Huang, Y., and Yang, M.. (2022). Complete chloroplast genome structure of four Ulmus species and Hemiptelea davidii and comparative analysis within Ulmaceae species. Sci. Rep-Uk. 12, 15953. doi: 10.1038/s41598-022-20184-w
Niu, S. L., Tong, Z. F., Lv, T. M., Wu, J., Yu, Y., Tian, J. L., et al. (2021). Prenylated isoflavones from the roots of Flemingia philippinensis as potential inhibitors of β-amyloid aggregation. Fitoterapia 155, 105060. doi: 10.1016/j.fitote.2021.105060
Revell, L. J. (2012). phytools: An R package for phylogenetic comparative biology (and other things). Methods Ecol. Evol. 3, 217–223. doi: 10.1111/j.2041-210X.2011.00169.x
Rozas, J., Ferrer-Mata, A., Sanchez-DelBarrio, J., Guirao-Rico, S., Librado, P., Ramos-Onsins, S., et al. (2017). DnaSP 6: DNA sequence polymorphism analysis of large data sets. Mol. Biol. Evol. 34, 3299–3302. doi: 10.1093/molbev/msx248
Saiki, F. A., Bernardi, A. P., Reis, M. S., Faoro, H., Souza, E. M., Pedrosa, F. O., et al. (2017). Development and validation of the first SSR markers for Mimosa scabrella Benth. Genet. Mol. Res. 16, 10. doi: 10.4238/gmr16019571
Schindel, D. E. and Miller, S. E. (2005). DNA barcoding a useful tool for taxonomists. Nature 435, 17–17. doi: 10.1038/435017b
She, Y. H., Yang, D. Q., and Ding, Y. (2022). Study on the quality standard of ethnic minority herbal medicines Flemingia Philippinensis decoction pieces. Drug Evaluation. 19, 1116–1120. doi: 10.19939/j.cnki.1672-2809.2022.18.07
Song, L. R., Hong, X., Ding, X. L., and Zang, Z. Y. (2001). Dictionary of Modern Chinese Materia Medica (Beijing: Beijing. People's Medical Publishing House).
Stamatakis, A. (2014). RAxML Version 8: A tool for Phylogenetic Analysis and post-analysis of large phylogenies. Bioinformatics 30, 1312–1313. doi: 10.1093/bioinformatics/btu033
Tang, D., Lin, Y., Wei, F., Quan, C., Wei, K., Wei, Y., et al. (2022). Characteristics and comparative analysis of Mesona chinensis Benth chloroplast genome reveals DNA barcode regions for species identification. Funct. Integr. Genomics 22, 467–479. doi: 10.1007/s10142-022-00846-8
Wang, R. J., Cheng, C. L., Chang, C. C., Wu, C. L., Su, T. M., and Chaw, S. M. (2008). Dynamics and evolution of the inverted repeat-large single copy junctions in the chloroplast genomes of monocots. BMC Evol. Biol. 8, 36. doi: 10.1186/1471-2148-8-36
Wu, Z. Y. (1991). Essentials of new China meteria medica (Shanghai: Shanghai Science and Technology Press), 135–204.
Wu, Q. J. (2003). Zhiwu Mingshi Tukao (Volume 1119 of the Supplements for Siku quanshu) (Shanghai: Shanghai Classics Publishing House), 236–237.
Yan, D., Xia, B., Li, C., Liu, S., Li, Y., Liao, D., et al. (2016). Research progress on medicinal plants of Flemingia Roxb. ex W. T. Ait. Chin. Traditional Herbal Drugs 47, 4456–4471. doi: 10.7501/jissn.0253-2670.2016.24.027
Yue, Y., Li, J., Sun, X., Li, Z., and Jiang, B. (2023). Polymorphism analysis of the chloroplast and mitochondrial genomes in soybean. BMC Plant Biol. 23, 15. doi: 10.1186/s12870-022-04028-3
Zalapa, J. E., Price, D. L., Kaeppler, S. M., Tobias, C. M., Okada, M., and Casler, M. D. (2011). Hierarchical classification of switchgrass genotypes using SSR and chloroplast sequences: ecotypes, ploidies, gene pools, and cultivars. Theor. Appl. Genet. 122, 805–817. doi: 10.1007/s00122-010-1488-1
Zhang, Z., Li, J., Zhao, X. Q., Wang, J., Wong, G. K., and Yu, J.. (2006). KaKs_Calculator: calculating Ka and Ks through model selection and model averaging. Genomics Proteomics Bioinf. 4, 259–263. doi: 10.1016/S1672-0229(07)60007-2
Zhao, Y., Zhang, R., Jiang, K. W., Qi, J., Hu, Y., Guo, J., et al. (2021). Nuclear phylotranscriptomics and phylogenomics support numerous polyploidization events and hypotheses for the evolution of rhizobial nitrogen-fixing symbiosis in Fabaceae. Mol. Plant 14, 748–773. doi: 10.1016/j.molp.2021.02.006
Zheng, Y., Zhang, P., He, J., Fu, K., Zhang, Y., He, F., et al. (2022). Study on medicinal materials grade evaluation of. Moghania macrophylla. J. Hunan Univ. Chin. Med. 42, 200–205. doi: 10.3969/j.issn.1674-070X.2022.02.006
Keywords: Flemingia, SSR, Fabaceae, phylogenetic analysis, genome comparison
Citation: Wei F, Lin Y, Tang D, Liang Y and Qin S (2025) Comparative analysis of complete chloroplast genomes of Flemingia prostrata and Flemingia macrophylla, two commonly used medicinal plants in southern China. Front. Plant Sci. 16:1591427. doi: 10.3389/fpls.2025.1591427
Received: 11 March 2025; Accepted: 24 July 2025;
Published: 18 August 2025.
Edited by:
Xiaojun Nie, Northwest A&F University, ChinaReviewed by:
Jose Planta, University of the Philippines Diliman, PhilippinesLicao Cui, Jiangxi Agricultural University, China
Copyright © 2025 Wei, Lin, Tang, Liang and Qin. This is an open-access article distributed under the terms of the Creative Commons Attribution License (CC BY). The use, distribution or reproduction in other forums is permitted, provided the original author(s) and the copyright owner(s) are credited and that the original publication in this journal is cited, in accordance with accepted academic practice. No use, distribution or reproduction is permitted which does not comply with these terms.
*Correspondence: Danfeng Tang, dGRmbWFudXNjcmlwdEAxNjMuY29t; Ying Liang, MTk4eWluZ3ppQDE2My5jb20=; Shuangshuang Qin, cWluX2RvdWJsZUAgMTI2LmNvbQ==