 Marie Højmark Fischer
 Agnieszka Rzepczynska
 Rasmus Kjøller1
- 1Section of Terrestrial Ecology, Institute of Science, Department of Biology, Copenhagen University, Copenhagen, Denmark
- 2Section of Microbial Ecology, Department of Biology, Lund University, Lund, Sweden
Wheat (Triticum aestivum L.) is a major crop grown on all continents. Due to environmental concerns, it is desirable to reduce the inputs of both chemical pesticides and inorganic fertilizers. However, yield reduction must be expected when switching to low-input systems. To mitigate such losses, the use of natural or introduced microbiomes may provide the key to maintaining sustainable yield. Phyllosphere fungi, both endophytic and phylloplane-associated, colonize aboveground plant structures, some of which have the potential to mitigate biotic and abiotic stressors. A first step toward realizing the potential of the wheat microbiome is to map the current knowledge on wheat phyllosphere fungi. This meta-analysis aims to map the diversity and abundance of fungal taxa associated with the wheat phyllosphere across global wheat-producing areas. To this end, we searched previous published literature and retrieved fungal community data from relevant studies. Retrieved studies included both culturing-based and metabarcoding amplicon sequence-based studies. We retrieved and analyzed 33 studies from five regions across the world, which differed greatly in their taxonomic composition. Across all regions, we found that while the majority of identified genera were unique to individual studies, some genera occurred across all five wheat growing regions, specifically Alternaria, Aspergillus, Bipolaris, Candida, Chaetomium, Cladosporium, Epicoccum, Fusarium, Nigrospora, Penicillium, Pyrenophora, Stemphylium and Trichoderma. Furthermore, we identified that while community composition differed between wheat growing regions, the identification method used was the most significant factor determining the depiction of community composition. We also highlight a lack of research in important wheat growing regions that are important for global wheat production. These considerations and other knowledge gaps are used to pinpoint future research.
1 Introduction
Wheat (Triticum aestivum L.) is one of the most widely cultivated crops, providing a stable source of nutrients for approximately 40 percent of the worlds population (Acevedo et al., 2018). With more than 218 million hectares across multiple climatic regions, it covers more land than any other commercial crop (Giraldo et al., 2019). Since the green revolution in the 1960s, global wheat production has increased tremendously to approximately 790 million metric tons annually (USDA, 2024), largely due to the increased input of mineral fertilizers and synthetic pesticides (Acevedo et al., 2018). Owing to environmental concerns, reduced inputs of both chemical pesticides and inorganic fertilizers are needed but, 18% percent of the annual wheat production is currently lost to fungal diseases (Savary et al., 2019) and without pesticides, current yield losses are expected to increase significantly (European Commission et al., 2022; Henning et al., 2021). Thus, alternative strategies are needed.
One promising approach is the utilization of plant-associated microbiomes, particularly the fungal communities inhabiting the wheat phyllosphere. The phyllosphere encompasses all aboveground plant structures, including leaves, stems, and flowers, and hosts diverse microbial populations. These microbial populations include fungi and bacteria, both residing on the surface (phylloplane) and within leaf tissues (endosphere) (Sohrabi et al., 2023). These fungi exhibit varied ecological roles, including mutualism, saprotrophy, and pathogenicity. Many endophytic fungi, for example, have been shown to benefit their hosts in various ways (Peñuelas and Terradas, 2014). These benefits include host growth promotion, increased stress resistance, and protection against fungal diseases and insect damage (Hawkes et al., 2021). Pathogen infection resistance can be induced directly, for example, through secondary metabolites released by the fungal endosymbiont, and indirectly by inducing physiological changes in the plant host (Pusztahelyi et al., 2015). The presence of endophytic fungi also battles pathogens through ecological mechanisms, by occupying the niche in the plant host, thus preventing other pathogens from establishing (Gao et al., 2010). Understanding the diversity and distribution of wheat-associated fungi is crucial for harnessing their potential in sustainable agriculture.
Historically, studies of the wheat phyllosphere mycobiome relied on culturing techniques, favoring culturable fast-growing and high-nutrient-favoring organisms (Rhoads et al., 2012). In recent years, meta-amplicon and meta-genome sequencing have allowed for taxonomic identification of whole communities without this bias albeit primer biases and sequencing errors remains an issue (Forry et al., 2024). Determining whether a microbe colonizes the phylloplane, endosphere, or both, is also a challenge. Most studies either identify all microbes in the phyllosphere or attempt to only address endophytes by surface sterilization of the plant material used before isolation or amplification.
Despite growing interest in the wheat phyllosphere microbiome on a local level, the taxonomic composition and geographic variation on a global level remain poorly characterized. A comprehensive synthesis of available data is necessary to identify patterns, research gaps, and future directions. In this review, we present the current knowledge based on the taxonomic composition of the wheat mycobiome identified from previous studies. We mined through publicly available, peer-reviewed literature on the above-ground mycobiome of wheat. We included studies in which fungi were isolated into pure cultures, followed by morphological identification or identification following Sanger sequencing of the ITS region, and more recent studies that implemented meta-barcoding identification methods. Specifically, we asked the following questions: 1) How is research on the wheat phyllosphere mycobiome distributed geographically? 2) Which species and genera are consistently found across wheat-growing regions? 3) How do fungal community compositions vary by region and identification method? 4) What are the dominant lifestyles/strategies of these fungi? By integrating data across global wheat-producing regions, this study aims to identify taxonomic patterns, highlight research gaps, and propose future directions for leveraging phyllosphere fungi in sustainable wheat production.
2 Materials and methods
2.1 Literature search
Literature published until 2023 identifying fungi in the wheat phyllosphere was mined by combining various search terms (Wheat, Triticum, Fungi, Fungal community, Mycobiome, Microbiome, Pathogen, Screening) using Google Scholar and Web of Science. In studies including both fungal and bacterial communities, only the results for the fungal community were extracted. For studies that investigated the mycobiome of various crops, only the results concerning Triticum spp. were extracted. Only studies published in English and which identified at least five fungal genera were included.
2.2 Data collection
Metadata was extracted from each paper, including identification method (culture-based vs. metabarcoding), sample type (leaf, stem and/or grain), surface sterilization (yes/no), climate zone based on the köppen classification (Köppen, 1936) and geographical location of sampling sites. For a complete list of meta data extracted, see Supplementary Table 1. For each study, fungal genera (Supplementary Table 2) and species (Supplementary Table 3) were extracted and taxonomic names updated using Index Fungorum (https://www.indexfungorum.org/names/names.asp). Higher-level taxonomies were assigned based on the UNITE repository (Abarenkov et al., 2024), and phylogenetic trees were generated using NCBI taxonomy tool (Schoch et al., 2020) and visualized in iTol (Letunic and Bork, 2021). Functional traits, were retrieved from the FungalTraits database (Põlme et al., 2020). Specifically, lifestyle, pathogenicity, endophytic capabilities, growth form and aquatic habitats. Most of the analysis is done on genera level, due to the high number of studies which did not identify fungi to species level.
2.3 Assigning wheat pathogenesis
Species found in more than one region and marked as pathogens in FungalTraits were manually checked for records of wheat pathogenesis (Supplementary Table 4). Potential to be a wheat pathogen was scored from 0-3, where 0 was for no records of pathogenic interactions with wheat, 1 was for records of rare and mild symptoms, 2 was for rare but severe pathogenesis or common but low pathogenesis, and 3 was for records of large-scale epidemics, high levels of toxins, or major threats to wheat production.
2.4 Geographical analysis
Geographic location of all sampling points or, if unavailable, affiliated research institutes were extracted from each study. Studies were grouped into five wheat-growing regions, namely North America, South America, Northern Europe (north of the Pyrenees and the Alps), Mediterranean, and Asia. Regions were assigned based on climatic similarity, wheat production volume (FAO, 1998), and geographic proximity. The countries included in each region are listed in Supplementary Table 5 and the geographical locations of sampling points are listed in Supplementary Table 6. Sampling locations were plotted in QGIS (v. 3.22) with ESRI QuickMap services (QGIS Development Team, 2024) supplemented with global wheat production data (FAO, 1998).
2.5 Statistical analysis
For the analysis of spatial autocorrelation, the Mantel test (Sokal, 1979) was used, and a single coordinate was chosen for each paper, which best represented the area of sampling. Calculations were done in R V4.3.2 (R Core Team, 2024). Distances between coordinates were calculated with the distm function in the geosphere (version 1.5-18) package (Hijmans, 2024) 41 using the haversine method. Distances in fungal communities were done using the vegdist function and the final Mantel test was performed using the Mantel function, both from the in the vegan (version 2.6-4) package (Oksanen et al., 2024). A permutational multivariate analysis of variance (PERMANOVA) using the Adonis function in R (vegan version 2.6-4) was performed to assess the influence of sample region, identification method, and pesticide use on fungal community composition.
2.6 Ranked abundance analysis
For 32 out of 33 studies where abundance data was available, the top ten most abundant genera were ranked from 1 (most abundant) to 10 (least abundant). Genera not appearing in the top ten were excluded from ranking. The average abundance rank for each genus across all the studies were calculated according to Equation 1:
Where is the average ranked abundance for a given genus, is the abundance rank of the given genus of the ith study and n is the total number of studies. Equation 1 inverts the ranked abundance such that one is the most abundant genus and ten is the least abundant genus, a format subsequently used throughout this article. The average rank abundance across regions was calculated by first calculating average ranked abundance for each genus in each region, utilizing the above formula. The ranked abundance for each genus in each region was then converted to average abundance rank across regions according to Equation 2:
Where m is the number of regions where the genus achieved a ranked score in top 10, is the average ranked abundance of a genus within the th region and is the average ranked abundance across regions. The average ranked abundance across regions was then plotted against the number of regions where a given genus was in the 10 most abundant.
3 Results
3.1 Literature summary
Our literature search identified 33 studies from 26 journals across five major wheat-growing regions (Larran et al., 2007; Perelló et al., 2002; Comby et al., 2016; Hertz et al., 2016; Karlsson et al., 2017; Karlsson et al., 2014; Knorr et al., 2019; Ofek-Lalzar et al., 2016; Rojas et al., 2020a; Rojas et al., 2020b; Sapkota et al., 2015; Vujanovic et al., 2012; Sapkota et al., 2017; Gdanetz et al., 2017; Casini et al., 2019; Schiro et al., 2019; Latz et al., 2021; Wachowska et al., 2013; Al-Khawaldeh et al., 2020; Jiang et al., 2021; Nicolaisen et al., 2014; Huang et al., 2016; Xu et al., 2018; Kaur et al., 2023; Sun et al., 2023; Sun et al., 2020; Zheng et al., 2021; Salamon et al., 2023; Hassanein et al., 2021; Malacrinò et al., 2023; Grudzinska-Sterno et al., 2016; Larran et al., 2002; Blixt et al., 2010) (Supplementary Table 1).
Among these, 39% (13 studies) used culture-dependent methods, while 61% (20 studies) used metabarcoding approaches. Approximately 61% of studies (20 studies) employed surface sterilization, aiming to identify endophytic fungi, whereas 39% (13 studies) included both epiphytic and endophytic fungi without sterilization. The studies sampled either single or multiple tissue types; 58% (19 studies) examined wheat heads or grains, 55% (18 studies) focused on leaves and 30% (10 studies) included stems. Wheat crops were grown under different conditions, with most studies sampling wheat grown in fields (20 studies, 61%) or experimental plots (8 studies, 24%). The rest sampled wheat grown in either a greenhouse or a growth chamber (5 studies, 15%).
3.2 Geographic distribution of current research
A total of 190 sampling locations across 14 countries and seven different climate zones were identified (Supplementary Tables 5, 6). Using data from Food and Agriculture Organization (FAO), five main regions relevant for global wheat production were assigned to these locations, North America, South America, Northern Europe (north of the Pyrenees and the Alps), Mediterranean and Asia. The distribution of studies was highly unequal between regions and was dominated by Northern Europe (17 studies, 51.5%) and the Mediterranean region (7 studies, 21.2%), followed by Asia (4 studies, 12.1%), South America (3 studies, 9.1%), and North America (2 studies, 6.1%). Notably, no studies were from the region surrounding the Black Sea, including Bulgaria, Romania, Ukraine, Russia, and Turkey, despite this area accounting for nearly 19% of global wheat production (FAO, 1998). Additionally, the number of sampling locations differed between the studies, from one to 51 locations per study.
3.3 Fungal diversity in the wheat phyllosphere
Across all studies, 924 fungal species belonging to 464 genera were identified. The majority belonged to Ascomycota (70.6%), followed by Basidiomycota (27.5%). The phylogenetic relationship of the fungi at genus level is shown in Figure 1.
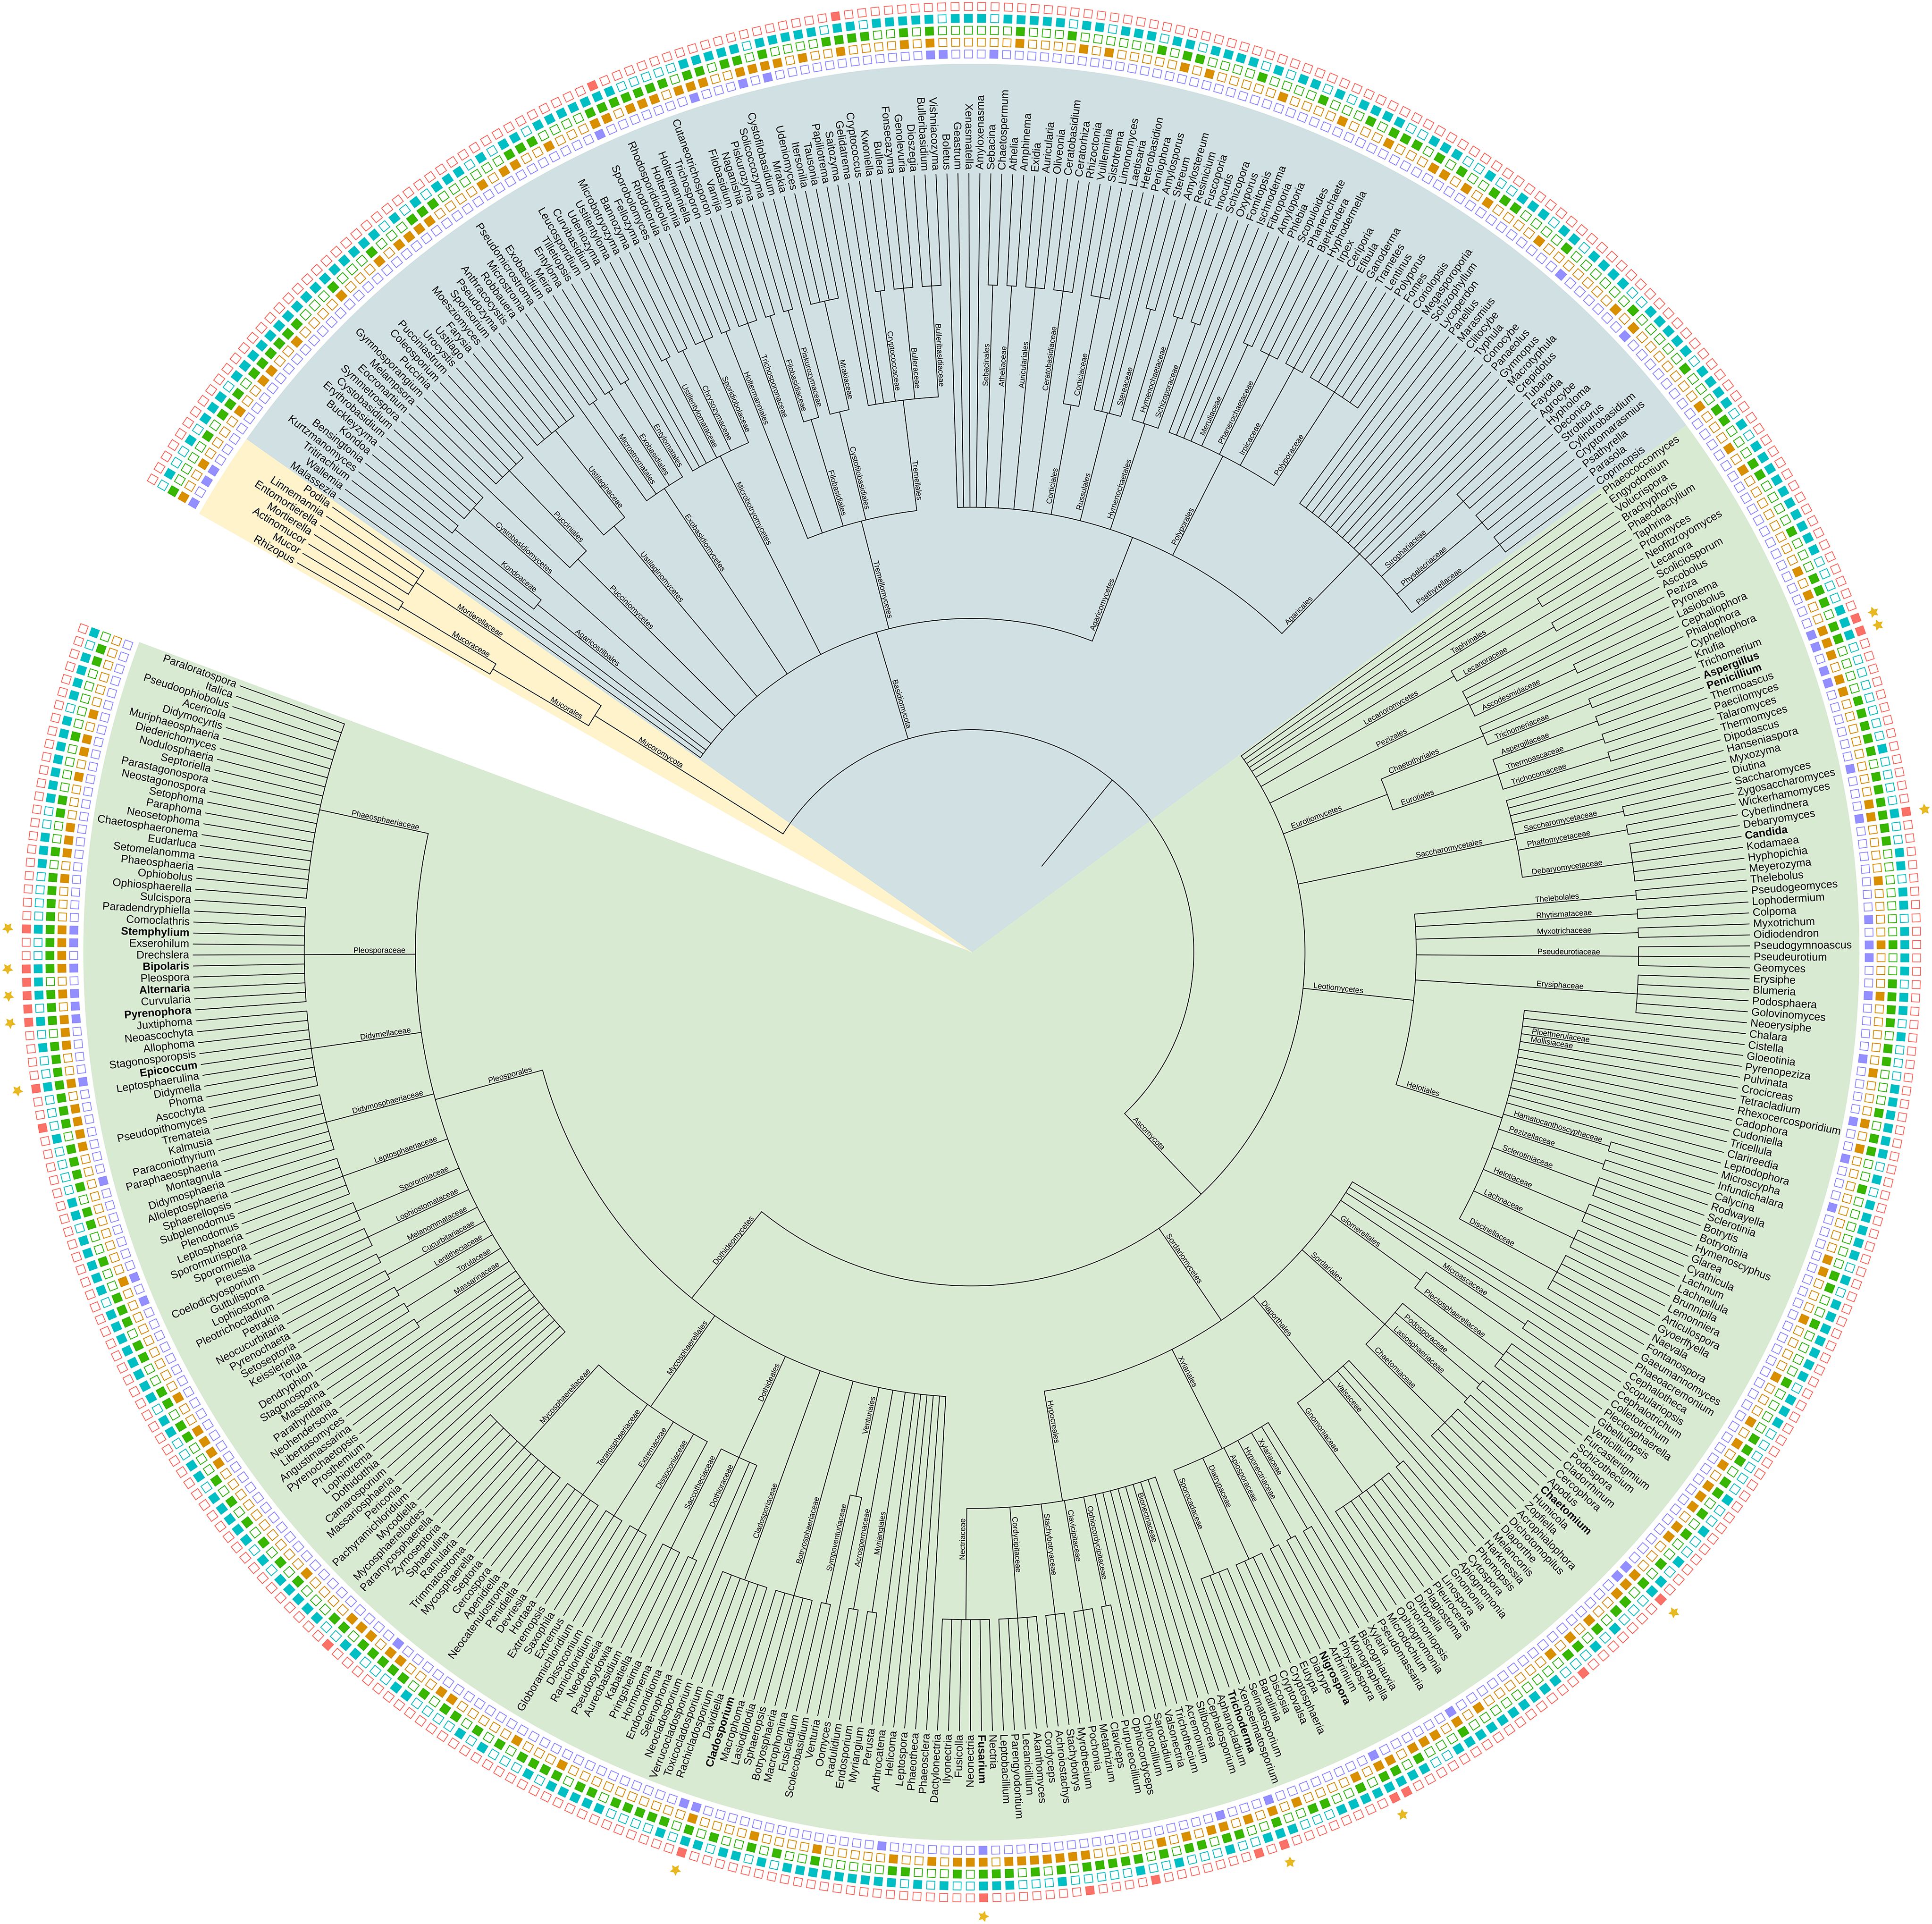
Figure 1. Phylogenetic tree of fungal genera detected in the wheat phyllosphere. Data is extracted from 33 published studies. The tree was constructed using the NCBI taxonomy browser and depicted using iTol. The presence of fungal genera in the identified wheat regions is indicated by color-filled boxes: North America (Blue), South America (Red), Northern Europe (Green), Mediterranean (Orange), and Asia (Purple). Phylum level is shown with colored branches. The green branches represent Ascomycota, blue Basidomycota, and yellow Mucoromycota. Stars indicate genera present in all five regions (High resolution version is available in Supplementary Figure 1).
Traits of interest were extracted from the FungalTraits database for each identified genera. A summary is shown in Figure 2.
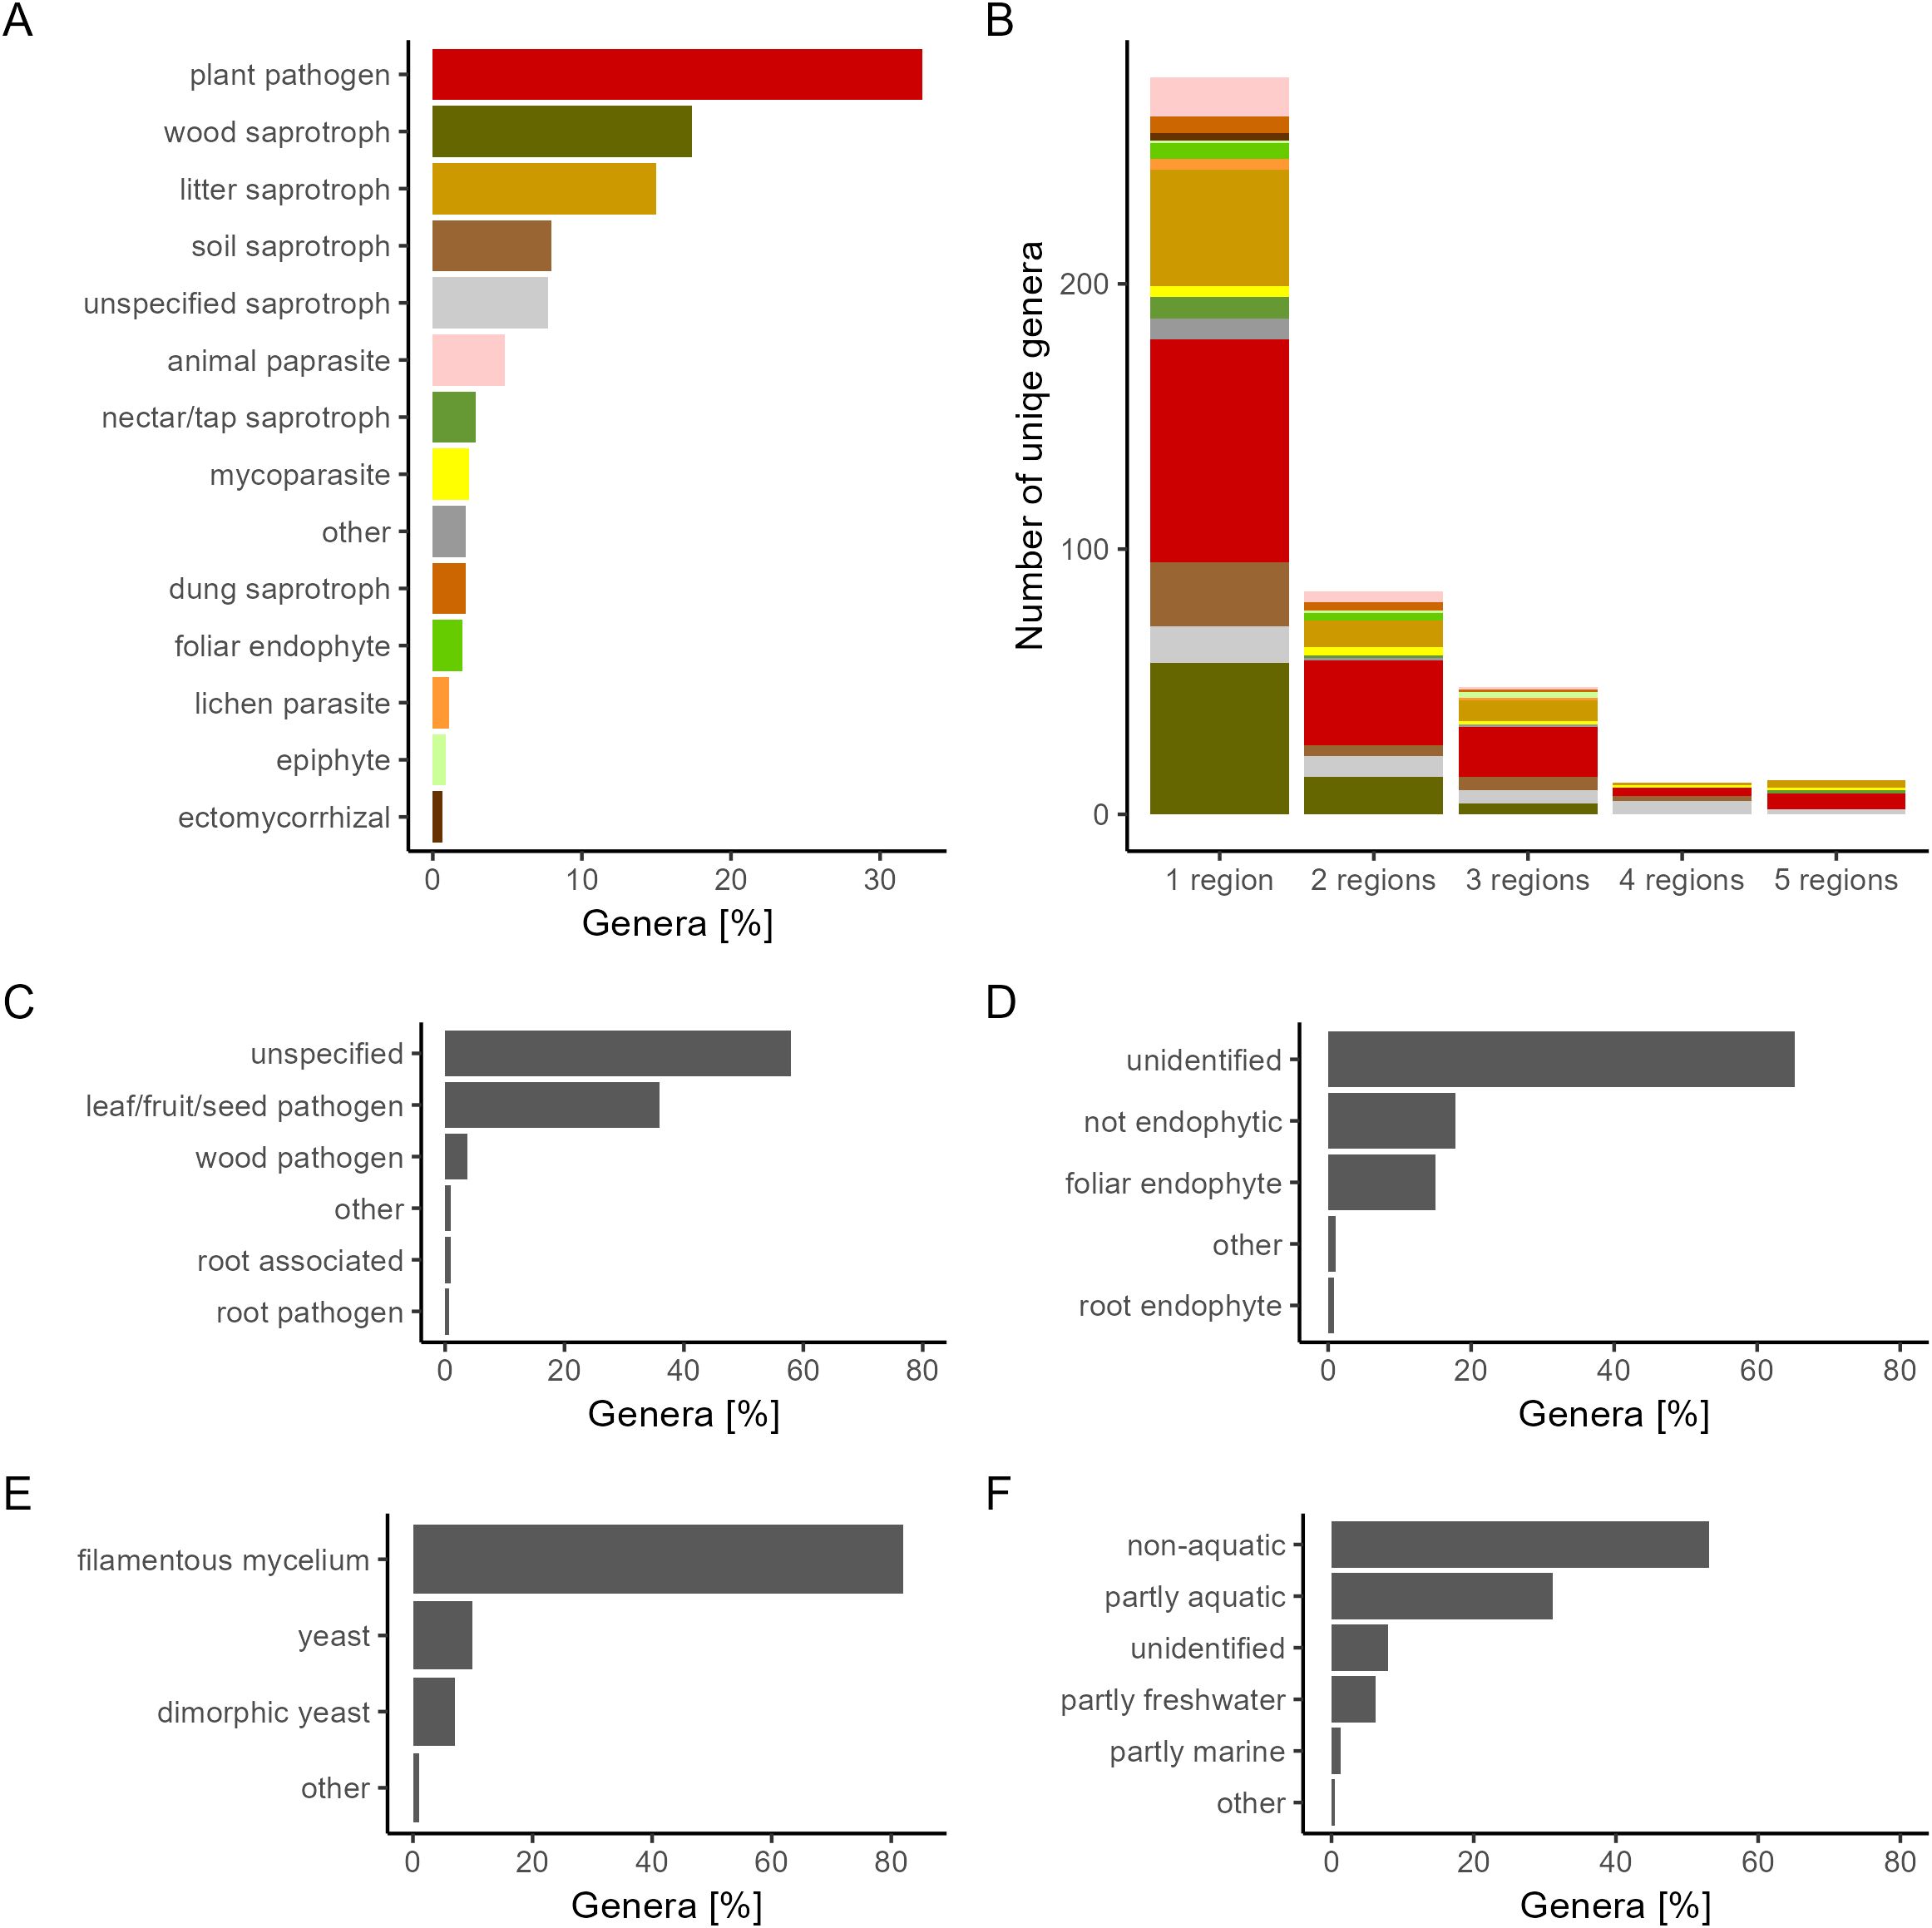
Figure 2. The percentage of genera with a certain trait. Traits were sourced from FungalTraits (Põlme et al., 2020) and summarized for (A) primary lifestyle, (B) unique genera found across wheat growing regions (C) plant pathogenic capacity, (D) endophytic interaction capacity, (E) growth form, and (F) aquatic habitat.
Fungal lifestyles varied greatly. The most common growth forms were filamentous mycelia (81.9%), followed by yeast (9.9%), and dimorphic yeast (7%). Endophytic capacity was undetermined for most genera, but 18% of genera was determined as not endophytic, and 15% of genera was determined to be foliar endophytes. Plant pathogen was the most common primary lifestyle (32.3%) with seeds, fruits, and leaves as the primary targets of infection. Species found in more than one region marked as pathogens in FungalTraits were manually checked for records of wheat pathogenesis (Supplementary Table 4). There were 36 genera found in more than one region, marked as plant pathogens as either their primary lifestyle or their secondary lifestyle. Of these, there were 17 genera (47%) in which at least one species was found, with records showing pathogenesis on wheat specifically.
3.4 Core wheat phyllosphere mycobiome
No genera were found across all studies or across all countries. However, despite high regional variability, thirteen fungal genera (2.8% of the total genera) were consistently present across all five regions (Figure 2B). The majority of the fungal genera (61.9%) were on the other hand found only in a single region. The thirteen fungal genera found in all five regions, henceforth referred to as core genera, were Cladosporium, Epicoccum, Alternaria, Bipolaris, Pyrenophora, Stemphylium, Aspergillus, Penicillium, Candida, Nigrospora, Trichoderma, Fusarium, and Chaetomium. At the Species level, E. nigrum was the only species found across all five regions. Other frequently recorded species were Alternaria alternata, Alternaria infectoria, Chaetomium globosum, Cystofilobasidium macerans, Pyrenophora tritici-repentis, Sporobolomyces roseus, Stemphylium vesicarium and Vishniacozyma victoriae, all found across four regions. The taxonomy and traits for the core genera are shown in Table 1. A summary of core species are available in Supplementary Table 7. All are Ascomycota and all except for the yeast Candida, are filamentous fungi. Most of the genera are partly aquatic and have foliar endophytic capacity. Of the 13 core genera, eight are characterized as commensal or plant growth promoting; Cladosporium, Epicoccum, Aspergillus, Penicillium, Candida, Trichoderma, Nigrospora and Chaetomium. The remaining five core genera, namely Alternaria, Bipolaris, Pyrenophora, Stemphylium and Fusarium, are plant pathogens, with species found capable of infecting wheat.
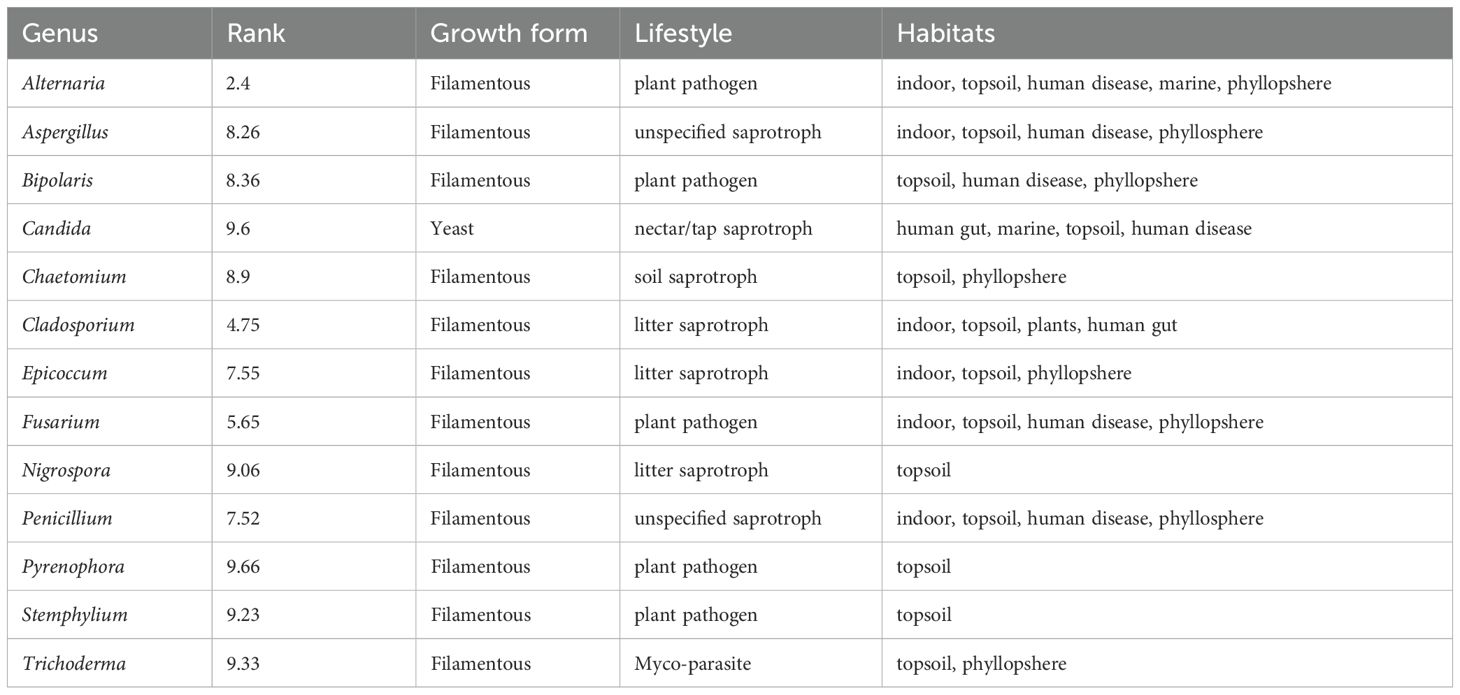
Table 1. Core genera in the wheat phyllosphere.
3.5 Abundance patterns
To determine if genera found across multiple studies and regions were also the most abundant in individual studies, the top ten most abundant genera were ranked for each study. A table for average ranked abundance for each genus can be found in Supplementary Table 8. The average across studies and regions are plotted in Figure 3.
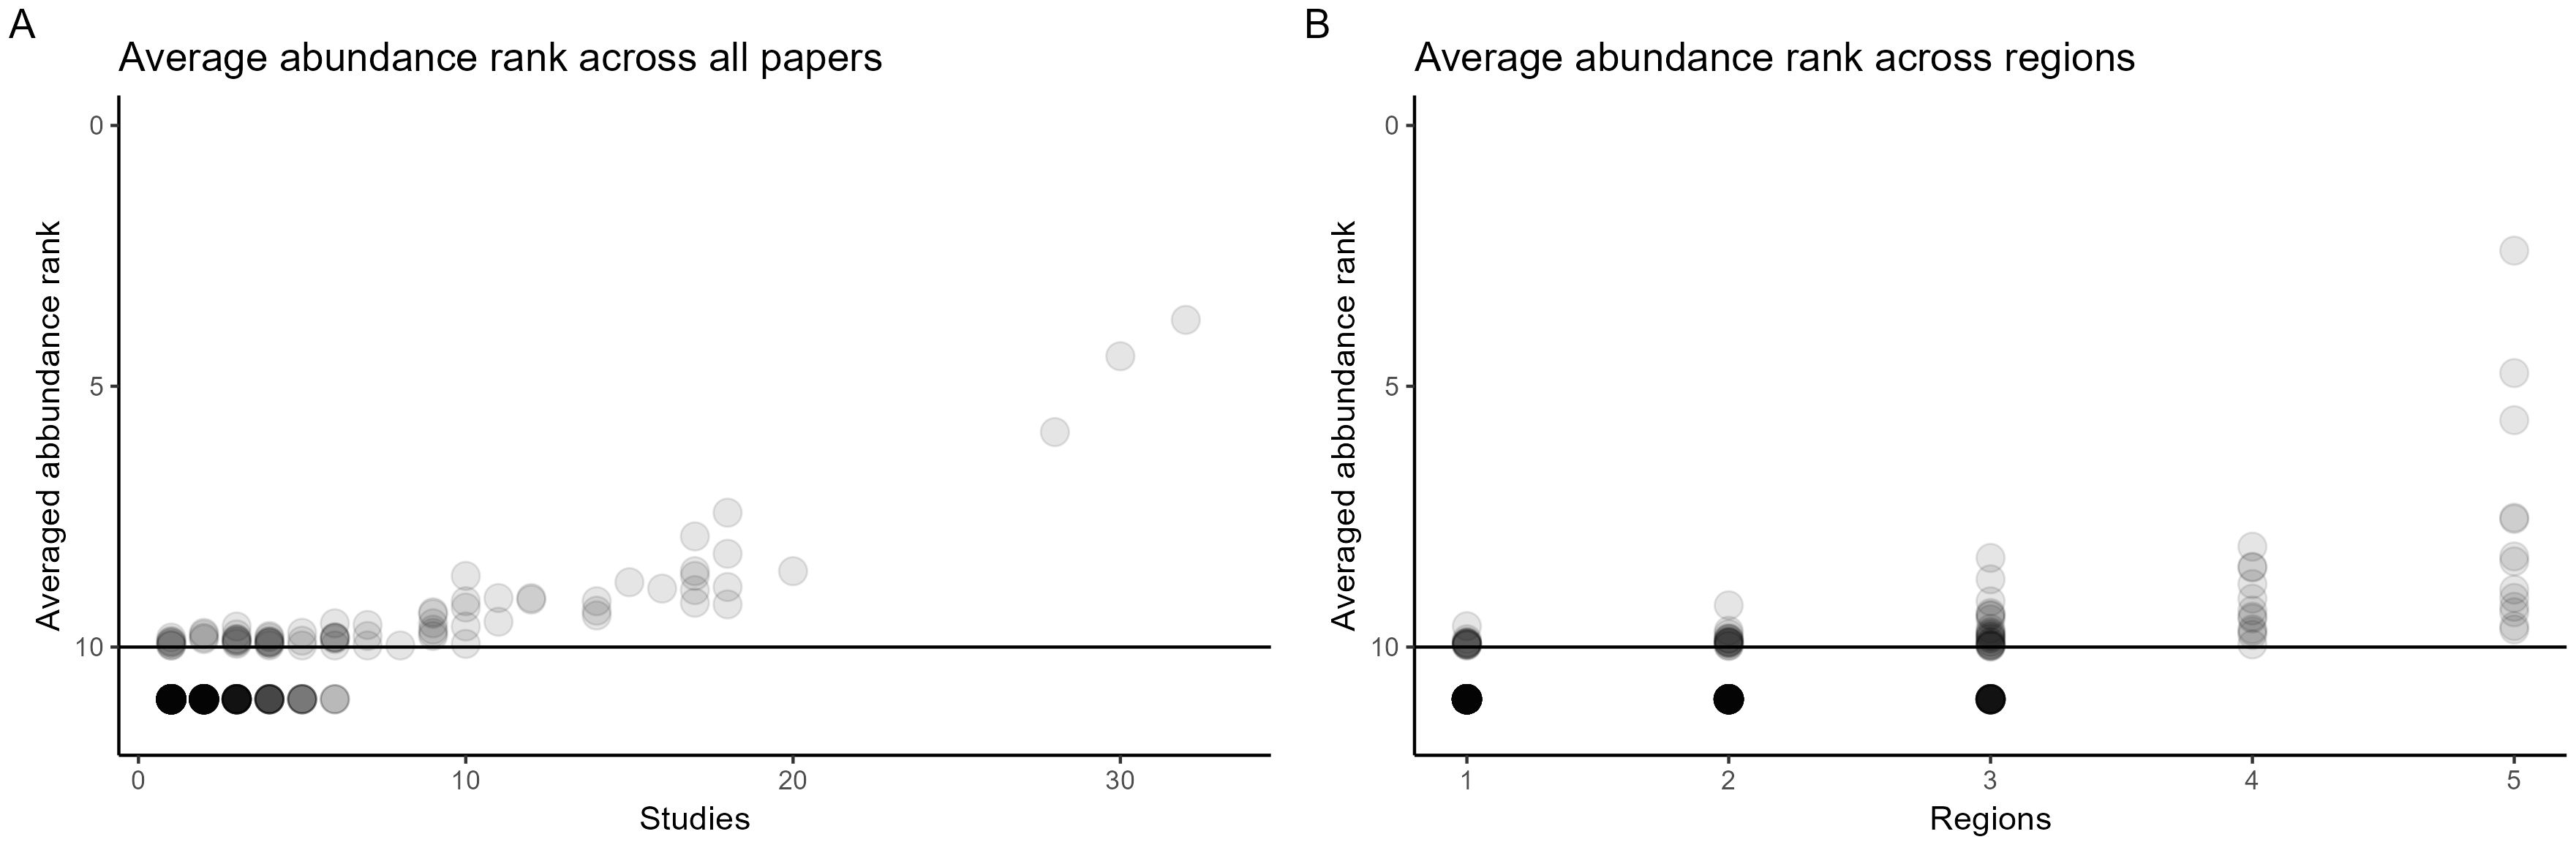
Figure 3. Scatter plot of the average rank of genera as a function of how many times each genus was recorded across studies (A) and regions (B). In each study, the top 10 genera were ranked 1-10, with one being the most abundant. Genera not recorded as the top 10 most abundant genera in any paper are plotted below the line. The intensity of the dots (alpha = 0.2) reflects the number of genera of a particular abundance rank.
Across both studies and regions, the most commonly found genera were also the highest ranked genera (with 1 being the highest rank). All the genera found in four or more regions had across studies a ranked abundance within the top 10. The top three most abundant and widespread genera were Alternaria, Cladosporium, and Fusarium, which also consistently were the highest ranked across studies.
3.6 Geographic variation in mycobiome composition
Similarities between regions were determined by comparing the number of genera shared between each combination of regions (Figure 4). Regions shared an average of 26.7 genera (SD = 31.5). The highest similarity was observed between North America and the Mediterranean (95 shared genera), while the lowest similarity occurred between South America and Asia (13 shared genera). Similarities within each region, defined here as the number of genera found more than once, were on average 27.5 genera (SD = 32.2), which represents 13.6% (SD = 17.7).

Figure 4. A world map showcasing wheat production, sample locations, and the percentage of shared genera between regions. The map was made using QGIS and data from FAOSTAT. The areas of wheat production are depicted in dark green, while the yellow dots on the map represent the sampling points within each wheat-growing region. Lines connecting each region indicate the percentage of shared genera and the distance between them. Pie charts show the distribution of annual wheat production, the number of studies, and the number of genera across regions.
The Venn diagram in Figure 5, visualizes the distribution of shared genera between regions. The region with the largest number of genera not shared with any other regions was North America. This was followed by the Mediterranean region. The region where most genera was shared (but also with the fewest genera in total) was South America.
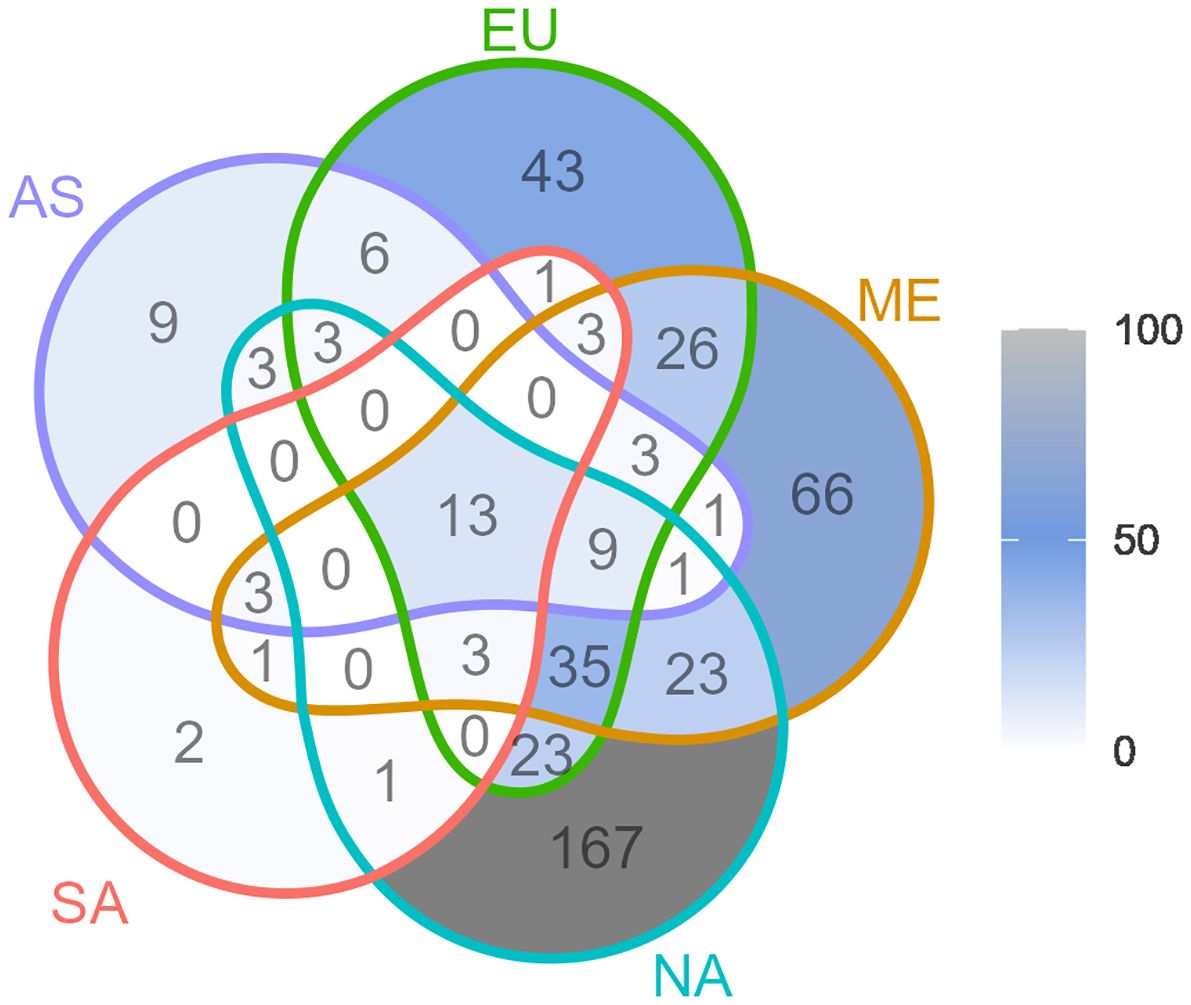
Figure 5. Venn diagram of genera shared between the wheat growing regions North America (NA), South America (SA), Northern Europe (EU), Mediterranean (ME), and Asia (AS). Numbers indicate shared genera within a specific intersection. See Figure 4 for the exact locations of studies and regions.
3.7 Factors influencing fungal community composition
An Adonis test was performed to identify which potential factors significantly affected the community composition, namely identification method, wheat growing region, pesticide use, surface sterilization, and climate zone (Table 2). As the Adonis test is sensitive to dispersion, a dispersion pre-test was also performed. Three factors were not significantly dispersed: identification method, use of pesticides, and whether the plant sample was surface sterilized or not. Of these three factors, the identification method and if leaves were surface sterilized or not significantly affected fungal community composition at genus level (Table 2).
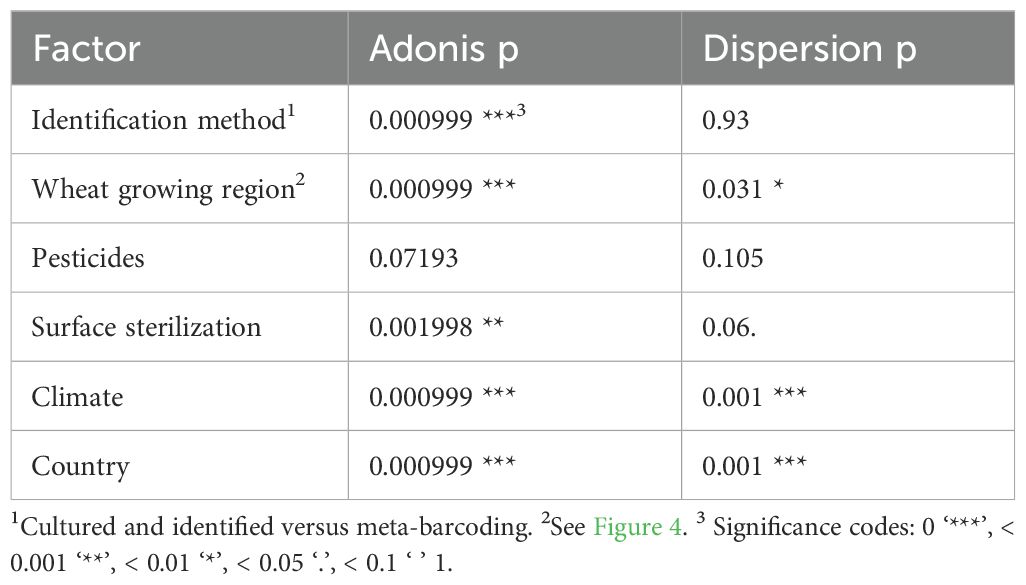
Table 2. Adonis and dispersion output of analyzed factors potentially affecting the fungal phyllosphere community composition.
Distances in community composition between studies were calculated using the Jaccard method for the presence/absence data, at genus level and depicted in a principal coordinate analysis (PCoA) plot (Figure 6). The plot is depicted four times each overlayed with either wheat regions, identification methods, surface sterilization and pesticide use to visualize patterns. The first principal coordinate explained 18.6% and the second principal coordinate explained 9.5% of the variation, in total explaining 28.1% of the variation in the community composition. The clearest separation of data points was seen when the identification method was overlayed (Figure 6A). Interestingly, only Northern Europe clustered separately from the other regions (Figure 6).
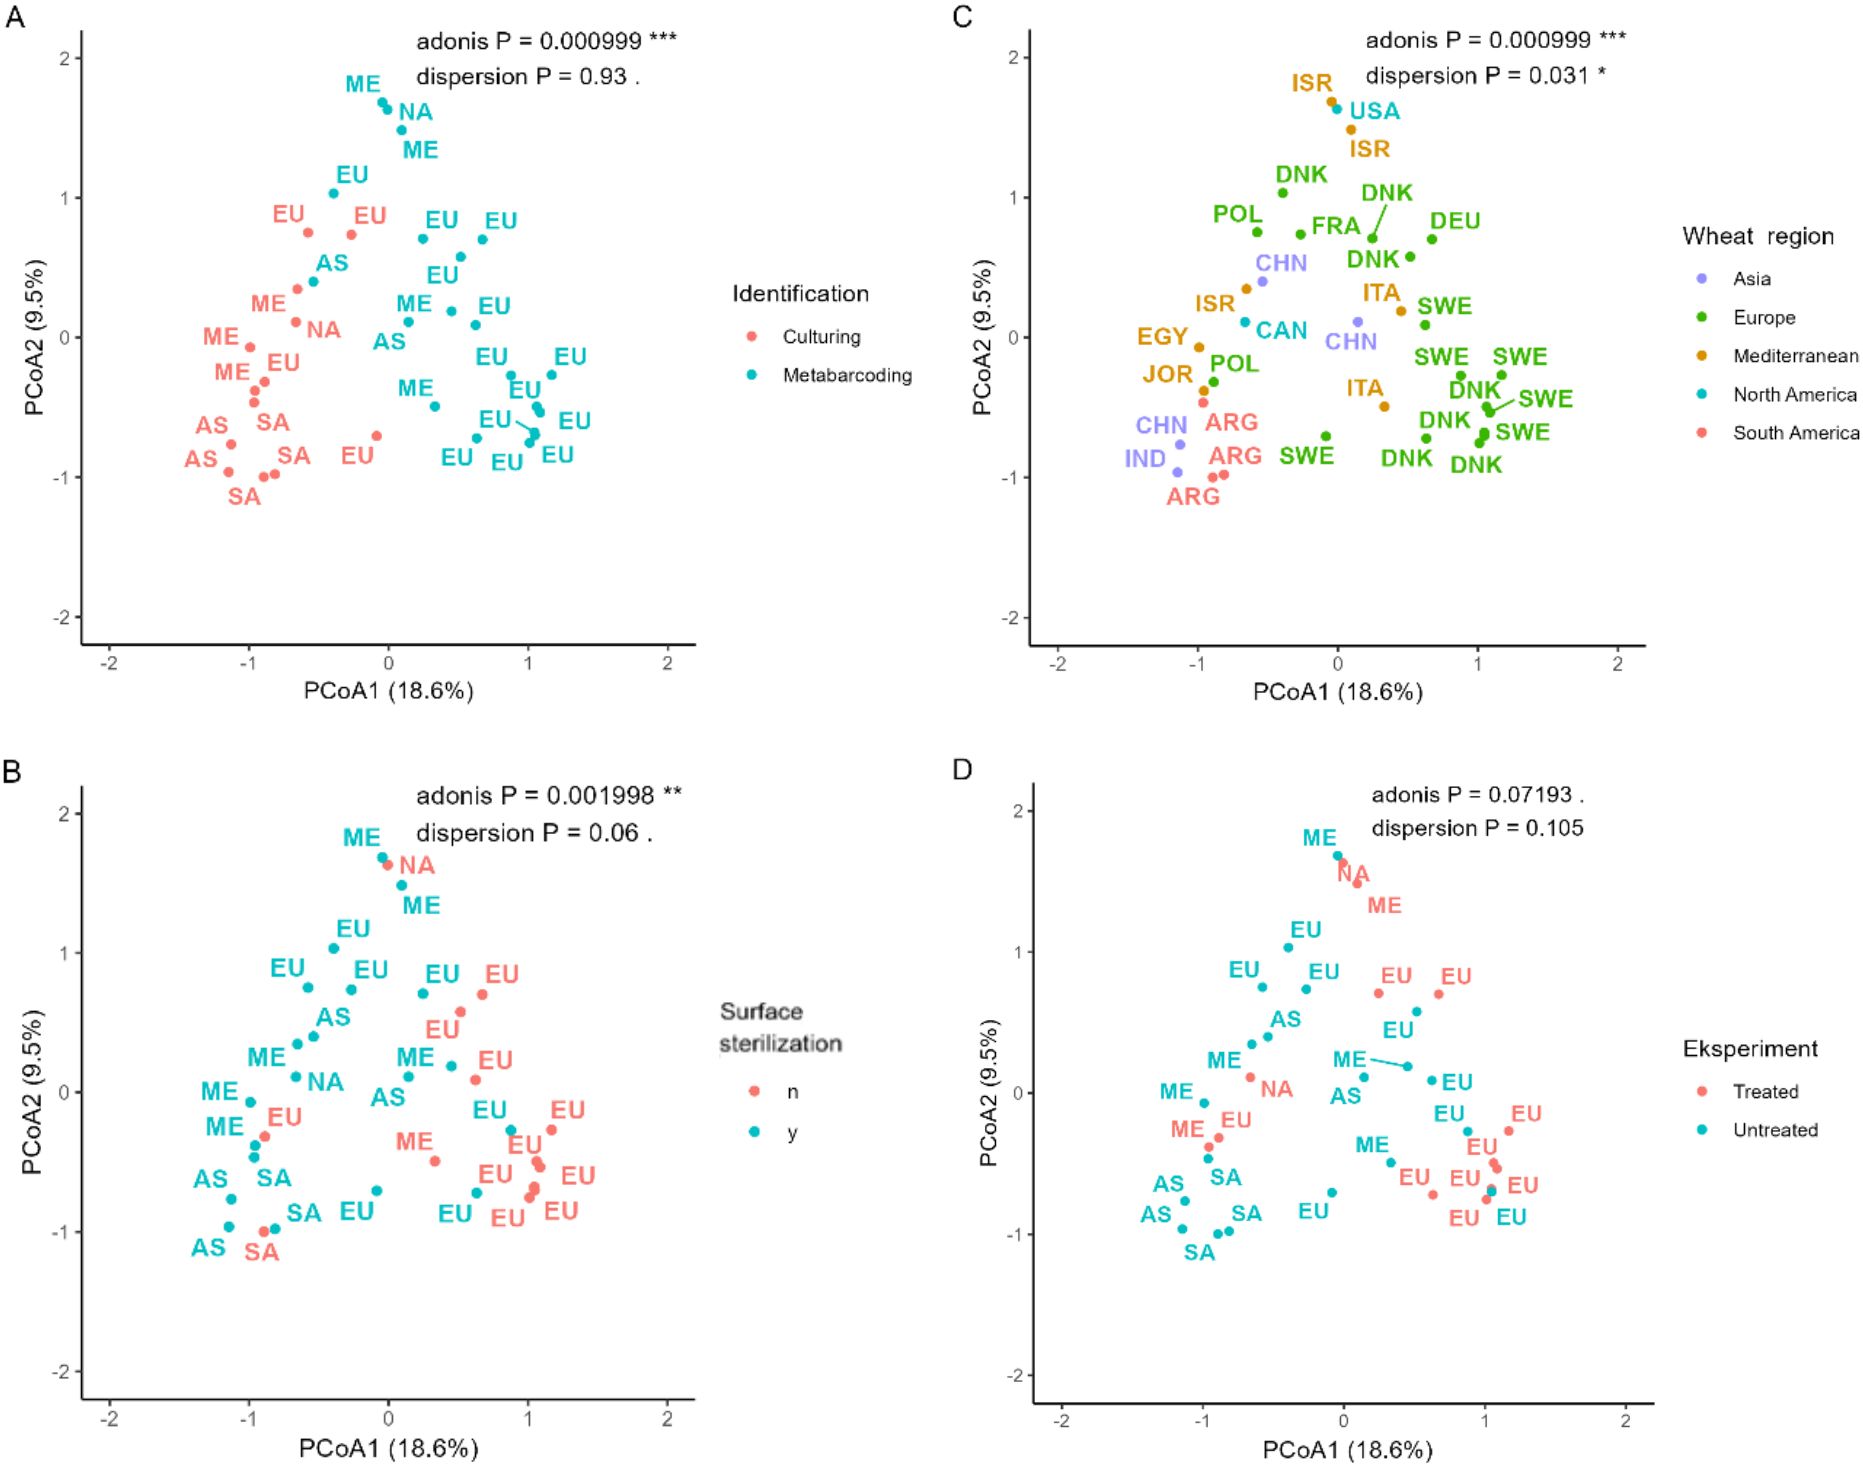
Figure 6. PCoA plot based on Jaccard dissimilarities. Each point is a study, and the overlaid colors represent identification methods (A), surface sterilization (B), wheat growing region (C), or use of antifungal compounds (D). Wheat region abbreviations: NA, North America; SA, South America; EU, Northern Europe; ME, Mediterranean; AS, Asia. Country abbreviations: ARG, Argentina; CAN, Canada; CHN, China; DNK, Denmark; EGY, Egypt; FRA, France; DEU, Germany; IND, India; ISR, Israel; ITA, Italy; JOR, Jordan; POL, Poland; SWE, Sweden; USA, USA.
To determine whether increased distance between sampling sites is associated with an increased dissimilarity between fungal communities, a Mantel test was performed. Given that the method of identification significantly influenced community composition (Table 2, Figure 6A), three Mantel tests were performed. One on all studies and two where studies were grouped based on identification method. Results from the Mantel tests are shown in Table 3 and visualized in Figure 7. Both for all studies together and for metabarcoding studies there was a significant positive correlation between community dissimilarity and geographical distance. This pattern was not observed for culture-based studies.
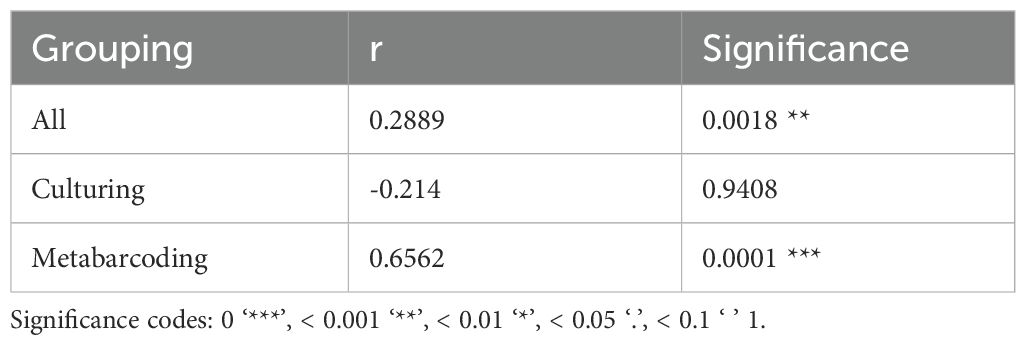
Table 3. Mantel statistics.
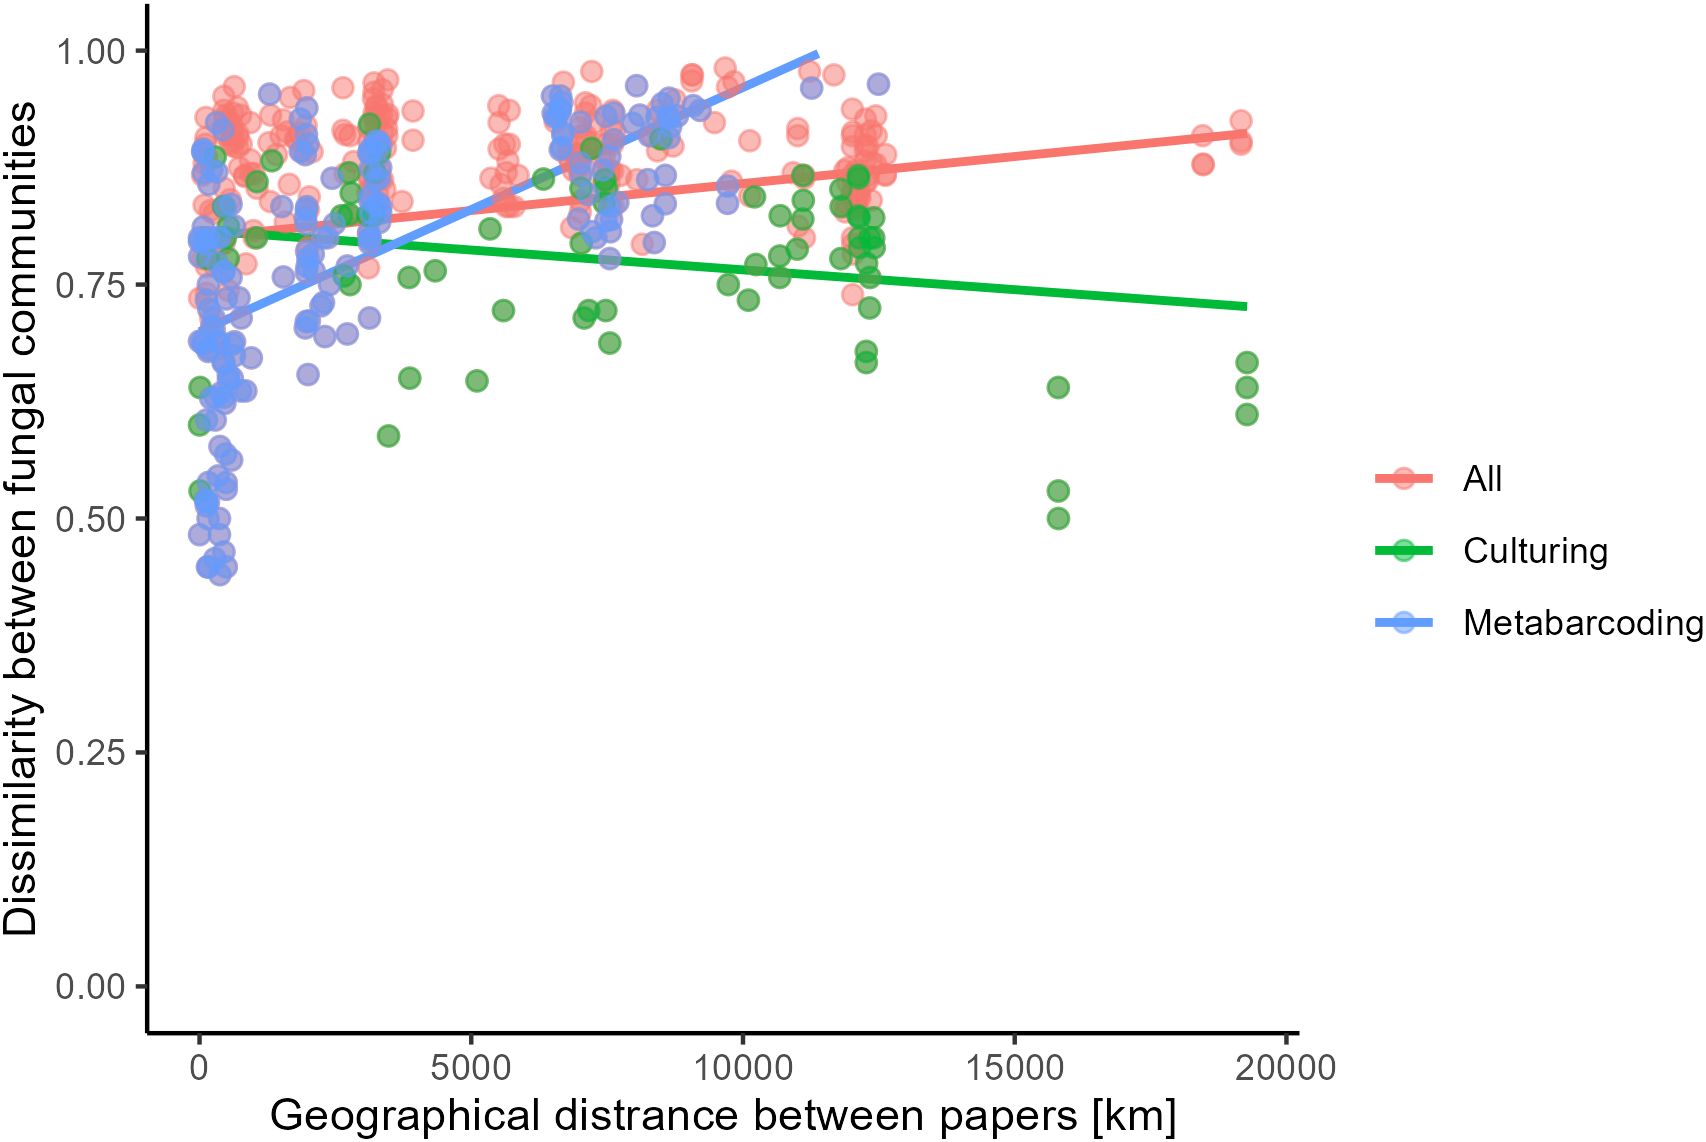
Figure 7. Distance in fungal community (Bray Curtis dissimilarity) over geographical distance (km) between all studies (red), and studies identifying fungi using culturing (green) or metabarcoding (blue).
4 Discussion
The need for sustainable alternatives to fungicide has led to an increased interest in the plant microbiome in general and specifically for the discovery of microbes capable of promoting or protecting plant growth. Multiple promising candidates have been identified (Khan et al., 2007; Sarrocco et al., 2019; Rojas et al., 2020b), some of which are already on the market (Rush et al., 2021). However, the many promising candidates and the relatively few products underline the major challenge of transitioning from the simple and controlled laboratory and greenhouse settings to the unpredictable and complex field conditions (Parnell et al., 2016).
4.1 Key findings
The present study documented the impressive fungal diversity associated with the phyllosphere of a single domesticated crop, wheat, in which over 300 genera were identified. As many studies did not identify the fungi to species level, the number of species to which this corresponds will therefore only be a guess, but a conservative estimate would certainly be above the 924 species that was recorded. A core wheat mycobiome comprising of 13 genera was identified. The available studies highlight how skewed sampling is between regions. Neither genera nor species richness were saturated when only the currently sampled regions were included (Supplementary Figure 2). We expect the number of genera and species identified in the wheat phyllosphere to increase, and to approach saturation, following more in-depth sampling across the entire wheat growing area. These findings and more will be discussed further in the following sections.
4.2 Non-sampled wheat regions
The low similarities between fungal phyllosphere communities, both within and between regions, stresses the need for more sampling. Even though the data was extracted from five continents, it was largely dominated by samples from Northern Europe and the Mediterranean (representing 72% of total studies). This bias is most likely the result of active wheat microbiome research groups, e.g. at universities in Denmark, Sweden, and Israel. Many important wheat-producing areas, including China (134 million tons), India (104 million tons), Russia (75 million tons), and the United States (53 million tons), which account for 48% of global annual wheat production (FAO, 2019), are underrepresented, as they contribute to only 12% of the total studies analyzed in this meta-analysis. Coordinated global sampling efforts, such as previously done by Tedersoo et al. or Dunn et al. for other habitats, could represent a major step forward toward comprehensive identification of the global wheat mycobiome (Tedersoo et al., 2014; Dunn et al., 2013).
4.3 It is common to be rare
From the regions studied to date, we could not identify any species or genera that were identified across all 33 studies. This, combined with the high number of genera found in only a single study and the low number of genera shared within and between regions, indicates that the wheat phyllosphere is a complex mycobiome inhabited by many rare fungi. Agricultural wheat is an annual plant. Each year present a new chance for fungi to colonize the plant, which could explain why it is common to be rare. The low sampling intensity in certain regions is likely to also contribute to the low similarity between regions.
4.4 A core of 13 genera across regions were found
Of the most common genera, 13 were found across all five regions: Cladosporium, Epicoccum, Alternaria, Bipolaris, Pyrenophora, Stemphylium, Aspergillus, Penicillium, Candida, Nigrospora, Trichoderma, Fusarium, and Chaetomium. Of these, five genera, Alternaria, Cladosporium, Fusarium, Penicillium, and Epicoccum, were also the most abundant across regions. Although these 13 genera are defined as core wheat phyllosphere mycobiomes, they are not unique to wheat. Most are common genera found in both the phyllosphere and rhizosphere of other cereals (Sapkota et al., 2015), plants in general (Sohrabi et al., 2023), soil (Tedersoo et al., 2014) and even in humans (Köhler et al., 2015) (Table 1). Of the 13 core genera, seven comprised of commensal or plant growth-promoting species, while six were wheat specific pathogens. More studies comparing fungal community composition across a variety of hosts, such as other crops and nearby vegetation within each region, are needed to identify if any species are unique to wheat, and the extent to which fungal phyllosphere communities represent the selective pressure of the host versus the meta community of the region. Including relevant species of these 13 genera in multi-species synthetic communities (SynCom), mimicking global wheat phyllosphere communities could be beneficial for future biocontrol success. We suggest that for any potential biological control agent to effectively integrate into native wheat microbiome, it would need to be able to co-exist, show positive or at least neutral interactions with these genera.
4.5 Sampling method rules above geographical areas
Across all studies, regardless of the sampling region, the PCoA plots (Figure 6A) and the Adonis test (Table 2) showed a clear separation of fungal communities identified with either barcoding or culturing methods. This indicates that the fungal identification method had a more significant impact on the identified community composition than geographical distance. However, when metabarcoding data was analyzed alone, with a Mantel test, a clear signal was observed by a decrease in community similarity with increased geographical distance. We found that most of the metabarcoding studies were also from the most intensively sampled region (Europe) and that these studies clustered together in the ordination space (Figure 6C). Possibly, the studies using culturing clustered separately together because this method favors the most common and cultivable fungi, thereby finding fewer rare genera unique to the region.
This highlights the need for more deep sequencing of all wheat growing regions, to find differences in the fungal microbiome that is not caused by our method of sampling. Different sampling and identification methods can affect observed fungal diversity by the different biases/selective opportunities that each method has. Metabarcoding is a high throughput tool which will find more rare fungi. In this study, more fungal genera were identified in studies using metabarcoding (average of 47 genera per study) than culturing (average of 20 genera per study). Whereas metabarcoding approaches are a promising tool in accurately describing complete wheat phyllosphere fungal communities, their results may be biased by primer selectivity and sequencing errors, which if not corrected can artificially inflate/disregard the species count of specific groups (Zou et al., 2019). By contrast, culturing favors fast-growing fungi and is more labor-intensive, thereby often finding fewer unique genera but allows for better identification and characterization of the fungi once in culture. It should be noted that recent improvements in high-throughput cultivation and sequencing could in future studies close the gap between culturing and metabarcoding species counts (Collado et al., 2007; Li et al., 2023). Importantly, this indicates that regions might in fact share more genera than reported in this study, which were not recognized due to different identification methods. We expect that if all regions were equally sequenced using a standardized metabarcoding approach, the number of shared genera would increase and the number of genera recorded could saturate.
4.6 The use of pesticides had little effect
Counterintuitively, we saw only a small effect of pesticides treatment on the fungal community composition. Similar marginal effects of pesticides use have been documented in literature before. Both (Karlsson et al., 2014; Knorr et al., 2019) did find an effect on the abundance of certain species but only a moderate effect on species composition, all which was affected by fungicide choice, timing and dose. In our study, it was not possible to identify the effect of other factors such as the surrounding pool of fungi, climate, plant organ, plant developmental stage, wheat cultivar, or genotype, either because they were not recorded or because there were too few studies representing each factor. More focus on the effect of these factors is needed in future studies.
4.7 Yeast has a high abundance but low diversity
We found relatively fewer yeast genera (16.7%) than filamentous fungal genera (80.7%). Since the filamentous growth form has the potential to grow internally between the leafs cells, taking up nutrients from within the host, this might allow a higher taxonomic diversity. In contrast, epiphytically growing yeast has to specialize in adapting to the leaves harsh surface environment. We tested whether the use of surface sterilization in 13 out of 33 studies could have affected the observed diversity. However, interestingly, studies using surface sterilization found more yeasts or yeast-like growth forms compared to studies not using surface sterilization, even though they observed approximately the same total number of genera (Supplementary Table 9). This suggests that either surface sterilization methods are not efficient enough to remove epiphytically growing fungi or that more yeast grow endophytically than expected. The relatively fewer yeast genera found did not indicate that yeast is not abundant in the wheat phyllosphere. We could see that seven out of the top twenty genera with the highest average ranked abundance across studies were yeasts (Sporobolomyces, Cryptococcus, Dioszegia, Filobasidium, Udeniomyces, Rhodotorula, and Vishniacozyma). The data therefore indicates that yeast has a low diversity compared to filamentous but are equally abundant.
4.8 Few endophytes or over representations of pathogens?
Using the FungalTraits database to assign lifestyle strategies to genera, we most commonly found plant pathogens as the lifestyle strategy. This was surprising, considering that most studies reported that fungi were isolated from symptom-free samples. However, our result was heavily skewed by genera that were found only once. When looking at genera found in more than one region, most were not characterized as plant pathogens, and less than half of them were known to infect wheat. Clearly, a trait as plant pathogen, especially a pathogen on above ground wheat structures, is much narrower than what predicted by FungalTraits. Not all species within a genus may be pathogens, and not all pathogens within a genus may infect wheat. From other fungal pathogens it is known that even small genetic differences may determine if these are pathogenic or not (Skovgaard et al., 2002; Stukenbrock and Mcdonald, 2007).
4.9 Knowledge gaps and suggestions for future studies
Our approach allowed us to integrate relevant studies using different species recognition methodologies into one analysis. By doing so, we emphasized the complexity of the wheat phyllosphere mycobiome and identify a core of 13 wheat phyllosphere fungi across five major wheat-growing regions. However, we should acknowledge that our method is limited by the studies that were available to us and our reliance on species or genera originally proposed by the authors of the studies. Although we updated the taxonomy to the most recently accepted one, there is still a chance that we have included misidentifications or that the authors across time and locations have worked with different frameworks for species designation. However, our approach allowed us to identify the following knowledge gaps. 1) Many important wheat-producing areas, including China, India, Russia, and the United States, are underrepresented in wheat phyllosphere mycobiome studies, despite contributing significantly to global wheat production. 2) It remains unclear how different environmental and agricultural factors influence the composition of wheat-associated fungal communities. 3) More studies are needed to determine whether certain fungal species or genera are unique to wheat. 4) Yeasts are abundant but exhibit low diversity in the wheat phyllosphere. The extent of their ecological roles and interactions with other fungi requires further investigation. 5) Many fungi identified in wheat phyllosphere studies are classified as potential pathogens, but their actual roles (pathogenic, mutualistic, or commensal) remain uncertain. 6) Different studies use varying methods for identifying fungi, leading to inconsistent results.
A standardized approach is needed to allow better comparisons across studies and regions. Future studies of the wheat phyllosphere mycobiomes will hopefully increase the knowledge of the under-sampled regions and allow for a comprehensive understanding of the wheat phyllosphere without methodological biases. Ultimately, the obtained knowledge may contribute to the development of wheat protection and growth enhancement methods alternative to the extensive use of pesticides and fertilizers.
Data availability statement
The original contributions presented in the study are included in the article/Supplementary Material. Further inquiries can be directed to the corresponding author.
Author contributions
MF: Writing – review & editing, Conceptualization, Investigation, Formal Analysis, Writing – original draft, Visualization, Data curation. AR: Conceptualization, Writing – review & editing, Writing – original draft, Data curation, Investigation, Formal Analysis, Visualization. RK: Conceptualization, Project administration, Supervision, Writing – review & editing, Funding acquisition, Writing – original draft.
Funding
The author(s) declare that financial support was received for the research and/or publication of this article. This work was funded as part of the Microbiome Assisted Triticum Resilience In X-dimensions (MATRIX) project under the Novo Nordisk Foundation grant NNF19SA0059348.
Acknowledgments
We would like to thank Kristi Gdanetz MacCready from Michigan State University (Gdanetz et al., 2017) for access to unpublished data.
Conflict of interest
The authors declare that the research was conducted in the absence of any commercial or financial relationships that could be construed as a potential conflict of interest.
Generative AI statement
The author(s) declare that no Generative AI was used in the creation of this manuscript.
Publisher’s note
All claims expressed in this article are solely those of the authors and do not necessarily represent those of their affiliated organizations, or those of the publisher, the editors and the reviewers. Any product that may be evaluated in this article, or claim that may be made by its manufacturer, is not guaranteed or endorsed by the publisher.
Supplementary material
The Supplementary Material for this article can be found online at: https://www.frontiersin.org/articles/10.3389/fpls.2025.1597807/full#supplementary-material
References
Abarenkov, K., Nilsson, R. H., Larsson, K. H., Taylor, A. F. S., May, T. W., Frøslev, T. G., et al. (2024). The UNITE database for molecular identification and taxonomic communication of fungi and other eukaryotes: sequences, taxa and classifications reconsidered. Nucleic Acids Res. 52 (D1), D791–D797. doi: 10.1093/NAR/GKAD1039
Acevedo, M., Zurn, J. D., Molero, G., Singh, P., He, X., Aoun, M., et al. (2018). “The role of wheat in global food security,” in Agricultural development and sustainable intensification: technology and policy challenges in the face of climate change Taylor and Francis, 81–110. doi: 10.4324/9780203733301-4/ROLE-WHEAT-GLOBAL-FOOD-SECURITY-MARICELIS-ACEVEDO-JASON-ZURN-GEMMA-MOLERO-PAWAN-SINGH-XINYAO-MERIEM-AOUN-PHILOMIN-JULIANA-HAROLD-BOCKLEMAN-MIKE-BONMAN-MAHMOUD-EL-SOHL-AHMED-AMRI-RONNIE-COFFMAN-LINDA-MCCANDLESS
Al-Khawaldeh, M. M., Araj, S. E., Alananbeh, K. M., and al Antary, T. M.. (2020). Wheat cultivable fungal endophytes in Jordan. Fresenius Environ. Bull. 29, 1229–1240.
Blixt, E., Olson, Å., Lindahl, B., Djurle, A., and Yuen, J.. (2010). Spatiotemporal variation in the fungal community associated with wheat leaves showing symptoms similar to stagonospora nodorum blotch. Eur. J. Plant Pathol. 126, 373–386. doi: 10.1007/s10658-009-9542-z
Casini, G., Yaseen, T., Abdelfattah, A., Santoro, F., Varvaro, L., Drago, S., et al. (2019). Endophytic fungal communities of ancient wheat varieties. Phytopathol. Mediterr. 58, 151–162. doi: 10.13128/Phytopathol_Mediterr-23785
Collado, J., Platas, G., Paulus, B., and Bills, G. F.. (2007). High-throughput culturing of fungi from plant litter by a dilution-to extinction technique. FEMS Microbiol. Ecol. 60, 521–533. doi: 10.1111/j.1574-6941.2007.00294.x
Comby, M. A. L., Lacoste, S., Baillieul, F., Profizi, C., and Dupont, J.. (2016). Spatial and temporal variation of cultivable communities of co-occurring endophytes and pathogens in wheat. Front. Microbiol. 7. doi: 10.3389/fmicb.2016.00403
Dunn, R. R., Fierer, N., Henley, J. B., Leff, J. W., and Menninger, H. L.. (2013). Home life: factors structuring the bacterial diversity found within and between homes. PloS One 8, 64133. doi: 10.1371/journal.pone.0064133
European Commission, Feijao, C., Flanagan, I., Abellan, B., Ryen Gloinson, E., Smith, E., et al. (2022). Development of future scenarios for sustainable pesticide use and achievement of pesticide-use and risk-reduction targets announced in the Farm to Fork and Biodiversity Strategies by 2030, European Commission (Publications Office of the European Union). doi: 10.2875/565045
FAO. (1998). Food And Agriculture Organization Of The United Nations. FAOSTAT. Available online at: https://lccn.loc.gov/2005617801
FAO. (2019). Food And Agriculture Organization Of The United Nations. FAOSTAT. Available online at: https://www.fao.org/faostat/en/#data/QCL/visualize
Forry, S. P., Servetas, S. L., Kralj, J. G., Soh, K., Hadjithomas, M., Cano, R., et al. (2024). Variability and bias in microbiome metagenomic sequencing: an interlaboratory study comparing experimental protocols. Sci. Rep. 14, 1. doi: 10.1038/s41598-024-57981-4
Gao, F.-K., Dai, C.-C., and Liu, X.-Z. (2010). Mechanisms of fungal endophytes in plant protection against pathogens. Afr. J. Microbiol. Res. 4 (13), 1346–1351. Available online at: http://www.academicjournals.org/ajmr.
Gdanetz, K. and Trail, F. (2017). The wheat microbiome under four management strategies, and potential for endophytes in disease protection. Phytobiomes J. 1, 158–168. doi: 10.1094/PBIOMES-05-17-0023-R
Giraldo, P., Benavente, E., Manzano-Agugliaro, F., and Gimenez, E. (2019). Worldwide research trends on wheat and barley: A bibliometric comparative analysis. Agronomy 9 (7). doi: 10.3390/agronomy9070352
Grudzinska-Sterno, M., Yuen, J., Stenlid, J., and Djurle, A. (2016). Fungal communities in organically grown winter wheat affected by plant organ and development stage. Eur. J. Plant Pathol. 146, 401–417. doi: 10.1007/s10658-016-0927-5
Hassanein, N. M., El-Gendy, M. M. A. A., and Abdelhameed, N. M. (2020). Molecular typing, biodiversity, and biological control of endophytic fungi of Triticum aestivum L. against phytopathogenic fungi of wheat, BioTechnologia. J. Biotechnol. Comput. Biol. Bionanotechnology 101, 283–299. doi: 10.5114/bta.2020.100421
Hawkes, C. v., Kjøller, R., Raaijmakers, J. M., Riber, L., Christensen, S., Rasmussen, S., et al. (2021). Extension of plant phenotypes by the foliar microbiome. Annu. Rev. Plant Biol. 72, 823–846. doi: 10.1146/ANNUREV-ARPLANT-080620-114342
Henning, C., Witzke, P., Panknin, L., and Grunenberg, M. (2021). Ökonomische und Ökologische Auswirkungen des Green Deals in der Agrarwirtschaft. (Christian-Albrechts-Universität).
Hertz, M., Jensen, I. R., Jensen, L. Ø., Thomsen, S. N., Winde, J., Dueholm, M. S., et al. (2016). The fungal community changes over time in developing wheat heads. Int. J. Food Microbiol. 222, 30–39. doi: 10.1016/j.ijfoodmicro.2016.01.018
Hijmans, R. J. (2024). Spherical Trigonometry [R package geosphere version 1.5-20]. CRAN: Contributed Packages; Comprehensive R Archive Network (CRAN). doi: 10.32614/CRAN.PACKAGE.GEOSPHERE
Huang, Y., Kuang, Z., Wang, W., and Cao, L. (2016). Exploring potential bacterial and fungal biocontrol agents transmitted from seeds to sprouts of wheat. Biol. Control. 98, 27–33. doi: 10.1016/j.biocontrol.2016.02.013
Jiang, M., Wang, Z., Li, X., Liu, S., Song, F., and Liu, F. (2021). Relationship between endophytic microbial diversity and grain quality in wheat exposed to multi-generational CO2 elevation. Sci. Total Environ. 776, 146029. doi: 10.1016/j.scitotenv.2021.146029
Karlsson, I., Friberg, H., Steinberg, C., and Persson, P. (2014). Fungicide effects on fungal community composition in the wheat phyllosphere. PloS One 9, e111786. doi: 10.1371/journal.pone.0111786
Karlsson, I., et al. (2017). Organic farming increases richness of fungal taxa in the wheat phyllosphere. Mol. Ecol. 26, 3424–3436. doi: 10.1111/mec.14132
Kaur, R. and Saxena, S. (2023). Penicillium citrinum, a Drought-Tolerant Endophytic Fungus Isolated from Wheat (Triticum aestivum L.) Leaves with Plant Growth-Promoting Abilities. Curr. Microbiol. , 80, 1–13. doi: 10.1007/s00284-023-03283-3
Khan, N. I., Schisler, D. A., Boehm, M. J., Slininger, P. J., and Bothast, R. J. (2001). Selection and evaluation of microorganisms for biocontrol of fusarium blight of wheat incited by gibberella zeae. J. King Saud Univ. Sci. 85, 1253–1258. doi: 10.1094/PDIS.2001.85.12.1253
Knorr, K., Jørgensen, L. N., Nicolaisen, M., and Sarrocco, S. (2019). Fungicides have complex effects on the wheat phyllosphere mycobiome. PloS One 14, 213176. doi: 10.1371/journal.pone.0213176
Köhler, J. R., Casadevall, A., and Perfect, J. (2015). The spectrum of fungi that infects humans. Cold Spring Harbor Perspect. Med. 5. doi: 10.1101/cshperspect.a019273
Köppen, W. G. (1936). Handbuch der Klimatologie - Das geographische System der Klimate (Gebrüder Borntraeger).
Larran, S., et al. (2002). Isolation and analysis of endophytic microorganisms in wheat (Triticum aestivum L.) leaves. World J. Microbiol. Biotechnol. 18, 683–686. doi: 10.1023/A:1016857917950
Larran, S., et al. (2007). The endophytic fungi from wheat (Triticum aestivum L.). World J. Microbiol. Biotechnol. 23, 565–572. doi: 10.1007/s11274-006-9266-6
Latz, M. A. C., Kerrn, M. H., Sørensen, H., Collinge, D. B., Jensen, B., Brown, J. K. M., et al. (2021). Succession of the fungal endophytic microbiome of wheat is dependent on tissue-specific interactions between host genotype and environment. Sci. Total Environ. 759, 143804. doi: 10.1016/j.scitotenv.2020.143804
Letunic, I. and Bork, P. (2021). Interactive Tree Of Life (iTOL) v5: an online tool for phylogenetic tree display and annotation. Nucleic Acids Res. 49, 293–296. doi: 10.1093/nar/gkab301
Li, W., et al. (2023). A catalog of bacterial reference genomes from cultivated human oral bacteria. NPJ Biofilms Microbiomes 9, 1. doi: 10.1038/s41522-023-00414-3
Malacrinò, A., et al. (2023). Plant genotype influence the structure of cereal seed fungal microbiome. Front. Microbiol. 13, 1075399. doi: 10.3389/fmicb.2022.1075399
Nicolaisen, M., Justesen, A. F., Knorr, K., Wang, J., and Pinnschmidt, H. O. (2014). Fungal communities in wheat grain show significant co-existence patterns among species. Fungal Ecol. 11, 145–153. doi: 10.1016/j.funeco.2014.06.002
Ofek-Lalzar, M., et al. (2016). Diversity of fungal endophytes in recent and ancient wheat ancestors triticum dicoccoides and aegilops sharonensis. FEMS Microbiol. Ecol. 92, 1–11. doi: 10.1093/femsec/fiw152
Oksanen, J., Simpson, G. L., Blanchet, F. G., Kindt, R., Legendre, P., and Minchin, P. R. (2024). Community Ecology Package [R package vegan version 2.7-1]. CRAN: Contributed Packages; Comprehensive R Archive Network (CRAN). doi: 10.32614/CRAN.PACKAGE.VEGAN
Parnell, J. J., et al. (2016). From the lab to the farm: An industrial perspective of plant beneficial microorganisms. Front. Plant Sci. 7, 209596. doi: 10.3389/fpls.2016.01110
Peñuelas, J. and Terradas, J. (2014). The foliar microbiome. Trends Plant Sci. 19 (5), 278–280. doi: 10.1016/J.TPLANTS.2013.12.007
Perelló, A., Simón, M. R., and Arambarri, A. M. (2002). Interactions between foliar pathogens and the saprophytic microflora of the wheat (Triticum aestivum L.) phylloplane. J. Phytopathol. 150, 232–243. doi: 10.1046/j.1439-0434.2002.00747.x
Põlme, S., et al. (2020). FungalTraits: a user-friendly traits database of fungi and fungus-like stramenopiles. Fungal Diversity 105, 1–16. doi: 10.1007/s13225-020-00466-2
Pusztahelyi, T., Holb, I. J., and Pócsi, I. (2015). Secondary metabolites in fungus-plant interactions. Front. Plant Sci. 6, 145754. doi: 10.3389/fpls.2015.00573
QGIS Development Team (2024). QGIS geographic information system. Available online at: https://www.qgis.org (Accessed March 20, 2024).
R Core Team (2024). R: A Language and Environment for Statistical Computing. Vienna, Austria: R Foundation for Statistical Computing. Available online at: https://www.R-project.org/.
Rhoads, D. D., et al. (2012). Clinical identification of bacteria in human chronic wound infections: Culturing vs. 16S ribosomal DNA sequencing. BMC Infect. Dis. 12, 1–8. doi: 10.1186/1471-2334-12-321
Rojas, E. C., Sapkota, R., Jensen, B., Jørgensen, H. J. L., Henriksson, T., Jørgensen, L. N., et al. (2020a). Selection of fungal endophytes with biocontrol potential against Fusarium head blight in wheat. Biol. Control 144, 104222. doi: 10.1016/j.biocontrol.2020.104222
Rojas, E. C., Sapkota, R., Jensen, B., Jørgensen, H. J. L., Henriksson, T., Jørgensen, L. N., et al. (2020b). Fusarium head blight modifies fungal endophytic communities during infection of wheat spikes. Microbial Ecol. 79, 397–408. doi: 10.1007/s00248-019-01426-3
Rush, T. A., Shrestha, H. K., Gopalakrishnan Meena, M., Spangler, M. K., Ellis, J. C., et al. (2021). Bioprospecting trichoderma: a systematic roadmap to screen genomes and natural products for biocontrol applications. Front. Fungal Biol. 2, 716511. doi: 10.3389/FFUNB.2021.716511
Salamon, S., Mikołajczak, K., and Błaszczyk, L. (2023). Constellation of the endophytic mycobiome in spring and winter wheat cultivars grown under various conditions. Sci. Rep. 13, 6089. doi: 10.1038/s41598-023-33195-y
Sapkota, R., Knorr, K., Jørgensen, L. N., O’Hanlon, K. A., and Nicolaisen, M. (2015). Host genotype is an important determinant of the cereal phyllosphere mycobiome. New Phytol. 207 (4), 1134–1144. doi: 10.1111/nph.13418
Sapkota, R., et al. (2022). Fungal communities of spring barley from seedling emergence to harvest during a severe puccinia hordei epidemic. Microbial Ecology.doi: 10.1007/s00248-022-01985-y
Sapkota, R., Jørgensen, L. N., and Nicolaisen, M. (2017). Spatiotemporal variation and networks in the mycobiome of the wheat canopy. Front. Plant Sci. 8, 1–10. doi: 10.3389/fpls.2017.01357
Sarrocco, S., et al. (2019). Is exploitation competition involved in a multitrophic strategy for the biocontrol of Fusarium head blight? Phytopathology 109, 560–570. doi: 10.1094/PHYTO-04-18-0123-R/ASSET/IMAGES/LARGE/PHYTO-04-18-0123-R_T6-1553300027743.JPEG
Savary, S., et al. (2019). The global burden of pathogens and pests on major food crops. Nat. Ecol. Evol. 3, 3. doi: 10.1038/s41559-018-0793-y
Schiro, G., Colangeli, P., and Müller, M. E. H. (2019). A metabarcoding analysis of the mycobiome of wheat ears across a topographically heterogeneous field. Front. Microbiol. 10, 12. doi: 10.3389/fmicb.2019.02095
Schoch, C. L., Ciufo, S., Domrachev, M., Hotton, C. L., Kannan, S., Khovanskaya, R., et al. (2020). NCBI Taxonomy: a comprehensive update on curation, resources and tools. Database: J. Biol. Database Curation 2020, baaa062. doi: 10.1093/database/baaa062
Skovgaard, K., Bødker, L., and Rosendahl, S. (2002). Population structure and pathogenicity of members of the Fusarium oxysporum complex isolated from soil and root necrosis of pea (Pisum sativum L.). FEMS Microbiol. Ecol. 42, 367–374. doi: 10.1111/j.1574-6941.2002.tb01026.x
Sohrabi, R., et al. (2023). Phyllosphere microbiome. Annu. Rev. Plant Biol. 74, 539–568. doi: 10.1146/annurev-arplant102820-032704
Sokal, R. R. (1979). Testing statistical significance of geographic variation patterns. Systematic Zoology 28, 227. doi: 10.2307/2412528
Stukenbrock, E. H. and Mcdonald, B. A. (2007). Geographical variation and positive diversifying selection in the host-specific toxin SnToxA. Mol. Plant Pathol. 8, 321–332. doi: 10.1111/j.1364-3703.2007.00396.x
Sun, X., Kosman, E., and Sharon, A. (2020). Stem endophytic mycobiota in wild and domesticated wheat: structural differences and hidden resources for wheat improvement. J. Fungi. 6, 1–19. doi: 10.3390/jof6030180
Sun, X., Sharon, O., and Sharon, A. (2023). Distinct features based on partitioning of the endophytic fungi of cereals and other grasses. Microbiol. Spectr. 11, e00611-23. doi: 10.1128/spectrum.00611-23
Tedersoo, L., et al. (2014). Global diversity and geography of soil fungi. Science 346, 1256688. doi: 10.1126/science.1256688
USDA (2024). Wheat (USDA Foreign Agricultural Service). Available online at: https://fas.usda.gov/data/production/commodity/0410000 (Accessed January 20, 2024).
Vujanovic, V., Mavragani, D., and Hamel, C. (2012). Fungal communities associated with durum wheat production system: A characterization by growth stage, plant organ and preceding crop. Crop Prot. 37, 26–34. doi: 10.1016/j.cropro.2012.02.006
Wachowska, U., et al. (2013). Response of epiphytes and endophytes isolated from winter wheat grain to biotechnological and fungicidal treatments. Polish J. Environ. Stud. 22, 267–273.
Xu, K. G., et al. (2018). Identification and pathogenicity of fungal pathogens causing black point in wheat on the north China plain. Indian J. Microbiol. 58, 159–164. doi: 10.1007/s12088-018-0709-1
Zheng, Y., et al. (2021). The assembly of wheat-associated fungal community differs across growth stages. Appl. Microbiol. Biotechnol. 105, 7427–7438. doi: 10.1007/s00253-021-11550-1
Keywords: wheat, phyllosphere, fungi, mycobiome, datamining, meta-analysis
Citation: Fischer MH, Rzepczynska A and Kjøller R (2025) Taxonomic diversity in the global wheat phyllosphere mycobiome – a meta analysis. Front. Plant Sci. 16:1597807. doi: 10.3389/fpls.2025.1597807
Received: 21 March 2025; Accepted: 02 July 2025;
Published: 30 July 2025.
Edited by:
Raffaella Maria Balestrini, National Research Council (CNR), ItalyReviewed by:
Nicola Pecchioni, Council for Agricultural Research and Economics, ItalyClaudia SL Vicente, University of Évora, Portugal
Copyright © 2025 Fischer, Rzepczynska and Kjøller. This is an open-access article distributed under the terms of the Creative Commons Attribution License (CC BY). The use, distribution or reproduction in other forums is permitted, provided the original author(s) and the copyright owner(s) are credited and that the original publication in this journal is cited, in accordance with accepted academic practice. No use, distribution or reproduction is permitted which does not comply with these terms.
*Correspondence: Marie Højmark Fischer, bWFyaWVAaG9lam1hcmstZmlzY2hlci5kaw==