 Hongyu Yan1
 Peijian Shi2*
 Weihao Yao2Feixue Jiang2Long Chen2Linli Deng2Meng Lian2Yi Heng3
 Karl J. Niklas4*
- 1School of Integrated Circuits, Chongqing University of Posts and Telecommunications, Chongqing, China
- 2Bamboo Research Institute, Nanjing Forestry University, Nanjing, China
- 3College of Landscape Architecture, Nanjing Forestry University, Nanjing, China
- 4School of Integrative Plant Science, Cornell University, Ithaca, NY, United States
Floral symmetry plays an important role in the evolution and ecology of flowering plants, yet quantifying the symmetry of the perianth remains challenging. Here, we quantify the floral symmetry of the daylily (Hemerocallis fulva) with a focus on tepal mass, area, and shape. H. fulva was selected for this study because its perianth exhibits weak bilateral symmetry, providing a unique opportunity to investigate floral forms that are transitional between radial and bilateral symmetry. Toward this end, the tepal fresh mass (FM), dry mass (DM), tepal area (A), and the ratio of tepal width to length (W/L) of 136 flowers of H. fulva were quantified. In addition, the tepal roundness index (RI) and the standardized index for bilateral asymmetry (SI) were calculated. For the purpose of comparison, the FM, DM, and A of 202 leaves were measured and calculated. Reduced major axis regression protocols were then used to fit the scaling relationships of mass vs. area for tepals and leaves. With the exception of W/L, there were no significant differences in the means of FM, DM, A, RI, and ln(SI) between any two of the three inner whorl tepals or between any two of the three outer whorl tepals. However, there were significant differences in the means of these six measures between inner and outer whorls of tepals. The 95% confidence intervals of the scaling exponents of FM vs. A and DM vs. A of the outer whorl included unity. In contrast, the lower bounds of the 95% confidence intervals of the scaling exponents of FM vs. A and DM vs. A of the inner whorl and leaves of H. fulva exceeded unity. Different metrics for size (i.e., tepal mass vs. area) and shape (i.e., the degree of deviation from a standard circle and the degree of bilateral symmetry) yield different assessments of H. fulva perianth morphometrics (i.e. radial vs. bilateral symmetry), thereby highlighting the challenge of assessing symmetry. The scaling relationships of perianth parts and leaves are statistically congruent and consistent with the phenomenon called “diminishing returns” and the classical hypothesis of serial homology.
1 Introduction
Symmetry plays an important role in physics, mathematics, and biology (Bahadur et al., 2019; Damerval et al., 2021) in part because it is generally sufficient to describe a variety of forms (Almeida and Galego, 2005; Manuel, 2009; Yu et al., 2022). In biology, symmetry also reflects how organisms adapt three-dimensionally to their environment (Damerval et al., 2021; Yu et al., 2022). This is particularly true for angiosperms whose floral symmetries affect pollination and thus seed production and fitness (Citerne et al., 2010; Jiang and Moubayidin, 2022). A typical flower consists of several organ-types (i.e., sepals, petals, stamens, and carpels), with each organ-type fulfilling a specific function (Jiang and Moubayidin, 2022). The ground plan consisting of a short axis with ovules protected by carpels, followed by stamens, and the perianth, which is typically composed of petals and sepals, is arranged sequentially from the center outward (Bateman et al., 2006; Reyes et al., 2016; Damerval et al., 2021). Thus, the flower has a well-conserved ground plan that can nevertheless manifest many different adaptive phenotypes (Citerne et al., 2010). Among these phenotypic variations, floral symmetry plays an important role because it can influence plant-pollinator interactions (Regal, 1982; Endress, 2001; Sargent, 2004; Wang et al., 2015; Vujić et al., 2015; Carleial et al., 2017; Savriama, 2018; Spencer and Kim, 2018; Wang et al., 2023).
Flowers are predominantly symmetrical and rarely asymmetrical (Citerne et al., 2010; Endress, 2012). Among symmetrical flowers, there are two main types of symmetry: actinomorphy (radial symmetry) and zygomorphy (bilateral symmetry) (Endress, 1999; Citerne et al., 2010; Endress, 2012; Jiang and Moubayidin, 2022; Naghiloo, 2020). Radially symmetric flowers are divided into equal halves by three or more planes of symmetry (Naghiloo, 2020; Jiang and Moubayidin, 2022), whereas bilaterally symmetric flowers are divided into two mirror images by a single plane (or axis) of symmetry (Naghiloo, 2020; Jiang and Moubayidin, 2022). In general, radially symmetric flowers are considered the ancestral state and are morphologically accessible to diverse pollinators from all directions (Soza et al., 2022; Wang et al., 2023). Bilaterally symmetric flowers are considered the derived state that can motivate pollinators with more precise pollen placement (Neal et al., 1998; Ushimaru et al., 2009; Ramírez et al., 2011; Soza et al., 2022). Although the transition from radial to bilateral symmetry may increase pollinator specificity (Fenster et al., 2009; Jesson and Barrett, 2002), it can also engender a greater reliance on specific pollinators, which presents a risk if reliable pollinators reduce in number and become extinct (Reyes et al., 2016; Wang et al., 2023). In addition, the symmetry of flowers is often correlated with their orientation. Most radially symmetric flowers are typically oriented horizontally, allowing pollinators to approach from multiple directions (Damerval et al., 2021; Jiang and Moubayidin, 2022), whereas bilaterally symmetrical flowers are usually oriented vertically, with only one direction displaying their unique symmetry (Ostler, 1976; Endress, 2001; Sargent, 2004; Citerne et al., 2010; Reyes et al., 2016; Wang et al., 2023).
Despite the importance of floral symmetry and its well-recognized role in the evolutionary dynamics of flowering plants, its quantitative analysis has presented a challenge, particularly because organic symmetry is often a size-dependent trait. One approach to this particular challenge is the use of scaling theory, which has revealed relationships among size-dependent traits such as mass and area (Niklas, 1994; Niklas et al., 2007). In this context, prior research has shown that the exponents governing the mass vs. area scaling relationships of foliage leaves typically exceed unity (i.e., increases in area typically fail to keep pace with increases in mass) a phenomenon known as “diminishing returns” (Niklas, 1994; Milla and Reich, 2007; Niklas et al., 2007; Wang et al., 2024). This phenomenon has important implications for the biomass allocation patterns of floral parts, which are considered homologs of foliage leaves (Wolff, 1774; Goethe, 1790; Eyde, 1975; Bailey, 2008; Guo et al., 2022).
The goal of this study was to quantify the floral symmetry of the daylily (Hemerocallis fulva) and to explore the scaling relationships of tepal mass vs. area and leaf mass vs. area. H. fulva (Asphodelaceae) was selected for this study not because it exhibits strict bilateral symmetry, but because it represents a transitional floral form. The flower’s slight bilateral symmetry, as shown by the curvature of its stamens and stigma (Figure 1), allows us to examine how different metrics may converge or diverge in assessing floral symmetry. Studying such a transitional species helps elucidate the complexity of symmetry as a continuous trait, rather than a binary state, and highlights the challenges in quantifying it rigorously. H. fulva is broadly available in temperate and subtropical regions of China, Israel, Afghanistan, and Southeast Asia (Chen and Junko, 2000). Its flower (known as “Jin Zhen Cai” in China) has been used as a “vegetable” and medicinal herb for 3,000 years (Hsu et al., 2023; Lei et al., 2024).
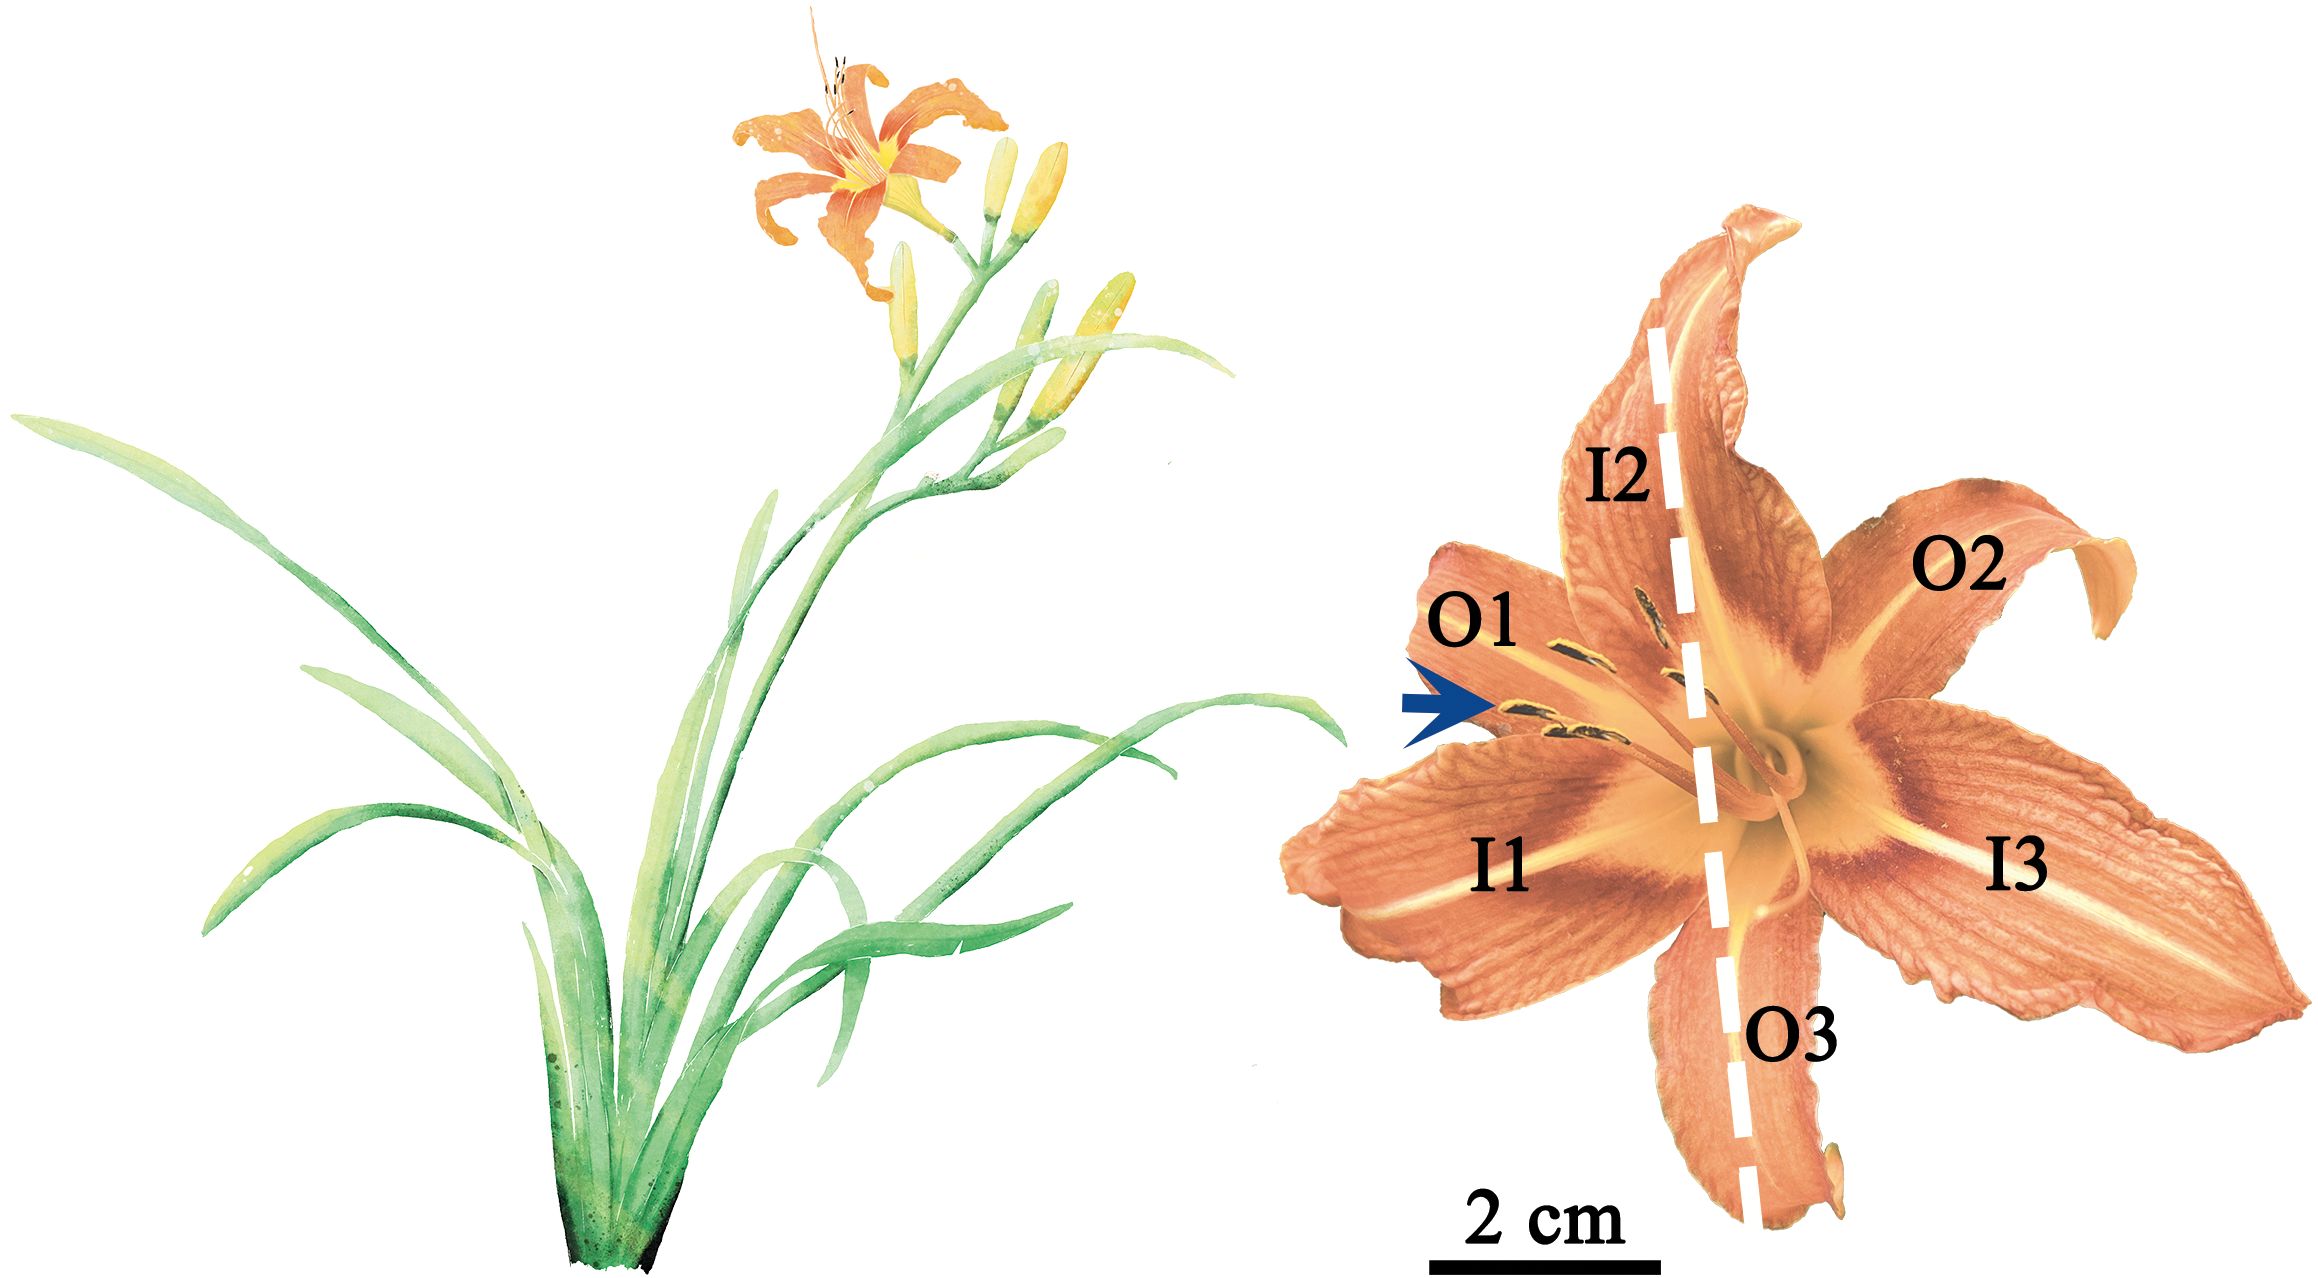
Figure 1. Representations of the above-ground morphology of a typical H. fulva plant (left) and a representative mature flower (right). I1, I2, I3, O1, O2, and O3 represent the tepals at the six positions denoted in the text and figures. The blue arrow denotes the stamens and stigma-styles; the white dashed line represents the reflection of insipient bilateral symmetry.
2 Materials and methods
2.1 Species and collection of information
A total of 136 mature, undamaged flowers and 202 leaves of H. fulva were randomly collected at the Xinzhuang Campus of Nanjing Forestry University, Nanjing, Jiangsu Province, China (32°4′51ʺN, 118°48′57ʺE) in early June 2024. The samples were immediately placed in an insulated box and transported to the laboratory within 20 minutes. Each flower consists of six tepals, arranged in two whorls (inner and outer), each containing three tepals (Figure 1). Thus, a total of 816 tepals (136 flowers × 6 tepals) were collected and used in the study. The stamens and stigma of mature flowers of H. fulva consistently curve upwards (Figure 1), establishing a top, bottom, left, and right orientation for each flower. The outer and inner tepals (denoted as “O” and “I”) were labeled in a clockwise direction (1, 2, 3). Specifically, I2 and O3 correspond to the top and bottom, I1 and O1 to the left, and O2 and I3 to the right (Figure 1).
2.2 Image processing and data acquisition
The fresh and dry mass (FM and DM, respectively) of tepals and leaves were measured because the former reflects the mass that must be mechanically supported, whereas dry mass is a measure of carbon allocation, with each metric providing different functional traits (Kramer and Boyer, 1995; Niklas and Spatz, 2012), using an electronic scale with a precision of 0.01 g (JM-A3002; Chaozeheng Equipment Company Limited, Zhuji, Zhejiang, China). Each tepal and leaf was subsequently scanned at 600-dpi resolution with an Epson photo scanner (V550, Epson Indonesia, Batam, Indonesia). Adobe Photoshop 2021 (version 22.4.2; Adobe Systems Incorporated, San Jose, CA, USA) was used to obtain black and white images of tepal and leaf edges, which were saved as bitmap images at a resolution of 600-dpi. We used the Matlab (version ≥ 2009a; MathWorks, Natick, MA, USA) procedure developed by Shi et al. (2018a) and Su et al. (2019) to calculate the pixel values of each image and obtain the planar coordinates of tepal and leaf boundary points.
The “bilat” function in the “biogeom” package (version 1.4.3; Shi et al., 2024) based on the R software (version 4.2.0; R Core Team, 2022) was used to calculate the tepal area (A), tepal length (L, defined as the distance from the apex to the base of the tepal), tepal width (W, defined as the maximum distance between two points on a tepal profile through a straight line perpendicular to the tepal length axis), tepal perimeter, the standardized index for bilateral asymmetry (SI), and lamina area (LA). The ratio of tepal width to length (W/L) was also calculated.
Flower and leaf data are available in online Supplementary Tables S1, S2.
2.3 Tepal shape deviation from a standard circle and symmetry measures
The roundness index (RI) was used to measure the deviation of tepal or leaf shape from a standard circle (Niinemets, 1998; Peppe et al., 2011) and SI (Shi et al., 2018b; Mu et al., 2024) was used to assess the degree of bilateral symmetry.
RI was calculated using the equation
where P is tepal or leaf perimeter and A is tepal or leaf area. A larger RI reflects a smaller degree of shape deviation from a standard circle. To measure the extent of tepal bilateral symmetry, 1000 equidistant strips (rectangles) were established (Figure 2, where only five strips are displayed for clarity). According to Shi et al. (2018b), SI was developed to reduce the influence of organ size on symmetry measurement, and they used 999 strips in their analysis. Similarly, Mu et al. (2024) adopted 1000 strips for quantifying SI in leaves with complex shapes. While both studies did not systematically test the effect of strip number, their consistent use of a large number of strips suggests that such resolution improves stability. In this study, we adopted 1000 strips based on this precedent. The intersection between each strip was divided into upper (left) and lower (right) parts. The standardized index (SI) for tepal or leaf asymmetry quantifies the average of the relative area differences between the left and right parts for all the 1000 intersections of the strips. The mathematical expression of SI is
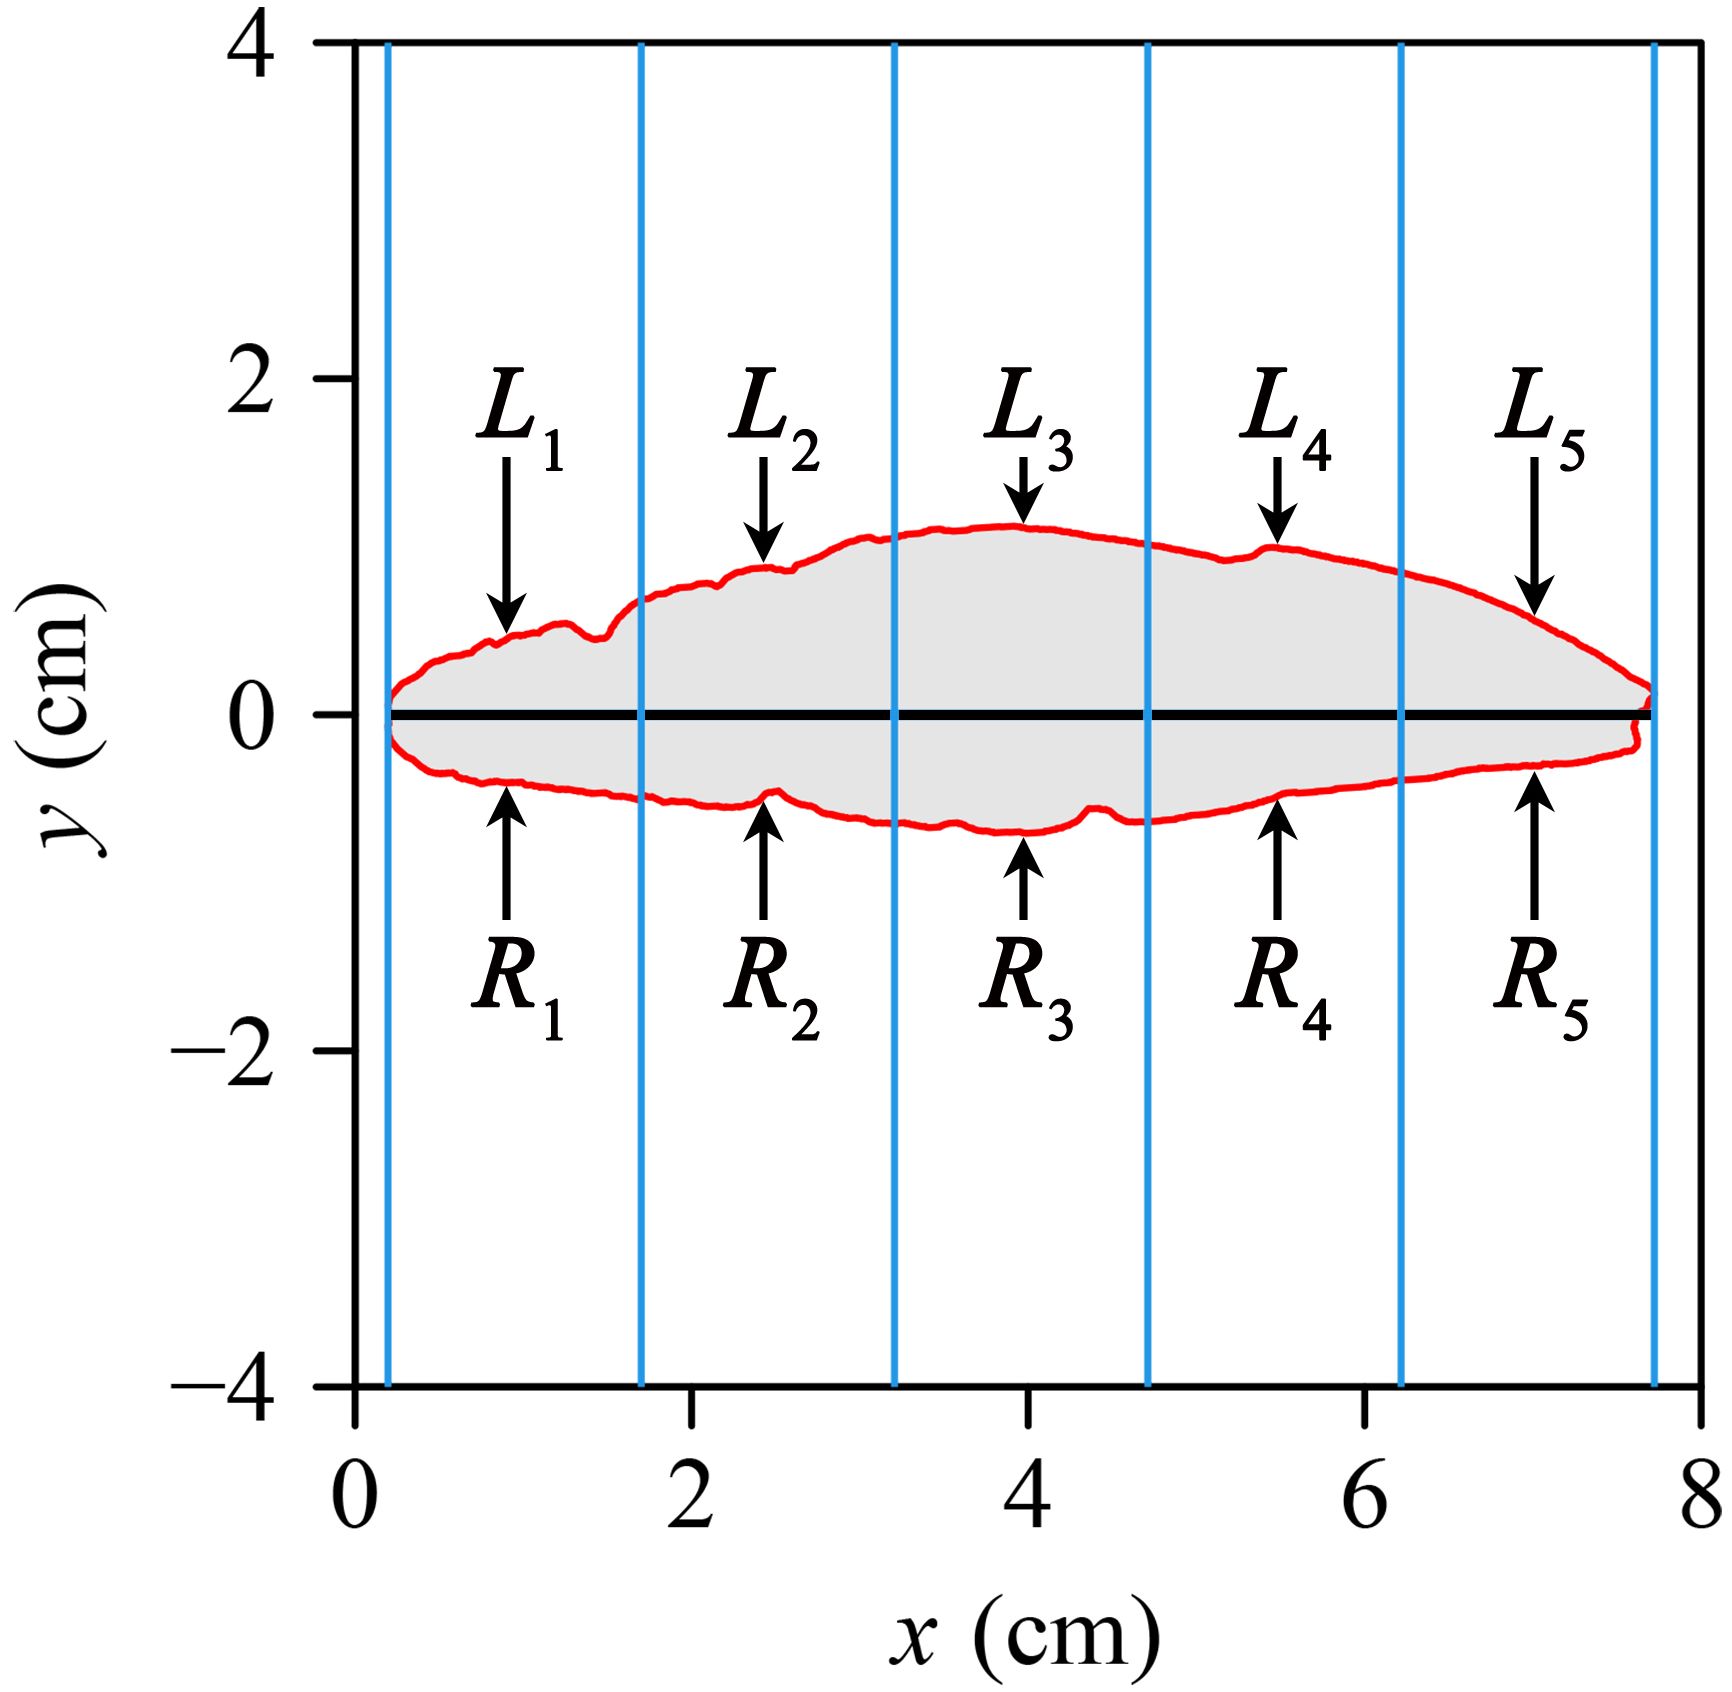
Figure 2. An illustration of the protocols used to calculate the standardized index of bilateral asymmetry (SI), showing only five equidistant strips as opposed to 1000 strips for simplicity, which were used in this study. The intersection between each strip and the tepal in each strip was divided into the upper (left) and lower (right) parts: L1 to L5 represent the areas of the left part, and R1 to R5 represent the areas of the right part.
where i represents the i-th strip, and Li and Ri represent the left and right areas of the i-th strip, respectively. A smaller SI reflects a higher degree of bilateral symmetry; SI was log-transformed to ensure normality. Equations 1 and 2 were used to quantify the shape and bilateral symmetry of each tepal.
2.4 Data analysis
A power-law function was used to describe the scaling relationships of FM vs. A and DM vs. A, as well as LFM vs. LA and LDM vs. LA, i.e.,
where Y1 and Y2 are any two interdependent variables (e.g., tepal area and mass), β is the normalization constant, and α is the scaling exponent of the relationship between Y1 and Y2 (Niklas, 1994). When both sides of Equation 3 were log-transformed, the power-law function takes the form
where y = ln(Y1), x = ln(Y2), and γ = ln(β). The parameters γ and α in Equation 4 were determined using reduced major axis regression protocols (Niklas, 1994; Quinn and Keough, 2002). Tukey’s HSD test (α = 0.05) was used to determine differences in FM, DM, A, W/L, RI, and ln(SI). The bootstrap percentile method (Efron and Tibshirani, 1993; Sandhu et al., 2011) with 3000 bootstrap replicates was used to obtain the 95% confidence intervals (CIs) of scaling exponents of Y1 vs. Y2.
All calculations were performed and figures constructed using R software (version 4.2.0; R Core Team, 2022).
3 Results
Different metrics for symmetry obtained different results. Specifically, there were no significant differences in the means of FM, DM, A, RI, and ln(SI) among I1, I2, and I3, or among O1, O2, and O3 (Figure 3). These metrics indicate that both the inner and outer tepal whorls manifest radial symmetry. In contrast, there were significant differences in the means of W/L between I1 and I2 and between O2 and O3 (Figure 3D), indicating that the inner and outer tepal whorls are not radially symmetrical.
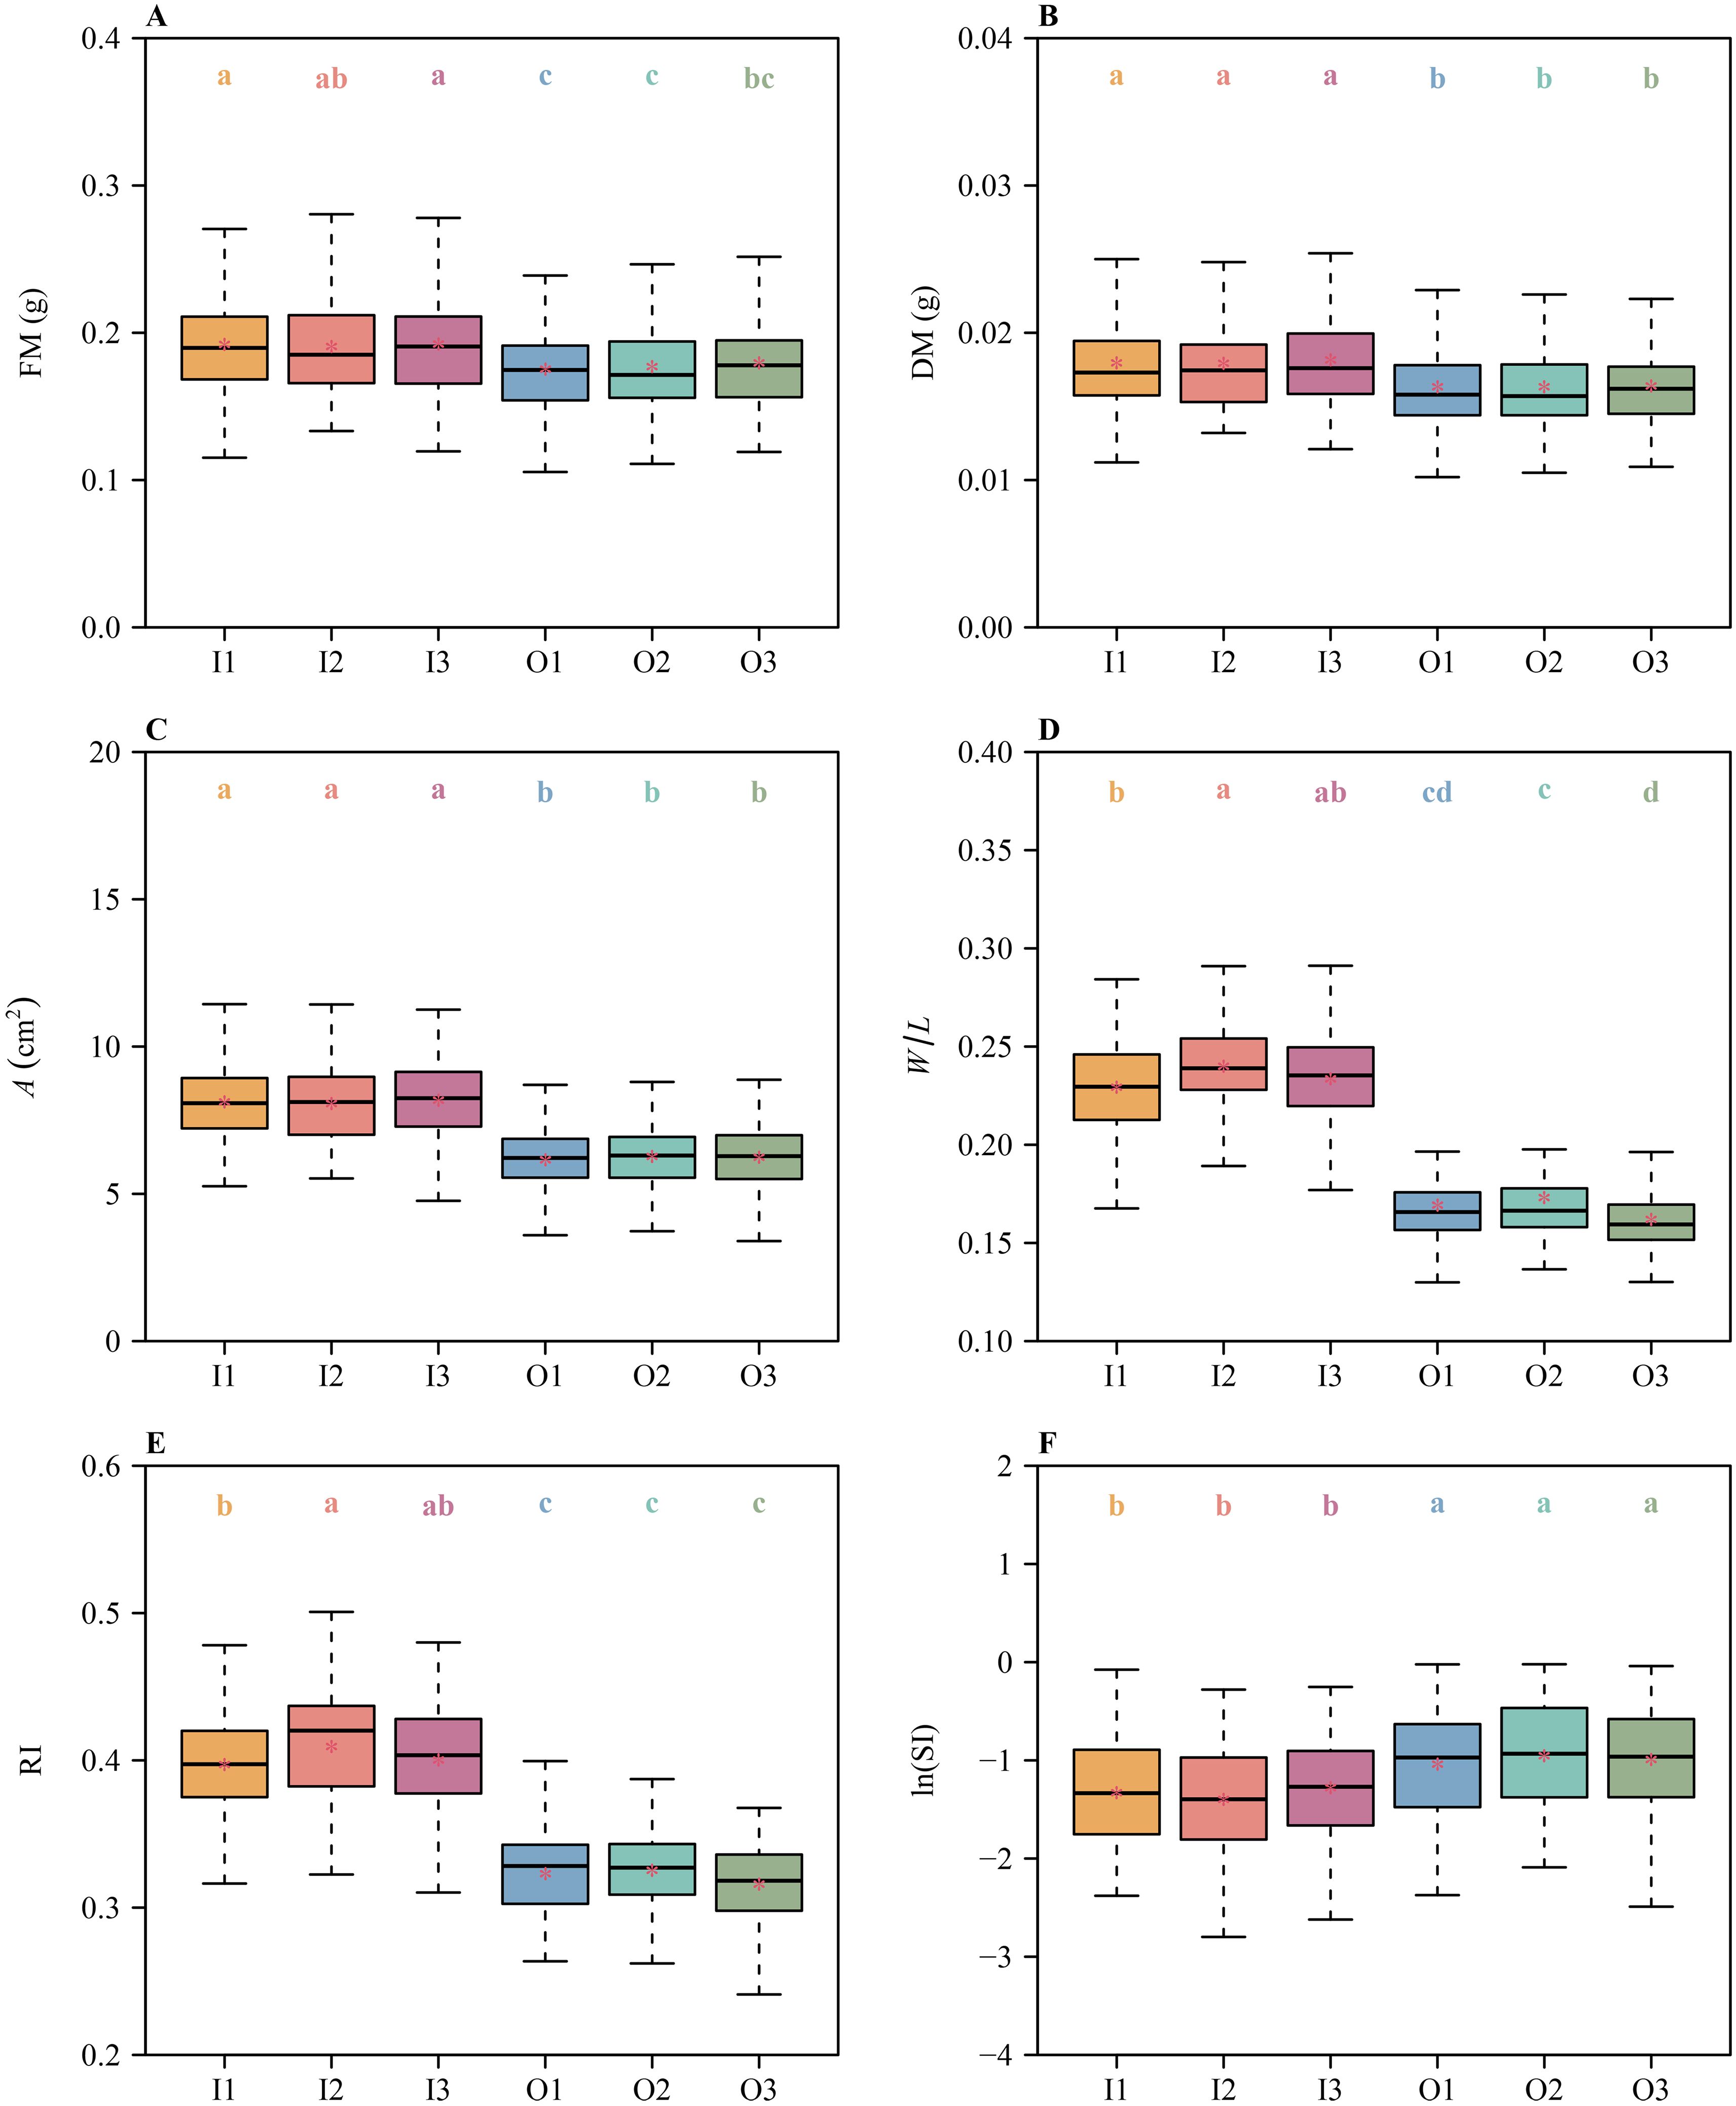
Figure 3. Boxplots of (A) tepal fresh mass, (B) tepal dry mass, (C) tepal area, (D) the ratio of width to length of tepals, (E) the tepal roundness index values, and (F) the natural logarithm of the standardized index for bilateral asymmetry values for each of the six tepals of H. fulva. The lowercase letters a–d indicate the significance of the difference in means between any two tepals based on the Tukey’s HSD test. Means with different letters are significantly different at P < 0.05. The horizontal solid lines represent the medians, and the asterisks within each box represent the means. In the x-axis label, I1, I2, I3, O1, O2, and O3 denote the six tepals (see Figure 1).
Likewise, there were significant differences in the means of FM, DM, A, W/L, RI, and ln(SI) between the inner and outer whorls (Figure 4), indicating that the inner and outer whorls differed significantly in both size and shape, i.e., the inner whorl had larger means of FM, DM, and A compared to the outer whorl (Figure 4). These metrics indicated that the inner whorl is larger than outer whorl, reflecting a petal vs. sepal duality. In addition, the inner whorl had larger means of W/L and RI, and smaller means of ln(SI) than the outer whorl (Figure 4), i.e., the inner whorl manifested a broader shape, lower degree of shape deviation from a standard circle, and a greater degree of bilateral symmetry compared to the outer whorl.
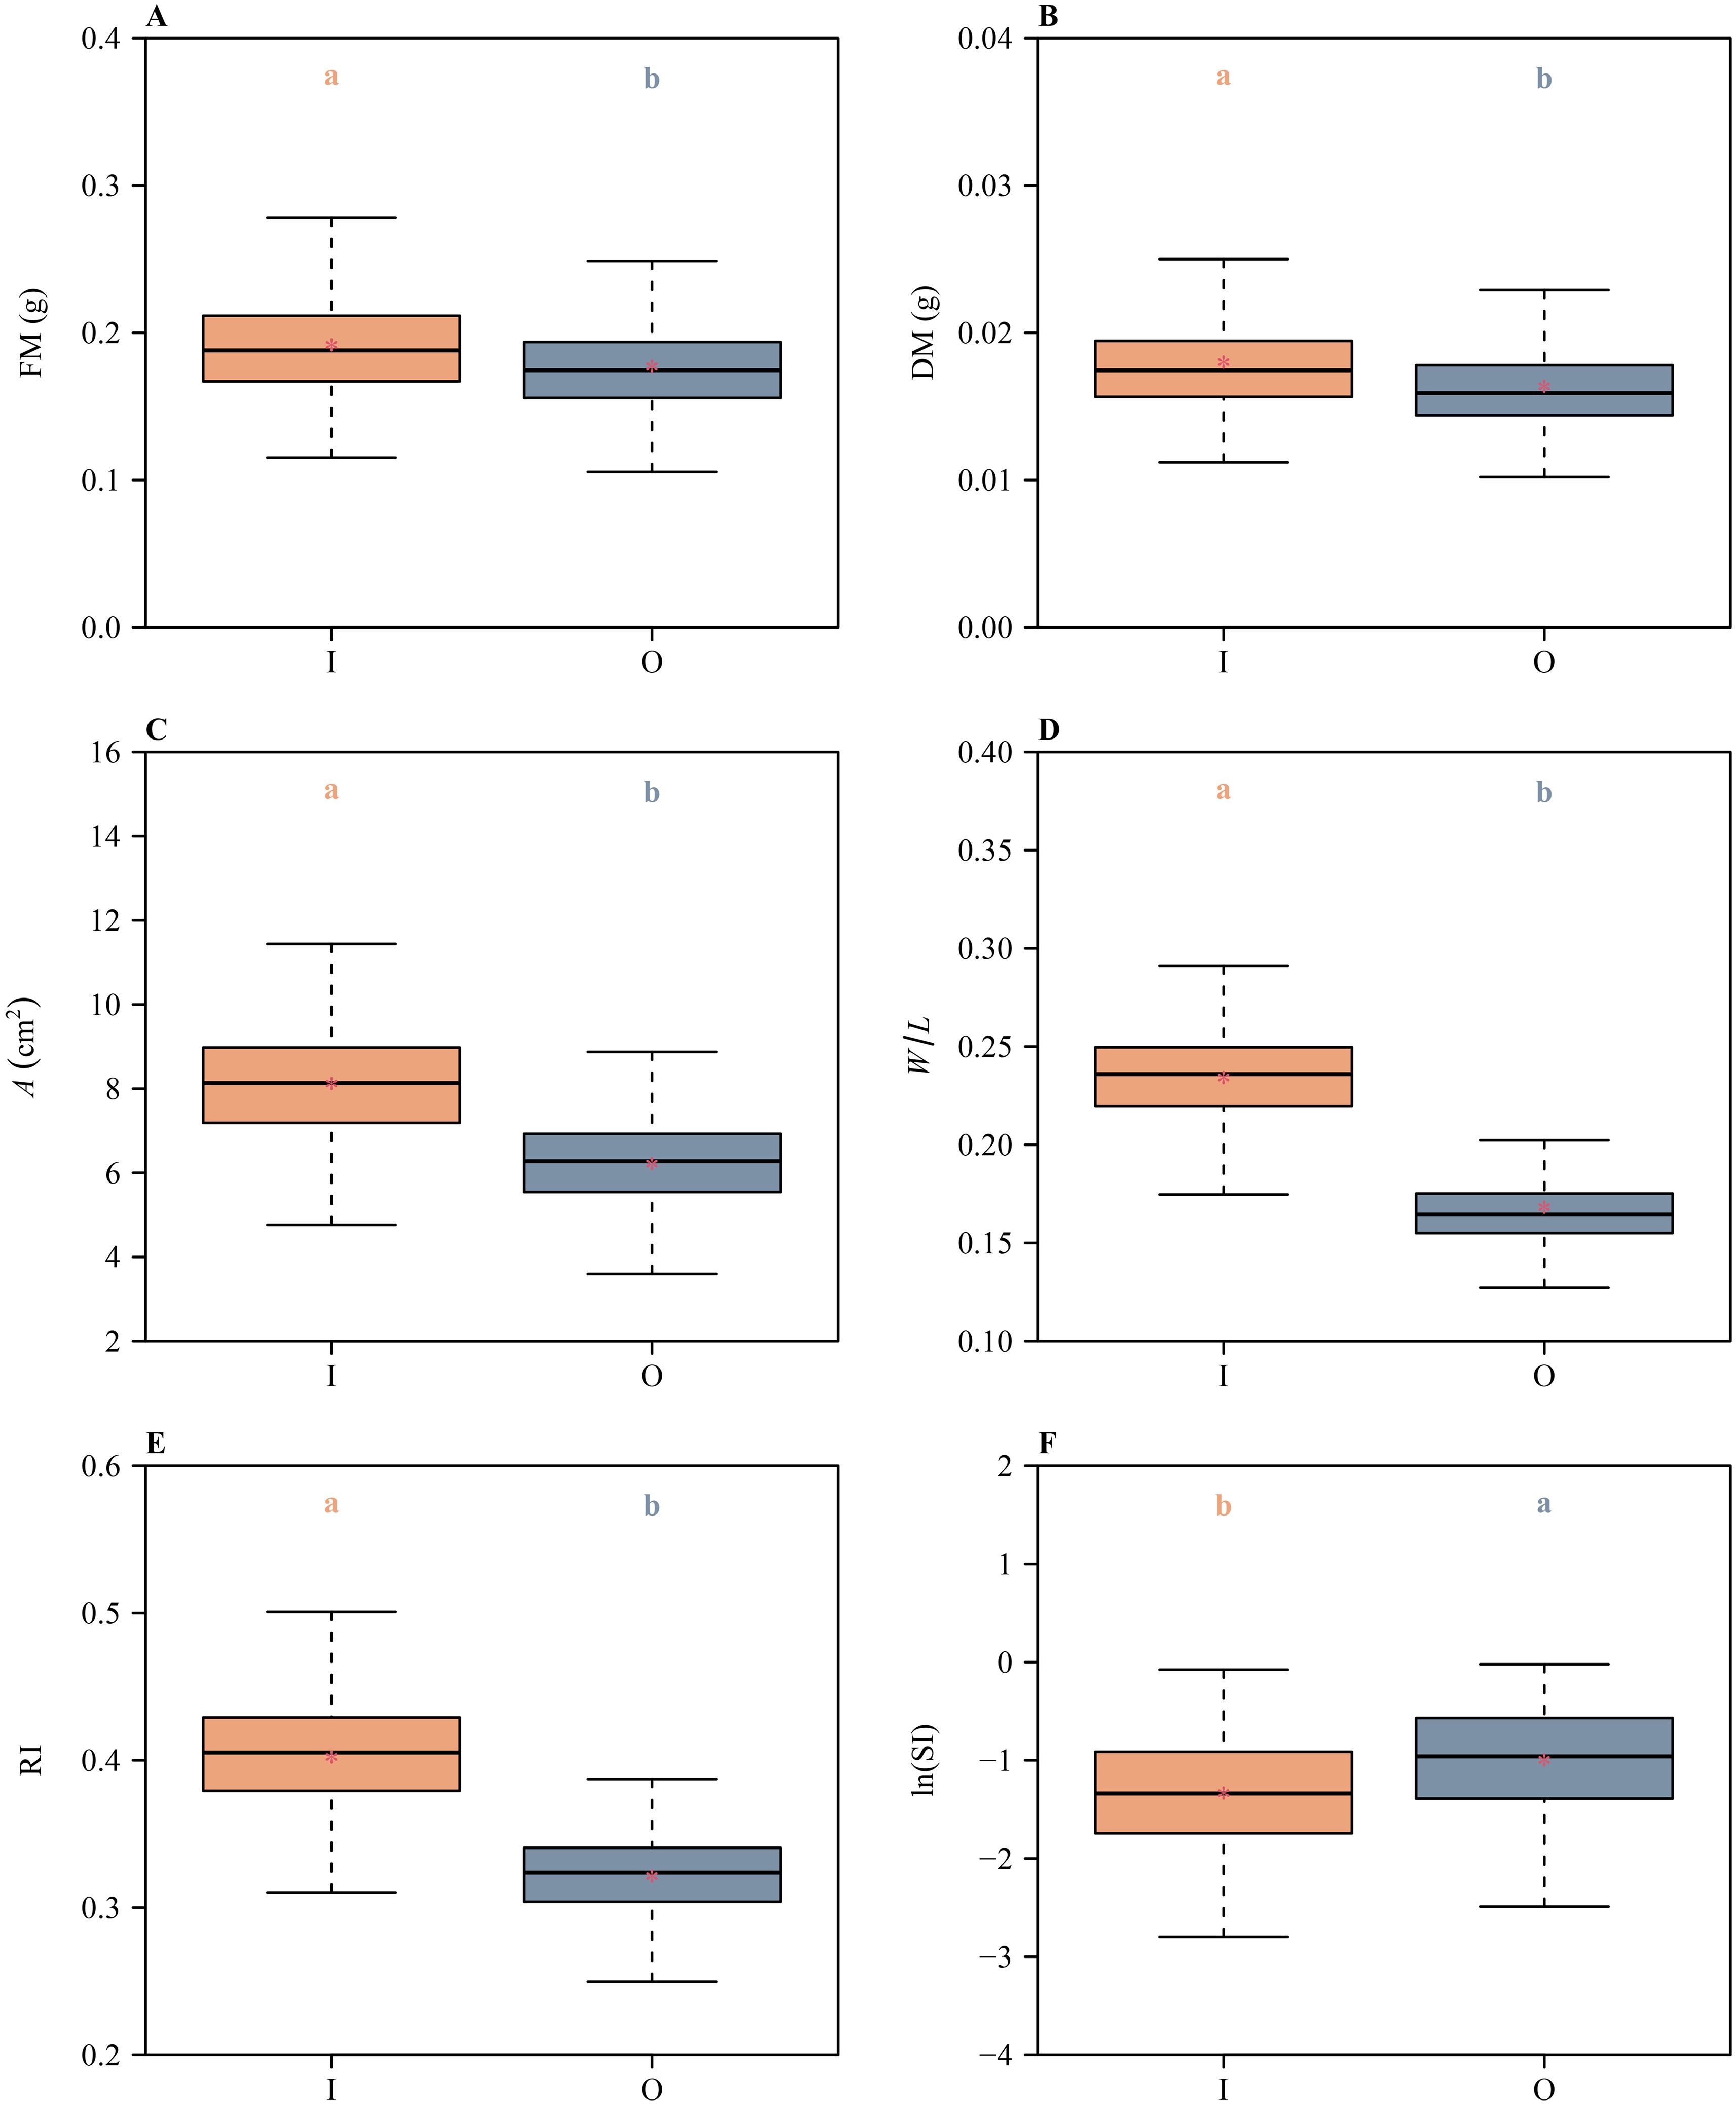
Figure 4. Boxplots of (A) tepal fresh mass, (B) tepal dry mass, (C) tepal area, (D) the ratio of width to length of tepals, (E) the tepal roundness index values, and (F) the natural logarithm of the standardized index for bilateral asymmetry values for the inner and outer tepal whorls of H. fulva. The lowercase letters a and b above the numerical values on the top of each box indicate the significance of the difference in means between any two tepals based on the Tukey’s HSD test. Means with different letters are significantly different at P < 0.05. The horizontal solid lines are the medians, and the asterisks within boxes represent the means. In the x-axis label, I and O represent the inner and outer whorl tepals, respectively.
The 95% CIs of the scaling exponents of both FM vs. A and DM vs. A for outer whorl included unity (Figure 5), indicating that both scaling relationships are isometric. However, the lower bounds of the 95% CIs of the scaling exponents of both FM vs. A and DM vs. A for the inner whorl exceeded unity (Figure 5), indicating a “diminishing returns” phenomenon, i.e., increases in tepal area fail to keep pace with increases in tepal mass. These scaling analyses were based on a total of 816 tepals, including 408 inner and 408 outer tepals (136 flowers × 3 tepals per whorl), with n = 408 representing the number of tepals in each whorl, as shown in Figure 5. Likewise, the lower bounds of the 95% CIs of the scaling exponents of LFM vs. LA and LDM vs. LA both exceeded unity (Figure 6), indicating “diminishing returns”, i.e., increases in lamina area fail to keep pace with increases in leaf mass.
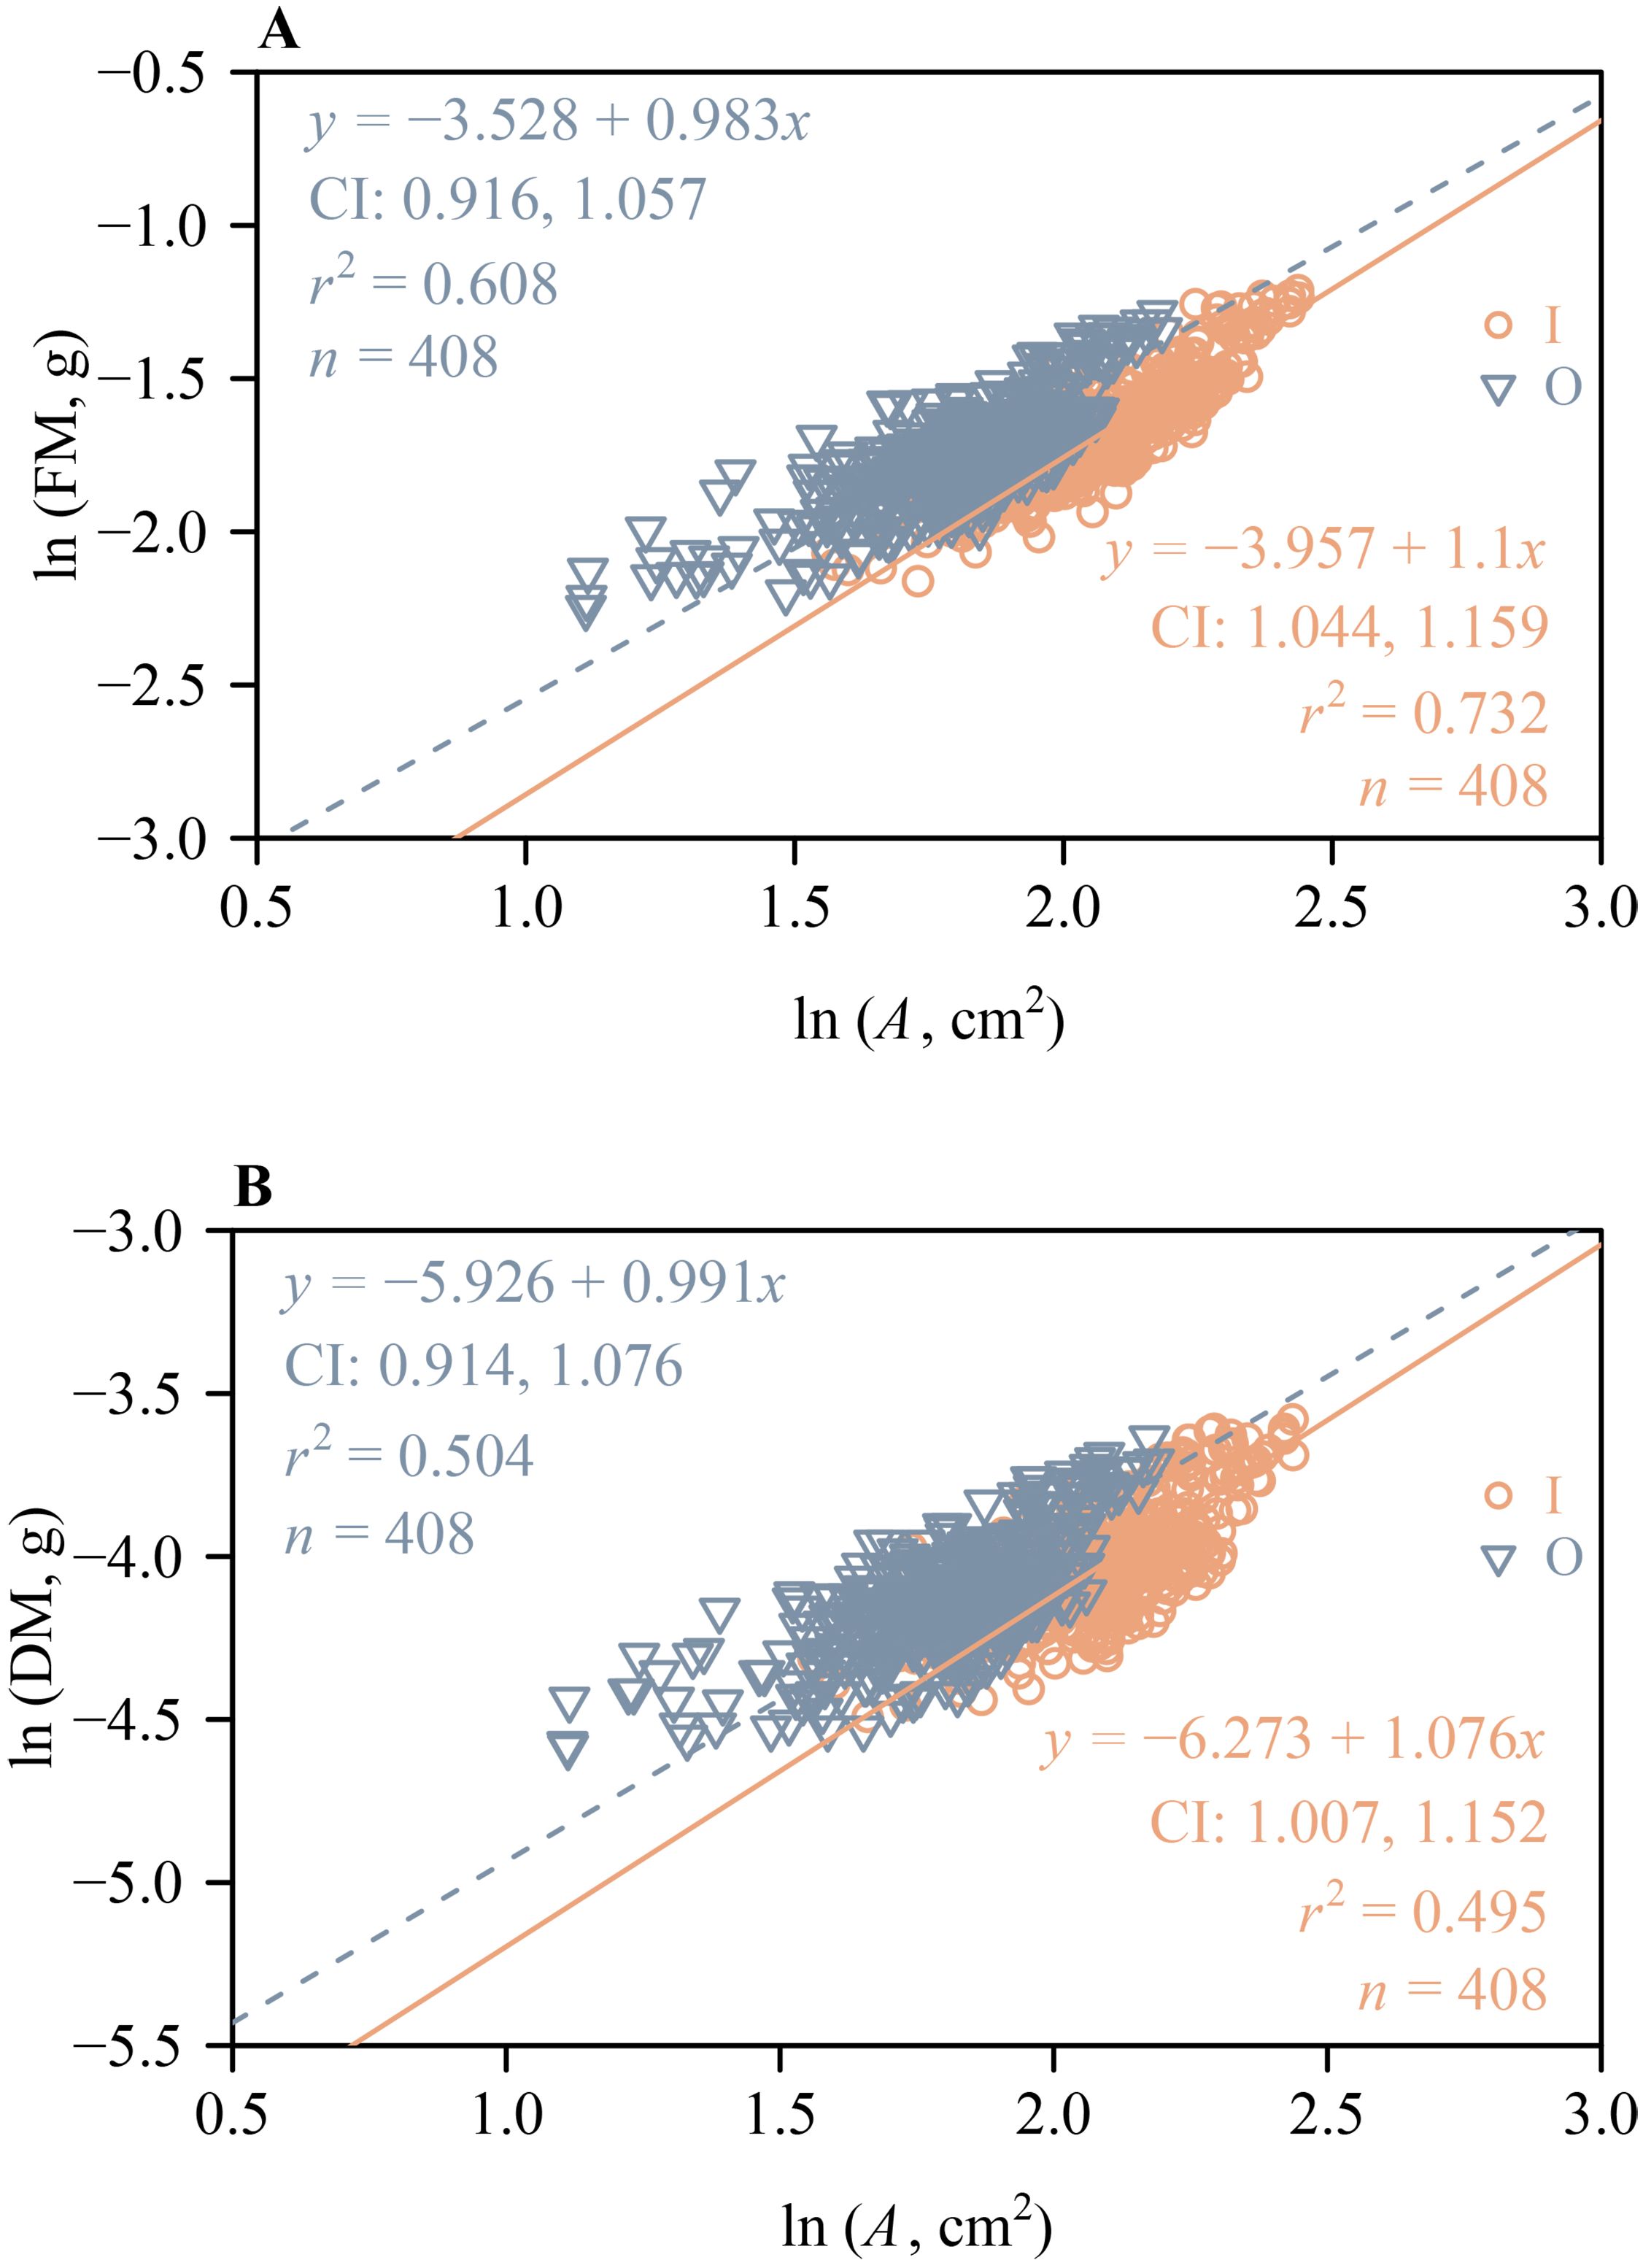
Figure 5. The log-log bivariate linear fit of tepal fresh mass vs. tepal area for the inner whorl and outer whorl of tepals of H. fulva (A). The log-log bivariant linear fit of tepal dry mass vs. tepal area for the inner whorl and outer whorl tepals of H. fulva (B). CI is the 95% confidence interval of the slope; r² is the coefficient of determination; n is the number of tepals for both inner and outer whorl tepals.
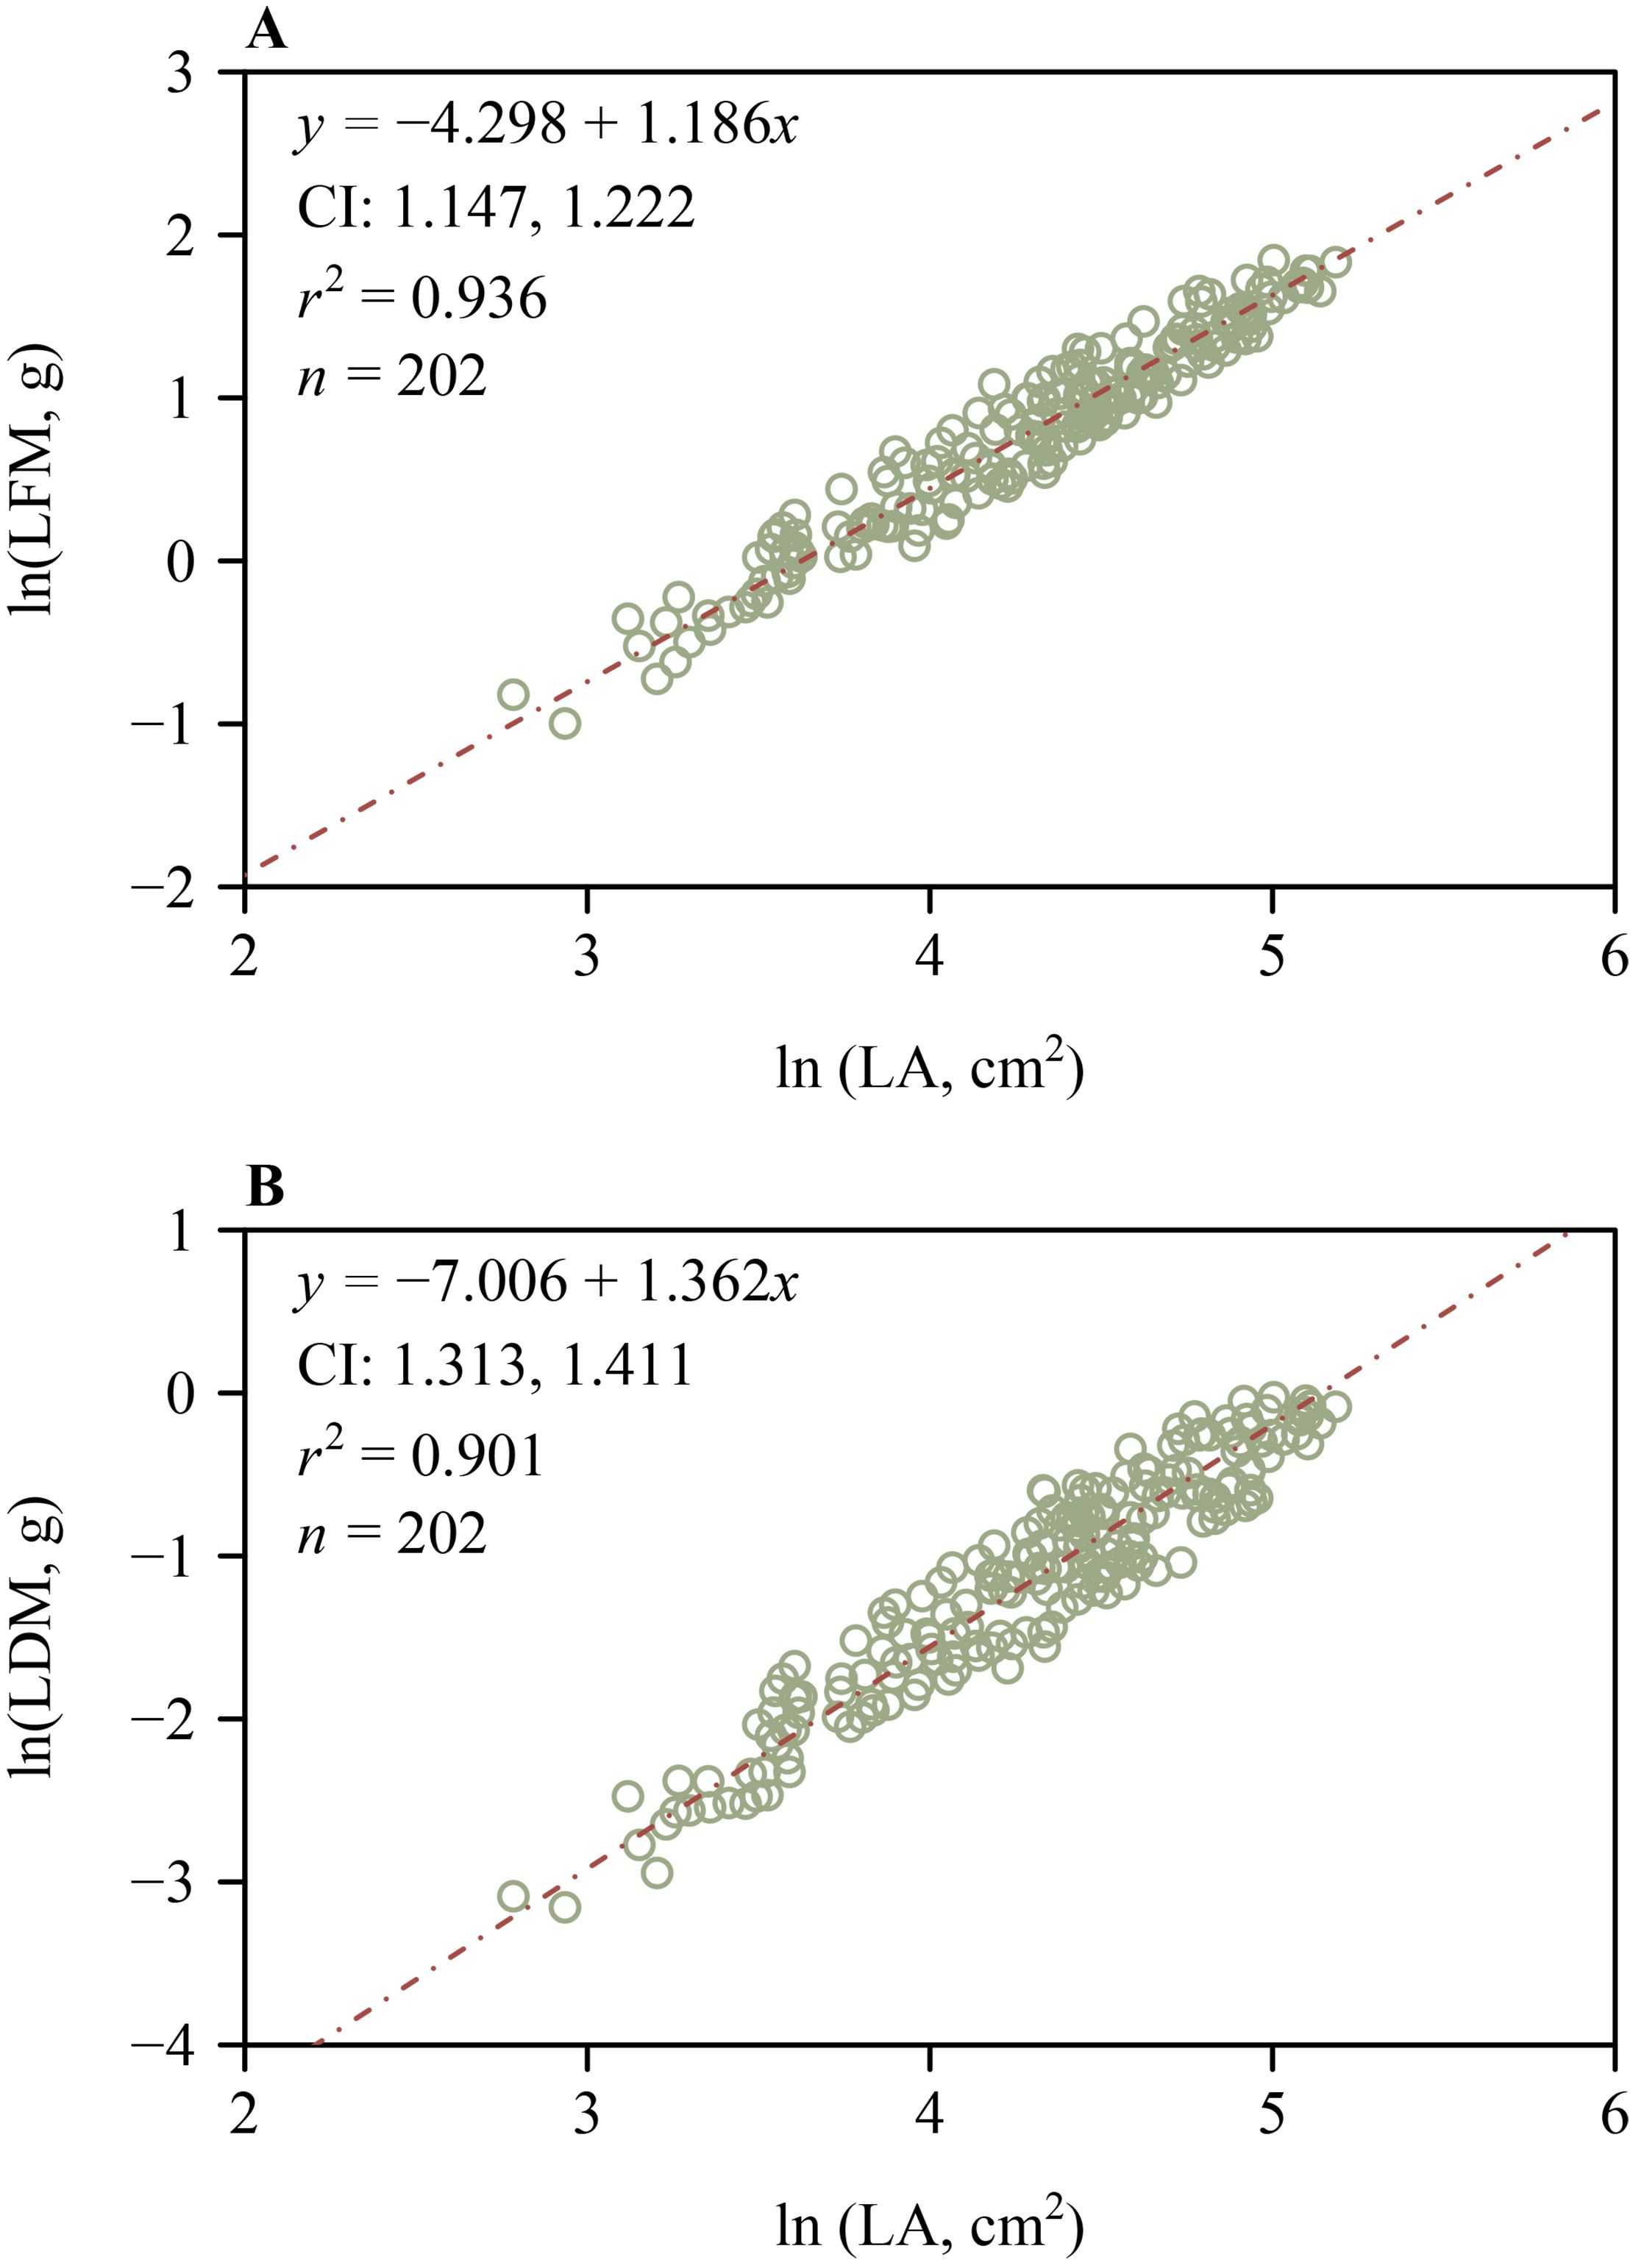
Figure 6. Log-log bivariate scaling relationships for leaf (lamina) H. fulva. (A) Lamina fresh mass vs. lamina area. (B) Lamina dry mass vs. lamina area. CI is the 95% confidence interval of the slope; r² is the coefficient of determination; n is the number of leaves in each sample.
4 Discussion
The data presented for the daylily H. fulva indicate that different metrics used to evaluate floral symmetry and size yield different results. The following sections discuss the implications of these results regarding the assessment of floral symmetry by comparing the inner and outer whorls of tepals, and the scaling relationships of lamina and tepal mass vs. area.
4.1 Floral symmetry
Floral symmetry has traditionally been described using the characteristics of perianth shape and size (e.g., symmetry, mass, and area) and the number and arrangement of stamens and carpels (Busch and Zachgo, 2009; Jiang and Moubayidin, 2022). The standardized index for bilateral asymmetry (SI) is a key metric for assessing the degree of bilateral symmetry (Shi et al., 2018b; Mu et al., 2024). However, we used it in combination with other size and shape metrics to capture distinct aspects of floral symmetry. No single metric can comprehensively describe the complex geometry of floral symmetry. By comparing multiple metrics, we aimed to provide a more comprehensive and nuanced evaluation of floral symmetry. Among these metrics, those quantifying shape have presented arguably the greatest challenges. For example, the data gathered for H. fulva indicate no significant differences in the means of fresh and dry mass (FM and DM) and the surface area (A) of the three tepals of the inner whorl or the three tepals of the outer whorl (Figure 3). Likewise, two metrics used to assess symmetry (RI and ln(SI)) revealed no differences among the three tepals for each of the two whorls. However, there are significant differences in the means of W/L between tepals I1 and I2, and between tepals O2 and O3 (Figure 3D). Thus, in terms of size, degree of shape deviation from a standard circle (RI), and the degree of bilateral symmetry (SI), both the inner and outer whorls of H. fulva are assessed as radially symmetrical, whereas in terms of W/L, they are asymmetric.
These seemingly conflicting results might be explained by the corrugated and often folded structure of H. fulva tepals (Figure 1). However, corrugations and folds do not easily explain differences in FM or DM, or in W/L, all of which are comparatively easily measured when tepals are weighed or flattened manually. A more likely explanation is rarely perfect in biology. Indeed symmetry is often “approximate”, with deviations emerging from finely tuned responses to microenvironmental conditions during development and maturation (Damerval et al., 2021). We suggest that the shape irregularities observed for H. fulva tepals indicates a level of responsive developmental flexibility that can result in structural complexity (Jiang and Moubayidin, 2022). Indeed, “symmetry breaking” is reported to be an adaptive strategy to adjust floral interactions with pollinators (Endress, 1999; Mora-Carrera et al., 2019).
This hypothesis is consistent with the observation that the stamens and stigma-styles of mature H. fulva flowers exhibit a sigmoidal curvature (Figure 1), which achieves different degrees of bilateral symmetry in the entire flower depending on the orientation of flowers with respect to the horizontal. This phenomenon can result in a widespread, weak or strong bilateral symmetry, as observed in many other angiosperm species (Citerne et al., 2010; Endress, 2012; Naghiloo, 2020). This type of bilateral symmetry is directly influenced by the position of the flower and may provide a precondition for the evolution of more elaborate bilateral symmetry (Endress, 2012; Naghiloo, 2020). In addition, symmetry may change during flower development, with the symmetry in early developmental stages differing from that in the mature flower (Damerval et al., 2021; Jiang and Moubayidin, 2022).
For example, Vincent and Coen (2004) report that in Antirrhinum majus, the early meristem shows bilateral symmetry. At sepal initiation, the bud is nearly radially symmetrical, but subsequently develops into and maintains bilateral symmetry. In the case of H. fulva, the sigmoidal curvature of the stamens and stigma commonly develops late in floral development (Endress, 2012). Thus, it is possible that in the early stages of H. fulva flower development, the stamens and stigma have not yet curved (i.e., the floral symmetry of H. fulva is radial) and only later assume varying degrees of bilateral or asymmetric morphology. Ontogenetic analyses are required to evaluate this proposition.
4.2 Comparison of inner and outer whorl tepals
A variety of metrics used in this study [i.e., FM, DM, A, W/L, RI, and ln(SI)] indicate that there are statistically significant differences in size and shape between the inner and outer whorls of H. fulva (Figure 4). The tepals in the inner whorl are larger, broader, and have a lower degree of deviation of tepal shape from a standard circle, and a greater degree of bilateral symmetry compared to the outer whorl. These trends are consistent with an incipient differentiation between sepals and petals reflecting different functionalities. For example, the tepals in the inner whorl may provide positional cues for pollinators, whereas the tepals of the outer whorl may provide protection during the development of stamens and carpels. Similar proposals have been presented (Citerne et al., 2010; Jiang and Moubayidin, 2022).
In addition, the 95% CIs of the scaling exponents of FM and DM vs. A for the outer whorl tepals include unity (Figure 5). In contrast, the lower bounds of the 95% CIs of the scaling exponents of FM vs. A and DM vs. A for the inner whorl tepals exceed unity (Figure 5), which is consistent with the phenomenon called “diminishing returns” (Niklas et al., 2007). These differences once again likely reflect different functionalities. For example, each tepal need only bear its own weight or that of neighboring tepals, as well as dynamic forces, such as wind (Gardiner et al., 2016). Wind pollination, a key mechanism in many plant species (Regal, 1982; Wang et al., 2019; Butcher et al., 2020), further contributes to the environmental pressures faced by tepals. The inner whorl tepals, which have a significantly larger area compared to the outer whorl (Figure 4), are closer to the stamens and stigma compared to the outer whorl tepals, and may provide positional cues for pollinators. Together, these factors may explain the “diminishing returns” phenomenon between mass and area for the inner whorl tepals.
4.3 Scaling relationships of mass vs. area for tepals and leaves
Classical botanical theory interprets floral parts as metameric homologues of foliage leaves, a concept of serial homology that emerged from the writings of J. W. von Goethe (Wolff, 1774; Goethe, 1790; Eyde, 1975; Bailey, 2008; Guo et al., 2022). The 95% CIs of the scaling exponents of FM and DM vs. A include unity for the outer whorl tepals of H. fulva (Figure 5), indicating that these relationships are isometric. In contrast, for the inner whorl tepals, the lower bounds of the 95% CIs of the scaling exponents of FM and DM vs. A exceed unity (Figure 5), indicating that increases in tepal area fail to keep pace with increases in tepal mass, consistent with the phenomenon called “diminishing returns” (Niklas et al., 2007). Similarly, increases in leaf lamina area fail to keep pace with increases in leaf mass, as evidenced by the lower bounds of the 95% CIs of the scaling exponents of LFM vs. LA and LDM vs. LA, which exceed unity (Figure 6). This may be due to the slender and elongated nature of the leaves of H. fulva (Figure 1), which not only bear more static weight from the upper parts of the plant but also withstand greater dynamic forces, such as wind, compared to flowers (Gardiner et al., 2016). Although the homology between floral parts and leaves has not been directly confirmed, our data can be interpreted to indicate that the leaves and perianth parts of H. fulva may have evolved distinct adaptive biomass allocation strategies, particularly in terms of mechanical traits.
5 Conclusions
This study provides additional insights into the floral symmetry of H. fulva and explores the scaling relationships of tepal mass vs. area and leaf mass vs. area. Significant differences in size, shape, and the scaling relationship between tepal mass and area for the inner and outer whorl tepals were detected, which can be interpreted to indicate that the adaptive functionalities of the inner and outer whorls differ. The scaling relationships between tepal mass and area, as well as leaf mass and area, reveal a finely tuned balance in resource allocation and mechanical performance. Perhaps more important, the data indicate that different metrics for measuring size and shape can yield what appear to be conflicting assessments of symmetry, which highlights the challenge of evaluating biological symmetries. Future studies are required to explore how floral symmetry and scaling relationships influence ecological adaptation and pollination efficiency in other plant species.
Data availability statement
The original contributions presented in the study are included in the article/Supplementary Material. Further inquiries can be directed to the corresponding authors.
Author contributions
HY: Formal Analysis, Writing – original draft, Investigation. PS: Formal Analysis, Writing – review & editing, Supervision. WY: Writing – original draft, Investigation. FJ: Writing – review & editing, Investigation. LC: Writing – review & editing, Investigation. LD: Writing – review & editing, Investigation. ML: Investigation, Writing – review & editing. YH: Investigation, Writing – review & editing. KN: Writing – review & editing, Formal Analysis, Supervision.
Funding
The author(s) declare that no financial support was received for the research and/or publication of this article.
Acknowledgments
The authors thank Chengkang Wang and Jinfeng Wang for their valuable help in the preparation of this work. We also thank the handling editor and referees for their forthcoming comments.
Conflict of interest
The authors declare that the research was conducted in the absence of any commercial or financial relationships that could be construed as a potential conflict of interest.
Generative AI statement
The author(s) declare that no Generative AI was used in the creation of this manuscript.
Publisher’s note
All claims expressed in this article are solely those of the authors and do not necessarily represent those of their affiliated organizations, or those of the publisher, the editors and the reviewers. Any product that may be evaluated in this article, or claim that may be made by its manufacturer, is not guaranteed or endorsed by the publisher.
Supplementary material
The Supplementary Material for this article can be found online at: https://www.frontiersin.org/articles/10.3389/fpls.2025.1599033/full#supplementary-material
References
Almeida, J. and Galego, L. (2005). Flower symmetry and shape in Antirrhinum. Int. J. Dev. Biol. 49, 527–537. doi: 10.1387/ijdb.041967ja
Bahadur, B., Krishnamurthy, K. V., Ghose, M., and Adams, S. J. (2019). Asymmetry in plants: biology of handedness (Boca Raton: CRC press).
Bailey, C. D. (2008). Plant systematics: a phylogenetic approach. Cladistics 24, 848–850. doi: 10.1111/j.1096-0031.2008.00212.x
Bateman, R. M., Hilton, J., and Rudall, P. J. (2006). Morphological and molecular phylogenetic context of the angiosperms: contrasting the ‘top-down’ and ‘bottom-up’ approaches used to infer the likely characteristics of the first flowers. J. Exp. Bot. 57, 3471–3503. doi: 10.1093/jxb/erl128
Busch, A. and Zachgo, S. (2009). Flower symmetry evolution: towards understanding the abominable mystery of angiosperm radiation. Bioessays 31, 1181–1190. doi: 10.1002/bies.200900081
Butcher, C. L., Rubin, B. Y., Anderson, S. L., and Lewis, J. D. (2020). Pollen dispersal patterns differ among sites for a wind-pollinated species and an insect-pollinated species. Am. J. Bot. 107, 1504–1517. doi: 10.1002/ajb2.1554
Carleial, S., van Kleunen, M., and Stift, M. (2017). Small reductions in corolla size and pollen: ovule ratio, but no changes in flower shape in selfing populations of the North American Arabidopsis lyrata. Oecologia 183, 401–413. doi: 10.1007/s00442-016-3773-4
Citerne, H. L., Jabbour, F., Nadot, S., and Damerval, C. (2010). The evolution of floral symmetry. Adv. Bot. Res. 54, 85–137. doi: 10.1016/S0065-2296(10)54003-5
Damerval, C., Jabbour, F., Nadot, S., and Citerne, H. L. (2021). Evolution of symmetry in plants (Cham: Springer International Publishing).
Efron, B. and Tibshirani, R. J. (1993). An introduction to the bootstrap. (New York: Chapman and Hall/CRC).
Endress, P. K. (1999). Symmetry in flowers: diversity and evolution. Int. J. Plant Sci. 160, S3–S23. doi: 10.1086/314211
Endress, P. K. (2001). Evolution of floral symmetry. Curr. Opin. Plant Biol. 4, 86–91. doi: 10.1016/s1369-5266(00)00140-0
Endress, P. K. (2012). The immense diversity of floral monosymmetry and asymmetry across angiosperms. Bot. Rev. 78, 345–397. doi: 10.1007/s12229-012-9106-3
Fenster, C. B., Armbruster, W. S., and Dudash, M. R. (2009). Specialization of flowers: is floral orientation an overlooked first step? New Phytol. 183, 502–506. doi: 10.1111/j.1469-8137.2009.02852.x
Gardiner, B., Berry, P., and Moulia, B. (2016). Wind impacts on plant growth, mechanics and damage. Plant Sci. 245, 94–118. doi: 10.1016/j.plantsci.2016.01.006
Goethe, J. W. V. (1790). Versuch die Metamorphose der Pflanzen zu erklären (Gotha: C. W. Ettinger), 1749–1832.
Guo, Y., Yan, H., Zhang, T., Wang, Q., Chen, M., Zhou, N., et al. (2022). The analysis of the relationship between disease resistance and leaf and petal ultrastructure of Rosa plants. J. Yunnan Univ. Nat. Sci. Ed. 44, 852–858. doi: 10.7540/j.ynu.20210041
Hsu, L. M., Chen, H., Wu, P., and Hua, K. (2023). Daylily (Hemerocallis fulva Linn.) flowers improve sleep quality in human and reduce nitric oxide and interleukin-6 production in macrophages. J. Physiol. Invest. 66, 313–325. doi: 10.4103/cjop.CJOP-D-23-00043
Jesson, L. K. and Barrett, S. C. (2002). Solving the puzzle of mirror-image flowers. Nature 417, 707–707. doi: 10.1038/417707a
Jiang, Y. and Moubayidin, L. (2022). Floral symmetry: the geometry of plant reproduction. Emerg. Top. Life Sci. 6, 259–269. doi: 10.1042/ETLS20210270
Kramer, P. J. and Boyer, J. S. (1995). Water relations of plants and soils (Cambridge: Academic Press).
Lei, Y., Wang, Q., Yaermaimaiti, S., Ma, Z., Li, M., Lu, Y., et al. (2024). Fulvanines J–K, two rare lactam pyrrole alkaloids from Hemerocallis fulva. Chem. Biodivers. 21, e202301672. doi: 10.1002/cbdv.202301672
Manuel, M. (2009). Early evolution of symmetry and polarity in metazoan boby plans. C. R. Biol. 332, 184–209. doi: 10.1016/j.crvi.2008.07.009
Milla, R. and Reich, P. B. (2007). The scaling of leaf area and mass: the cost of light interception increases with leaf size. Proc. R. Soc Lond. B Biol. Sci. 274, 2109–2115. doi: 10.1098/rspb.2007.0417
Mora-Carrera, E., Castañeda-Zárate, M., Fornoni, J., Boege, K., and Domínguez, C. A. (2019). On the adaptive value of monomorphic versus dimorphic enantiostyly in Solanum rostratum. Ann. Bot. 123, 205–212. doi: 10.1093/aob/mcy162
Mu, Y., He, K., Shi, P., Wang, L., Deng, L., Shi, Z., et al. (2024). Comparison between computer recognition and manual measurement methods for the estimation of leaf area. Ann. Bot. 134, 501–510. doi: 10.1093/aob/mcae090
Naghiloo, S. (2020). Patterns of symmetry expression in angiosperms: developmental and evolutionary lability. Front. Ecol. Evol. 8. doi: 10.3389/fevo.2020.00104
Neal, P. R., Dafni, A., and Giurfa, M. (1998). Floral symmetry and its role in plant-pollinator systems: terminology, distribution, and hypotheses. Ann. Rev. Ecol. S. 29, 345–373. doi: 10.1146/annurev.ecolsys.29.1.345
Niinemets, Ü. (1998). Adjustment of foliage structure and function to a canopy light gradient in two co-existing deciduous trees. Variability in leaf inclination angles in relation to petiole morphology. Trees Struct. Funct. 12, 446–451. doi: 10.1007/s004680050173
Niklas, K. J. (1994). Plant allometry: the scaling of form and process (Chicago: The University of Chicago Press).
Niklas, K. J., Cobb, E. D., Niinemets, Ü., Reich, P. B., Sellin, A., Shipley, B., et al. (2007). “Diminishing returns” in the scaling of functional leaf traits across and within species groups. Proc. Natl. Acad. Sci. 104, 8891–8896. doi: 10.1073/pnas.0701135104
Ostler, W. K. (1976). Correlations between plant species diversity and flower characteristics in the Wasatch Mountains of Utah and Idaho. (Utah: Brigham Young University).
Peppe, D. J., Royer, D. L., Gariglino, B., Oliver, S. Y., Newman, S., Leight, E., et al. (2011). Sensitivity of leaf size and shape to climate: Global patterns and paleoclimatic applications. New Phytol. 190, 724–739. doi: 10.1111/j.1469-8137.2010.03615.x
Quinn, G. P. and Keough, M. J. (2002). Experimental design and data analysis for biologists (Cambridge: Cambridge University Press).
Ramírez, S. R., Eltz, T., Fujiwara, M. K., Gerlach, G., Goldman-Huertas, B., Tsutsui, N. D., et al. (2011). Asynchronous diversification in a specialized plant-pollinator mutualism. Science 333, 1742–1746. doi: 10.1126/science.1209175
R Core Team (2022). R: a Language and environment for statistical computing (Vienna: R Foundation for Statistical Computing). Available online at: https://www.r-project.org/.
Regal, P. J. (1982). Pollination by wind and animals: ecology of geographic patterns. Ann. Rev. Ecol. S. 13, 497–524. doi: 10.1146/annurev.es.13.110182.002433
Reyes, E., Sauquet, H., and Nadot, S. (2016). Perianth symmetry changed at least 199 times in angiosperm evolution. Taxon 65, 945–964. doi: 10.12705/655.1
Sandhu, H. S., Shi, P., Kuang, X., Xue, F., and Ge, F. (2011). Applications of the bootstrap to insect physiology. Fla. Entomol. 94, 1036–1041. doi: 10.2307/23065863
Sargent, R. D. (2004). Floral symmetry affects speciation rates in angiosperms. Proc. Roy Soc. B Biol. Sci. 271, 603–608. doi: 10.1098/rspb.2003.2644
Savriama, Y. (2018). A step-by-step guide for geometric morphometrics of floral symmetry. Front. Plant Sci. 9. doi: 10.3389/fpls.2018.01433
Shi, P., Gielis, J., and Quinn, B. K. (2024). biogeom: Biological Geometries (R package version 1.4.3). doi: 10.32614/CRAN.package.biogeom
Shi, P., Ratkowsky, D. A., Li, Y., Zhang, L., Lin, S., and Gielis, J. (2018a). A general leaf-area geometric formula exists for plants—evidence from the simplified Gielis equation. Forests 9, 714. doi: 10.3390/f9110714
Shi, P., Zheng, X., Ratkowsky, D. A., Li, Y., Wang, P., and Chen, L. (2018b). A simple method for measuring the bilateral symmetry of leaves. Symmetry 10, 118. doi: 10.3390/sym10040118
Soza, V. L., Kriebel, R., Ramage, E., Hall, B. D., and Twyford, A. D. (2022). The symmetry spectrum in a hybridising, tropical group of rhododendrons. New Phytol. 234, 1491–1506. doi: 10.1111/nph.18083
Spencer, V. and Kim, M. (2018). Re “CYC” ling molecular regulators in the evolution and development of flower symmetry. Semin. Cell Dev. Biol. 79, 16–26. doi: 10.1016/j.semcdb.2017.08.052
Su, J., Niklas, K. J., Huang, W., Yu, X., Yang, Y., and Shi, P. (2019). Lamina shape does not correlate with lamina surface area: an analysis based on the simplified Gielis equation. Glob. Ecol. Conserv. 19, e00666. doi: 10.1016/j.gecco.2019.e00666
Ushimaru, A., Dohzono, I., Takami, Y., and Hyodo, F. (2009). Flower orientation enhances pollen transfer in bilaterally symmetrical flowers. Oecologia 160, 667–674. doi: 10.1007/s00442-009-1334-9
Vincent, C. A. and Coen, E. S. (2004). A temporal and morphological framework for flower development in Antirrhinum majus. Can. J. Bot. 82, 681–690. doi: 10.1139/b04-042
Vujić, V., Avramov, S., Tarasjev, A., Barišić Klisarić, N., Živković, U., and Miljković, D. (2015). The effects of traffic-related air pollution on the flower morphology of Iris pumila-comparison of a polluted city area and the unpolluted Deliblato Sands (nature reserve). Appl. Ecol. Environ. Res. 13, 405–415. doi: 10.15666/aeer/1302_405415
Wang, T., Clifford, M. R., Martínez-Gómez, J., Johnson, J. C., Riffell, J. A., and Di Stilio, V. S. (2019). Scent matters: differential contribution of scent to insect response in flowers with insect vs. wind pollination traits. Ann. Bot. 123, 289–301. doi: 10.1093/aob/mcy131
Wang, P., Liao, H., Zhang, W., Yu, X., Zhang, R., Shan, H., et al. (2015). Flexibility in the structure of spiral flowers and its underlying mechanisms. Nat. Plants 2, 15188. doi: 10.1038/nplants.2015.188
Wang, J., Shi, P., Yao, W., Wang, L., Li, Q., Tan, R., and Niklas, K. J.. (2024). The scaling relationship between perianth fresh mass and area: proof of concept using Magnolia × soulangeana Soul.-Bod. Trees Struct. Funct. 38, 241–249. doi: 10.1007/s00468-023-02480-8
Wolff, C. F. (1774). Theoria generations (Halle (Saale): Hendel). Available online at: http://wiki.uibk.ac.at/noscemus/Theoria_generationis.
Keywords: bilateral symmetry, diminishing returns, plant serial, pollination organs, radial symmetry, tepals
Citation: Yan H, Shi P, Yao W, Jiang F, Chen L, Deng L, Lian M, Heng Y and Niklas KJ (2025) Floral symmetry and scaling relationships between tepal mass and area in the daylily (Hemerocallis fulva). Front. Plant Sci. 16:1599033. doi: 10.3389/fpls.2025.1599033
Received: 24 March 2025; Accepted: 08 July 2025;
Published: 25 July 2025.
Edited by:
Monika M. Lipińska, University of Gdansk, PolandReviewed by:
Quanfeng Yang, Beijing Forestry University, ChinaRafał Chmara, University of Gdansk, Poland
Copyright © 2025 Yan, Shi, Yao, Jiang, Chen, Deng, Lian, Heng and Niklas. This is an open-access article distributed under the terms of the Creative Commons Attribution License (CC BY). The use, distribution or reproduction in other forums is permitted, provided the original author(s) and the copyright owner(s) are credited and that the original publication in this journal is cited, in accordance with accepted academic practice. No use, distribution or reproduction is permitted which does not comply with these terms.
*Correspondence: Peijian Shi, cGpzaGlAbmpmdS5lZHUuY24=; Karl J. Niklas, a2puMkBjb3JuZWxsLmVkdQ==