 Sheng Bi
 Qin Liu
 Jie-Wei Hao
 Xiang-Zhe Cai2
 Li-Na Zhang
- 1Ministry of Education Key Laboratory for Genetics and Germplasm Innovation of Tropical Special Forest Trees and Ornamental Plant, School of Life and Health Sciences, Hainan University, Haikou, Hainan, China
- 2International Joint Center for Terrestrial Biodiversity around South China Sea of Hainan Province, School of Ecology, Hainan University, Haikou, Hainan, China
- 3College of Agricultural Engineering, Guangxi Vocational University of Agriculture, Nanning, Guangxi, China
- 4College of Geographical Sciences, Hebei Normal University, Shijiazhuang, Hebei, China
The liverwort genus Pleurozia, a morphologically specialized bryophyte group, holds unique taxonomic and evolutionary significance. This study sequenced and assembled the chloroplast genomes of three Pleurozia species (P. acinosa, P. gigantea, and P. subinflata), with genome sizes of 118,233 bp, 118,423 bp, and 118,304 bp, respectively. All three genomes exhibit the typical quadripartite structure. Comparative genomics analyses, including the genome of P. purpurea, revealed high conservation in genome size, gene content, and inverted repeat (IR) boundaries. Coding regions were more conserved than noncoding and intronic regions, suggesting the potential of the latter as molecular markers. The IR regions also displayed significantly lower sequence divergence compared to the single-copy regions. Most protein-coding genes were subject to purifying selection, whereas ycf66 and ndhD showed signs of positive selection. Codon usage bias analyses across the four species identified a consistent preference for U- and A-ending codons, with a moderate bias primarily shaped by natural selection, in conjunction with mutation pressure. Phylogenetic analyses based on 35 liverwort chloroplast genomes strongly supported the monophyly of Pleurozia and confirmed Pleuroziales as an evolutionary intermediate between thalloid and leafy liverworts. These findings provide valuable genomic resources for improving our understanding of species delimitation, phylogenetic relationships, and evolutionary mechanisms in liverworts.
1 Introduction
Liverworts (Marchantiophyta), comprising approximately 7,300 species (Söderström et al., 2016), represent a key lineage in land plant evolution. Their pivotal evolutionary role is supported by both fossil records (Wellman et al., 2003; Rubinstein et al., 2010; Clarke et al., 2011) and phylogenetic analyses (Bowman, 2013; Cox et al., 2014; Li et al., 2024). Current phylogenetic studies reveal an evolutionary trajectory in liverworts from complex thalloid via simple thalloid to leafy conditions (Forrest et al., 2006; Qiu et al., 2006). Within this evolutionary framework, the genus Pleurozia Dumort. (Pleuroziales: Pleuroziaceae) occupies a significant position hypothesized to be a transitional group bridging simple thalloid and leafy liverworts (He-Nygrén et al., 2006). Pleurozia is notable for its distinctive two-sided apical cell, differing from the typical three-sided apical cell found in other leafy liverworts (Crandall-Stotler, 1976; Thiers, 1993). Furthermore, this genus also displays diverse morphological features, notably the formation of sac-shaped leaves and the frequent occurrence of sterile perianths. These unique traits not only demonstrate the genus’s evolutionary distinctiveness but also enhance its value for understanding liverwort phylogeny and evolutionary processes. Ecologically, Pleurozia species are predominantly epiphytic, primarily inhabiting high-elevation tropical and subtropical montane rainforests (Thiers, 1993)—habitats that are particularly sensitive to environmental disturbances such as climate change. This niche specialization renders Pleurozia not only a potential bioindicator for high-altitude forest ecosystems, but also highly vulnerable to environmental threats.
There are twelve species in Pleurozia according to the latest taxonomic checklist (Söderström et al., 2016). However, the placement of Pleuroziaceae within the liverwort taxonomic framework, as well as the resolution of its infrageneric relationships, has been historically challenging when based solely on morphological data (He-Nygrén et al., 2006), likely due to the reduction and subsequent re-evolution of morphological characters within the lineage (Thiers, 1993). DNA barcoding, first proposed by Hebert et al. (2003), has become a valuable tool for taxonomic studies, particularly in resolving ambiguous identifications, uncovering cryptic species, identifying new taxa, and reconstructing phylogenetic relationships (Hollingsworth et al., 2009; Krawczyk et al., 2014; Bączkiewicz et al., 2017). However, its effectiveness varies across plant groups and has shown notable limitations in liverworts (Ślipiko et al., 2020). The advent of Next-Generation Sequencing (NGS) has made complete plastid genomes (plastomes) an increasingly powerful alternative. Complete plastid genomes now serve as powerful molecular markers for classification, phylogenetic reconstruction, and evolutionary studies across diverse land plants (Dodsworth, 2015; Li et al., 2015). Their utility extends to distinguishing closely related taxa (e.g., Szczecińska and Sawicki, 2015; Myszczyński et al., 2017; Krawczyk et al., 2018), varieties, and individual genotypes (Kane et al., 2012), significantly improving phylogenetic resolutions across various taxonomic levels (e.g., Zhang et al., 2011; Wang et al., 2016; Chen et al., 2022). Although the first liverwort chloroplast genome (Marchantia polymorpha L.) was sequenced over three decades ago (Ohyama et al., 1986), the number of complete liverwort genomes in GenBank remains strikingly low compared to vascular plants. This scarcity substantially hinders our understanding of plastid genome evolution in bryophytes, limits the application of plastid sequences in comprehensive phylogenomic analyses (Wang et al., 2022; Li et al., 2024), and critically impedes efforts to resolve the phylogenetic placement of key transitional taxa such as Pleurozia. Moreover, the presumed conserved quadripartite structure of liverwort plastomes (Yu et al., 2019; Dong et al., 2021) requires further validation through expanded taxonomic sampling.
Although Pleurozia occupies a unique phylogenetic position, its study has been hindered by challenges in specimen collection and preservation, resulting in limited data availability for modern taxonomic revisions and molecular phylogenetic analyses. To date, only the complete plastid genome of P. purpurea and P. subinflata have been sequenced and preliminarily analyzed (Wang et al., 2009; Dong et al., 2021; Song et al., 2024). In China, five Pleurozia species have been recorded (P. acinosa, P. caledonica, P. subinflata, P. gigantea, and P. purpurea), all restricted to southern regions, with four of these (excluding P. purpurea) occurring on Hainan Island (http://www.sp2000.org.cn/). Among these species, P. purpurea and P. subinflata are categorized as Near Threatened (NT) on the China Biodiversity Red List: Higher Plants Volume (2020). Additionally, P. caledonica has not been reported or re-collected since its initial discovery on Hainan Island in 1998 (Bai and Li, 1998). Therefore, this study aims to enhance the genomic resources for this important genus by sequencing the complete chloroplast genomes of three Pleurozia species from Hainan Island. Specifically, our objectives are to: 1) assemble and annotate the complete chloroplast genomes of the three Pleurozia species; 2) analyze the chloroplast genome characteristics and codon usage patterns within Pleurozia; 3) investigate the phylogenetic placement of Pleurozia as a potential transitional lineage between simple thalloid and leafy liverworts.
2 Materials and methods
2.1 Plant materials and DNA extraction
Fresh specimens of three Pleurozia species were collected from tree trunks in the tropical cloud forests of Wuzhishan Mountain (108°42′E, 18°53′N), Hainan, China, in October 2022. Their morphological characteristics in the wild is illustrated in Figure 1. Voucher specimens have been preserved at the Herbarium of Hainan University (HUTB). Species identification was performed by Li-Na Zhang. Each specimen was meticulously cleaned with distilled water and then dried using absorbent paper. To reduce potential contamination from other plant sources, the clean shoots were isolated using a stereomicroscope and immediately frozen in liquid nitrogen. They were stored in an ultralow-temperature freezer at -80 °C pending further analysis. Total genomic DNA extractions were carried out employing the Universal Genomic DNA Kit (CW2298, CWBIO), and using the Agilent 5400 Fragment Analyzer system, their integrity, quality, and concentration were assessed.

Figure 1. Morphological characteristics and habitats of Pleurozia species. (A) P. acinosa. (B) P. subinflata. (C) P. gigantea.
2.2 Chloroplast genome sequencing, assembly and annotation
DNA clusters were sequenced on the Illumina NovaSeq 6000 platform, achieving average sequencing depths of 795X for P. acinosa, 409X for P. gigantea, and 189X for P. subinflata. The sequencing produced raw sequences with a read length of 150 bp, including paired-end sequencing of total DNA and the construction of an Illumina PE library. The raw sequencing image data were converted into sequence data via Base Calling and saved in the FASTQ format. These sequences underwent a rigorous quality control process, which included the removal of adapter sequences and 5’-end bases that were not AGCT, trimming reads with quality values below Q20, discarding reads with N proportions of 10% or higher, and eliminating joint sequences and small segments under 75 bp after pruning. Consequently, high-quality read sequences (clean reads) were obtained. For the de novo assembly of these clean data, SPAdes v3.14.1 (Prjibelski et al., 2020) was used in “careful” mode with default k-mers, and the sequences were self-corrected using the Hammer algorithm. Following the initial assembly, reassembly was performed with optimized k-mer settings (93, 95, 97, 103, 105, 107, and 115) using VelvetOptimiser (Zerbino and Birney, 2008) to integrate the results.
The extracted chloroplast genome sequences were merged into a single FASTA file after alignment with published chloroplast DNA (cpDNA) data and protein-coding gene (PCG) sequences of closely related species using BLASTn and Exonerate. The PRICE (Paired-Read Iterative Contig Extension) algorithm facilitated iterative contig extension until the sequence length stabilized (Ruby et al., 2013). Subsequently, the original sequencing reads were reviewed, and paired reads were selected for reassembly using Bowtie2 (Langmead and Salzberg, 2012). The circular chloroplast genome was then extracted after performing a final assembly with SPAdes v3.14.1 (Prjibelski et al., 2020).
The initial annotation of chloroplast genomes was performed using PGA (available at https://github.com/quxiaojian/PGA) (Qu et al., 2019), with Porella perrottetiana (GenBank accession: NC_043780) and Ptilidium pulcherrimum (GenBank accession: HM222519) serving as reference sequences for preliminary annotation. Re-annotation was subsequently performed using Geneious Prime 2023.2.1, utilizing the GenBank file from the initial annotation results and setting a 70% similarity threshold for annotation. Initiation and termination codons, along with intron/exon boundaries, were manually verified by referencing sequences from closely related species. tRNA genes were identified using tRNAscan-SE 2.0.7 (Chan et al., 2021), and rRNA genes were annotated with RNAmmer 1.2 (Lagesen et al., 2007). Finally, the large single-copy (LSC) region, small single-copy (SSC) region, and inverted repeat (IR) regions of the cpDNA were annotated using the Repeats Finder plugin in Geneious Prime 2023.2.1.
The assembled and annotated cp-genome sequences have been deposited in GenBank (http://www.ncbi.nlm.nih.gov/) under the accession numbers OR168937, OR168938 and OR168939.
2.3 Characteristic analysis of chloroplast genome
The annotated chloroplast genome maps of the three Pleurozia species were generated using the online chloroplast genome mapping tool Chloroplot (Zheng et al., 2020). Further analysis in Geneious Prime 2023.2.1 enabled us to ascertain crucial chloroplast genome characteristics, including the total length, GC content, the number of PCGs, introns, tRNA genes, and rRNA genes.
2.4 Comparative genomic analysis and nucleotide diversity
To elucidate the sequence divergence within the chloroplast genomes of Pleurozia species, we used a custom Perl script (available at https://github.com/quxiaojian/Bioinformatic_Scripts) to transform the GenBank files into mVISTA-compatible formats. Employing P. purpurea cpDNA (GenBank accession: MK645838; also included in subsequent analyses) as a reference, we compared the complete chloroplast genome sequences of the three newly sequenced species using the mVISTA tool in Shuffle-LAGAN mode (Frazer et al., 2004). Structural variations and collinearity within the Pleurozia cpDNA were investigated through progressive Mauve alignments in the Mauve software, enabling the creation of a structural variation map (Darling et al., 2004, 2010). A sliding window analysis was conducted to assess nucleotide variability (Pi) across the entire chloroplast genome using DnaSp v6 (Rozas et al., 2017), with a window length of 600 bp and a step size of 200 bp. To analyze the expansion and contraction of the IR regions, the MUMmer4 and CPJSdraw software were employed to delineate the boundaries between the single-copy (SC) and IR regions (Marçais et al., 2018; Li et al., 2023).
2.5 Selective pressure analysis
To accurately assess selective pressures in the molecular evolution of chloroplast genomes, homologous protein-coding genes (PCGs) were extracted from the chloroplast genomes of four Pleurozia species using Geneious Prime 2023.2.1. The Translation Align module of Geneious Prime 2023.2.1 was employed to select the transl_table 11 genetic code (Bacterial, Archaeal, and Plant Plastid Code) for MAFFT v7.490 alignment (Katoh, 2002; Katoh and Standley, 2013). Subsequently, Ka, Ks, and Ka/Ks values of PCGs were calculated using transl_table 11 with the YN method selected in KaKs_Calculator 3.0 (Yang and Nielsen, 2000; Zhang, 2022; Hu et al., 2023). Here, Ka represents the rate of nonsynonymous substitutions, while Ks indicates the rate of synonymous substitutions. By comparing these substitution rates and the Ka/Ks ratio, inferences were made regarding whether the PCGs are under positive selection (Ka/Ks > 1), negative selection (Ka/Ks < 1), or neutral selection (Ka/Ks = 1). Finally, the R language packages ggplot2 (Wickham, 2016) and aplot (Yu, 2023) were utilized to create bubble charts for visualizing the results.
2.6 Analysis of codon usage bias
To explore the codon usage bias (CUB), we analyzed the chloroplast genomes of four Pleurozia species. The coding sequences (CDS) were extracted using Geneious Prime 2023.2.1 and screened to ensure correct transcriptional start codons (transl_table 11), with sequences shorter than 300 bp excluded. We calculated GC1, GC2, and GC3 (the G+C content at the first, second and third codon position, excluding stop codons), as well as P1, P2, and P3 (G+C content at the first, second and third codon positions, excluding ATG, ATA, TGG and stop codons) (Sueoka, 1999). Additionally, we determined A3s, T3s, C3s, and G3s (the content of A, T, C and G at synonymous third codon positions, excluding ATG, ATT, ATC, ATA, TGG and stop codons) for each chloroplast genomic CDS using Python scripts. The effective number of codons (ENC) (Wright, 1990), relative synonymous codon usage (RSCU) (Sharp and Li, 1986), and GC3s (the G+C content at the third position of synonymous codons) were calculated using the codonW 1.4.2 program. RSCU values reflect the preference or avoidance of synonymous codons, with an RSCU value of 1.0 indicating no bias, while values deviating from 1.0 indicate positive or negative codon preference, respectively (He et al., 2016). ENC values, ranging from 20 to 61, indicate the degree of codon usage bias, with lower values (≤35) suggesting a strong preference (Parvathy et al., 2022).
To investigate the forces shaping CUB, we performed three analyses. First, an ENC-GC3s plot was generated to distinguish the effects of mutation pressure versus natural selection. Genes lying on or near the standard curve are considered to be primarily influenced by mutation pressure, whereas those deviating significantly below the curve are shaped by selection (Wright, 1990). Second, a Parity Rule 2 (PR2) plot was constructed by plotting A3/(A3+T3) against G3/(G3+C3) (Sueoka, 1995). Deviation of genes from the central point (0.5, 0.5), where A=T and G=C, indicates the relative influence of selection over mutation pressure (Chakraborty et al., 2020). Third, a neutrality plot (P12 vs. P3, where P12 is the mean of P1 and P2) was used to quantify the relative contributions of mutation and selection. The regression slope approaching 1.0 suggests a dominant role for mutation pressure, while a slope near 0 indicates stronger selection (Sueoka, 1988). RSCU patterns and all subsequent analytical plots were visualized in R v4.3.1 using the ggplot2, ggstar, and aplot packages (Wickham, 2016; Xu, 2022; Yu, 2023).
2.7 Phylogenetic analysis
2.7.1 Maximum likelihood phylogenetic tree
In order to investigate the phylogenetic position of Pleurozia in relation to thalloid and leafy liverworts, we selected 35 liverwort species from the available chloroplast genome data in GenBank, representing the major orders and families of both morphological groups. Using the maximum likelihood (ML) method, a phylogenetic tree was constructed based on the chloroplast genomes of these species, with Lunularia cruciata serving as the outgroup. The corresponding GenBank accession numbers are listed in Supplementary Table S1. To assess the impact of non-coding and intronic regions on the phylogenetic tree topology, we created a dataset comprising the entire chloroplast genomes, excluding the second inverted repeat region (IRa), as noted by Xiang et al. (2022), to eliminate redundancy and enhance computational efficiency by preventing duplicate inclusion repeated consideration of identical information. For the “LSC+IRb+SSC” dataset, multiple alignments were performed using MAFFT v7.490 with the “–AUTO” strategy (Katoh et al., 2002; Katoh and Standley, 2013). Subsequently, the best-fit model for the dataset was identified using Modelfinder under the Bayesian Information Criterion (BIC), with GTR+F+R5 selected as the optimal model (Kalyaanamoorthy et al., 2017). Finally, the dataset was subjected to ML analysis using IQ-TREE multicore version 2.2.2.7 (Minh et al., 2020), employing stochastic nearest neighbor interchange (NNI) operations for tree searches and conducting 5000 ultra-fast bootstrap (BS) replications (Minh et al., 2013; Nguyen et al., 2015).
2.7.2 Bayesian inference phylogenetic tree
Bayesian inference (BI) analysis was conducted using MrBayes-mpi version 3.2.7 (Huelsenbeck et al., 2001; Ronquist et al., 2012), based on the “LSC + IRb + SSC” sequences of 35 liverwort (Marchantiophyta) chloroplast genomes, with Lunularia cruciata as the outgroup (Supplementary Table S1). Sequence alignments were performed in Geneious Prime 2023.2.1 using MAFFT v7.490 with the “–auto” strategy in normal comparison mode (Katoh et al., 2002; Katoh and Standley, 2013). The optimal DNA substitution model was evaluated using MrModeltest v.2 (Nylander, 2004) under the Akaike Information Criterion (AIC), as implemented in PAUP* v.4.0a169 (Wilgenbusch and Swofford, 2003; Posada, 2003), which identified GTR + I + G as the best-fit model. The aligned sequence dataset was then conducted using Markov chain Monte Carlo (MCMC) with the following parameters: two independent runs, each with four chains (3 hot chains, 1 cold chain), running for 4 million iterations and sampling every 500 iterations. The convergence of the MCMC chains was confirmed by ensuring that the average standard deviation of split frequencies (ASDF) was less than 0.01, and the effective sample sizes (ESS) for all parameters in Tracer v1.7.2 exceeded 200 (Rambaut et al., 2018). After discarding a 10% burn-in, as determined by Tracer v.1.7.2, a majority-rule consensus tree with posterior probabilities (PP) was generated from the remaining trees.
3 Results
3.1 Chloroplast genome characteristics of Pleurozia species
The chloroplast genomes of the three sequenced Pleurozia species exhibit the same conserved quadripartite structure, comprising a large single-copy (LSC) region, a small single-copy (SSC) region, and a pair of inverted repeat (IR) regions. The genome lengths are 118,233 bp, 118,423 bp, and 118,304 bp for P. acinosa, P. subinflata, and P. gigantea, respectively (refer to Table 1; Figure 2). These chloroplast genomes are highly similar in gene content, overall size, and GC composition, with an average overall GC content of approximately 32%. In all three genomes, the IR regions consistently show the highest GC content (46.5–46.6%), followed by the LSC (29.9%) and SSC regions (28.6–28.8%) (Table 1). The annotated chloroplast genes can be categorized into three functional groups: PCGs, RNA-coding genes, and other genes, as detailed in Table 1 and Table 2. Among these, 16 genes (e.g., petB, petD, atpF) contain single introns (Table 2), while two genes (clpP and ycf3) possess double introns. Notably, the rps12 gene exhibits trans-splicing in the chloroplast genome. The IR regions contain duplicated tRNA genes, including trnA-UGC, trnI-GAU, trnN-GUU, trnR-ACG, and trnV-GAC. The chloroplast genome of P. acinosa comprises 130 genes (8 rRNA, 36 tRNA, 86 PCGs), while the other two species each possess 132 genes (8 rRNA, 36 tRNA, 88 PCGs). This difference is primarily due to the absence of the cysA and cysT genes in P. acinosa (refer to Table 2; Figure 2).
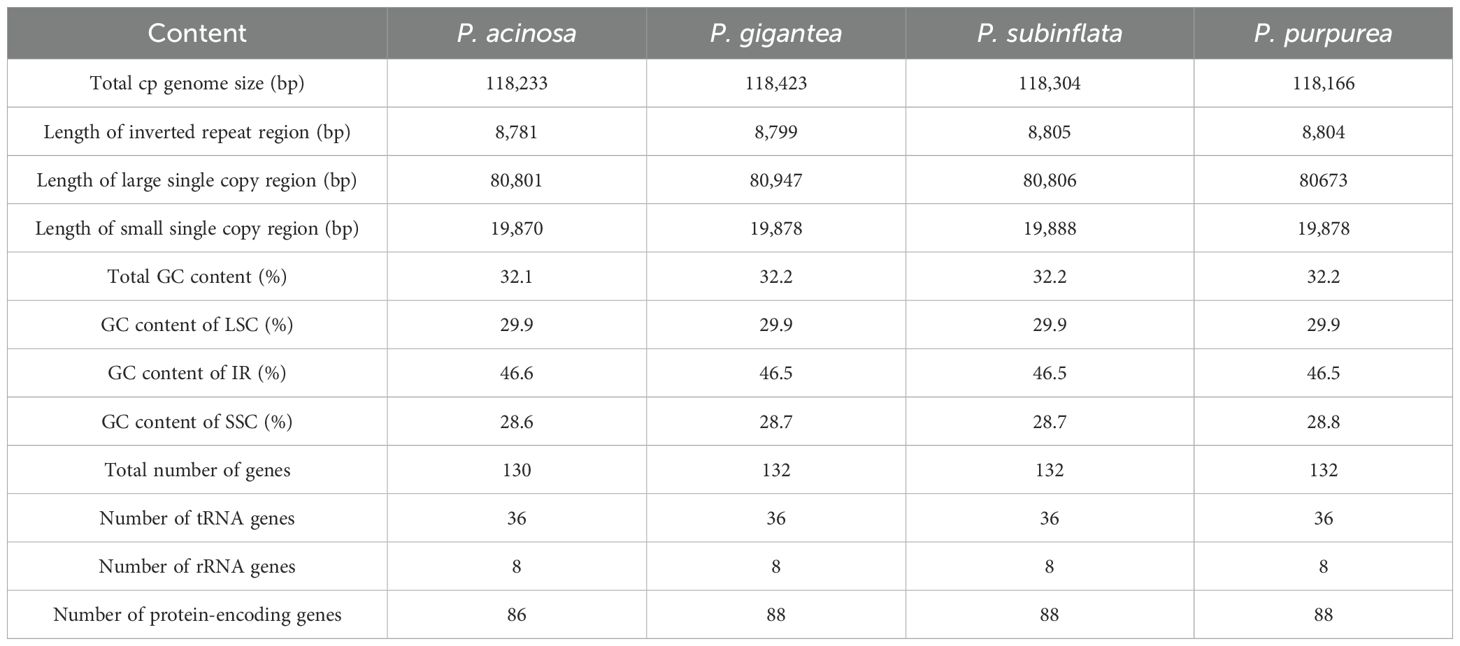
Table 1. Characteristics of cp genomes of the Pleurozia species.
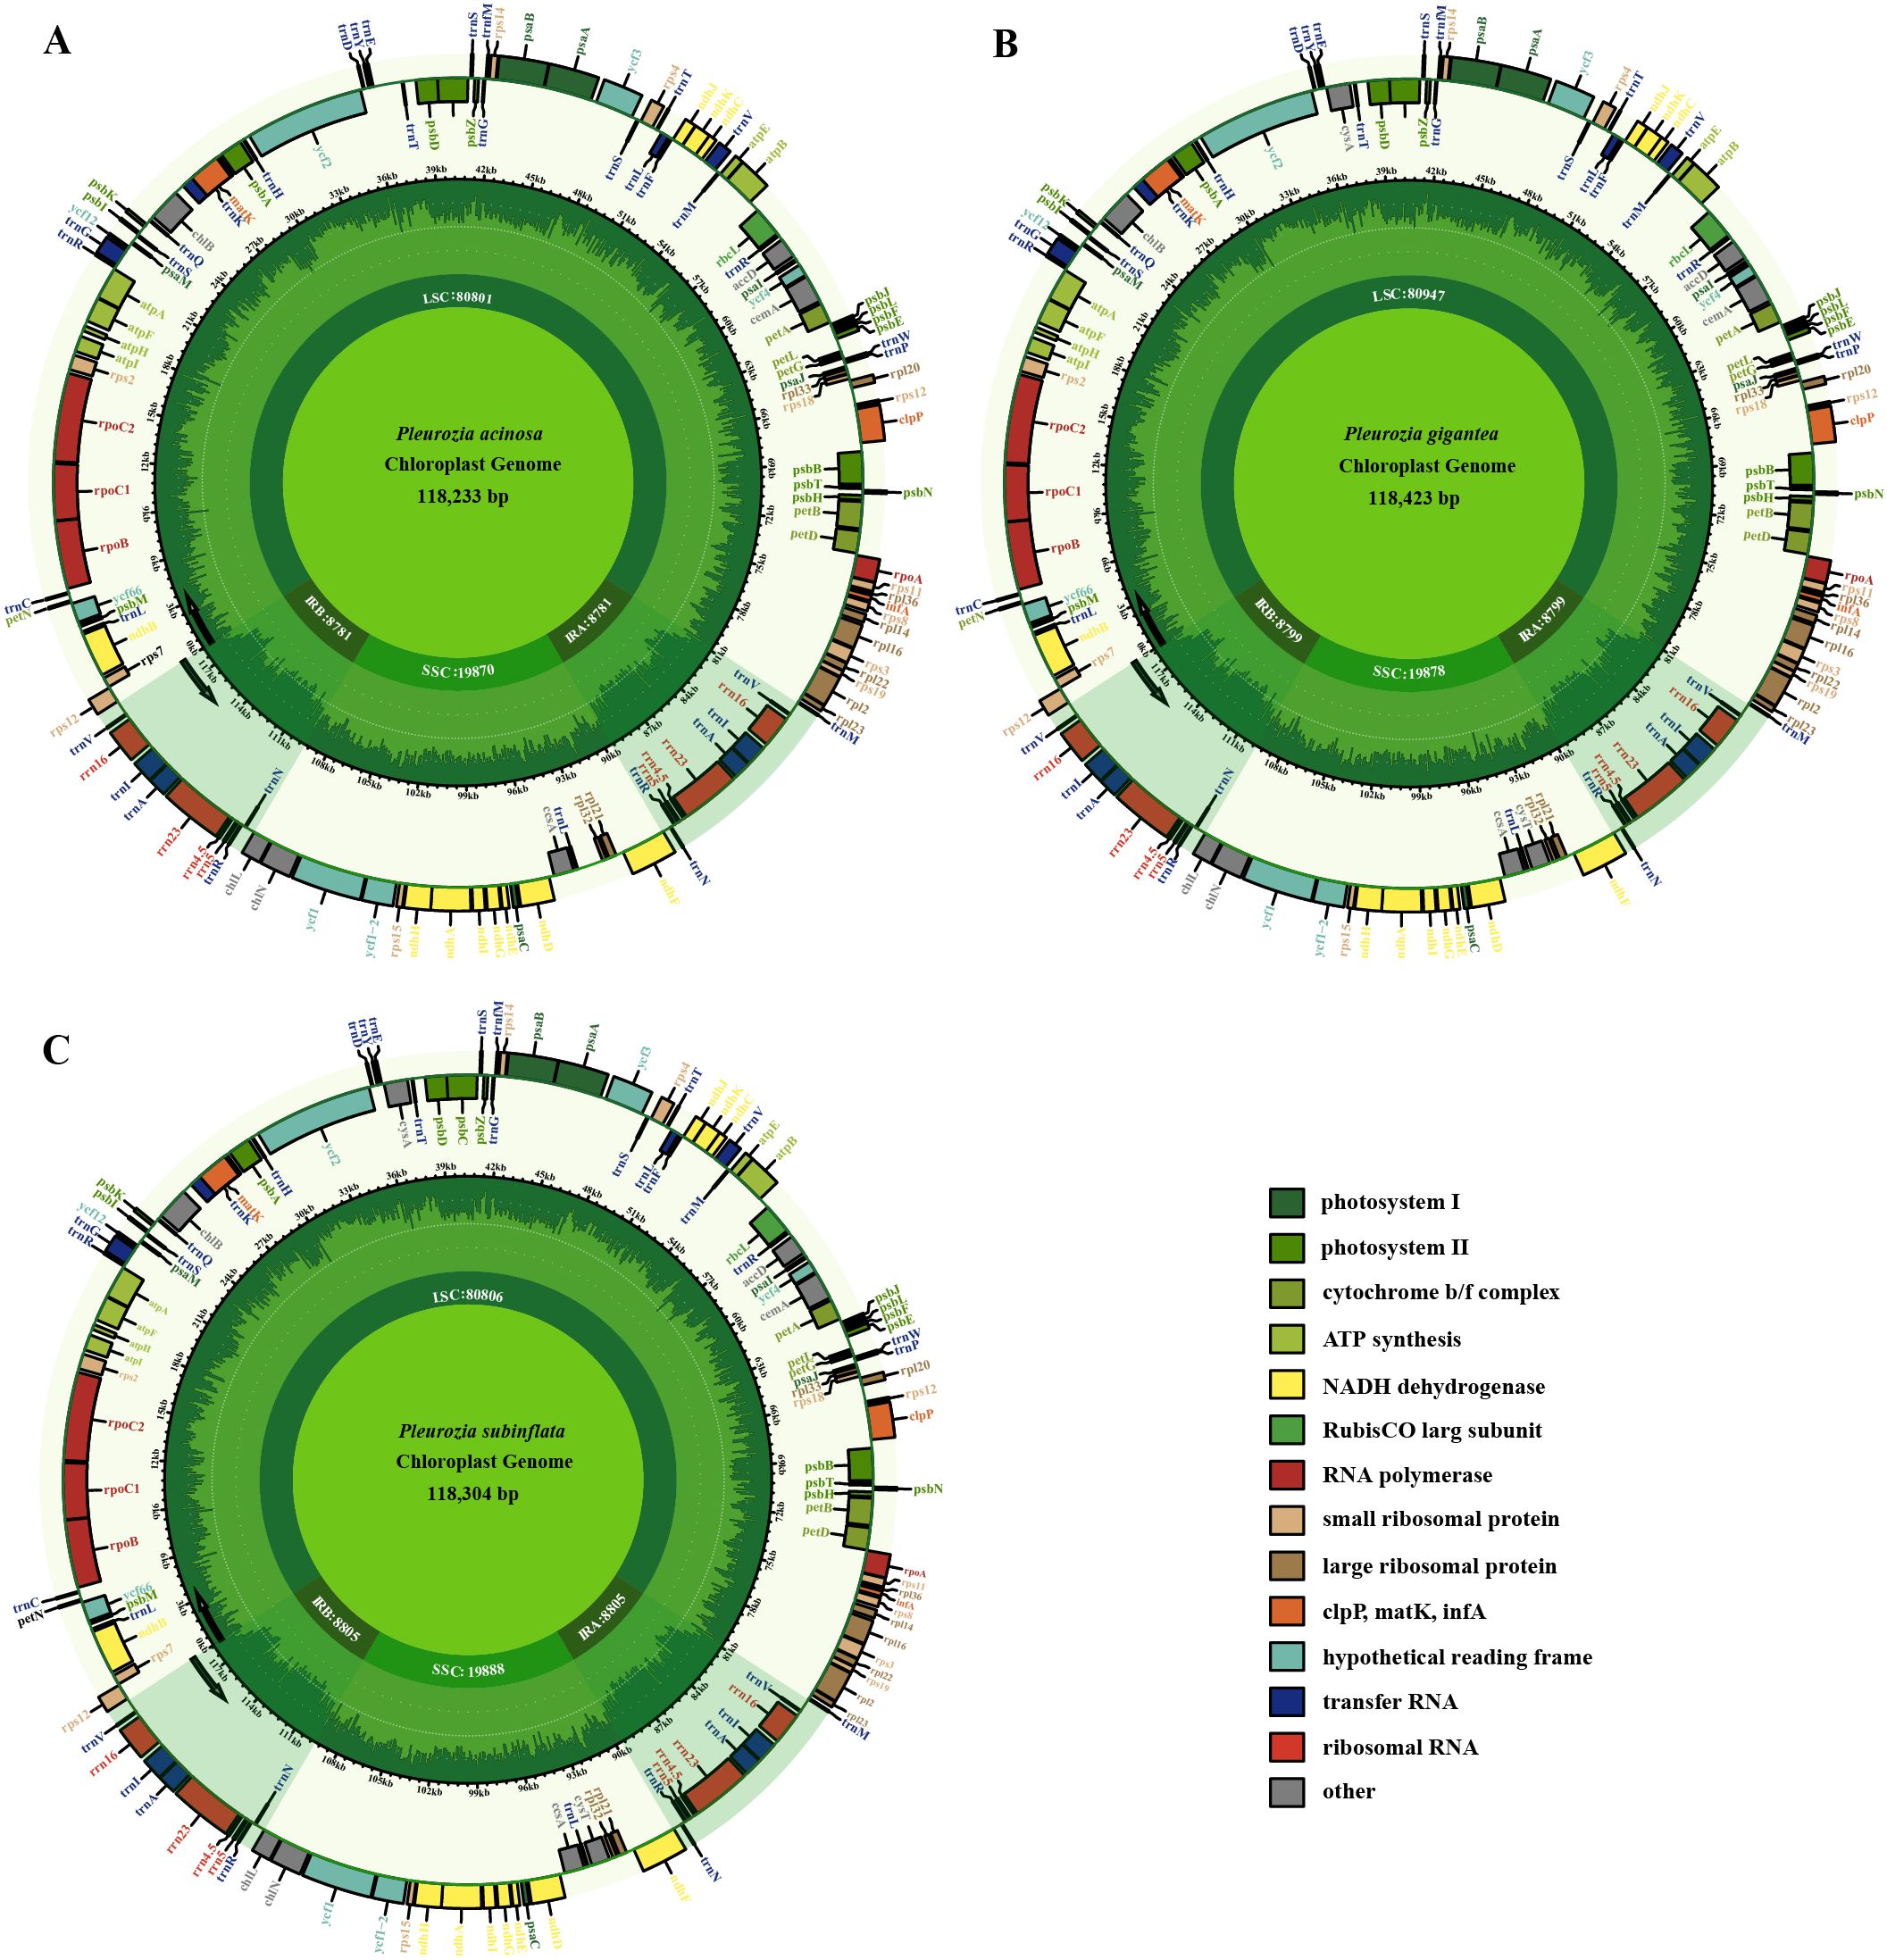
Figure 2. Chloroplast genome maps of Pleurozia. P. acinosa (A), P. gigantea (B), and P. subinflata (C). Genes inside the large circles are transcribed in a clockwise direction, whereas those outside follow a counterclockwise transcriptional direction. Small circles indicate the GC content and shaded regions denote the IR areas. Genes of differing functions are distinguished by various colors.
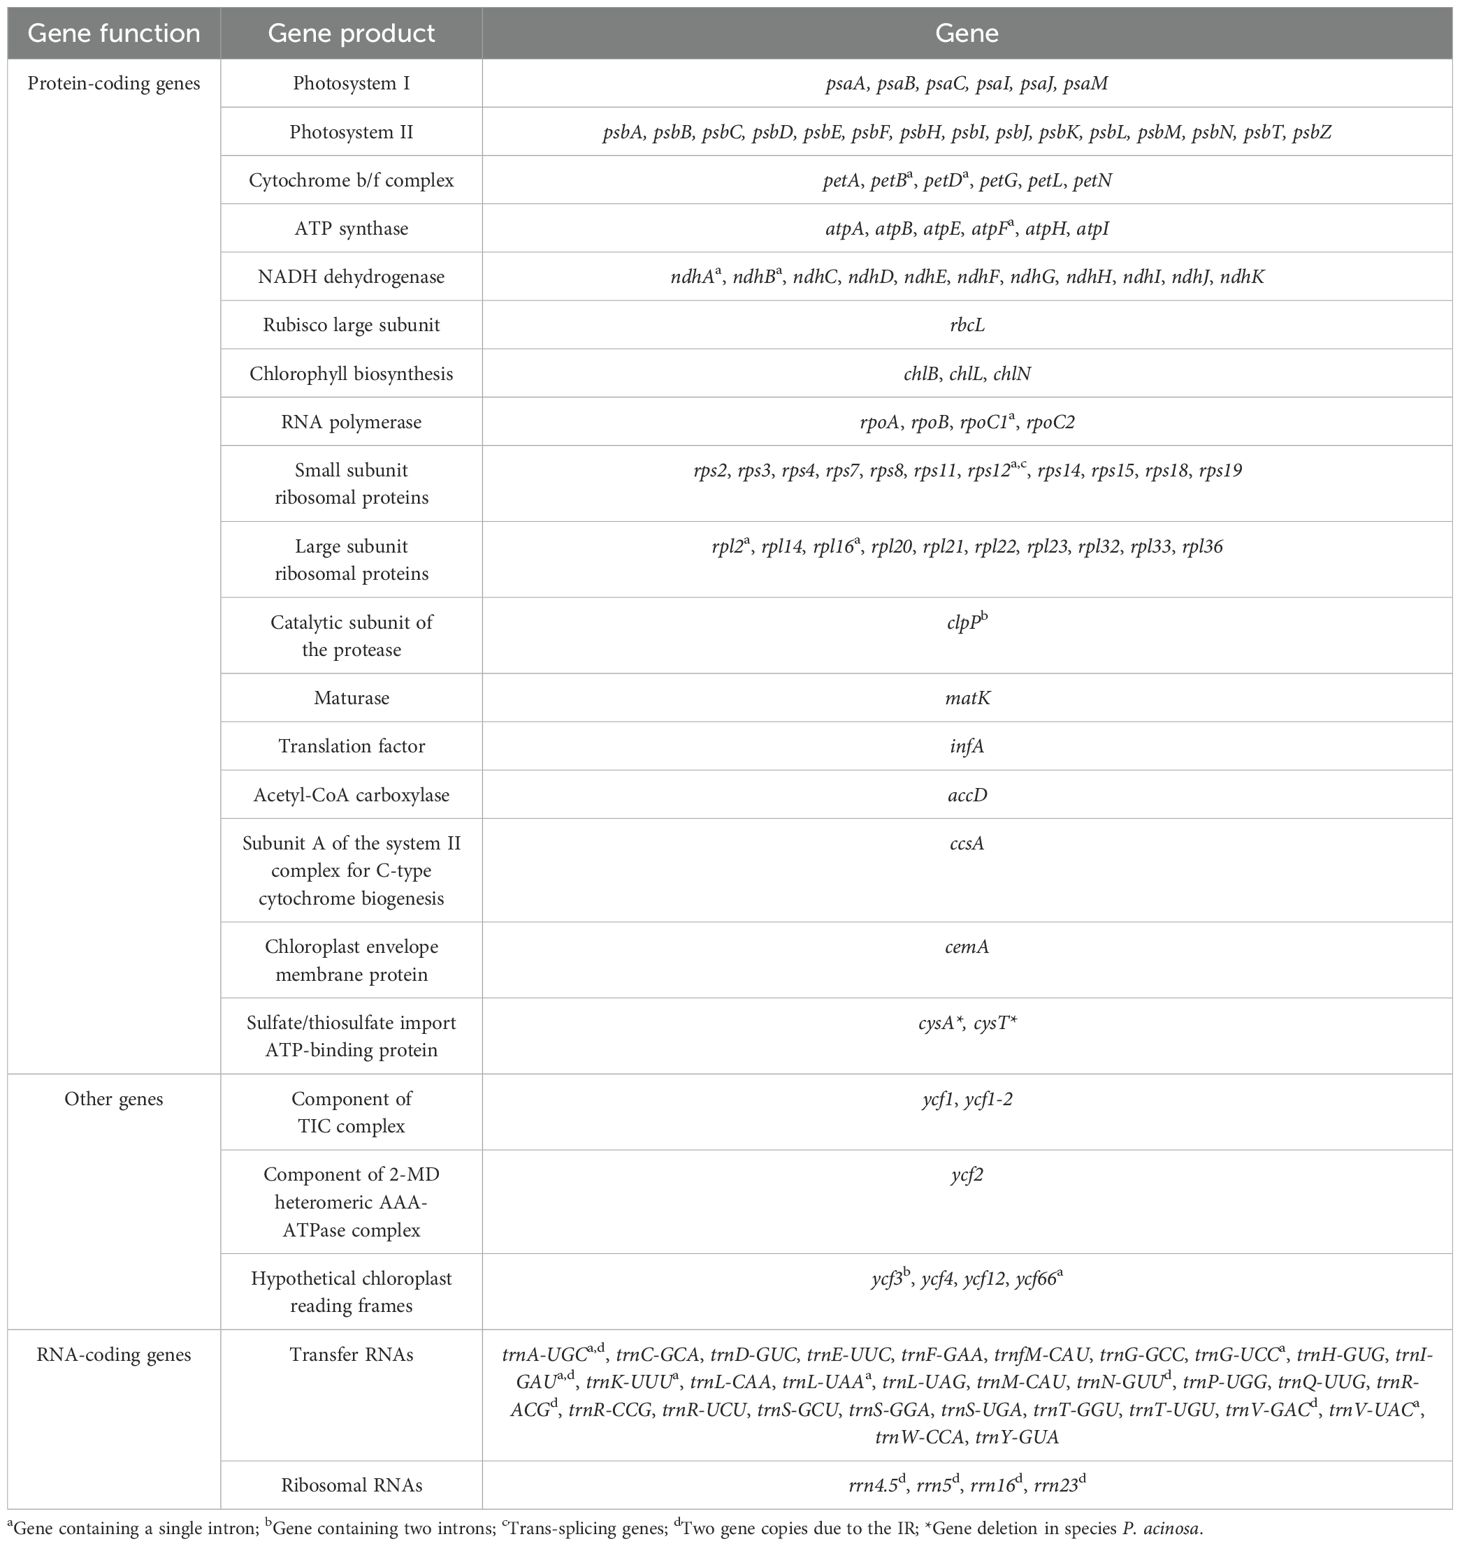
Table 2. List of genes annotated in three Pleurozia plastomes.
3.2 Genome comparison and nucleotide diversity
3.2.1 Comparative genomic analysis
mVISTA-based comparative analyses demonstrated high sequence conservation and overall similarity across Pleurozia chloroplast genomes (Figure 3). Coding regions were more conserved than non-coding regions. Non-translated elements (tRNAs, rRNAs) showed comparable levels of variation among the four species. The sequence divergence was predominantly localized in non-coding and intronic regions. Notable intron variations were identified in ycf66, trnG-UCC, ycf3, trnL-UAA, trnV-UAC, and clpP. Highly variable non-coding regions included psbM~ycf66, atpH~atpF, psbI~psbK, psbA~trnH-GUG, trnD-GUC~trnY-GUA, psbC~trnS-UGA, ycf3~trnS-GGA, psbZ~trnG-GCC, petA~psbJ, psbE~petL, rpl20~rps12, clpP~psbB, trnM-CAU~trnV-GAC, and chlL~trnN-GUU.
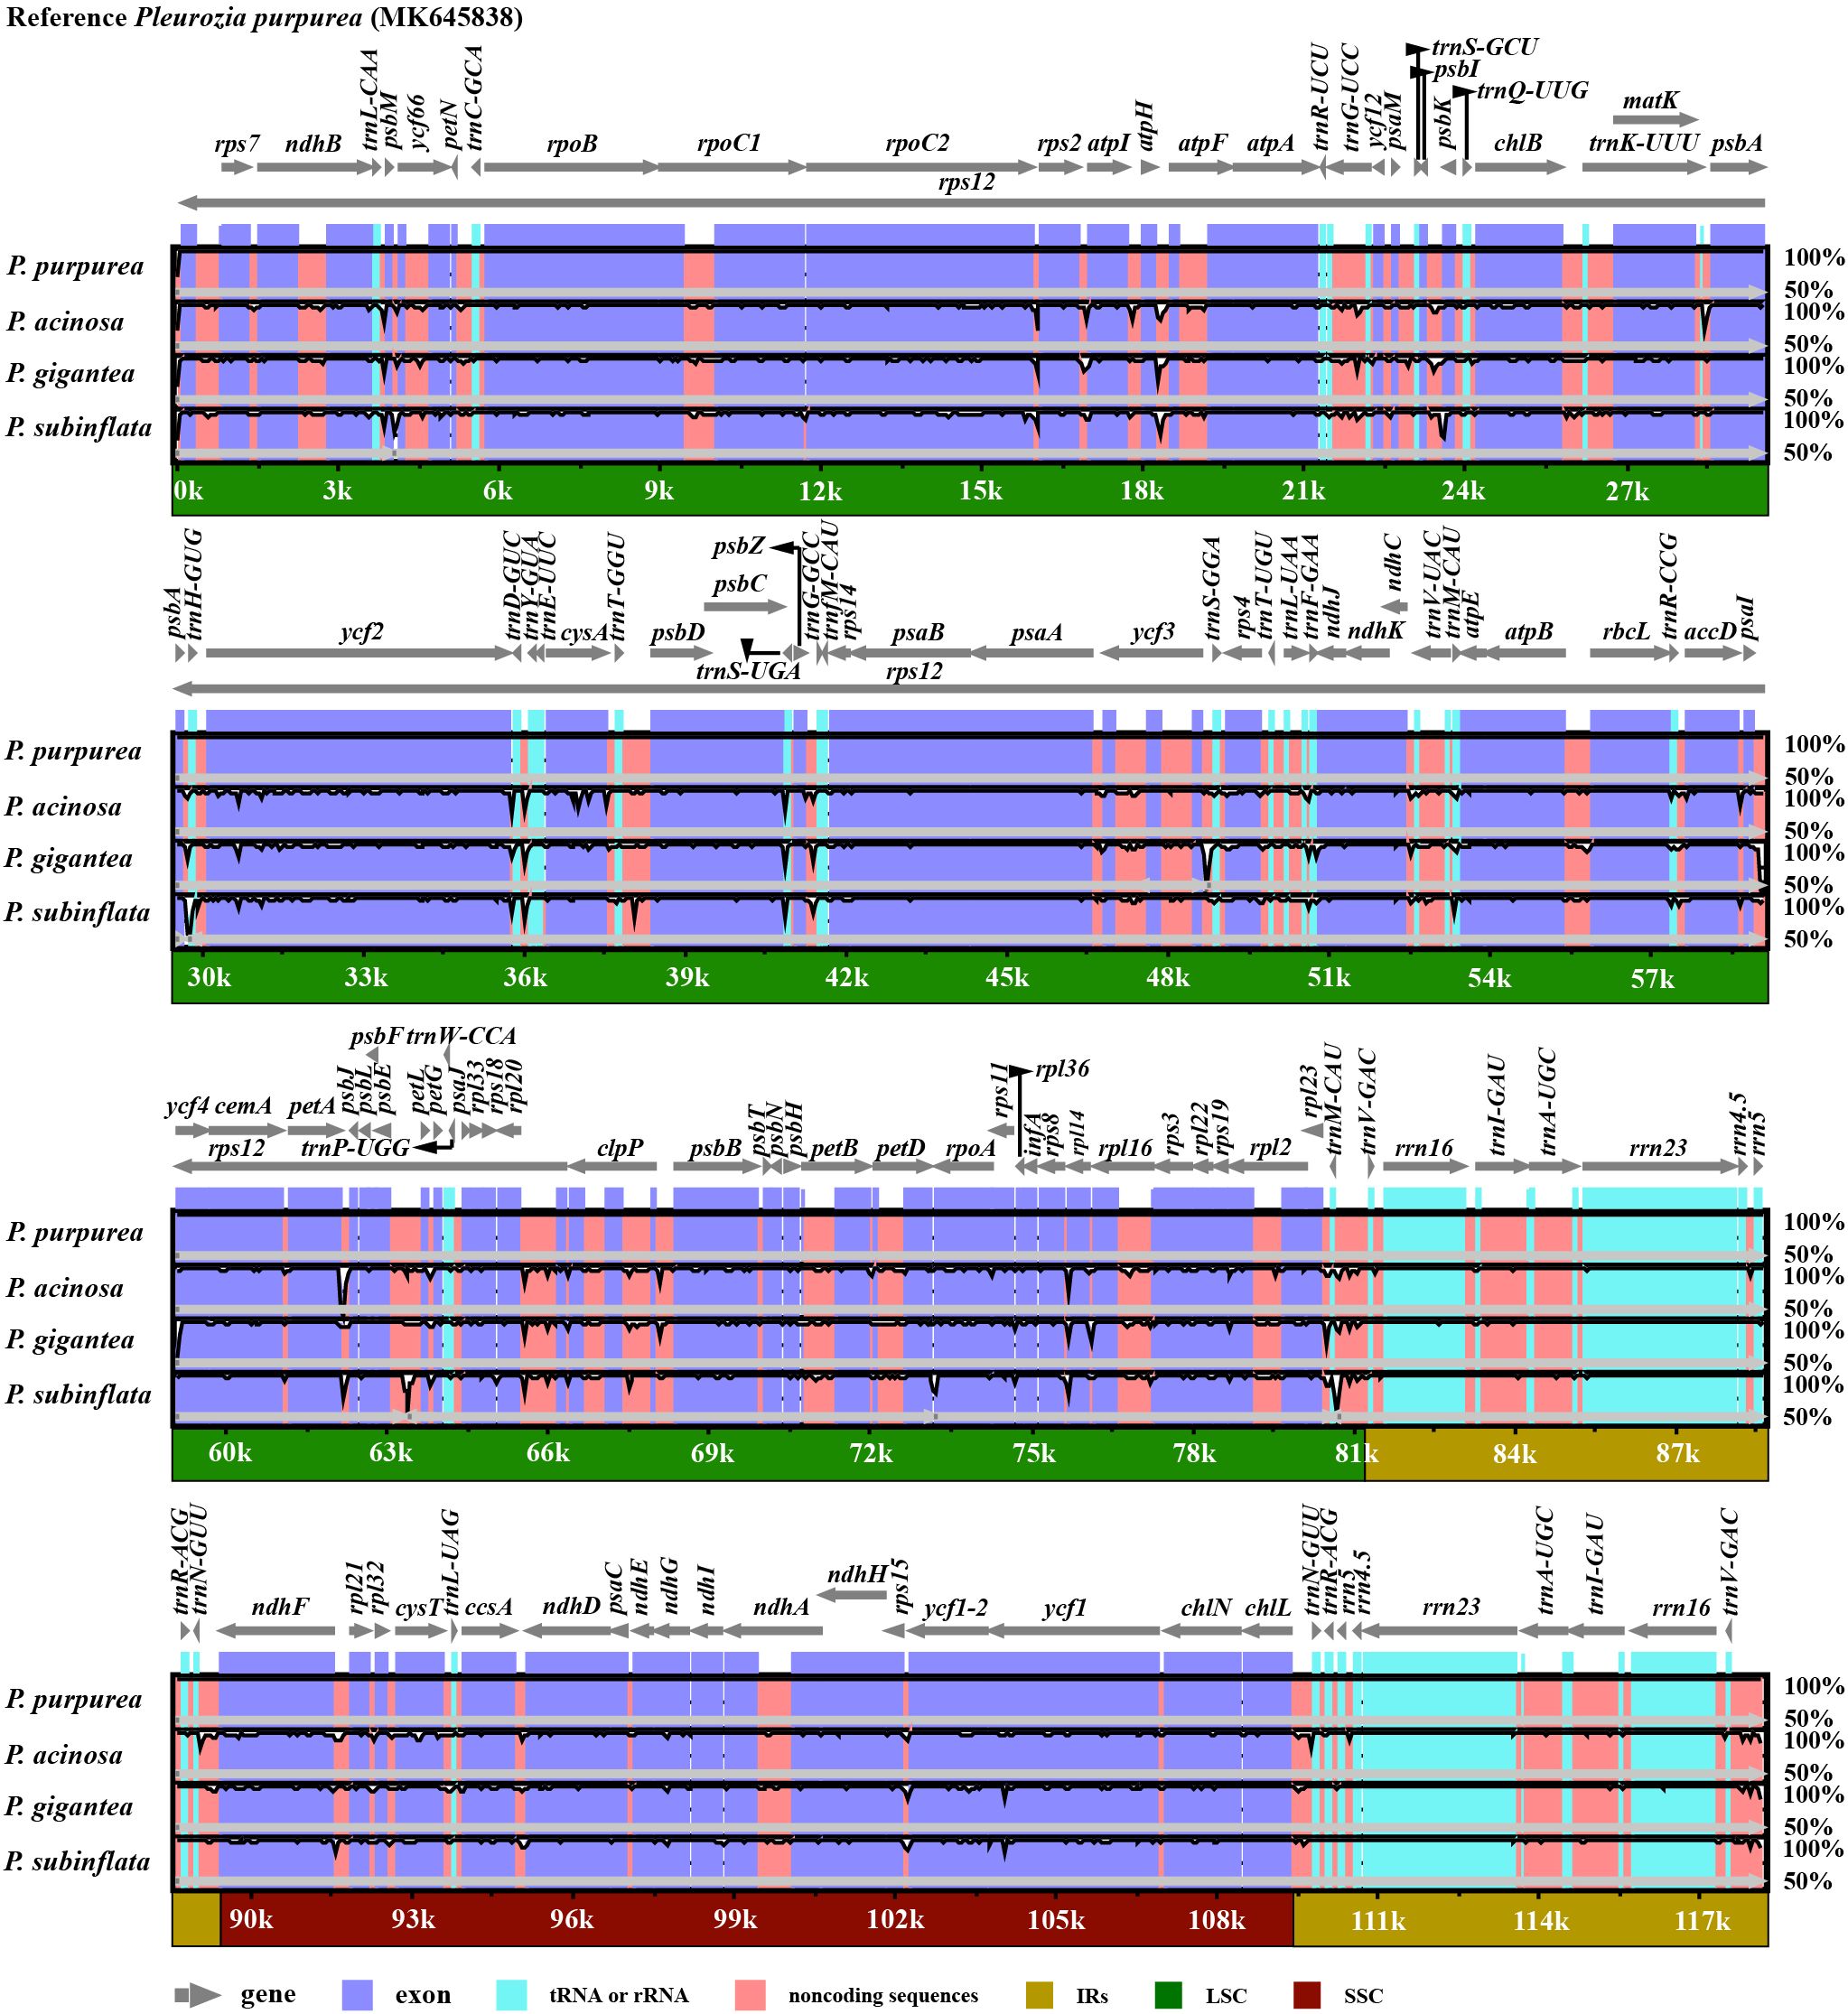
Figure 3. Comparative visualization of chloroplast genome sequences across four Pleurozia species. The y-axis represents sequence identity ranging from 50% to 100%, and the x-axis shows the position within the chloroplast genome. Arrows indicate the annotated genes and their transcription direction in the reference genome. The protein-coding and non-coding regions are highlighted in purple and orange, respectively.
3.2.2 Genome collinearity analysis and nucleotide diversity
Genome collinearity analyses demonstrated structural conservation among the chloroplast genomes of Pleurozia species (Figure 4A). The absence of gene inversions or genomic rearrangements confirms high collinearity among these genomes. Nucleotide diversity (Pi) analyses revealed Pi (π) values ranging from 0 to 0.0350, with a genome-wide average of 0.0127 (Figure 4B). The IR regions exhibited significantly lower variability compared to the LSC and SSC regions. Three hypervariable non-coding regions (π > 0.03) were identified: rpl23~trnM-CAU (0.0350), psbE~petL~petG (0.0317), and trnL-UAA~trnF-GAA (0.0314). Additionally, 15 moderately variable non-coding regions (e.g., trnN-GUU~ndhF, atpI~atpH~atpF, psbA~trnH-GUG) and six intronic regions (ycf66, trnG-UCC, rpl16, rpoC1, clpP, ndhB introns) were detected (see Figure 4B; Supplementary Table S2). Notably, ycf2 was the only moderately variable protein-coding region.
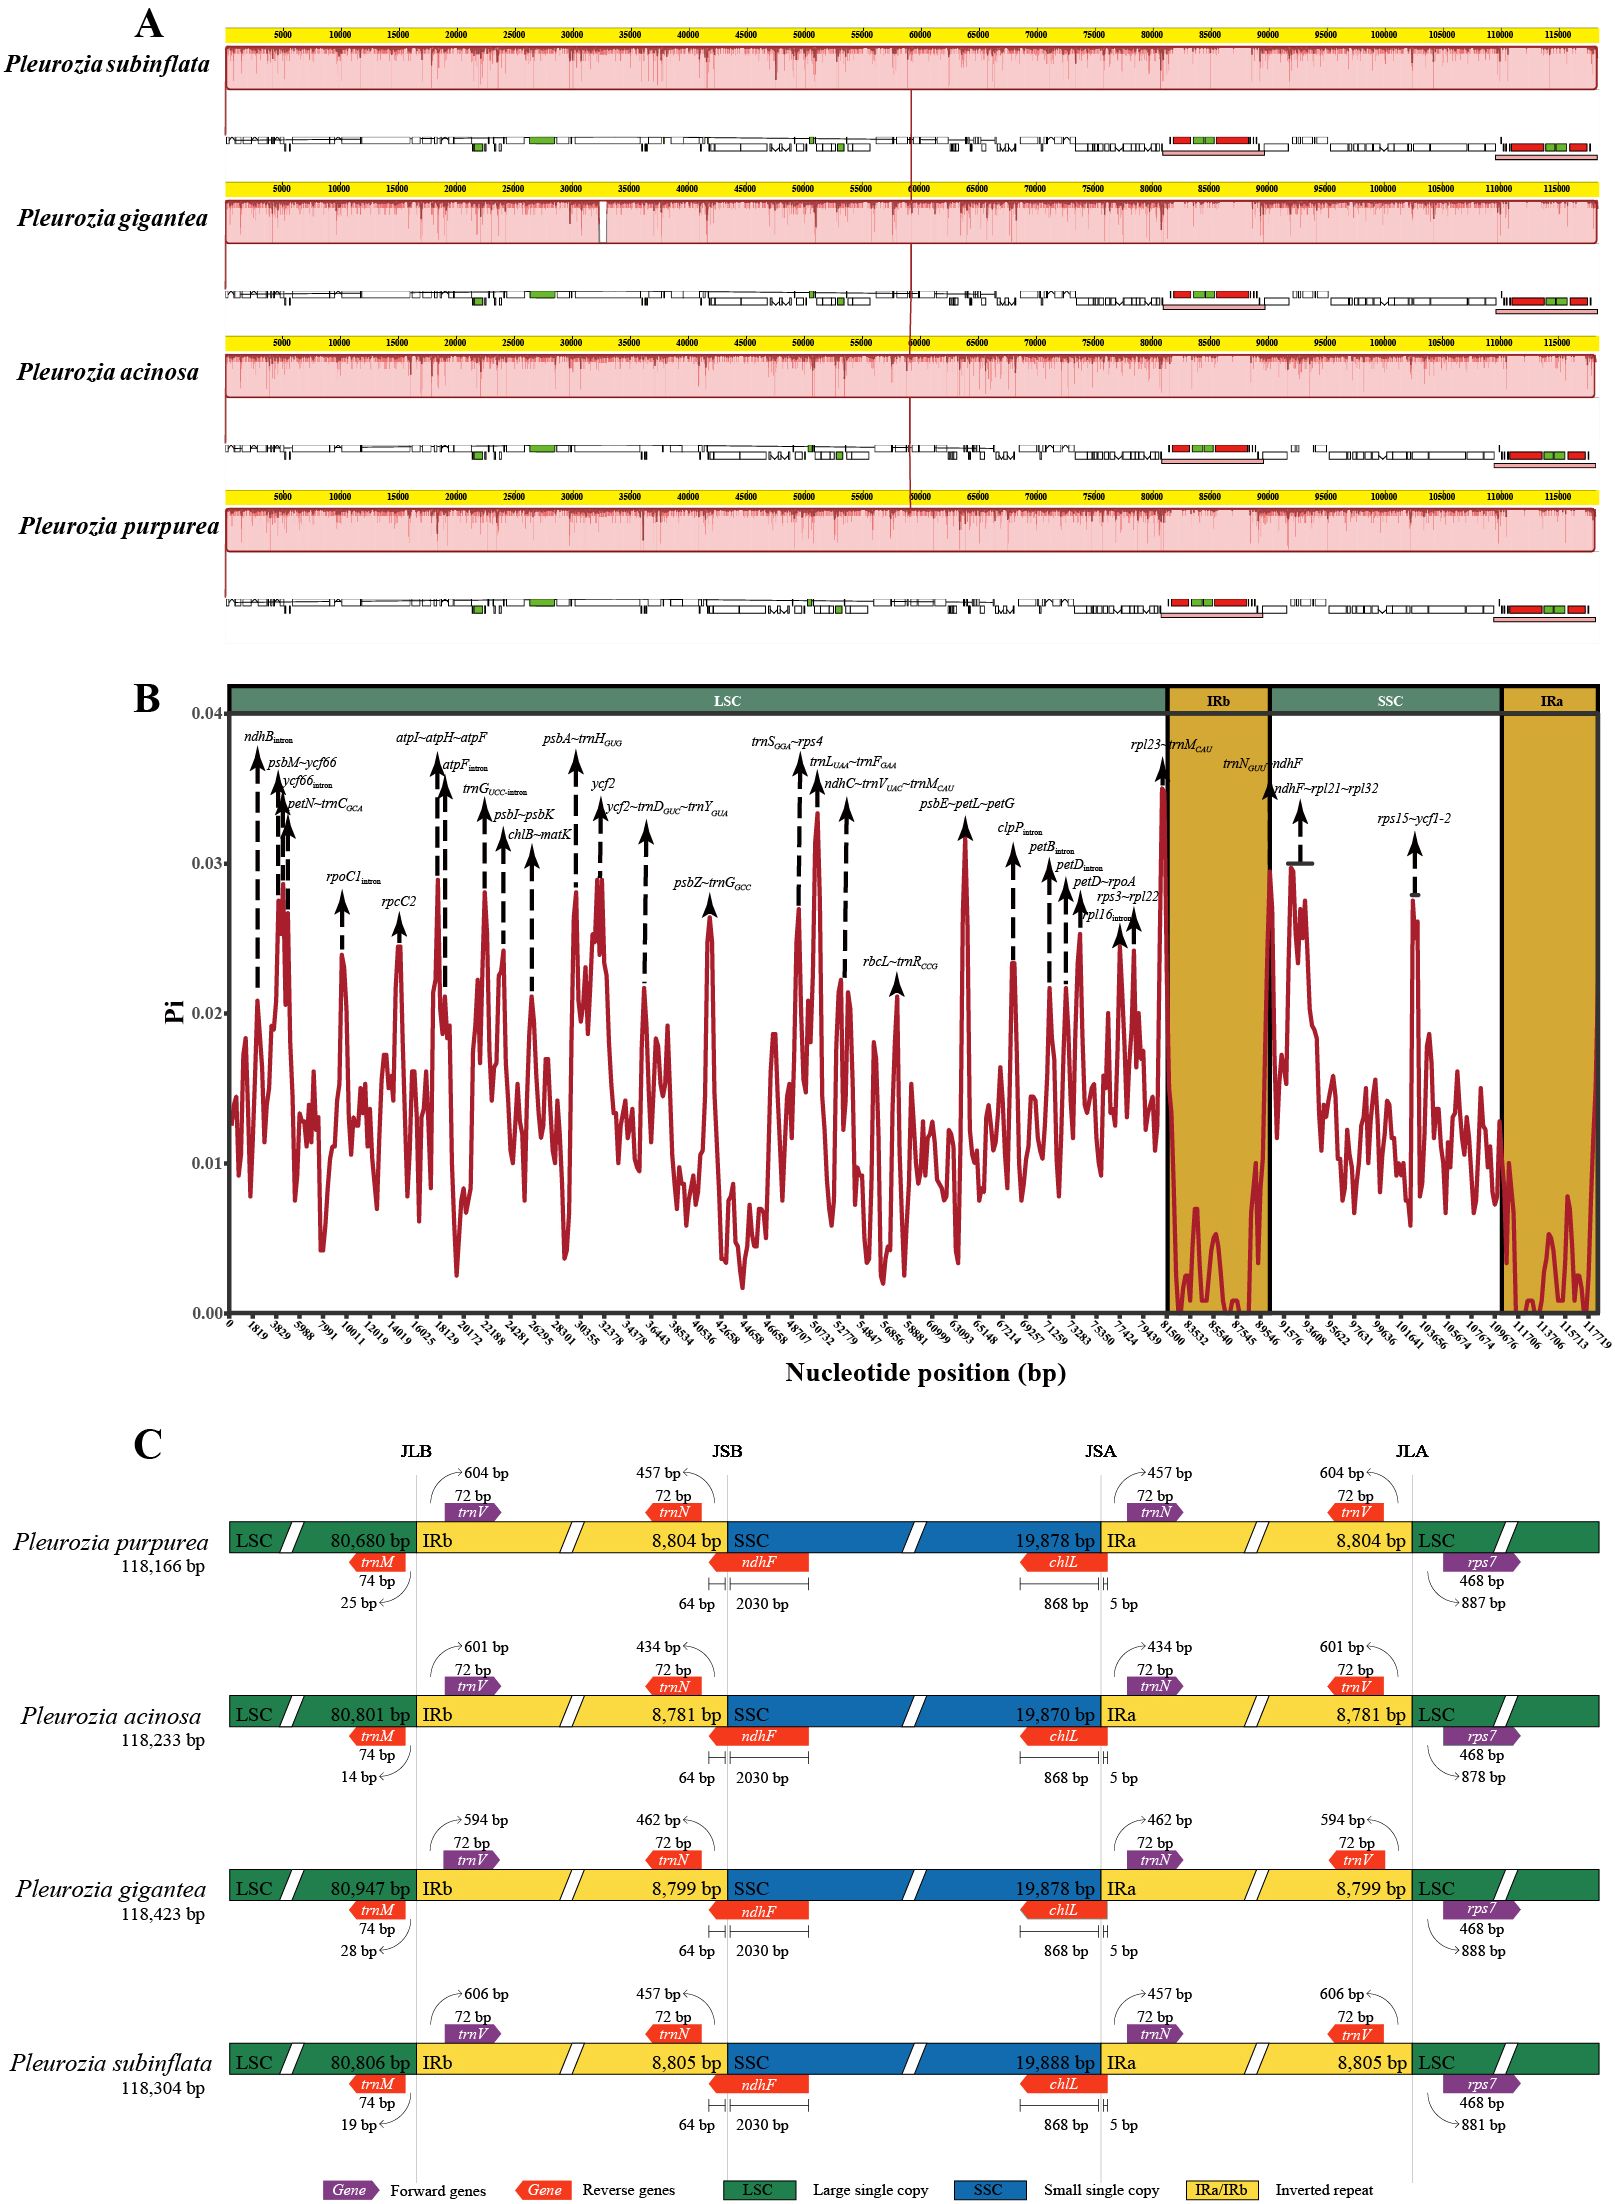
Figure 4. Comparative genomics analyses of four Pleurozia species. (A) Mauve alignment of four Pleurozia plastomes. Locally co-linear blocks are represented by continuous colored regions. (B) Sliding window analysis of the whole chloroplast genomes across Pleurozia species. Step length: 600 bp; window length: 200 bp. (C) Comparative analysis of the junctions between the IR regions and two single copy regions (LSC/SSC) in four Pleurozia chloroplast genomes. Colored boxes above or below the main line indicate adjacent border genes. The distance between the genes and boundaries are represented by the base lengths (bp). JLA, junction between LSC and inverted repeat (IRA). JLB, junction between LSC and IRB. JSA, junction between SSC and IRA. JSB, junction between SSC and IRB.
3.2.3 IR contraction and expansion analysis
As depicted in Figure 4C, the chloroplast genomes of the four Pleurozia species exhibit highly conserved SC/IR boundary architecture, with no significant expansions or contractions. Notably, the ndhF gene extends across the IRb/SSC junction, with 64 bp located within IRb region, while the chlL gene spans the IRa/SSC boundary, containing merely 5 bp into the IRa region.
3.3 Selective pressure analysis
In the chloroplast genomes across four Pleurozia species, only ycf66 and ndhD exhibited Ka/Ks > 1, indicating positive selection. The remaining genes displayed ratios < 1 (Figure 5), consistent with genome-wide purifying selection. These findings underscore strong evolutionary constraints in Pleurozia chloroplast genomes, reflecting the conservation of essential protein functions through the selective removal of deleterious mutations.
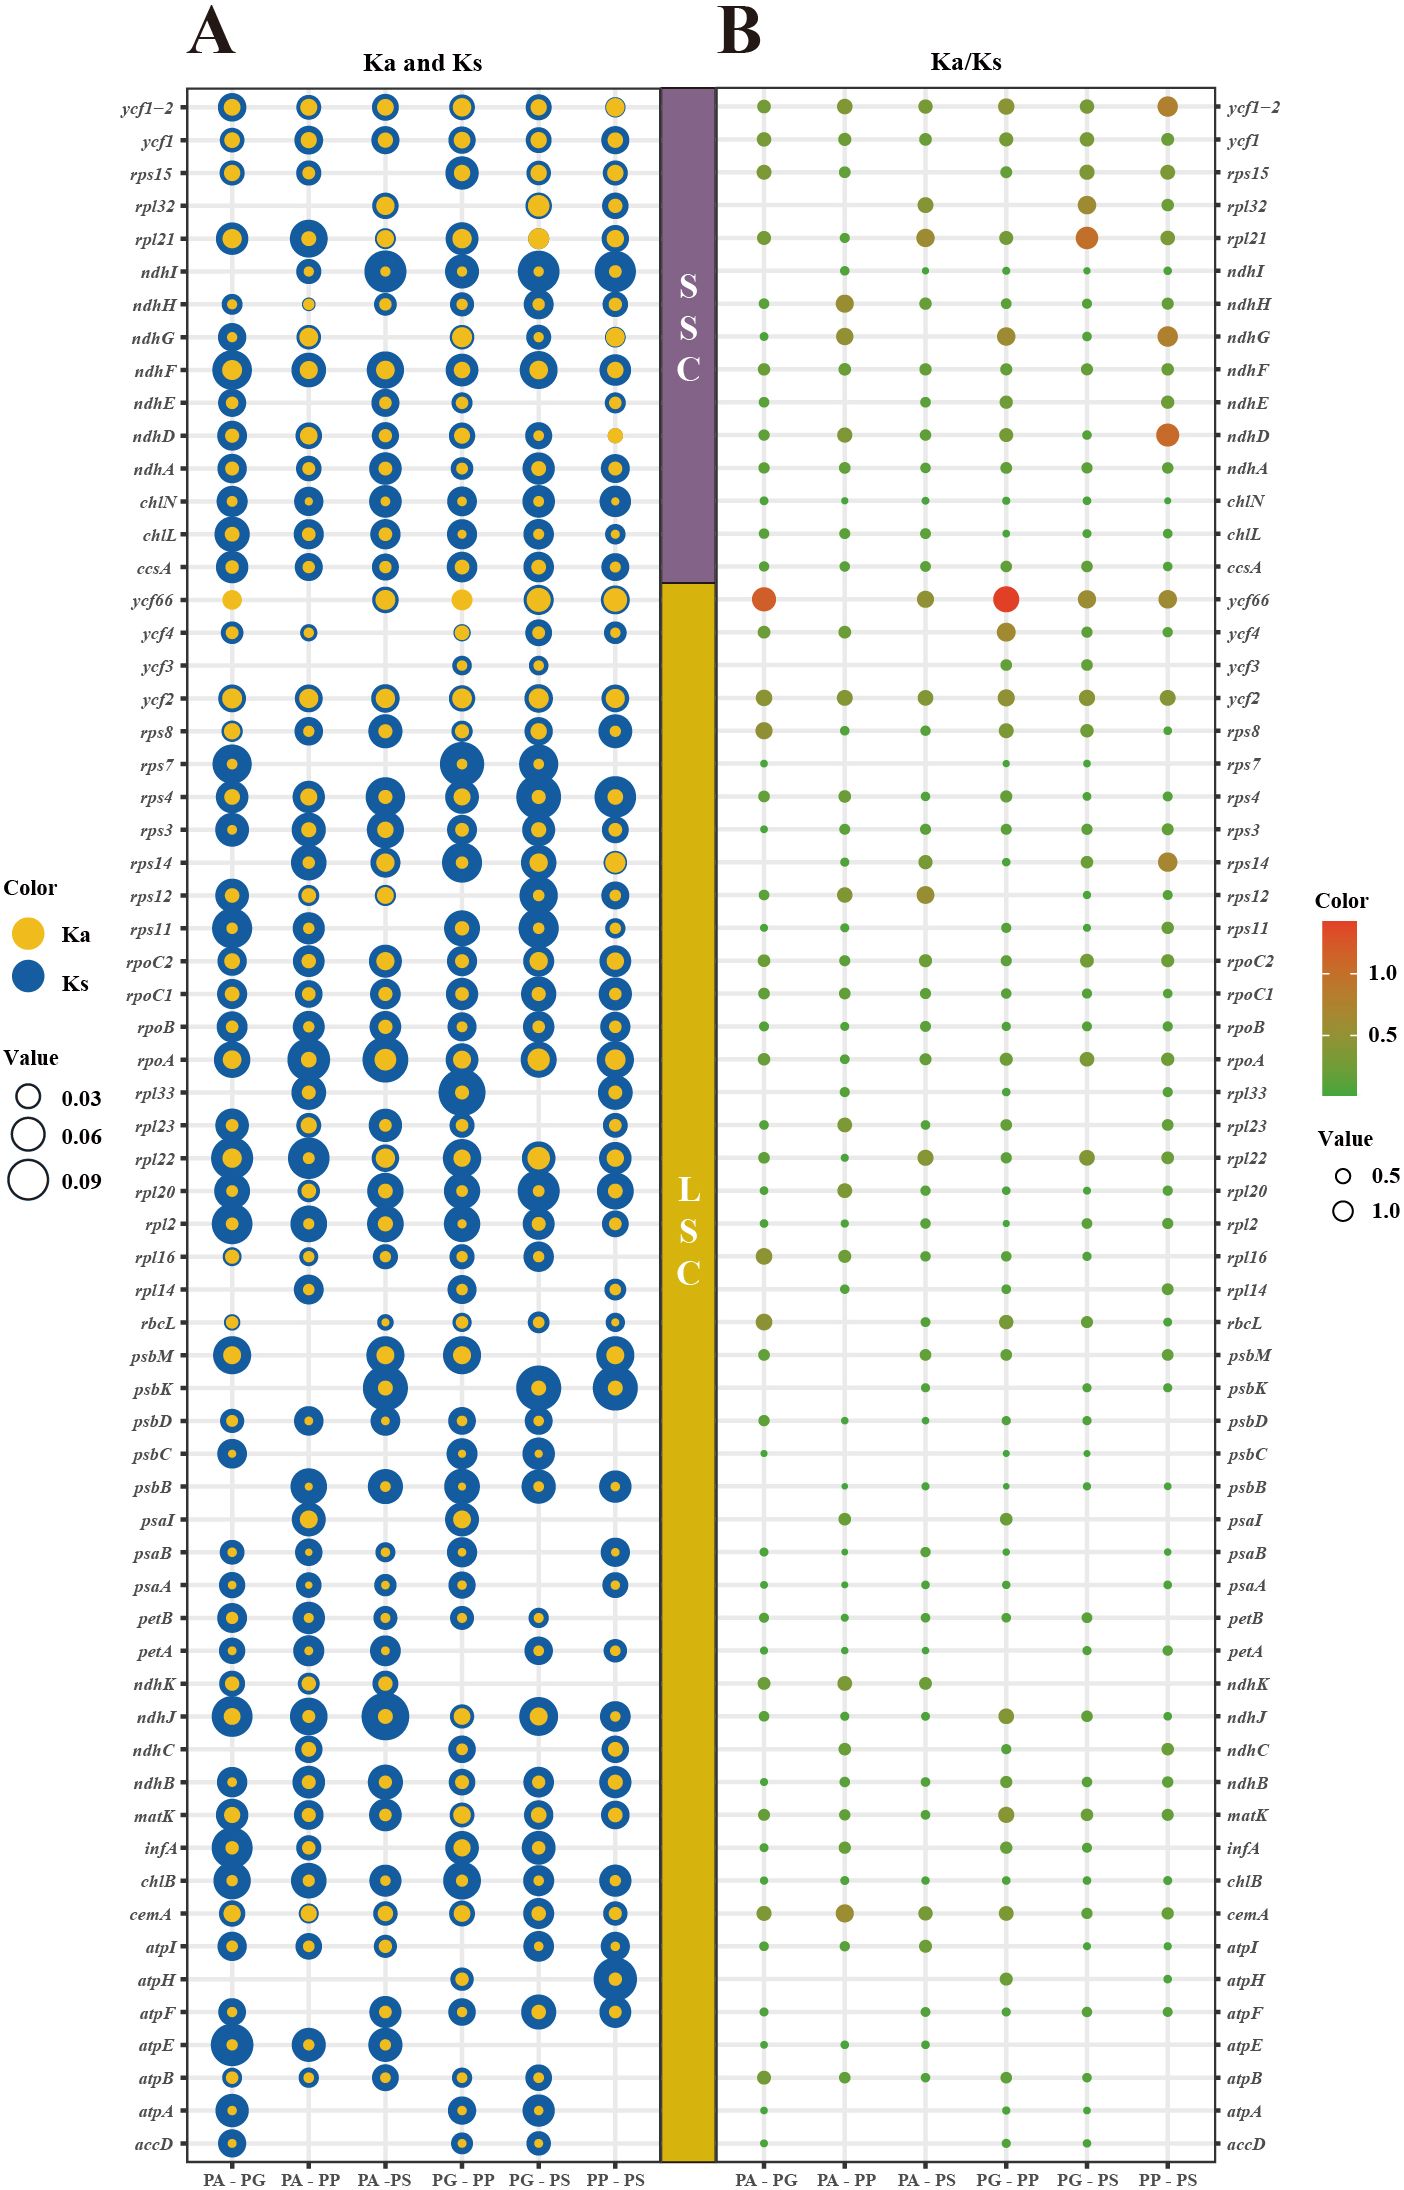
Figure 5. Bubble plots are employed to illustrate the variation in selection pressure across 63 PCGs in four Pleurozia chloroplast genomes. (A) Ka (blue bubbles) and Ks (yellow bubbles) substitution rates. Bubble size corresponds to Ka or Ks values; yellow predominance indicates Ka/Ks > 1. (B) Ka/Ks ratios. Bubble size and color intensity reflect ratio magnitude; larger ratios indicate stronger selection pressure. Vertical axis: individual genes; horizontal axis: species pairs (PA, P. acinosa; PG, P. gigantea; PP, P. purpurea; PS, P. subinflata).
3.4 Codon usage bias of chloroplast genomes of Pleurozia species
3.4.1 GC content of each codon position
A total of 58, 60, 60, and 60 CDS from P. acinosa, P. gigantea, P. purpurea, and P. subinflata were analyzed, respectively. The results showed no significant interspecific variation in overall GC content (Supplementary Table S3). However, significant heterogeneity (p < 0.0001) was observed among GC1, GC2, and GC3, demonstrating a consistent pattern of GC1(43.40%) > GC2 (36.75%) > GC3 (18.04%) across all species (Supplementary Figure S1; Supplementary Table S3).
3.4.2 RSCU analysis
The analyses identified 29 codons with RSCU values >1 (Supplementary Table S4), including 16 U-ending and 13 A-ending codons, demonstrating a pronounced preference for U/A-terminated codons in the chloroplast genomes of Pleurozia. Notably, the Leucine-encoding UUA codon exhibited an RSCU value exceeding 3. As shown in Figure 6, the RSCU ratios are broadly similar across the four Pleurozia species, indicating a consistent codon usage pattern.
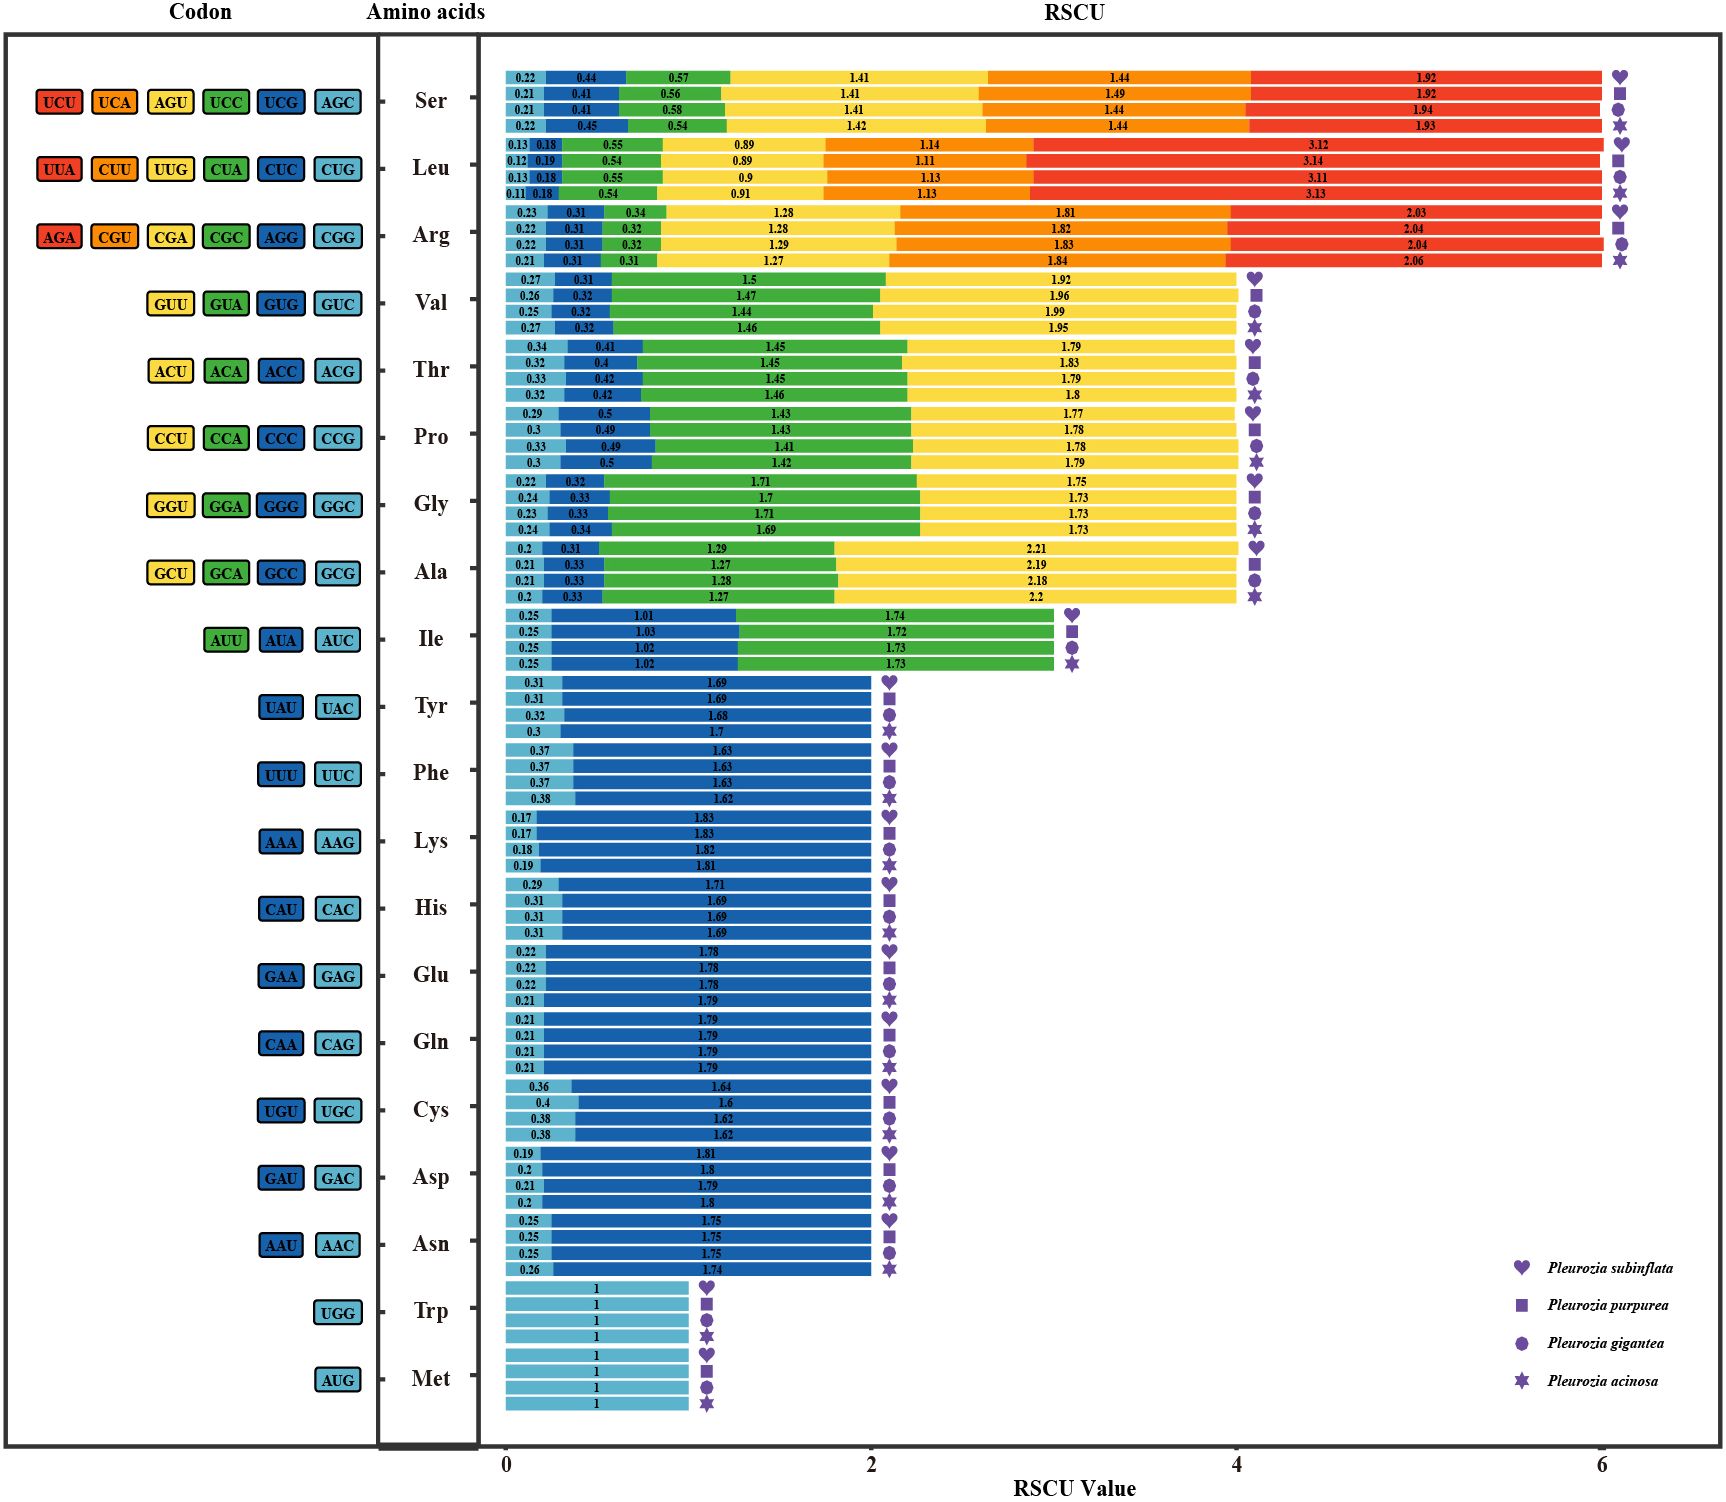
Figure 6. RSCU-plot in the chloroplast genomes of four Pleurozia species. Codons are listed on the left side of the graph, corresponding amino acids in the center, and RSCU values on the right.
3.4.3 ENC plot analysis
The ENC values ranged from 33.74 to 48.28 in P. acinosa (mean = 40.42), 37.10 to 47.66 in P. gigantea (mean = 40.56), 34.18 to 48.42 in P. purpurea (mean = 40.30), and 34.59 to 48.69 in P. subinflata (mean = 40.34). All genes exhibited ENC values below 50, with species means exceeding 35 (Figures 7A–D), indicating moderate CUB in Pleurozia chloroplast genomes. The ENC plots for the four Pleurozia species (Figures 7A–D) revealed dispersed distributions relative to the expected curve. While a minority of genes clustered near the standard curve, the majority of genes were scattered around it. This pattern suggests synergistic effects of mutation pressure and natural selection in shaping CUB. Furthermore, no significant interspecific differences were observed in ENC values, GC3s composition (Supplementary Figures S2A–B), or overall codon usage patterns (Supplementary Figure S2C–D).
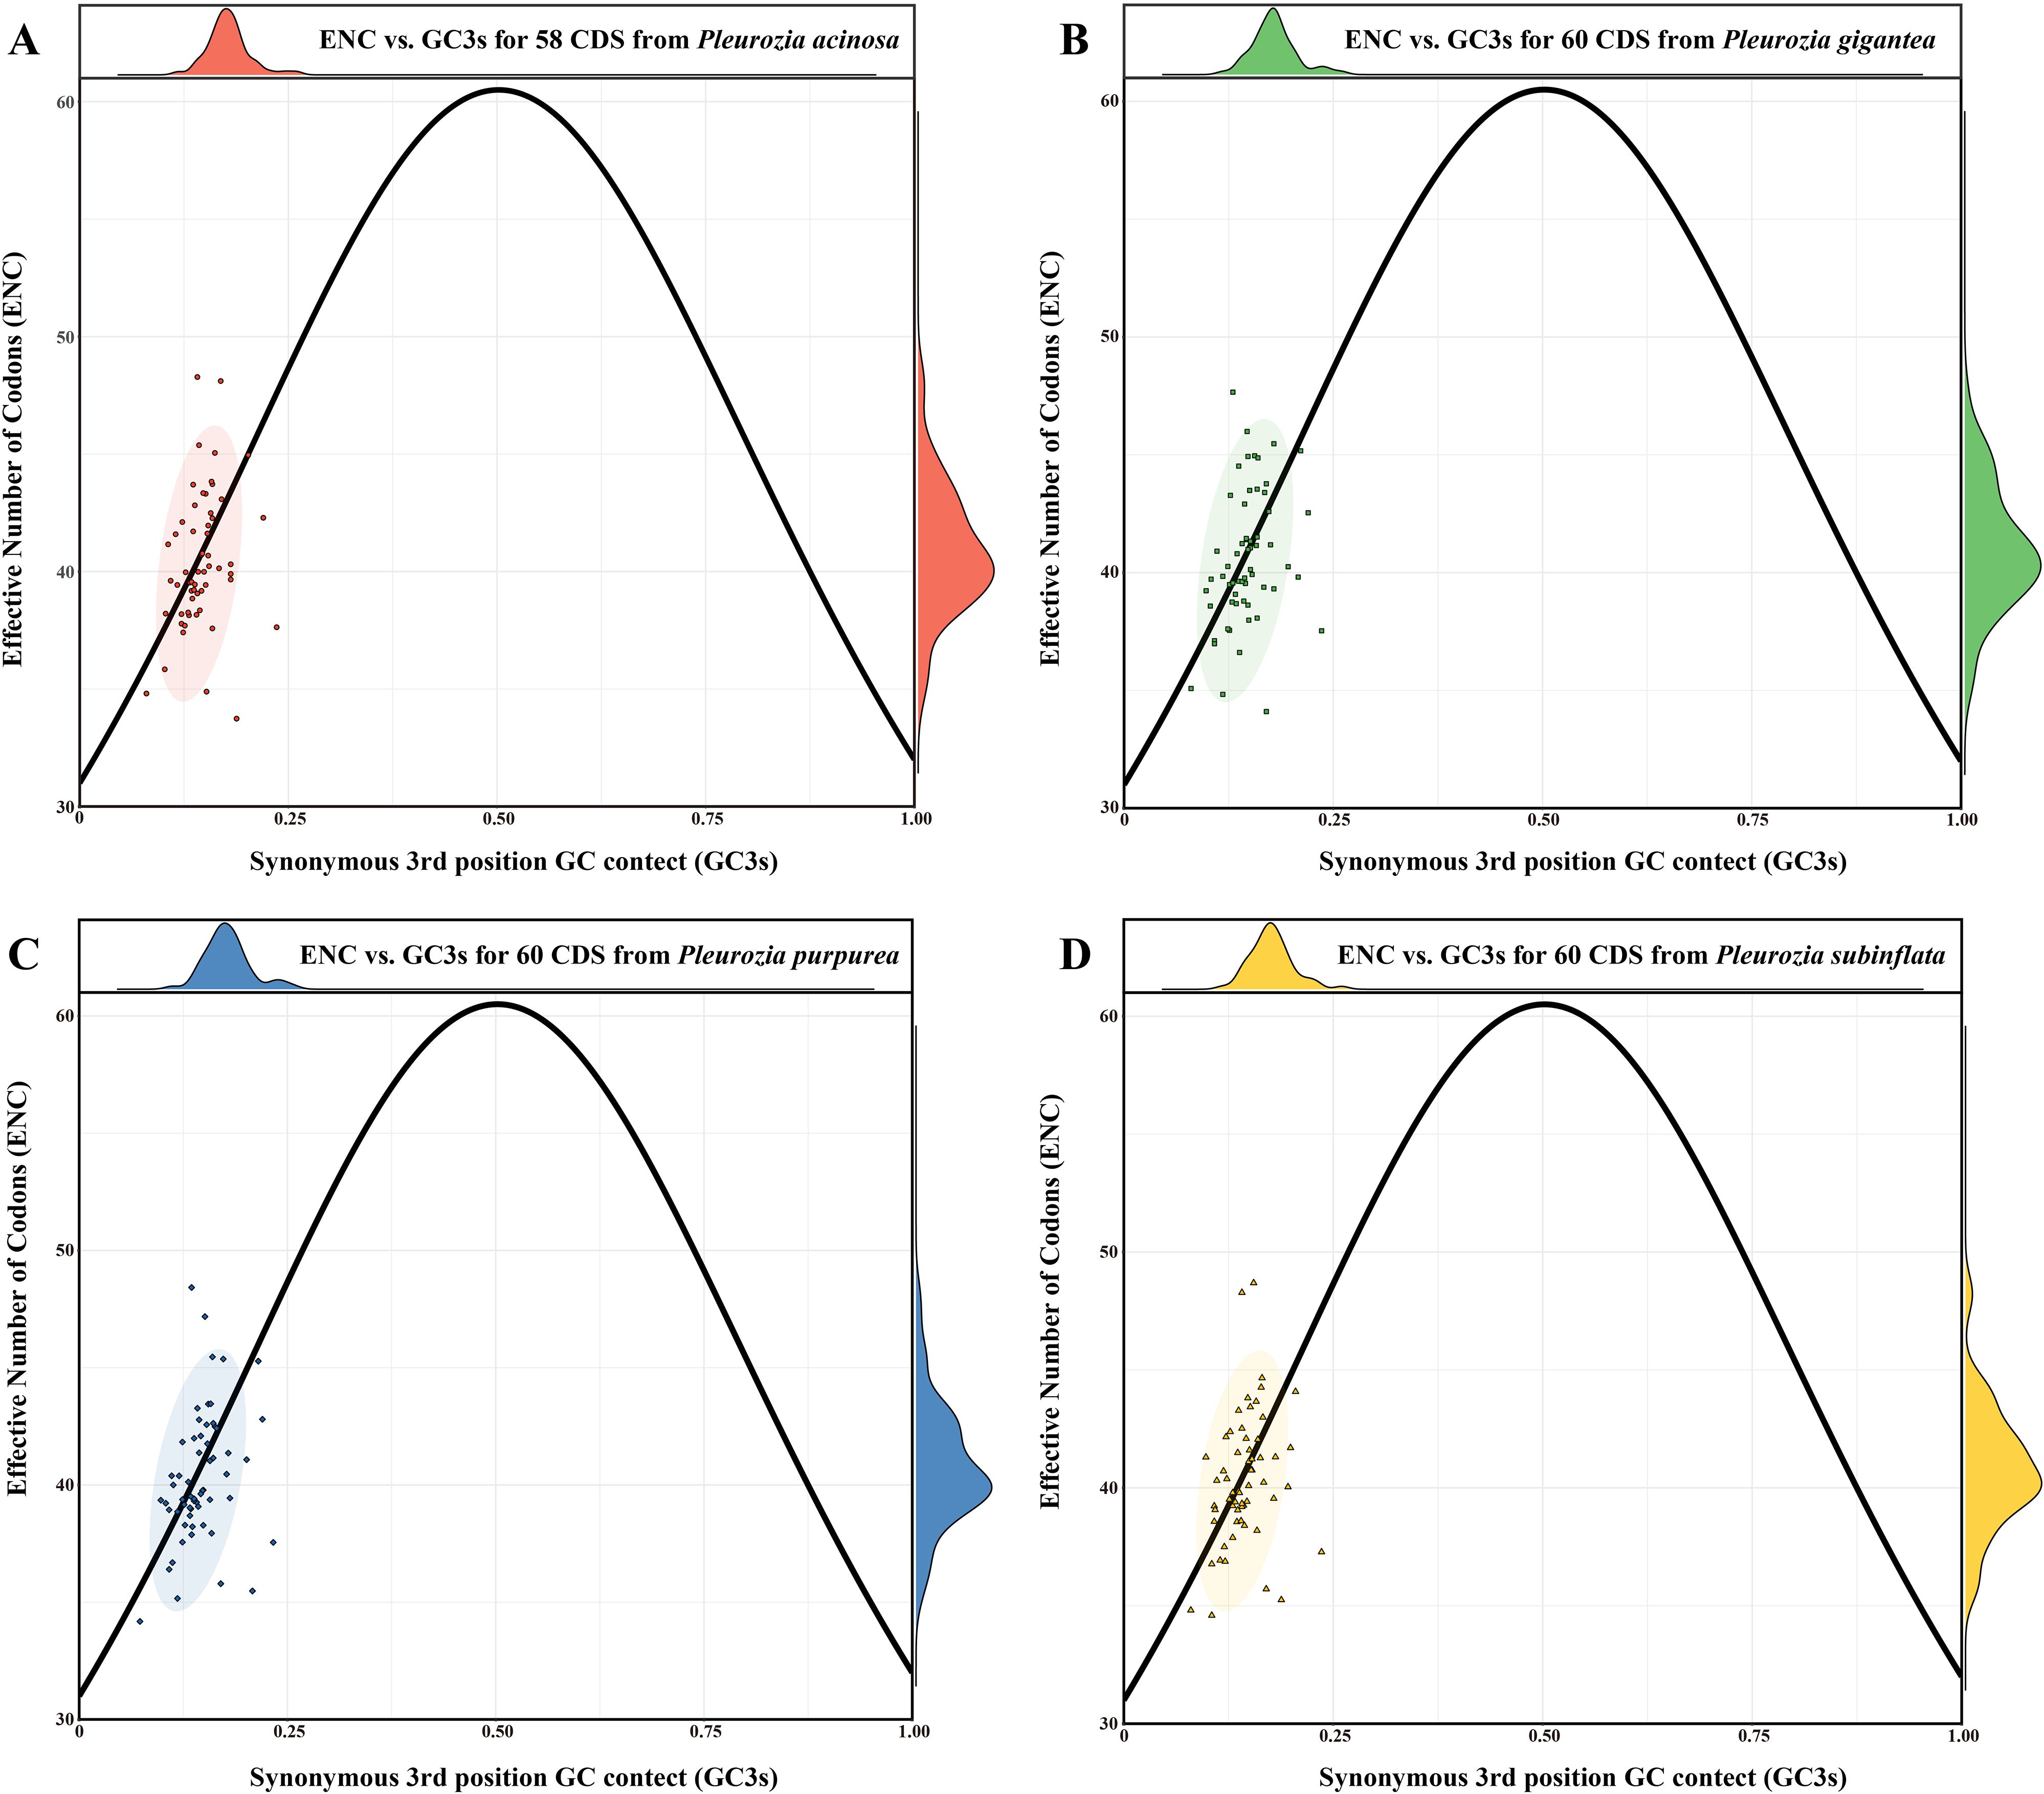
Figure 7. ENC-GC3s plot of the chloroplast genomes of Pleurozia species. (A–D) ENC-GC3s results of P. acinosa, P. gigantea, P. purpurea, and P. subinflata, respectively. The circles represent 95% confidence intervals.
3.4.4 PR2-plot analysis
The PR2-plot results (Figures 8A–D) revealed asymmetric CDS distribution across all four Pleurozia species, with CDS points predominantly clustered in the lower-left quadrant (A3s < T3s, G3s < C3s), indicating a clear preference for T/C bases. A small number of CDS approached the plot center (A3s/(A3s + T3s) ≈ 0.5, G3s/(G3s + C3s) ≈ 0.5), suggesting limited neutral evolution dynamics. The consistent, unbalanced usage of bases at the third codon position across Pleurozia species highlights conserved evolutionary constraints mediated by the combined effects of mutational pressures, selective constraints, and other forces.
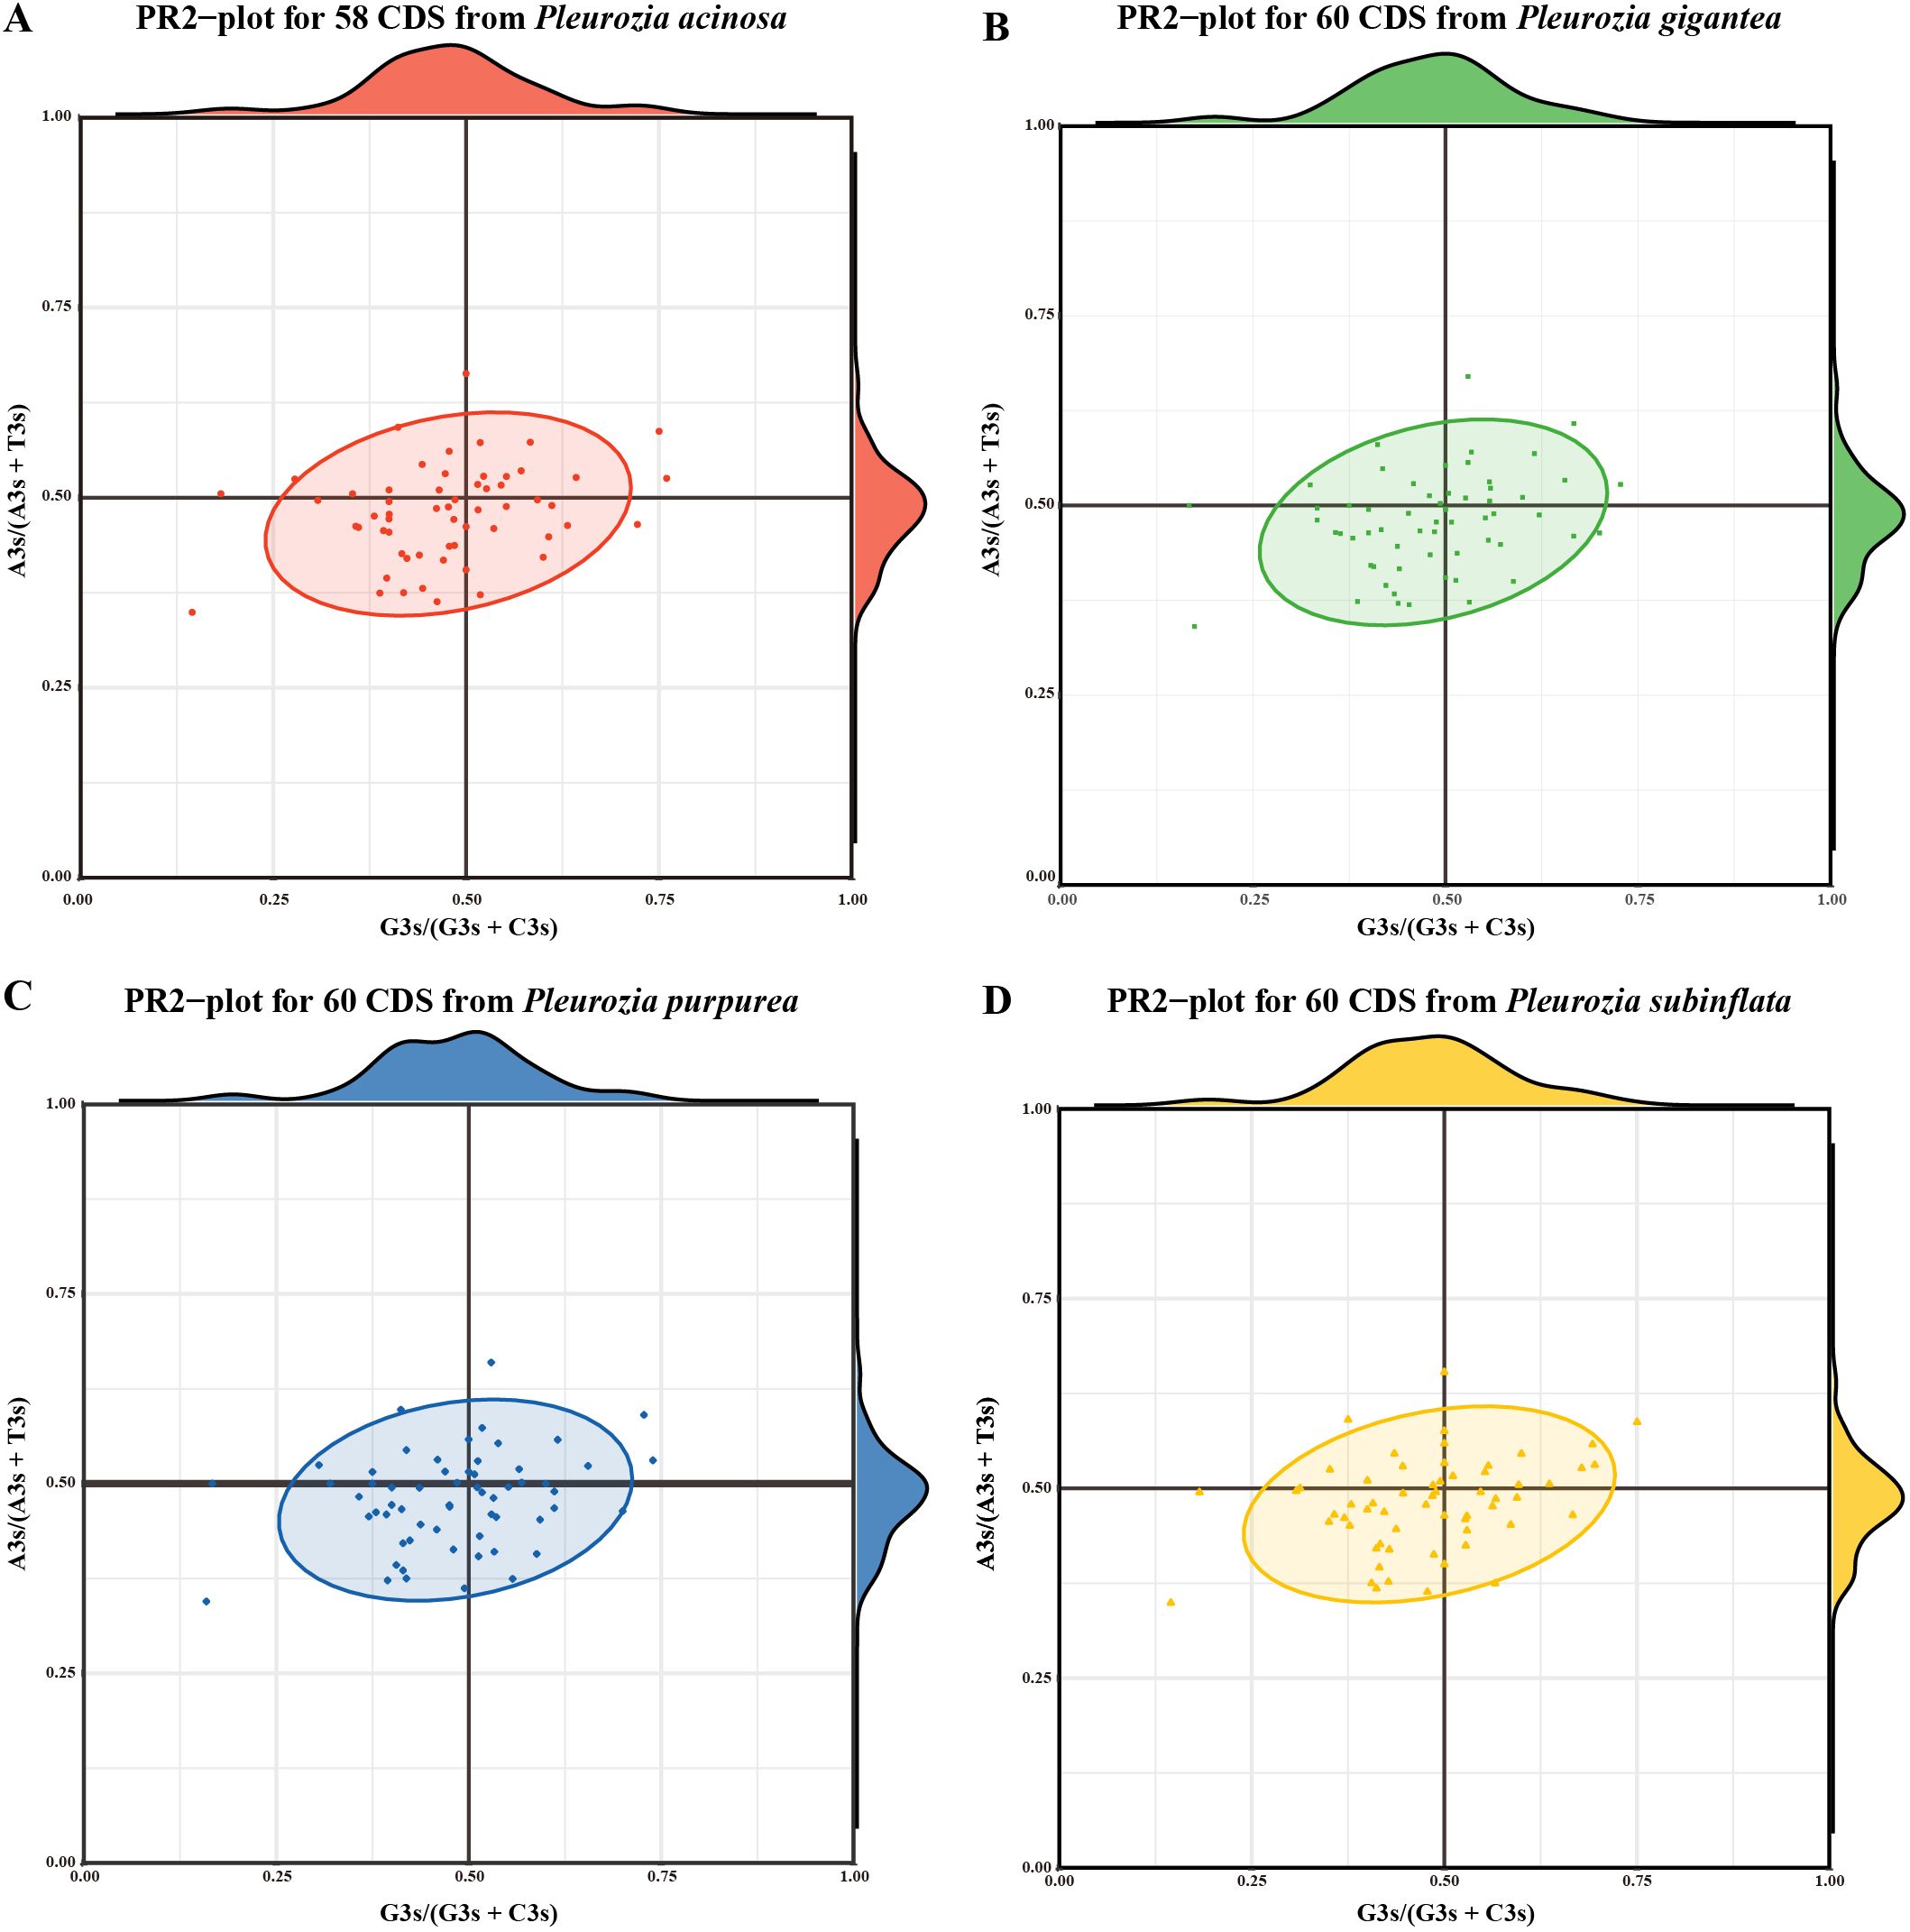
Figure 8. PR2-plot analysis of chloroplast genomes in Pleurozia species. (A–D) PR2-plot results for P. acinosa, P. gigantea, P. purpurea, and P. subinflata, respectively. Density profiles of G3s/(G3s + C3s) and A3s/(A3s + T3s) in A-D are shown on the top and right edges, respectively.
3.4.5 Neutrality-plot analysis
As shown in Figures 9A–D, the regression analysis revealed that only a few genes were diagonally distributed in the plot, and P12 exhibited no significant correlation with P3 (r for all species < 0.09, P > 0.05), suggesting that natural selection may exert a considerable influence on the CUB of the four Pleurozia species. Furthermore, the slopes of the regression lines were 0.1000 (P. acinosa), 0.1230 (P. gigantea), 0.0914 (P. purpurea) and 0.1800 (P. subinflata), indicating that the mutation pressure across the four species accounted for only 9.14% to 18.00%. Consequently, these results imply that natural selection is superior to mutation pressure in shaping the development of CUB in Pleurozia.
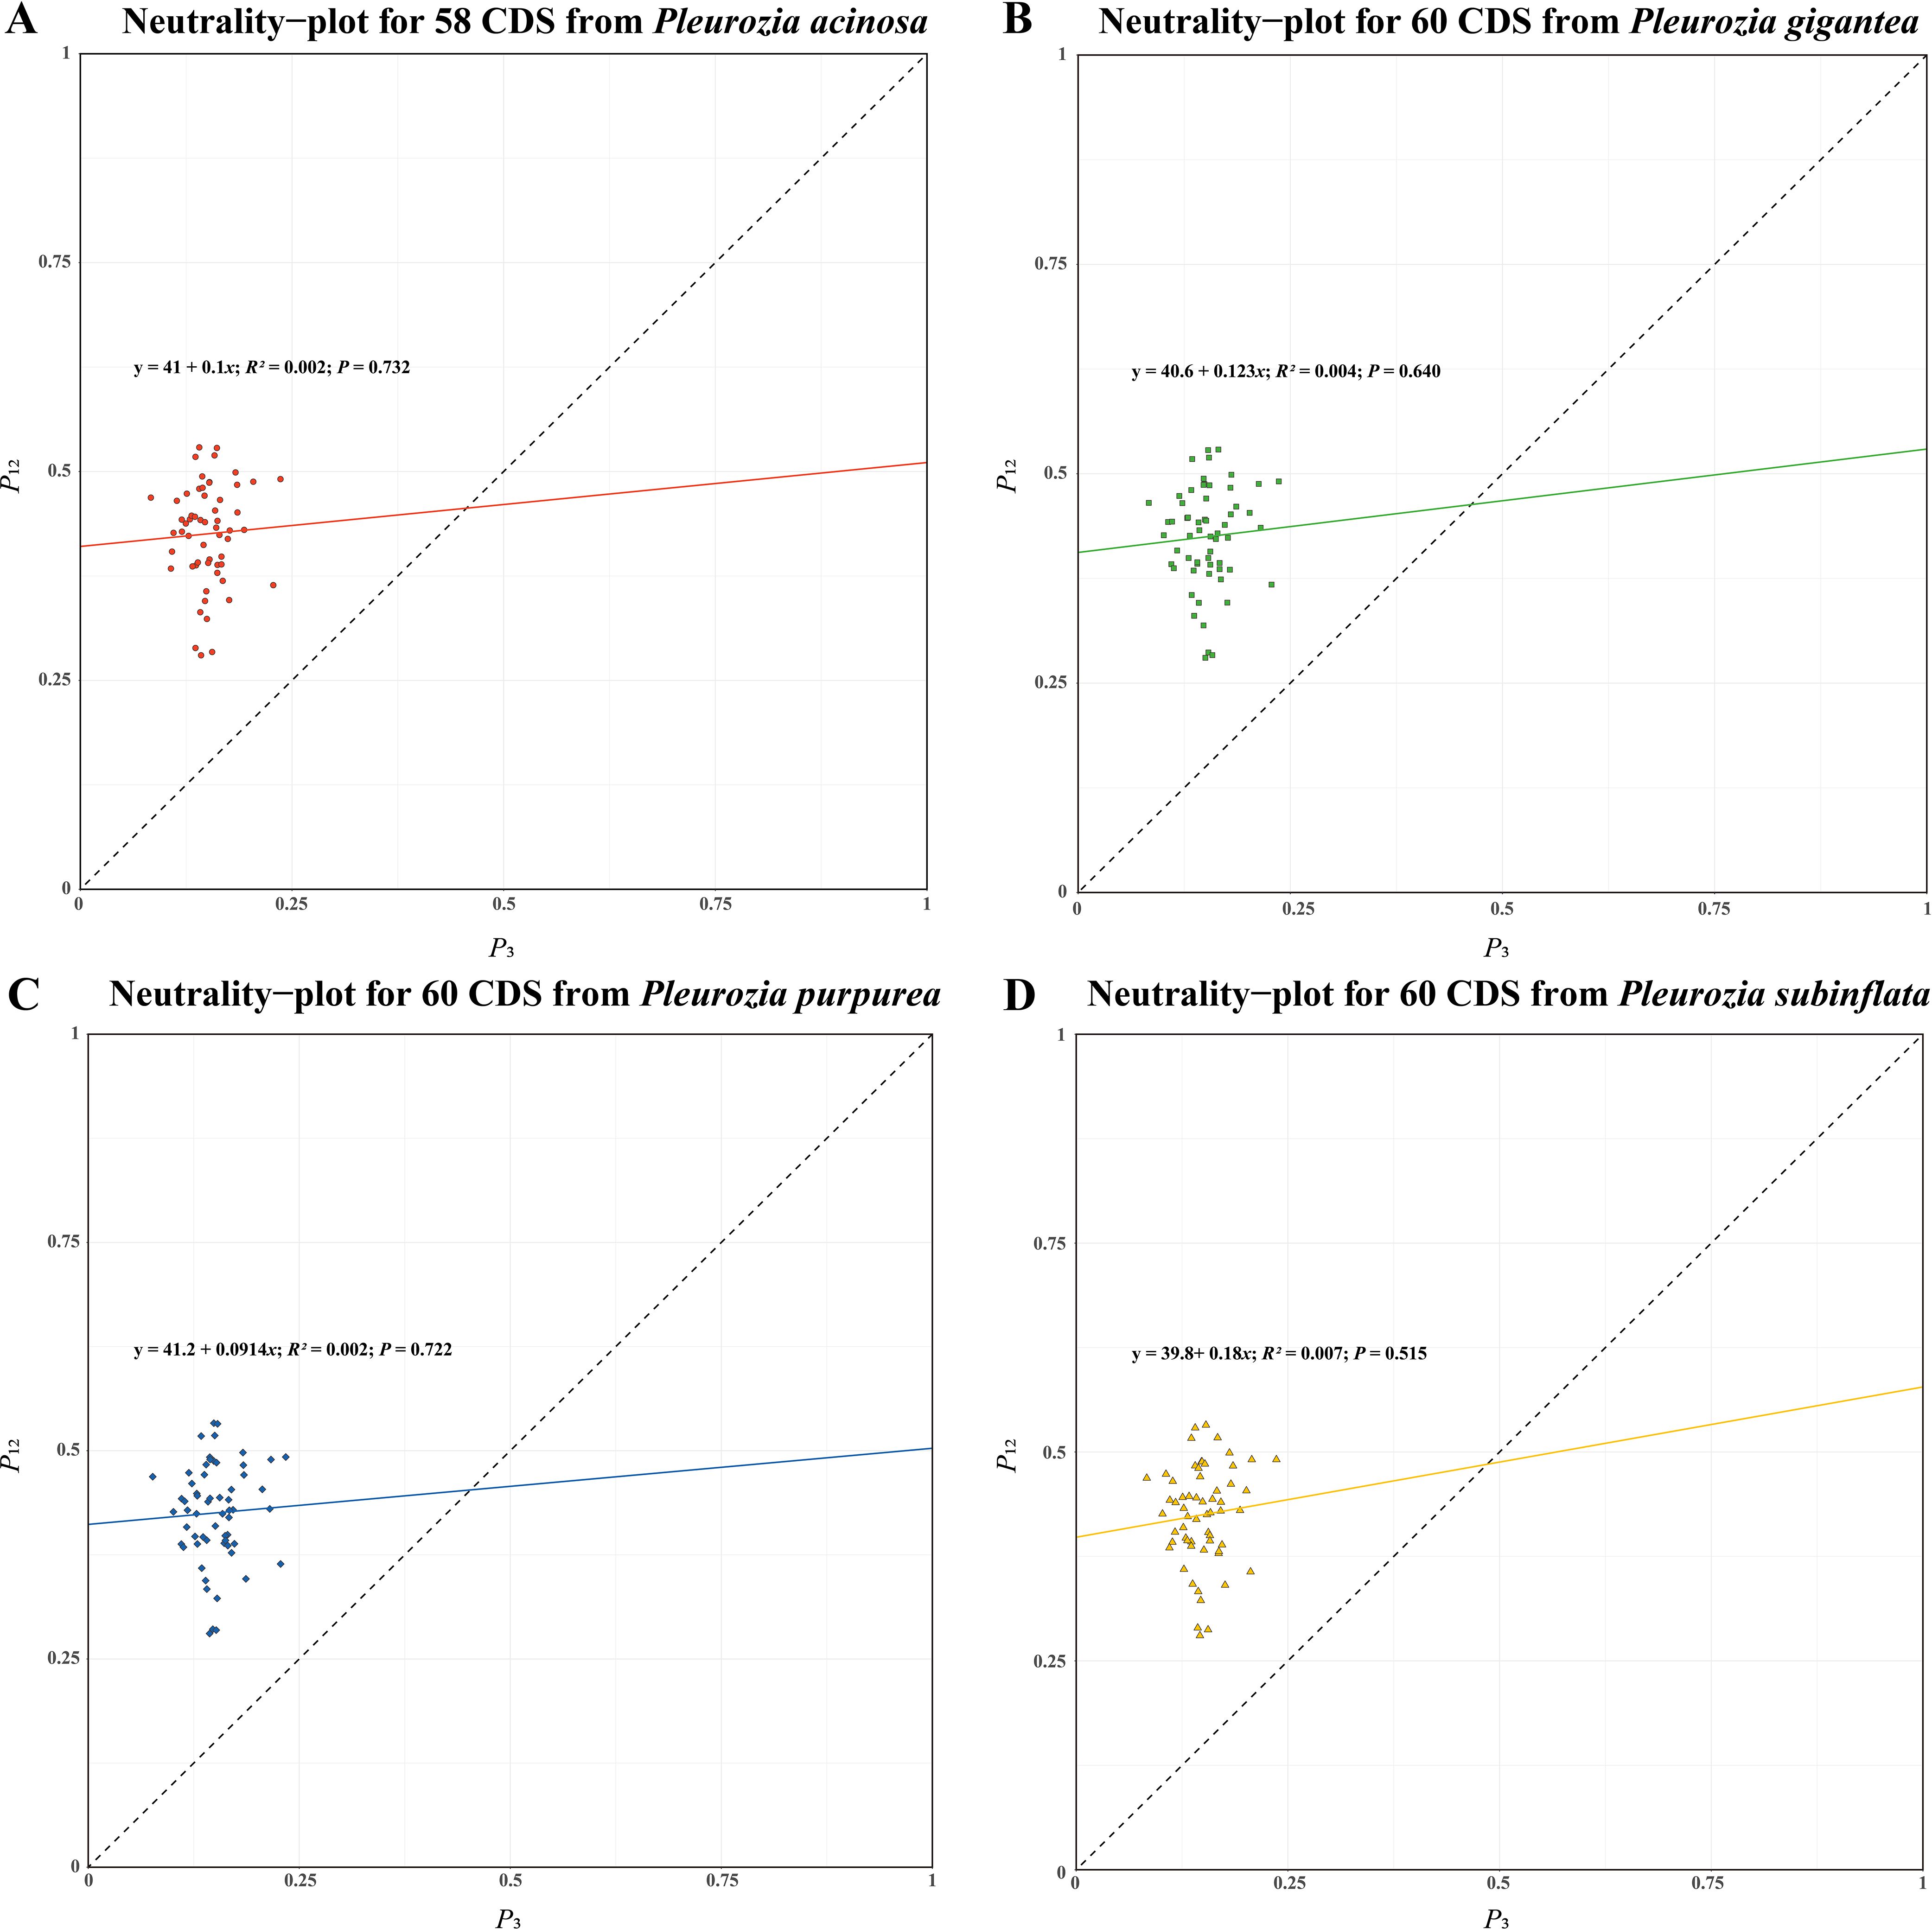
Figure 9. Neutral-plot analysis of CUB in the chloroplast genomes of Pleurozia species. (A–D) Results for P. acinosa, P. gigantea, P. purpurea, and P. subinflata, respectively. Horizontal axis: P3 value; vertical axis: P12 value.
3.5 Phylogenetic analysis of Pleurozia chloroplast genomes
Phylogenetic analyses of 35 liverwort chloroplast genomes (LSC + IRb + SSC regions) using both maximum likelihood (ML) and Bayesian inference (BI) methods revealed highly congruent topologies. Most nodes corresponding to orders and families received strong support, with ML bootstrap (BS) values ≥ 80 and Bayesian posterior probabilities (PP) of 1.00 (Figures 10A, B). On the resulting phylogenetic tree, the Marchantiales clade, together with Lunulariales, belongs to the complex thalloid liverworts. The remaining taxa form a major clade, further divided into two subclades. One consists of Pallaviciniales, Pelliales, and Fossombroniales, representing a group of simple thalloid liverworts. The other contains Metzgeriales, another group of simple thalloid liverworts, along with the leafy liverwort orders Pleuroziales, Ptilidiales, Porellales, and Jungermanniales. The four Pleurozia species form a strongly supported monophyletic group representing Pleuroziales (BS/PP = 100/1.00), which is resolved as the sister lineage to Metzgeriales.
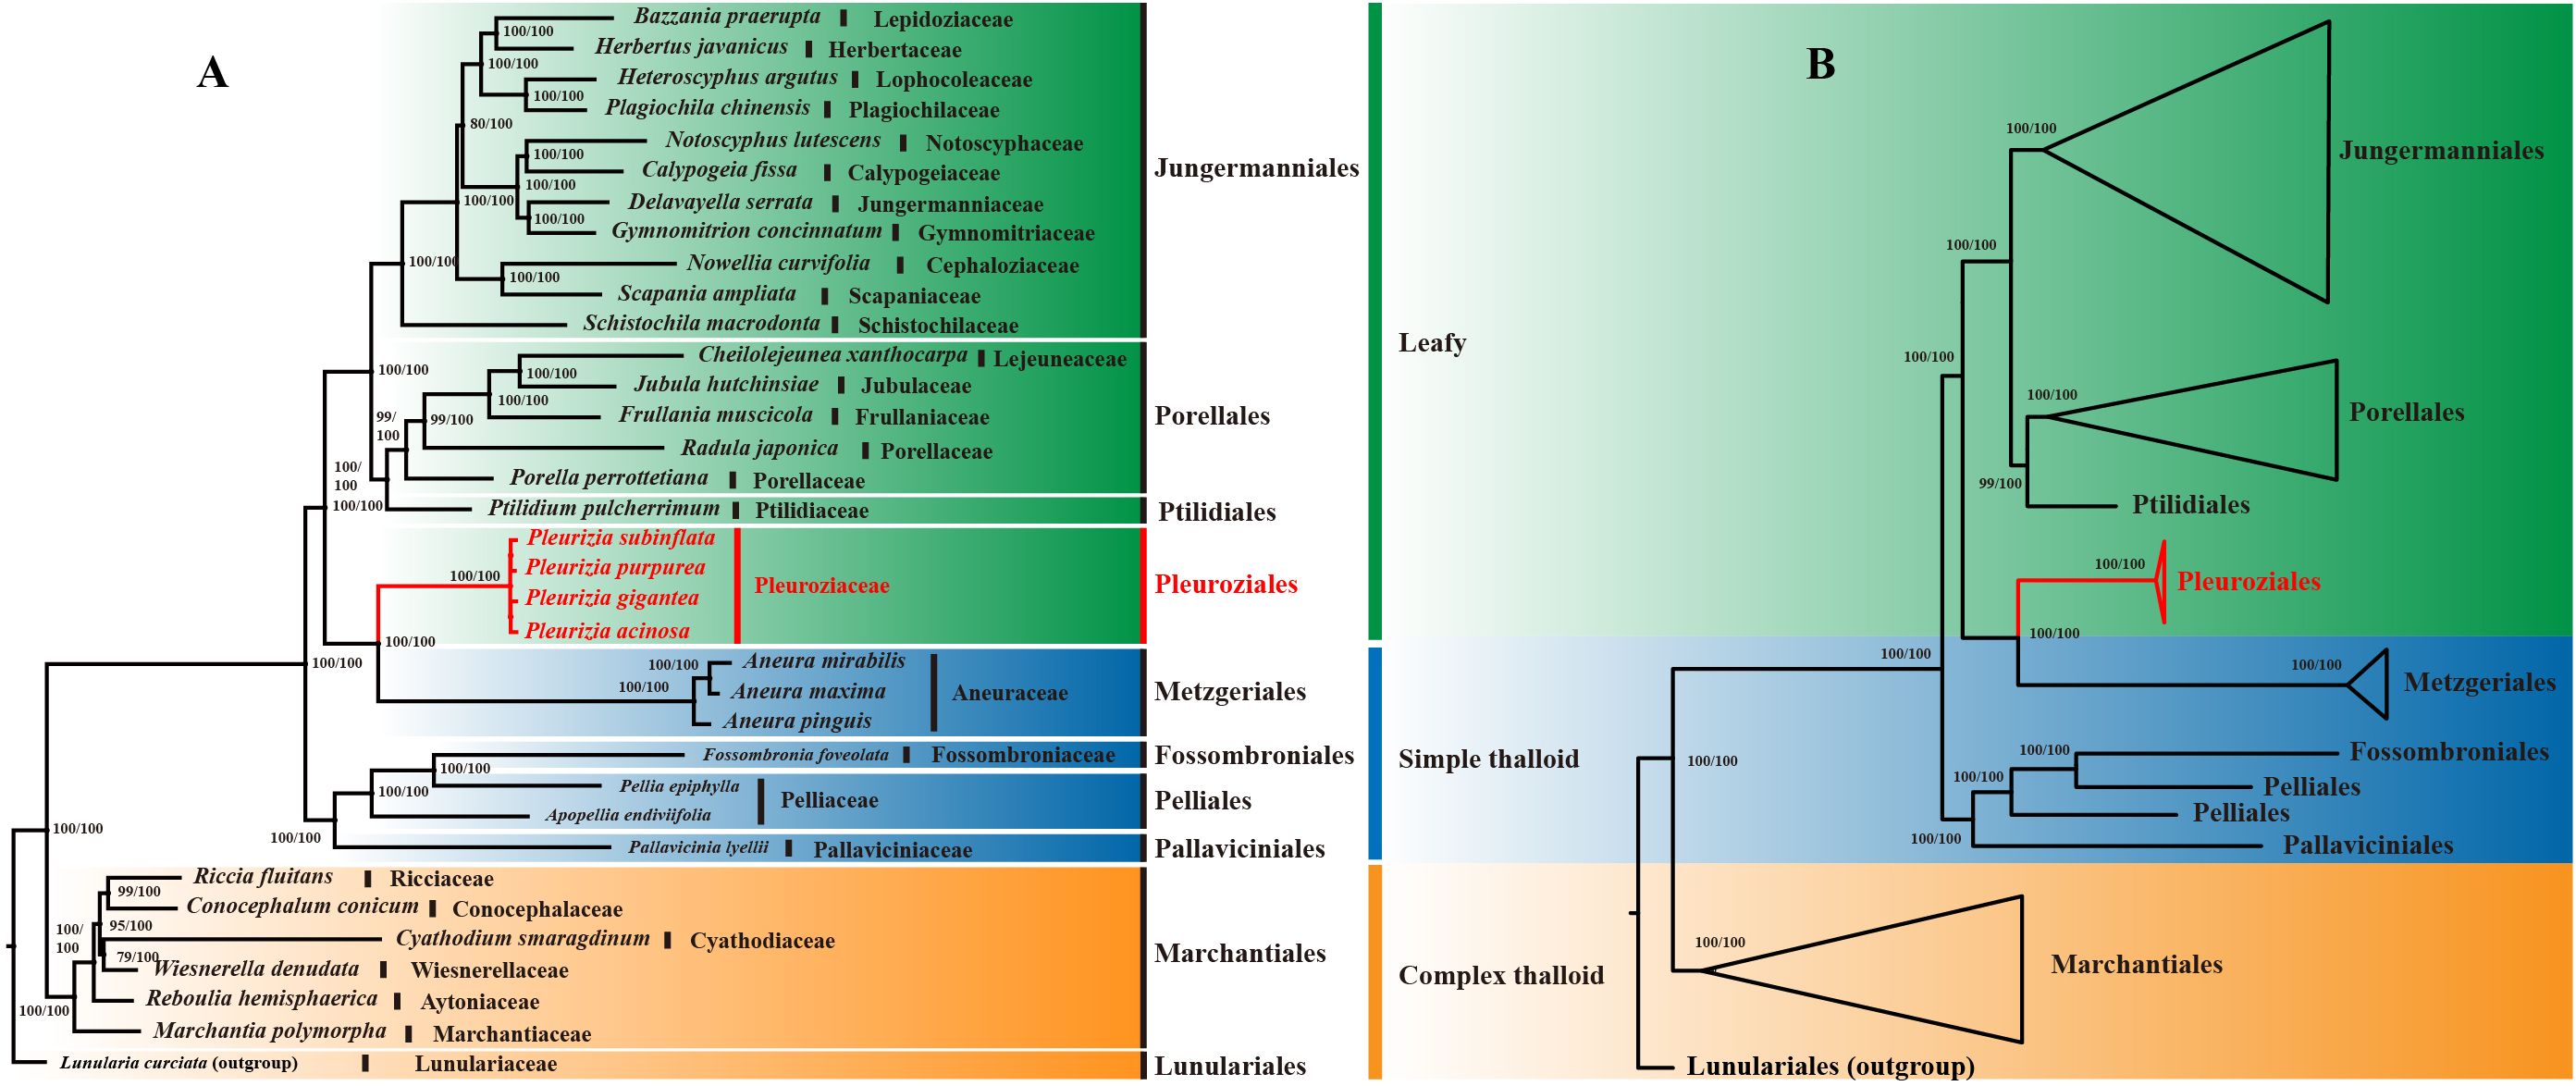
Figure 10. Topological comparison and Consensus phylogenetic trees for 35 Liverwort species constructed using ML and BI methods. (A) Topological comparison trees. (B) Order-level phylogenetic tree. The BS and PP values are annotated at each node to indicate statistical confidence. The red font highlights the order Pleuroziales.
4 Discussion
4.1 Chloroplast genome features and genome variations
The genus Pleurozia represents a pivotal lineage in the evolutionary transition from thalloid to leafy liverworts, offering significant insights into the liverwort phylogeny (He-Nygrén et al., 2006). In this study, we present three complete chloroplast genomes from Pleurozia species, along with the first comparative genomic analysis of this genus. The findings reveal a conserved quadripartite chloroplast genome architecture, consisting of one SSC region, one LSC region, and two IR regions (Figure 2), a typical organization found in most green plants, including bryophytes (Dong et al., 2021; Xiang et al., 2022). The chloroplast genome lengths of the four Pleurozia species range from 118,116 to 118,432 bp, aligning with the genome sizes observed in other Marchantiophyta species (Ślipiko et al., 2020; Dong et al., 2021; Sawicki et al., 2021), yet shorter than those of earlier-diverging hornworts (Yu et al., 2019; Xiang et al., 2022). Comparative analyses demonstrate a high degree of structural conservation and complete collinearity (Figure 4A), with minimal fluctuations at the IR boundaries (Figure 4C). Nucleotide diversity patterns indicate mutation rate hotspots primarily in the LSC and SSC regions, in contrast to the highly conserved IR regions. This pattern is consistent with observations across land plants (Hu et al., 2023; Xiao et al., 2023). The hypervariable regions are mainly located in non-coding and intronic sequences (Figure 4B), paralleling evolutionary patterns observed in angiosperms (Xiao and Ge, 2022; Yang et al., 2022). These highly variable loci exhibit more polymorphic sites than standard DNA barcodes, demonstrating their potential as phylogenetic markers for resolving complex taxonomic relationships (Ren et al., 2021; Hu et al., 2023).
4.2 Genome annotation and deletion of cysA and cysT genes
Our annotation of the three Pleurozia species identified 130–132 chloroplast genes per genome, including eight rRNA, 36 tRNA, and 86–88 PCGs (Table 2; Figure 2). Notably, P. acinosa uniquely lacks the cysA and cysT genes, which are typically present in this genus. This co-deletion also occurs in other members of Jungermanniopsida, such as Fossombronia cristula, Pallavinicia lyellii, and Metzgeria leptoneura (Wicke et al., 2011; Dong et al., 2021). The cysA and cysT genes exhibit a patchy distribution across bryophytes, being variably present in hornworts (Kugita, 2003), liverworts (Ohyama et al., 1986; Wicke et al., 2011; Dong et al., 2021), and mosses (Sadamitsu et al., 2021). This irregular pattern suggests that these genes have been independently lost multiple times during bryophyte evolution (Wicke et al., 2011). Typically located in the chloroplasts, cysA and cysT are integral components of the sulfate transport system, facilitating the uptake of sulfate—a crucial nutrient for plant growth and development—from the external environment into the cell and its distribution within the plant (Cackett et al., 2022). However, studies have shown that species lacking cysA and cysT can still transport cysteine via nuclear-encoded proteins (Kopriva et al., 2008). The evolutionary pattern of cysA and cysT loss remains unclear, and such deletions have not previously been reported in Pleurozia. This study presents the first documented case of cysA and cysT co-deletion in Pleurozia, contributing to a broader understanding of recurrent gene loss in bryophyte evolution (Dong et al., 2021).
4.3 Selection pressure
Ka/Ks ratios are widely used to assess evolutionary pressures on PCGs, enabling the differentiation between purifying selection, neutral drift, and positive selection (Yang and Bielawski, 2000; Raman et al., 2022). Non-synonymous substitutions (Ka) result in amino acid changes that can affect protein structure and function, potentially contributing to adaptive evolution. In contrast, synonymous substitutions (Ks) do not alter the amino acid sequence and are generally considered selectively neutral, thereby serving as a baseline for estimating mutation rates (Hurst, 2002). A Ka/Ks ratio < 1 suggests purifying selection, reflecting the preferential elimination of deleterious non-synonymous mutations. Conversely, a Ka/Ks > 1 indicates positive selection, signifying the preferential retention of advantageous mutations that promote adaptive genetic changes and accelerate gene evolution (Navarro and Barton, 2003). In Pleurozia, the ycf66 and ndhD genes exhibit Ka/Ks ratios greater than 1, suggesting that they are subject to positive selection, which may drive adaptive changes in these loci. In contrast, most chloroplast genes display Ka/Ks ratios below 1, indicating they are under purifying selection that acts to preserve their functional integrity. This pattern aligns with the general evolutionary conservation of chloroplast genomes in angiosperms, as exemplified by Epimedium (Wang et al., 2023).
4.4 Codon usage bias
Plants generally exhibit a high GC content. In nuclear coding regions, monocots tend to prefer codons ending in C or G, whereas dicots display a higher frequency of codons ending in U or A (Parvathy et al., 2022). In contrast, chloroplast and mitochondrial genomes typically show a preference for codons ending in U or A. This codon usage bias has been observed in studies of chloroplast genomes across various plant species, such as Oryza (Chakraborty et al., 2020) and Elaeagnus (Li et al., 2023). In bryophytes, including Pleurozia, the chloroplast genomes generally exhibit lower GC content compared to those of most angiosperms (Yu et al., 2019). There is a clear preference for U/A-terminated codons in the chloroplast genome of Pleurozia. Comparative analyses of CUB across the Pleurozia chloroplast genomes (Figures 6–9) revealed consistent patterns among the four species. ENC-GC3s plots displayed gene distributions both near and far from the expected curve, reflecting that codon usage in Pleurozia is shaped by a combination of mutational pressures and natural selection. The similar pattern was previously reported in the mitochondrial genome of P. purpurea (Wang et al., 2010). PR2 plots revealed a preference for T and C at the third codon positions, likely reflecting adaptive fine-tuning of translational efficiency superimposed on inherent mutational tendencies (Quax et al., 2015). This dual evolutionary mechanism allows for limited codon adaptation while maintaining genomic stability (Parvathy et al., 2022). Furthermore, neutral plot analyses suggest that natural selection exerts a stronger influence than mutation in determining codon usage patterns in Pleurozia. This trend mirrors observations in most angiosperms, where CUB is influenced by both natural selection and mutational pressure, with natural selection playing the dominant role (Yang et al., 2023).
4.5 Phylogenetic analysis
As the earliest diverging lineages of land plants, liverworts, mosses, and hornworts occupy a pivotal position in plant phylogeny, providing key insights into the evolutionary transition from aquatic to terrestrial environments (Wang et al., 2022). In this study, the phylogenetic tree (Figure 10) comprises major orders representing complex thalloid, simple thalloid, and leafy liverworts. Pleuroziales, a monotypic order containing only the genus Pleurozia, forms a distinct monophyletic lineage. It is resolved as the sister group to Metzgeriales, a representative of simple thalloid liverworts. Together, these two lineages cluster with the leafy liverworts. Although Pleuroziales exhibits a leafy morphology, its close phylogenetic affinity with Metzgeriales suggests a stronger evolutionary relationship with simple thalloid liverworts. This relationship is consistent with their shared characteristic of possessing a two-sided apical cell (Thiers, 1993).
The phylogeny also indicates that simple and complex thalloid liverworts belong to separate clades, with simple thalloid group showing closer affinity to leafy liverworts. Notably, the simple thalloid liverworts are divided into two groups: one forms a monophyletic clade, while Metzgeriales alone clusters sister to the leafy liverworts. Among the leafy liverworts, all orders except Pleuroziales comprise a distinct clade. This topology aligns with previous studies (Dong et al., 2021; Xiang et al., 2022; Li et al., 2024) and strongly supports Pleurozia’s transitional position between simple thalloid and leafy liverworts, confirming earlier hypotheses (Forrest et al., 2006; Dong et al., 2021; Shen et al., 2025). These findings contribute to both the taxonomic and genomic knowledge of Pleurozia and enhance our understanding of liverwort evolution.
5 Conclusions
In our study, we sequenced the complete chloroplast genomes of three Pleurozia species and provided comprehensive insights into their structural and evolutionary dynamics. The genomes exhibit a conserved quadripartite structure with minimal interspecific variation in overall size, gene content, and boundary architecture. While coding regions were highly conserved, non-coding sequences and introns displayed notable variability, particularly within three hypervariable regions, highlighting their potential as informative markers for species delimitation and phylogenetic analysis. The lower variation in IR regions compared to single-copy regions supports their proposed stabilizing role in chloroplast genome evolution. Codon usage bias (CUB) analyses revealed that natural selection plays a predominant role over mutation pressure in shaping codon preferences across all Pleurozia species, with a pronounced preference for U/A-ended codons. The combined effects of natural selection and mutation pressure contribute to maintaining moderate CUB, balancing translational efficiency with genomic stability. Notably, purifying selection was predominant across protein-coding regions, while only ycf66 and ndhD exhibited signs of positive selection, underscoring the strong functional constraints governing chloroplast genome evolution. Phylogenetic reconstruction robustly supports Pleurozia as a monophyletic clade, placing it in an intermediate evolutionary position between thalloid and leafy liverworts. This finding aligns with morphological evidence and previous phylogenetic hypotheses, highlighting the transitional role of Pleurozia in liverwort diversification.
Data availability statement
The datasets presented in this study can be found in online repositories. The names of the repository/repositories and accession number(s) can be found below: https://www.ncbi.nlm.nih.gov/genbank/, OR168937 https://www.ncbi.nlm.nih.gov/genbank/, OR168938 https://www.ncbi.nlm.nih.gov/genbank/, OR168939.
Author contributions
SB: Conceptualization, Methodology, Formal Analysis, Visualization, Writing – original draft. QL: Conceptualization, Methodology, Supervision, Writing – original draft, Writing – review & editing. JH: Writing – review & editing, Methodology. XC: Writing – review & editing, Data curation. DG: Writing – review & editing. LZ: Project administration, Supervision, Writing – review & editing.
Funding
The author(s) declare that financial support was received for the research and/or publication of this article. This study was funded by the National Natural Science Foundation of China (Grant Nos. 32160315, 31760054) and the Start-up Fund of Hainan University (Grant No. KYQD(ZR)-22105).
Acknowledgments
We are grateful to the Wuzhishan Branch of the Hainan Tropical Rainforest National Park Administration for their assistance during fieldwork. We would like to express our gratitude to Professor You-Liang Xiang for his valuable guidance on the phylogenetic analysis. We also sincerely thank the anonymous reviewers for their constructive comments and suggestions, which greatly improved the quality of this manuscript.
Conflict of interest
The authors declare that the research was conducted in the absence of any commercial or financial relationships that could be construed as a potential conflict of interest.
Generative AI statement
The author(s) declare that no Generative AI was used in the creation of this manuscript.
Publisher’s note
All claims expressed in this article are solely those of the authors and do not necessarily represent those of their affiliated organizations, or those of the publisher, the editors and the reviewers. Any product that may be evaluated in this article, or claim that may be made by its manufacturer, is not guaranteed or endorsed by the publisher.
Supplementary material
The Supplementary Material for this article can be found online at: https://www.frontiersin.org/articles/10.3389/fpls.2025.1599291/full#supplementary-material
Abbreviations
RSCU, Relative synonymous codon usage; ENC, Effective number of codons; LSC, Large single-copy; SSC, Small single-copy; IR, Inverted repeat; CDS, Coding sequences; BI, Bayesian inference; ML, Maximum likelihood; CUB, Codon usage bias; PCGs, Protein-coding genes.
References
Bączkiewicz, A., Szczecińska, M., Sawicki, J., Stebel, A., and Buczkowska, K. (2017). DNA barcoding, ecology and geography of the cryptic species of Aneura pinguis and their relationships with Aneura maxima and Aneura mirabilis (Metzgeriales, Marchantiophyta). PLoS One 12, e0188837. doi: 10.1371/journal.pone.0188837
Bai, Z.-K. and Li, D.-K. (1998). A study on Pleuroziaceae (Hepaticae) of China. Acta Botanica Yunnanica 20, 174–178.
Bowman, J. L. (2013). Walkabout on the long branches of plant evolution. Curr. Opin. Plant Biol. 16, 70–77. doi: 10.1016/j.pbi.2012.10.001
Cackett, L., Luginbuehl, L. H., Schreier, T. B., Lopez-Juez, E., and Hibberd, J. M. (2022). Chloroplast development in green plant tissues: the interplay between light, hormone, and transcriptional regulation. New Phytol. 233, 2000–2016. doi: 10.1111/nph.17839
Chakraborty, S., Yengkhom, S., and Uddin, A. (2020). Analysis of codon usage bias of chloroplast genes in Oryza species: Codon usage of chloroplast genes in Oryza species. Planta 252, 67. doi: 10.1007/s00425-020-03470-7
Chan, P. P., Lin, B. Y., Mak, A. J., and Lowe, T. M. (2021). tRNAscan-SE 2.0: improved detection and functional classification of transfer RNA genes. Nucleic Acids Res. 49, 9077–9096. doi: 10.1093/nar/gkab688
Chen, D.-J., Landis, J. B., Wang, H.-X., Sun, Q.-H., Wang, Q., and Wang, H.-F. (2022). Plastome structure, phylogenomic analyses and molecular dating of Arecaceae. Front. Plant Sci. 13. doi: 10.3389/fpls.2022.960588
Clarke, J. T., Warnock, R. C. M., and Donoghue, P. C. J. (2011). Establishing a time-scale for plant evolution. New Phytol. 192, 266–301. doi: 10.1111/j.1469-8137.2011.03794.x
Cox, C. J., Li, B., Foster, P. G., Embley, T. M., and Civáň, P. (2014). Conflicting phylogenies for early land plants are caused by composition biases among synonymous substitutions. Syst. Biol. 63, 272–279. doi: 10.1093/sysbio/syt109
Crandall-Stotler, B. (1976). The apical cell and early development of Pleurozia purpurea lindb. Lindbergia 3, 197–208.
Darling, A. C. E., Mau, B., Blattner, F. R., and Perna, N. T. (2004). Mauve: multiple alignment of conserved genomic sequence with rearrangements. Genome Res. 14, 1394–1403. doi: 10.1101/gr.2289704
Darling, A. E., Mau, B., and Perna, N. T. (2010). progressiveMauve: multiple genome alignment with gene gain, loss and rearrangement. PLoS One 5, e11147. doi: 10.1371/journal.pone.0011147
Dodsworth, S. (2015). Genome skimming for next-generation biodiversity analysis. Trends Plant Sci. 20, 525–527. doi: 10.1016/j.tplants.2015.06.012
Dong, S., Zhang, S., Zhang, L., Wu, H., Goffinet, B., and Liu, Y. (2021). Plastid genomes and phylogenomics of liverworts (Marchantiophyta): Conserved genome structure but highest relative plastid substitution rate in land plants. Mol. Phylogenet. Evol. 161, 107171. doi: 10.1016/j.ympev.2021.107171
Forrest, L. L., Davis, E. C., Long, D. G., Crandall-Stotler, B. J., Clark, A., and Hollingsworth, M. L. (2006). Unraveling the evolutionary history of the liverworts (Marchantiophyta): multiple taxa, genomes and analyses. Bryologist 109, 303–334. doi: 10.1639/0007-2745(2006)109[303:UTEHOT]2.0.CO;2
Frazer, K. A., Pachter, L., Poliakov, A., Rubin, E. M., and Dubchak, I. (2004). VISTA: computational tools for comparative genomics. Nucleic Acids Res. 32, W273–W279. doi: 10.1093/nar/gkh458
He, B., Dong, H., Jiang, C., Cao, F., Tao, S., and Xu, L. (2016). Analysis of codon usage patterns in Ginkgo biloba reveals codon usage tendency from A/U-ending to G/C-ending. Sci. Rep. 6, 35927. doi: 10.1038/srep35927
Hebert, P. D. N., Cywinska, A., Ball, S. L., and deWaard, J. R. (2003). Biological identifications through DNA barcodes. Proc. R. Soc. Lond. B 270, 313–321. doi: 10.1098/rspb.2002.2218
He-Nygrén, X., Juslén, A., Ahonen, I., Glenny, D., and Piippo, S. (2006). Illuminating the evolutionary history of liverworts (Marchantiophyta)—towards a natural classification. Cladistics 22, 1–31. doi: 10.1111/j.1096-0031.2006.00089.x
Hollingsworth, M. L., Clark, A. A., Forrest, L. L., Richardson, J., Pennington, R. T., Long, D. G., et al. (2009). Selecting barcoding loci for plants: evaluation of seven candidate loci with species-level sampling in three divergent groups of land plants. Mol. Ecol. Resour. 9, 439–457. doi: 10.1111/j.1755-0998.2008.02439.x
Hu, H., Wang, Q., Hao, G., Zhou, R., Luo, D., Cao, K., et al. (2023). Insights into the phylogenetic relationships and species boundaries of the Myricaria squamosa complex (Tamaricaceae) based on the complete chloroplast genome. PeerJ 11, e16642. doi: 10.7717/peerj.16642
Huelsenbeck, J. P., Ronquist, F., Nielsen, R., and Bollback, J. P. (2001). Bayesian inference of phylogeny and its impact on evolutionary biology. Science 294, 2310–2314. doi: 10.1126/science.1065889
Hurst, L. D. (2002). The Ka/Ks ratio: diagnosing the form of sequence evolution. Trends Genet. 18, 486. doi: 10.1016/s0168-9525(02)02722-1
Kalyaanamoorthy, S., Minh, B. Q., Wong, T. K. F., von Haeseler, A., and Jermiin, L. S. (2017). ModelFinder: fast model selection for accurate phylogenetic estimates. Nat. Methods 14, 587–589. doi: 10.1038/nmeth.4285
Kane, N., Sveinsson, S., Dempewolf, H., Yang, J. Y., Zhang, D., Engels, J. M. M., et al. (2012). Ultra-barcoding in cacao (Theobroma spp.; Malvaceae) using whole chloroplast genomes and nuclear ribosomal DNA. Am. J. Bot. 99, 320–329. doi: 10.3732/ajb.1100570
Katoh, K., Misawa, K., Kuma, K., and Miyata, T. (2002). MAFFT: a novel method for rapid multiple sequence alignment based on fast Fourier transform. Nucleic Acids Res. 30, 3059–3066. doi: 10.1093/nar/gkf436
Katoh, K. and Standley, D. M. (2013). MAFFT multiple sequence alignment software version 7: improvements in performance and usability. Mol. Biol. Evol. 30, 772–780. doi: 10.1093/molbev/mst010
Kopriva, S., Patron, N. J., Keeling, P., and Leustek, T. (2008). “Phylogenetic analysis of sulfate assimilation and cysteine biosynthesis in phototrophic organisms,” in Sulfur Metabolism in Phototrophic Organisms, eds. Hell, R., Dahl, C., Knaff, D., and Leustek, T. (Springer Netherlands, Dordrecht), 31–58. doi: 10.1007/978-1-4020-6863-8_3
Krawczyk, K., Nobis, M., Myszczyński, K., Klichowska, E., and Sawicki, J. (2018). Plastid super-barcodes as a tool for species discrimination in feather grasses (Poaceae: Stipa). Sci. Rep. 8, 1924. doi: 10.1038/s41598-018-20399-w
Krawczyk, K., Szczecińska, M., and Sawicki, J. (2014). Evaluation of 11 single-locus and seven multilocus DNA barcodes in Lamium L. (Lamiaceae). Mol. Ecol. Resour. 14, 272–285. doi: 10.1111/1755-0998.12175
Kugita, M., Kaneko, A., Yamamoto, Y., Takeya, Y., Matsumoto, T., and Yoshinaga, K. (2003). The complete nucleotide sequence of the hornwort (Anthoceros formosae) chloroplast genome: insight into the earliest land plants. Nucleic Acids Res. 31, 716–721. doi: 10.1093/nar/gkg155
Lagesen, K., Hallin, P., Rødland, E. A., Stærfeldt, H.-H., Rognes, T., and Ussery, D. W. (2007). RNAmmer: consistent and rapid annotation of ribosomal RNA genes. Nucleic Acids Res. 35, 3100–3108. doi: 10.1093/nar/gkm160
Langmead, B. and Salzberg, S. L. (2012). Fast gapped-read alignment with Bowtie 2. Nat. Methods 9, 357–359. doi: 10.1038/nmeth.1923
Li, H., Guo, Q., Xu, L., Gao, H., Liu, L., and Zhou, X. (2023). CPJSdraw: analysis and visualization of junction sites of chloroplast genomes. PeerJ 11, e15326. doi: 10.7717/peerj.15326
Li, Y., Luo, L., Liu, Y., He, Q., Yu, N., Gaowa, N., et al. (2024). The bryophyte phylogeny group: A revised familial classification system based on plastid phylogenomic data. J. Syst. Evol. 62, 577–588. doi: 10.1111/jse.13063
Li, X., Yang, Y., Henry, R. J., Rossetto, M., Wang, Y., and Chen, S. (2015). Plant DNA barcoding: from gene to genome. Biol. Rev. 90, 157–166. doi: 10.1111/brv.12104
Marçais, G., Delcher, A. L., Phillippy, A. M., Coston, R., Salzberg, S. L., and Zimin, A. (2018). MUMmer4: A fast and versatile genome alignment system. PLoS Comput. Biol. 14, e1005944. doi: 10.1371/journal.pcbi.1005944
Minh, B. Q., Nguyen, M. A. T., and von Haeseler, A. (2013). Ultrafast approximation for phylogenetic bootstrap. Mol. Biol. Evol. 30, 1188–1195. doi: 10.1093/molbev/mst024
Minh, B. Q., Schmidt, H. A., Chernomor, O., Schrempf, D., Woodhams, M. D., von Haeseler, A., et al. (2020). IQ-TREE 2: new models and efficient methods for phylogenetic inference in the genomic era. Mol. Biol. Evol. 37, 1530–1534. doi: 10.1093/molbev/msaa015
Myszczyński, K., Bączkiewicz, A., Buczkowska, K., Ślipiko, M., Szczecińska, M., and Sawicki, J. (2017). The extraordinary variation of the organellar genomes of the Aneura pinguis revealed advanced cryptic speciation of the early land plants. Sci. Rep. 7, 9804. doi: 10.1038/s41598-017-10434-7
Navarro, A. and Barton, N. H. (2003). Chromosomal speciation and molecular divergence–accelerated evolution in rearranged chromosomes. Science 300, 321–324. doi: 10.1126/science.1080600
Nguyen, L.-T., Schmidt, H. A., von Haeseler, A., and Minh, B. Q. (2015). IQ-TREE: A fast and effective stochastic algorithm for estimating maximum-likelihood phylogenies. Mol. Biol. Evol. 32, 268–274. doi: 10.1093/molbev/msu300
Nylander, J. A. A. (2004). MrModeltest v2. Program distributed by the author. Available online at: https://github.com/nylander/MrModeltest2 (Accessed November 20, 2023).
Ohyama, K., Fukuzawa, H., Kohchi, T., Shirai, H., Sano, T., Sano, S., et al. (1986). Chloroplast gene organization deduced from complete sequence of liverwort Marchantia polymorpha chloroplast DNA. Nature 322, 572–574. doi: 10.1038/322572a0
Parvathy, S. T., Udayasuriyan, V., and Bhadana, V. (2022). Codon usage bias. Mol. Biol. Rep. 49, 539–565. doi: 10.1007/s11033-021-06749-4
Posada, D. (2003). Using MODELTEST and PAUP * to select a model of nucleotide substitution. Curr. Protoc. Bioinf. 00, 6.5.1–6.5.14. doi: 10.1002/0471250953.bi0605s00
Prjibelski, A., Antipov, D., Meleshko, D., Lapidus, A., and Korobeynikov, A. (2020). Using SPAdes de novo assembler. Curr. Protoc. Bioinf. 70, e102. doi: 10.1002/cpbi.102
Qiu, Y.-L., Li, L., Wang, B., Chen, Z., Knoop, V., Groth-Malonek, M., et al. (2006). The deepest divergences in land plants inferred from phylogenomic evidence. Proc. Natl. Acad. Sci. U.S.A. 103, 15511–15516. doi: 10.1073/pnas.0603335103
Qu, X.-J., Moore, M. J., Li, D.-Z., and Yi, T.-S. (2019). PGA: a software package for rapid, accurate, and flexible batch annotation of plastomes. Plant Methods 15, 50. doi: 10.1186/s13007-019-0435-7
Quax, T. E., Claassens, N. J., Söll, D., and van der Oost, J. (2015). Codon bias as a means to fine-tune gene expression. Mol. Cell. 59, 149–161. doi: 10.1016/j.molcel.2015.05.035
Raman, G., Nam, G.-H., and Park, S. (2022). Extensive reorganization of the chloroplast genome of Corydalis platycarpa: A comparative analysis of their organization and evolution with other Corydalis plastomes. Front. Plant Sci. 13. doi: 10.3389/fpls.2022.1043740
Rambaut, A., Drummond, A. J., Xie, D., Baele, G., and Suchard, M. A. (2018). Posterior summarisation in Bayesian phylogenetics using Tracer 1.7. Syst. Biol. 67, 901–904. doi: 10.1093/sysbio/syy032
Ren, W., Guo, D., Xing, G., Yang, C., Zhang, Y., Yang, J., et al. (2021). Complete chloroplast genome sequence and comparative and phylogenetic analyses of the cultivated cyperus esculentus. Diversity 13, 405. doi: 10.3390/d13090405
Ronquist, F., Teslenko, M., van der Mark, P., Ayres, D. L., Darling, A., Höhna, S., et al. (2012). MrBayes 3.2: efficient bayesian phylogenetic inference and model choice across a large model space. Syst. Biol. 61, 539–542. doi: 10.1093/sysbio/sys029
Rozas, J., Ferrer-Mata, A., Sánchez-DelBarrio, J. C., Guirao-Rico, S., Librado, P., Ramos-Onsins, S. E., et al. (2017). DnaSP 6: DNA sequence polymorphism analysis of large data sets. Mol. Biol. Evol. 34, 3299–3302. doi: 10.1093/molbev/msx248
Rubinstein, C. V., Gerrienne, P., de la Puente, G. S., Astini, R. A., and Steemans, P. (2010). Early Middle Ordovician evidence for land plants in Argentina (eastern Gondwana). New Phytol. 188, 365–369. doi: 10.1111/j.1469-8137.2010.03433.x
Ruby, J. G., Bellare, P., and DeRisi, J. L. (2013). PRICE: software for the targeted assembly of components of (Meta) genomic sequence data. G3 Genes|Genomes|Genetics 3, 865–880. doi: 10.1534/g3.113.005967
Sadamitsu, A., Inoue, Y., Sakakibara, K., Tsubota, H., Yamaguchi, T., Deguchi, H., et al. (2021). The complete plastid genome sequence of the enigmatic moss, Takakia lepidozioides (Takakiopsida, Bryophyta): evolutionary perspectives on the largest collection of genes in mosses and the intensive RNA editing. Plant Mol. Biol. 107, 431–449. doi: 10.1007/s11103-021-01214-z
Sawicki, J., Krawczyk, K., Ślipiko, M., and Szczecińska, M. (2021). Sequencing of organellar genomes of Nowellia curvifolia (Cephaloziaceae Jungermanniales) revealed the smallest plastome with complete gene set and high intraspecific variation suggesting cryptic speciation. Diversity 13, 81. doi: 10.3390/d13020081
Sharp, P. M. and Li, W.-H. (1986). Codon usage in regulatory genes in Escherichia coli does not reflect selection for ‘rare’ codons. Nucleic Acids Res. 14, 7737–7749. doi: 10.1093/nar/14.19.7737
Shen, C., Li, H., Shu, L., Huang, W.-Z., and Zhu, R.-L. (2025). Ancient large-scale gene duplications and diversification in bryophytes illuminate the plant terrestrialization. New Phytol. 245, 2292–2308. doi: 10.1111/nph.20221
Ślipiko, M., Myszczyński, K., Buczkowska, K., Bączkiewicz, A., Szczecińska, M., and Sawicki, J. (2020). Molecular delimitation of European leafy liverworts of the genus Calypogeia based on plastid super-barcodes. BMC Plant Biol. 20, 243. doi: 10.1186/s12870-020-02435-y
Söderström, L., Hagborg, A., von Konrat, M., Bartholomew-Began, S., Bell, D., Briscoe, L., et al. (2016). World checklist of hornworts and liverworts. PhytoKeys 59, 1–828. doi: 10.3897/phytokeys.59.6261
Song, Z.-M., Liu, B.-X., Fan, M.-Y., and Yu, Y. (2024). Complete chloroplast genomes of Pallavicinia longispina stephani and Pleurozia subinflata (austin) austin. Bangladesh J. Bot. 53, 109–113. doi: 10.3329/bjb.v53i1.72249
Sueoka, N. (1988). Directional mutation pressure and neutral molecular evolution. Proc. Natl. Acad. Sci. U.S.A. 85, 2653–2657. doi: 10.1073/pnas.85.8.2653
Sueoka, N. (1995). Intrastrand parity rules of DNA base composition and usage biases of synonymous codons. J. Mol. Evol. 40, 318–325. doi: 10.1007/BF00163236
Sueoka, N. (1999). Translation-coupled violation of Parity Rule 2 in human genes is not the cause of heterogeneity of the DNA G+C content of third codon position. Gene 238, 53–58. doi: 10.1016/S0378-1119(99)00320-0
Szczecińska, M. and Sawicki, J. (2015). Genomic resources of three Pulsatilla species reveal evolutionary hotspots, species-specific sites and variable plastid structure in the family Ranunculaceae. Int. J. Mol. Sci. 16, 22258–22279. doi: 10.3390/ijms160922258
Thiers, B. M. (1993). A monograph of Pleurozia (Hepaticae; Pleuroziaceae). Bryologist 96, 517–554. doi: 10.2307/3243984
Wang, W.-C., Chen, S.-Y., and Zhang, X.-Z. (2016). Chloroplast genome evolution in Actinidiaceae: clpP loss, heterogenous divergence and phylogenomic practice. PLoS One 11, e0162324. doi: 10.1371/journal.pone.0162324
Wang, Y., Jiang, D., Guo, K., Zhao, L., Meng, F., Xiao, J., et al. (2023). Comparative analysis of codon usage patterns in chloroplast genomes of ten Epimedium species. BMC Genomic Data 24, 3. doi: 10.1186/s12863-023-01104-x
Wang, B., Liu, J., Jin, L., Feng, X., and Chen, J. (2010). Complex mutation and weak selection together determined the codon usage bias in bryophyte mitochondrial genomes. J. Integr. Plant Biol. 52, 1100–1108. doi: 10.1111/j.1744-7909.2010.00998.x
Wang, B., Xue, J., Li, L., Liu, Y., and Qiu, Y.-L. (2009). The complete mitochondrial genome sequence of the liverwort Pleurozia purpurea reveals extremely conservative mitochondrial genome evolution in liverworts. Curr. Genet. 55, 601–609. doi: 10.1007/s00294-009-0273-7
Wang, Q.-H., Zhang, J., Liu, Y., Jia, Y., Jiao, Y.-N., Xu, B., et al. (2022). Diversity, phylogeny, and adaptation of bryophytes: insights from genomic and transcriptomic data. J. Exp. Bot. 73, 4306–4322. doi: 10.1093/jxb/erac127
Wellman, C. H., Osterloff, P. L., and Mohiuddin, U. (2003). Fragments of the earliest land plants. Nature 425, 282–285. doi: 10.1038/nature01884
Wicke, S., Schneeweiss, G. M., dePamphilis, C. W., Müller, K. F., and Quandt, D. (2011). The evolution of the plastid chromosome in land plants: gene content, gene order, gene function. Plant Mol. Biol. 76, 273–297. doi: 10.1007/s11103-011-9762-4
Wickham, H. (2016). ggplot2: elegant graphics for data analysis. Available online at: https://ggplot2.tidyverse.org (Accessed January 10, 2024).
Wilgenbusch, J. C. and Swofford, D. (2003). Inferring evolutionary trees with PAUP *. Curr. Protoc. Bioinf. 6.4.1–6.4.28. doi: 10.1002/0471250953.bi0604s00
Wright, F. (1990). The ‘effective number of codons’ used in a gene. Gene 87, 23–29. doi: 10.1016/0378-1119(90)90491-9
Xiang, Y., Jin, X., Shen, C., Cheng, X., Shu, L., and Zhu, R. (2022). New insights into the phylogeny of the complex thalloid liverworts (Marchantiopsida) based on chloroplast genomes. Cladistics 38, 649–662. doi: 10.1111/cla.12513
Xiao, T.-W. and Ge, X.-J. (2022). Plastome structure, phylogenomics, and divergence times of tribe Cinnamomeae (Lauraceae). BMC Genomics 23, 642. doi: 10.1186/s12864-022-08855-4
Xiao, Y., Wang, X., He, Z., Lv, Y., Zhang, C., and Hu, X. (2023). Assessing the phylogenetic relationship among varieties of Toona ciliata (Meliaceae) in sympatry with chloroplast genomes. Ecol. Evol. 13, e10828. doi: 10.1002/ece3.10828
Xu, S. (2022). ggstar: multiple geometric shape point layer for “ggplot2”. Available online at: https://CRAN.R-project.org/package=ggstar (Accessed January 12, 2024).
Yang, Z. and Bielawski, J. P. (2000). Statistical methods for detecting molecular adaptation. Trends Ecol. Evol. 15, 496–503. doi: 10.1016/S0169-5347(00)01994-7
Yang, J., Hu, G., and Hu, G. (2022). Comparative genomics and phylogenetic relationships of two endemic and endangered species (Handeliodendron bodinieri and Eurycorymbus cavaleriei) of two monotypic genera within Sapindales. BMC Genomics 23, 27. doi: 10.1186/s12864-021-08259-w
Yang, Z. and Nielsen, R. (2000). Estimating synonymous and nonsynonymous substitution rates under realistic evolutionary models. Mol. Biol. Evol. 17, 32–43. doi: 10.1093/oxfordjournals.molbev.a026236
Yang, Q., Xin, C., Xiao, Q.-S., Lin, Y.-T., Li, L., and Zhao, J.-L. (2023). Codon usage bias in chloroplast genes implicate adaptive evolution of four ginger species. Front. Plant Sci. 14. doi: 10.3389/fpls.2023.1304264
Yu, G. (2023). aplot: decorate a “ggplot” with associated information. Available online at: https://CRAN.R-project.org/package=aplot (Accessed January 12, 2024).
Yu, Y., Liu, H., Yang, J., Ma, W., Pressel, S., Wu, Y., et al. (2019). Exploring the plastid genome disparity of liverworts. J. Syst. Evol. 57, 382–394. doi: 10.1111/jse.12515
Zerbino, D. R. and Birney, E. (2008). Velvet: Algorithms for de novo short read assembly using de Bruijn graphs. Genome Res. 18, 821–829. doi: 10.1101/gr.074492.107
Zhang, Z. (2022). KaKs_Calculator 3.0: calculating selective pressure on coding and non-coding sequences. Genomics Proteomics Bioinf. 20, 536–540. doi: 10.1016/j.gpb.2021.12.002
Zhang, Y.-J., Ma, P.-F., and Li, D.-Z. (2011). High-throughput sequencing of six bamboo chloroplast genomes: phylogenetic implications for temperate woody bamboos (Poaceae: Bambusoideae). PLoS One 6, e20596. doi: 10.1371/journal.pone.0020596
Keywords: Pleurozia, chloroplast genome, comparative genomics, codon usage bias, phylogeny
Citation: Bi S, Liu Q, Hao J-W, Cai X-Z, Gao D and Zhang L-N (2025) Complete chloroplast genomes of three Pleurozia species and comparative analyses with P. purpurea: codon usage bias and phylogeny. Front. Plant Sci. 16:1599291. doi: 10.3389/fpls.2025.1599291
Received: 24 March 2025; Accepted: 23 June 2025;
Published: 18 July 2025.
Edited by:
Purushothaman Natarajan, University of Maryland Eastern Shore, United StatesReviewed by:
Qing-Hua Wang, Chinese Academic of Science, ChinaSatyabrata Sahoo, Dhruba Chand Halder College, India
Copyright © 2025 Bi, Liu, Hao, Cai, Gao and Zhang. This is an open-access article distributed under the terms of the Creative Commons Attribution License (CC BY). The use, distribution or reproduction in other forums is permitted, provided the original author(s) and the copyright owner(s) are credited and that the original publication in this journal is cited, in accordance with accepted academic practice. No use, distribution or reproduction is permitted which does not comply with these terms.
*Correspondence: Li-Na Zhang, emhhbmdsaW5hQGhhaW5hbnUuZWR1LmNu
†These authors have contributed equally to this work