 Yihan Wang
 Peng Di
 Yingping Wang
- State Local Joint Engineering Research Center of Ginseng Breeding and Application, Jilin Agricultural University, Changchun, China
Panax ginseng C. A. Meyer (ginseng) is one of the most widely used traditional Chinese medicinal herbs, with its roots as the primary medicinal part garnering significant attention due to their therapeutic potential. The GRAS [GRI (Gibberellic Acid Insensitive), RGA (Repressor of GAI-3 mutant), and SCR (Scarecrow)] genes are a class of widely distributed plant-specific transcription factors that play crucial roles in various physiological processes including root formation, fruit development, hormone signaling, and stem cell maintenance. This study systematically identified 139 GRAS genes (PgGRAS) in the ginseng genome for the first time, analyzing their complexity and diversity through protein domain structure, phylogenetic relationships, gene structure, and cis-acting element prediction. Evolutionary analysis revealed that all PgGRAS members were divided into 14 evolutionary branches, including a novel species-specific subfamily PG28, with segmental duplication being the primary driver of family expansion. RNA-seq analysis uncovered tissue-specific expression patterns of the PgGRAS gene family. qRT-PCR validation demonstrated that PgGRAS48, a member of the SCL3 subfamily, was significantly highly expressed in the main root and upregulated upon GA treatment, suggesting its potential regulatory role in main root development. Therefore, this gene was selected for further investigation. Overexpression of PgGRAS48 significantly increased the main root length in Arabidopsis thaliana (A. thaliana), accompanied by elevated endogenous GA levels. Subcellular localization, molecular docking, Bimolecular Fluorescence Complementation (BIFC) and yeast two-hybrid (Y2H) experiments confirmed the interaction between PgGRAS48 (SCL3) and PgGRAS2 (DELLA) in the nucleus, revealing the molecular mechanism by which SCL3-DELLA regulates main root elongation through gibberellin (GA) biosynthesis or signaling pathways. This study elucidates the molecular network of the GRAS family in root development in ginseng, providing key targets for the targeted improvement of root architecture in medicinal plants.
1 Introduction
The GRAS gene family is a group of plant-specific transcription regulators, named after the first three identified members: GAI (gibberellic acid insensitive), RGA (repressor of GA1–3 mutant), and SCR (scarecrow) (Di Laurenzio et al., 1996; Peng et al., 1997; Silverstone et al., 1998). Members of this family are widely distributed across the plant kingdom, with typical GRAS proteins consisting of 400–770 amino acids and exhibiting distinct structural features (Waseem et al., 2022). The C-terminal region contains five highly conserved domains: LHRI, VHIID, LHRII, PFYRE, and SAW (Hakoshima, 2018). Studies have shown that VHIID, as the core element, assembles with the flanking LHR I/II regions into a composite structure. This structure, formed by approximately 100 amino acids with atypical 7-amino acid repeat units, mediates DNA binding and protein-protein interactions (Hakoshima, 2018). The C-terminal LHR I region contains a putative nuclear localization signal capable of recognizing SV40-type nuclear localization sequences (Bolle, 2004; Raikhel, 1992). The PFYRE motif is less conserved than VHIID, but the potential phosphorylation of its tyrosine residues suggests its involvement in post-translational regulation (Pysh et al., 1999). Although the exact function of the SAW motif remains unclear, the high conservation of its amino acid residues during evolution indicates its potential role in maintaining protein structural stability or regulating functional activity (Bolle, 2004; Sun et al., 2011). In the N-terminal region, GRAS proteins exhibit significant structural plasticity: this region is highly variable and intrinsically disordered regions (IDRs), with conformational flexibility enabling dynamic binding to different ligands (Sun et al., 2012). When interacting with target proteins, these disordered regions can form specific molecular recognition interfaces, thereby facilitating functional differentiation in processes such as gibberellin (GA) signaling, photomorphogenesis, and meristem regulation (Waseem et al., 2022).
In model plants such as A. thaliana and Oryza sativa (O. sativa), 33 and 60 GRAS family members have been identified, respectively. These GRAS members are classified into 13 subfamilies: LISCL, LAS, SCL4/7, DLT, SCL3, DELLA, SCR, HAM, SHR, PAT1, Os43, Os4, and Os3 (Tian et al., 2004). Due to significant differences in amino acid sequences among subfamilies, it is speculated that each subfamily may perform unique functions. SCL3 (SCARECROW-LIKE 3) is a key member of the GRAS transcription factor family, regulating the GA signaling pathway by antagonizing DELLA proteins (core repressors of GA signaling), thereby promoting main root elongation and lateral root development (Zhang et al., 2011). Its specific expression in the endodermis of A. thaliana is regulated by the SHR/SCR complex, with the three cooperatively driving cell divisions and differentiation in the root apical meristem (Montiel, 2004). Recent studies have shown that SCL3 not only maintains GA homeostasis by regulating GA biosynthesis genes (such as GA20ox and GA3ox) but may also be regulated by phosphorylation: the phosphatase CPL3 interacts with DELLA and enhances its stability, suggesting that SCL3 may fine-tune GA signaling dynamics in coordination with post-translational modifiers (Feng et al., 2008; Li et al., 2024). DELLA proteins, as key regulatory elements in the GA signaling pathway, act as negative regulators, inhibiting plant growth and development (De et al., 2008). In O. sativa, SLR1 (SLENDER RICE 1) is a homolog of DELLA proteins, and its loss of function leads to excessive elongation of the plant (Itoh, 2002); in Hordeum, the SLN1 (SLENDER1) gene encodes a DELLA protein, whose loss of function similarly causes excessive elongation, while its gain of function results in dwarfism (Chandler, 2002). Studies have shown that GA can bind to the gibberellin receptor protein GID1 (gibberellin insensitive dwarf 1) to form a GA/GID1 complex, which then interacts with the DELLA domain at the N-terminus of DELLA proteins to form a new GA/GID1/DELLA ternary complex. Subsequently, the 26S proteasome ubiquitinates and degrades DELLA proteins, thereby relieving their inhibitory effect on plant growth (Hirano et al., 2008). In addition, other subfamilies of the GRAS gene family exhibit significant functional diversity across different plant tissues and species. For example, members of the LAS subfamily play a crucial regulatory role in axillary bud growth and development (Grimplet et al., 2016); PAT1 is involved in phytochrome signaling in A. thaliana (Wang et al., 2018); HAM maintains the differentiation of the shoot apical meristem by keeping stem cells in an undifferentiated state, enabling continuous differentiation of the apical meristem (Mélanie et al., 2017; Koizumi et al., 2012); both SCR and SHR act as positive regulators of radial root growth in A. thaliana and play an important role in the formation of root cell layers (Mélanie et al., 2017). To date, GRAS genes have been identified and functionally characterized in a range of field crops and economic crops (Laskar et al., 2021; Liu et al., 2019; Lv et al., 2021).
Ginseng is a perennial herbaceous medicinal plant belonging to the Araliaceae family. Its roots are rich in bioactive compounds such as ginsenosides, which possess pharmacological properties including immune regulation and anti-aging (Laskar et al., 2021), making it widely used in medicine and health products. Members of the GRAS family are involved in various physiological processes, with subfamilies such as SCL3, SHR, SCR, and LISCL extensively regulating root development, including main root elongation, lateral root formation, and maintenance of the root apical meristem. Therefore, systematic identification of GRAS genes in ginseng is crucial for elucidating the molecular mechanisms underlying root development in this medicinal plant.
In this study, we systematically identified 139 GRAS transcription factors (PgGRAS) from the ginseng genome for the first time, classifying them into 14 evolutionary branches, including a newly discovered species-specific subfamily, PG28. Through chromosomal localization, gene structure analysis, conserved domain identification, and collinearity analysis, we revealed the expansion mechanisms and functional differentiation of these genes. Furthermore, we analyzed the expression patterns of PgGRAS genes in different tissues and under various hormone treatments, identifying PgGRAS48 as a gene associated with root development. Preliminary functional validation and mechanistic exploration were conducted using qRT-PCR, subcellular localization, Y2H, BIFC, and overexpression in transgenic plants. This study aims to systematically identify members of the ginseng GRAS gene family through whole-genome analysis, elucidate their evolutionary relationships, structural characteristics, and tissue-specific expression patterns; combine hormone treatment experiments to screen key genes for root development, and delve into the molecular mechanisms by which PgGRAS48 regulates main root elongation via the gibberellin (GA) signaling pathway, providing theoretical basis and critical targets for genetic improvement of ginseng root architecture.
2 Materials and methods
2.1 Identification and analysis of the GRAS gene family in ginseng
The genome and protein data of ginseng were obtained from the National Genomics Data Center (NGDC, https://ngdc.cncb.ac.cn/) (Wang et al., 2022), and the Hidden Markov Model (HMM) profile of the GRAS gene (PF03195) was downloaded from the Pfam database (http://pfam.xfam.org/). Using HMMER 3.2.1 software, sequences matching the structural characteristics (E-value ≤ 1×10⁻⁵) were screened from the ginseng genome. Sequences with complete GRAS domains were further filtered using the NCBI Conserved Domain Database (https://www.ncbi.nlm.nih.gov/cdd/) and the SMART data-base (http://smart.embl-heidelberg.de/) and confirmed as members of the GRAS gene family in ginseng. Subcellular localization was predicted using the WoLF PSORT tool (https://www.genscript.com/wolf-psort.html), and the physicochemical properties of the proteins were analyzed using the ExPASy ProtParam tool (https://web.expasy.org/protparam).
2.2 Phylogenetic analysis of the PgGRAS gene family
The GRAS protein sequences of A. thaliana were obtained from the A. thaliana resource database TAIR (http://www.arabidopsis.org/home.html), while the O. sativa genome data were sourced from Phytozome v13 (https://phytozome-next.jgi.doe.gov/). These sequences, along with the GRAS family members from ginseng, were subjected to multiple sequence alignment using MAFFT (http://mafft.cbrc.jp/alignment/software/). A maximum likelihood phylogenetic tree was constructed using IQ-TREE based on the JTTDCMut+F+R4 model, with branch support assessed through 1000 bootstrap replicates. The resulting phylogenetic tree was visualized and annotated using iTOL (https://itol.embl.de/).
2.3 Structural, conserved domain, and cis-acting element analysis of the PgGRAS gene family
Using the MEME online tool (https://meme-suite.org/meme/doc/meme.html) with the following parameters: maximum number of motifs = 20, motif width range = 10–100 amino acids, and E-value threshold ≤ 1×10⁻⁵, to identify conserved motifs in PgGRAS proteins. Based on the GFF3 annotation file (BioProject: PRJCA006678; Accession: GWHBEIL00000000.1) of the ginseng genome (Wang et al., 2022), analyze the exon-intron structure of PgGRAS genes. Extract the 1500 bp upstream sequences of the transcription start sites (TSS) of PgGRAS genes from the ginseng genome and predict cis-regulatory elements using the PlantCARE database (http://bioinformatics.psb.ugent.be/webtools/plantcare/html/).
2.4 Replication and synteny analysis of PgGRAS genes
Obtain the genome data of Daucus carota from Phytozome v13 (https://phytozome-next.jgi.doe.gov/) and the genome data of Panax quinquefolium and Panax stipuleanatus from the National Genomics Data Center (https://ngdc.cncb.ac.cn/). Perform intra- and inter-species synteny analysis using MCScanX (E-value ≤ 1×10⁻⁵) to identify orthologous and paralogous relationships. Calculate the non-synonymous substitution rate (Ka) and synonymous substitution rate (Ks) using KaKs_Calculator 2.0 and evaluate selection pressure through the Ka/Ks ratio.
2.5 RNA sequencing and expression analysis
Obtain RNA-seq data of different tissue parts of ginseng from the NCBI database (Accession Number: PRJNA302556) and analyze the expression data under different hormone treatments. Preprocess and normalize the raw data to obtain TPM values and use R 4.3.1 (https://www.r-project.org) to draw the heatmap of PgGRAS gene expression.
2.6 RNA extraction and qRT-PCR analysis
RNA extraction and qRT-PCR analysis were performed using tissues from 3-year-old ginseng plants (for tissue-specific expression) or 5-week-old seedlings (for hormone treatments). For tissue-specific analysis, three independent biological replicates were collected from each tissue type (main root periderm, cortex, stele, lateral roots, fibrous roots, rhizomes). For hormone treatments, seedlings with three true leaves were sprayed with ABA (50 μM), IAA (10 μM), 6-BA (75 μM), GA3 (100 μM), or distilled water (control), and samples were harvested after 5 hours with three biological replicates per treatment group. Total RNA was extracted by RNAprep pure plant kit (TIANGEN, Beijing, China) and reverse transcribed into cDNA.
Gene-specific primers were designed using Primer Premier 5 (Supplementary Table S1) and validated through standard curve analysis (amplification efficiencies: 95-105%, R² > 0.99). qRT-PCR was performed on the LightCycler 96 system (Roche, Mannheim, Germany) with a 10 µL reaction volume under the following conditions: 95°C for 2 min (initial denaturation); 40 cycles of 94°C for 15 sec (denaturation) and 60°C for 30 sec (annealing/extension); followed by melting curve analysis. Three biological replicates (independent samples) and three technical replicates (PCR repeats) were included for each experimental condition. The relative expression levels were calculated using the 2-ΔΔCT method with β-actin as the internal reference gene.
2.7 Subcellular localization
The PHB-YFP vector was digested using HindIII and SacI, and the coding sequences of PgGRAS48 and PgGRAS90 were cloned into the vector (primers are listed in Supplementary Table S1). The recombinant plasmids were transformed into Agrobacterium tumefaciens GV3101 and used to infiltrate the leaves of Nicotiana benthamiana. YFP signals were observed using a confocal laser scanning microscope.
2.8 Plant materials and treatments
Wild-type A. thaliana (Columbia, Col-0) was purchased from Shaanxi Aiyouji Bio-technology Co., Ltd. Seeds were sterilized with 75% ethanol, rinsed with ddH2O, and stratified at 4°C in the dark for 3 days. They were then sown in organic-rich soil and cultivated in a growth chamber (26°C/20°C, 16 hours light/8 hours dark, relative humidity 75%) until flowering for experimental use.
2.9 Overexpression of PgGRAS48 in A. thaliana
The PgGRAS48 gene was cloned into the pCAMBIA1300 vector (primers are listed in Supplementary Table S1) and transformed into A. thaliana using Agrobacterium tumefaciens GV3101. Seeds of wild-type (WT) and T3 generation transgenic lines were inoculated on 1/2 MS medium, and after 10 days of cultivation, the number of lateral roots, lateral root length, and main root length were recorded. Endogenous hormone levels were also measured.
2.10 Quantification of endogenous hormones in A. thaliana
The levels of GA, IAA, and 6-BA were quantified using enzyme-linked immunosorbent assay (ELISA). Plant samples were ground in liquid nitrogen and extracted with 80% methanol. After centrifugation, the supernatant was collected, dried under nitrogen gas, and resuspended in PBS. Anti-GA or anti-IAA antibodies were coated onto 96-well plates and incubated overnight at 4°C. The plates were then blocked with 1% BSA for 1 hour. Standards or samples were added and incubated at 37°C for 2 hours. After washing, HRP-conjugated secondary antibodies were added and incubated at 37°C for 1 hour. TMB substrate was added for color development, and the reaction was stopped with 2 M H2SO4. Absorbance was measured at 450 nm, and hormone concentrations were calculated.
2.11 The prediction of protein-protein interaction network
The 139 PgGRAS protein sequences were submitted to the STRING website, and A. thaliana was selected as the homologous species. After eliminating the genes that do not interact with others, the network was constructed using the genes with the highest bit score after BLAST analysis.
2.12 Molecular docking analysis
The three-dimensional structures of PgGRAS48 and PgGRAS2 were predicted using AlphaFold2 and visualized using PyMOL v.2.5.4 (https://pymol.org/2/).
2.13 Yeast two-hybrid assay
The full-length CDS of PgGRAS48 was cloned into the pGBKT7 vector, and the full-length CDS of PgGRAS2 was cloned into the pGADT7 vector (primers listed in Supplementary Table S1). The constructs were co-transformed into yeast strain AH109 and screened on SD/-Leu/-Trp/-His/-Ade and SD/-Leu/-Trp/-His/-Ade/x-α-Gal media.
2.14 Quantification of endogenous hormones in A. thaliana
For the BIFC assay, the full-length CDS of PgGRAS2 was cloned into the pSPYNE(R)173 vector, and the full-length CDS of PgGRAS48 was cloned into the pSPYCE(M) vector (primers are provided in Supplementary Table S1). The two constructed vectors, along with an empty vector, were transformed into GV3101 strain. After mixing the Agrobacterium cultures, they were used to infect tobacco plants. YFP signals were observed under a confocal laser scanning microscope.
2.15 Statistical analysis
One-way ANOVA was performed using SPSS (v27.0) software to analyze the expression levels of PgGRAS genes in different tissues of ginseng. The root phenotype and endogenous hormone content data in A. thaliana, as well as the expression data of PgGRAS genes under different hormone treatments, were analyzed using t-tests in GraphPad Prism 8.4.2 software, and the results were visualized using this method (***p<0.001, ns not significant).
3 Results
3.1 Identification of the GRAS gene family in ginseng
The HMM model (PF03514) of the GRAS gene family was downloaded from the PFAM protein family database. Using HMMER3 software, a total of 166 protein sequences containing the GRAS domain were identified, and the conserved domains were validated through NCBI and SMART. Ultimately, 139 non-redundant GRAS genes were confirmed and renamed from PgGRAS1 to PgGRAS139 based on their chromosomal locations in ginseng (Supplementary Table S2). The protein characteristics of the GRAS family members in ginseng were analyzed. These proteins encode 321 (PgGRASD114) to 993 (PgGRAS19) amino acids, with molecular weights ranging from 36.20 kDa to 110.06 kDa (Supplementary Table 2). Among them, 134 PgGRAS proteins have an average hydrophilicity (GRAVY) score of less than 0, while only 5 PgGRAS proteins have a score greater than 0. The average isoelectric point (pI) is 4.16, indicating that most PgGRAS proteins are weakly acidic. Additionally, the predicted aliphatic index ranges from 69.77 to 102.45, indicating a high proportion of aliphatic amino acids. The instability index ranges from 35.24 to 60.27, with 9 PgGRAS proteins having an instability index greater than 40, suggesting that these proteins may be unstable and prone to denaturation or degradation. According to subcellular localization predictions, 61.15% of PgGRAS proteins are localized in nucleus, while a minority are localized in the cytoplasm, mitochondria, and other organelles.
3.2 Phylogenetic analysis of the PgGRAS gene family
To further investigate the evolutionary relationships of the GRAS gene family in ginseng, a phylogenetic tree was constructed using IQ-TREE software, including 139 PgGRAS proteins, 33 AtGRAS proteins, and 50 OsGRAS proteins (Supplementary Table 3), and they were classified accordingly. The 222 GRAS proteins were divided into 14 subfamilies: LISCI, LAS, SCL4/7, DLT, SCL3, DELLA, SCR, HAM, SHR, PAT1, PG28, OS4, OS19, OS43, and PG28 (Figure 1). Notably, the HAM subfamily contains the largest number of members (22 PgGRAS proteins), while the OS19 subfamily has the fewest members (only 2 PgGRAS proteins) (Figure 1). Additionally, 28 PgGRAS proteins were found to cluster independently, not grouping with any GRAS proteins from A. thaliana or O. sativa. This subfamily was named PG28, indicating that these PgGRAS members may have undergone species-specific evolution, forming a unique gene family with potential functional or adaptive characteristics distinct from GRAS proteins in other species (Figure 1).
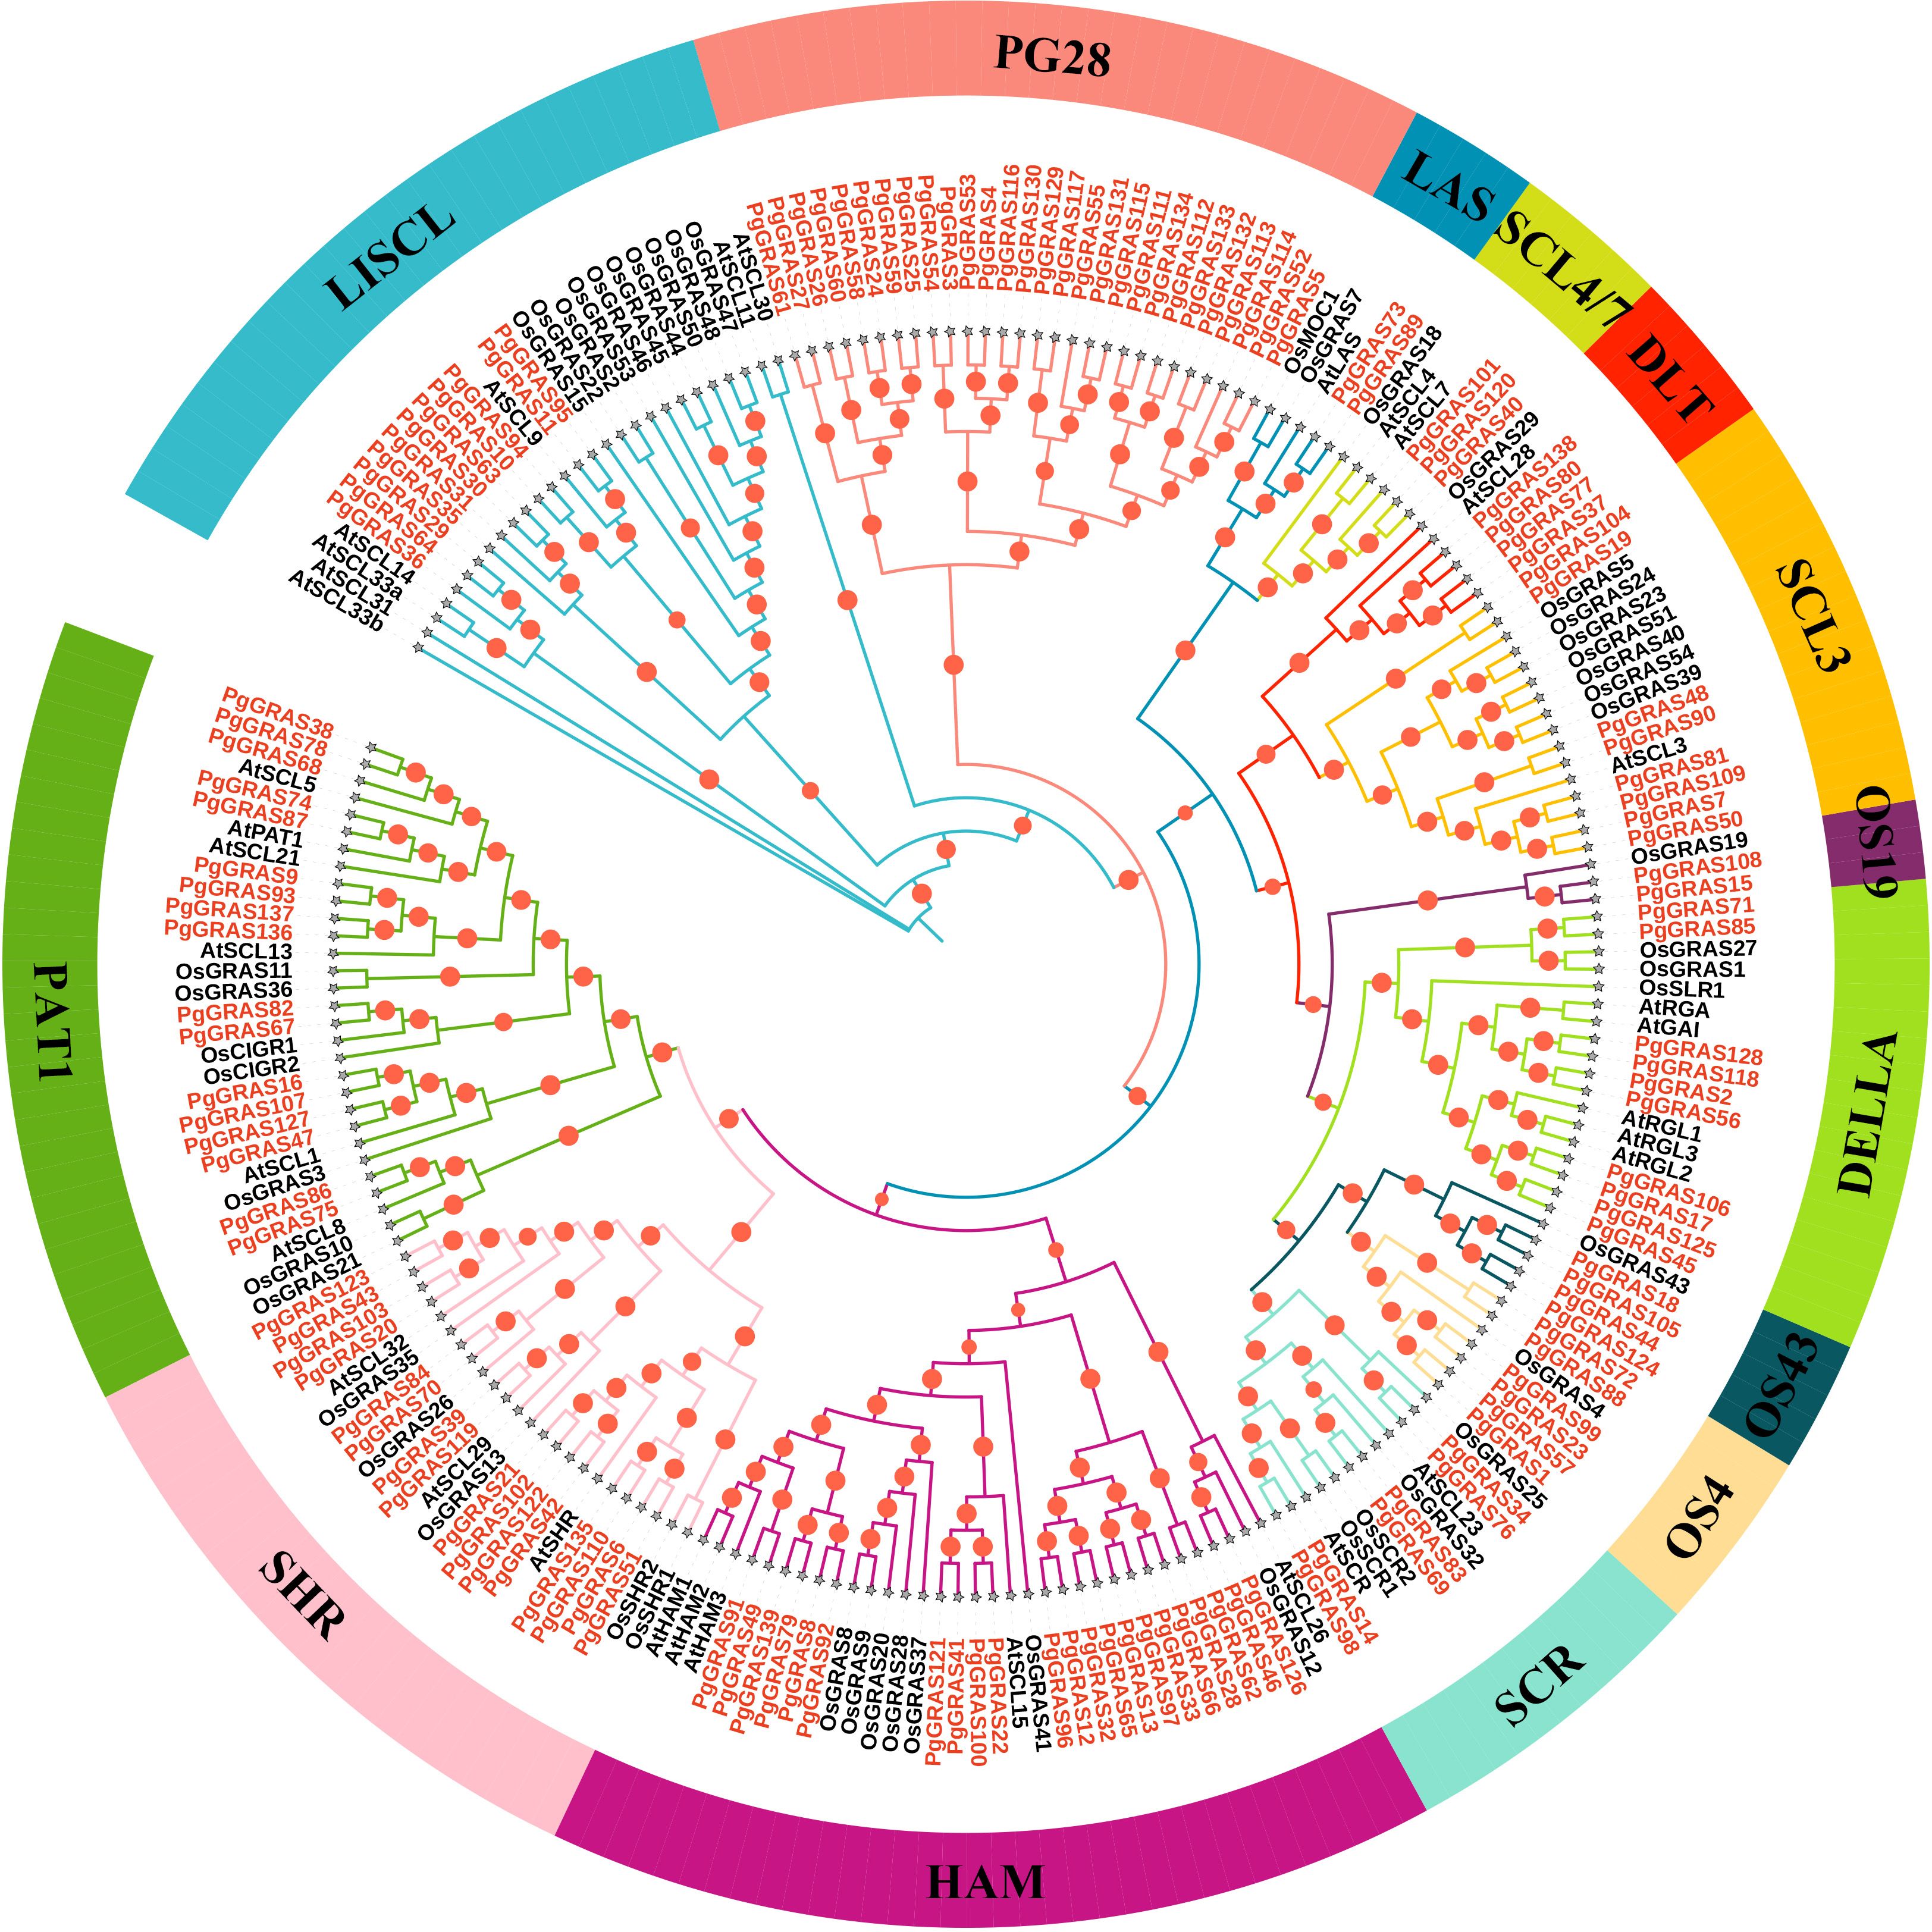
Figure 1. Phylogenetic tree of GRAS proteins from P. ginseng, A. thaliana, and O. sativa. The phylogenetic tree was constructed using the maximum likelihood method in IQ-TREE based on the JTTDCMut+F+R4 model. GRAS proteins from Ginseng are highlighted in red.
3.3 Gene structure and conserved motif analysis of PgGRAS family members
To further investigate the structural characteristics of PgGRAS family members, the distribution of introns/exons and conserved protein motifs were analyzed (Figure 2). The analysis of gene structure revealed that most PgGRAS genes contain 1–3 exons (134 genes), followed by PgGRAS8 (4 exons) and PgGRAS117 (7 exons), while PgGRAS24, PgGRAS82, and PgGRAS101 contain more than 10 exons (Figure 2a). Additionally, 52.24% of PgGRAS genes contain 1–5 UTRs (Figure 2a). Using the MEME Suite online tool, a total of 20 conserved motifs (named Motif 1 to Motif 20) were identified. The results showed that the distribution of motifs in the C-terminal region was significantly more abundant than in the N-terminal region (Figure 2b; Supplementary Figure 1). All PgGRAS protein members contain the corresponding conserved GRAS domain. The core part of the GRAS domain, the VHIID domain, is located in Motif 1, while Motif 3, 5, 9 and Motif 6, 13 are located in the LHRI and LHRII domains flanking the VHIID domain, respectively. This is followed by the PFYRE domain in Motif 2 and the SAM domain in the C-terminal region within Motif 4 (Figure 2b). Members of the same subgroup exhibit subfamily-specific motif patterns. For example, all 10 PgGRAS members in the DELLA subfamily contain the unique Motif 18, and the DLT subfamily contains the unique Motif 20 (Figure 2b). Additionally, Motif 12 is exclusively present in the PG28 subfamily, Motif 9 is unique to the PAT1 subfamily, and Motif 14 is located only at the N-terminus of LISCL subfamily members (Figure 2b). Overall, the diverse structural features observed across subfamilies reflect their broad functional diversity.
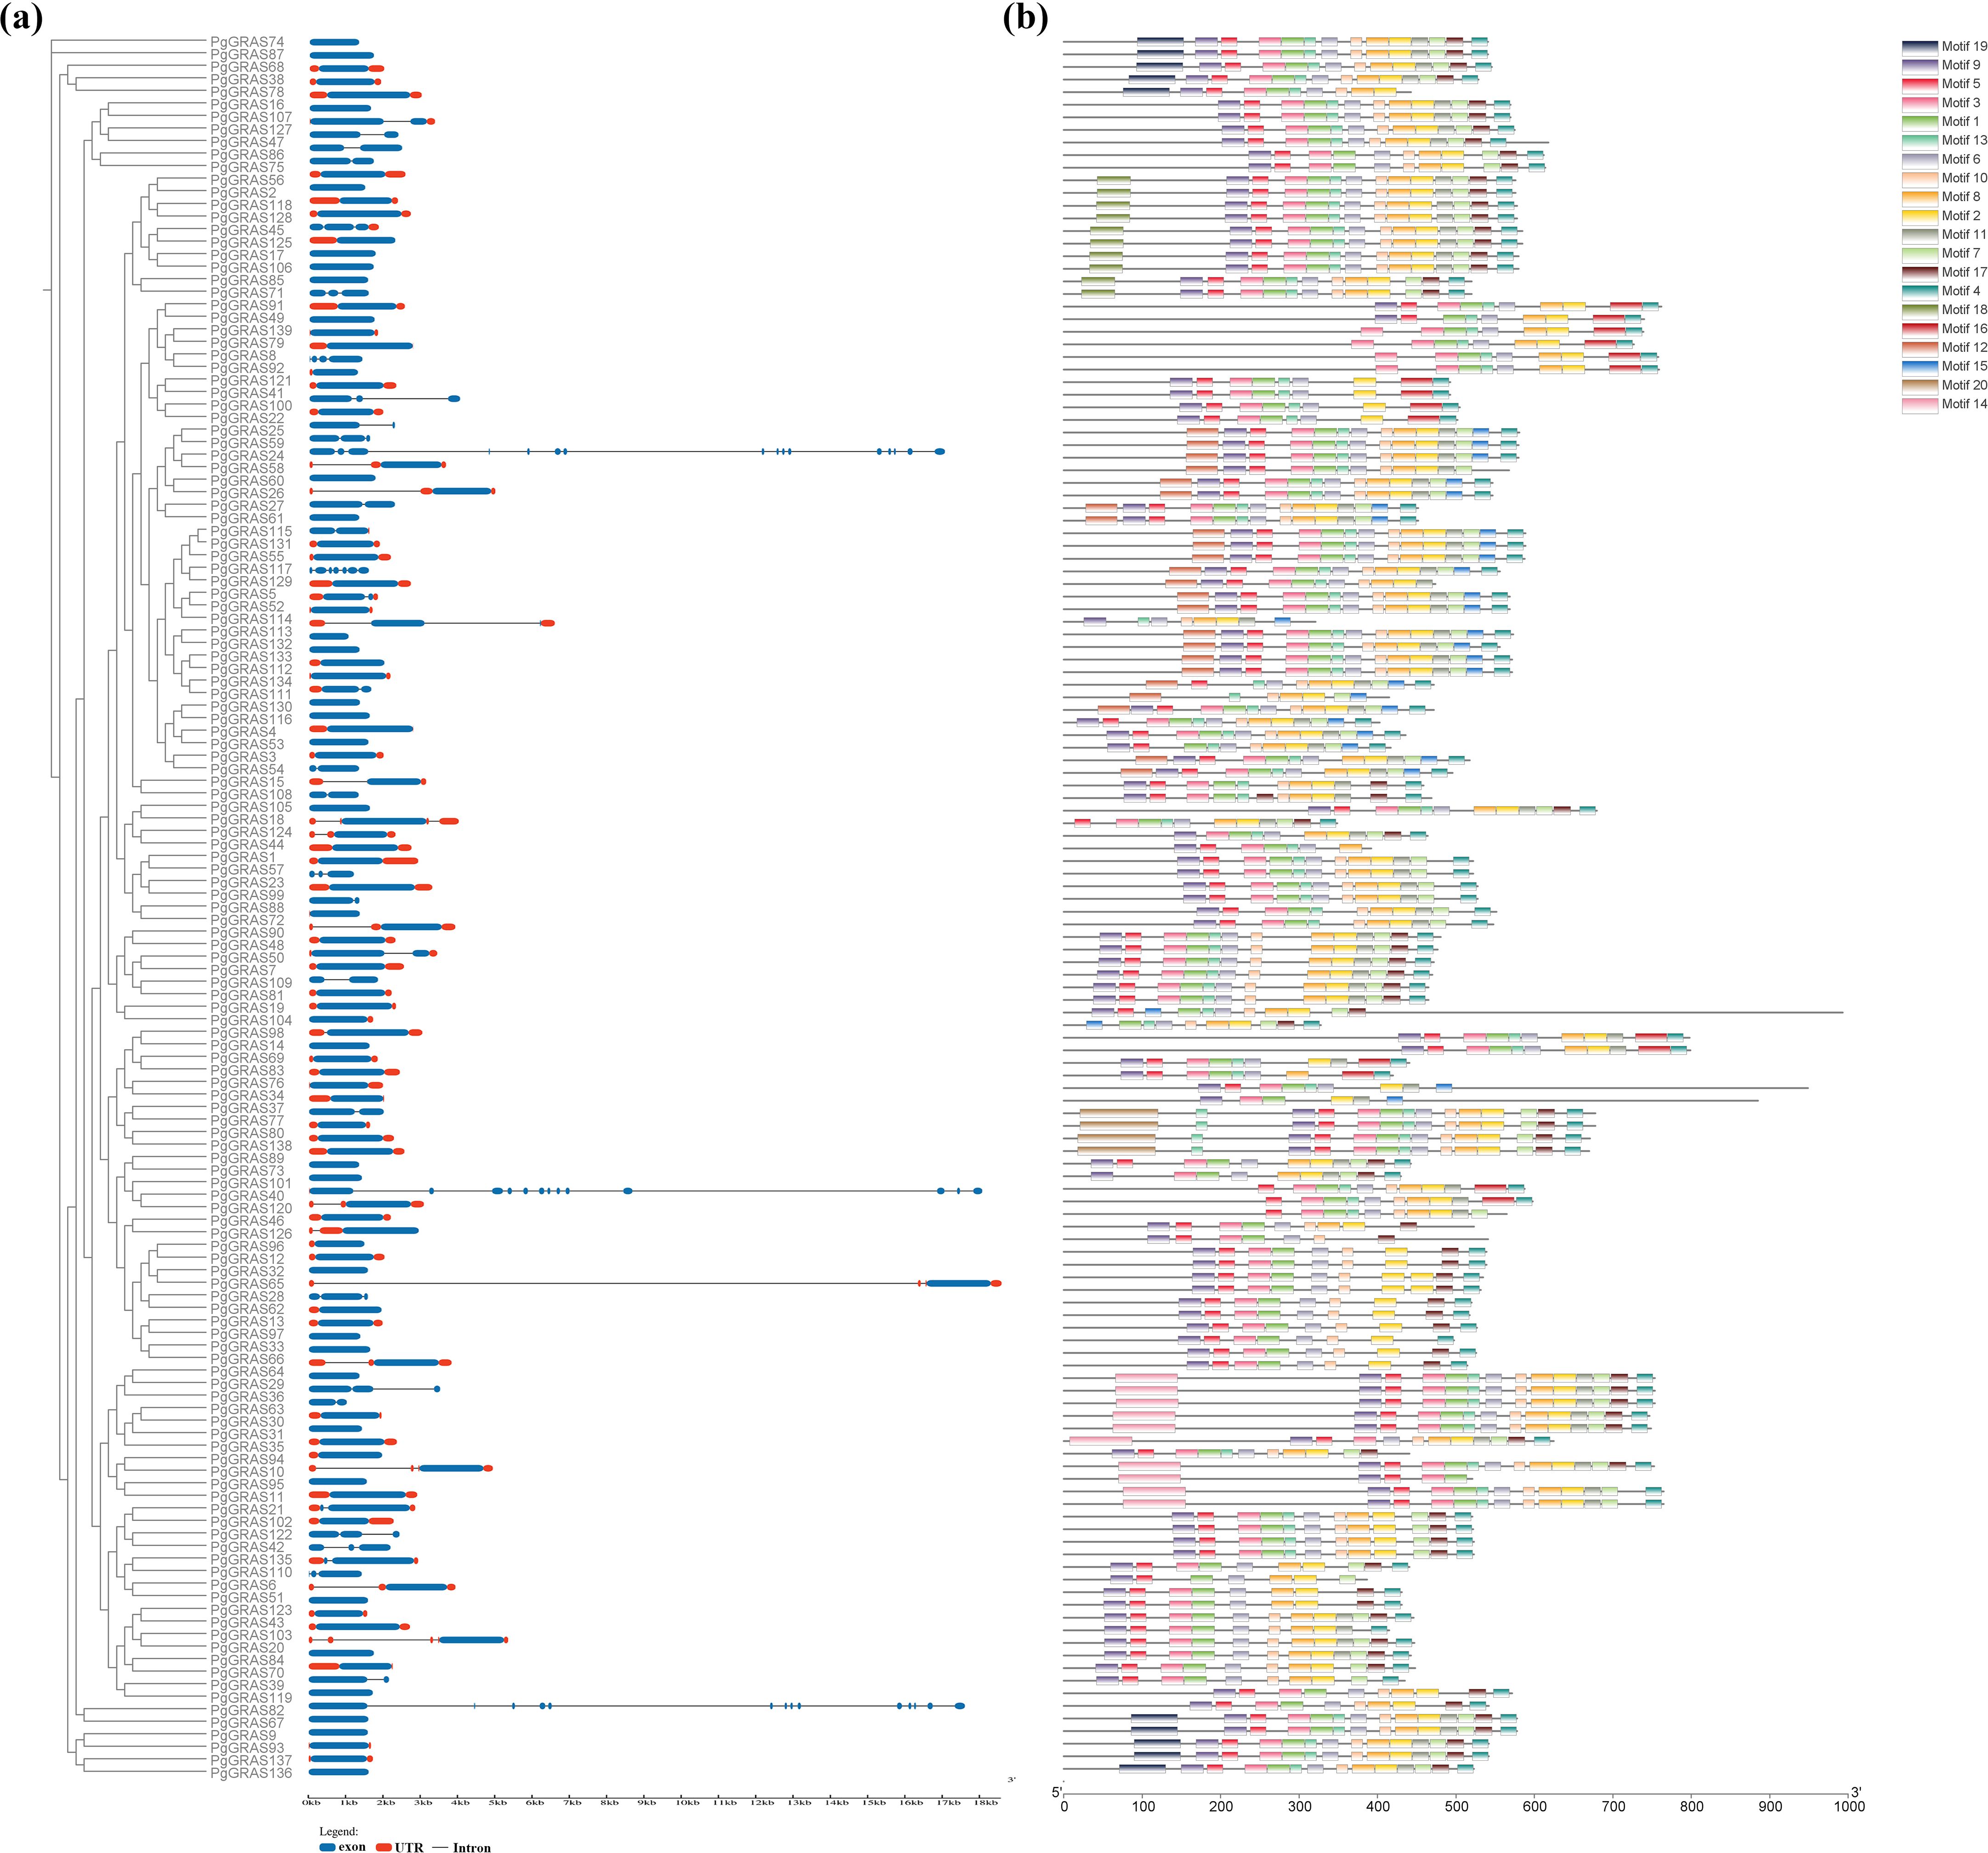
Figure 2. Exon-intron structure, conserved domains, and motif patterns of PgGRAS proteins (genes). (a) Exon-intron structure of PgGRAS genes. (b) Motif patterns of PgGRAS proteins.
3.4 PgGRAS genes cis-acting element prediction and transcriptional regulatory network analysis
Cis-acting elements, as non-coding DNA regions in gene promoters, can regulate the transcriptional activity of their linked genes. The distribution of cis-acting elements in promoters may be closely related to the functional diversity and expression pattern complexity of genes (Lescot et al., 2002). By analyzing the 1.5 kb upstream sequences of PgGRAS gene promoters and identifying them using the PlantCARE database, a total of 55 types of cis-acting elements were identified (Supplementary Figure 2, Supplementary Table 3). Light-responsive elements were universally present in the promoter regions of all PgGRAS genes and dominated in quantity, accounting for 51% of the total elements. It was found that 29 PgGRAS genes contain 9 types of elements related to plant hormone responses, including methyl jasmonate-responsive elements (CGTCA-motif, TGACG-motif), salicylic acid-responsive elements (TCA-element), abscisic acid-responsive elements (ABRE), gibberellin-responsive elements (GARE-motif, P-box, TATC-box), and auxin-responsive elements (TGA-element, AuxRR-core) (Supplementary Figure 2). In the promoter regions of PgGRAS genes, 7 types of cis-acting elements were identified to be involved in regulating the development of different tissues in ginseng, such as meristems, endosperm, and seeds (Supplementary Figure 2). Additionally, 42% of the genes contain elements related to stress responses, including ARE (anaerobic response element), LTR (low-temperature response element), MBS (drought response element), TC-rich repeats (stress response element), and GC-motif (stress response element) (Supplementary Figure 2). This indicates that PgGRAS genes not only participate in tissue development but also play important roles in responding to various abiotic stresses.
3.5 Collinearity analysis of the PgGRAS gene family
Chromosomal localization analysis revealed that the 139 PgGRAS genes are unevenly distributed across 20 chromosomes of the ginseng genome (out of 24 chromosomes). Chromosomes 4, 19, and 21 contain the highest number of PgGRAS genes (13.9%, 10 genes each), while the lowest numbers were observed on chromosomes 7 and 16 (1.44%, 2 genes each) (Figure 3a). Gene duplication plays a crucial role in functional innovation and gene family expansion. Therefore, a detailed analysis of PgGRAS gene duplication events in the ginseng genome was conducted. The results showed that 130 pairs of PgGRAS genes exhibit collinearity, with 11 pairs originating from tandem duplication events located on chromosomes 1, 2, 4, 10, 17, 21, and 23, while the remaining 119 pairs arose from segmental duplication events (Figure 3a). Interspecies collinearity analysis indicated that 120 PgGRAS genes have homologous relationships with genes from multiple plant species, including Arabidopsis thaliana (5 pairs), Daucus carota (34 pairs), Panax quinquefolium (91 pairs), and Panax stipuleanatus (116 pairs) (Figure 3b). Notably, the proportion of orthologous gene pairs between ginseng and its closely related species, Panax quinquefolium and Panax stipuleanatus, was significantly higher, reaching 65.47% and 83.45%, respectively. Additionally, PgGRAS9/14/23/80/93/99/123/138 were associated with at least 4 homologous gene pairs, suggesting that these genes may have played an important role in the evolutionary expansion of the GRAS gene family (Figure 3b).
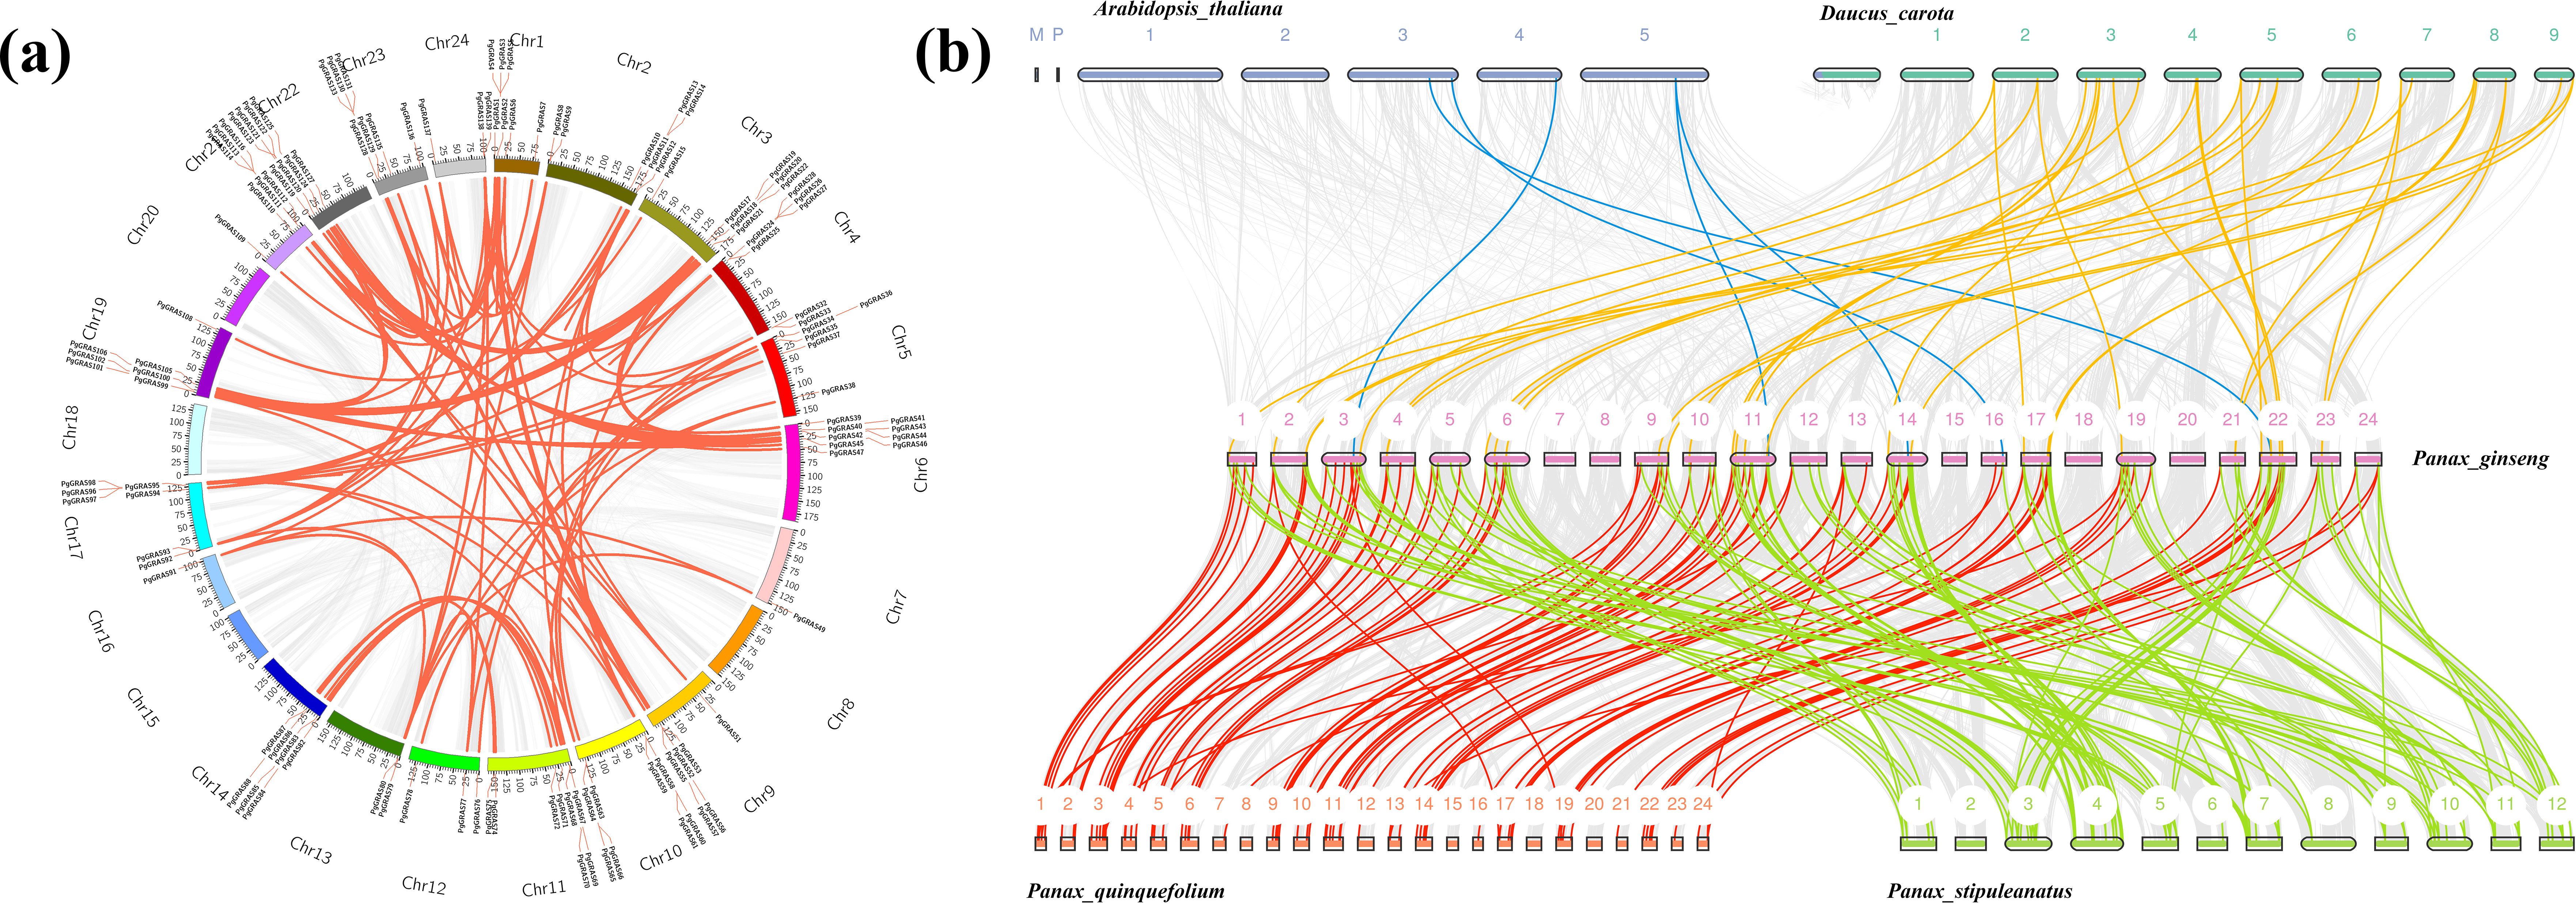
Figure 3. Chromosomal distribution and evolutionary relationship analysis of PgGRAS gene family members in Ginseng. (a) Intraspecies collinearity of PgGRAS genes. Colored blocks represent parts of Ginseng chromosomes. Red lines indicate duplicated PgGRAS gene pairs. (b) Interspecies collinearity between Panax ginseng and Arabidopsis thaliana, Daucus carota, Panax quinquefolium, and Panax stipuleanatus. Different colors represent duplicated PgGRAS pairs between Ginseng and different species.
To investigate the evolutionary patterns and selection pressure of PgGRAS genes, Ka/Ks analysis was performed on duplicated PgGRAS gene pairs. The results showed that the Ka values of 127 PgGRAS gene pairs ranged from 0.0024 to 0.441, while the Ks values ranged from 0.011 to 2.294 (Supplementary Table S5). Further analysis revealed that the Ka/Ks ratios ranged from 0.047 to 1.103, with only one homologous gene pair (PgGRAS21-PgGRAS102) having a Ka/Ks ratio greater than 1, indicating that they may have undergone positive selection. The Ka/Ks ratios of the remaining duplicated genes were all less than 1 (Supplementary Table S5). These results suggest that the PgGRAS gene family primarily maintained functional stability through purifying selection during evolution, while individual gene pairs may have acquired new adaptive functions through positive selection.
3.6 Differential expression analysis of PgGRAS genes in different tissues and under hormone treatments
By analyzing published transcriptome data, we revealed the expression characteristics of PgGRAS genes in different root tissues and under hormone treatment conditions (Figure 4). The results showed that PgGRAS members of the PAT1, SCL3, and SCR subfamilies were highly expressed in various root tissues (main root periderm, main root cortex, main root stele, leg root, fibrous root, arm root, and rhizome), while PgGRAS genes in the LISCL subfamily exhibited significantly higher expression in the main root periderm compared to other root tissues (Figure 4a). Additionally, some PgGRAS genes showed organ-specific expression in the root, with PgGRAS58 expressed exclusively in the main root cortex and PgGRAS18 expressed only in fibrous root (Figure 4a). This tissue-specific expression pattern suggests that these genes may play specific biological roles in different root regions. Furthermore, the expression patterns of PgGRAS genes exhibited significant differences under various hormone treatments. PgGRAS genes in the LISCL subfamily showed enhanced expression levels after IAA treatment, while most PgGRAS genes in the PAT1 subfamily (PgGRAS9/38/67/74/82/87/93) were significantly upregulated after GA treatment (Figure 4b). Additionally, it was found that PgGRAS24, PgGRAS44, and PgGRAS96 genes specifically responded to GA, while PgGRAS24, PgGRAS97, and PgGRAS115 genes specifically responded to IAA (Figure 4b). The relative expression levels of six SCL3 subfamily genes in root tissues and under hormone treatments were evaluated using qRT-PCR (Figure 5). The results showed that PgGRAS48, PgGRAS90, and PgGRAS109 had higher expression levels in the main root periderm, main root cortex, and main root stele, while PgGRAS7 and PgGRAS50 were highly expressed in fibrous root and rhizome, and PgGRAS81 exhibited higher expression in the main root periderm and arm root (Figure 5a). The expression profiles of SCL3 subfamily members under hormone treatments showed different trends. PgGRAS48 and PgGRAS90 were significantly upregulated under GA induction, PgGRAS81 and PgGRAS109 had higher expression levels after IAA treatment, and PgGRAS7 and PgGRAS50 responded more prominently to 6-BA (Figure 5b). These results support the expression patterns observed in the transcriptome data, indicating the high reliability of the transcriptome data.
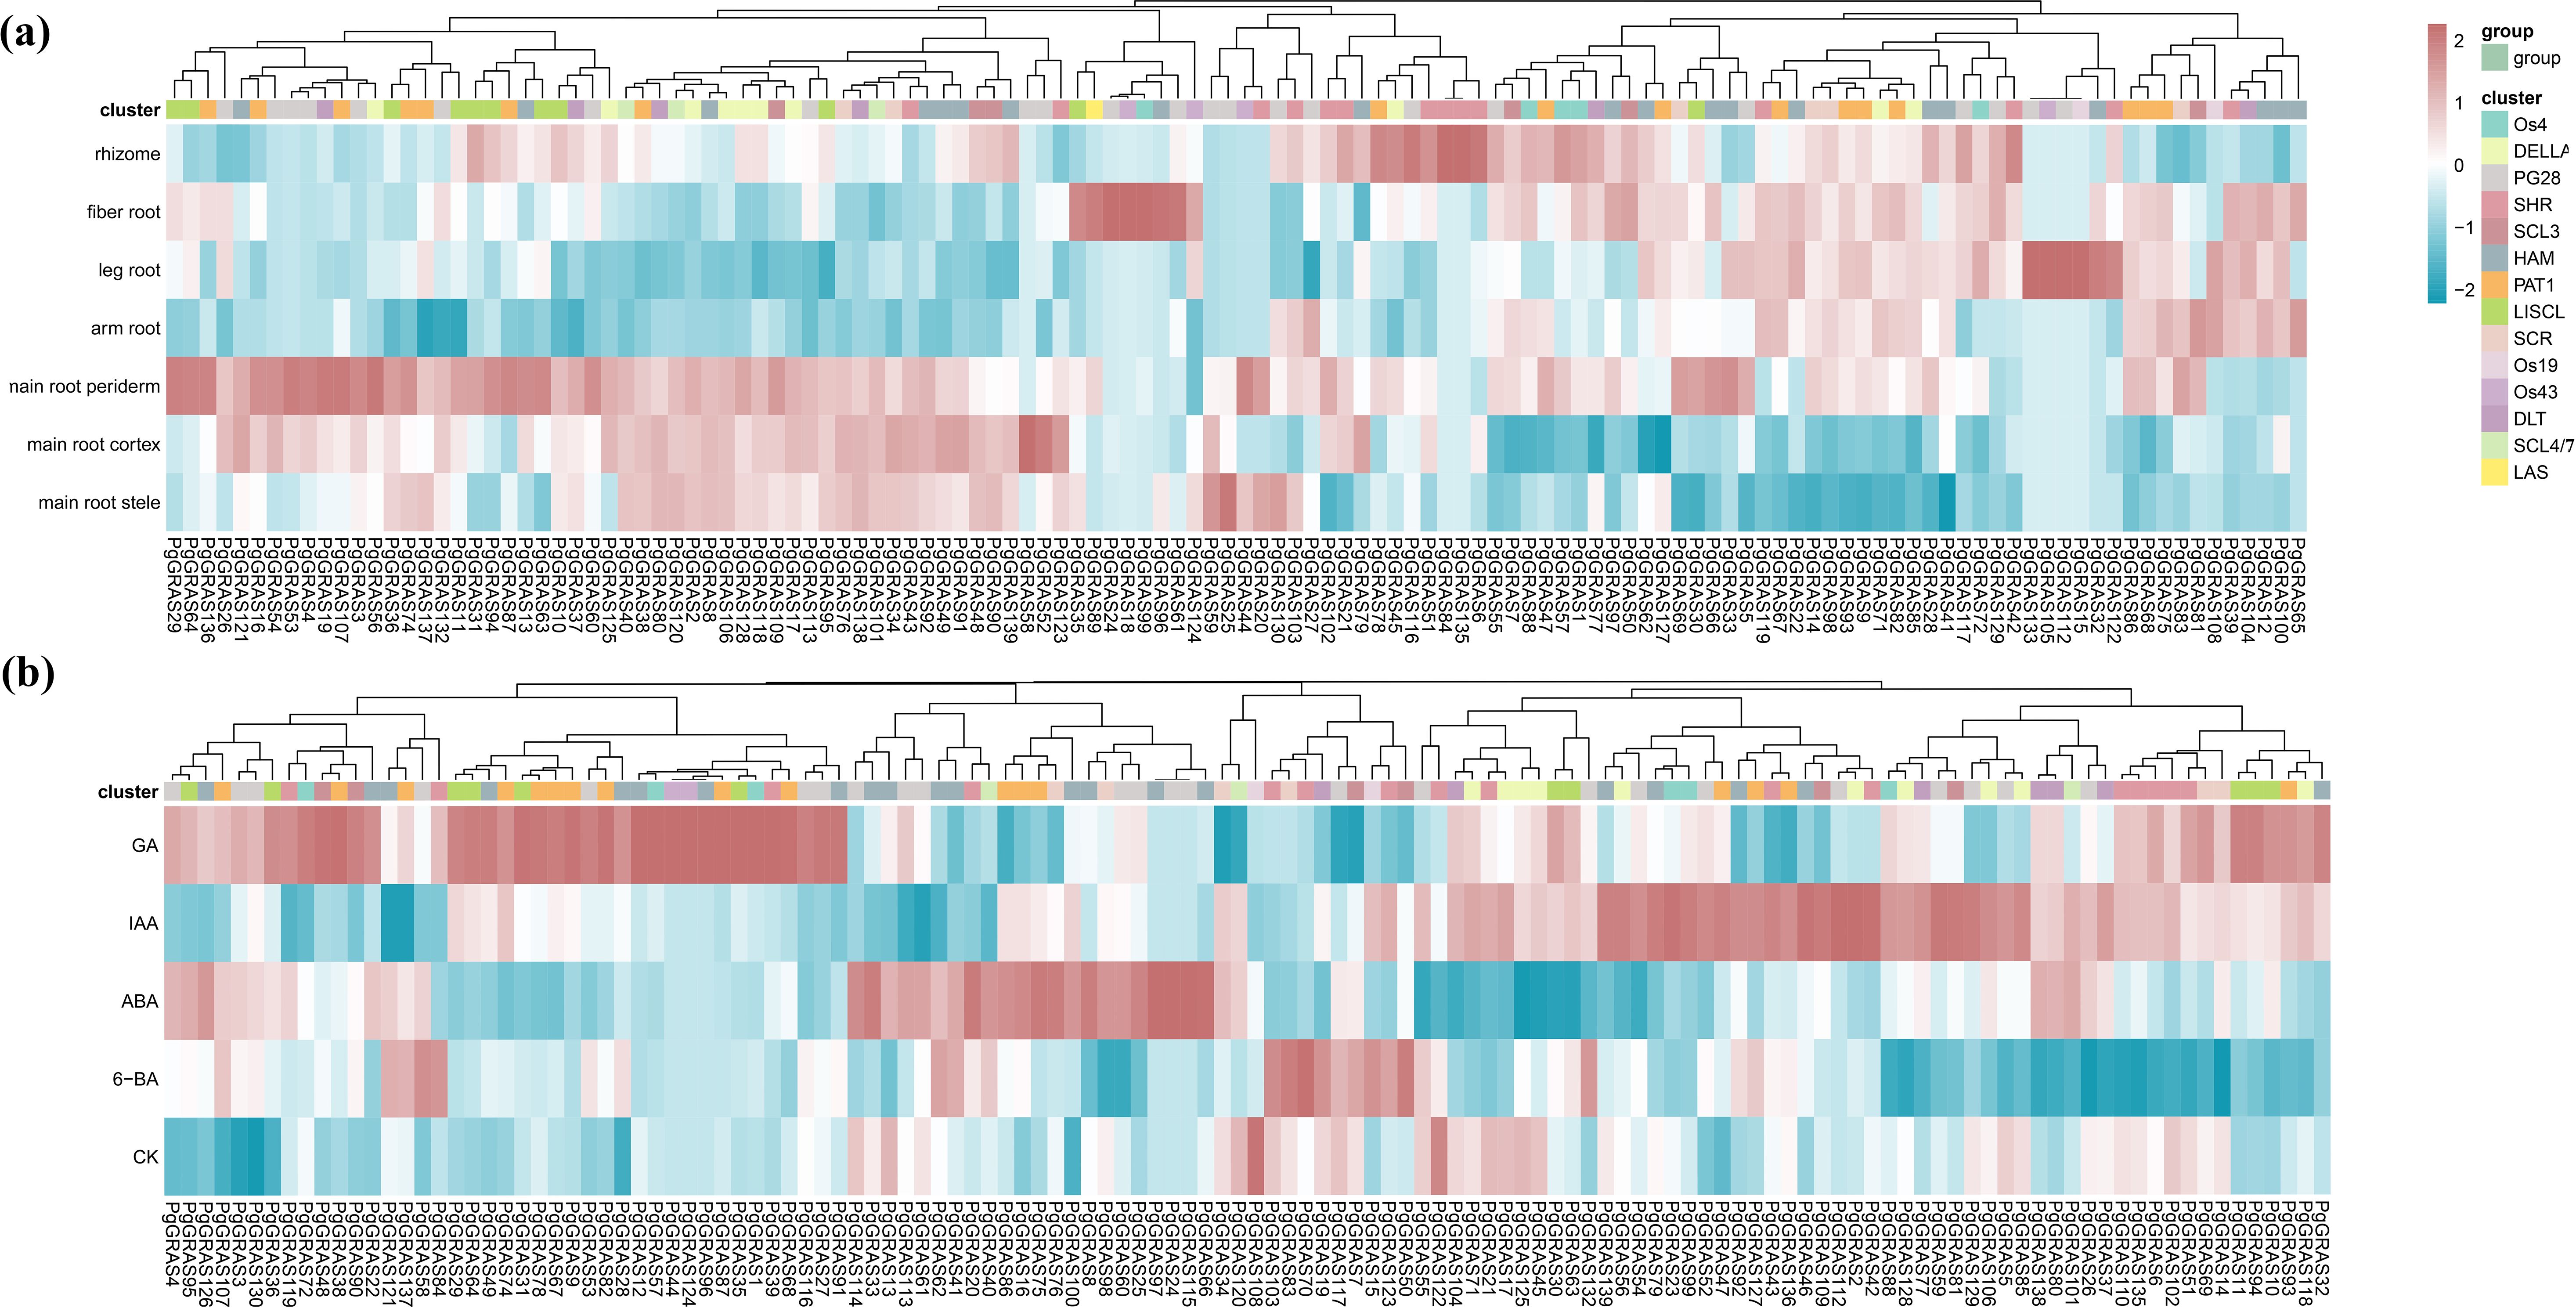
Figure 4. Expression patterns of PgGRAS genes. (a) Expression levels of PgGRAS genes in different tissues. (b) Expression levels of PgGRAS genes under different hormone treatments.
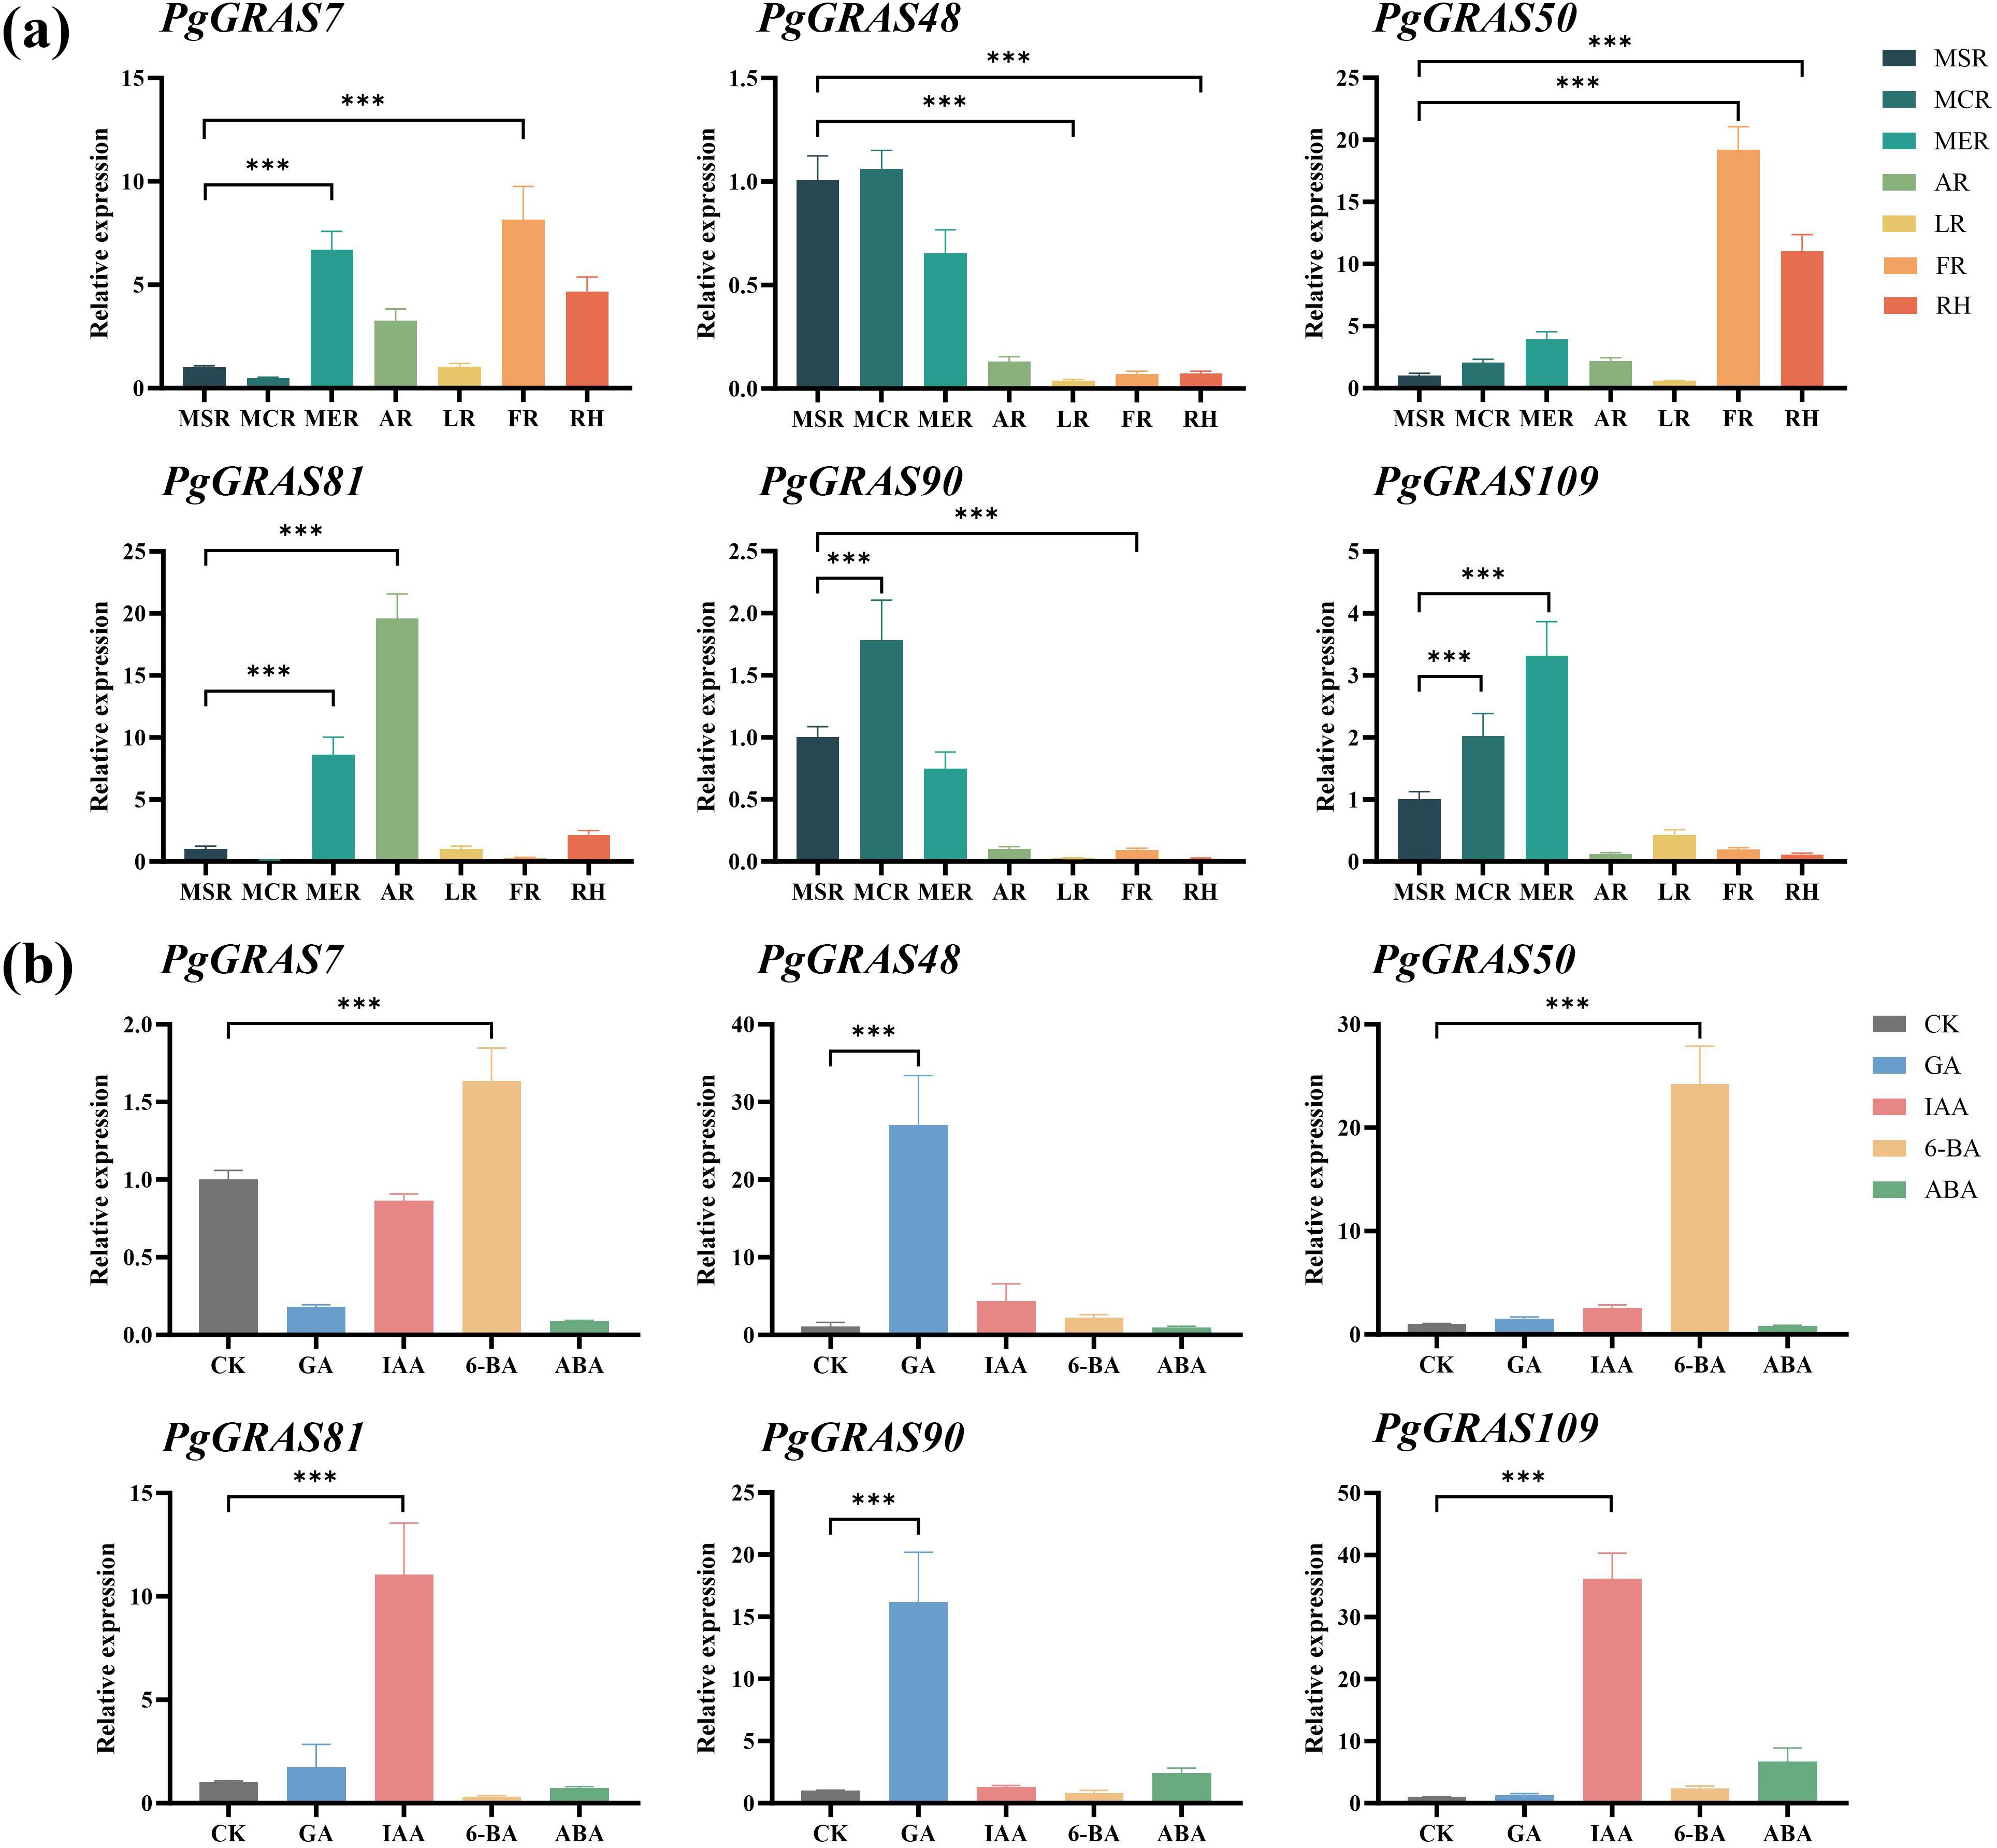
Figure 5. RT-qPCR analysis of PgGRAS expression in Ginseng under different tissue locations and hormone treatments. (a) Expression levels of PgGRAS in different tissue locations (n = 3). (b) Expression levels of PgGRAS under different hormone treatments (n =3). main root periderm (MER), main root cortex (MCR), main root stele (MSR), rhizome (RH), leg root (LR), fiber root (FR), and arm root (AR). Statistical significance is indicated by asterisks: ***p<0.001..
3.7 Functional and interaction studies of the PgGRAS48 gene
To reveal the key regulatory role of the PgGRAS48 gene in plant root development, this study constructed PgGRAS48 overexpression lines. The identified positive transgenic plants were named PgGRAS48-OE1 and PgGRAS48-OE2 (Figure 6a). Statistical analysis of root phenotypes showed that the main root lengths of overexpression lines OE-1 and OE-2 were significantly longer than those of the wild-type (WT), while the lateral root lengths and numbers showed no significant changes (Figure 6b). Additionally, the endogenous GA content in the main roots of overexpression A. thaliana lines was significantly higher than that of WT, with no significant changes in endogenous IAA or 6-BA levels (Figure 6b). Protein-protein interaction analysis and AlphaFold2-based protein structure prediction revealed that PgGRAS48 and PgGRAS2 interact through specific binding between four pairs of key amino acid residues, forming a stable heterodimeric complex (Figures 6c, d). To investigate their subcellular localization, we constructed two fusion expression vectors (35S-PgGRAS48-YFP and 35S-PgGRAS2-YFP). Fluorescence microscopy showed that while YFP signals in the control group were diffusely distributed across both the cell membrane and nucleus, the 35S-PgGRAS48-YFP and 35S-PgGRAS2-YFP fusion proteins exhibited predominant nuclear localization (Figure 7a). Subsequently, the protein interaction between PgGRAS48 and PgGRAS2 was validated using Y2H assays. Specifically, the PgGRAS48 gene was cloned into the pGBKT7 vector to construct the bait protein, while the PgGRAS2 gene was inserted into the pGADT7 vector to construct the prey protein. Screening on quadruple dropout medium (SD/-Leu/-Trp/-His/-Ade) supplemented with X-α-Gal and Aba showed that yeast colonies co-transformed with PgGRAS48-BD and PgGRAS2-AD turned blue (Figure 7b). The BiFC assay further confirmed the specific binding between PgGRAS48 and PgGRAS2 (Figure 7c), demonstrating their direct interaction.
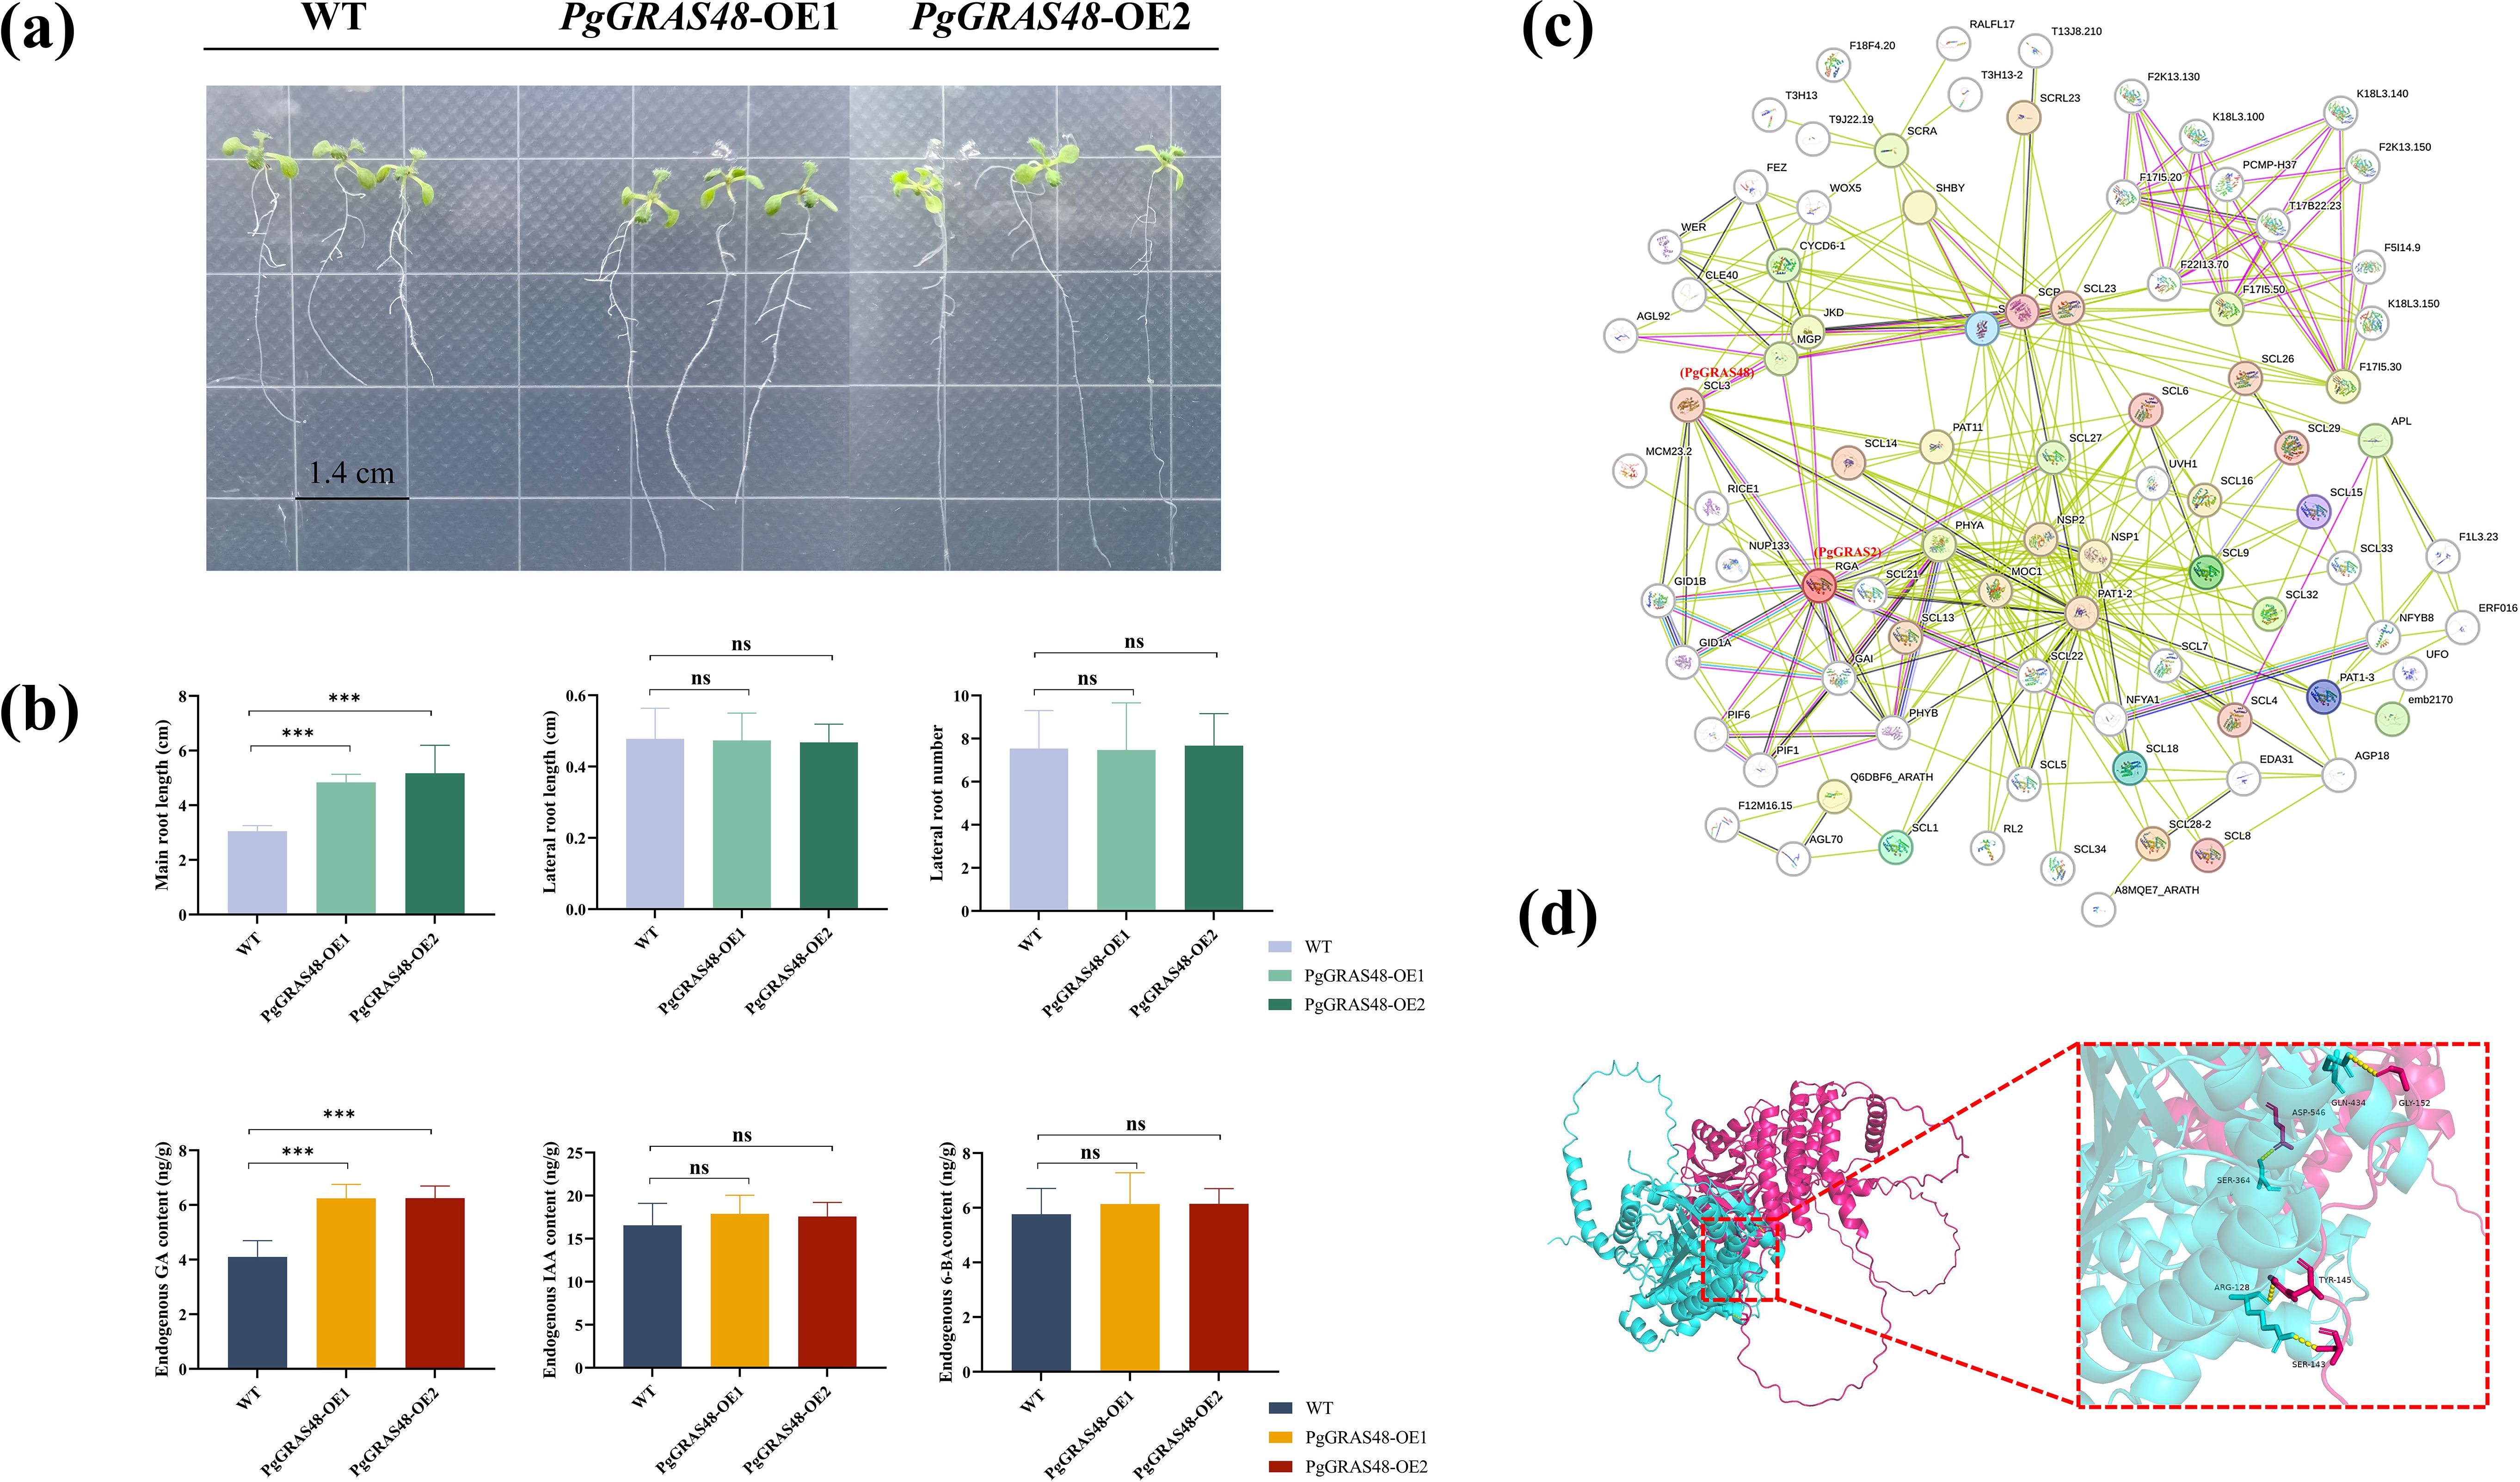
Figure 6. Functional analysis of PgGRAS48 transgenic A. thaliana and prediction of protein-protein interactions. (a) Phenotypes of wild-type (WT) and PgGRAS48 overexpression lines at 2 weeks old. Scale bar: 1.4 cm. (b) Root phenotypes and endogenous hormone content statistics of WT and PgGRAS48 transgenic plants. Error bars represent standard deviation (SD; n = 3). (c) Protein-protein interaction prediction of PgGRAS proteins. (d) Molecular docking analysis of the interaction between PgGRAS48 and PgGRAS2 proteins. Statistical significance is indicated by asterisks: ***p<0.001, ns, not significant.
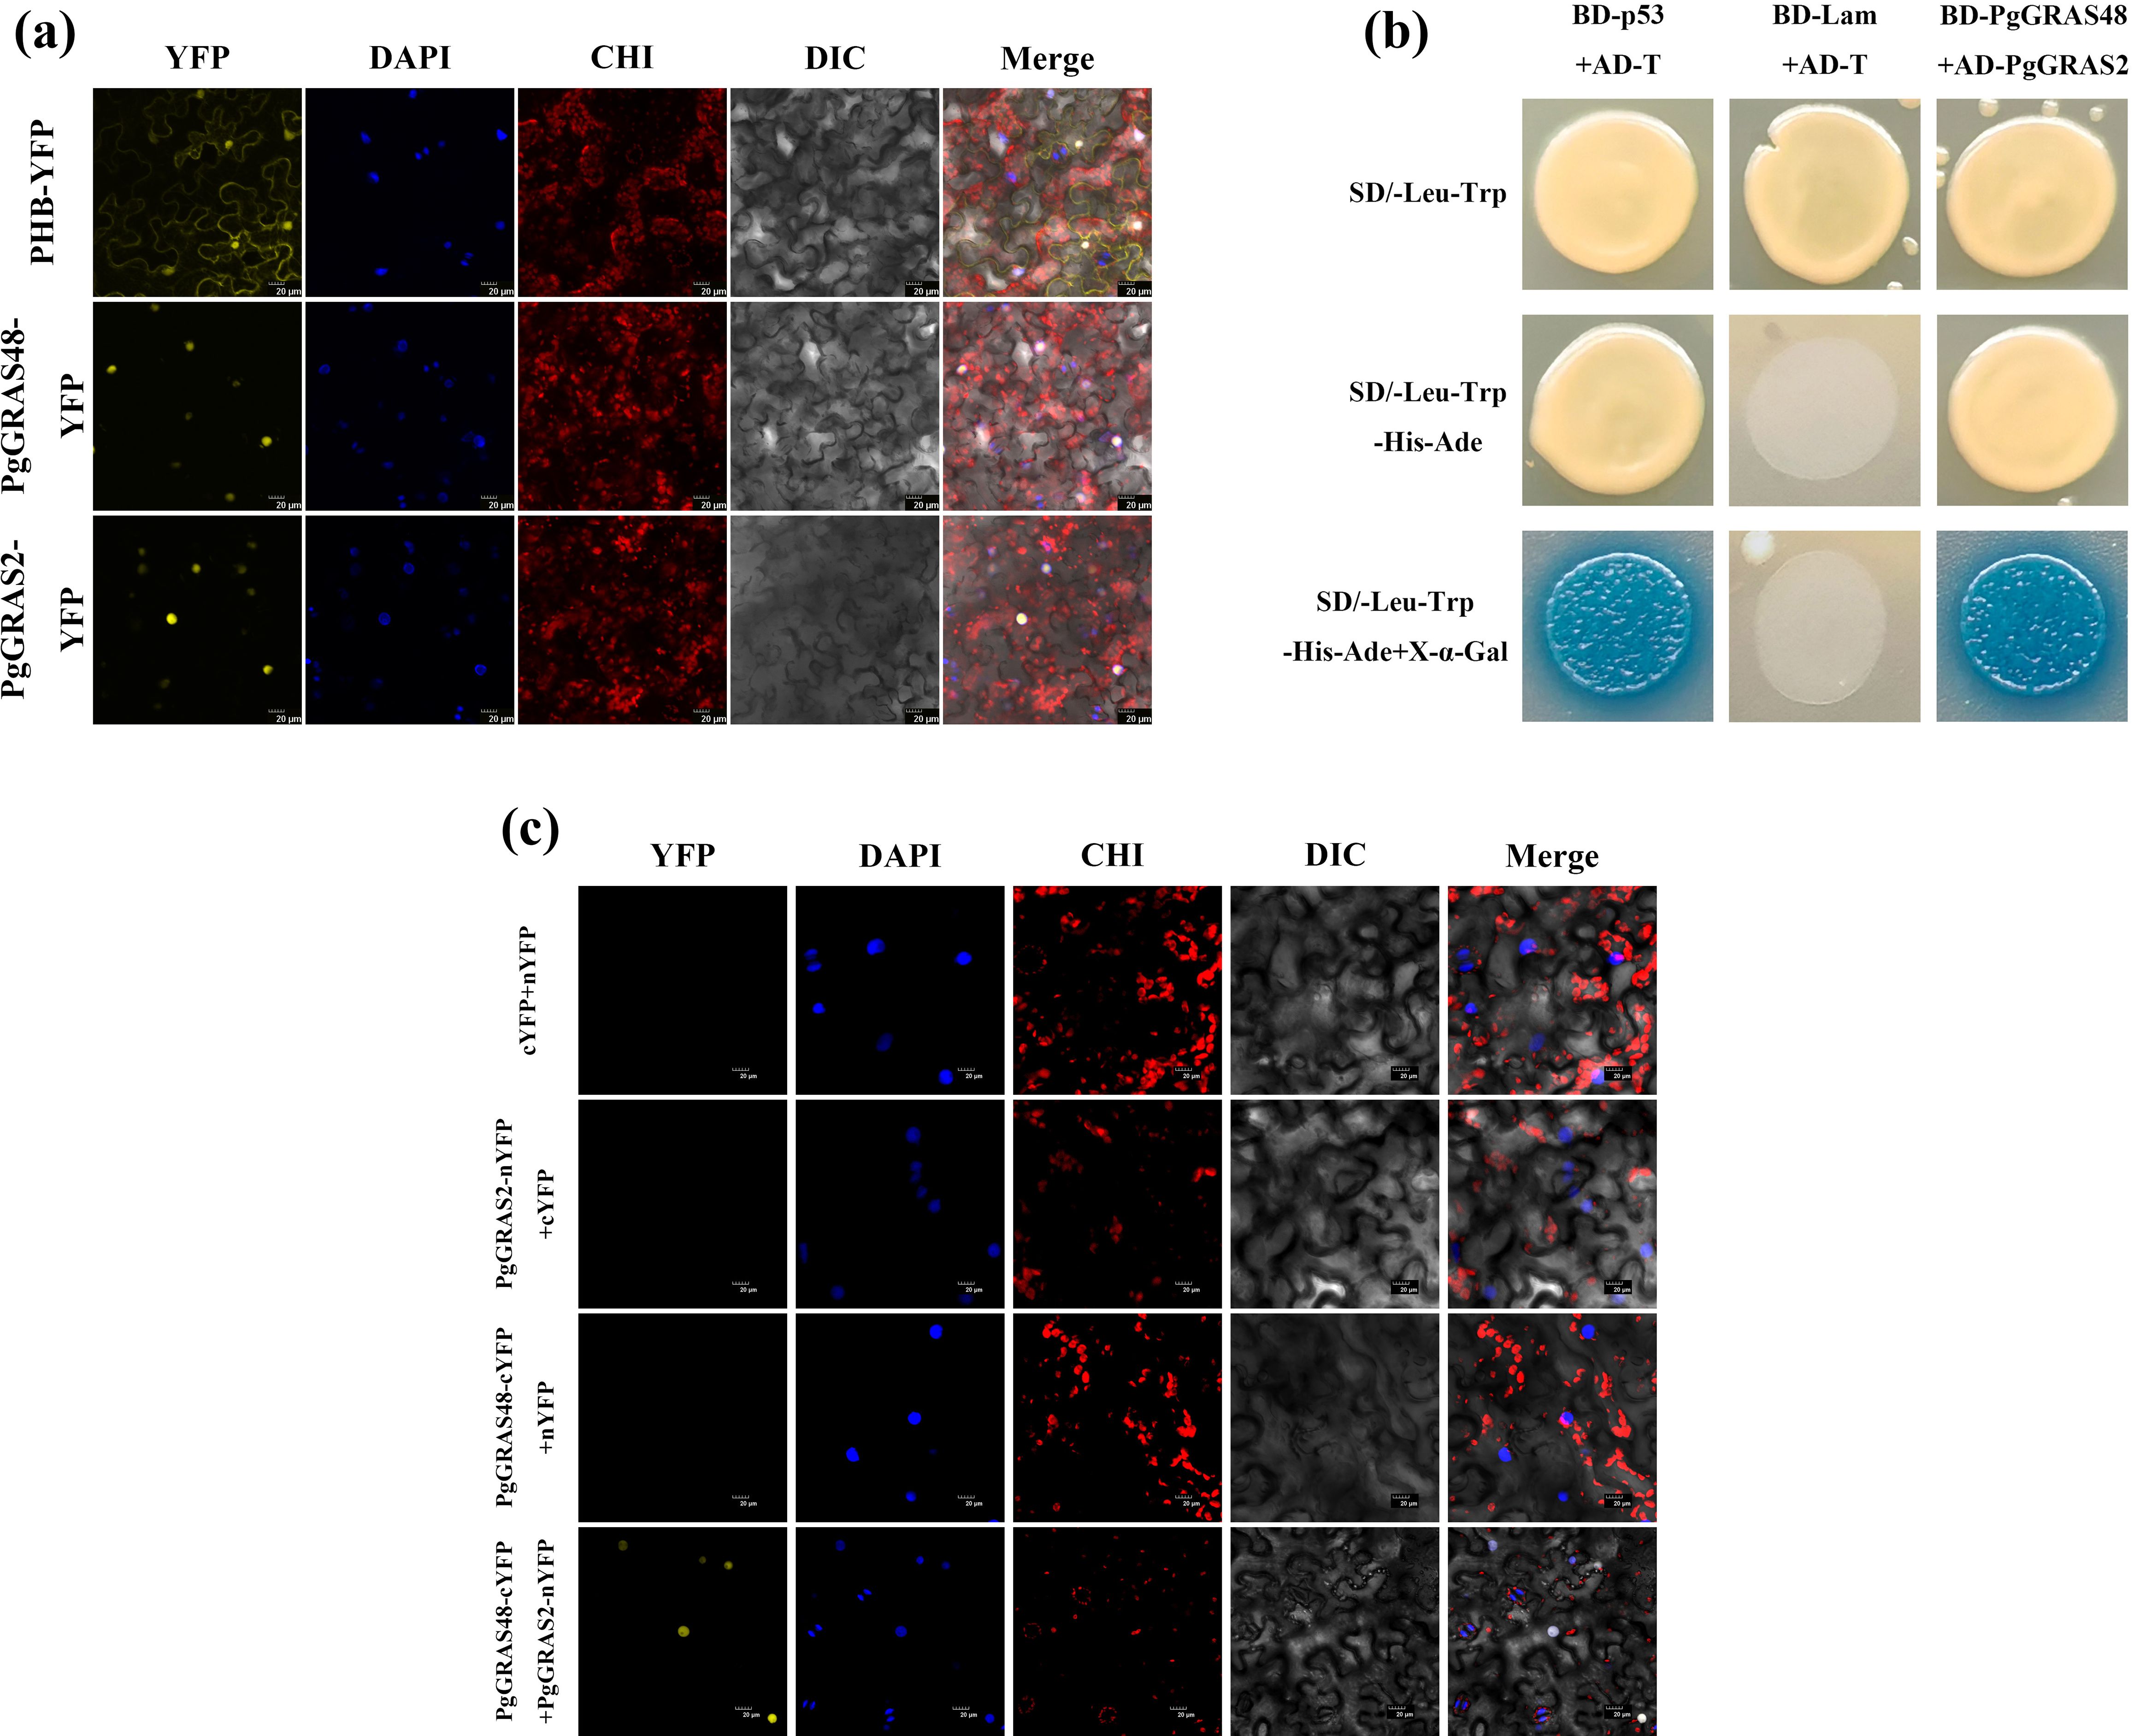
Figure 7. Subcellular localization of PgGRAS48 and PgGRAS2 and their interaction validation. (a) Subcellular localization analysis of PgGRAS2 and PgGRAS48 in Nicotiana tabacum of leaves. (b) Yeast two-hybrid validation of the interaction between PgGRAS48 and PgGRAS2. (c) BIFC analysis.
4 Discussion
The GRAS gene family plays a pivotal role in regulating the progression of plant growth and development (Laskar et al., 2021), such as the response to GA signaling and establishing radial root patterning and phytohormone signaling pathways (Guo et al., 2017). However, the widespread distribution and functional diversity of GRAS family members in ginseng have not been systematically studied. In this study, we conducted a comprehensive analysis of the GRAS gene family in ginseng, delving into the phylogenetic relationships, gene structures, chromosomal localization, cis-acting elements, and expression patterns of PgGRAS genes. A total of 139 PgGRAS genes were identified at the genome level of ginseng (Supplementary Table 1), a number significantly higher than those in Arabidopsis thaliana (34) (Liu and Widmer, 2014), O. sativa (60) (Liu and Widmer, 2014), Secale cereale (67) (Fan et al., 2024), Liriodendron chinense (49) (Weng et al., 2023), Dendrobium chrysotoxum (46) (Zhao et al., 2022), Hibiscus hamabo (59) (Ni et al., 2022), and Castanea mollissima (48) (Yu et al., 2022). Such differences in GRAS gene numbers among species may be closely related to gene duplication events or variations in genome size (Grimplet et al., 2016). As an allotetraploid, ginseng shows polyploidy-associated lineage-specific expansion of GRAS transcription factors, likely contributing to functional diversification of duplicated genes and increased regulatory complexity in development and stress responses (Li et al., 2021). To clarify the evolutionary relationships, classification, and functional conservation of PgGRAS genes, a phylogenetic tree containing AtGRAS and OsGRAS genes was constructed. The results showed that the 139 PgGRAS genes can be divided into 14 subfamilies: LISCL, LAS, SCL4/7, DLT, SCL3, DELLA, SCR, HAM, SHR, PAT1, OS4, OS19, OS43, and PG28 (Figure 1). Additionally, 28 PgGRAS genes were found to cluster independently and were named PG28, suggesting that these genes may have undergone ginseng-specific evolution or functional differentiation, potentially related to the unique biological characteristics of ginseng. The remaining 13 subfamilies of PgGRAS proteins were grouped into the same branches as A. thaliana and O. sativa, indicating high conservation during evolution and their potential involvement in fundamental physiological processes common to plants.
Our analysis revealed that over half of PgGRAS genes are intronless (Figure 2a), mirroring the high frequency observed in Solanum lycopersicon (77.4%) (Huang et al., 2015) and Prunus mume (82.2%) (Lu et al., 2015), while three members (PgGRAS24/82/101) contain more than 10 exons, suggesting evolutionary intron loss and gene fragment insertion events (Rogozin et al., 2012; Staiger and Brown, 2013). Typical GRAS proteins contain highly conserved domains at the C-terminus, primarily including the VHIID motif and its flanking LRI and LRII regions, as well as the PFYRE, RVER, and SAW motifs (Khan et al., 2022). These domains are hallmark features of the GRAS family proteins and are widely involved in protein-protein and protein-nucleic acid interactions. Analysis of conserved domains in PgGRAS proteins revealed that PgGRAS31, PgGRAS111, PgGRAS114, and PgGRAS134 lack conserved histidine and aspartic acid residues in the VHIID region, while the remaining VHIID regions exhibit many variations in histidine and aspartic acid residues (Figure 2b), a phenomenon also observed in Secale cereale (Fan et al., 2024). These variations in the VHIID domain challenge the traditional notion of its absolute conservation among GRAS proteins, suggesting that domain diversification can facilitate the formation of novel regulatory partnerships while preserving core GRAS functionality (Khan et al., 2022). This hypothesis aligns with recent findings in A. thaliana, where mutations in key residues of the VHIID domain led to specific alterations in the GA signaling pathway (Yoshida and Ueguchi-Tanaka, 2014), and is consistent with studies on the O. sativa DELLA protein SLR1, which demonstrated that structural reorganization of the VHIID domain modulates gibberellin perception (Itoh, 2002). Additionally, members within the same subfamily share similar conserved motifs. The DELLA subfamily uniquely contains Motif18, the DLT subfamily specifically includes Motif20, while Motif12, Motif9 and Motif14 are exclusively present in the PG28, PAT1 and LISCL subfamilies, respectively (Figure 2b). This subfamily-specific motif distribution suggests these conserved domains may confer specialized functional properties that contribute to the distinct regulatory roles of each PgGRAS subfamily in plant development and stress responses.
Gene duplication is a core mechanism driving gene family expansion and functional innovation, playing a key role in genome evolution, environmental adaptation, and the formation of new species (Fang et al., 2022). Through intraspecies collinearity analysis in ginseng, we identified 130 pairs of PgGRAS genes with collinear relationships (Figure 3a). Among these, segmental duplication events were the primary driver of gene family expansion, accounting for over 91%, while tandem duplication events were relatively rare. These duplication events may lead to functional redundancy and gene diversification, providing a genetic basis for species adaptation to complex environments (Clark, 2023). Further comparison of genomic collinearity between ginseng and species such as Arabidopsis thaliana, Daucus carota, Panax quinquefolium, and Panax stipuleanatus revealed that these genes are highly conserved within the Panax genus but exhibit less collinearity with Arabidopsis thaliana and Daucus carota (Figure 3b), suggesting that these genes may have been newly acquired during the evolution of Panax species, reflecting species-specific functional differentiation (Freschet et al., 2021). Ka/Ks ratio analysis showed that the vast majority of duplicated gene pairs (126 pairs) had Ka/Ks values less than 1, indicating that they were subject to purifying selection during evolution and are highly conserved in function. Only one gene pair had a Ka/Ks value greater than 1, suggesting it may have undergone positive selection (Supplementary Table S5). This may be related to ginseng’s environmental adaptation or the acquisition of specific functions. These findings provide important insights into the evolutionary history of the ginseng gene family and its role in species adaptation.
In this study, by integrating transcriptome data and qRT-PCR validation, we systematically analyzed the potential roles of the PgGRAS gene family in tissue-specific expression and hormone responses in roots. Transcriptome analysis revealed that most SCL3 subfamily members are highly expressed in the cortex, periderm, and stele of the main root (Figure 4a). qRT-PCR validation of selected SCL3 subfamily genes further supported the reliability of the transcriptome data (Figure 5a), a pattern consistent with reports in A. thaliana and O. sativa, where SCL3 homologs regulate root meristem activity via GA signaling (Neves et al., 2023). Notably, PgGRAS48 and PgGRAS90 exhibited GA-specific induction (Figures 4b), with their expression levels being significantly upregulated by GA treatment (Figure 5b). This GA responsiveness mirrors the conserved function of SCL3 homologs like AtSCL3 in A. thaliana, which antagonizes DELLA proteins to activate GA signaling (Seemann et al., 2022). However, unlike AtSCL3 that predominantly integrates GA and auxin pathways, PgGRAS48 uniquely retained GA specificity while other SCL3 members (e.g., PgGRAS7/50) showed broader responsiveness to cytokinin (6-BA) or auxin (IAA). This functional difference is similar to the findings in O. sativa - OsGRAS23 regulates lateral root development through cytokinin signaling (Xu et al., 2015; Wang et al., 2024). However, PgGRAS48 exhibits unique characteristics: its specific high expression in the cortex, periderm, and stele of main roots, and strict responsiveness to GA signals, suggesting that it drives main root elongation through the GA pathway in these key tissues rather than participating in multi-hormone interaction processes.
In this study, by constructing PgGRAS48 overexpression lines and combining phenotypic analysis, we revealed its key role in regulating root elongation. Experimental results demonstrated that overexpression of PgGRAS48 significantly promoted main root elongation, accompanied by a marked increase in endogenous GA content within the main roots (Figures 6a-b). This finding aligns with the canonical role of SCL3 subfamily members in GA signaling, where SCL3 likely indirectly regulates the expression of GA biosynthetic genes by promoting GA signal transduction, thereby maintaining GA homeostasis (Zhang et al., 2011). Subsequently, through protein-protein interaction analysis and AlphaFold2 prediction, we identified an interaction between PgGRAS48 and PgGRAS2, a member of the DELLA subfamily (Figures 6c-d). Previous studies have demonstrated the diversity of DELLA-SCL3 interaction patterns: in A. thaliana, these proteins form an indirect complex through INDETERMINATE DOMAIN (IDD) family proteins to coordinately regulate GA signaling feedback pathways, where DELLA represses target gene expression while SCL3 antagonizes DELLA to release GA signals (Yoshida and Ueguchi-Tanaka, 2014). However, our study provides the first experimental evidence through BiFC and yeast two-hybrid assays that PgGRAS48 (SCL3) and PgGRAS2 (DELLA) can directly interact without requiring IDD scaffold proteins (Figures 7b-c). This finding challenges the conventional model of exclusively IDD-mediated SCL3-DELLA interactions and suggests a dual regulatory mechanism - direct interaction may serve as a rapid response system (e.g., for immediate root development regulation), while IDD-mediated complexes maintain long-term GA homeostasis. Furthermore, PgGRAS48 overexpression enhances GA biosynthesis capacity (Figure 6b). Recent studies indicate that DELLA can regulate chromatin accessibility by binding to the SWI/SNF complex core subunit SWI3C (Sarnowska et al., 2013). Combined with our results, we propose that PgGRAS48 may recruit the SWI/SNF complex to GA biosynthetic gene loci through its interaction with DELLA, cooperatively opening chromatin structure to establish an “SCL3-DELLA-SWI/SNF” ternary regulatory model. Notably, while SCL3-DELLA interactions primarily regulate hypocotyl elongation in A. thaliana (Waseem et al., 2022), our study reveals that PgGRAS48 overexpression significantly promotes main root elongation (Figure 6a), suggesting species- or tissue-specific regulatory divergence. This functional difference may stem from the ginseng SCL3-DELLA module specifically activating root development-related target genes (e.g., EXPANSINs) (Samalova et al., 2023), with PgSCL3 showing high root-specific expression patterns, indicating its unique regulatory role in root morphogenesis. Future studies should focus on resolving the precise molecular interface of SCL3-DELLA interactions and elucidating how they coordinate GA metabolism with root tissue-specific development through downstream target gene networks.
5 Conclusions
In this study, we systematically identified 139 GRAS gene family members (PgGRAS) in the Ginseng genome for the first time and classified them into 14 subfamilies, including a newly discovered species-specific subfamily, PG28. Through gene structure, conserved motif, and phylogenetic analyses, we revealed the functional differentiation and evolutionary conservation of different subfamilies. Collinearity analysis indicated that segmental duplication is the primary driver of the expansion of the GRAS family in ginseng. Experimental studies have demonstrated that the overexpression of PgGRAS48 significantly promotes root growth in A. thaliana by elevating endogenous gibberellin (GA) levels. Further molecular interaction analyses confirmed that PgGRAS48 can directly bind to PgGRAS2 (a member of the DELLA subfamily), suggesting its potential role in regulating GA biosynthesis or signaling pathways. These findings not only expand our understanding of the functional diversity within the PgGRAS gene family but also reveal the existence of the novel PG28 subfamily and lineage-specific expansion of GRAS genes in ginseng, reflecting genetic innovation during its evolution. Notably, PgGRAS48 may regulate GA biosynthesis and signaling pathways through the SCL3-DELLA protein interaction network, thereby promoting main root elongation. However, its precise regulatory network and molecular mechanisms remain to be elucidated. Future research should prioritize the use of ginseng CRISPR gene-editing technology to validate the native function of PgGRAS48 and decipher its molecular mechanisms, while also exploring the adaptive evolutionary significance of the PG28 subfamily. Integrating multi-omics approaches will provide a theoretical foundation for the genetic improvement of medicinal root traits.
Data availability statement
Publicly available datasets were analyzed in this study. This data can be found here: https://www.cncb.ac.cn/.
Author contributions
YHW: Writing – original draft, Writing – review & editing. PW: Software, Writing – original draft. PD: Supervision, Validation, Writing – review & editing. YPW: Funding acquisition, Resources, Writing – original draft.
Funding
The author(s) declare that financial support was received for the research and/or publication of this article. Natural Science Foundation of China (U21A20405).
Conflict of interest
The authors declare that the research was conducted in the absence of any commercial or financial relationships that could be construed as a potential conflict of interest.
Generative AI statement
The author(s) declare that no Generative AI was used in the creation of this manuscript.
Publisher’s note
All claims expressed in this article are solely those of the authors and do not necessarily represent those of their affiliated organizations, or those of the publisher, the editors and the reviewers. Any product that may be evaluated in this article, or claim that may be made by its manufacturer, is not guaranteed or endorsed by the publisher.
Supplementary material
The Supplementary Material for this article can be found online at: https://www.frontiersin.org/articles/10.3389/fpls.2025.1603268/full#supplementary-material
References
Bolle, C. (2004). The role of GRAS proteins in plant signal transduction and development. Planta 218, 683–692. doi: 10.1007/s00425-004-1203-z
Chandler, P. (2002). Mutants at the Slender1 Locus of Barley cv Himalaya. Molecular and Physiological Characterization. Plant Physiol. 129, 181–190. doi: 10.1104/pp.010917
Clark, J. W. (2023). Genome evolution in plants and the origins of innovation. New Phytol. 240, 2204–2209. doi: 10.1111/nph.19242
De, L. M., Davière, J. M., Rodríguez-Falcón, M., Pontin, M., Iglesias-Pedraz, J. M., Lorrain, S., et al. (2008). A molecular framework for light and gibberellin control of cell elongation. Nature 451, 480–484. doi: 10.1038/nature06520
Di Laurenzio, L., Wysocka-Diller, J., Malamy, J. E., Pysh, L., Helariutta, Y., Freshour, G., et al. (1996). The SCARECROW gene regulates an asymmetric cell division that is essential for generating the radial organization of the Arabidopsis root. Cell 86, 423–433. doi: 10.1016/s0092-8674(00)80115-4
Fan, Y., Wan, X., Zhang, X., Zhang, J., Zheng, C., Yang, Q., et al. (2024). GRAS gene family in rye (Secale cereale L.): genome-wide identification, phylogeny, evolutionary expansion and expression analyses. BMC Plant Biol. 24, 22. doi: 10.1186/s12870-023-04674-1
Fang, Y., Jiang, J., Hou, X., Guo, J., Li, X., Zhao, D., et al. (2022). Plant protein-coding gene families: Their origin and evolution. Front. Plant Sci. 13. doi: 10.3389/fpls.2022.99574
Feng, S., Martinez, C., Gusmaroli, G., Wang, Y., Zhou, J., Wang, F., et al. (2008). Coordinated regulation of Arabidopsis thaliana development by light and gibberellins. Nature 451, 475–479. doi: 10.1038/nature06448
Freschet, G. T., Roumet, C., Comas, L. H., Weemstra, M., Bengough, A. G., Rewald, B., et al. (2021). Root traits as drivers of plant and ecosystem functioning: current understanding, pitfalls and future research needs. New Phytol. 232, 1123–1158. doi: 10.1111/nph.17072
Grimplet, J., Agudelo-Romero, P., Teixeira, R. T., Martinez-Zapater, J. M., and Fortes, A. M. (2016). Structural and functional analysis of the GRAS gene family in grapevine indicates a role of GRAS proteins in the control of development and stress responses. Front. Plant Sci. 7. doi: 10.3389/fpls.2016.00353
Guo, Y., Wu, H., Li, X., Li, Q., Zhao, X., Duan, X., et al. (2017). Identification and expression of GRAS family genes in maize (Zea mays L.). PloS One 12, e0185418. doi: 10.1371/journal.pone.0185418
Hakoshima, T. (2018). Structural basis of the specific interactions of GRAS family proteins. FEBS Lett. 592, 489–501. doi: 10.1002/1873-3468.12987
Hirano, K., Ueguchi-Tanaka, M., and Matsuoka, M. (2008). GID1-mediated gibberellin signaling in plants. Trends Plant Sci. 13, 192–199. doi: 10.1016/j.tplants.2008.02.005
Huang, W., Xian, Z., Kang, X., Tang, N., and Li, Z. (2015). Genome-wide identification, phylogeny and expression analysis of GRAS gene family in tomato. BMC Plant Biol. 15, 209. doi: 10.1186/s12870-015-0590-6
Itoh, H. (2002). The gibberellin signaling pathway is regulated by the appearance and disappearance of SLENDER RICE1 in nuclei. Plant Cell 14, 57–70. doi: 10.1105/tpc.010319
Khan, Y., Xiong, Z., Zhang, H., Liu, S., Yaseen, T., and Hui, T. (2022). Expression and roles of GRAS gene family in plant growth, signal transduction, biotic and abiotic stress resistance and symbiosis formation-a review. Plant Biol. 24, 404–416. doi: 10.1111/plb.13364
Koizumi, K., Hayashi, T., Wu, S., and Gallagher, K. L. (2012). The SHORT-ROOT protein acts as a mobile, dose-dependent signal in patterning the ground tissue. Proc. Natl. Acad. Sci. United States America 109, 13010–13015. doi: 10.1073/pnas.1205579109
Laskar, P., Bhattacharya, S., Chaudhuri, A., and Kundu, A. (2021). Exploring the GRAS gene family in common bean (Phaseolus vulgaris L.): characterization, evolutionary relationships, and expression analyses in response to abiotic stresses. Planta 254, 84. doi: 10.1007/s00425-021-03725-x
Lescot, M., Déhais, P., Thijs, G., Marchal, K., Moreau, Y., Van de Peer, Y., et al. (2002). PlantCARE, a database of plant cis-acting regulatory elements and a portal to tools for in silico analysis of promoter sequences. Nucleic Acids Res. 30, 325–327. doi: 10.1093/nar/30.1.325
Li, M. R., Ding, N., Lu, T., Zhao, J., Wang, Z. H., Jiang, P., et al. (2021). Evolutionary contribution of duplicated genes to genome evolution in the ginseng species complex. Genome Biol. Evol. 13, evab051. doi: 10.1093/gbe/evab051
Li, T., Wang, Y., Natran, A., Zhang, Y., Wang, H., Du, K., et al. (2024). C-TERMINAL DOMAIN PHOSPHATASE-LIKE 3 contributes to GA-mediated growth and flowering by interaction with DELLA proteins. New Phytol. 242, 2555–2569. doi: 10.1111/nph.19742
Liu, M., Huang, L., Ma, Z., Sun, W., Wu, Q., Tang, Z., et al. (2019). Genome-wide identification, expression analysis and functional study of the GRAS gene family in Tartary buckwheat (Fagopyrum tataricum). BMC Plant Biol. 19, 342. doi: 10.1186/s12870-019-1951-3
Liu, X. and Widmer, A. (2014). Genome-wide comparative analysis of the GRAS gene family in populus, arabidopsis and rice. Plant Mol. Biol. Rep. 32, 1129–1145. doi: 10.1007/s11105-014-0721-5
Lu, J., Wang, T., Xu, Z., Sun, L., and Zhang, Q. (2015). Genome-wide analysis of the GRAS gene family in Prunus mume. Mol. Genet. Genomics 290, 303–317. doi: 10.1007/s00438-014-0918-1
Lv, G., Zheng, X., Duan, Y., and He, B. (2021). The GRAS gene family in watermelons: identification, characterization and expression analysis of different tissues and root-knot nematode infestations. PeerJ 110, 57–66. doi: 10.7717/peerj.11526
Mélanie, K. R., Pierre-Emmanuel, C., Christophe, R., and Didier, R. (2017). Role of the GRAS transcription factor ATA/RAM1 in the transcriptional reprogramming of arbuscular mycorrhiza in Petunia hybrida. BMC Genomics 18, 589. doi: 10.1186/s12864-017-3988-8
Montiel, G. (2004). Transcription factor networks. Pathways to the knowledge of root development. Plant Physiol. 136, 3478–3485. doi: 10.1104/pp.104.051029
Neves, C., Ribeiro, B., Amaro, R., Expósito, J., Grimplet, J., and Fortes, A. M. (2023). Network of GRAS transcription factors in plant development, fruit ripening and stress responses. Horticulture Res. 10, uhad220. doi: 10.1093/hr/uhad220
Ni, L., Wang, Z., Liu, X., Wu, S., Hua, J., Liu, L., et al. (2022). Genome-wide study of the GRAS gene family in Hibiscus hamabo Sieb. et Zucc and analysis of HhGRAS14-induced drought and salt stress tolerance in Arabidopsis. Plant Sci. 319, 111260. doi: 10.1016/j.plantsci.2022.111260
Peng, J., Carol, P., Richards, D. E., King, K. E., Cowling, R. J., Murphy, G. P., et al. (1997). The Arabidopsis GAI gene defines a signaling pathway that negatively regulates gibberellin responses. Genes Dev. 11, 3194–3205. doi: 10.1101/gad.11.23.3194
Pysh, L. D., Wysocka-Diller, J. W., Camilleri, C., Bouchez, D., and Benfey, P. N. (1999). The GRAS gene family in Arabidopsis: sequence characterization and basic expression analysis of the SCARECROW-LIKE genes. Plant J. 18, 111–119. doi: 10.1046/j.1365-313x.1999.00431.x
Raikhel, N. (1992). Nuclear targeting in plants. Plant Physiol. 100, 1627–1632. doi: 10.1104/PP.100.4.1627
Rogozin, I. B., Carmel, L., Csuros, M., and Koonin, E. V. (2012). Origin and evolution of spliceosomal introns. Biol. Direct 7, 11. doi: 10.1186/1745-6150-7-11
Samalova, M., Melnikava, A., Elsayad, K., Peaucelle, A., Gahurova, E., Gumulec, J., et al. (2023). Hormone-regulated expansins: Expression, localization, and cell wall biomechanics in Arabidopsis root growth. Plant Physiol. 194, 209–228. doi: 10.1093/plphys/kiad228
Sarnowska, E. A., Rolicka, A. T., Bucior, E., Cwiek, P., Tohge, T., Fernie, A. R., et al. (2013). DELLA-interacting SWI3C core subunit of switch/sucrose nonfermenting chromatin remodeling complex modulates gibberellin responses and hormonal cross talk in Arabidopsis. Plant Physiol. 163, 305–317. doi: 10.1104/pp.113.223933
Seemann, C., Heck, C., Voß, S., Schmoll, J., Enderle, E., Schwarz, D., et al. (2022). Root cortex development is fine-tuned by the interplay of MIGs, SCL3 and DELLAs during arbuscular mycorrhizal symbiosis. New Phytol. 233, 948–965. doi: 10.1111/nph.1782
Silverstone, A. L., Ciampaglio, C. N., and Sun, T. (1998). The Arabidopsis RGA gene encodes a transcriptional regulator repressing the gibberellin signal transduction pathway. Plant Cell 10, 155–169. doi: 10.1105/tpc.10.2.155
Staiger, D. and Brown, J. W. (2013). Alternative splicing at the intersection of biological timing, development, and stress responses. Plant Cell 25, 3640–3656. doi: 10.1105/tpc.113.113803
Sun, X., Jones, W. T., and Rikkerink, E. H. A. (2012). GRAS proteins: the versatile roles of intrinsically disordered proteins in plant signalling. Biochem. J. 442, 1–12. doi: 10.1042/BJ20111766
Sun, X., Xue, B., Jones, W. T., Rikkerink, E., Dunker, A. K., and Uversky, V. N. (2011). A functionally required unfoldome from the plant kingdom: intrinsically disordered N-terminal domains of GRAS proteins are involved in molecular recognition during plant development. Plant Mol. Biol. 77, 205–223. doi: 10.1007/s11103-011-9803-z
Tian, C., Wan, P., Sun, S., Li, J., and Chen, M. (2004). Genome-wide analysis of the GRAS gene family in rice and arabidopsis. Plant Mol. Biol. 54, 519–532. doi: 10.1023/B:PLAN.0000038256.89809.57
Wang, Y. X., Liu, Z. W., Wu, Z. J., Li, H., Wang, W. L., Cui, X., et al. (2018). Genome-wide identification and expression analysis of GRAS family transcription factors in tea plant (Camellia sinensis). Sci. Rep. 8, 3949. doi: 10.1038/s41598-018-22275-z
Wang, Y., Wang, Q., Di, P., and Wang, Y. (2024). Genome-wide identification and analysis of the aux/IAA gene family in panax ginseng: evidence for the role of pgIAA02 in lateral root development. Int. J. Mol. Sci. 25, 2470. doi: 10.3390/ijms25063470
Wang, Z. H., Wang, X. F., Lu, T., Li, M. R., Jiang, P., Zhao, J., et al. (2022). Reshuffling of the ancestral core-eudicot genome shaped chromatin topology and epigenetic modification in Panax. Nat. Commun. 13, 1902. doi: 10.1038/s41467-022-29561-5
Waseem, M., Nkurikiyimfura, O., Niyitanga, S., Jakada, B. H., Shaheen, I., and Aslam, M. M. (2022). GRAS transcription factors emerging regulator in plants growth, development, and multiple stresses. Mol. Biol. Rep. 49, 9673–9685. doi: 10.1007/s11033-022-07425-x
Weng, Y., Chen, X., Hao, Z., Lu, L., Wu, X., Zhang, J., et al. (2023). Genome-wide analysis of the GRAS gene family in Liriodendron chinense reveals the putative function in abiotic stress and plant development. Front. Plant Sci. 14. doi: 10.3389/fpls.2023.1211853
Xu, K., Chen, S., Li, T., Ma, X., Liang, X., Ding, X., et al. (2015). OsGRAS23, a rice GRAS transcription factor gene, is involved in drought stress response through regulating expression of stress-responsive genes. BMC Plant Biol. 15, 141. doi: 10.1186/s12870-015-0532-3
Yoshida, H. and Ueguchi-Tanaka, M. (2014). DELLA and SCL3 balance gibberellin feedback regulation by utilizing INDETERMINATE DOMAIN proteins as transcriptional scaffolds. Plant Signaling Behav. 9, e29726. doi: 10.4161/psb.29726
Yu, L., Hui, C., Huang, R., Wang, D., Fei, C., Guo, C., and Zhang, J. (2022). Genome-wide identification, evolution and transcriptome analysis of GRAS gene family in Chinese chestnut (Castanea mollissima). Front. Genet. 13. doi: 10.3389/fgene.2022.1080759
Zhang, Z. L., Ogawa, M., Fleet, C. M., Zentella, R., Hu, J., Heo, J. O., et al. (2011). SCARECROW-LIKE 3 promotes gibberellin signaling by antagonizing master growth repressor DELLA in Arabidopsis. Proc. Natl. Acad. Sci. United States America 131, 1667–1681. doi: 10.1073/pnas.1012232108
Keywords: GRAS gene family, Panax ginseng, expression pattern analysis, main root, GA
Citation: Wang Y, Wang P, Di P and Wang Y (2025) Genome-wide identification of the GRAS gene family and evidence for the involvement of PgGRAS48 in main root development in Panax ginseng. Front. Plant Sci. 16:1603268. doi: 10.3389/fpls.2025.1603268
Received: 31 March 2025; Accepted: 27 May 2025;
Published: 13 June 2025.
Edited by:
Shihai Xing, Anhui University of Chinese Medicine, ChinaReviewed by:
Yongbo Duan, Huaibei Normal University, ChinaQiang Li, Sichuan Agricultural University, China
Copyright © 2025 Wang, Wang, Di and Wang. This is an open-access article distributed under the terms of the Creative Commons Attribution License (CC BY). The use, distribution or reproduction in other forums is permitted, provided the original author(s) and the copyright owner(s) are credited and that the original publication in this journal is cited, in accordance with accepted academic practice. No use, distribution or reproduction is permitted which does not comply with these terms.
*Correspondence: Yingping Wang, d2FuZ3lpbmdwaW5nQGpsYXUuZWR1LmNu; Peng Di, ZGlAamxhdS5lZHUuY24=