 Peng Liu
 Ting Guan†
 Mingshou Fan
 Liguo Jia
- College of Agronomy, Inner Mongolia Agricultural University, Hohhot, China
Introduction: Potato (Solanum tuberosum L.) production in semi-arid regions requires precision irrigation management to address water scarcity, highlighting the critical need for real-time, non-destructive plant water status assessment techniques. This study aimed to investigate the feasibility of measuring the leaf–air temperature difference (LAD) as an indicator for diagnosing potato water status.
Methods: A field experiment was conducted with five irrigation levels (0–300 mm) to evaluate LAD responses at three leaf positions (L1, L4, and L8) across different growth stages.
Results: The results demonstrated that LAD significantly correlated with irrigation levels, plant water content (PWC), and soil moisture, with the strongest relationships observed for the fourth leaf from the top (L4). L4 exhibited the highest sensitivity to water status, the lowest variability among plants. A binomial regression between LAD and yield was identified, revealing a threshold LAD beyond which further LAD increases did not enhance the yield. These findings not only suggest that LAD can be a reliable indicator for monitoring potato water status but also identify L4 as the optimal leaf position for LAD-based water status monitoring.
Discussion: The study provides a foundation for precision irrigation in potato production, enabling improved water use efficiency and sustainable potato production in a semiarid region.
1 Introduction
Potato (Solanum tuberosum L.) has a large water requirement. Approximately 100–150 L of water is required to produce 1 kg of fresh tubers (Men and Chen, 1986; Hill et al., 2021). In semi-arid regions such as Yin Mountain area, a dominant potato production zone in China (Yang et al., 2022), precipitation often fails to meet the water requirements of potato cultivation, making irrigation essential for optimal yields. However, water resources are often scarce in these regions. Therefore, implementing efficient irrigation management strategies to concurrently enhance potato yield and water use efficiency is crucial for the sustainable development of the potato industry in the regions (Zhao et al., 2016, 2018; Akkamis and Caliskan, 2023). This challenge underscores the need for non-destructive, real-time monitoring techniques to assess plant water status—a foundation of precision irrigation (Ihuoma and Madramootoo, 2017).
Plant transpiration plays a critical role in leaf temperature regulation, as water loss through stomata dissipates heat. Under water deficit conditions, reduced transpiration leads to increased leaf temperature, while adequate hydration maintains a lower leaf temperature (Gates, 1968). Handheld infrared thermometers, with their high accuracy and low noise levels, offer a promising tool for quantifying crop water stress through leaf–air temperature difference (LAD) measurements (Morales-Santos and Nolz, 2023; Dominic et al., 2024). Previous research in wheat (Triticum aestivum L.), maize (Zea mays L.), rice (Oryza sativa L.), sorghum (Sorghum bicolor L.), and other species had shown that the LAD could indicate well the plant water or soil water content (Zhang et al., 2017; Luan et al., 2021; Zhang et al., 2023; Kumari et al., 2024). In the meantime, temperature-based indices for irrigation such as the stress cumulative temperature and crop water stress index were established (Hiler and Clark, 1971; Idso et al., 1977; Jackson et al., 1977; Gardner et al., 1981; Idso et al., 1981; Clawson and Blad, 1982). These indices have been successfully applied in irrigation decision-making for crop production in many regions.
Despite these advances, the application of LAD for potato water status diagnosis remains uninvestigated. This knowledge gap stems from the complexity of potato’s pinnately compound leaves. Unlike gramineous and leguminous crops, potato leaflets in compound leaf exhibit age-dependent variations in flatness and wrinkling. These morphological variations pose challenges for obtaining consistent temperature measurements. Notably, the fourth leaf from the top of potato plants, as the first fully expanded leaf, exhibits relatively stable size and shape (Fan, 2019). Therefore, we hypothesize that this specific leaf may serve as an optimal site for diagnosing the crop’s water characteristics through LAD measurements. The objectives of this study were as follows: (1) to compare the LAD responses of different leaves to varying soil and plant water status and (2) to assess the feasibility of using a handheld differential infrared thermometer to measure LAD for real-time determination of potato plant water status.
2 Materials and methods
2.1 Description of the experimental area
The field experiment was conducted from May to September 2021 in Chayouzhong County, Yinshan Mountain area, China (41°30′ N, 112°64′ E), which has a temperate continental monsoon climate, an average annual temperature of 1.3 °C, an elevation of 1,780 m, a frost-free period of approximately 100 days, and annual evapotranspiration greater than 2,000 mm. The soil at the experimental sites is sandy-loamy, with 26.3 g kg-1 of organic matter, 2.24 g kg-1 of total nitrogen, 10.3 mg kg-1 of available P (Olsen-P), 69.8 mg kg-1 of exchangeable K, pH of 7.9, and maximum field water holding capacity of 25.61%. The effective precipitation during the potato growth period was 236.6 mm. A small automatic weather station (Spectrum Watchdog 2900ET, USA) was installed in the experimental field to continuously and automatically detect rainfall, wind speed, air temperature, and other meteorological parameters during the potato growth period. The specific meteorological data are presented in Figure 1.

Figure 1. Maximum temperature, minimum temperature, rainfall, relative humidity, wind speed, and solar radiation during the potato growth period were recorded at the test site in 2021.
2.2 Experimental design
Five irrigation levels (total irrigation amount during potato growth), namely, 0 mm (W0), 75 mm (W1), 150 mm (W2), 225 mm (W3), and 300 mm (W4), were used in this experiment, and the specific irrigation regime (irrigation timing and amount of each irrigation event) for each treatment is shown in Table 1.
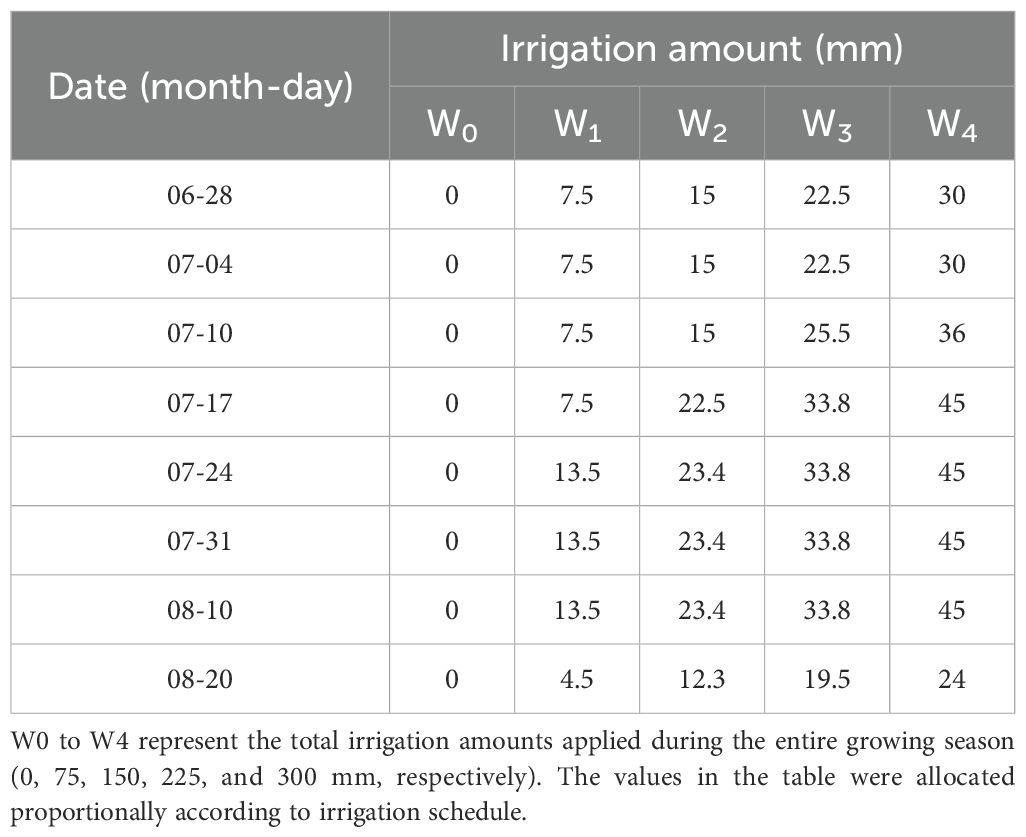
Table 1. Irrigation regime used in the experiment.
2.3 Plant materials and crop management
The virus-free seed potato cultivar Kexin No.1 was used in the experiment. The plants were sown in May 2 and harvested in September 9. Drip irrigation was provided with a 0.3-m dripper spacing, and 2.2 L/h dripper flow was used. All of the treatments were arranged in a randomized block design with three replicates. The plot area was 90 m2, with 30 cm between potato plants and 90 cm between rows. Urea (300 kg N ha−1) was used as N source, and 30% of it was basal dressed and the 70% was fertigated through drip irrigation. Phosphorus fertilizer (79 kg P ha−1) and potassium fertilizer (224 kg K ha−1) were both broadcasted as basal fertilizers.
2.4 Measurements and methods
2.4.1 Leaf–air temperature difference
A total of 12 potato plants were randomly selected from each plot at 35 days after emergence (DAE, tuber initiation stage), 50 DAE, and 60 DAE (tuber bulking stage) to measure air and leaf temperatures. The first (L1), fourth (L4), and eighth (L8) leaves from the top of the seedlings were selected as representative leaves of the upper, middle, and lower positions, respectively. A handheld differential infrared thermometer (AGRI-THERM III™, 6110 L, USA) was chosen for LAD detection in the experiment. The air temperature (Ta) was measured at a distance of 10 cm perpendicular to the top leaflet at 13:00–15:00 for all treatments. The shady side of the leaflet was selected for measurement leaf temperature (Ti). The air–leaf temperature difference (LAD) was calculated as follows:
where Ta is the atmospheric temperature (°C), and Ti is the leaf temperature (°C).
2.4.2 Plant biomass measurement
Five potato plants were randomly selected from each plot at 15, 35, 50, 60, and 80 DAE, and the plants were separated into roots, stems, leaves, and tubers. After fresh weight (FW) was taken, each part was placed in an oven at 105 °C for 30 min and then dried at 80 °C for 48 h to a constant weight. After the dried samples were weighed, this was recorded as dry weight (DW).
2.4.3 Leaf area index
At each sampling time, five plants in each plot were randomly sampled, and then the leaves from each plant were picked off. A small round leaf sample with a diameter of 1 cm from each leaf of 10 randomly selected leaves was taken using a puncher with a diameter of 1 cm. After drying, the dry weight of leaves per unit leaf area was then calculated accordingly. Based on the dry weight of the leaves of a single plant, the total leaf area of each potato plant was then derived. The leaf area index (LAI) was determined as the leaf area per unit field area.
2.4.4 Leaf relative water content
After the fresh weight (FW) of the removed leaves was measured, the samples were immersed in water and allowed to fully absorb. The leaves were wiped dry and weighed again. This process was repeated until the weight became consistent, and the final result was recorded as the saturated fresh weight (SFW). The saturated water-absorbing leaves were placed in an oven at 105°C for 30 min, and then dried at 80 °C for 48 h to a constant weight, and the resulting weight was recorded as the dry weight (DW). The leaf relative water content (%) was calculated as follows:
2.4.5 Soil moisture
Soil moisture determination was performed on the same day as the LAD measurement. Soil samples from the 0–40-cm layers were taken directly by an auger at the midpoint between potato seedlings. Three replications were conducted for each treatment. After weighing, the soil samples were dried in an oven at 80 °C to a constant weight. The soil moisture was expressed as the percentage of water weight relative to the fresh weight.
2.4.6 Tuber yield
At the end of the experiment, four 1.8-m2 area of normally growing potato plants from each plot were harvested for yield measurement, and a single tuber with a weight greater than 150 g was regarded as a commodity potato. The yield per hectare was converted according to the sampled yield.
where YM represents the yield of tubers weighing ≥150 g, and Y denotes the total tuber yield.
2.5 Statistical analysis
The SPSS 25.0 statistical software package was employed to assess the normality of these data and conduct tests for homogeneity of variance. ANOVA with LSD test (P < 0.05) and regression analysis were performed, Pearson correlation coefficients were calculated to assess linear associations between normally distributed variables.
3 Results
3.1 Plant growth and tuber yield of potatoes under varying irrigation levels
At the early growth stage, the plant dry weights did not show a significant difference among irrigation levels. Afterwards, both plant dry weight and leaf area index (LAI) of potatoes exhibited significant increases in response to higher irrigation rates (p < 0.05) (Figure 2).

Figure 2. Plant dry matter and LAI of potatoes under different irrigation levels. (a) dry matter; (b) LAI. W0 (0 mm), W1 (75 mm), W2 (150 mm), W3 (225 mm), W4 (300 mm).
Potato yield and its contributing factors demonstrated a remarkable response to irrigation under low-irrigation conditions (from W0 to W2). As the irrigation level increased within this range, there was an increase in tuber yield, the percentage of commodity potatoes, tuber number per plant, and the weight of tubers per plant. However, once the irrigation level surpassed 150 mm (W2), no further increases were observed in either the yield or its contributing factors, as shown in Table 2.
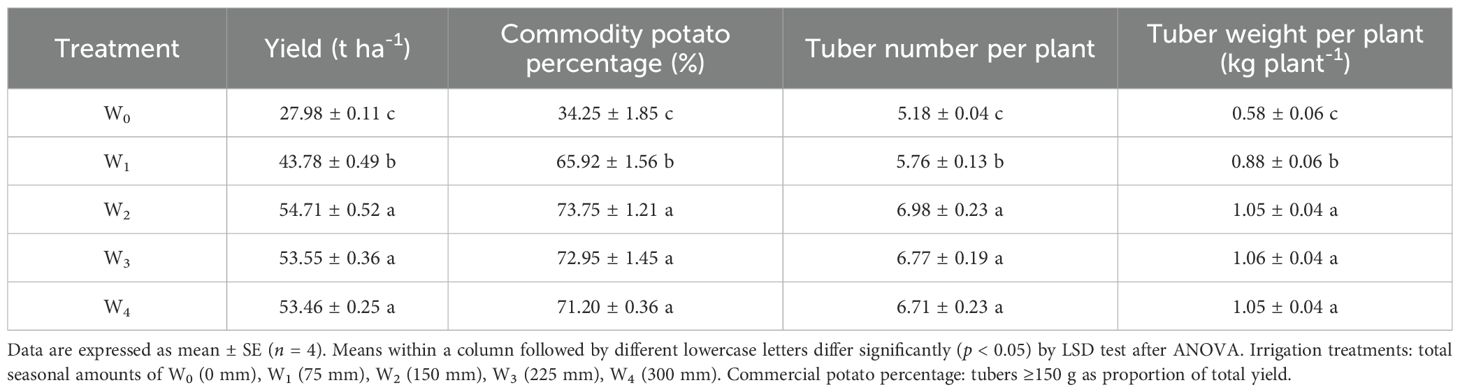
Table 2. Effects of varying irrigation levels on potato yield and yield components.
3.2 Leaf–air temperature difference influenced by irrigation levels
The irrigation level significantly affected LAD across all measured leaves (L1, L4, and L8). Compared to the non-irrigated treatment (W0), all irrigated treatments (W1–W4) resulted in higher LAD for each leaf. With increasing irrigation levels, the LAD of each leaf showed varying degrees of increase depending on the growth stage—for instance at 35 DAE, the LAD of L4 under W4 was 15% higher than that under W1. By 60 DAE, the LAD under W4 had increased by 38% compared to that under W1 (Table 3).

Table 3. Leaf–air temperature differences (°C) (LAD) under different irrigation levels.
Statistical analysis indicated a significant positive correlation between the LAD and the irrigation level. At each growth stage, the correlation between the LAD of L4 or L8 and irrigation level reached a significance level of p < 0.01. Moreover, the correlation coefficient (R) between the LAD and irrigation level was greater for L4 than for L1 or L8 (Table 4).
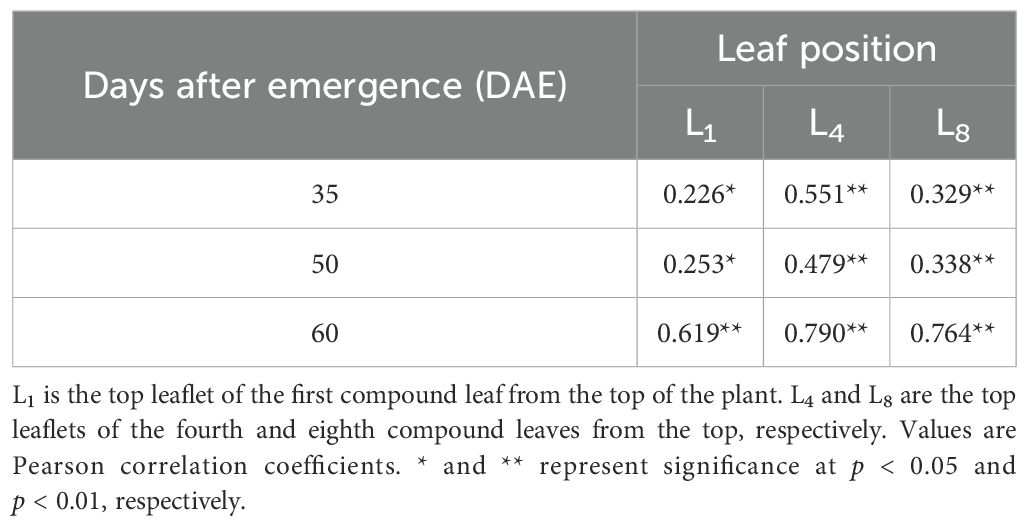
Table 4. Correlation coefficient between the leaf–air temperature difference and irrigation amount on different days after emergence.
Under the same irrigation level, the LADs of L1 exhibited the greatest variation among plants. The variation coefficient of LAD throughout the growth period was L4 < L8 < L1 (Table 5).

Table 5. Variation in leaf–air temperature difference.
Further statistical analysis showed that there was a significant binomial regression relationship (p < 0.05) between the potato yield and the LAD of each leaf at each growth stage, as shown in Figure 3. All of the regression equations clearly demonstrate that as the LAD increased, the potato yield also increased. However, once LAD reached a critical point, further increments in LAD no longer resulted in increased potato yield.

Figure 3. Regression analysis of the relationship between potato yield (y) and LAD (x) across different leaf positions and growth stages. (a) 35, (b) 50, and (c) 60 days after emergence. L1 is the top leaflet of the first compound leaf from the top of the plant. L4 and L8 are the top leaflets of the fourth and eighth compound leaves from the top, respectively.
3.3 Relationships between LAD and plant water content
There were significant linear relationships (p < 0.05) between the LAD of each leaf and the plant water content (PWC) across different growth stages. As the plant water content increased, the LAD exhibited diverse degrees of increase depending on leaf positions. At all growth stages, the coefficient of determination (R2) of the regression for L4 was higher than that for other leaf positions (Figure 4).

Figure 4. Relationships between the LAD and plant water content at (a) 35, (b) 50, and (c) 60 days after emergence. L1 is the top leaflet of the first compound leaf from the top of the plant. L4 and L8 are the top leaflets of the fourth and eighth compound leaves from the top, respectively.
Just as in the case of the relationship between LAD and PWC, a positive correlation (p < 0.05) between LAD and leaf relative water content (LRWC) was discerned at each growth stage. Throughout each growth stage, the correlation coefficients for L4 ranged from 0.48 to 0.59, being greater than those for L1 and L8 (Table 6).
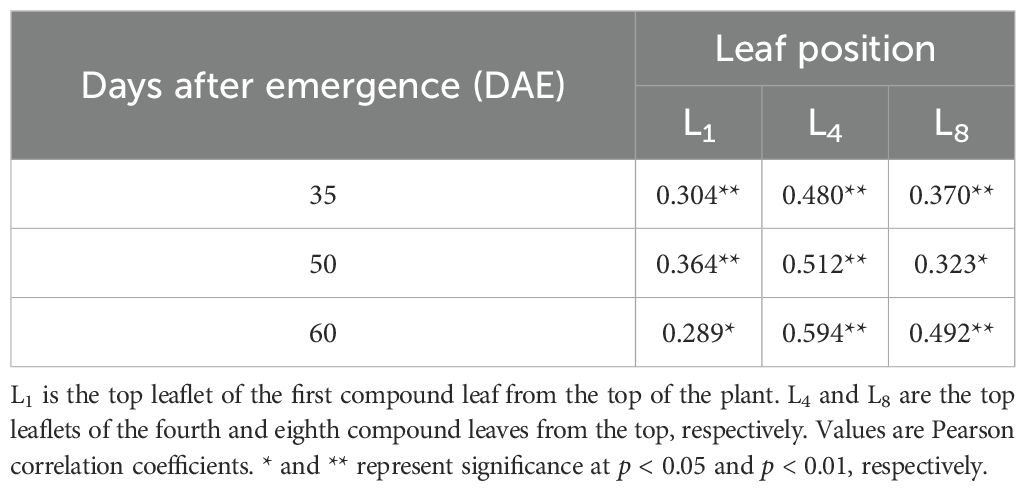
Table 6. Correlations between leaf–air temperature (LAD) and leaf relative water content (LRWC) on different days after emergence.
3.4 Response of the LAD to soil water content
As the soil water content increased, the LAD increased to varying degrees depending on leaf positions—that is, the LADs of L1, L4, and L8, each to a different extent, reflected the soil water content status. For each leaf position, significant regression (p < 0.05) between LAD and soil water content was discerned. However, the R2 of the regression for L4 was higher than that for other leaf positions at all growth stages, while the R2 value for L1 was the lowest (Figure 5).

Figure 5. Relationships between the LAD and soil water content at (a) 35, (b) 50, and (c) 60 days after emergence in the 0–40-cm soil layer. L1 is the top leaflet of the first compound leaf from the top of the plant. L4 and L8 are the top leaflets of the fourth and eighth compound leaves from the top, respectively.
4 Discussion
4.1 Feasibility of assessing potato plant water status by measuring LAD
In this study, we systematically measured LAD at L1, L4, and L8 of potato plants across different growth stages and irrigation levels. The significant positive correlations between LAD and irrigation levels observed for each potato leaf position (Tables 3, 4) clearly indicate that the LAD of potato responds highly to water supply. Notably, even the first leaf from the plant top (L1), which is typically incompletely expanded and exhibits substantial morphological variation among plants (Fan, 2019), demonstrated a significant positive correlation with irrigation level (Table 4). The relative water content of leaves (LRWC) is the best index to reflect the water balance of plants (Torres et al., 2019). In this study, the significant correlation observed between LAD and the corresponding leaf’s LRWC (Table 6) indicates that LAD could be an indicator of the water status in potato plants. The positive relationships between LAD and plant water content as well as between LAD and soil water content (Figures 4, 5) validate that LAD can serve as a reliable indicator to monitor the water status of potato plants—that is, by measuring LAD, the water status of potato plants can be assessed.
The threshold LAD value, defined as the minimal LAD required to achieve maximum yield, is critical for developing LAD-based irrigation protocols. The yield saturation effect observed in the study (in which exceeding a critical LAD value no longer results in higher potato yields) and the significant binomial regression relationship between LAD and potato yield (R2 > 0.92, p < 0.05) (Figure 3) provide two key operational advantages for precision irrigation in potato cultivation: (1) threshold-based irrigation triggering when LAD exceeds optimal ranges and (2) predictive yield modeling through continuous LAD monitoring and thereby further highlighting the substantial agronomic significance of monitoring LAD.
4.2 Optimal leaf position for assessing potato plant water status via LAD measurement
Previous studies have demonstrated that the leaf position has a significant impact on the water status diagnosis accuracy in gramineous crops through temperature measurement (Grant et al., 2016; Wang et al., 2023)—for instance, the LAD at two-thirds of the height of a maize plant could better reflect the moisture characteristics of the crop and soil (Wang et al., 2006), while in sorghum, the three leaves from the top of the plant were found most suitable for leaf temperature monitoring (Wang et al., 2019). They underscore the critical importance of leaf position selection in plant water status diagnostics. As potato has complex pinnately compound leaves and inherent intra-plant variability, precise leaf positioning becomes particularly essential for accurate water assessment. The results that the L4 exhibited significantly higher correlation coefficients between LAD and irrigation levels compared to L1 and L8 (Table 4) suggest a heightened sensitivity of L4 LAD to irrigation. Furthermore, the significantly higher R2 values for L4 than for other leaf positions in modeling relationships between LAD and both PWC and SWC (Figures 4, 5), along with the strongest correlations between LAD and LRWC (Table 6), collectively indicate L4’s superior responsiveness to dynamic plant water status changes. Notably, intra-treatment variability analysis shows that L4 maintained a significantly lower coefficient of variation (CV) in LAD measurements compared to L1 and L8 under identical irrigation regimes (Table 5). This is likely attributed to L4 being the first fully expanded mature leaf with stable morphological structures and physiological functions, whereas L1 represents developing tissue and L8 undergoes senescence. Considering its dual advantages of reduced variability and enhanced sensitivity to water availability, L4 can be proposed as the optimal leaf position for assessing potato plant water status via LAD measurement.
4.3 Potential future research directions
Potato plants have a relatively shallow and sparse root system, leading to inefficient water uptake capabilities (Zarzyńska et al., 2017; Zinta et al., 2022). This characteristic makes precision irrigation techniques particularly crucial for potato cultivation. The findings of this study lay the solid foundation for the development of precision irrigation management in potato production, being of substantial agronomic significance. However, implementing LAD measurements to guide irrigation in potato production relies on establishing appropriate LAD-based irrigation indices. Since the LAD-obtained relative maximum yield varies among years due to the variation of weather conditions, it probably needs several years of data to determine the threshold value of LAD of L4 for a certain potato production region. Moreover, this study revealed that as irrigation levels increased, the extent of the LAD increase varied with the growth stage. Specifically, the increase was more pronounced during the later growth stages (Table 3). This finding strongly suggests that LAD-based irrigation indices should be customized according to different potato growth stages.
5 Conclusions
This study demonstrates that the LAD is a reliable indicator for monitoring the water status of potato plants, and the L4 (4th leaf from the apex) is identified as the optimal leaf position for assessing the water status due to:
1. Enhanced sensitivity: L4-LAD showed the highest responsiveness to irrigation gradients and dynamic change in plant water contents;
2. Reduced variability: Under uniform irrigation, L4-LAD exhibited significantly lower variability among individual plants.
In addition, a significant binomial regression relationship is identified between potato yield and LAD at each leaf position across all growth stages, showing a yield saturation effect in which exceeding a critical LAD value no longer results in higher potato yields. This provides threshold-based triggering of irrigation when LAD exceeds optimal ranges. Overall, the study lays a foundation for precision irrigation in potato production, enabling improved water use efficiency and sustainable potato production in a semi-arid region.
Data availability statement
The original contributions presented in the study are included in the article/supplementary material. Further inquiries can be directed to the corresponding authors.
Author contributions
PL: Writing – original draft, Writing – review & editing, Conceptualization, Data curation, Formal analysis, Investigation, Methodology, Software, Validation, Visualization. TG: Writing – original draft, Writing – review & editing, Conceptualization, Data curation, Formal analysis, Investigation, Methodology, Software, Validation, Visualization. MF: Writing – review & editing, Conceptualization, Data curation, Funding acquisition, Resources, Supervision. JG: Writing – review & editing, Formal analysis, Validation, Visualization. MW: Writing – review & editing, Data curation, Investigation, Validation. ZS: Writing – review & editing, Formal analysis, Investigation, Validation, Visualization. LJ: Writing – review & editing, Conceptualization, Funding acquisition, Resources, Supervision, Validation.
Funding
The author(s) declare financial support was received for the research and/or publication of this article. This work was supported by the National Natural Science Foundation of China (32360536), National Key R&D Program of China (2022YFD1900302-03), and Basic Scientific Research Funds for universities in Inner Mongolia (BR 22-13-01; BR 221031; BR 251041).
Conflict of interest
The authors declare that the research was conducted in the absence of any commercial or financial relationships that could be construed as a potential conflict of interest.
Generative AI statement
The author(s) declare that no Generative AI was used in the creation of this manuscript.
Any alternative text (alt text) provided alongside figures in this article has been generated by Frontiers with the support of artificial intelligence and reasonable efforts have been made to ensure accuracy, including review by the authors wherever possible. If you identify any issues, please contact us.
Publisher’s note
All claims expressed in this article are solely those of the authors and do not necessarily represent those of their affiliated organizations, or those of the publisher, the editors and the reviewers. Any product that may be evaluated in this article, or claim that may be made by its manufacturer, is not guaranteed or endorsed by the publisher.
References
Akkamis, M. and Caliskan, S. (2023). Responses of yield, quality and water use efficiency of potato grown under different drip irrigation and nitrogen levels. Sci. Rep. 13, 9911. doi: 10.1038/s41598-023-36934-3
Clawson, K. L. and Blad, B. L. (1982). Infrared thermometry for scheduling irrigation of corn1. Agron. J. 74, 311–316. doi: 10.2134/agronj1982.00021962007400020013x
Dominic, H., Antreas, K., David, N., John, H., and Luke, B. (2024). Investigating the utility of potato (Solanum tuberosum L.) canopy temperature and leaf greenness responses to water-restriction for the improvement of irrigation management. Agric. Water Manage. 303, 109063. doi: 10.1016/j.agwat.2024.109063
Fan, M. (2019). Physiology of potato mineral nutrition and nutrient management (Beijing: Chinese Agriculture Press).
Gardner, B., Blad, B. L., Garrity, D., and Watts, D. (1981). Relationships between crop temperature, grain yield, evapotranspiration and phenological development in two hybrids of moisture stressed sorghum. Irrig. Sci. 2, 213–224. doi: 10.1007/BF00258375
Gates, D. M. (1968). Transpiration and leaf temperature. Ann. Rev. Plant Physiol. 19, 211–238. doi: 10.1146/annurev.pp.19.060168.001
Grant, O. M., Ochagavía, H., Baluja, J., Diago, M. P., and Tardáguila, J. (2016). Thermal imaging to detect spatial and temporal variation in the water status of grapevine (Vitis vinifera L.). J. Hortic. Sci. Biotech. 91, 43–54. doi: 10.1080/14620316.2015.1110991
Hiler, E. A. and Clark, R. N. (1971). Stress day index to characterize effects of water stress on crop yields. T ASABE 14, 757–761. doi: 10.13031/2013.38384
Hill, D., Nelson, D., Hammond, J., and Bell, L. (2021). Morphophysiology of potato (Solanum tuberosum L.) in response to drought stress: paving the way forward. Front. Plant Sci. 11. doi: 10.3389/fpls.2020.597554
Idso, S. B., Jackson, R. D., Pinter, P. J., Jr., Reginato, R. J., and Hatfield, J. L. (1981). Normalizing the stress-degree-day parameter for environmental variability. Agric. Meteorol. 24, 45–55. doi: 10.1016/0002-1571(81)90032-7
Idso, S. B., Jackson, R. D., and Reginato, R. J. (1977). Remote-Sensing of Crop Yields: Canopy temperature and albedo measurements have been quantitatively correlated with final harvests of wheat. Science 196, 19–25. doi: 10.1126/science.196.4285.19
Ihuoma, S. O. and Madramootoo, C. A. (2017). Recent advances in crop water stress detection. Comput. Electron Agr. 141, 267–275. doi: 10.1016/j.compag.2017.07.026
Jackson, R. D., Reginato, R. J., and Idso, S. B. (1977). Wheat canopy temperature: A practical tool for evaluating water requirements. Water Resour. Res. 13, 651–656. doi: 10.1029/WR013i003p00651
Kumari, A., Singh, D. K., Sarangi, A., Murtaza, H., and Kumar, S. V. (2024). Optimizing wheat supplementary irrigation: Integrating soil stress and crop water stress index for smart scheduling. Agric. Water Manage. 305, 109104. doi: 10.1016/j.agwat.2024.109104
Luan, Y., Xu, J., Lv, Y., Liu, X., Wang, H., and Liu, S. (2021). Improving the performance in crop water deficit diagnosis with canopy temperature spatial distribution information measured by thermal imaging. Agric. Water Manage. 246, 106699. doi: 10.1016/j.agwat.2020.106699
Men, F. Y. and Chen, S. D. (1986). Potato water requirements. Ningxia Agric. For. Sci. Technol. 2, 50–51.
Morales-Santos, A. and Nolz, R. (2023). Assessment of canopy temperature-based water stress indices for irrigated and rainfed soybeans under subhumid conditions. Agric. Water Manage. 279, 108214. doi: 10.1016/j.agwat.2023.108214
Torres, I., Sánchez, M.-T., Benlloch-González, M., and Pérez-Marín, D. (2019). Irrigation decision support based on leaf relative water content determination in olive grove using near infrared spectroscopy. Biosyst. Eng. 180, 50–58. doi: 10.1016/j.biosystemseng.2019.01.016
Wang, C. Z., Yu, Z. R., Sun, D. F., Liu, Y., and Liu, Y. H. (2006). Analysis on the factors affecting summer maize canopy-air temperature difference. Chin. J. Soil Sci. 37, 651–658. doi: 10.19336/j.cnki.trtb.2006.04.007
Wang, L., Miao, Y., Han, Y., Li, H., Zhang, M., and Peng, C. (2023). Extraction of 3D distribution of potato plant CWSI based on thermal infrared image and binocular stereovision system. Front. Plant Sci. 13. doi: 10.3389/fpls.2022.1104390
Wang, W., Zhang, R., Zhou, Y., Yue, Z., Chen, X., Cao, X., et al. (2019). The leaf-air temperature difference reflects the variation in water status and photosynthesis of sorghum under waterlogged conditions. PloS One 14, e0219209. doi: 10.1371/journal.pone.0219209
Yang, Y. D., Duan, D. D., Ju, Z. H., Du, T., Luo, Q. Y., and Zhang, Q. (2022). Optimization analysis of China’s potato spatial layout at county level based on FAO-GAEZ model. Geogr. Res. 41, 3352–3363. doi: 10.11821/dlyj020211125
Zarzyńska, K., Boguszewska-Mańkowska, D., and Nosalewicz, A. (2017). Differences in size and architecture of the potato cultivars root system and their tolerance to drought stress. Plant Soil Environ. 63, 159–164. doi: 10.17221/4/2017-PSE
Zhang, L. W., Zhang, Z. J., Liu, H. J., Liu, Y., Zhu, M. C., and Ding, M. (2017). Research on water deficit diagnosis of maize based on canopy temperature. Agric. Res. Arid Areas. 35, 94–98. doi: 10.7606/j.issn.1000-7601.2017.03.15
Zhang, L., Zhang, H., Zhu, Q., and Niu, Y. (2023). Further investigating the performance of crop water stress index for maize from baseline fluctuation, effects of environmental factors, and variation of critical value. Agric. Water Manage. 285, 108349. doi: 10.1016/j.agwat.2023.108349
Zhao, J., Zhan, X., Jiang, Y., and Xu, J. (2018). Variations in climatic suitability and planting regionalization for potato in northern China under climate change. PloS One 13, e0203538. doi: 10.1371/journal.pone.0203538
Zhao, J., Zhang, Y., Qian, Y., Pan, Z., Zhu, Y., Zhang, Y., et al. (2016). Coincidence of variation in potato yield and climate in northern China. Sci. Total Environ. 573, 965–973. doi: 10.1016/j.scitotenv.2016.08.195
Keywords: water stress, infrared thermometry, moisture diagnosis, leaf position, precision irrigation
Citation: Liu P, Guan T, Fan M, Guo J, Wang M, Shang Z and Jia L (2025) Leaf–air temperature difference as a reliable indicator for potato water status. Front. Plant Sci. 16:1609350. doi: 10.3389/fpls.2025.1609350
Received: 10 April 2025; Accepted: 25 July 2025;
Published: 01 September 2025.
Edited by:
Alberto Soares de Melo, State University of Paraíba, BrazilReviewed by:
Thounaojam Thorny Chanu, Assam Don Bosco University, IndiaAgda Malany Forte De Oliveira, State University of Paraíba, Brazil
Copyright © 2025 Liu, Guan, Fan, Guo, Wang, Shang and Jia. This is an open-access article distributed under the terms of the Creative Commons Attribution License (CC BY). The use, distribution or reproduction in other forums is permitted, provided the original author(s) and the copyright owner(s) are credited and that the original publication in this journal is cited, in accordance with accepted academic practice. No use, distribution or reproduction is permitted which does not comply with these terms.
*Correspondence: Mingshou Fan, Zm1zd2hAMTI2LmNvbQ==; Liguo Jia, bm5kamlhbGlndW9AMTYzLmNvbQ==
†These authors contributed equally to this work and share first authorship