 Yufan Jie1†
 Ai-Min Wu
 Chunjie Fan
 Siwen Liu
- 1Guangdong Key Laboratory for Innovative Development and Utilization of Forest Plant Germplasm, College of Forestry and Landscape Architectures, South China Agricultural University, Guangzhou, China
- 2State Key Laboratory of Tree Genetics and Breeding, Key Laboratory of State Forestry and Grassland Administration on Tropical Forestry, Research Institute of Tropical Forestry, Chinese Academy of Forestry, Guangzhou, China
- 3Guangdong Provincial Key Laboratory of Utilization and Conservation of Food and Medicinal Resources in Northern Region, Shaoguan University, Shaoguan, China
Introduction: The Glycosyltransferase 8 (GT8) family is critically involved in plant cell wall synthesis, yet exhibits significant functional divergence among its members. Despite its importance, systematic characterization of GT8 genes in woody plants remains limited. This study aims to comprehensively analyze the GT8 gene family in Eucalyptus grandis to elucidate its role in cell wall biosynthesis.
Methods: We employed bioinformatics tools to mine the E. grandis whole-genome database. A systematic analysis was conducted, including phylogenetic classification, assessment of physicochemical properties, subcellular localization prediction, gene structure annotation, chromosome mapping, and cis-acting element identification in promoter regions.
Results: Fifty-two GT8 family members were identified and classified into four subfamilies: GAUT, GATL, GolS, and PGSIP. Protein molecular weights ranged from 15.75 to 185.00 kD (mean: 49.08 kD). Genes were dispersed across all chromosomes except chromosomes 3 and 7. Promoter analysis revealed ubiquitous hormone-responsive cis-elements and prevalent light-responsive elements. Phylogenetic inference suggested that EgGUX02 and EgGUX04 may mediate glucuronic acid (GlcA) incorporation into xylan side chains, while EgGAUT1 and EgGAUT12 are likely direct contributors to xylan and pectin biosynthesis.
Discussion: This study provides the first genome-wide functional annotation of the GT8 family in E. grandis, revealing subfamily-specific roles in cell wall polymer synthesis. The enrichment of stress- and hormone-responsive promoter elements implies regulatory complexity in cell wall remodeling. Our findings establish a foundation for targeted manipulation of xylan and pectin biosynthesis in woody plants, with potential applications in biomass engineering.
1 Introduction
The cell wall is a unique external protective structure in plant cells, providing mechanical support, maintaining normal metabolic functions, and facilitating responses to environmental stress. It is essential for plant growth and development (Gigli-Bisceglia et al., 2020) As such, the cell wall is closely connected to physiological processes such as absorption, transpiration, transport, and secretion. Plant cell walls are typically comprised of the middle lamella, primary wall, and secondary wall, with primary components including cellulose, hemicellulose, lignin, and pectin (Kubicek et al., 2014).
Pectin, cellulose, and hemicellulose make up the majority of the primary wall. Cellulose is interconnected by hydrogen bonds, providing structural strength and support to the cell wall. Xylan, the predominant hemicellulose in plant cell walls, consists of a β- (1→4)-linked D-xylose backbone with L-arabinose and 4-O-methyl-glucuronic acid side chains (Zabotina, 2012). It mediates interactions between the pectin/lignin matrix and cellulose microfibrils, affecting wall flexibility biomass recalcitrance (Kang et al., 2019; Zhong et al., 2019; Yu et al., 2022). The three types of pectin-homogalacturonan (HG), rhamnogalacturonan I (RG-I), and rhamnogalacturonan II (RG-II)-are structurally complex polysaccharides found in plant cell walls made up of α-D-galacturonic acid residues connected by 1,4-bonds. The most prevalent sugar residue in all plant primary walls is galacturonic acid (GalA) (Ridley et al., 2001). In plant cell walls, HG, a polymer of α-1,4-linked D-galacturonic acid, makes up more than 60% of the pectin (Caffall and Mohnen, 2009). Pectin regulates the cell wall’s porosity, contributing to its plasticity and permeability (Mohnen, 2008). These carbohydrates play critical roles in the composition and metabolism of plant cell walls.
Glycosyltransferases (GTs) are enzymes that transfer sugar moieties from active donor molecules to specific acceptor molecules, thereby catalyzing the creation of glycosidic connections. The manufacture of disaccharides, oligosaccharides, and polysaccharides is facilitated by these enzymes (Sinnott, 1990; Lairson et al., 2008). Glycosyltransferases were categorized into 138 families as of March 2025 based on sequence similarity and substrate recognition (http://www.cazy.org/GlycosylTransferases.html). Among these, the GT8 family has a vital part in plant cell wall production and abiotic stress response (Wang et al., 2024). Evolutionary analysis has classified GT8 into seven subfamilies: Galacturonic acid transferases (GAUT), Galacturonic acid transferase-like transferases (GATL), GATL-related (GATR), Galactinol synthases (GolS), and Plant glycogen starch synthesis initiation protein A (PGSIP-A), PGSIP-B, and PGSIP-C (Yin et al., 2010; Kong et al., 2019). The production of pectin and xylan is the main function of GAUT, GATL, and GATR, which also aid in cell wall remodeling (Sterling et al., 2006). PGSIP proteins are involved in initiating starch biosynthesis (Chatterjee et al., 2005), while GolS is a key enzyme in the synthesis of cotton oligosaccharides, playing a role in plant abiotic stress responses (Taji et al., 2002). In Arabidopsis thaliana, the GT8 gene family comprises 41 proteins categorized into four major subfamilies: GAUT, GATL, GolS, and PGSIP (Yin et al., 2010). Among these, QUASIMODO1 (QUA1) and GALACTURONOSYL TRANSFERASE1 (GAUT1) have been shown to be involved in pectin biosynthesis (Bouton et al., 2002). In particular, QUA1 is expressed in vascular tissues and influences the activity of β-1→4-D-xylan synthase and α-1→4-D-galacturonic acid transferase, which are involved in the synthesis of pectin and hemicellulose (Orfila et al., 2005). GAUT1 encodes a galacturonic acid polysaccharide glycosyltransferase directly involved in pectin synthesis, and alterations in its function significantly affect plant cell wall composition and function (Caffall and Mohnen, 2009). AtGATL1/PARVUS was initially thought to play a role in pectin synthesis (Bouton et al., 2002), However, further studies revealed that the PARVUS gene, which is essential for xylan biosynthesis, is expressed in cells undergoing secondary wall thickening. Its loss of function leads to reduced mechanical strength of the plant cell wall (Lee et al., 2007). AtGAUT12/IRX8 (IRREGULAR XYLEM 8) is also crucial for xylan synthesis. Both PARVUS and IRX8 contribute to the synthesis of tetramer-saccharides at xylan’s reducing end (Brown et al., 2007; Peña et al., 2007), and A. thaliana irx8 mutants exhibit reduced xylan and lignin content, along with partial reductions in pectin and cellulose (Persson et al., 2007). Additionally, GUX1and GUX2 are involved in xylan side chain synthesis, particularly by adding GlcA to the xylan backbone (Rennie et al., 2012). In Populus deltoides, PdGATL1.1 and PdGATL1.2 are the closest orthologs of the A. thaliana gene PARVUS and function in xylan biosynthesis (Suo et al., 2022). RNAi-mediated knockdown of GAUT12.1 in Populus reduced xylan and pectin content during wood formation, along with decreased biomass recalcitrance. Given the conserved role of GAUT12 in A. thaliana, these results suggest that GAUT12.1 similarly plays a key role in pectin and xylan biosynthesis in Populus (Biswal et al., 2015; Biswal et al., 2018). These genes are vital for plant cell wall construction and mechanical support. For a deeper comprehension of the dynamic process of woody plant cell wall formation, it is imperative to investigate the functional partitioning and evolution of the GT8 gene family.Eucalyptus (Eucalyptus robusta Smith), a species from the Myrtaceae family, is known for rapid growth, strong adaptability, high economic value and diverse uses. It is one of the three major fast-growing tree species in artificial afforestation, alongside poplar and pine (Kirch et al., 2011). With a short growth cycle, rapid regeneration, and strong soil nutrient dependency, Eucalyptus is a key species in southern artificial forests and a critical species for timber reserves (Melesse and Zewotir, 2017). The GT8 glycosyltransferase family has been studied in various species. GT8 family member numbers vary across species: 41 in A. thaliana (Yin et al., 2010), 40 in Oryza sativa (Kong et al., 2019), 40 in Solanum lycopersicum and 56 in Malus domestica members (Wang et al., 2024). However, research on the GT8 family in E. grandis remains limited. This study identifies the GT8 gene family in E. grandis based on bioinformatics analysis. We analyzed various features including physicochemical properties, phylogenetic trees, gene structures, conserved motifs, chromosome locations, and synteny relationships using multiple bioinformatics tools: TBtools-II (v1.120), MEGA11 (v13.0), and Jalview (v2.11.2.6), along with other online platforms. These analyses provide a foundation for further exploring the functional roles of GT8 genes in E. grandis.
2 Materials and methods
2.1 Gene family member identification and physicochemical property analysis
Gene sequences for the GT8 gene family members from E. grandis (Myburg et al., 2014) and A. thaliana were retrieved from the Phytozome database (https://phytozome-next.jgi.doe.gov/) and the TAIR database (http://www.arabidopsis.org) (Berardini et al., 2015), respectively. The genomic sequences were then converted to protein sequences using TBtools-II (Chen et al., 2023). Comparative alignment of E. grandis and A. thaliana GT8 protein sequences via TBtools-II’s “Blast Compare Two Seqs” identified 52 GT8 family members. An E-value threshold of e-5 was used for sequence alignment. The ProtParam tool on the Expasy database was used to assess the physicochemical characteristics of the E. grandis GT8 family members, including their molecular weight, isoelectric point, and number of amino acids (https://www.expasy.org/) (Artimo et al., 2012). The WoLFPSORT program was employed to predict the EgGT8 proteins’ subcellular location (https://www.genscript.com/wolf-psort.html) (Horton et al., 2007).
2.2 Gene structure, conserved motif and conserved structural domains analysis
The MEME online tool (http://meme-suite.org) was used to predict the conserved motifs for all EgGT8 gene family members (Bailey et al., 2009). The number of motifs was set to 10, while all other parameters were kept at their default settings. The structural information of the EgGT8 genes was combined with the conserved motif analysis results. The data were visualized using the TBtools-II software, generating the structural and conserved motif analysis results for the E. grandis GT8 gene family. Furthermore, the Batch CDD NCI tool (https://www.ncbi.nlm.nih.gov/Structure/bwrpsb/bwrpsb.cgi) and TBtools-II were used to identify conserved gene domains within the E. grandis GT8 family members.
2.3 Gene family chromosomal distribution and synteny analysis
Chromosomal localization of the 52 E. grandis GT8 genes was performed using TBtools-II. The “Gene Location Visualize from GTF/GFF” tool in TBtools-II was employed to map the positions of the identified genes on the chromosomes. Subsequently, in the “Gene Density Profile” module of TBtools-II, the “Bin Size” was set to 100,000, with all other parameters kept at their default values. The gene sequence and annotation files of E. grandis, A. thaliana, and P. alba were imported into the “One Step MCScanX” tool in TBtools-II for synteny analysis. The syntenic relationships were visualized using the “Dual Synteny Plot.” Subsequently, “One Step MCScanX” was used to compare all genes within the E. grandis genome, and the results were visualized with “Advanced Circos” to display the intra-species synteny. When using the “One Step MCScanX” module, the value for CPU for BlastP was set to 2, the E-value was set to e−10, and the number of BlastHits was set to 5.
2.4 Phylogenetic and structural classification of gene family members
Gene sequence files for Selaginella moellendorffii and Marchantia polymorpha were retrieved from NCBI (https://www.ncbi.nlm.nih.gov/), and gene sequences for P. alba were obtained from the Chinese Academy of Forestry website (Liu et al., 2019). The homologous protein files for these species were generated using TBtools- II. Sequence alignment was performed utilizing MUSCLE in MEGA11.0 (Tamura et al., 2021), followed by phylogenetic tree construction using the Neighbor-Joining algorithm (NJ), with other parameters left at their default values and the bootstrap mechanism set to 1000 iterations. The resulting phylogenetic tree file was saved and structural classification was conducted using the iTOL tool (https://itol.embl.de/) (Letunic and Bork, 2024).
2.5 Cis-acting element analysis of gene family members
The 2000 bp sequence upstream of each EgGT8 genes was extracted from the E. grandis genome data as the promoter region. The online tool PlantCARE (http://bioinformatics.psb.ugent.be/webtools/plantcare/) (Lescot et al., 2002) was used to predict the cis-acting elements present in these promoter regions. The results were visualized using TBtools-II.
2.6 Expression pattern analysis of gene family members in different tissues and under various stress conditions
To investigate the expression patterns of GT8 family genes across different tissues, we analyzed transcriptome data from our previous study. The plant materials and expression data of E. grandis GT8 family genes were obtained from the published article (Fan et al., 2024). Sampling and treatment times were conducted according to previously published literature (Jiang and Deyholos, 2006; Wang et al., 2021). The corresponding raw sequence data have been deposited in the Genome Sequence Archive (GSA) at the National Genomics Data Center under accession number PRJCA002468. For each biological replicate, we sampled at least three individual plants and performed three technical replicates per data point. Tissue separation was achieved through manual dissection: fresh stem segments were longitudinally sectioned to expose the epidermis, followed by careful removal of the outer phloem layer using fine forceps. The inner xylem tissue was subsequently collected by precision scraping. Expression patterns were visualized using TBtools-II (v1.120), where log2-transformed data underwent hierarchical clustering (Euclidean distance, complete linkage) to generate comparative heatmaps across tissue types and stress conditions. This transformation enhanced the visualization of differential expression patterns.
2.7 3D Structure analysis of E. grandis GT8 family members
The 3D structures of EgGT8 family proteins were modeled using the SWISS-MODEL online tool (https://swissmodel.expasy.org/) through homology modeling (Waterhouse et al., 2018).
3 Results
3.1 Identification of GT8 gene family members and physicochemical property analysis in E. grandis
Through bioinformatics research, 52 GT8 gene family members were identified in the genome of E. grandis (Table 1). The E. grandis GT8 gene family members were named based on their subfamily classification and phylogenetic relationships to A. thaliana GT8 genes. The nomenclature of the GUX subfamily was based on previously published literature (Li et al., 2024). Physicochemical characterization of the proteins demonstrated that EgGT8 family members exhibit amino acid lengths ranging from 134 to 1637 residues. EgGATL4D had the highest number of amino acids (1637), while EgGATL4C had the fewest (134). The average molecular weight of the proteins was 49.08 kD, with a range of 15.75 to 185.00 kD. With an average pI of 7.0, the isoelectric points varied from 4.89 to 9.51. Among them, 22 proteins (42.31%) had a pI greater than 7. The average instability index was 41.63, and members of this gene family are relatively unstable, as seen by the 21 proteins (40.38%) with an instability score below 40. The protein indices ranged from 71.68 to 100.2, with an average of 85.53. Of these, 49 proteins (94.23%) showed an average hydrophilicity coefficient of less than 0, showing that majority of the proteins in this gene family are hydrophilic (Table 1). According to the protein localization prediction, the GT8 family members are mainly distributed in the endoplasmic reticulum and the Golgi apparatus (Table 1). A. thaliana possesses five pairs of chromosomes, while E. grandis has eleven. Moreover, the GT8 gene family in E. grandis (52 genes) is more numerous than in A. thaliana (41 genes), suggesting that E. grandis may have undergone whole-genome expansion during evolution. This expansion likely contributed to enhanced environmental adaptability through the retention of gene duplicates and subsequent functional divergence.
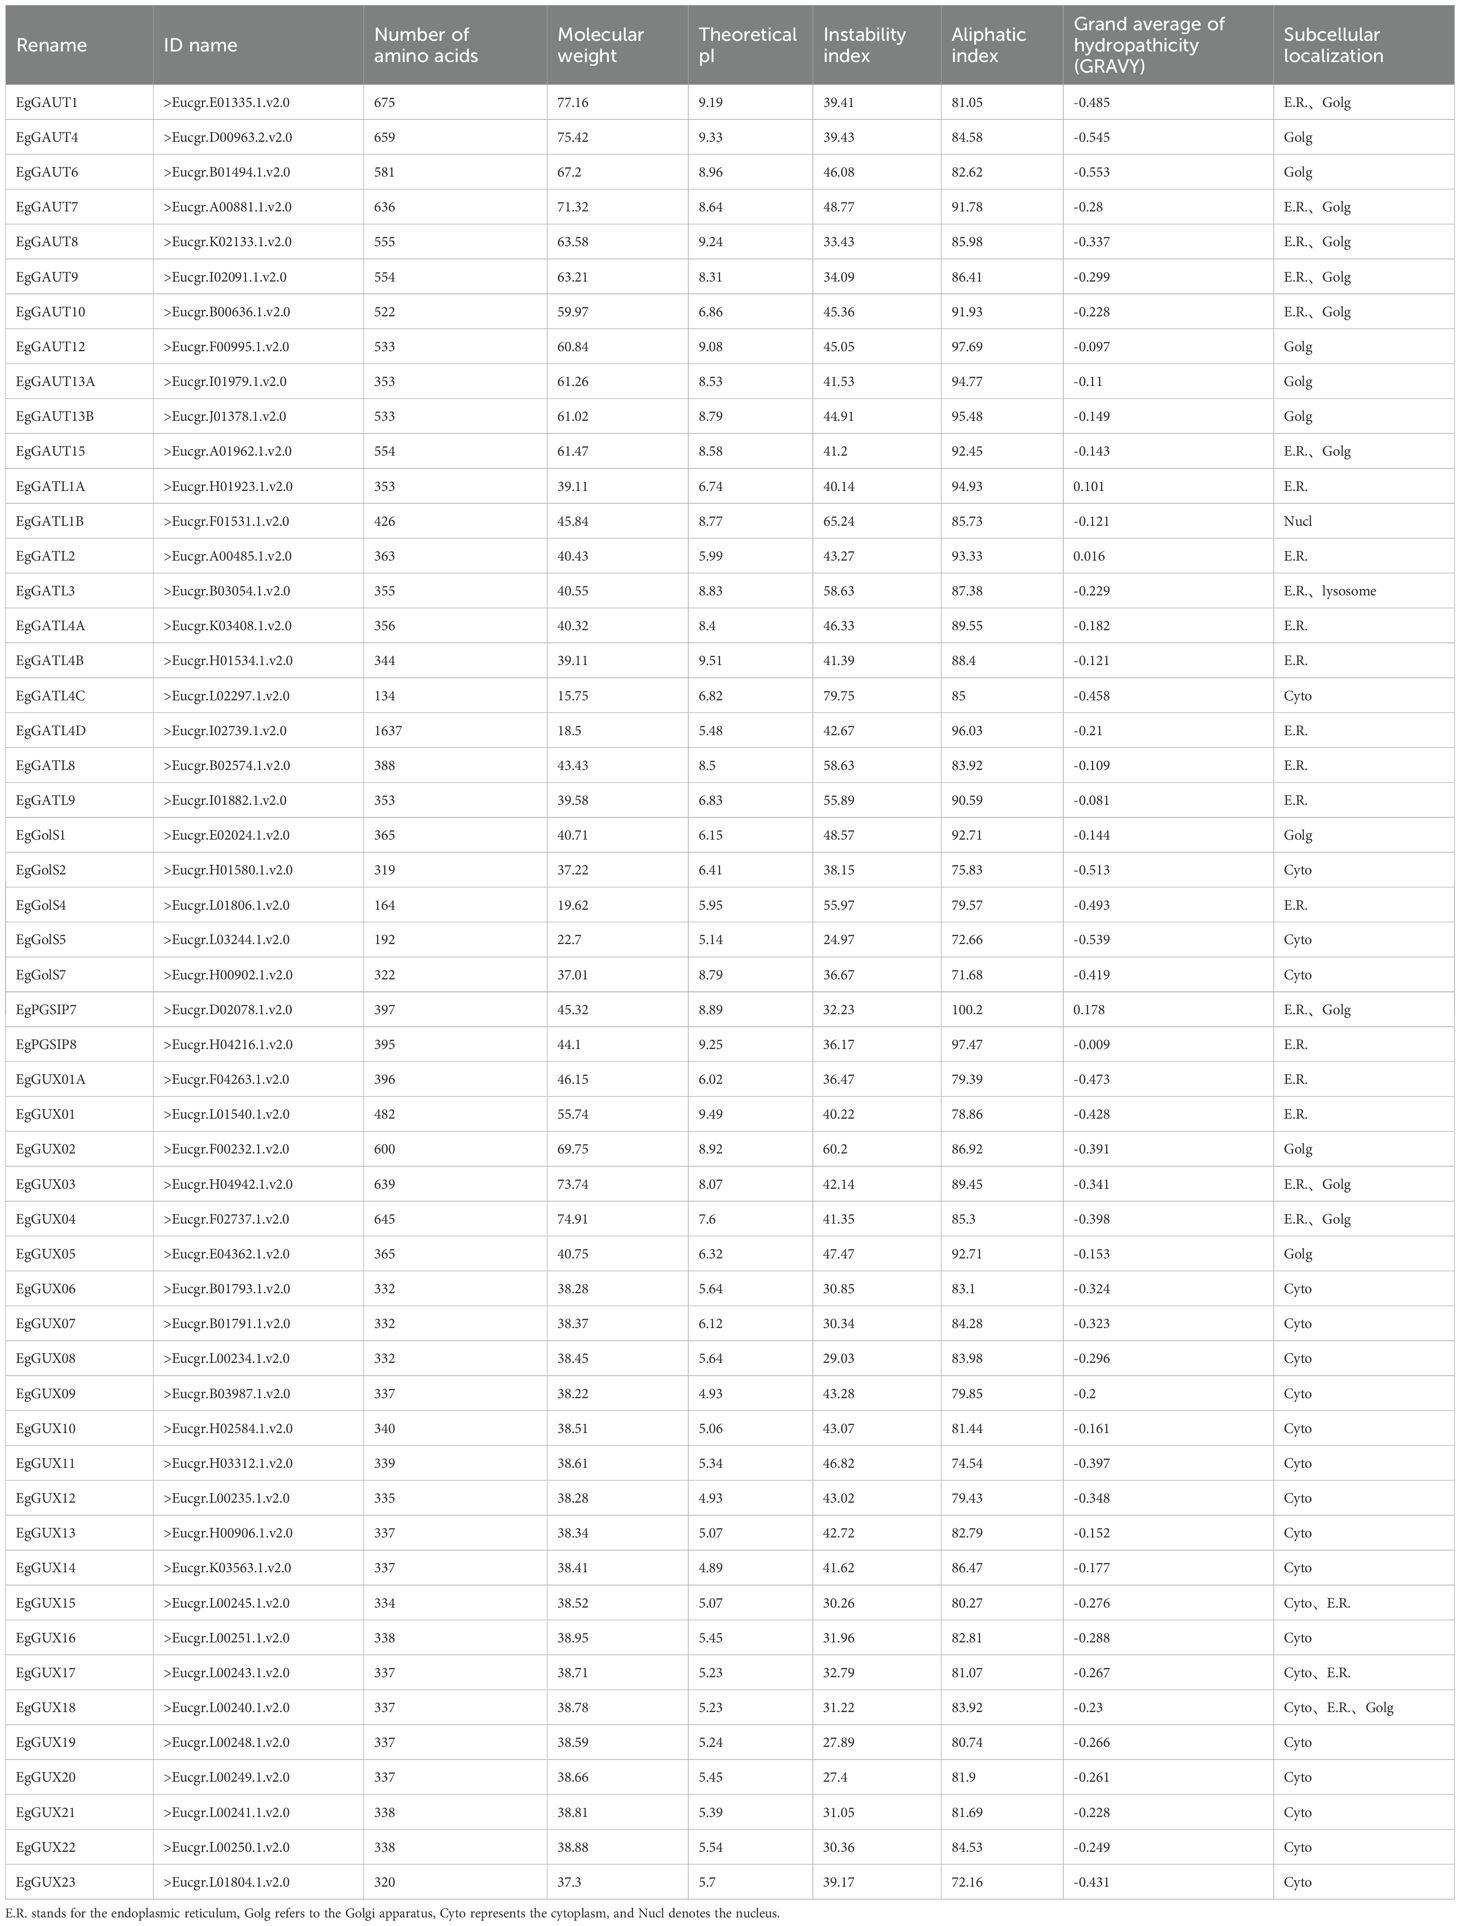
Table 1. The basic information of identified E. grandis GT8 genes family members.
3.2 The GT8 gene family members’ gene structure and conserved domains in E. grandis
Using the E. grandis gene annotation file, the gene structures of the EgGT8 family members were plotted (Figure 1). Ten motifs were identified in the EgGT8 family members, and based on the conserved protein motifs, four groups were created from the phylogenetic tree of the 52 EgGT8 members (Figure 1A). The domain architecture of Class I EgGT8 family members is relatively conserved, while Classes III and IV exhibit similar domain compositions. The conserved motif analysis (Figure 1B) showed that all gene members contained 1 to 7 motifs, with motif 3 being the most widespread, appearing in 34 family members (65.38%). It was evident that the C-terminus of the 52 GT8 genes typically contained relatively conserved domains. EgPGSIP7 and EgGATL4C only contained one conserved motif, suggesting that these genes may be incomplete or functionally impaired. Furthermore, there were differences in length, exon count, non-coding regions, and initiation sites among the different EgGT8 genes (Figure 1C). The conserved domains of the E. grandis GT8 family members were further analyzed with the aid of Batch CDD NCI (https://www.ncbi.nlm.nih.gov/Structure/bwrpsb/bwrpsb.cgi) and TBtools-II (Supplementary Figure 1).
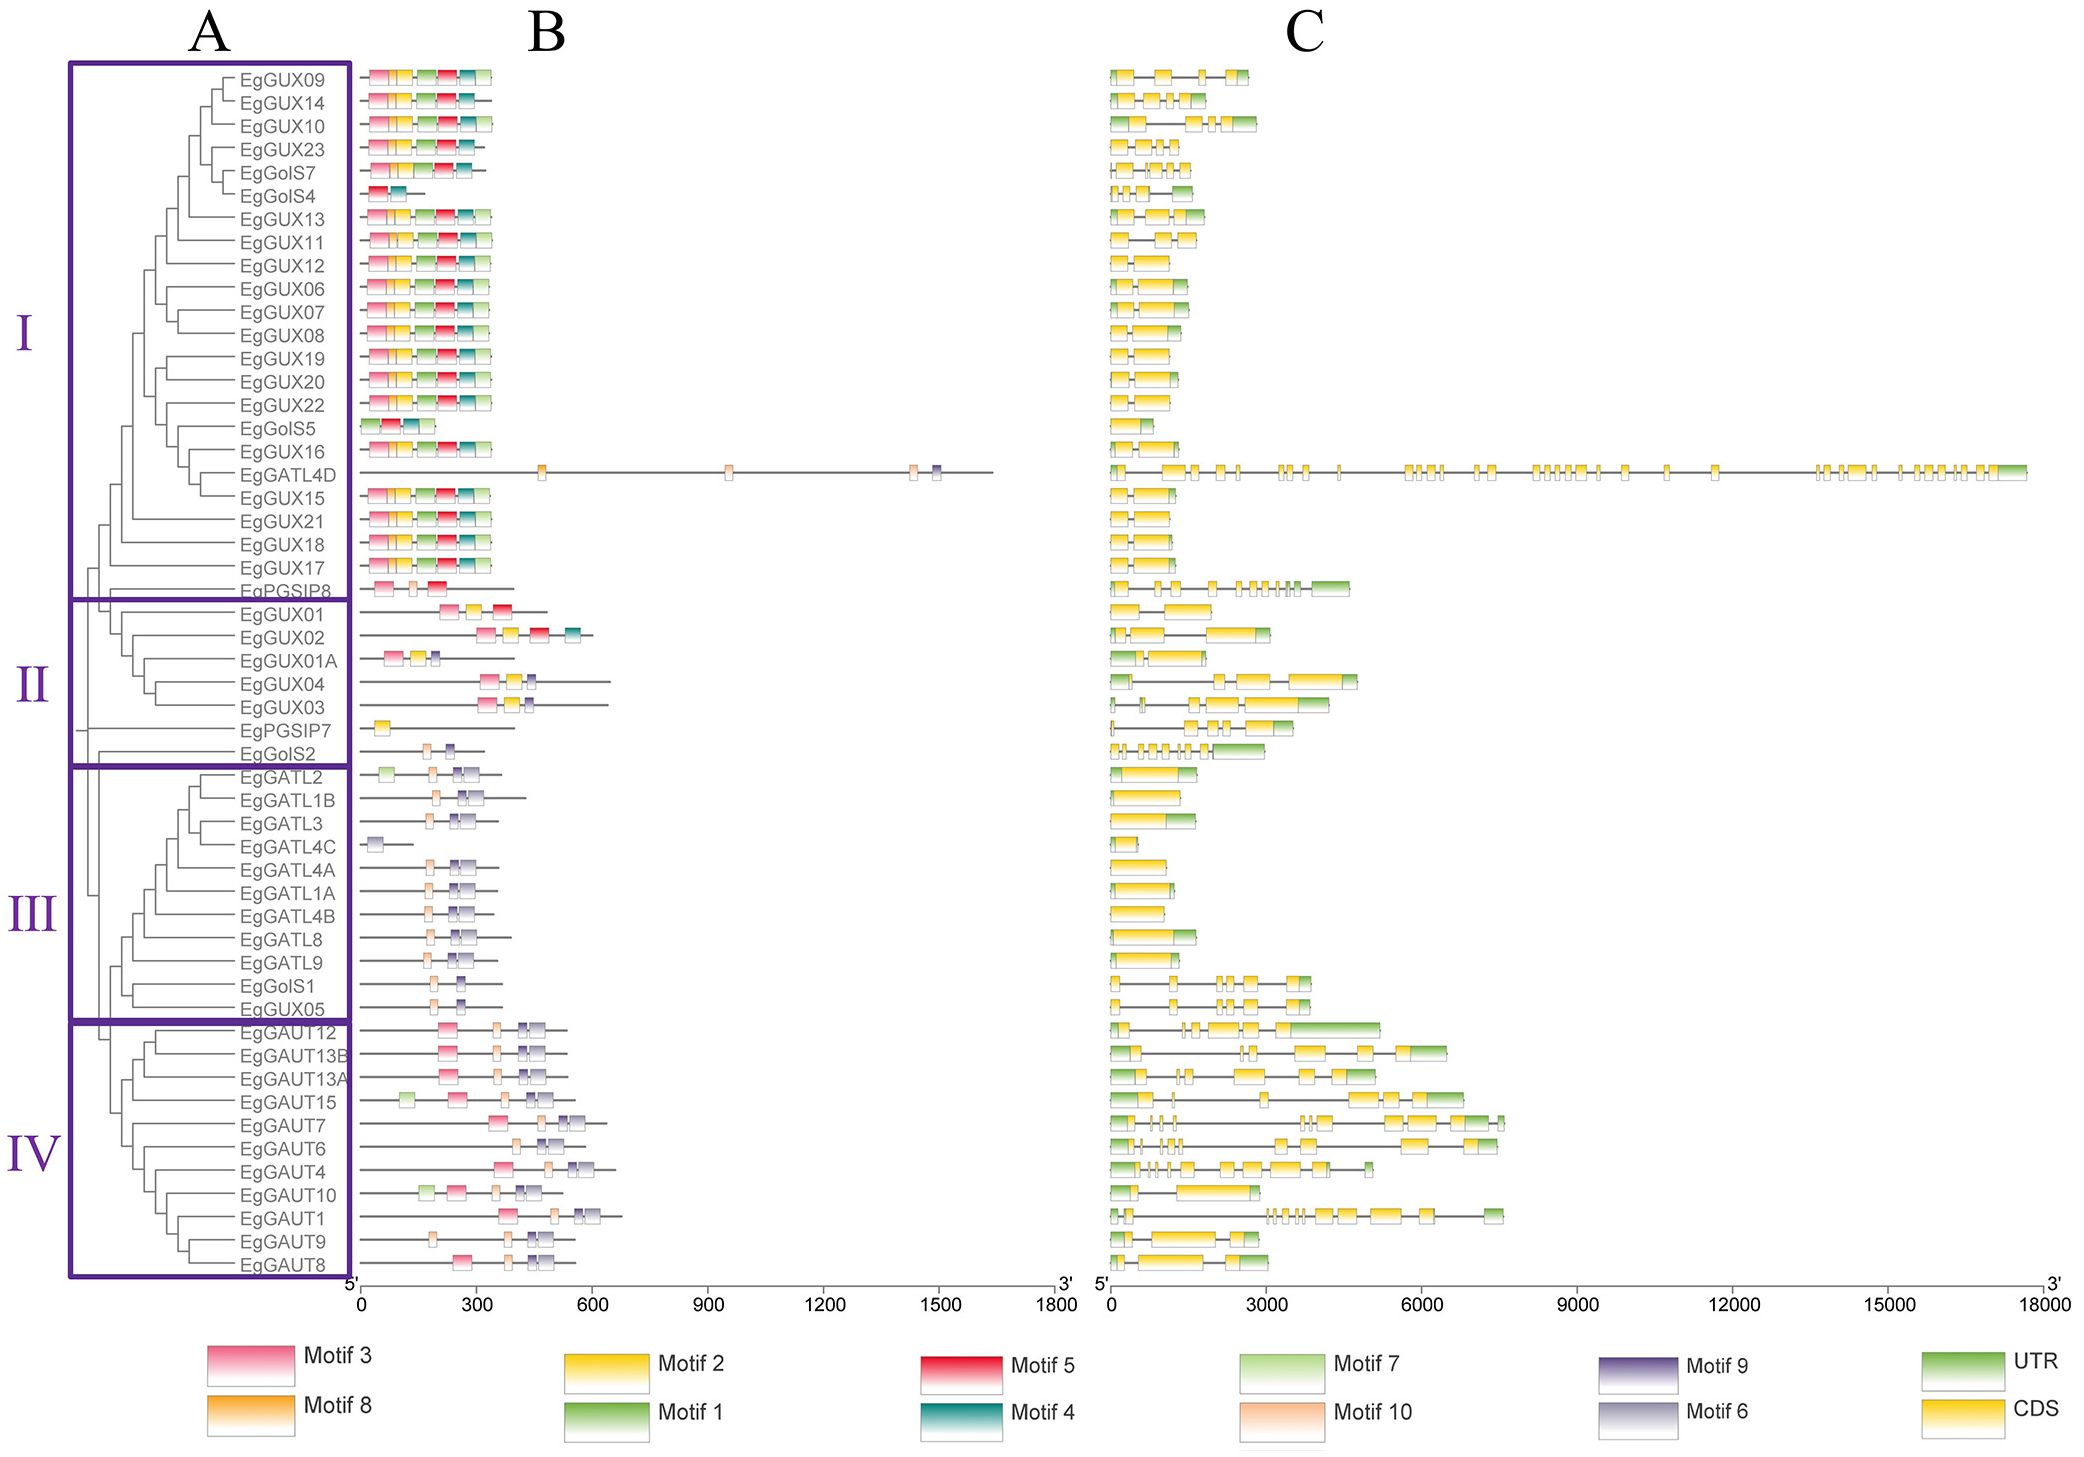
Figure 1. Analysis of EgGT8 family members' gene structure and conserved motif. (A) Phylogenetic tree of EgGT8 proteins using maximum likelihood methods, showing subfamily classifications. (B) Motif composition of EgGT8 proteins, represented in different colors for motifs 1 through 10. (C) Gene models of EgGT8, showing the positions of exons and introns in the gene structure. The relative positions are displayed based on the kilobase scale at the bottom of the figure.
3.3 Chromosomal distribution of the E. grandis GT8 gene family
Tandem duplication accounts for a sizable fraction of the genes in the genome of E. grandis (Myburg et al., 2014). The chromosomal distribution of EgGT8 genes was displayed using the gene annotation dataset of the E. grandis genome (Figure 2). It was discovered that there were no EgGT8 family genes on chromosomes 3 and 7, while the remaining nine chromosomes (chr01-chr02, chr04-chr06, chr08-chr11) harbored EgGT8 genes. Chromosomes 2 and 8 had the highest number of EgGT8 genes, while chromosome 10 had the fewest, with only one EgGT8 gene. On chromosome 2, GUX genes within the GT8 family appear in clusters. Such clustered gene arrangements might be the result of gene duplication events originating from a common ancestral gene, leading to multiple copies within the genome. The uneven distribution of GT8 family genes on chromosomes may be relevant to the replication and recombination of GT8 genes during the evolutionary process of E. grandis.
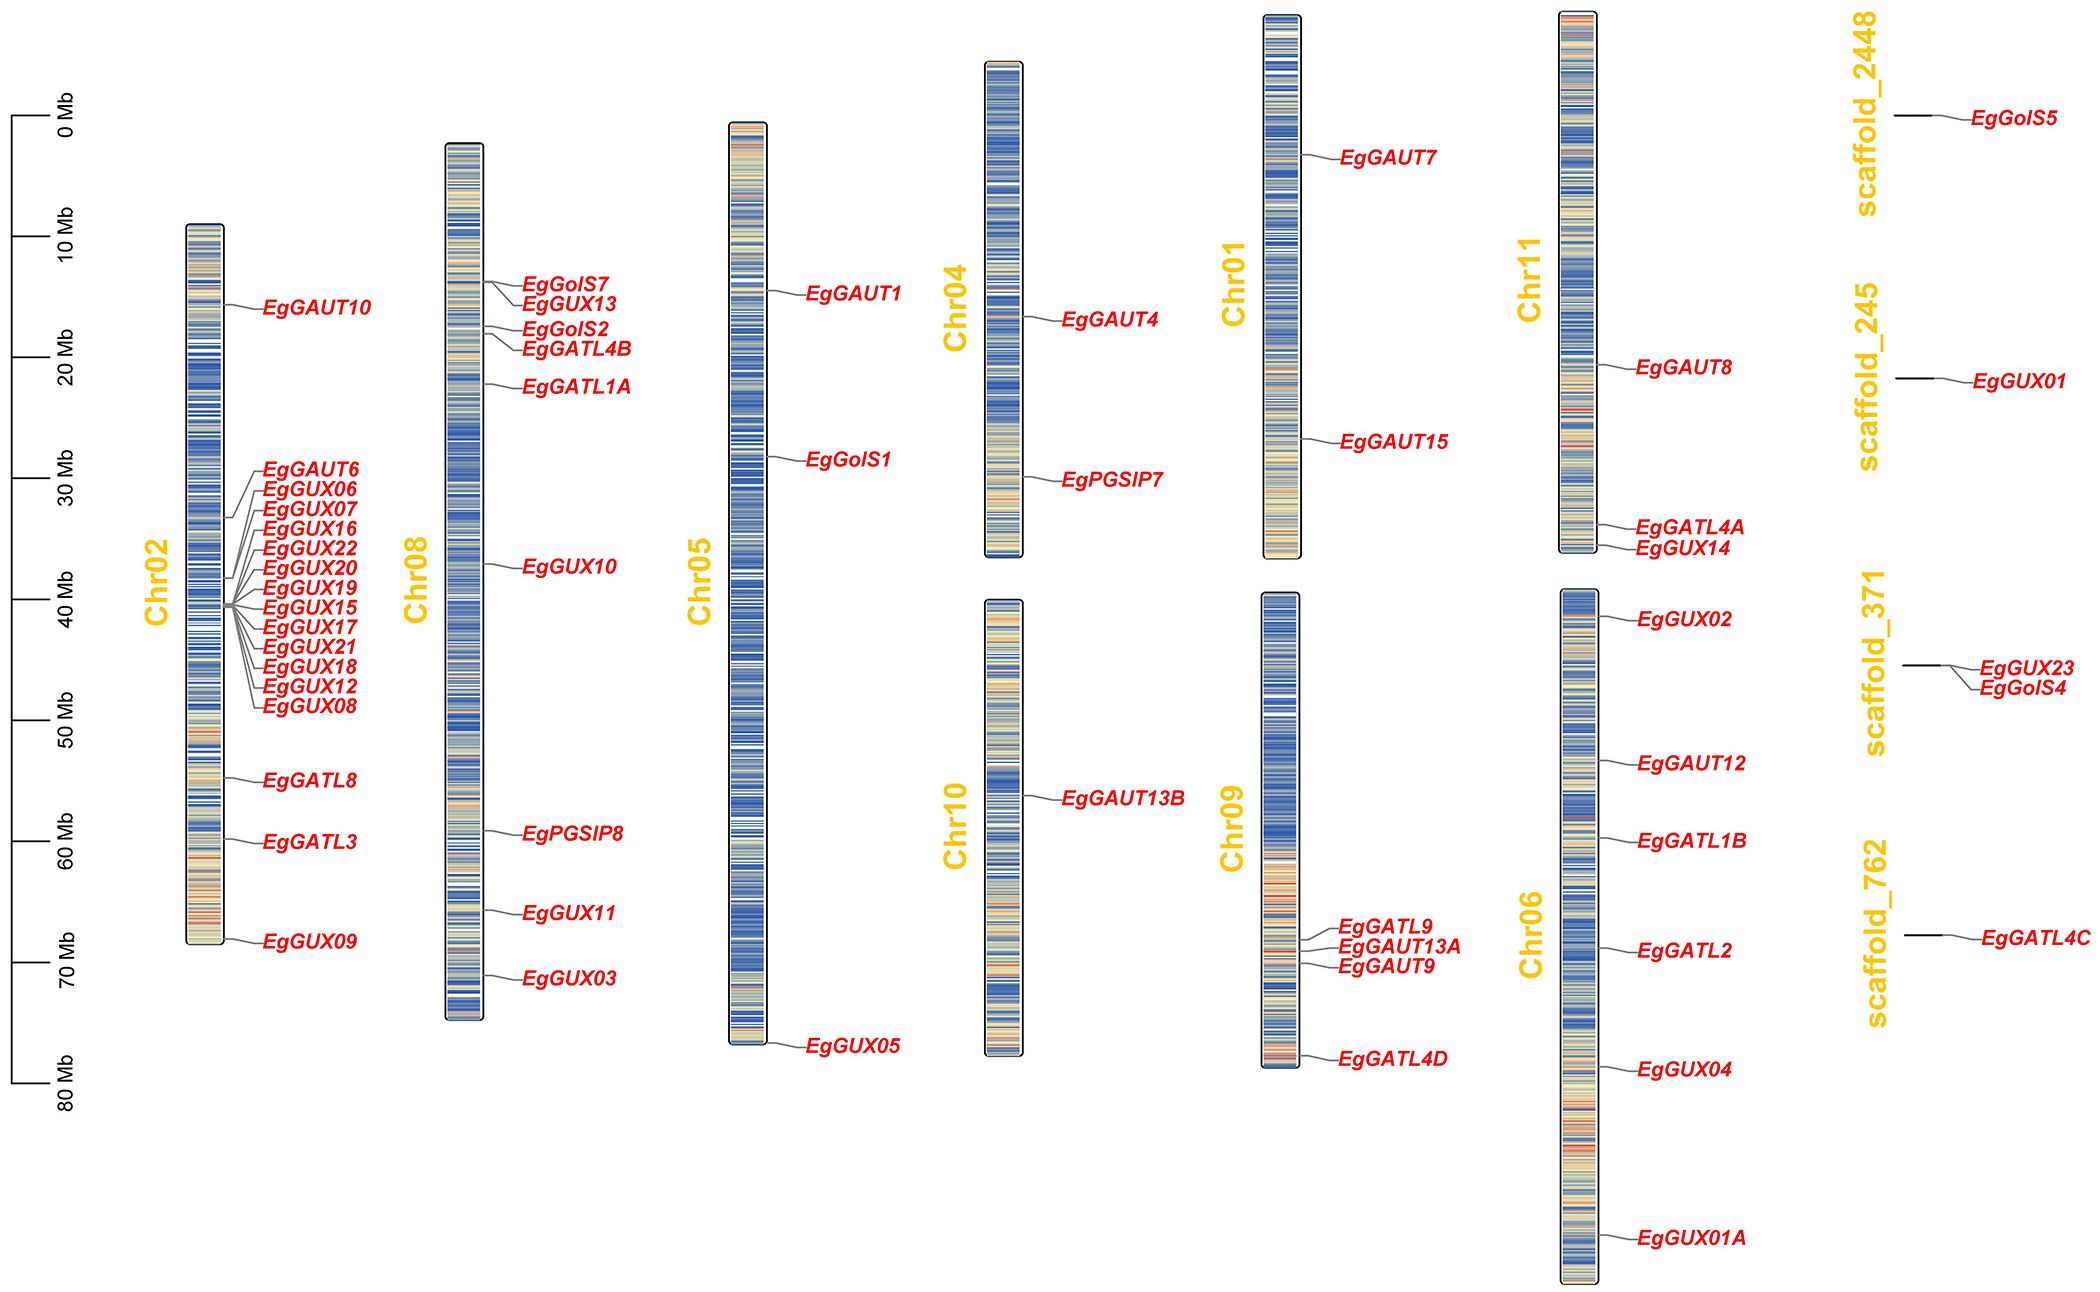
Figure 2. Chromosomal localization of the E. grandis GT8 gene family. The scale bar on the far left of the figure represents the length in megabases (Mb). The central long bars depict the chromosomes, where red regions show areas of high gene density, while blue regions show areas of low gene density. The short lines on the right side represent sequences of unknown location that have not yet been integrated into the chromosomes. The yellow text on the left of each chromosome indicates the chromosome number, while the red text on the right denotes the gene names. Each gene name is linked by a line to its specific position on the chromosome.
3.4 Analysis of the GT8 gene family’s synteny within and across species in E. grandis
Three main evolutionary forces are thought to be tandem gene duplication, segmental duplication, and whole-genome duplication (Panchy et al., 2016). To explore the whole-genome duplication of EgGT8 genes, an intra-species synteny analysis of the E. grandis GT8 gene family was conducted (Figure 3A). The finding showed that the GT8 gene family in E. grandis underwent relatively low-frequency self-duplication, with only four pairs of tandem and segmental duplications: EgGATL4B and EgGolS2, EgGUX13 and EgGUX14, EgGATL2 and EgGATL1B, EgGUX05 and EgGolS1.
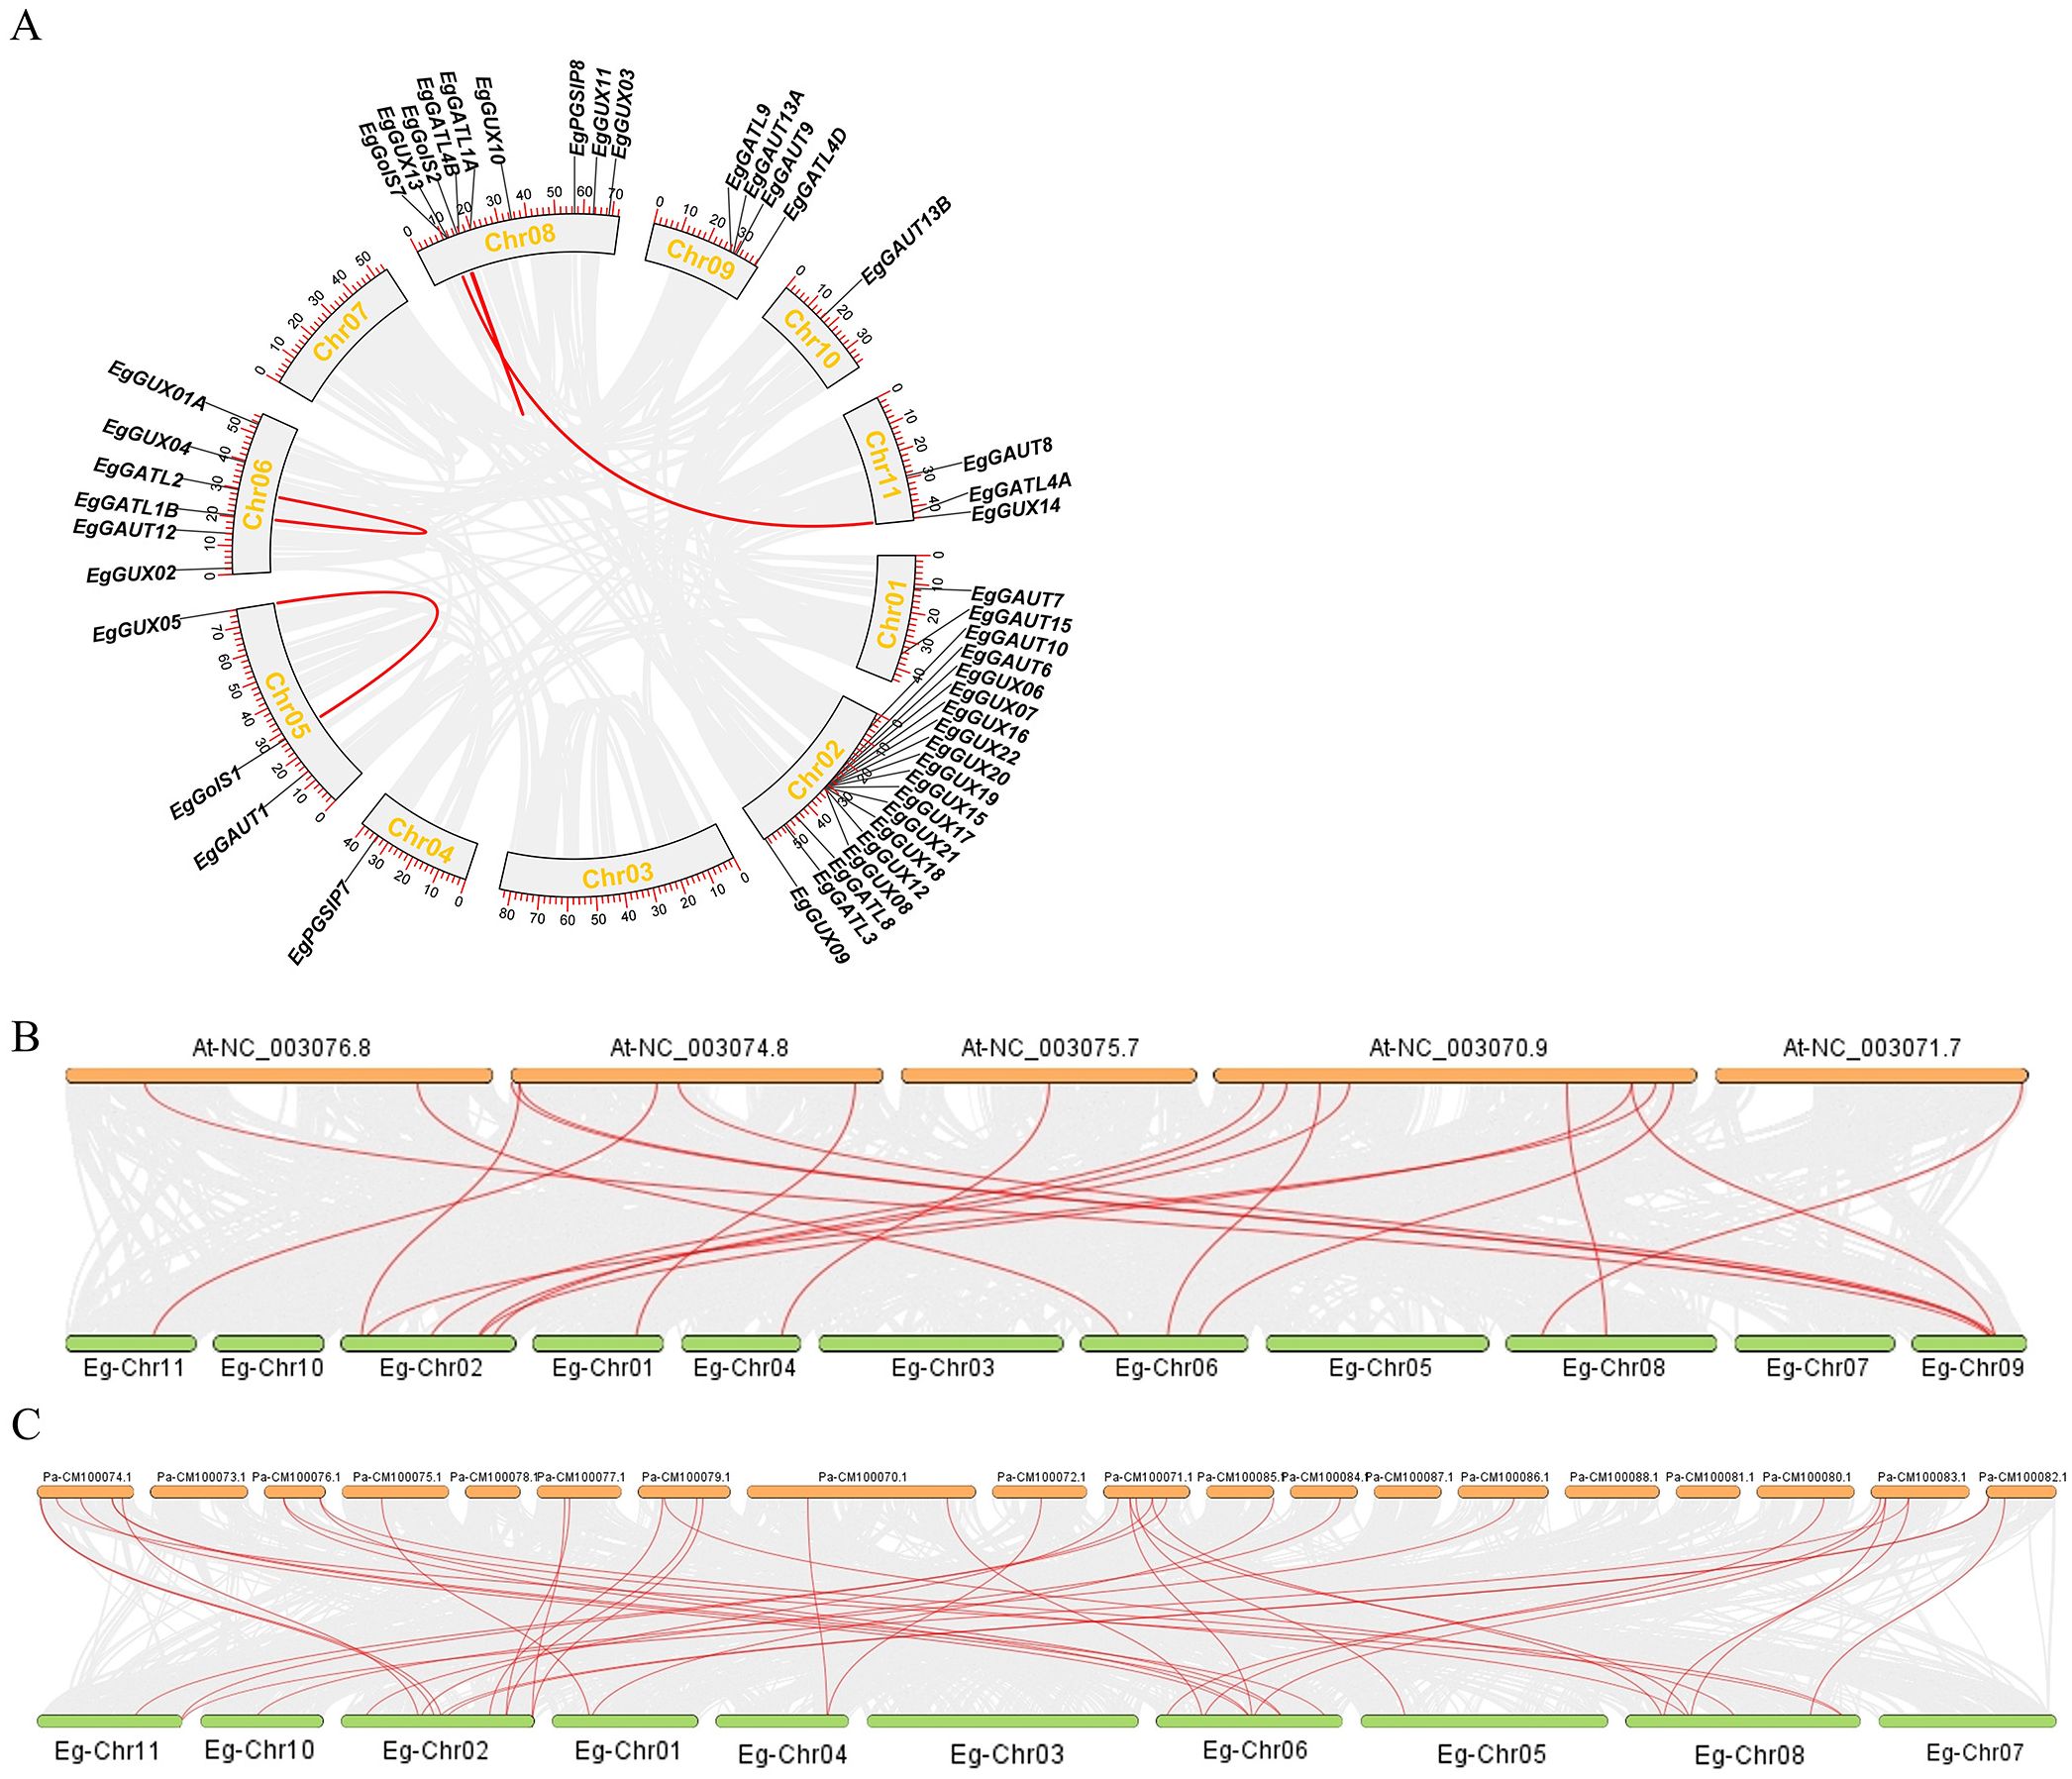
Figure 3. Synteny relationships of the GT8 gene family between E. grandis, A. thaliana, and P. alba. (A) Intra-species synteny relationships of the E. grandis GT8 gene family, with gray lines representing all syntenic blocks in the GT8 genome and red lines indicating segmental duplications of the EgGT8 genes. (B) Inter-species synteny between E. grandis and A. thaliana, and (C) between E. grandis and P. alba, with gray lines representing all syntenic blocks and red lines indicating synteny of GT8 genes between species.
Further inter-species synteny analysis using the genomes of A. thaliana and P. alba revealed 19 syntenic pairs between A. thaliana and E. grandis (Figure 3B), and 39 syntenic pairs between P. alba and E. grandis (Figure 3C). This suggests a closer phylogenetic relationship between P. alba and E. grandis.
3.5 Phylogenetic tree of the E. grandis GT8 gene family
MEGA software was used to evaluate 229 protein sequences from E. grandis (52), A. thaliana (33), S. moellendorffii (32), P. patens (59), and P. alba (53) to comprehend the evolutionary connections of the E. grandis GT8 family members with other species. The phylogenetic tree analysis divided the GT8 proteins into four groups (Group I–IV) (Figure 4). The EgGT8 family had 7, 24, 11, and 10 members in Groups I–IV, respectively. Based on the phylogenetic relationships, it was found that EgGUX02 and EgGUX04 displayed closer links with AtGUX1 and AtGUX2; EgGolS4 and EgGolS5 showed closer relationships with AtGolS2 and AtGolS4; EgGAUT1 and EgGAUT12 were more closely related to AtGAUT1/PARVUS and AtGAUT12; EgGATL8 and EgGATL4A showed closer relationships with AtGATL4 and AtGATL9. Phylogenetic analysis revealed that EgGT8 family members clustered closely with orthologs from A. thaliana and P. alba, forming a distinct clade separate from the more evolutionarily distant species S. moellendorffii and P. patens.
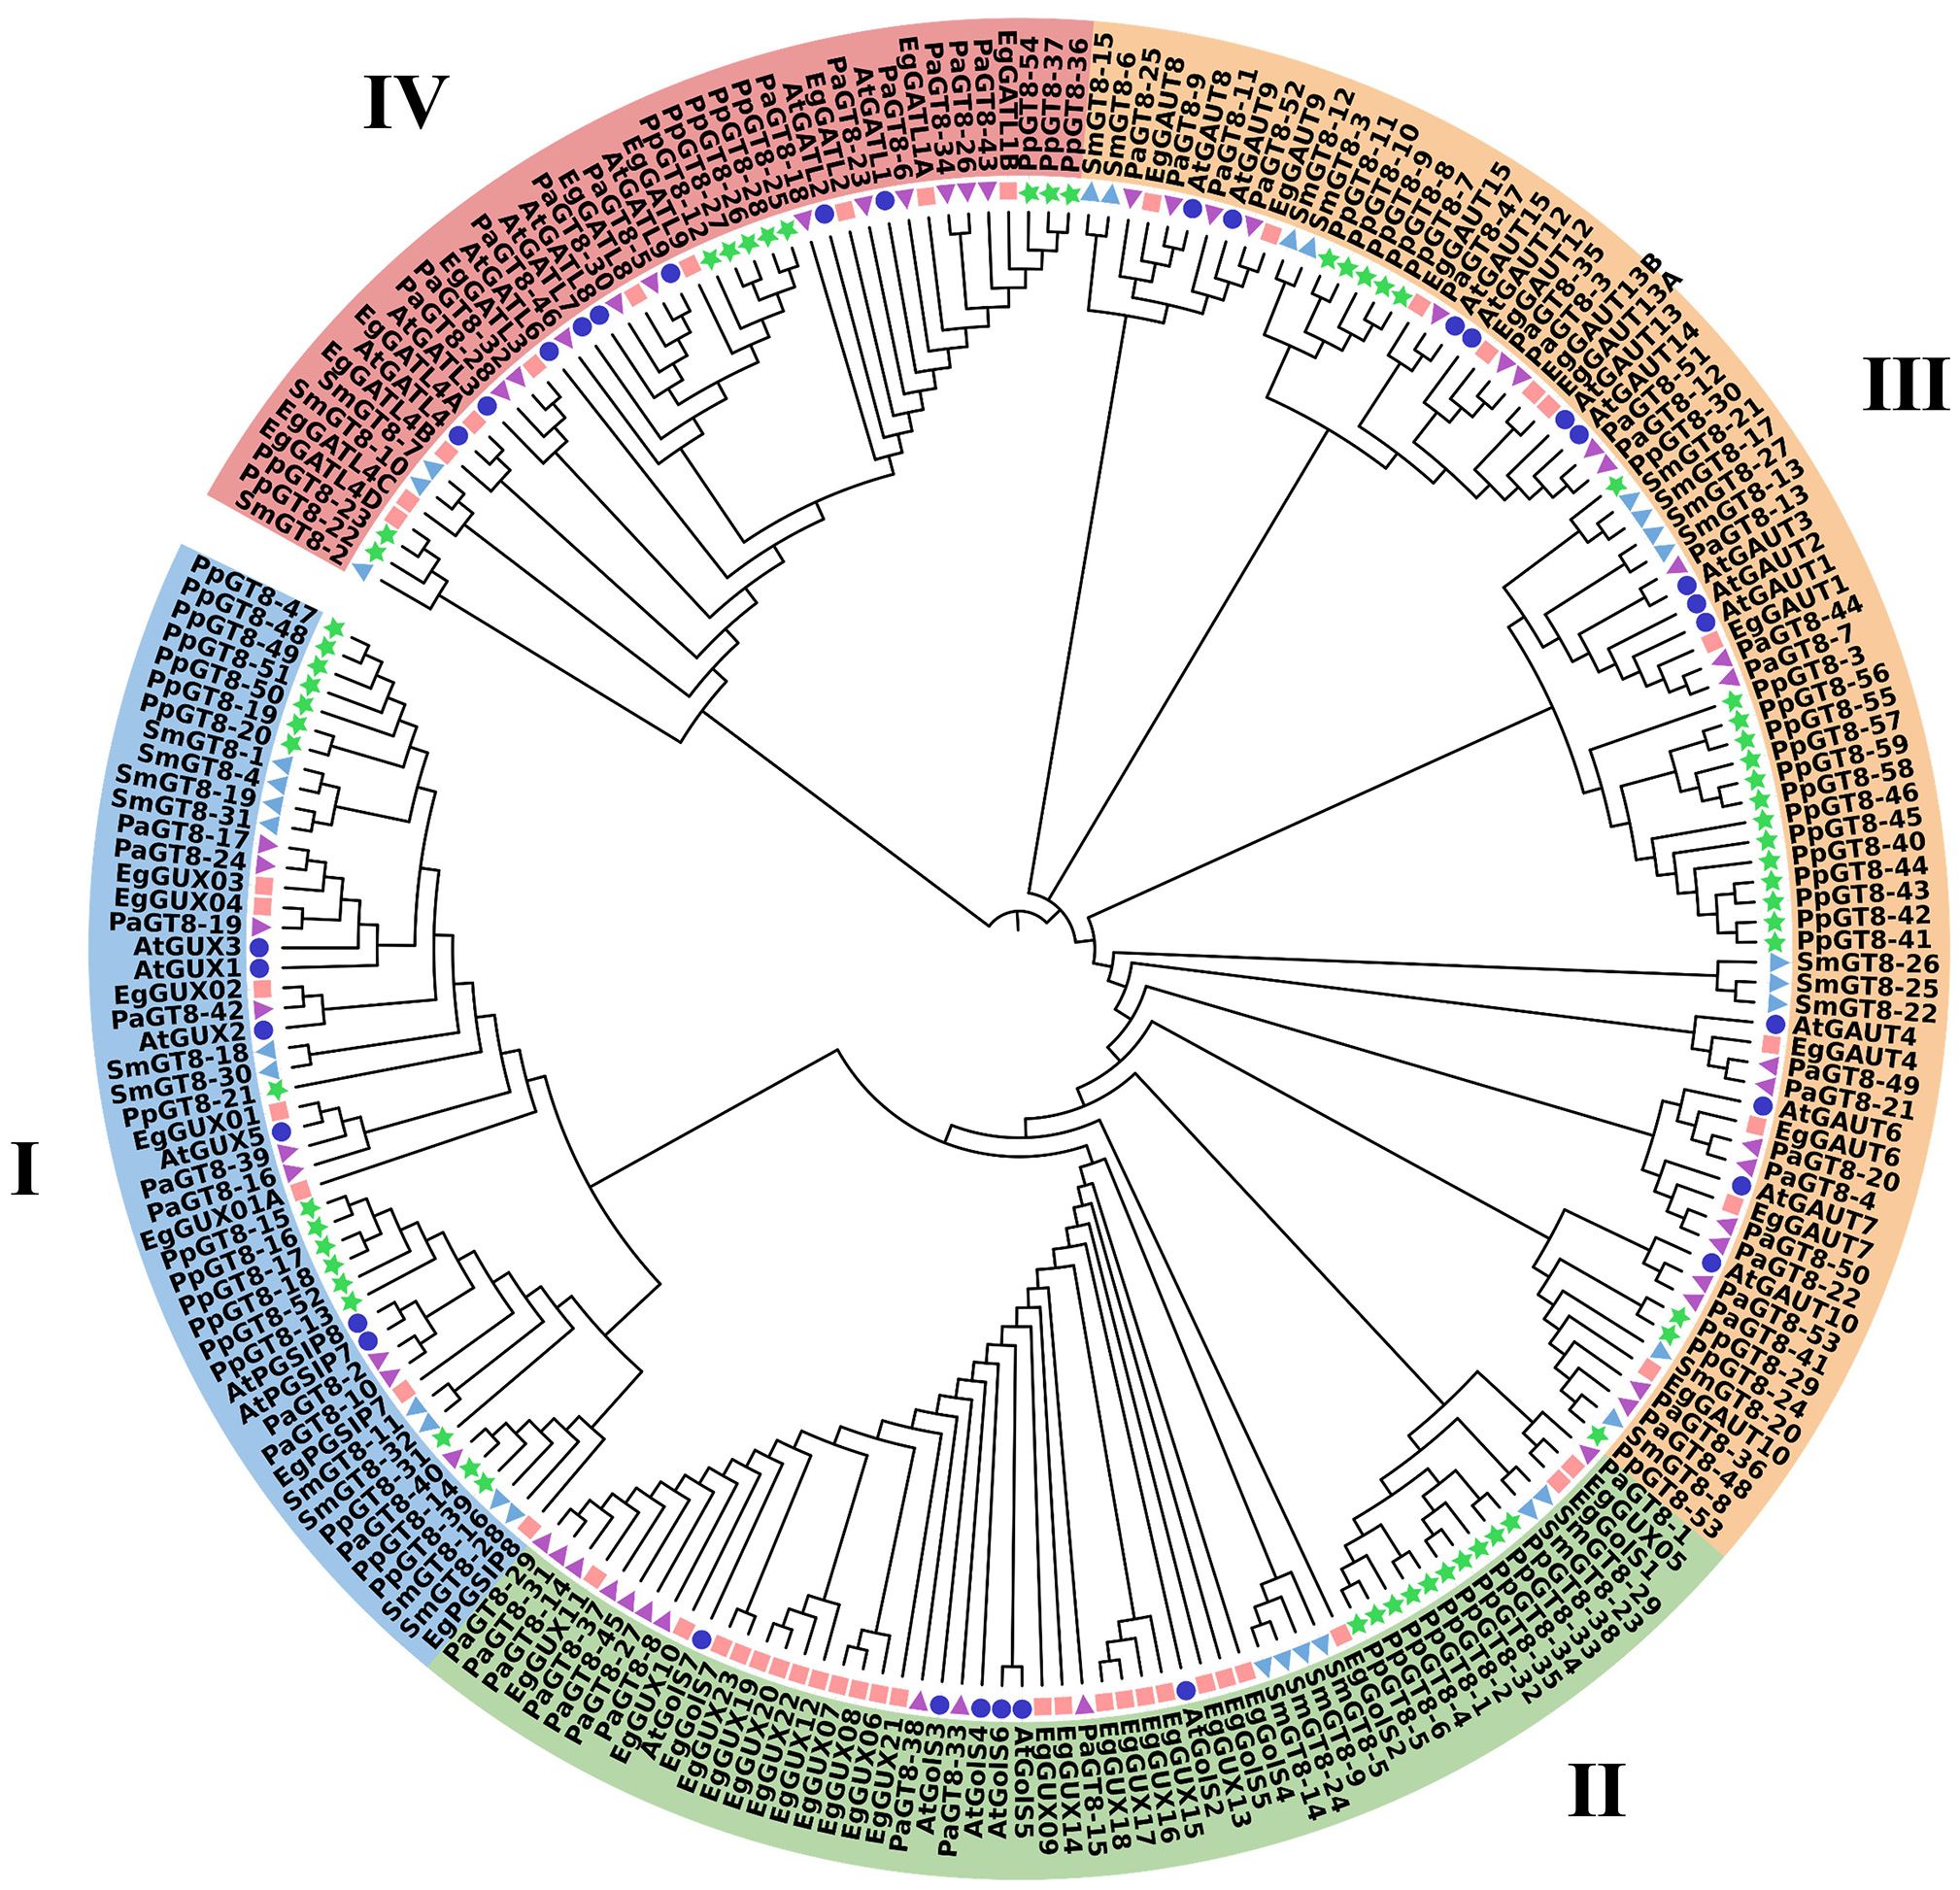
Figure 4. Phylogenetic tree of GT8 gene family members. The GT8 genes from E. grandis (52), A. thaliana (33), S. moellendorffii (32), P. patens (59), and P. alba (53) were selected. These species are represented by pink squares, blue circles, light blue triangles, green stars, and purple inverted triangles, respectively. MEGA11 was used to create the maximum-likelihood phylogenetic tree using full-length GT8 sequences (5000 bootstrap replicates). Blue, green, orange, and pink highlight the four groups.
3.6 Analysis of cis-acting elements in the promoters of the E. grandis GT8 gene family
By binding to cis-acting sites in the promoter regions, transcription factors (TFs) can regulate the expression of genes (Wang et al., 2014). We analyzed cis-acting elements within the 2000 bp promoter regions upstream of EgGT8 genes and correlated these findings with phylogenetic relationships (Figure 5). Among the 52 EgGT8 family genes, 17 cis-acting elements were predicted. These elements were classified into several categories: hormone response elements, light response elements, abiotic stress response elements, and plant growth and development-related elements. Light response-related elements were the most prevalent, and hormone response elements such as salicylic acid (SA), abscisic acid (ABA), methyl jasmonate (MeJA), gibberellin (GA), and auxin (IAA) response elements were present in all family members. This suggests that light and plant hormone signaling may control the transcription of this gene family. Additionally, there were four types of abiotic stress response elements and two plant growth-related elements.
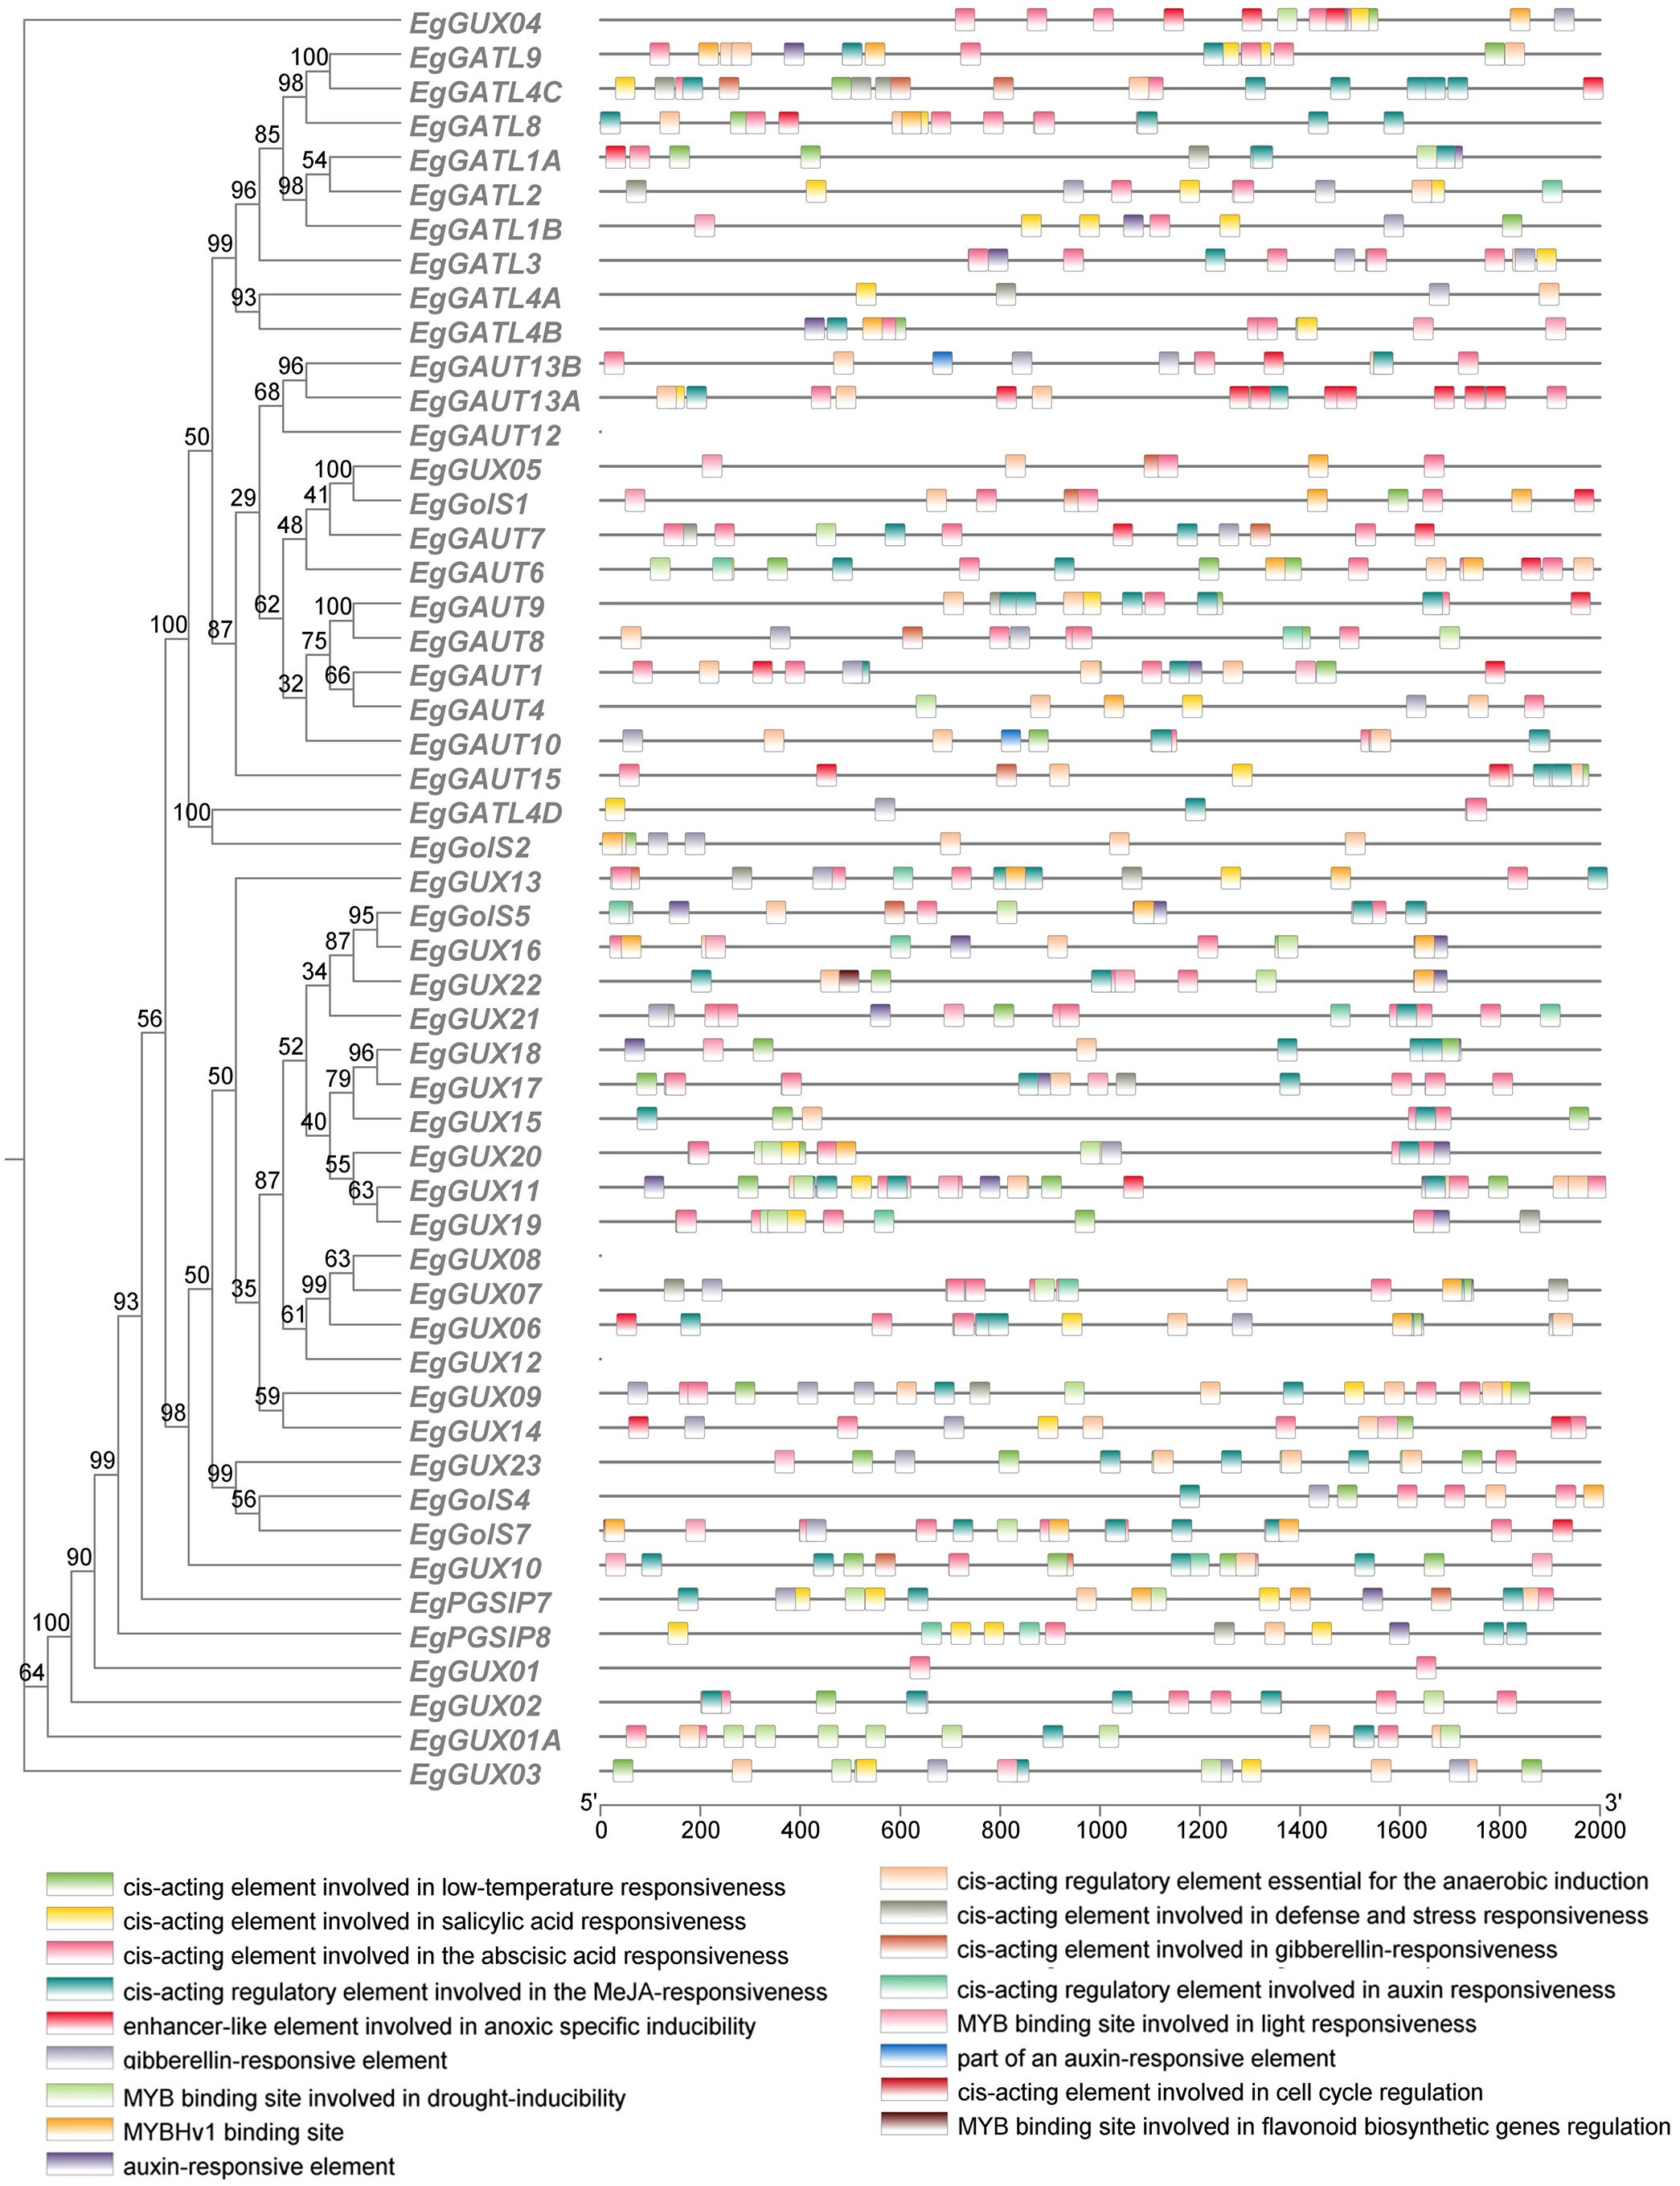
Figure 5. Cis-acting element analysis of the E. grandis GT8 gene family promoters. The vertical axis of the figure represents the names of different genes, while the horizontal axis represents the 2000 bp upstream region of the gene. The squares in the middle indicate the positions of various cis-acting elements, with their specific names shown in the upper right corner.
3.7 Expression of the E. grandis GT8 gene family in different tissues
To investigate the expression patterns of the EgGT8 gene family in E. grandis, we analyzed 49 EgGT8 genes across multiple tissues, including young leaves, mature leaves, phloem, xylem, roots, flowers, stems, and lateral branches. Expression data were unavailable for EgGolS7, EgGATL4A and EgGUX15. The results showed that in 6-month-old E. grandis, EgGUX14 was highly expressed in young leaves and mature leaves, while EgGUX10 exhibited significant expression in mature leaves and xylem. Compared to other tissues, EgGAUT12 and EgGATL2 showed relatively higher expression levels in the xylem (Figure 6A). The expression of the EgGT8 genes in various sections of 3-year-old E. grandis is shown in Figure 6B. EgGATL9 was most expressed in young leaves and lateral branches, whereas EgGUX09, EgGUX13, EgGUX14, and EgGUX10 were most expressed in mature leaves. Figure 6C demonstrates the expression of the EgGT8 genes in various stem segments of 6-month-old E. grandis, with EgGAUT12, EgGAUT8, EgGATL2 and EgGATL1B exhibiting the highest expression. From the top to the base of the tree, the expression of EgGUX02, EgGUX03, EgGUX01A and EgGATL1A gradually increased, while the expression of EgGUX06, EgGUX07 and EgGATL9 gradually decreased. In comparison, the expression levels in the xylem were higher than those in the phloem, with EgGAUT12 and EgGUX10 showing the highest expression in the xylem (Figure 6D).
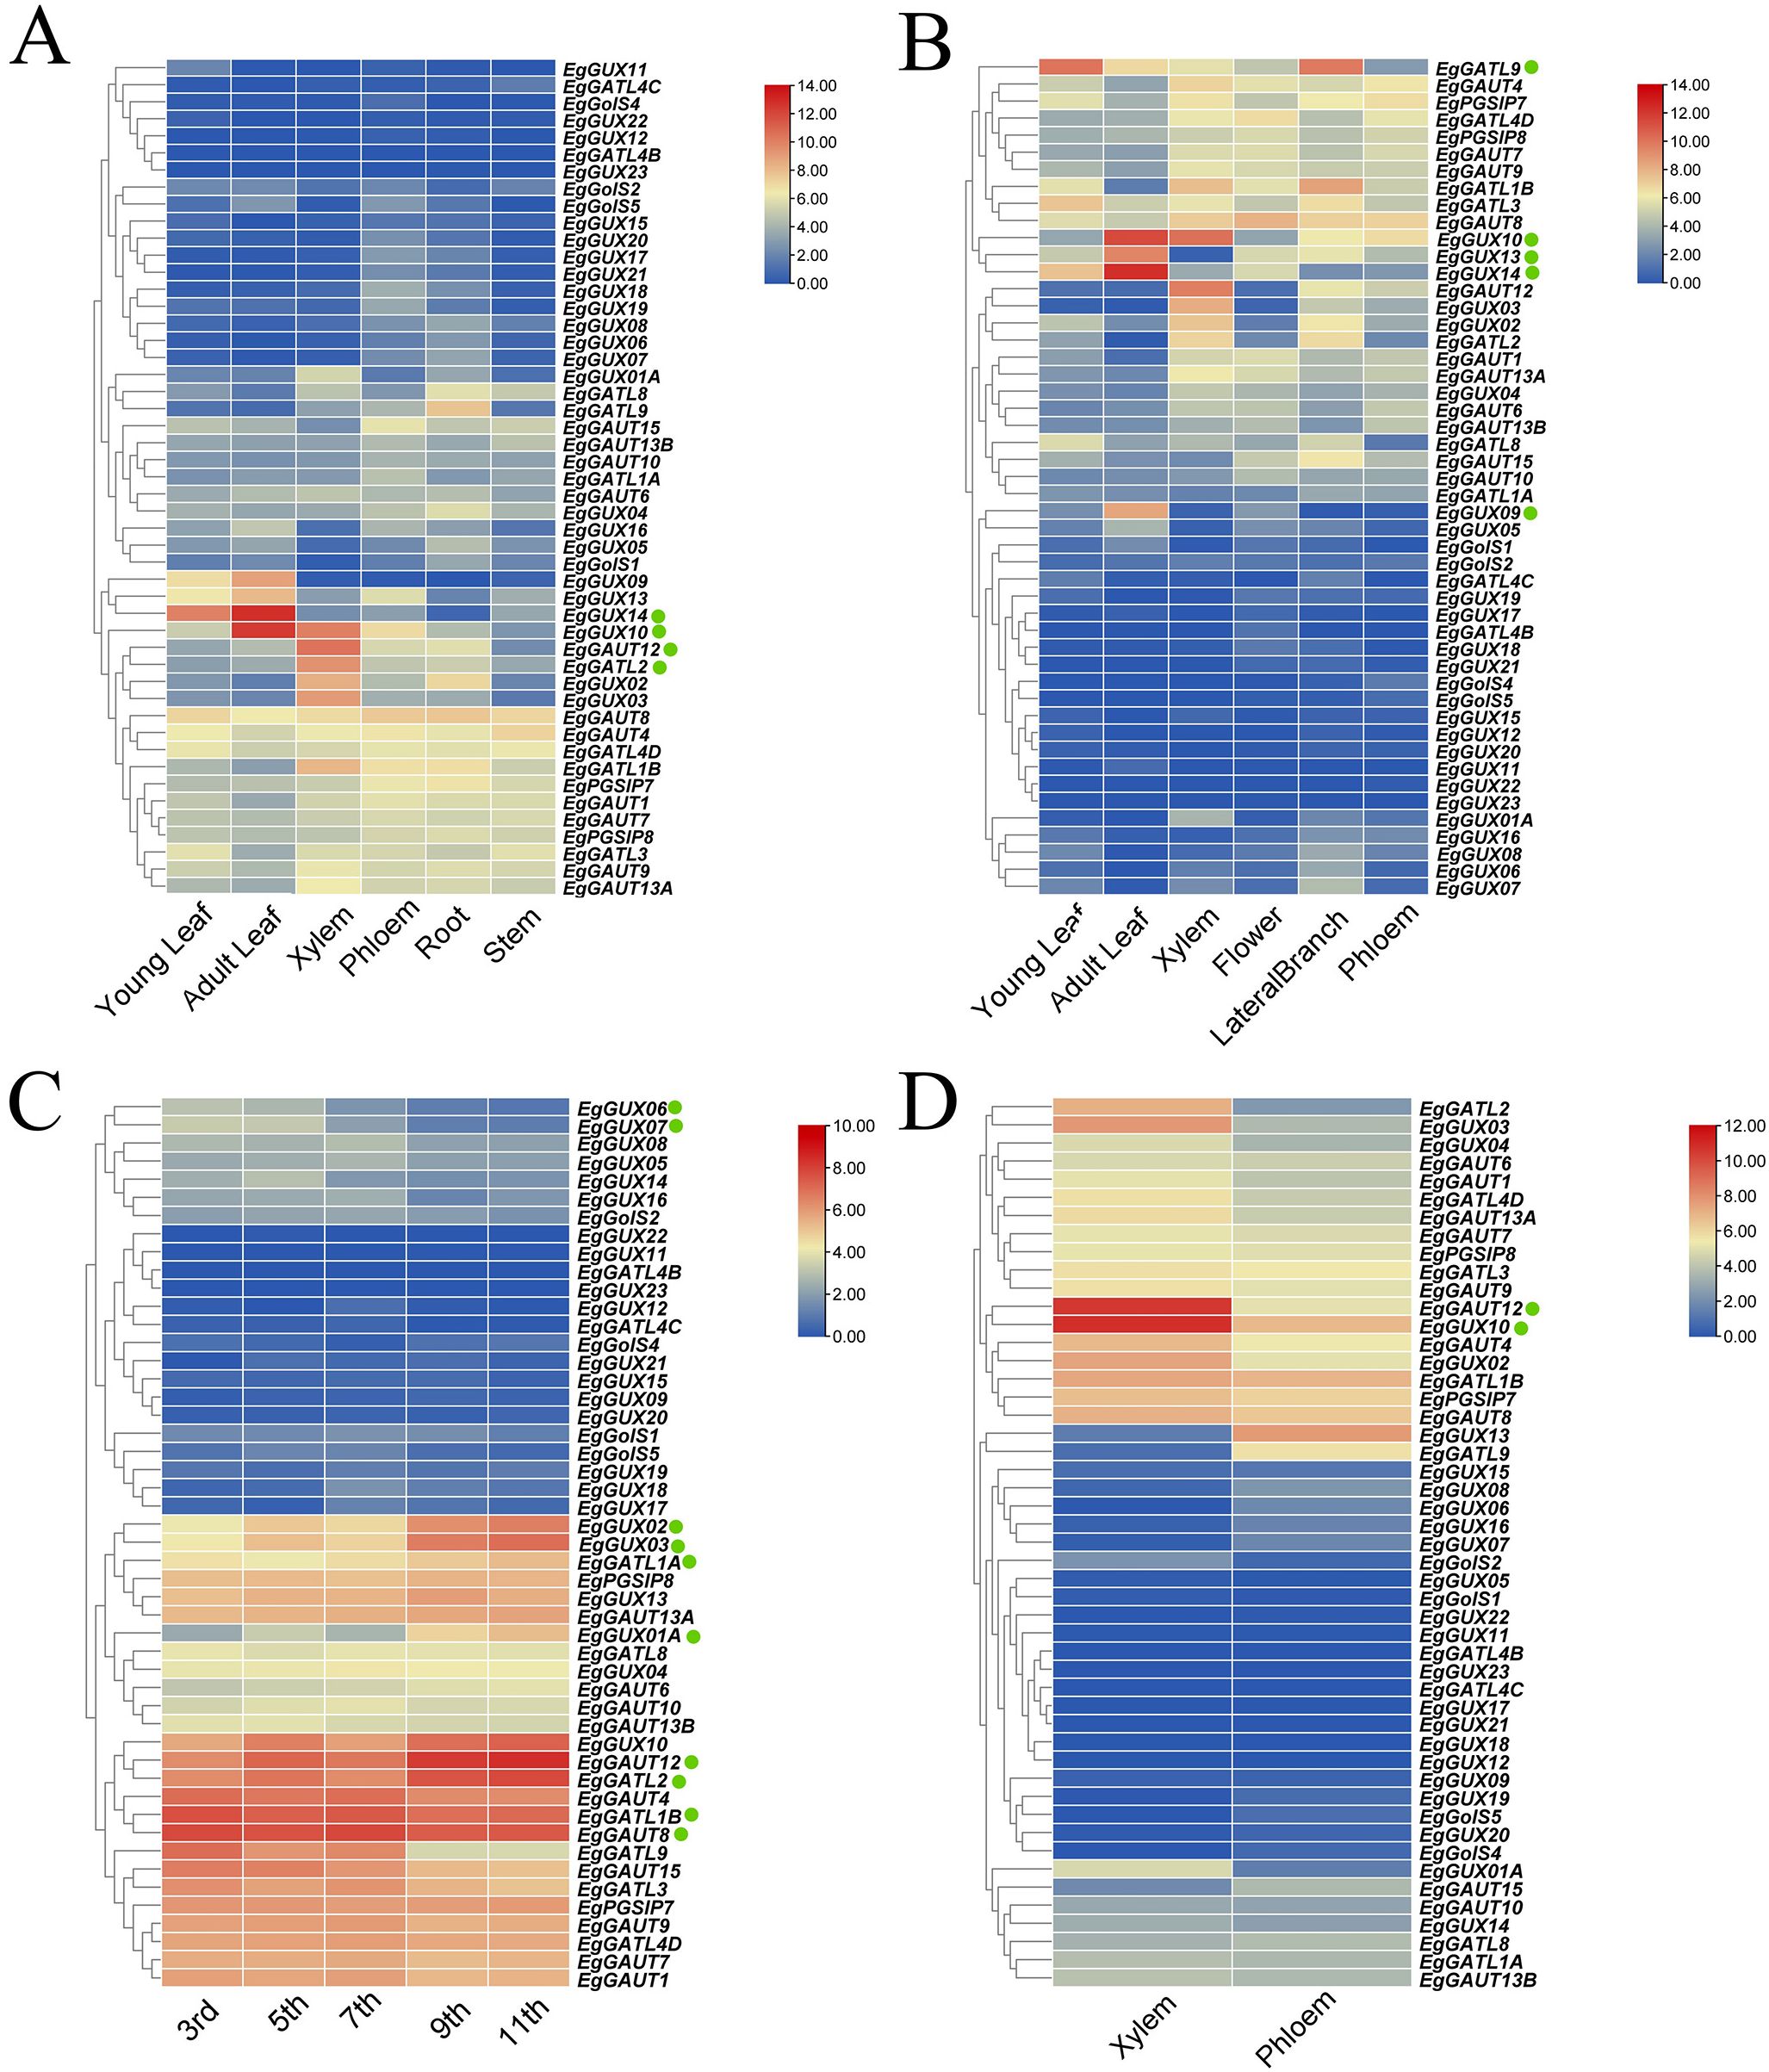
Figure 6. Heatmap of EgGT8 Gene Expression in Various E. grandis Tissues. (A) Expression heatmap of 6-month-old E. grandis in roots, stems, xylem, phloem, juvenile leaves, and mature leaves. (B) 3-year-old E. grandis expression heatmap in phloem, xylem, flowers, lateral branches, immature leaves, and mature leaves. (C) EgGT8 gene expression heatmap in 6-month-old E. grandis stem nodes (nodes 3, 5, 7, 9, 11). (D) EgGT8 gene expression heatmap in 6-year-old E. grandis xylem and phloem. The color of the rectangular grids represents expression levels, with red indicating higher expression and blue indicating lower expression. The green dots next to the genes indicate key genes of interest.
3.8 Expression of E. grandis GT8 family members under abiotic stress and plant hormone treatments
To investigate the differential expression of EgGT8 family members under abiotic stress and plant hormone treatments, 2-month-old E. grandis seedlings were subjected to phosphate deficiency, boric acid deficiency, and salt stress. Additionally, salicylic acid (SA) and methyl jasmonate (MeJA) were sprayed on the leaves. Expression analysis was performed on 49 EgGT8 genes, excluding EgGolS7, EgGATL4A, and EgGUX15. The circles in the figure provide a more intuitive visualization of gene expression levels, with larger circles indicating higher expression. This design facilitates vertical comparisons of gene expression across different treatments. The normalized heatmaps indicated that under phosphate deficiency, the expression of EgGATL4B, EgGUX09, and EgGUX23 gradually increased, while the expression of EgGUX05 and EgGAUT13A gradually decreased (Figure 7A). Under boric acid deficiency, the expression of EgGUX11, EgGUX13, and EgGATL1A gradually increased, while the expression of EgGATL9, EgGAUT6, and EgGolS1 gradually decreased (Figure 7B). Under salt stress, the expression of EgGUX12, EgGUX16, and EgGAUT6 gradually increased, while the expression of EgGAUT4, EgGUX04, and EgGolS2 gradually decreased (Figure 7C). Under MeJA treatment, the expression of EgGUX16, EgGUX18, and EgGAUT6 gradually increased, while the expression of EgGAUT7, EgGAUT15, and EgGUX13 gradually decreased (Figure 7D). Under SA treatment, the expression of EgGUX07, EgGUX22, and EgGATL1A gradually increased, while the expression of EgGUX02, EgGUX05, and EgGATL4B gradually decreased (Figure 7E). It is worth noting that the increases or decreases in expression observed here may reflect short-term effects under different treatments, which might be regulated back due to feedback mechanisms after prolonged treatments.
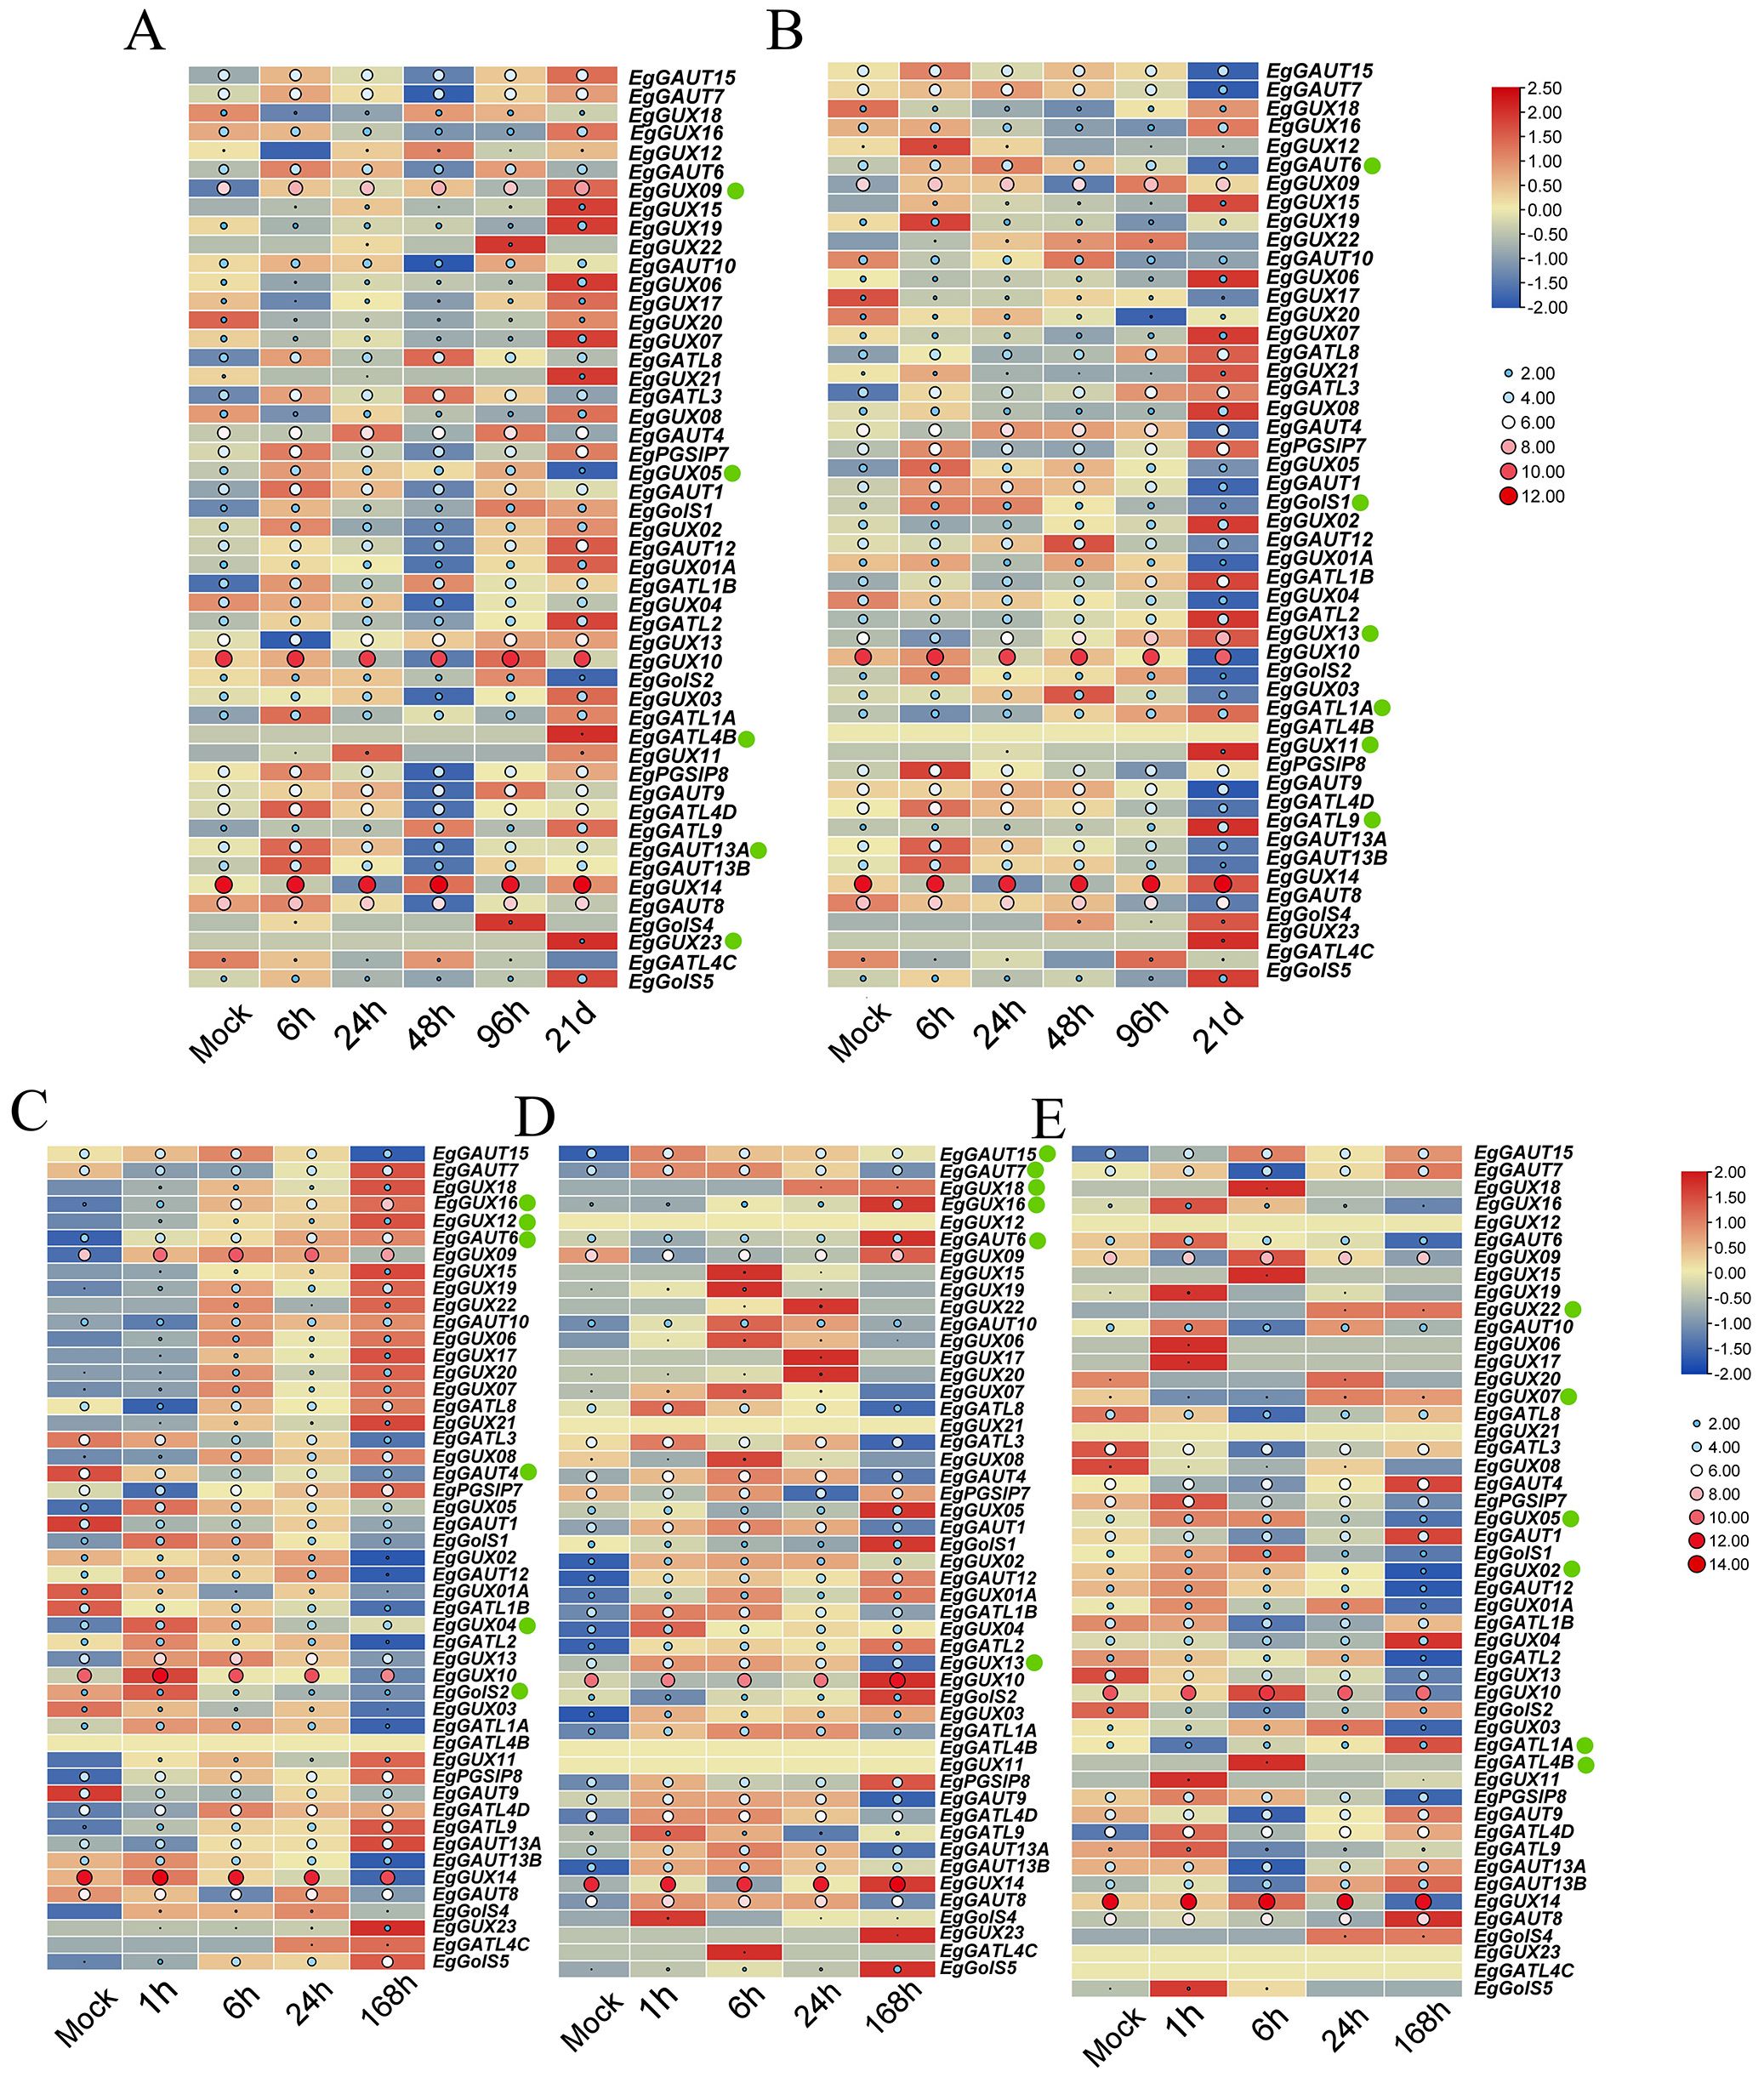
Figure 7. Heatmap of EgGT8 Gene Expression in E. grandis under abiotic stress and plant hormone treatments. (A) Expression heatmap after phosphate deficiency treatment (0, 6, 24, 48, 96 hours, 21 days). (B) Expression heatmap after boric acid deficiency treatment (0, 6, 24, 48, 96 h, 21 days). (C) Expression heatmap after salt stress treatment (0, 1, 6, 24, 168 h). (D) Expression heatmap after MeJA treatment (0, 1, 6, 24, 168 h). (E) Expression heatmap after SA treatment (0, 1, 6, 24, 168 h). The color of the rectangular grids represents expression levels, with red indicating higher expression and blue indicating lower expression. The size and color of the circles correspond to the magnitude of the raw data: larger, redder circles indicate higher expression levels, while smaller, bluer circles indicate lower expression levels. The green dots next to the genes indicate key genes of interest.
3.9 3D structure analysis of E. grandis GT8 gene family members
Using SWISS-MODEL, the 3D structures of eight sample EgGT8 proteins were effectively predicted (Figure 8). Proteins within the same subfamily showed significant similarity in their 3D structures with minimal differences. However, proteins from different subfamilies exhibited more noticeable structural differences, which may be attributed to variations in the α-helix, β-turn, and irregular coil regions. These structural differences likely result in changes in the spatial folding angles, which may underpin the different functional roles of these proteins.
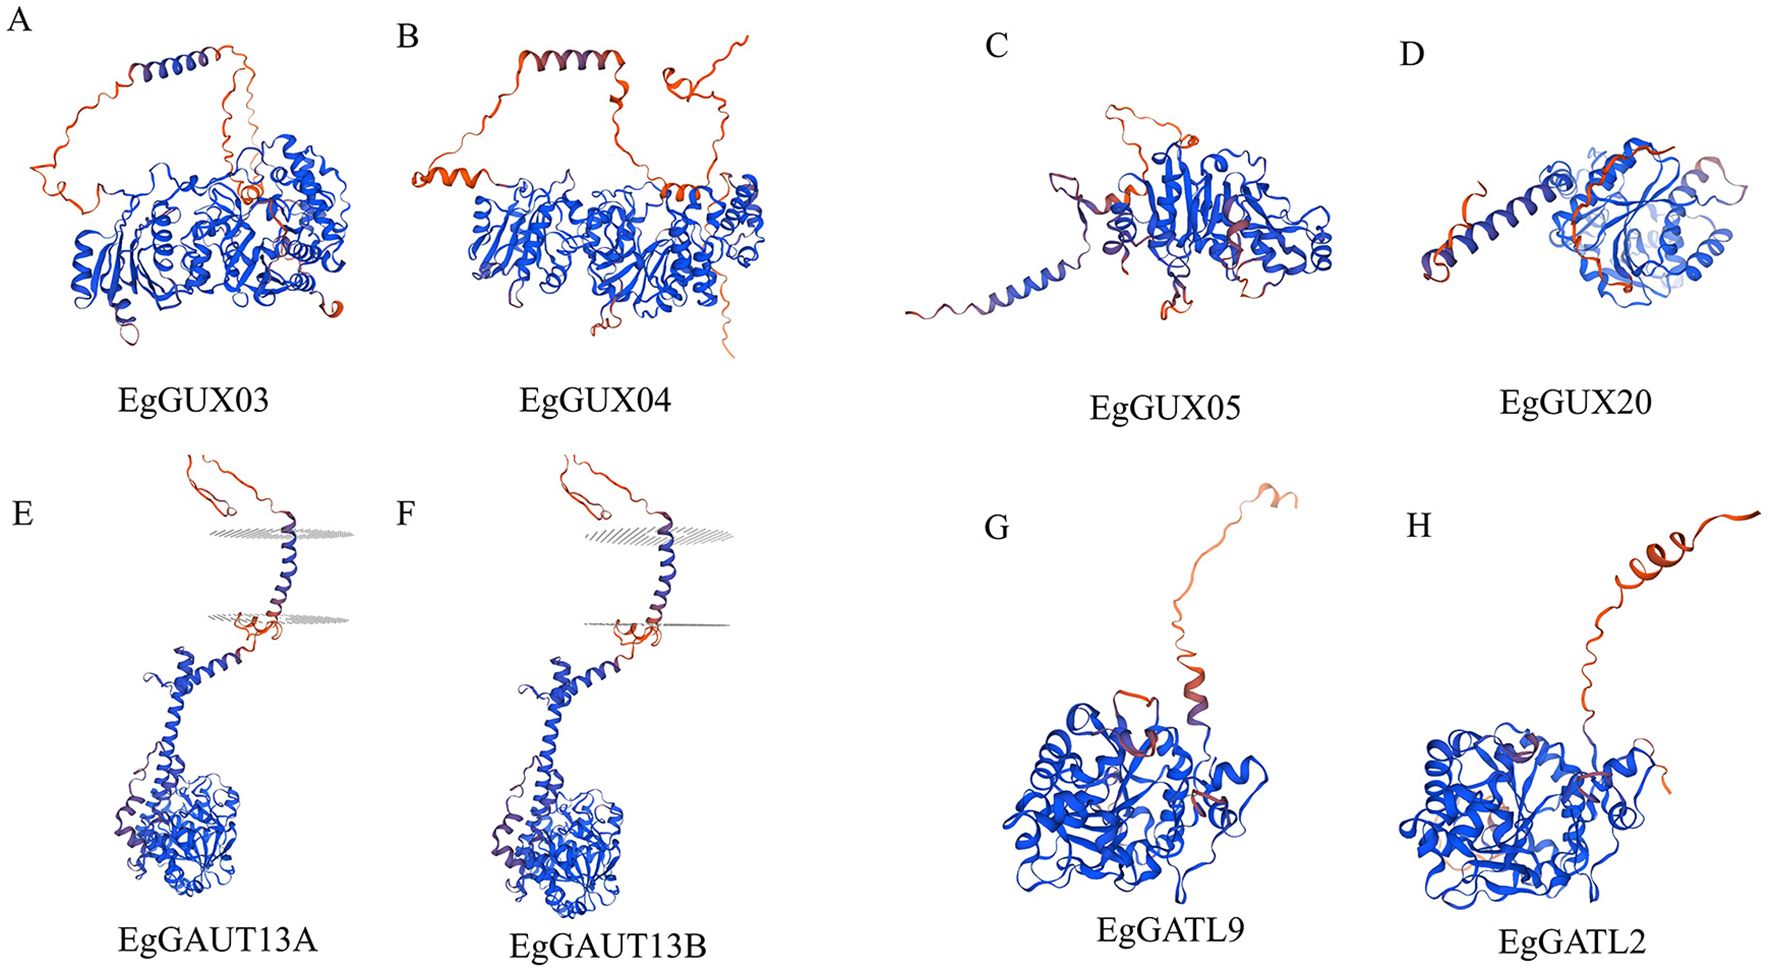
Figure 8. 3D Structures of EgGT8 Gene Family Members. (A) Protein subfamily I's three-dimensional structure EgPGSIP7. (B) Protein subfamily I's three-dimensional structure EgPGSIP8. (C) 3 Protein subfamily II's three-dimensional structure EgGUX05. (D) Protein subfamily II's three-dimensional structure EgGUX20. (E) 3 Protein subfamily III's three-dimensional structure EgGAUT13A. (F) Protein subfamily III's three-dimensional structure EgGAUT13B. (G) Protein subfamily IV's three-dimensional structure EgGATL9. (H) Protein subfamily IV's three-dimensional structure EgGATL2..
4 Discussion
The GT8 gene family is widely present in plant genomes, and studies have demonstrated that it is essential for plant cell wall biosynthesis and reaction to abiotic stress. E. grandis, characterized by its rapid growth and high economic value, is a key species for wood reserves. Therefore, studying the functional differentiation and evolution of the GT8 gene family in E. grandis is vital for the formation and utilization of its wood. Currently, the GT8 family has been reported in various species, but research on the GT8 family in woody plants such as E. grandis is relatively scarce. Using the GT8 genes of A. thaliana as a reference, we discovered 52 GT8 genes in E. grandis. Analysis of their physicochemical properties showed that the EgGT8 genes are unevenly distributed across 11 chromosomes, with most family members being unstable. Subcellular localization predictions displayed that EgGT8 proteins are extensively dispersed in the Golgi apparatus and endoplasmic reticulum, and the bulk of these genes (94.23%) encode hydrophilic proteins. The E. grandis GT8 family’s protein sequences and domains are generally very conserved, indicating that these genes are important for plant physiology, warranting further functional exploration.
Ten GT8 genes (EgGUX08, EgGUX12, EgGUX15, EgGUX16, EgGUX17, EgGUX18, EgGUX19, EgGUX20, EgGUX21, and EgGUX22) form a tightly linked cluster on E. grandis chromosome 2 (Figure 2), showing high structural similarity-a hallmark of tandem duplication. These group II genes share conserved motifs and domains, suggesting retained biochemical functions and potential involvement in common pathways. Analysis of E. grandis GT8 genes identified only four collinear gene pairs: EgGATL4B and EgGolS2, EgGUX13 and EgGUX14, EgGATL2 and EgGATL1B, EgGUX05 and EgGolS1 (Figure 3A). These genes represent non-contiguously distributed repetitive sequences in the genome, with phylogenetic evidence supporting their origin through dispersed duplication events. Syntenic gene pairs exhibit conserved motifs and similar gene architectures (Figure 1), indicating their potential functional conservation via dosage effects. In contrast, non-syntenic gene pairs demonstrate substantial divergence in gene structures, suggesting evolutionary functional differentiation. Such divergent paralogs likely mediate distinct biological processes contributing to growth and development in E. grandis.
Comparative genomic analysis revealed that E. grandis exhibits significantly stronger collinearity in GT8 genes with P. alba than with A. thaliana (Figures 3B, C). This phenomenon can be attributed to two primary factors: First, both E. grandis and P. alba belong to woody clade, while A. thaliana is classified to herbaceous clade, indicating closer phylogenetic relationship between the former two species. Second, as woody plants, Eucalyptus and Populus require more conserved GT8 gene functions for secondary cell wall formation, resulting in greater gene diversification.
E. grandis exhibits greater GT8 gene family expansion (11 chromosome pairs) compared to A. thaliana (5 pairs) (Figure 7B), likely due to whole-genome duplication. This expansion facilitated functional diversification of GT8 genes, enhancing environmental adaptation. Duplicated genes may evolve specialized functions through sequence divergence and expression changes, forming adaptive networks. Future studies could employ CRISPR and comparative genomics to investigate GT8 functional mechanisms.
Previous work has demonstrated that IRX8, a member of the GT8 gene family, contributes to the production of the tetrasaccharide that contains galacturonic acid at the reducing end of xylan (Brown et al., 2007). The protein encoded by GAUT1 functions as a galacturonosyltransferase, directly participating in pectin biosynthesis (Caffall and Mohnen, 2009). In the phylogenetic tree constructed for GT8 genes across E. grandis, A. thaliana, S. moellendorffii, P. patens, and P. alba, these genes cluster within Group III. This suggests that EgGAUT1, EgGAUT12, and other Group III members may share functional similarities with IRX8 and GAUT1, potentially contributing to both pectin and xylan biosynthesis. Additionally, EgGUX02 and EgGUX04 exhibit close phylogenetic relationships with AtGUX1 and AtGUX2, indicating their possible involvement in xylan side-chain modifications by incorporating glucuronic acid (GlcA) into the xylan backbone (Rennie et al., 2012; Lyczakowski et al., 2021). Similarly, EgGolS4 and EgGolS5 cluster with AtGolS2 and AtGolS4, suggesting their potential roles as essential enzymes in the production of raffinose family oligosaccharides (Taji et al., 2002). Furthermore, EgGATL8 and EgGATL4A are closely related to AtGATL4 and AtGATL9, suggesting their possible role in the formation of the tetrasaccharide that contains galacturonic acid at the reducing end of xylan (Peña et al., 2007). These results offer insightful information about the functional diversification of GT8 genes, yet further experimental validation and functional characterization are required in future studies.
Expression data from E. grandis seedlings under various abiotic stresses and plant hormone treatments underscore the importance of MeJA. MeJA is a significant plant hormone, and previous studies have demonstrated that MeJA is crucial for maintaining ion homeostasis (Mir et al., 2018) and in cell stress responses (Piotrowska et al., 2009; Bali et al., 2019; Shri et al., 2019). In MeJA-treated E. grandis seedlings, the expression of GT8 genes was generally upregulated. The cis-element analysis showed that all EgGT8 family members contain hormone response elements, including those responsive to MeJA, strongly indicating a strong bond between the EgGT8 gene family and MeJA, which could be further analyzed in subsequent studies.
In situations including salt stress, phosphorus deficiency, boric acid deficiency, SA treatment, and MeJA treatment, EgGUX10 and EgGUX14 displayed increased levels of expression, according to heatmap analysis of RNA-Seq data. This suggests that these two genes may participate in hormone signal transduction pathways. As key nodes in the signaling chain, they may respond to hormone signals and regulate the expression of downstream genes, thus coordinating the plant’s response to different environmental signals. Moreover, EgGUX10 and EgGUX14 might function synergistically under environmental stress, controlling plant development and growth as well as adversity adaptation.
Under both boric acid deficiency and salicylic acid (SA) treatment, the expression level of the EgGATL1A gene was significantly upregulated, suggesting its involvement in both biotic and abiotic stress responses (Figure 7). Phylogenetic analysis reveals that EgGATL1A clusters with AtGATL1, which have known to mediate glucuronoxylan biosynthesis during secondary cell wall thickening, in the same evolutionary clade, demonstrating high sequence and functional similarity (Lee et al., 2007). We therefore propose that EgGATL6 similarly participates in glucuronoxylan biosynthesis.
Tissue-specific expression analysis of the GT8 gene family in E. grandis reveals that several EgGT8 members are highly expressed in xylem and phloem, while others are predominantly expressed in leaves. Overall, EgGT8 genes exhibit highest expression levels in xylem, mature leaves, and lateral branches. This expression pattern aligns well with the enrichment of MYB-binding cis-elements in the promoter regions of GT8 genes, suggesting that these genes may be regulated by MYB transcription factors and participate in secondary cell wall modification. Based on the structural features of the GT8 gene family, we propose a hypothesis that the MYB-GT8 module enhances mechanical strength of the cell wall by glycosylating lignin precursors. This modification helps E. grandis respond to mechanical stress, maintain leaf morphology and structure, and regulate the synthesis and reinforcement of cell walls in lateral branches, thereby ensuring normal photosynthesis and promoting lateral branch development. This proposed mechanism is consistent with functional studies of PtrGT8D in Populus (Li et al., 2011), although tandemly duplicated genes in the E. grandis GT8 family may have further diverged to acquire subfunctions in regulating different substrates.
To evaluate the natural selection pressures acting on the E. grandis GT8 gene family, we calculated the ratio of non-synonymous (Ka) to synonymous (Ks) substitutions (u) for the EgGT8 gene pairs (Supplementary Table 1). When the Ka/Ks ratio is < 1, = 1, or > 1, it indicates purifying, neutral, and positive selection, respectively. The data suggest that the majority of these gene pairs are under purifying selection, with only a few exhibiting signs of neutral selection. This likely indicates that these genes have been primarily subjected to conserved selection throughout evolution to maintain their functional integrity.
5 Summary
We analyzed 52 members of the GT8 gene family in E. grandis from the perspectives of phylogeny, gene structure, and proteomics. These genes were classified into four subfamilies, and a series of conserved protein structures were identified. We analyzed the phylogenetic relationships between different species. Expression profile analysis of related genes under different tissue types and treatments indicated that members of the GT8 gene family play important roles in plant resistance to environmental stress, a process associated with their involvement in multiple cell wall biosynthesis pathways. Based on the distribution of key GT8 family members from published literature and expression profile data, we identified potential key genes that may function within the E. grandis GT8 family. This will assist in future functional studies and provide valuable insights for breeders in improving wood quality and cultivating superior varieties.
Data availability statement
The datasets presented in this study can be found in online repositories. The names of the repository/repositories and accession number(s) can be found in the article/Supplementary Material.
Author contributions
YJ: Resources, Project administration, Validation, Data curation, Formal Analysis, Methodology, Visualization, Writing – review & editing, Funding acquisition, Conceptualization, Investigation, Supervision, Software, Writing – original draft. LWL: Writing – review & editing, Validation, Conceptualization, Supervision, Investigation, Software, Methodology, Resources, Funding acquisition, Project administration, Writing – original draft, Visualization, Data curation, Formal Analysis. LSL: Writing – review & editing, Resources, Methodology. AW: Data curation, Funding acquisition, Writing – review & editing. CF: Data curation, Methodology, Investigation, Writing – review & editing. SL: Funding acquisition, Writing – review & editing.
Funding
The author(s) declare that financial support was received for the research and/or publication of this article. This work was funded by China Postdoctoral Science Foundation (Certificate Number: 2024M750964) and the Guangdong Basic and Applied Basic Research Foundation (2024A1515011209).
Conflict of interest
The authors declare that the research was conducted in the absence of any commercial or financial relationships that could be construed as a potential conflict of interest.
The author(s) declared that they were an editorial board member of Frontiers, at the time of submission. This had no impact on the peer review process and the final decision.
Generative AI statement
The author(s) declare that no Generative AI was used in the creation of this manuscript.
Publisher’s note
All claims expressed in this article are solely those of the authors and do not necessarily represent those of their affiliated organizations, or those of the publisher, the editors and the reviewers. Any product that may be evaluated in this article, or claim that may be made by its manufacturer, is not guaranteed or endorsed by the publisher.
Supplementary material
The Supplementary Material for this article can be found online at: https://www.frontiersin.org/articles/10.3389/fpls.2025.1610059/full#supplementary-material
Supplementary Figure 1 | Conserved Domains of the E. grandis GT8 Gene Family This figure illustrates the conserved domains of the E. grandis GT8 gene family and their spatial distribution. The left side of the image displays the names of different genes, while the middle segments, scaled in kilobases, indicate the relative positions of the conserved domains. Different colored blocks represent distinct conserved domains, with their corresponding names labeled at the bottom of the image.
Supplementary Table 1 | Ka/Ks Selection Pressure Analysis of Eucalyptus grandis GT8 Gene Family Members.
Abbreviations
GT8, The Glycosyltransferase 8; GIcA, glucuronic acid; HG, homogalacturona; RG-I, rhamnogalacturonan; RG-II, rhamnogalacturonan II; IRX, irregular xylem; QUA1, QUASIMODO1; GAUT1, TRANSFERASE1; E.R., endoplasmic reticulum; Golg, Golgi apparatus; Cyto, cytoplasm; Nucl, nucleus.
References
Artimo, P., Jonnalagedda, M., Arnold, K., Baratin, D., Csardi, G., de Castro, E., et al. (2012). ExPASy: SIB bioinformatics resource portal. Nucleic Acids Res. 40, W597–W603. doi: 10.1093/nar/gks400
Bailey, T. L., Boden, M., Buske, F. A., Frith, M., Grant, C. E., Clementi, L., et al. (2009). MEME SUITE: tools for motif discovery and searching. Nucleic Acids Res. 37, W202–W208. doi: 10.1093/nar/gkp335
Bali, S., Jamwal, V. L., Kaur, P., Kohli, S. K., Ohri, P., Gandhi, S. G., et al. (2019). Role of P-type ATPase metal transporters and plant immunity induced by jasmonic acid against Lead (Pb) toxicity in tomato. Ecotoxicology Environ. Safety. 174, 283–294. doi: 10.1016/j.ecoenv.2019.02.084
Berardini, T. Z., Reiser, L., Li, D., Mezheritsky, Y., Muller, R., Strait, E., et al. (2015). The Arabidopsis information resource: Making and mining the “gold standard” annotated reference plant genome. Genesis. 53, 474–485. doi: 10.1002/dvg.22877
Biswal, A. K., Atmodjo, M. A., Pattathil, S., Amos, R. A., Yang, X., Winkeler, K., et al. (2018). Working towards recalcitrance mechanisms: increased xylan and homogalacturonan production by overexpression of GAlactUronosylTransferase12 (GAUT12) causes increased recalcitrance and decreased growth in Populus. Biotechnol. Biofuels. 11, 9. doi: 10.1186/s13068-017-1002-y
Biswal, A. K., Hao, Z., Pattathil, S., Yang, X., Winkeler, K., Collins, C., et al. (2015). Downregulation of GAUT12 in Populus deltoides by RNA silencing results in reduced recalcitrance, increased growth and reduced xylan and pectin in a woody biofuel feedstock. Biotechnol. Biofuels. 8, 41. doi: 10.1186/s13068-015-0218-y
Bouton, S., Leboeuf, E., Mouille, G., Leydecker, M. T., Talbotec, J., Granier, F., et al. (2002). Quasimodo1 encodes a putative membrane-bound glycosyltransferase required for normal pectin synthesis and cell adhesion in Arabidopsis. Plant Cell. 14, 2577–2590. doi: 10.1105/tpc.004259
Brown, D. M., Goubet, F., Wong, V. W., Goodacre, R., Stephens, E., Dupree, P., et al. (2007). Comparison of five xylan synthesis mutants reveals new insight into the mechanisms of xylan synthesis. Plant J. 52, 1154–1168. doi: 10.1111/j.1365-313X.2007.03307.x
Caffall, K. H. and Mohnen, D. (2009). The structure, function, and biosynthesis of plant cell wall pectic polysaccharides. Carbohydr. Res. 344, 1879–1900. doi: 10.1016/j.carres.2009.05.021
Chatterjee, M., Berbezy, P., Vyas, D., Coates, S., and Barsby, T. (2005). Reduced expression of a protein homologous to glycogenin leads to reduction of starch content in Arabidopsis leaves. Plant Science. 168, 501–509. doi: 10.1016/j.plantsci.2004.09.015
Chen, C., Wu, Y., Li, J., Wang, X., Zeng, Z., Xu, J., et al. (2023). TBtools-II: A “one for all, all for one” bioinformatics platform for biological big-data mining. Mol. Plant 16, 1733–1742. doi: 10.1016/j.molp.2023.09.010
Fan, C., Lyu, M., Zeng, B., He, Q., Wang, X., Lu, M. Z., et al. (2024). Profiling of the gene expression and alternative splicing landscapes of Eucalyptus grandis. Plant Cell Environ. 47, 1363–1378. doi: 10.1111/pce.14814
Gigli-Bisceglia, N., Engelsdorf, T., and Hamann, T. (2020). Plant cell wall integrity maintenance in model plants and crop species-relevant cell wall components and underlying guiding principles. Cell. Mol. Life Sci. 77, 2049–2077. doi: 10.1007/s00018-019-03388-8
Horton, P., Park, K. J., Obayashi, T., Fujita, N., Harada, H., Adams-Collier, C. J., et al. (2007). WoLF PSORT: protein localization predictor. Nucleic Acids Res. 35, W585–W587. doi: 10.1093/nar/gkm259
Jiang, Y. and Deyholos, M. K. (2006). Comprehensive transcriptional profiling of NaCl-stressed Arabidopsis roots reveals novel classes of responsive genes. BMC Plant Biol. 6, 25. doi: 10.1186/1471-2229-6-25
Kang, X., Kirui, A., Dickwella Widanage, M. C., Mentink-Vigier, F., Cosgrove, D. J., and Wang, T. (2019). Lignin-polysaccharide interactions in plant secondary cell walls revealed by solid-state NMR. Nat. Commun. 10, 347. doi: 10.1038/s41467-018-08252-0
Kirch, R., Astarita, L. V., Santarém, E. R., and Pasquali, G. (2011). Eucalyptus transgenic plants: from genetic transformation protocols to biosafety analysis. BMC Proc. 5, P179. doi: 10.1186/1753-6561-5-S7-P179
Kong, W., Gong, Z., Zhong, H., Zhang, Y., Zhao, G., Gautam, M., et al. (2019). Expansion and Evolutionary Patterns of Glycosyltransferase Family 8 in Gramineae Crop Genomes and Their Expression under Salt and Cold Stresses in Oryza sativa ssp. japonica. Biomolecules. 9, 188. doi: 10.3390/biom9050188
Kubicek, C. P., Starr, T. L., and Glass, N. L. (2014). Plant cell wall–degrading enzymes and their secretion in plant-pathogenic fungi. Annu. Rev. Phytopathology. 52, 427–451. doi: 10.1146/annurev-phyto-102313-045831
Lairson, L. L., Henrissat, B., Davies, G. J., and Withers, S. G. (2008). Glycosyltransferases: structures, functions, and mechanisms. Annu. Rev. Biochem. 77, 521–555. doi: 10.1146/annurev.biochem.76.061005.092322
Lee, C., Zhong, R., Richardson, E. A., Himmelsbach, D. S., McPhail, B. T., and Ye, Z.-H. (2007). The PARVUS gene is expressed in cells undergoing secondary wall thickening and is essential for glucuronoxylan biosynthesis. Plant Cell Physiol. 48, 1659–1672. doi: 10.1093/pcp/pcm155
Lescot, M., Déhais, P., Thijs, G., Marchal, K., Moreau, Y., Van de Peer, Y., et al. (2002). PlantCARE, a database of plant cis-acting regulatory elements and a portal to tools for in silico analysis of promoter sequences. Nucleic Acids Res. 30, 325–327. doi: 10.1093/nar/30.1.325
Letunic, I. and Bork, P. (2024). Interactive Tree of Life (iTOL) v6: recent updates to the phylogenetic tree display and annotation tool. Nucleic Acids Res. 52, W78–w82. doi: 10.1093/nar/gkae268
Li, L. S., Tang, J. Y., Wu, A. M., Fan, C. J., and Li, H. L. (2024). Genome-wide identification and functional analysis of the GUX gene family in eucalyptus grandis. Int. J. Mol. Sci. 25. doi: 10.3390/ijms25158199
Li, Q. Z., Min, D. Y., Wang, J. P. Y., Peszlen, I., Horvath, L., Horvath, B., et al. (2011). Down-regulation of glycosyltransferase 8D genes in Populus trichocarpa caused reduced mechanical strength and xylan content in wood. Tree Physiol. 31, 226–236. doi: 10.1093/treephys/tpr008
Liu, Y. J., Wang, X. R., and Zeng, Q. Y. (2019). De novo assembly of white poplar genome and genetic diversity of white poplar population in Irtysh River basin in China. Sci. China Life Sci. 62, 609–618. doi: 10.1007/s11427-018-9455-2
Lyczakowski, J. J., Yu, L., Terrett, O. M., Fleischmann, C., Temple, H., Thorlby, G., et al. (2021). Two conifer GUX clades are responsible for distinct glucuronic acid patterns on xylan. New Phytologist. 231, 1720–1733. doi: 10.1111/nph.17531
Melesse, S. F. and Zewotir, T. (2017). Variation in growth potential between hybrid clones of Eucalyptus trees in eastern South Africa. J. Forestry Res. 28, 1157–1167. doi: 10.1007/s11676-017-0400-0
Mir, M. A., John, R., AlYemeni, M. N., Alam, P., and Ahmad, P. (2018). Jasmonic acid ameliorates alkaline stress by improving growth performance, ascorbate glutathione cycle and glyoxylase system in maize seedlings. Sci. Rep. 8, 2831. doi: 10.1038/s41598-018-21097-3
Mohnen, D. (2008). Pectin structure and biosynthesis. Curr. Opin. Plant Biol. 11, 266–277. doi: 10.1016/j.pbi.2008.03.006
Myburg, A. A., Grattapaglia, D., Tuskan, G. A., Hellsten, U., Hayes, R. D., Grimwood, J., et al. (2014). The genome of Eucalyptus grandis. Nature. 510, 356–362. doi: 10.1038/nature13308
Orfila, C., Sorensen, S. O., Harholt, J., Geshi, N., Crombie, H., Truong, H. N., et al. (2005). QUASIMODO1 is expressed in vascular tissue of Arabidopsis thaliana inflorescence stems, and affects homogalacturonan and xylan biosynthesis. Planta. 222, 613–622. doi: 10.1007/s00425-005-0008-z
Panchy, N., Lehti-Shiu, M., and Shiu, S.-H. (2016). Evolution of gene duplication in plants. Plant Physiol. 171, 2294–2316. doi: 10.1104/pp.16.00523
Peña, M. J., Zhong, R. Q., Zhou, G. K., Richardson, E. A., O’Neill, M. A., Darvill, A. G., et al. (2007). Arabidopsis irregular xylem8 and irregular xylem9: Implications for the complexity of glucuronoxylan biosynthesis. Plant Cell. 19, 549–563. doi: 10.1105/tpc.106.049320
Persson, S., Caffall, K. H., Freshour, G., Hilley, M. T., Bauer, S., Poindexter, P., et al. (2007). The Arabidopsis irregular xylem8 mutant is deficient in glucuronoxylan and homogalacturonan, which are essential for secondary cell wall integrity. Plant Cell. 19, 237–255. doi: 10.1105/tpc.106.047720
Piotrowska, A., Bajguz, A., Godlewska-Żyłkiewicz, B., Czerpak, R., and Kamińska, M. (2009). Jasmonic acid as modulator of lead toxicity in aquatic plant Wolffia arrhiza (Lemnaceae). Environ. Exp. Botany. 66, 507–513. doi: 10.1016/j.envexpbot.2009.03.019
Rennie, E. A., Hansen, S. F., Baidoo, E. E. K., Hadi, M. Z., Keasling, J. D., and Scheller, H. V. (2012). Three members of the arabidopsis glycosyltransferase family 8 are xylan glucuronosyltransferases. Plant Physiol. 159, 1408–1417. doi: 10.1104/pp.112.200964
Ridley, B. L., O’Neill, M. A., and Mohnen, D. (2001). Pectins: structure, biosynthesis, and oligogalacturonide-related signaling. Phytochemistry. 57, 929–967. doi: 10.1016/S0031-9422(01)00113-3
Shri, M., Singh, P. K., Kidwai, M., Gautam, N., Dubey, S., Verma, G., et al. (2019). Recent advances in arsenic metabolism in plants: current status, challenges and highlighted biotechnological intervention to reduce grain arsenic in rice. Metallomics. 11, 519–532. doi: 10.1039/c8mt00320c
Sinnott, M. L. (1990). Catalytic mechanism of enzymic glycosyl transfer. Chem. Rev. 90, 1171–1202. doi: 10.1021/cr00105a006
Sterling, J. D., Atmodjo, M. A., Inwood, S. E., Kolli, V. S. K., Quigley, H. F., Hahn, M. G., et al. (2006). Functional identification of an Arabidopsis pectin biosynthetic homogalacturonan galacturonosyltransferase. Proc. Natl. Acad. Sci. United States America. 103, 5236–5241. doi: 10.1073/pnas.0600120103
Suo, J., Zhang, S., Xu, C., Chang, R., Xu, X., Liu, G., et al. (2022). Identification and expression analysis of the PtGATL genes under different nitrogen and carbon dioxide treatments in Populus trichocarpa. 3 Biotech. 12, 67. doi: 10.1007/s13205-022-03129-y
Taji, T., Ohsumi, C., Iuchi, S., Seki, M., Kasuga, M., Kobayashi, M., et al. (2002). Important roles of drought- and cold-inducible genes for galactinol synthase in stress tolerance in Arabidopsis thaliana. Plant J. 29, 417–426. doi: 10.1046/j.0960-7412.2001.01227.x
Tamura, K., Stecher, G., and Kumar, S. (2021). MEGA11: molecular evolutionary genetics analysis version 11. Mol. Biol. Evol. 38, 3022–3027. doi: 10.1093/molbev/msab120
Wang, W. Q., Wu, Y. R., and Messing, J. (2014). RNA-Seq transcriptome analysis of Spirodela dormancy without reproduction. BMC Genomics 15, 60. doi: 10.1186/1471-2164-15-60
Wang, X., Zhang, Z. X., Li, J. L., and Wang, Y. X. (2024). Genome-wide analysis of the GT8 gene family in apple and functional identification of MhGolS2 in saline-alkali tolerance. Plant Mol. Biol. 114, 60. doi: 10.1007/s11103-024-01499-w
Wang, Y., Zhang, J., Qiu, Z., Zeng, B., Zhang, Y., Wang, X., et al. (2021). Transcriptome and structure analysis in root of Casuarina equisetifolia under NaCl treatment. PeerJ. 9, e12133. doi: 10.7717/peerj.12133
Waterhouse, A., Bertoni, M., Bienert, S., Studer, G., Tauriello, G., Gumienny, R., et al. (2018). SWISS-MODEL: homology modelling of protein structures and complexes. Nucleic Acids Res. 46, W296–w303. doi: 10.1093/nar/gky427
Yin, Y., Chen, H., Hahn, M. G., Mohnen, D., and Xu, Y. (2010). Evolution and function of the plant cell wall synthesis-related glycosyltransferase family 8. Plant Physiol. 153, 1729–1746. doi: 10.1104/pp.110.154229
Yu, L., Yoshimi, Y., Cresswell, R., Wightman, R., Lyczakowski, J. J., Wilson, L. F. L., et al. (2022). Eudicot primary cell wall glucomannan is related in synthesis, structure, and function to xyloglucan. Plant Cell. 34, 4600–4622. doi: 10.1093/plcell/koac238
Zabotina, O. A. (2012). Xyloglucan and its biosynthesis. Front. Plant Science. 3. doi: 10.3389/fpls.2012.00134
Keywords: glycosyltransferase, GT8, gene family, Eucalyptus grandis, functional analysis
Citation: Jie Y, Liu L, Li L, Wu A-M, Fan C and Liu S (2025) Comprehensive genome-wide identification and functional analysis of the GT8 gene family in Eucalyptus Grandis. Front. Plant Sci. 16:1610059. doi: 10.3389/fpls.2025.1610059
Received: 11 April 2025; Accepted: 31 May 2025;
Published: 19 June 2025.
Edited by:
Baohua Wang, Nantong University, ChinaReviewed by:
Jing Xu, Chinese Academy of Forestry, ChinaZhongyi Yang, Zhejiang Wanli University, China
Copyright © 2025 Jie, Liu, Li, Wu, Fan and Liu. This is an open-access article distributed under the terms of the Creative Commons Attribution License (CC BY). The use, distribution or reproduction in other forums is permitted, provided the original author(s) and the copyright owner(s) are credited and that the original publication in this journal is cited, in accordance with accepted academic practice. No use, distribution or reproduction is permitted which does not comply with these terms.
*Correspondence: Chunjie Fan, ZmFuY2h1bmppZUBjYWYuYWMuY24=; Siwen Liu, bGl1c2l3ZW4yMDA4QDEyNi5jb20=
†These authors have contributed equally to this work and share first authorship