 Asad Ullah1,2†
 Zhijun Tong3†
 Muhammad Kamran1,2
 Feng Lin1,2
 Tianneng Zhu1,2Muhammad Shahzad1Umaira1,2
 Xuejun Chen3Bingguang Xiao3*
 Haiming Xu1,2*
- 1Institute of Crop Science, College of Agriculture and Biotechnology, Zhejiang University, Zhejiang, Hangzhou, China
- 2Institute of Bioinformatics, College of Agriculture and Biotechnology, Zhejiang University, Zhejiang, Hangzhou, China
- 3Key Laboratory of Tobacco Biotechnological Breeding, National Tobacco Genetic Engineering Research Center, Yunnan Academy of Tobacco Agricultural Sciences, Yunnan, Kunming, China
Tobacco (Nicotiana tabacum L.) is a significant industrial crop whose leaves serve as the primary raw material for various smoking products. However, the genetic basis of tobacco leaf chemical composition which is a key factor in product quality, remains largely unexplored. To address this, a QTL study was undertaken to pinpoint genomic loci associated with 21 leaf chemistry traits using a recombinant inbred line population of 271 genotypes evaluated across multiple environments. Variance components and heritability were estimated for nine multi-environment phenotypes. Phenotypic correlations between paired traits were calculated within each environment, while genotypic correlations were estimated across multi-environment phenotypes. Mixed-linear-model-based composite interval mapping (MCIM) was employed using QTLNetwork, leading to the identification of 18 QTLs with significant individual effects. Among these, qPA15-18 and qGA15-18 exhibited pleiotropic effects, while three epistatic QTL pairs associated with chlorogenic acid (CHA) and rutin (RU) were also detected. Notably, no significant QTL-by-environment interactions were observed. Through integration of association mapping, bioinformatics analysis and gene enrichment analysis of the QTL regions, we predicted three candidate genes. Nt08g00266 and Nt22g03479 were identified as pleiotropic genes associated with starch and total sugar, and with total sugar and reducing sugar, respectively. While, Nt16g00236 exhibited significant association with total plant alkaloid. This study lays the groundwork for tobacco varieties with enhanced chemical composition by targeting the identified QTLs and candidate genes, ultimately contributing to production of higher-quality smoking products.
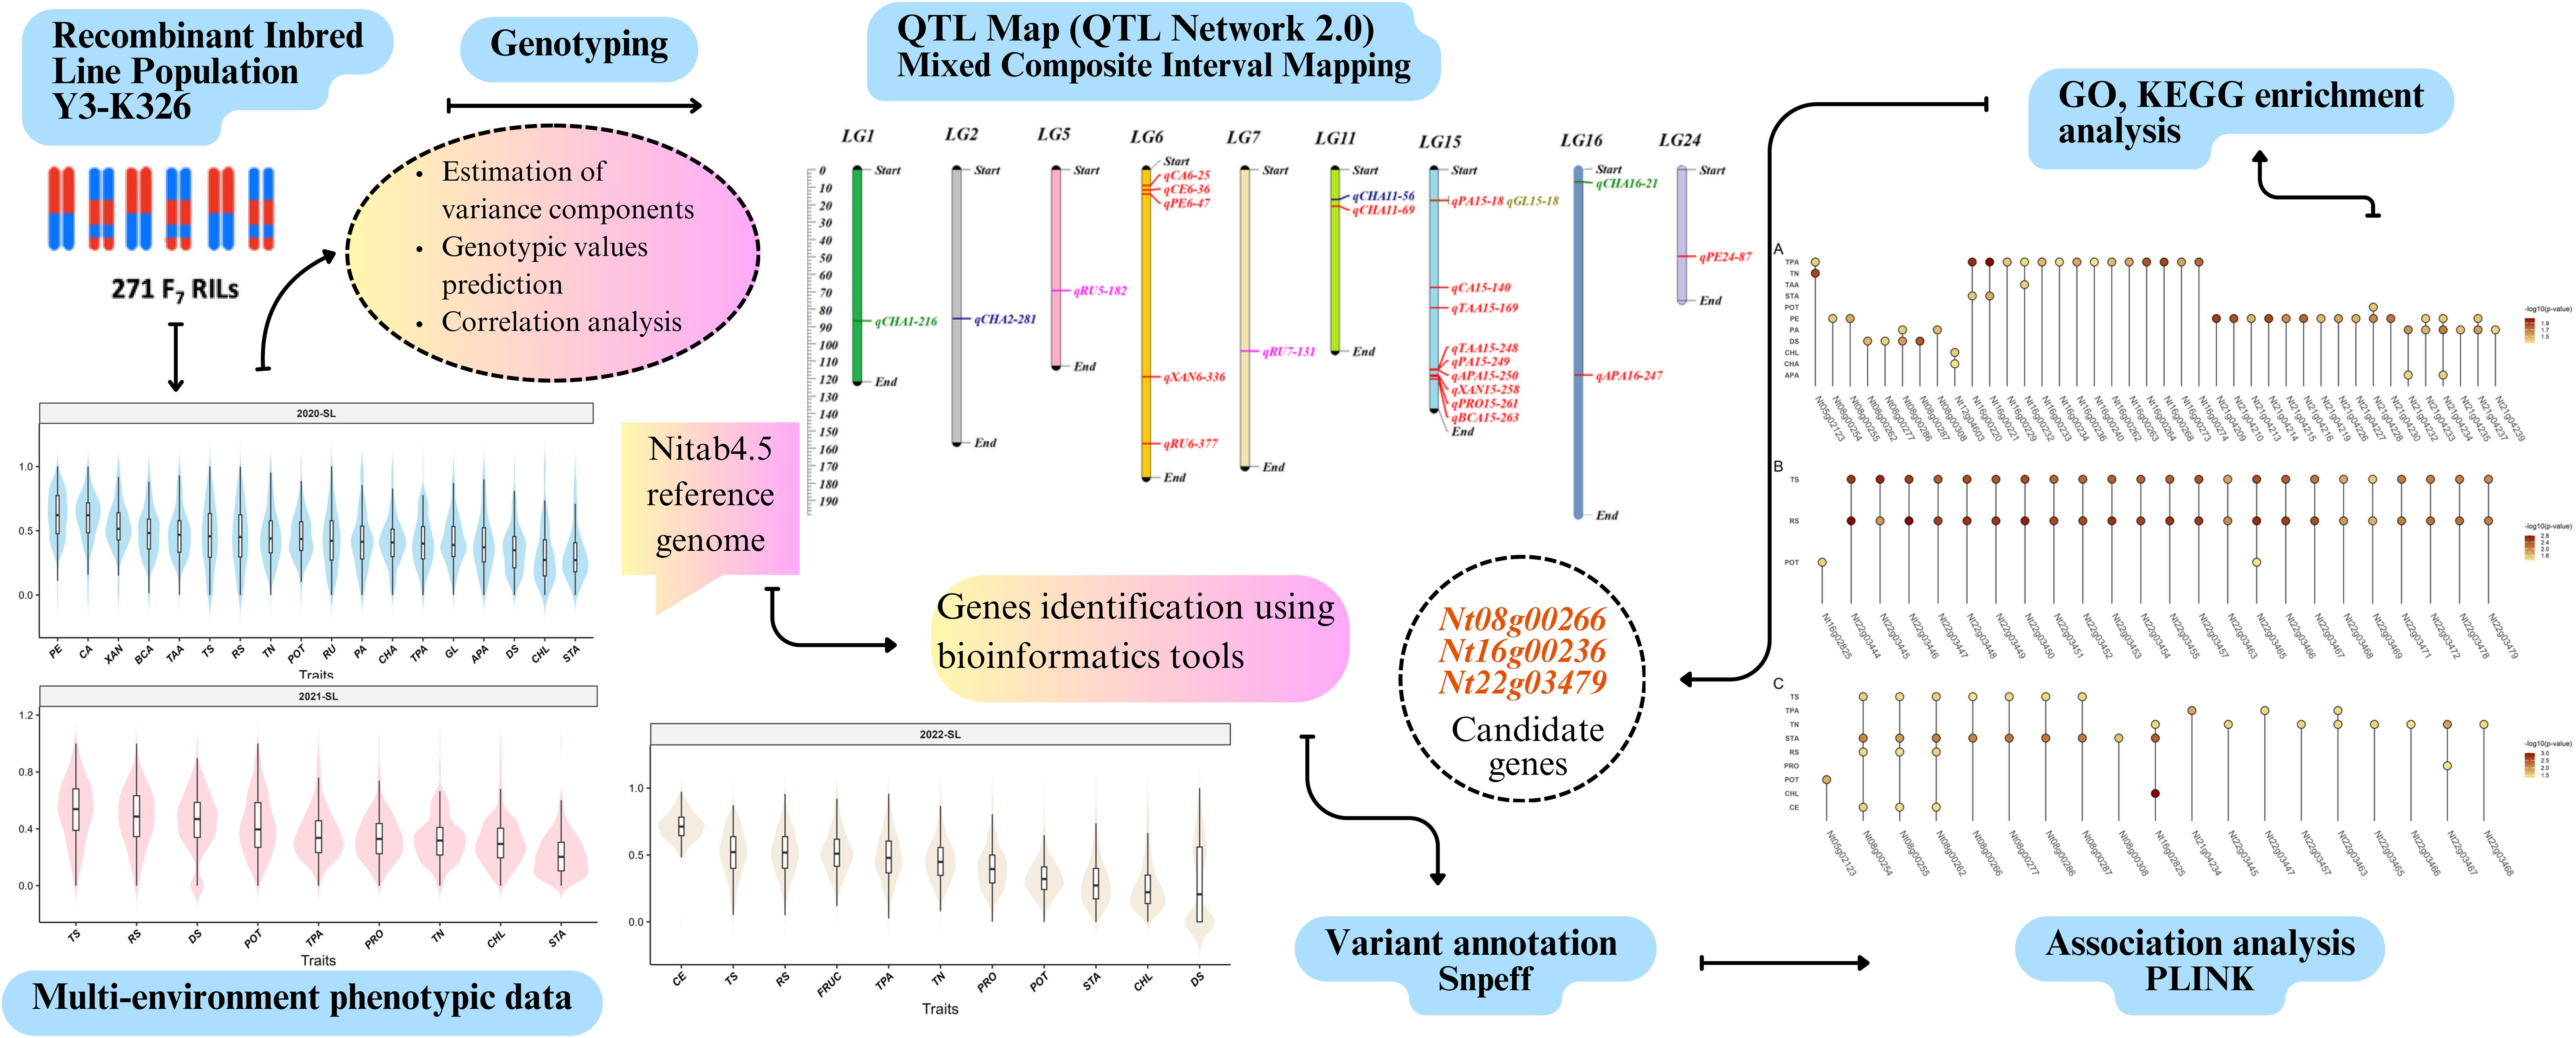
Graphical Abstract.
1 Introduction
Tobacco (Nicotiana Tabaccum L.) is an allopolyploid species (2n = 48) that originated from interspecific hybridization between N. Sylvestris (2n=24) and N. tomentosiformis (2n=24) (Tong et al., 2020, 2021). It is predominantly known for its leaves, which are used in the production of various smoking products intended to be chewed, snuffed, sucked, or smoked (Li et al., 2023). The quality of these smoking products and tobacco yield largely depends on the chemical composition of their leaves (Li et al., 2023). Tobacco is a chemically complex plant in which approximately 3000 chemical constituents have been identified and characterized in its leaves and around 4000 in its smoke (Leffingwell, 1999). These chemical constituents provide the framework for tobacco leaf chemistry and differentiate different tobacco types like flue-cured, air-cured, and oriental (Leffingwell, 1999; Ji et al., 2024).
Among the key chemical traits in tobacco, total plant alkaloids primarily nicotine, range from 0.5% to 8%, within the main cultivars, N. tabacum and N. rustica. Alkaloids define stimulating properties and positively correlate with taste and smoking density (Leffingwell, 1999). Besides the alkaloids, carbohydrates are the main component in determining the smoke quality (Stedman, 1968). Sugars (reducing sugar, total sugar) constitute 10–20% of dry leaf matter and enhance the flavor by adding sweetness and mitigating the harshness of nicotine and other alkaloids (Talhout et al., 2006; Tong et al., 2025). Cellulose is more concentrated in the midrib than in the lamina of the leaf and provides structural stability (Stedman, 1968). However, excessive cellulose imparts an unpleasant, burnt paper-like taste (Leffingwell, 1999). Pectin not only strengthens the leaf structure but also contributes to desirable aroma and flavor during combustion (Zhu et al., 2014). Nitrogenous compounds, such as proteins and amino acids have complex roles in tobacco quality (Chaplin, 1975). These compounds assess the strength, smoking, and blending qualities. In general, nitrogenous chemicals were thought to have an inverse relationship with quality (Mendell et al., 1984). A lower nitrogen level typically indicates a lighter and less desirable taste. Phenols also influence smoke flavor, quality, and scent thus acting as flavoring precursors. For instance, chlorogenic acid and rutin positively correlate with the quality of flue-cured tobacco. Tobacco ash contains minerals such as calcium, potassium, magnesium, chlorine, phosphorus, and sulphur affect the burning properties (Leffingwell, 1999). For instance, magnesium and potassium accelerate the burn rate, while phosphorus and chloride slow it down (Camlica and Yaldiz, 2021). Additionally, pigments such as lutein, β-carotene, and xanthophyll, serve as the precursors for volatile aroma compounds. These pigments degrade during curing to enhance tobacco flavor. Carboxylic acids including citric, malic, oxalic, and malonic acids also play a role with an inverse relationship observed between citric and oxalic levels and smoking quality (Leffingwell, 1999). This complex interrelationship between alkaloids, carbohydrates, structural components, nitrogenous compounds, minerals, and organic acids highlights the complexity of tobacco leaf composition, making it the primary objective of tobacco breeders.
Due to the complex genetic architecture and the quantitative nature of leaf chemistry traits, most QTL studies in tobacco have focused on simpler traits, such as disease resistance (Cheng et al., 2019), and agronomic traits including yield (Cheng et al., 2015; Ikram et al., 2022a; Liu et al., 2022; Tong et al., 2024). Consequently, there is limited QTL information available on leaf chemistry traits (Julio et al., 2006; Tong et al., 2020, 2025). Therefore, additional research is required to develop more molecular markers, discover more QTLs, and identify genes carrying valuable alleles to elucidate the genetic architecture of these traits.
In the present study, QTL mapping was conducted using multi-environment phenotypic data and a genetic linkage map integrated with SNP-InDel-SSR (Tong et al., 2023). This revealed 18 QTLs with additive individual effects and 3 QTLs with epistatic interactions. QTL mapping combined with bioinformatics and association analysis pinpointed 3 candidate genes showing significant association with total plant alkaloid (TPA), total sugar (TS), reducing sugar (RS) and starch (STA). These findings provide new insights into the genetic basis of tobacco leaf composition traits and offer valuable resources for genomics-assisted breeding to improve the quality of smoking products.
2 Materials and methods
2.1 Plant material and experimental design
The recombinant inbred line (RIL_F7) population was derived from two parental lines, Y3 and K326 through the single-seed descent method. This population contains 271 genotypes and was planted at Shilin in a completely randomized design in 2020, 2021, and 2022 years, which were treated as three distinct environments. The evaluated traits for each genotype included total nitrogen % (TN), potassium % (POT), chlorine % (CHL), reducing sugar % (RS), total plant alkali % (TPA), total sugar % (TS), starch % (STA), chlorogenic acid mg/g (CHA), rutin mg/g (RU), fructose % (FRUC), xanthophyll μg/g (XAN), beta-carotene μg/g (BCA), citric acid mg/g (CA), petroleum ether % (PE), cellulose % (CE), the difference between two sugars % (DS), total amino acids (TAA), aspartic acid (APA), phenylalanine (PA), glutamine (GL), and protein % (PRO). These traits were quantified using high-performance liquid chromatography (HPLC) following the procedures detailed in (Julio et al., 2006; Pang et al., 2006; Jing et al., 2016; Wang P. et al., 2024). Eighteen chemical traits were evaluated in E1 (2020-SL), nine traits in E2 (2021-SL), and eleven traits in E3 (2022-SL).
2.2 Statistical analysis
We estimated variance components using the following mixed linear model (Tong et al., 2025).
In this model, represents the phenotypic value of the k-th genotype in the h-th environment; represents the population mean; indicates the genotypic value of the k-th genotype, ; , denotes the effect of the h-th environment; , denotes the residual effect of the k-th genotype in the h-th environment. To estimate variance components (, , ), mmer module of the Sommer R package was utilized and genotypic values were predicted using the best linear unbiased prediction (BLUP) method. Broad sense heritability was calculated using the formula , here represents the genotypic variance and represents residual variances (Tong et al., 2025). Additionally, the pearson correlation coefficient between traits was computed using the rcorr function of the Hmisc R package. Phenotypic correlation coefficients were calculated separately for each environment, while the genetic correlation coefficients were derived from predicted genotypic values using the BLUP method. Finally, the relationship between traits was visualized using the corrplot package in R.
2.3 Genotyping and genetic linkage map
A total of 274 samples, including two parental lines, one F1 hybrid, and 271 F7 individuals, were genotyped using the BIGSEQ-500 platform, following the protocol outlined in our previous study (Tong et al., 2023). High-quality reads were filtered and aligned to the reference genome Nitab4.5 (Edwards et al., 2017) using bioinformatics tools. SNPs and InDels were called out using GATK, with stringent quality control filters. From these data, 46,324 bin markers were constructed and used to develop a high-density linkage map. This map spans a total genetic distance of 3334.88 cM across 24 linkage groups (LGs), with an average marker interval of 0.469 cM (Supplementary Table S1).
2.4 Genetic and statistical model for QTL mapping
We employed a full QTL model to investigate the genetic architecture of complex traits across multi-environment field experiments. This model incorporates the individual additive genetic effect (a) of each QTL, the additive-by-additive epistatic effect of each QTL pair (aa), and their interaction with the environments (ae and aae). We assume ‘s’ is the number of segregating QTLs and ‘t’ denotes the number of QTL pairs exhibiting epistasis. Then, the phenotypic value of the k-th genotype in the h-th environment can be described by the following mixed linear model (Tong et al., 2023):
Where, is the population mean; ai is the additive effect of the i-th QTL with coefficient which is treated as a fixed effect and takes values 1 and for QQ and qq genotypes of QTL, respectively. Similarly, is the additive-by-additive epistatic effect of the i-th and the j-th QTL with coefficient as a fixed effect; is the random effect of the h-th environment, ; indicates the additive by environment interaction effect of the i-th QTL and the h-th environment with coefficient , ; refer to the interaction effect of the h-th environment with , with coefficient , ; is the random residual effect, .
QTL analysis was conducted using QTLNetwork 2.0 (Yang et al., 2008), specifically designed for mixed-linear-model-based composite interval mapping (MCIM). Both one-dimensional (1D) and two-dimensional (2D) genome-wide scans were conducted at a walking speed of 1 cM, To control experiment wise type 1 error rate, a critical F-value based on Henderson method III which was determined by permutation testing 1000 times for each tested locus at a significance level of 0.05. The full QTL model was employed to estimate and test the QTL effects and their significance using the Markov Chain Monte Carlo (MCMC) method. Finally, the distribution of QTLs across linkage groups (Figure 1, Figure 2) was visualized using the LinkageMapView package in R.
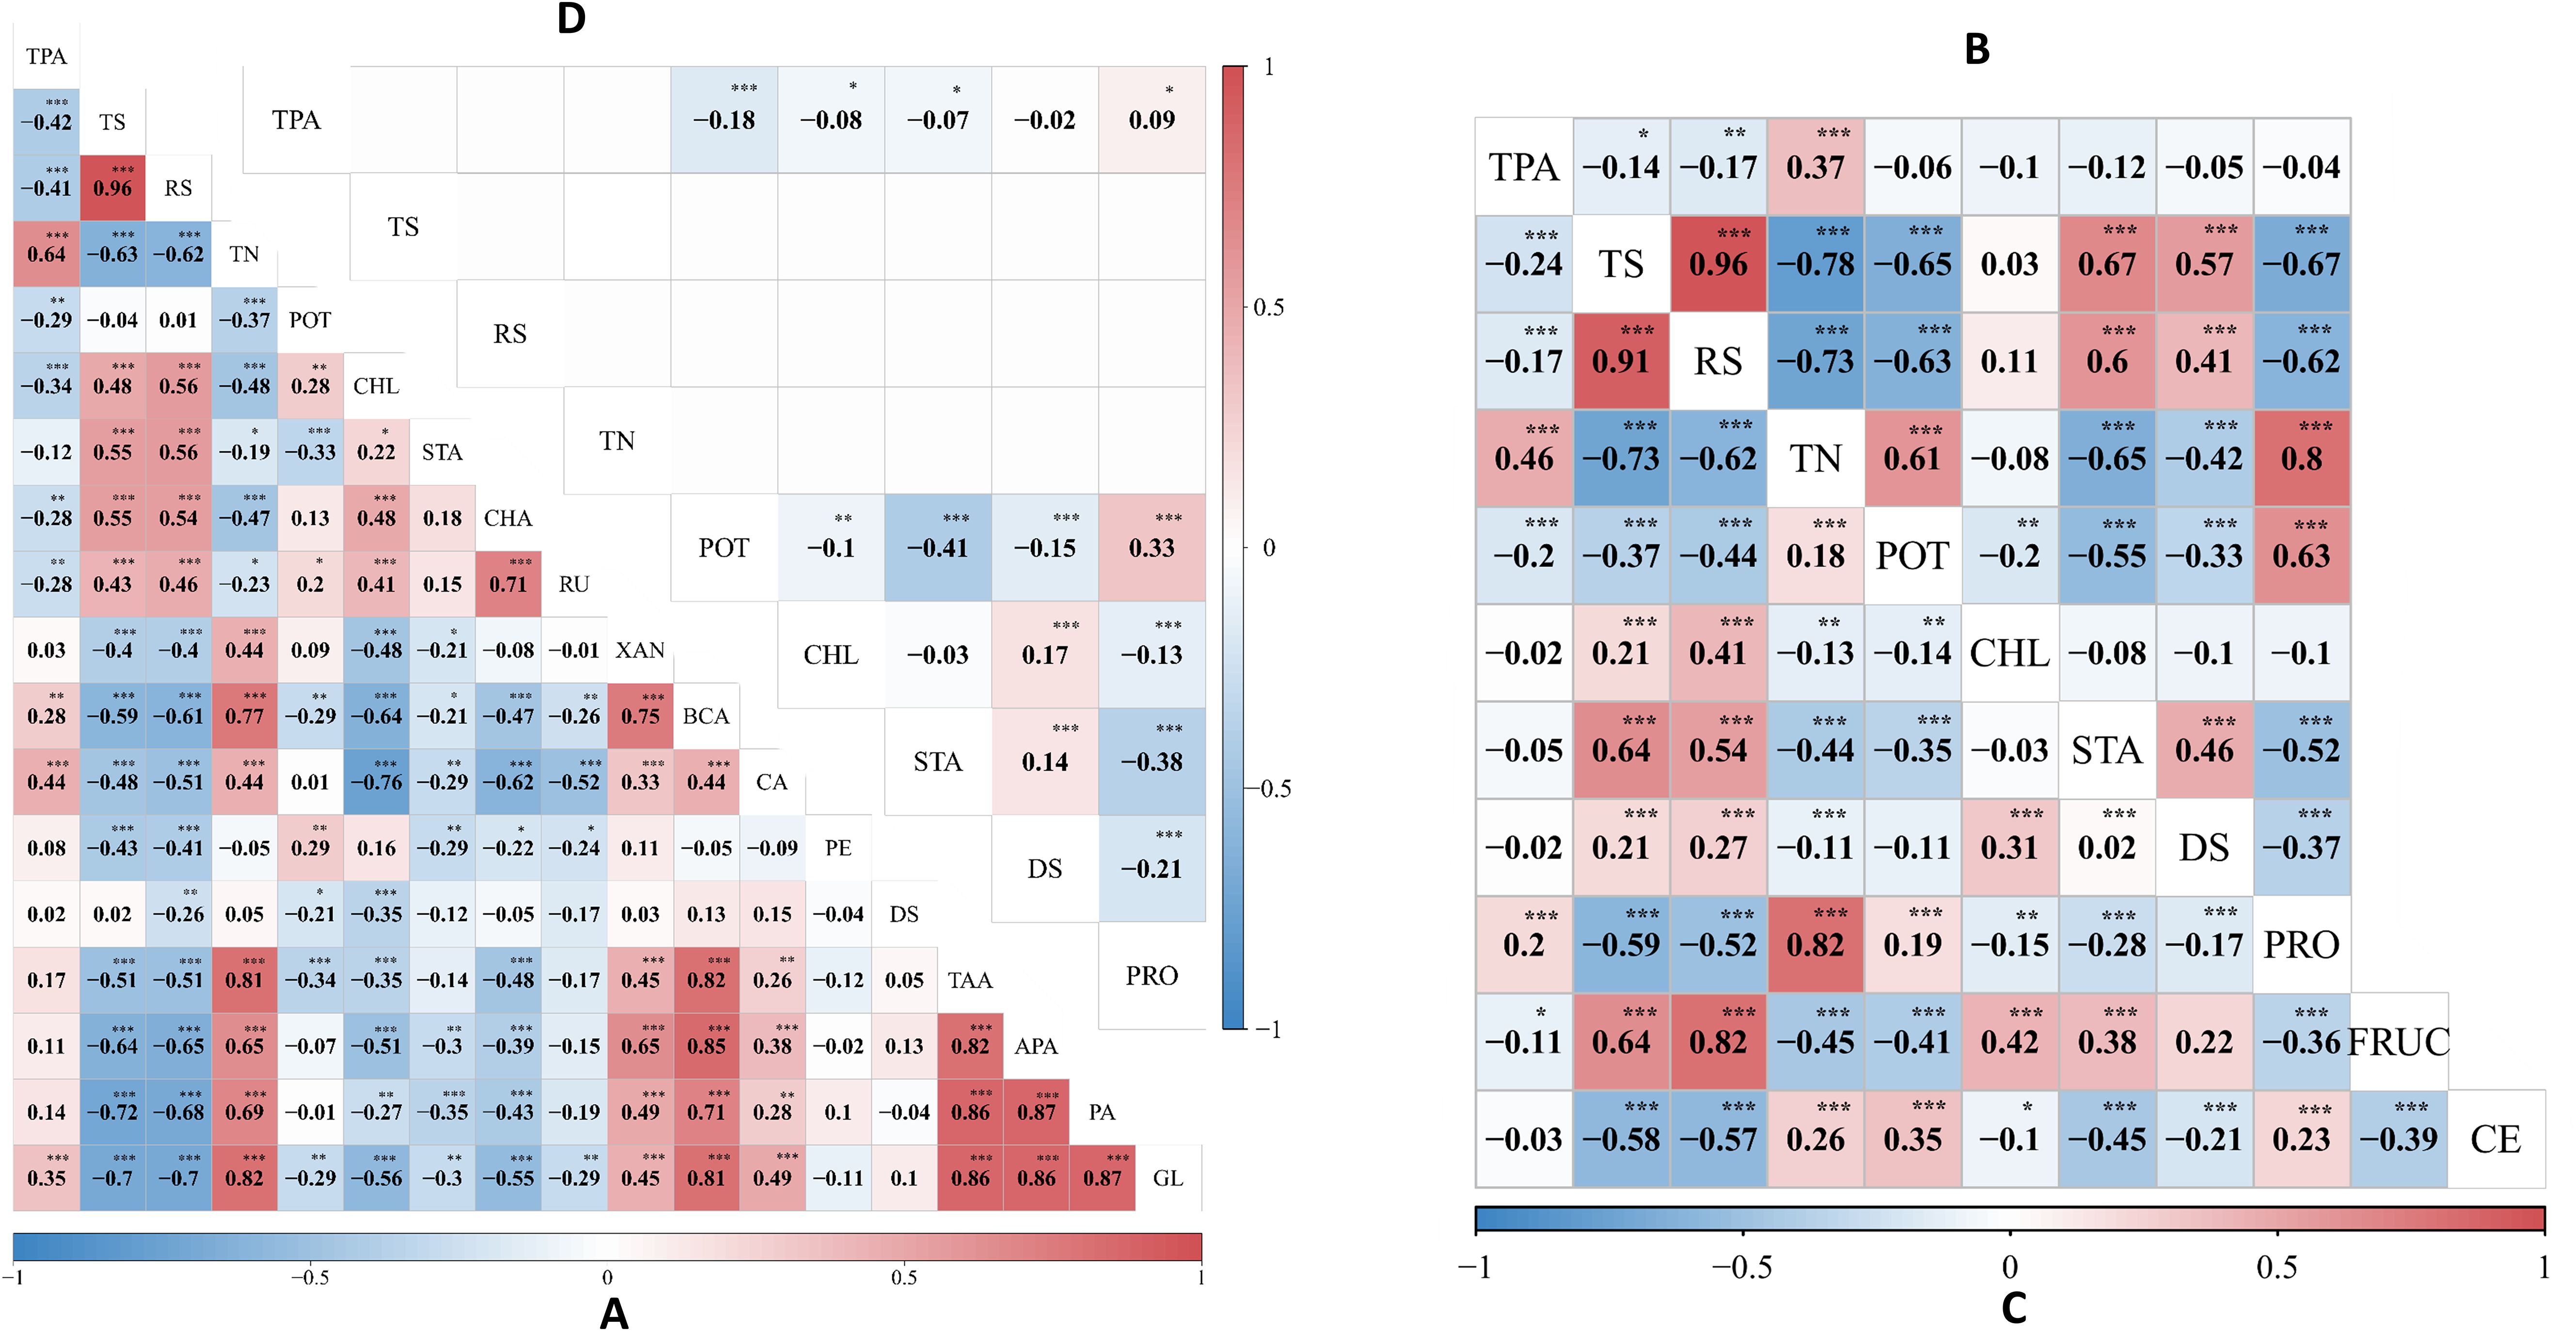
Figure 1. Phenotypic and genotypic correlation analysis across three environments. (A) displays the phenotypic correlation coefficient between 18 traits in E1 (2020-SL), (B) illustrates the phenotypic correlation coefficient between 9 traits in E2 (2021-SL) and (C) shows the phenotypic correlation coefficient between 11 traits in E3 (2022-SL), while (D) exhibits a genotypic correlation. Asterisks (*, **, and ***), denote the significance level at 0.05, 0.01, and 0.001, respectively.
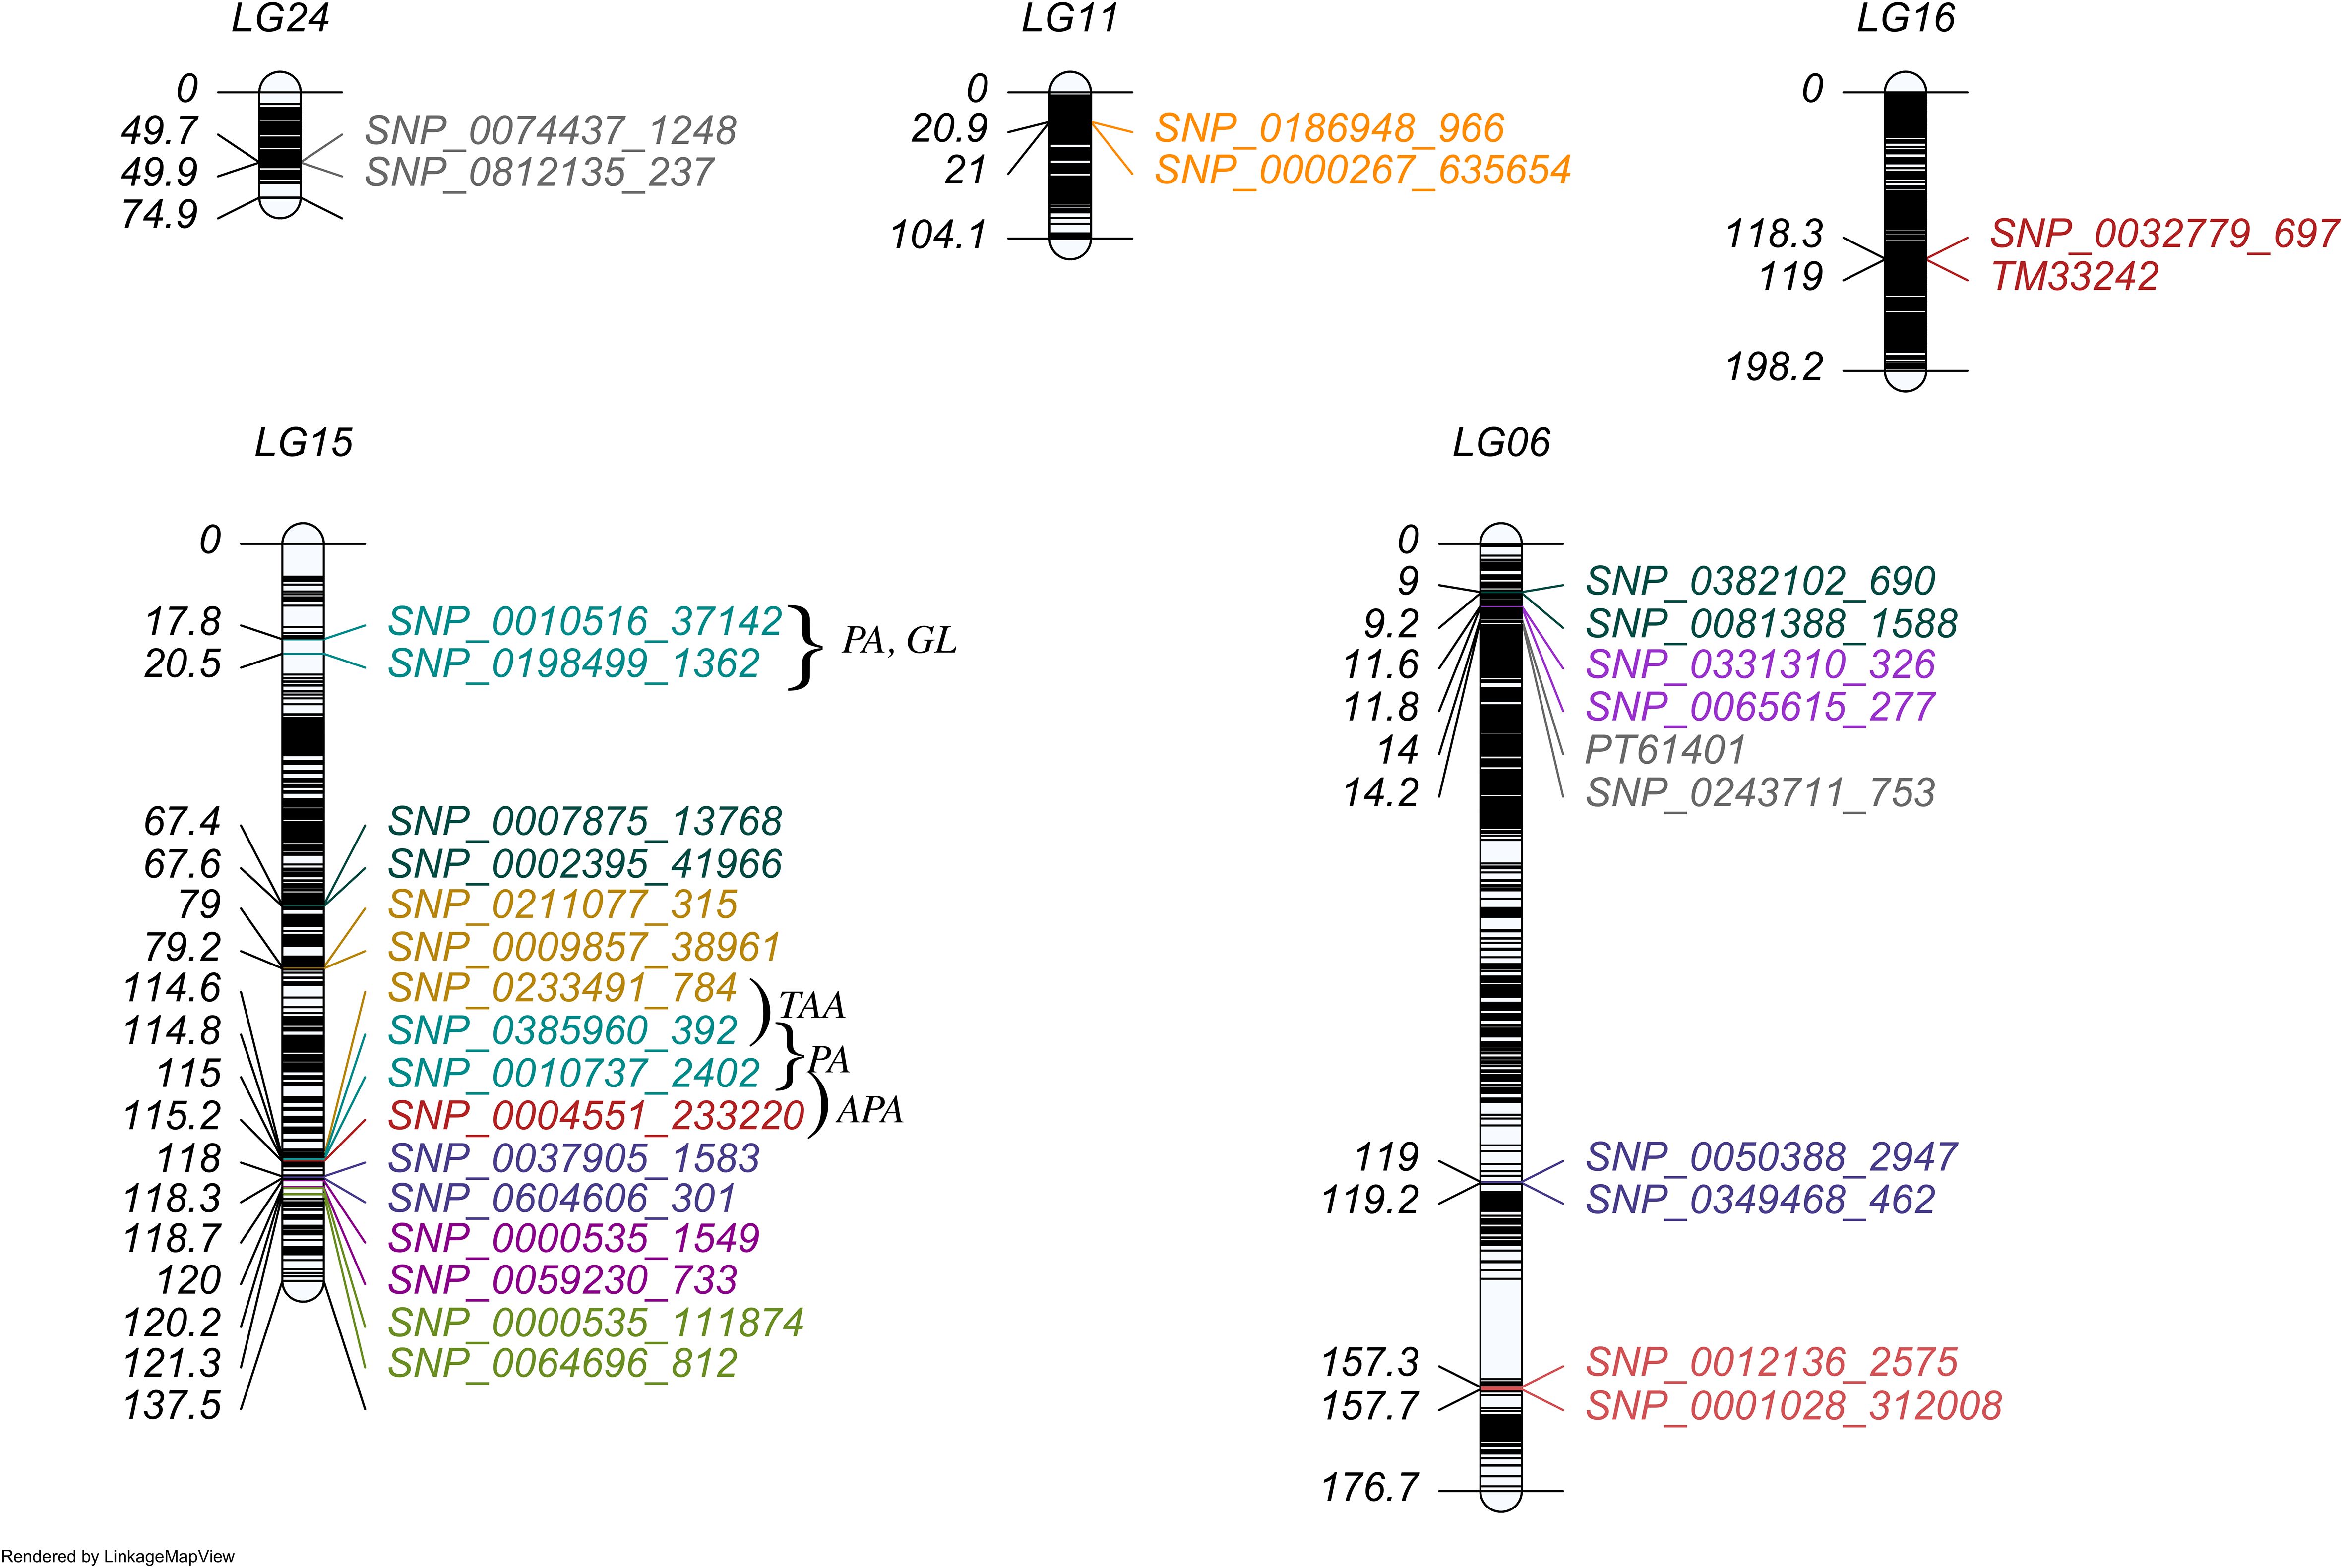
Figure 2. The distribution of QTLs with individual effect in linkage map. Each marker interval represents each QTL region for a specific trait indicated by a corresponding color. The traits were colored as CHA (orange), RU (red salmon), XAN (slate blue), BCA (olive drab), CA (teal), PE (grey), CE (orchid), TAA (golden rod), APA (firebrick), PRO (magenta), While the pleiotropic QTLs (affecting PA, GL) were marked in dark cyan.
2.5 Prediction of candidate genes
Each QTL region was defined by the two flanking bin markers in the genetic linkage map. The sequences of these markers were aligned to the Nitab4.5 reference genome using Burrow Wheeler Aligner with the mem algorithm (Li and Durbin, 2009) and the genes were extracted using intersect function in BEDTools (Quinlan and Hall, 2010). Variants including SNPs and Indels were annotated with SnpEff (Cingolani et al., 2012) and those predicted to have moderate to high impact on protein function were retained for further analysis. These variants were subsequently validated through single marker association analysis using PLINK (Purcell et al., 2007), applying a significance threshold of p < 0.05. For functional enrichment analysis, the protein sequence of Nitab4.5 reference genome was uploaded to eggnog-mapper website. Finally, Gene Ontology (GO) and KEGG pathway enrichment analysis were performed using clusterprofiler R package (Yu et al., 2012). Putative candidate genes were functionally characterized using the BLASTp module of NCBI against the non-redundant (nr) protein database.
3 Results
3.1 Phenotypic evaluation, heritability, and trait correlation analysis
For multi-environment phenotypes, variance components and broad-sense heritability were estimated (Table 1). The heritability of traits TS, RS, TN, and POT was 0, indicating that these traits were predominantly influenced by environmental and error variance. In contrast, traits DS and TPA were significantly influenced by genetic factors, as reflected by their heritability of 75.71% and 44.83%, respectively. The majority of traits exhibited statistically significant but negative correlation values (α=0.05) (Figure 1). Significant phenotypic correlation was observed between TS and RS across all environments, followed by APA and PA in E1 (Figure 1A). The correlation between PA and GL in E1 exhibited a similar trend, as did TN and PRO in E2 and E3, respectively (Figures 1B, C). In contrast, a consistently large negative correlation was observed between TS and TN across all environments, though the magnitude varied. The phenotypic correlation between CHL and STA was positive and significant (α=0.05) in E1 but negative and non-significant in E2 and E3. Overall, the correlation pattern varied slightly across environments but remained consistent with general trends. The highest genetic correlation coefficient of 0.33 was observed between POT and PRO (Figure 1D), accompanied by a substantial phenotypic correlation in E2 and E3 (Figures 1B, C). Additionally, the traits TS, RS, and TN exhibited no genetic correlation, demonstrating that environmental influences drove phenotypic variation rather than shared genetic architecture.
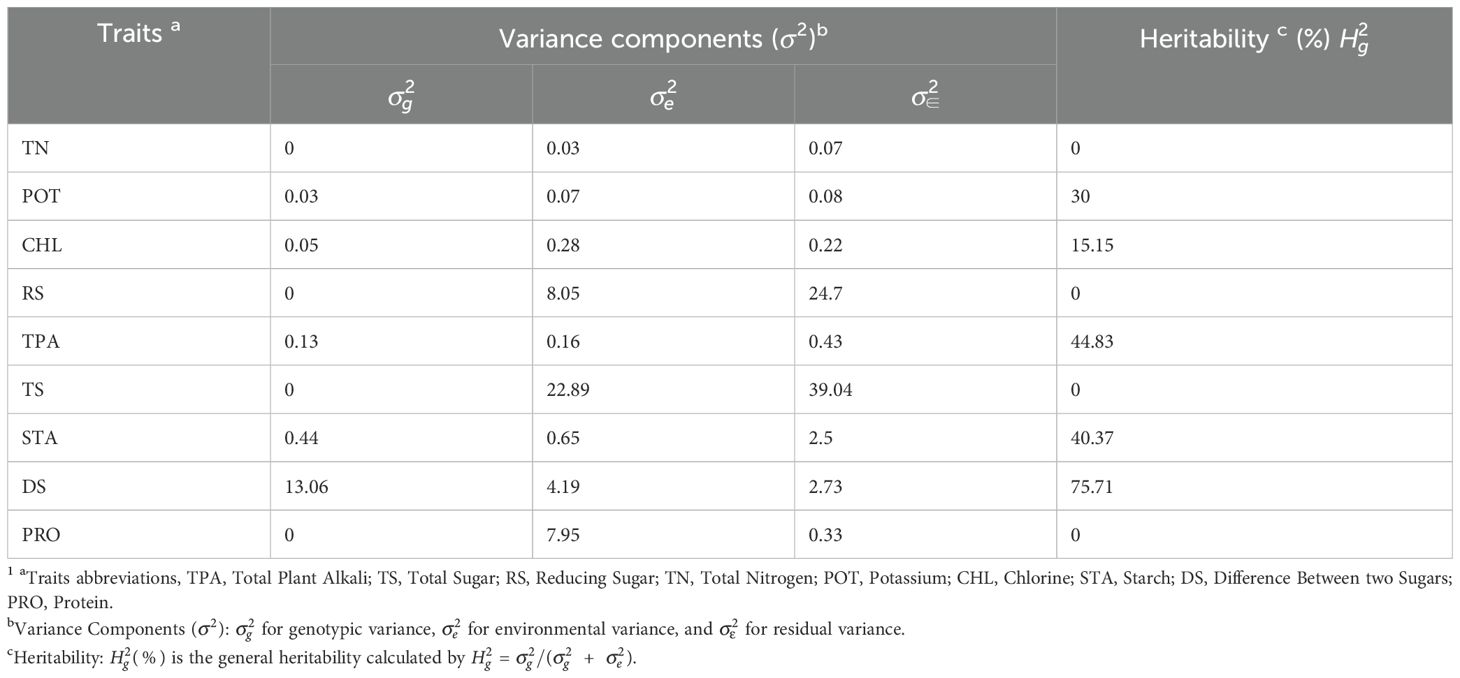
Table 1. Summary of variance analysis of 9 chemical traits across 3 environments.
3.2 QTL distribution on linkage groups
We identified 18 QTLs associated with 12 traits that exhibited significant individual additive effects across 5 linkage groups (Figure 2) and three pairs of epistatic QTLs distributed over 6 linkage groups for two traits (Figure 3). Two epistatic QTL pairs were detected for chlorogenic acid (CHA) and one QTL pair for rutin (RU). LG15 contained the highest number of QTLs with individual additive effects (10 QTLs), followed by LG06 with 5 QTLs. LG11, LG16, and LG24 each carried one QTL.
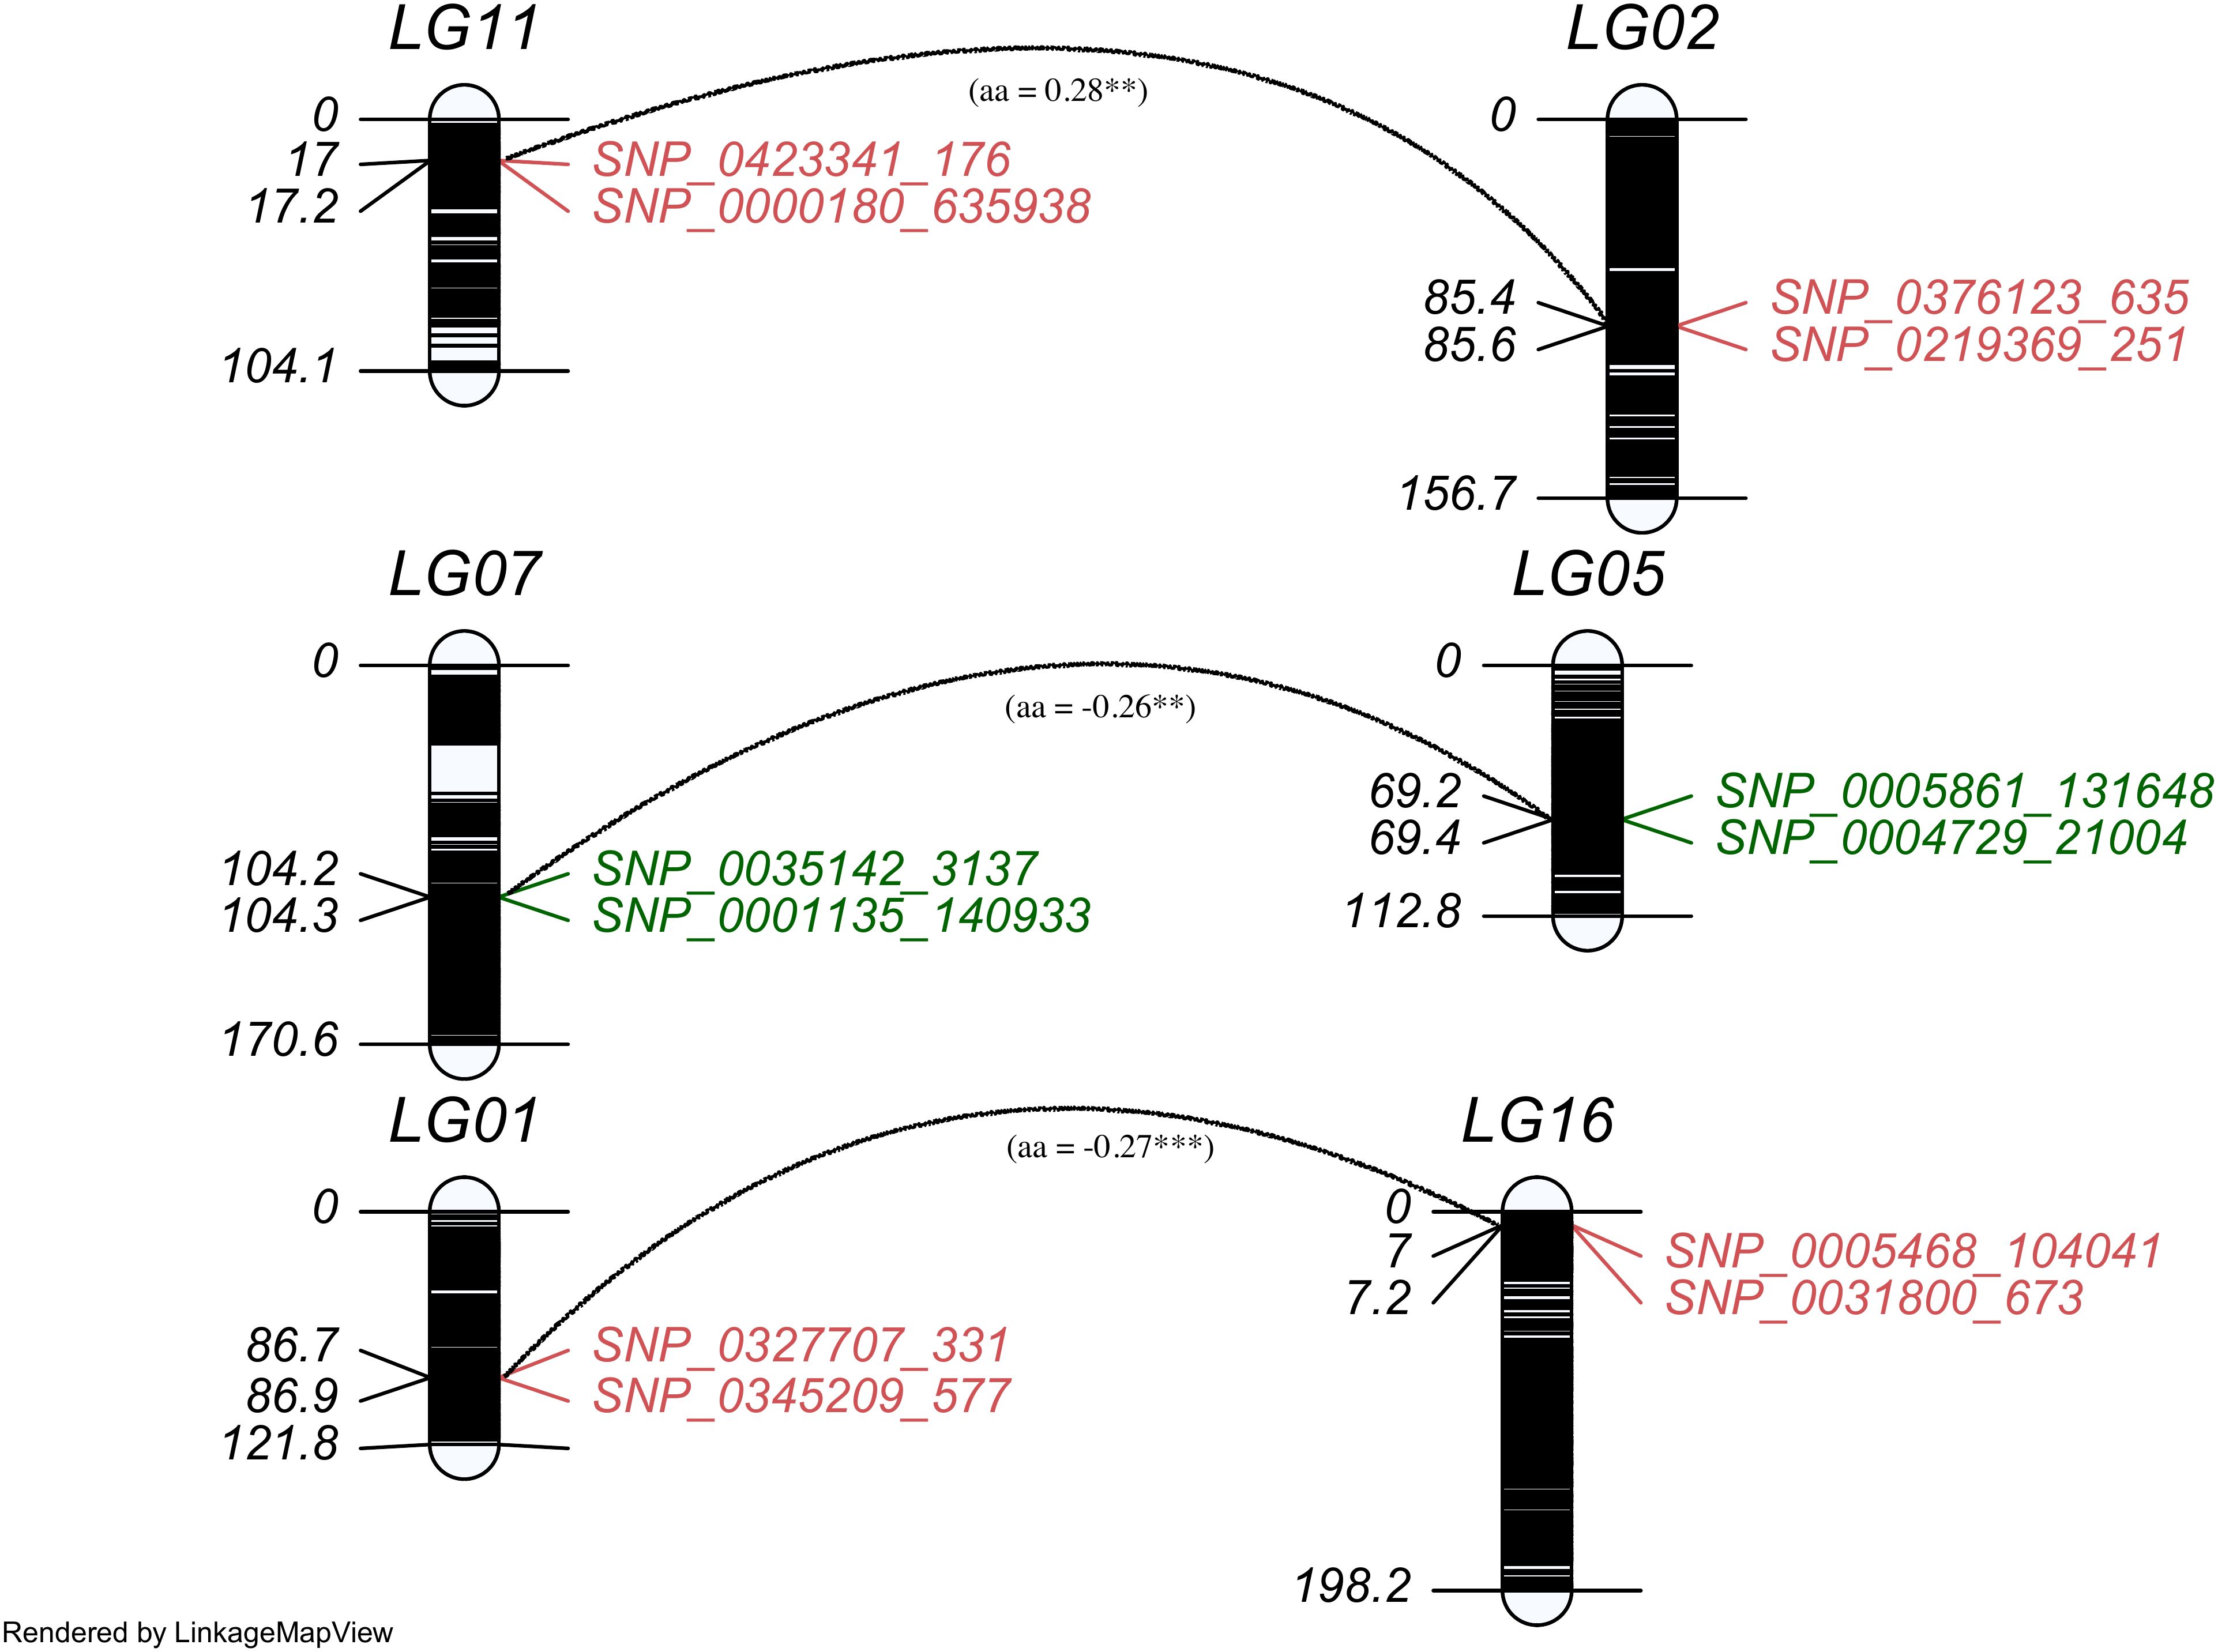
Figure 3. The distribution of QTLs contributing epistatic effects in the linkage map. Each paired epistatic QTL was indicated by two marker intervals connected with an arc line with its magnitude and marked the same color for one trait, red for chlorogenic acid (CHA) and green for rutin (RU).
3.3 Additive interaction effect, heritability, and pleiotropic effects
A total of 18 QTLs with additive (a) effects were detected for 12 traits (Table 2). Out of these 18 QTLs, 11 QTLs contributed positive additive effects, while 7 QTLs exhibited negative additive effects, indicating the complex genetic architecture (Supplementary Figure S1). The heritability of each QTL explained a percentage of the phenotypic variation, ranging from 2.21% to 20.05%. The majority of the QTLs had small additive effects and lower heritability, thus regarded as minor-effect QTLs. The QTLs qAPA16-247 , qGL15-18 , qAPA15-250 , qPA15-249 , and qTAA15-248 were identified as major-effect QTLs due to their significant and larger contribution to phenotypic variation. However, qTAA15-248, qTAA15-169, qGL15-18, qAPA15-250, qPA15-249, and qPA15-18 exhibited substantial additive effects on their respective traits and were located on LG15. For breeding purposes, one of the main goal is to identify QTLs that express stably across environments with minimal or non-significant QTL-environment interactions. In our study, all QTLs exhibited no interaction effects, indicating they can be utilized in breeding new variety for most general environment. Notably, qPA15-18 and qGL15-18 were located in a same marker interval ranged by SNP_0010516_37142 and SNP_0198499_1362. The co-localizations indicate there may be gene which take pleiotropic effect on PA and GL. This hypothesis was further supported by the substantial and reasonably high estimated correlation coefficient of 0.87 between PA and GL (Figure 1A).
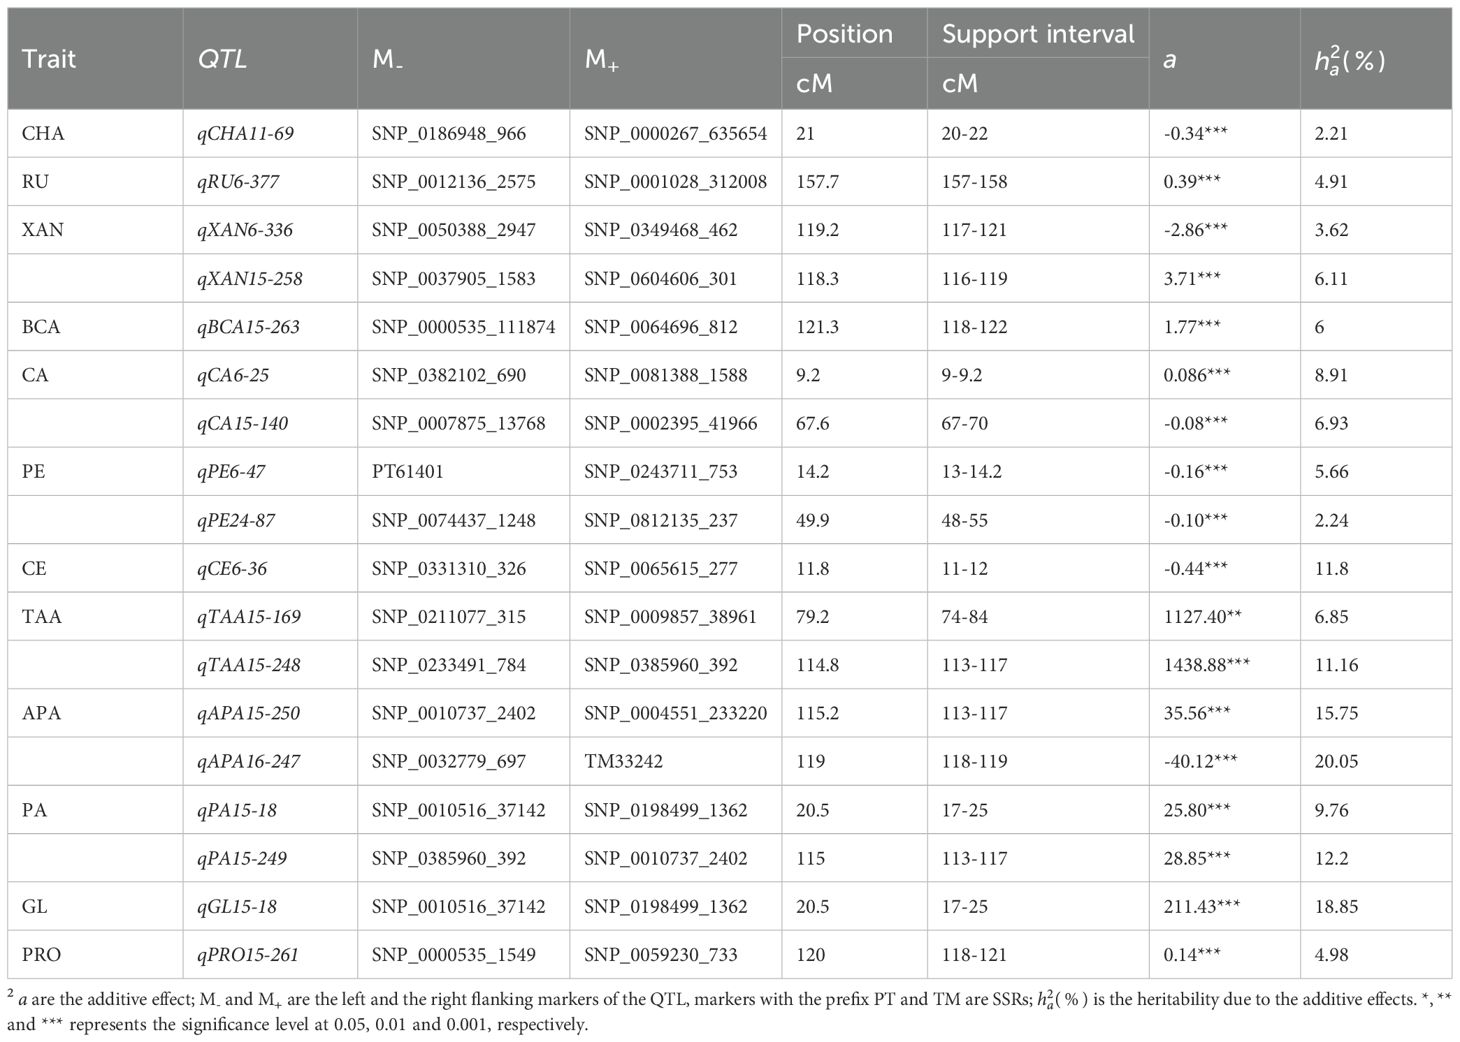
Table 2. Additive effect and heritability of QTL for 12 traits.
3.4 Additive-additive epistatic effect and heritability
A two-dimensional (2D) genome wide scan detected three epistatic QTL pairs associated with chlorogenic acid and rutin across LG1/LG16, LG2/LG11, and LG5/LG7 (Table 3). All these QTL pairs exhibited minimal additive-additive epistatic effects. Furthermore, these epistatic QTLs exhibited no significant additive-additive epistasis by environment interaction effects. Each QTL pair explained less than 3% of the overall phenotypic variation. Notably, the QTL pair qRU5-182/qRU7-131 accounted for greater heritability than qCHA1-216/qCHA16-21 and qCHA2-281/qCHA11-56 . Interestingly, the interaction effects of qCHA2-281/qCHA11-56 and qRU5-182/qRU7-131 were -0.26 and -0.27, respectively (Supplementary Figure S2). This indicated that the genotype of two QTL from same parent will reduce the trait value, in contrast, the genotype from different parent will increase the trait values.
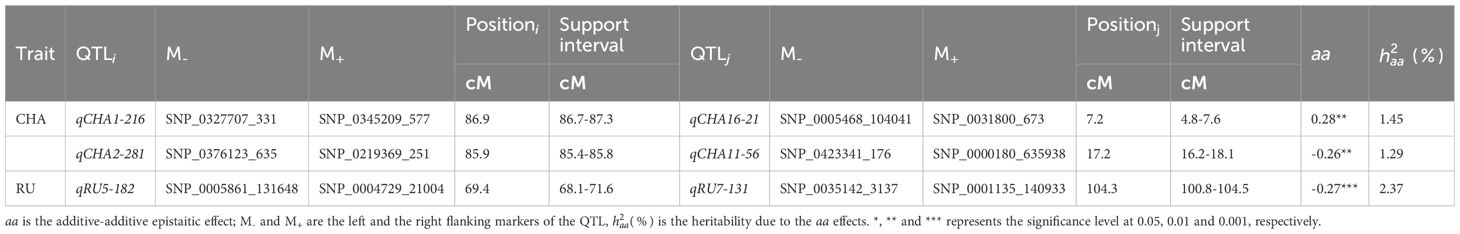
Table 3. The additive-additive epistatic effect and heritability of QTL for chlorogenic acid and rutin.
3.5 Candidate gene prediction through association and enrichment analysis
Through comparative mapping with the Nitab4.5 reference genome, the QTLs were mapped onto ten chromosomes, namely Nt05, Nt06, Nt08, Nt10, Nt12, Nt16, Nt18, Nt21, Nt22 and Nt24. A total of 477 genes were identified from these QTL regions (Supplementary Table S2). 56,983 variants within these genic regions were identified and annotated through the SnpEff tool. Wherein, 395 variants in 99 genes were determined to have moderate to high impacts on the protein level and were filtered for further analysis (Supplementary Table S3). These 99 genes were subjected to genome-wide association study using single marker association analysis. This analysis revealed 205 variants in 66 genes demonstrating significant association with multiple phenotypes across all the environments (Figure 4), (Supplementary Table S4). Among the 66 genes, 20 were significantly enriched in six GO biological processes, eight in GO cellular components, and one in GO molecular functions, while three genes were enriched in four KEGG pathways (Figure 5). Based on these results, Nt08g00266, Nt16g00236, and Nt22g03479 were predicted as candidate genes. GWAS analysis further revealed that Nt08g00266 was significantly associated with total sugar TS and STA, Nt16g00236 with TPA, and Nt22g03479 with TS and RS. The functions of these candidate genes were retrieved from BLASTp. This analysis revealed that Nt16g00236 encodes a mitogen-activated protein kinase (MAPK), Nt22g03479 encode scopoletin glucosyltransferase, and Nt08g00266 encodes a MYC2-like transcription factor.
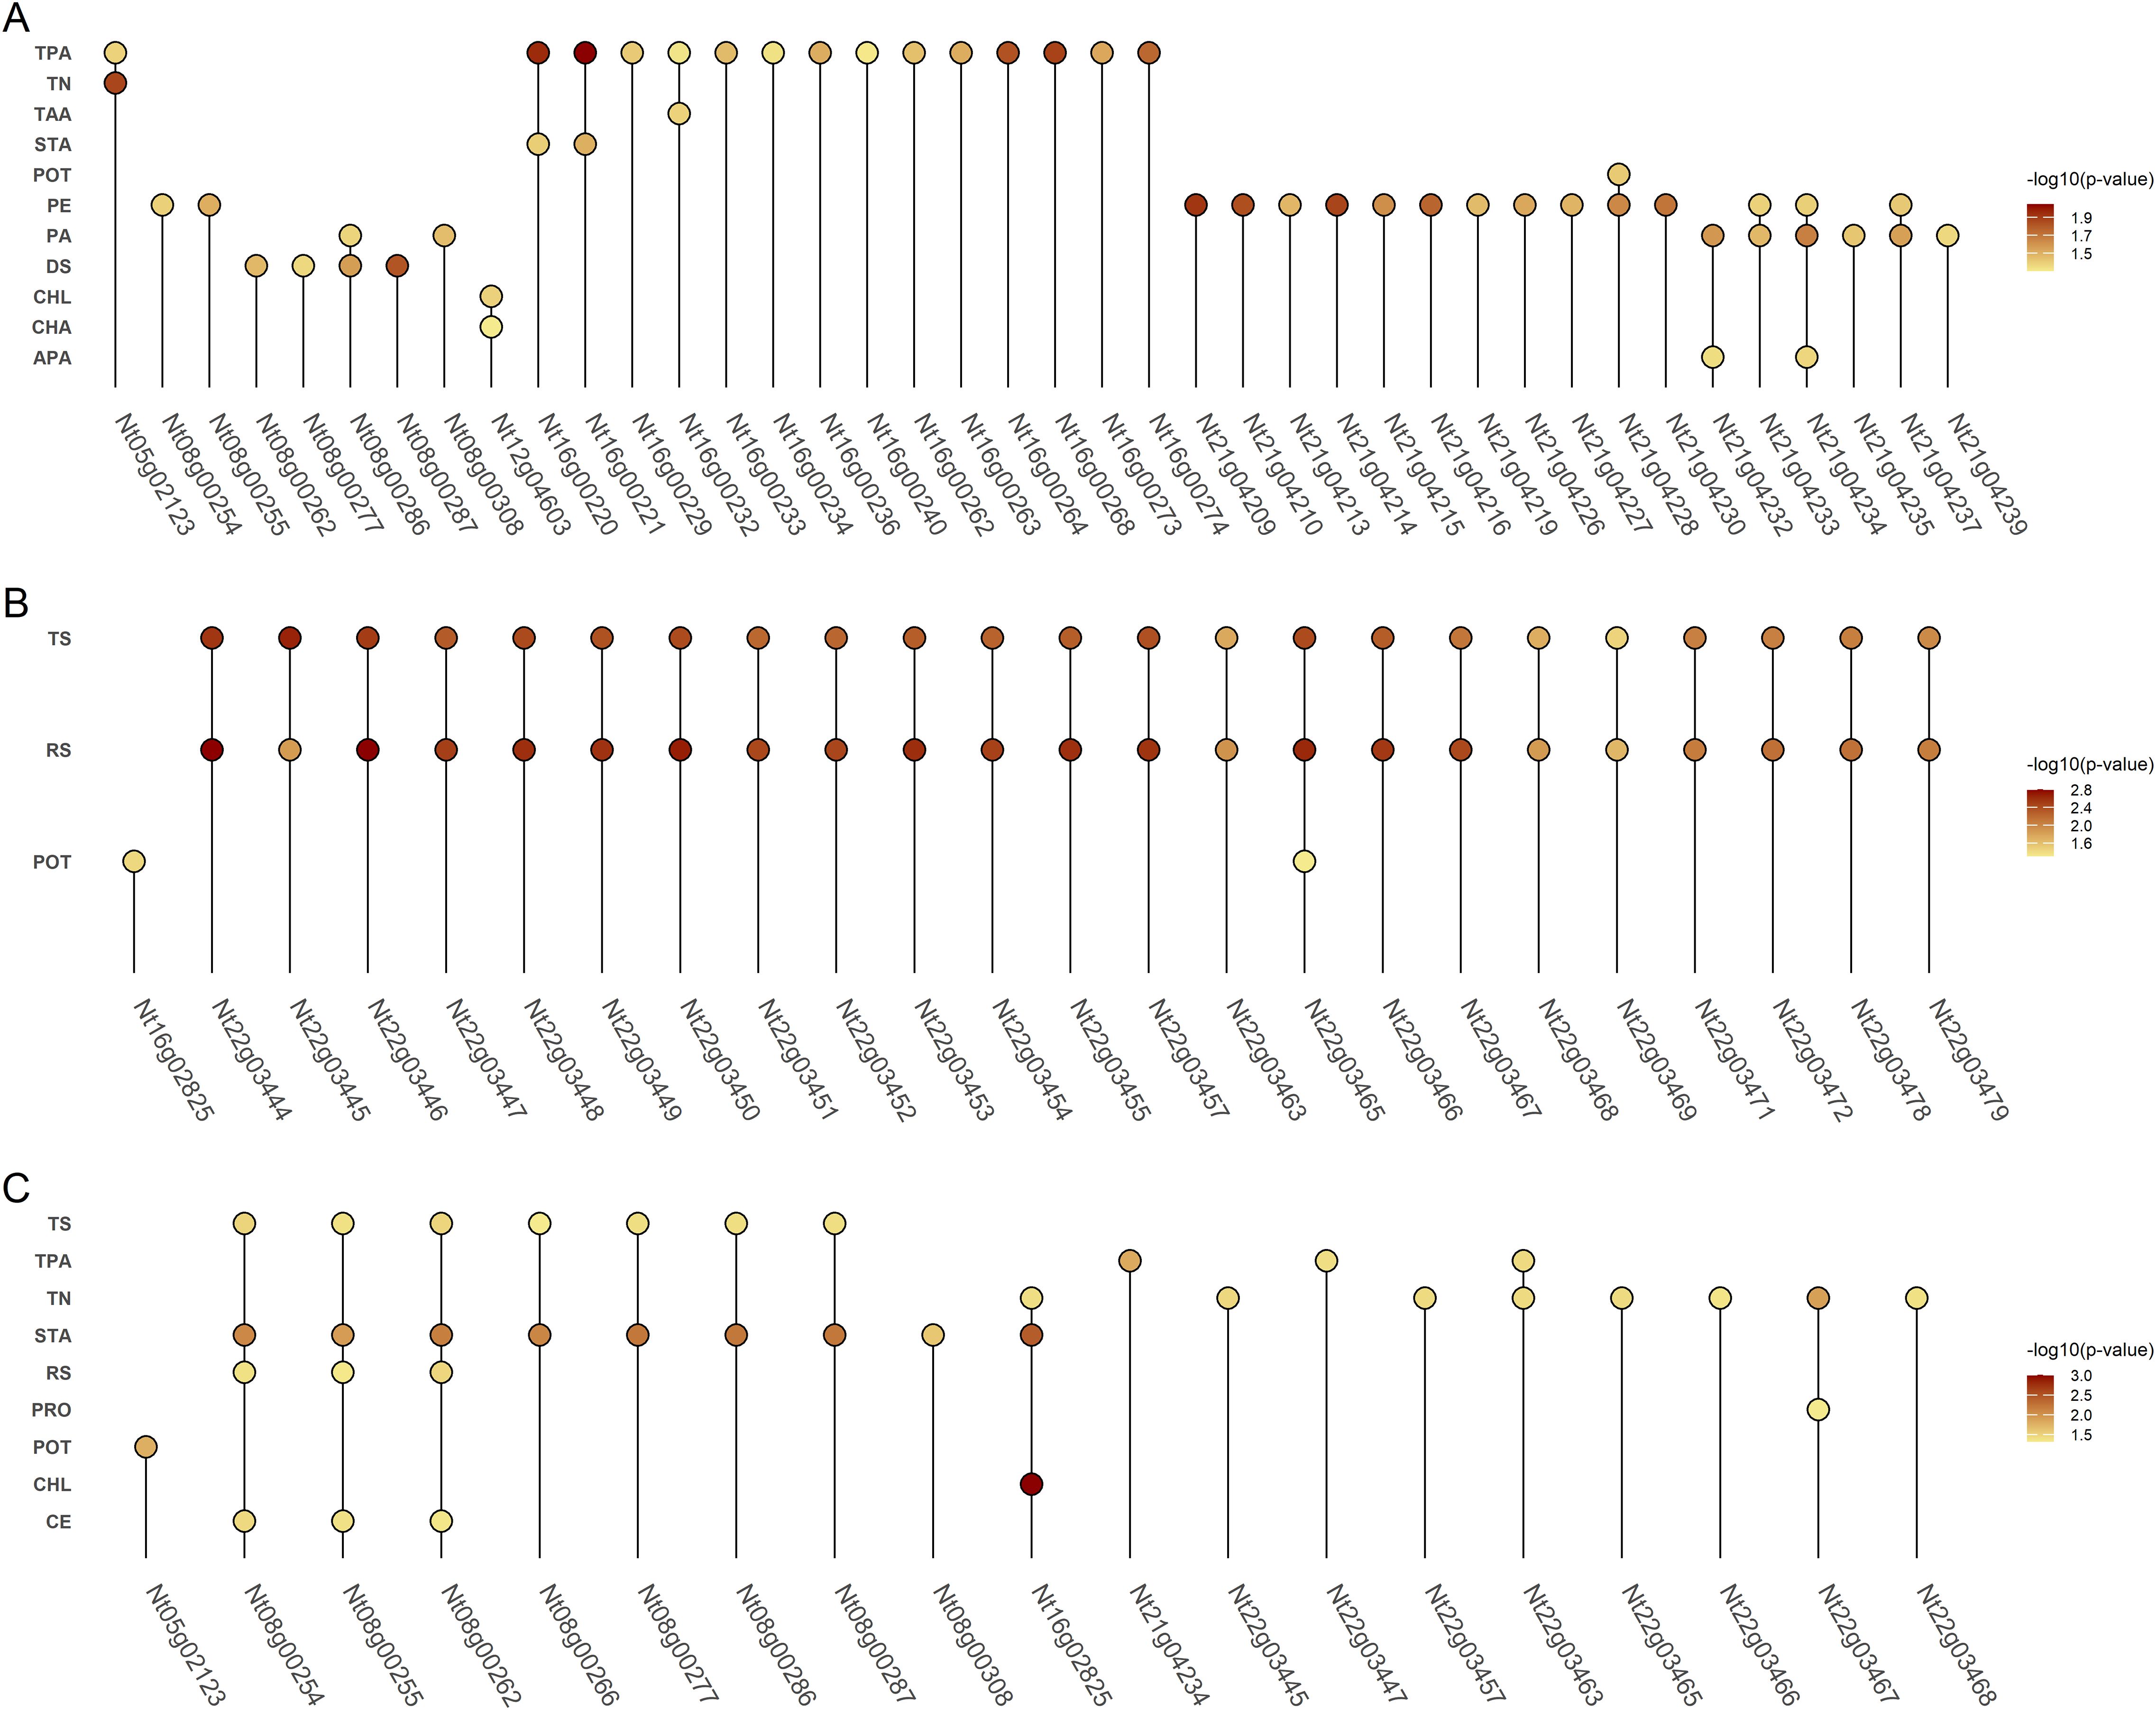
Figure 4. Dot plots showing genes exhibiting significant associations with multiple phenotypes across three environments. Panel A represents Environment 1, Panel B Environment 2, and Panel C Environment 3. The color intensity of each dot indicates the -log10 of the p-value for the association.
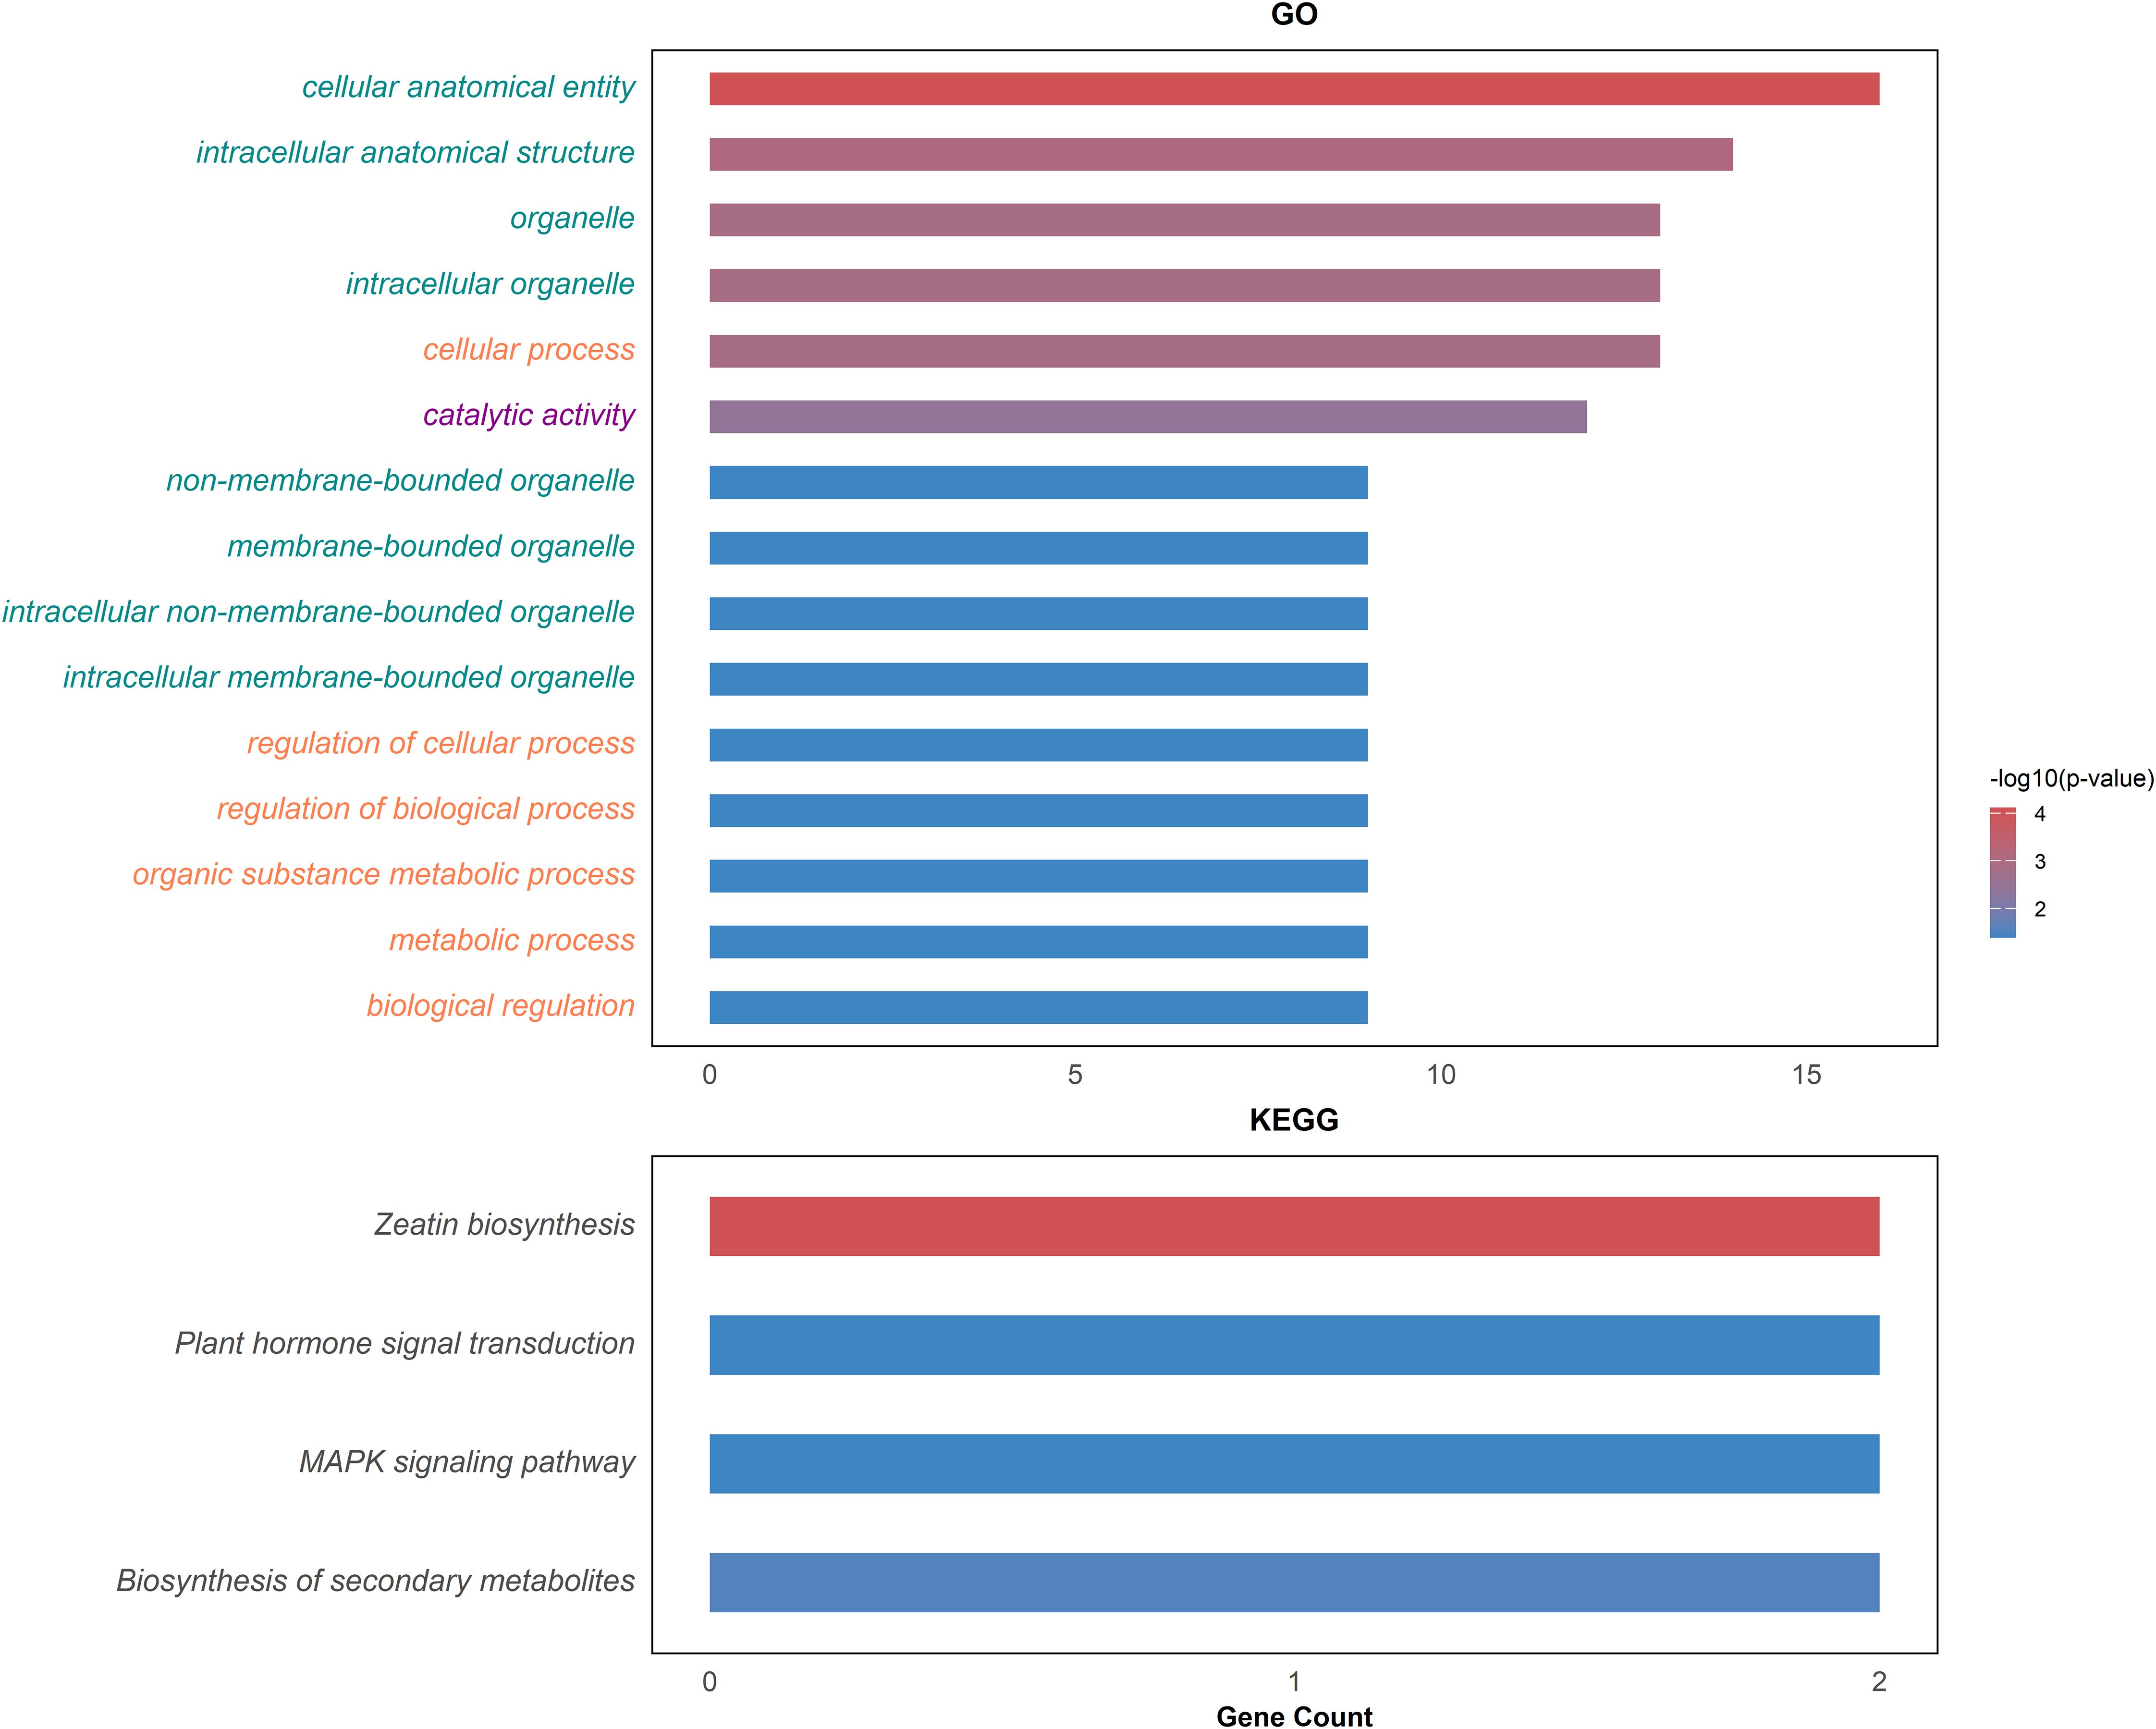
Figure 5. Top significantly enriched GO terms and KEGG pathways. The green colored of GO terms represents cellular process, orange colored denotes biological process and magenta colored is for molecular function.
4 Discussion
Tobacco leaf chemical traits are quantitative in nature and governed by the combined effects of multiple genes. Their complex genetic architecture and susceptibility to environmental influences made traditional breeding methods based on phenotypic selection ineffective for improving these traits (Tong et al., 2020). Thus, understanding the genetic architecture of these complex traits is crucial for designing efficient breeding programs to improve tobacco leaf chemical traits.
Molecular markers played a key role in exploring the genetic basis of complex quantitative traits (Julio et al., 2006). Compared to other solanaceous crops like potato (Tanksley et al., 1992), tomato (Haanstra et al., 1999; Tanksley et al., 1992), and pepper (Lefebvre et al., 1995), tobacco has fewer molecular resources available for genetic mapping (Tong et al., 2021). Genetic maps in these crops have greatly facilitated QTL analysis. In tobacco, various types of molecular markers, including AFLPs (Julio et al., 2006; Moon and Nicholson, 2007), SSRs (Tong et al., 2016, 2024), InDels and SNPs (Song et al., 2015; Xiao et al., 2015; Tong et al., 2023, 2025; Xu et al., 2024) have been employed to construct a genetic linkage map. Among these, SNPs are the most widely used markers due totheir dense distribution across the genome (Tong et al., 2025). However, there are limited QTLs identified for tobacco leaf composition traits. This is in part due to its larger genome size (4.3 Gb) along with narrow genetic diversity (Ikram et al., 2022; Wang J. et al., 2024).
The first QTL study on traits related to tobacco leaves and smoke traits was reported in 2006 (Julio et al., 2006). In that study, a partial genetic linkage map was constructed utilizing 138 low-throughput markers, including AFLP, ISSR, SSAP, and SCAR, covering 18 linkage groups. Their study identified six QTLs associated with total alkaloids, proline, and reducing sugars in an RIL population. In contrast, our study identified distinct QTLs for proline and discovered new QTLs associated with CHA, RU, XAN, BCA, CA, PE, TAA, APA, PA, GL, and CE. These findings provided new QTL resources for the genetic improvement of tobacco chemical traits. Compared with previous QTL studies on leaf chemistry, our research has several advantages. First, we used a high-density linkage map with 46,324 markers across 24 linkage groups, representing the most saturated linkage map to date. Second, we employed a full QTL model which included not only additive effects but also additive-additive epistatic interaction and their interaction with the environment as well. Consequently, we identified 18 QTLs with significant individual effects underlying 12 traits and three pairs of epistatic QTLs. Notably, no QTL-environment interactions were observed for any of the identified QTLs. A significant finding of our study was that qPA15-18 and qGL15-18 were located in the same linkage group and likely indicated the existence of pleiotropic QTLs. On the other hand, no QTLs were identified for nine traits (Table 1); which might be due to the absence of genotypic variation or the traits are controlled by many minor-effect genes that couldn’t be detected by traditional mapping method (Heffner et al., 2009; Xu et al., 2024).
In this study, GO enrichment analysis indicated that the genes were significantly enriched in terms related to metabolic process, organic substance metabolic process, catalytic activity, regulation of cellular process, and biological regulation. These findings suggest that key genes are involved in the biosynthesis, metabolism, and modification of essential compounds such as alkaloids, sugars, and phenolics, which are the primary determinants of tobacco leaf composition. Metabolic processes are crucial regulators of nicotine biosynthesis (Qin et al., 2020; Shoji et al., 2024). The enrichment of catalytic activity highlights a functional emphasis on enzymatic processes, including the breakdown of starch (Ye et al., 2024), synthesis of secondary metabolites (Malinowski et al., 2007), and degradation of nicotine (Li et al., 2024). Overall, these enriched biological functions collectively contribute to shaping the chemical composition of tobacco leaves.
By integrating the results from linkage mapping, association analysis, and enrichment analysis, three candidate genes Nt08g00266, Nt16g00236, and Nt22g03479 were identified. Functional annotation using the BLASTp tool revealed that Nt08g00266 encodes a MYC2-like transcription factor, previously reported to regulate carbohydrate metabolism and pollen development via the jasmonic acid (JA) signaling pathway in tobacco (Bian et al., 2022). Consistent with this, our KEGG enrichment analysis indicated that Nt08g00266 is involved in the Plant hormone signal transduction pathway. Nt16g00236 encodes a mitogen-activated protein kinase (MAPK), showing homology to serine/threonine kinases in Nicotiana tabacum (Wilson et al., 1995). MAPKs are known to participate in signal transduction, autophosphorylation, substrate phosphorylation, and disease resistance mechanisms. Furthermore, Nt22g03479 encodes a scopoletin glucosyltransferase which promotes the glucosylation of scopoletin, a process critical for the accumulation of scopoletin and scopoline. These secondary metabolites enhance the antiviral defense mechanisms in response to tobacco mosaic virus, by reducing reactive oxygen intermediates and improve plant resilience (Chong et al., 2002). Based on its role in secondary metabolite biosynthesis, we formulated that Nt22g03479 plays a regulatory role in plant defense mechanisms by modulation of secondary metabolites (Siwinska et al., 2014).
In our study, candidate genes were predicted based on the sequences of chromosome region of QTL. Although, we performed association analysis and enrichment analysis to strengthen the reliability of these candidate genes but still functional validation of these candidate genes was required for their application in advanced molecular and biological techniques.
5 Conclusion
In conclusion, 21 leaf composition traits were studied through QTL mapping. Our analysis revealed 18 QTLs exhibiting significant individual additive effects, of which only one QTL (qPA15-118 & qGL15-18) exhibited pleiotropic effects, along with 3 pairs of epistatic QTLs. Prioritization of candidate genes was achieved through subsequent association, GO and KEGG enrichment analysis and as a result, Nt08g00266, Nt16g00236 and Nt22g03479 were mined as candidate genes. These candidate genes are implicated in critical biological processes, functions in mitogen activate protein kinase signalling pathway, carbohydrate metabolism through hormone signalling and biosynthesis of secondary metabolites. This study brought new insights into the genetic architecture of these chemical traits and paved a way to molecular improvement of tobacco leaf chemistry.
Data availability statement
The original contributions presented in the study are included in the article/Supplementary Material. Further inquiries can be directed to the corresponding authors.
Author contributions
AU: Visualization, Formal analysis, Methodology, Writing – original draft, Software. ZT: Data curation, Conceptualization, Writing – original draft, Investigation, Funding acquisition, Resources, Project administration. MK: Writing – review & editing, Visualization, Formal analysis. FL: Software, Formal analysis, Writing – review & editing, Resources. TZ: Formal analysis, Resources, Writing – review & editing, Software. MS: Writing – review & editing, Formal analysis. U: Formal Analysis, Writing – review & editing. XC: Writing – review & editing, Methodology, Investigation, Conceptualization, Resources, Data curation. BX: Funding acquisition, Project administration, Conceptualization, Writing – review & editing. HX: Conceptualization, Resources, Supervision, Writing – review & editing, Formal analysis, Project administration, Funding acquisition.
Funding
The author(s) declare that financial support was received for the research and/or publication of this article. This research was funded by China National Tobacco Company, grant numbers (110202101038 (JY-15) and 110202101002 (JY-02)) and the Yunnan Tobacco Company with grant numbers (2022530000241009, 202253000241003, 2021530000241013 and 2025530000241005).
Acknowledgments
We are grateful for the valuable collaboration of the China National Tobacco Company and the Yunnan Tobacco Company, which made this study possible.
Conflict of interest
The authors declare that the research was conducted in the absence of any commercial or financial relationships that could be construed as a potential conflict of interest.
Generative AI statement
The author(s) declare that no Generative AI was used in the creation of this manuscript.
Publisher’s note
All claims expressed in this article are solely those of the authors and do not necessarily represent those of their affiliated organizations, or those of the publisher, the editors and the reviewers. Any product that may be evaluated in this article, or claim that may be made by its manufacturer, is not guaranteed or endorsed by the publisher.
Supplementary material
The Supplementary Material for this article can be found online at: https://www.frontiersin.org/articles/10.3389/fpls.2025.1616591/full#supplementary-material
Abbreviations
TPA, total plant alkali; TS, total sugar; RS, reducing sugar; TN, total nitrogen; POT, potassium; CHL, chlorine; STA, starch; CHA, chlorogenic acid; RU, rutin; FRUC, fructose; XAN, xanthophyll; BCA, beta-carotene; CA, citric acid; PE, petroleum ether; CE, cellulose; DS, difference between two sugars; TAA, total amino acids; APA, aspartic acid; PA, phenylalanine; GL, glutamine; PRO: protein; RIL, recombinant inbred line population; LG, linkage group; SNP, single nucleotide polymorphism; InDel, insertion or deletion; SSR, simple sequence repeat; AFLP, amplified fragment length polymorphism; ISSR, inter simple sequence repeat; SSAP, sequence-specific amplified polymorphism; SCAR, Sequence characterized amplified region; QTL, Quantitative trait locus; MCIM, mixed linear model based composite interval mapping; MCMC, Markov Chain Monte Carlo; BWA, burrow wheeler alignment; NCBI, national center for biotechnology information; BLAST, basic local alignment search tool; BLASTp, protein BLAST; SSL, single segment lines; NIL, near iso-genic line.
References
Bian, S., Tian, T., Ding, Y., Yan, N., Zhang, Z., Zhang, H., et al. (2022). BHLH transcription factor NtMYC2a regulates carbohydrate metabolism during the pollen development of tobacco (Nicotiana tabacum L. cv. TN90). Plants 11, 7. doi: 10.3390/plants11010017
Camlica, M. and Yaldiz, G. (2021). Analyses and evaluation of the main chemical components in different tobacco (Nicotiana tabacum L.) genotypes. Grasas y Aceites 72, e389. doi: 10.3989/GYA.0801192
Chaplin, J. F. (1975). Genetic influence on chemical constituents of tobacco leaf and smoke. Beitr. zur Tab. Int. Contrib. to Tob. Res. 8, 233–240. doi: 10.2478/cttr-2013-0385
Cheng, L., Chen, X., Jiang, C., Ma, B., Ren, M., Cheng, Y., et al. (2019). High-density SNP genetic linkage map construction and quantitative trait locus mapping for resistance to cucumber mosaic virus in tobacco (Nicotiana tabacum L.). Crop J. 7, 539–547. doi: 10.1016/j.cj.2018.11.010
Cheng, L., Yang, A., Jiang, C., Ren, M., Zhang, Y., Feng, Q., et al. (2015). Quantitative trait loci mapping for plant height in tobacco using linkage and association mapping methods. Crop Sci. 55, 641–647. doi: 10.2135/cropsci2014.05.0404
Chong, J., Baltz, R., Schmitt, C., Beffa, R., Fritig, B., and Saindrenan, P. (2002). Downregulation of a pathogen-responsive tobacco UDP-Glc:phenylpropanoid glucosyltransferase reduces scopoletin glucoside accumulation, enhances oxidative stress, and weakens virus resistance. Plant Cell 14, 1093–1107. doi: 10.1105/tpc.010436
Cingolani, P., Platts, A., Wang, L. L., Coon, M., Nguyen, T., Wang, L., et al. (2012). A program for annotating and predicting the effects of single nucleotide polymorphisms, SnpEff: SNPs in the genome of Drosophila melanogaster strain w1118; iso-2; iso-3. Fly (Austin) 6, 80–92. doi: 10.4161/fly.19695
Edwards, K. D., Fernandez-Pozo, N., Drake-Stowe, K., Humphry, M., Evans, A. D., Bombarely, A., et al. (2017). A reference genome for Nicotiana tabacum enables map-based cloning of homeologous loci implicated in nitrogen utilization efficiency. BMC Genomics 18, 1–14. doi: 10.1186/s12864-017-3791-6
Haanstra, J., Wye, C., Verbakel, H., Meijer-Dekens, F., Van-Den-Berg, P., Odinot, P., et al. (1999). An integrated high-density RFLP-AFLP map of tomato based on two Lycopersicon esculentum × L. pennellii F2 populations. Theor. Appl. Genet. 99, 254–271. doi: 10.1007/s001220051231
Heffner, E. L., Sorrells, M. E., and Jannink, J. L. (2009). Genomic selection for crop improvement. Crop Sci. 49, 1–12. doi: 10.2135/cropsci2008.08.0512
Ikram, M., Xiao, J., Li, R., Xia, Y., Zhao, W., Yuan, Q., et al. (2022). Identification of superior haplotypes and candidate genes for yield-related traits in tobacco (Nicotiana tabacum L.) using association mapping. Ind. Crops Prod 189, 115886. doi: 10.1016/j.indcrop.2022.115886
Ji, Y., Liu, G., Yan, S., Jiang, X., Wu, M., Liu, W., et al. (2024). GWAS combined with QTL mapping reveals the genetic loci of leaf morphological characters in Nicotiana tabacum. BMC Plant Biol. 24, 583. doi: 10.1186/s12870-024-05261-8
Jing, Y., Zhang, B., Yuan, X., Gao, Y., Lu, P., Wang, W., et al. (2016). Determination of free amino acids in burley tobacco by high performance liquid chromatography. Saudi J. Biol. Sci. 23, S64–S68. doi: 10.1016/j.sjbs.2015.08.008
Julio, E., Denoyes-Rothan, B., Verrier, J. L., and Dorlhac De Borne, F. (2006). Detection of QTLs linked to leaf and smoke properties in Nicotiana tabacum based on a study of 114 recombinant inbred lines. Mol. Breed. 18, 69–91. doi: 10.1007/s11032-006-9019-0
Lefebvre, V., Palloix, A., Caranta, C., and Pochard, E. (1995). Construction of an intraspecific integrated linkage map of pepper using molecular markers and doubled-haploid progenies. Genome 38, 112–121. doi: 10.1139/g95-014
Leffingwell, J. (1999). Leaf chemistry-basic chemical constituents of tobacco leaf and differences among tobacco types. Tobacco: Prod. Chem. Technol. 1, 265–284. doi: 10.13140/2.1.5173.6645
Li, H. and Durbin, R. (2009). Fast and accurate short read alignment with Burrows-Wheeler transform. Bioinformatics 25, 1754–1760. doi: 10.1093/bioinformatics/btp324
Li, Y., Liu, F., Sun, S., Xiang, Y., Jiang, X., and He, J. (2023). Metabolome of flue-cured tobacco is significantly affected by the presence of leaf stem. BMC Plant Biol. 23, 89. doi: 10.1186/s12870-023-04093-2
Li, Z. J., Yang, D. D., Wei, Z. Y., Huang, J., Chi, Y. Q., Lu, Y. X., et al. (2024). Reduction of nicotine content in tobacco through microbial degradation: research progress and potential applications. Biotechnol. Biofuels Bioprod. 17, 144. doi: 10.1186/s13068-024-02593-3
Liu, Y., Yuan, G., Si, H., Sun, Y., Jiang, Z., Liu, D., et al. (2022). Identification of QTLs associated with agronomic traits in tobacco via a biparental population and an eight-way MAGIC population. Front. Plant Sci. 13. doi: 10.3389/fpls.2022.878267
Malinowski, J., Krzymowska, M., Godoń, K., Hennig, J., and Podstolski, A. (2007). A new catalytic activity from tobacco converting 2-coumaric acid to salicylic aldehyde. Physiol. Plant 129, 461–471. doi: 10.1111/j.1399-3054.2006.00837.x
Mendell, S., Bourlas, E. C., and DeBardeleben, M. Z. (1984). Factors influencing tobacco leaf quality: an investigation of the literature. Beitr. zur Tab. Int. Contrib. to Tob. Res. 12, 153–167. doi: 10.2478/cttr-2013-0537
Moon, H. and Nicholson, J. S. (2007). AFLP and SCAR markers linked to tomato spotted wilt virus resistance in tobacco. Crop Sci. 47, 1887–1894. doi: 10.2135/cropsci2007.01.0002
Pang, T., Bai, C., Xu, Y., Xu, G., Yuan, Z., Su, Y., et al. (2006). Determination of sugars in tobacco leaf by HPLC with evaporative light scattering detection. J. Liq Chromatogr Relat. Technol. 29, 1281–1289. doi: 10.1080/10826070600598993
Purcell, S., Neale, B., Todd-Brown, K., Thomas, L., Ferreira, M. A. R., Bender, D., et al. (2007). PLINK: A tool set for whole-genome association and population-based linkage analyses. Am. J. Hum. Genet. 81, 559–575. doi: 10.1086/519795
Qin, Y., Bai, S., Li, W., Sun, T., Galbraith, D. W., Yang, Z., et al. (2020). Transcriptome analysis reveals key genes involved in the regulation of nicotine biosynthesis at early time points after topping in tobacco (Nicotiana tabacum L.). BMC Plant Biol. 20, 1–15. doi: 10.1186/s12870-020-2241-9
Quinlan, A. R. and Hall, I. M. (2010). BEDTools: A flexible suite of utilities for comparing genomic features. Bioinformatics 26, 841–842. doi: 10.1093/bioinformatics/btq033
Shoji, T., Hashimoto, T., and Saito, K. (2024). Genetic regulation and manipulation of nicotine biosynthesis in tobacco: strategies to eliminate addictive alkaloids. J. Exp. Bot. 75, 1741–1753. doi: 10.1093/jxb/erad341
Siwinska, J., Kadzinski, L., Banasiuk, R., Gwizdek-Wisniewska, A., Olry, A., Banecki, B., et al. (2014). Identification of QTLs affecting scopolin and scopoletin biosynthesis in Arabidopsis thaliana. BMC Plant Biol. 14, 1–14. doi: 10.1186/s12870-014-0280-9
Song, Q., Jia, G., Hyten, D. L., Jenkins, J., Hwang, E. Y., Schroeder, S. G., et al. (2015). SNP assay development for linkage map construction, anchoring whole-genome sequence, and other genetic and genomic applications in common bean. G3: Genes Genomes Genet. 5, 2285–2290. doi: 10.1534/g3.115.020594
Stedman, R. L. (1968). THE CHEMICAL COMPOSITION OF TOBACCO AND TOBACCO SMOKE. doi: 10.1021/cr60252a002
Talhout, R., Opperhuizen, A., and van Amsterdam, J. G. C. (2006). Sugars as tobacco ingredient: Effects on mainstream smoke composition. Food Chem. Toxicol. 44, 1789–1798. doi: 10.1016/j.fct.2006.06.016
Tanksley, S. D., Ganal, M. W., Prince, J. P., de Vicente, M. C., Bonierbale, M. W., Broun, P., et al. (1992).High density molecular linkage maps of the tomato and potato genomes. Genetics. 132, 1141–1160. doi: 10.1093/genetics/132.4.1141
Tong, Z., Fang, D., Chen, X., Jiao, F., Zhang, Y., Li, Y., et al. (2020). Genome-wide association study of leaf chemistry traits in tobacco. Breed Sci. 70, 253–264. doi: 10.1270/jsbbs.19067
Tong, Z., Kamran, M., Zhang, Q., Lin, F., Fang, D., Chen, X., et al. (2024). Identification of QTLs associated with yield-related traits and superior genotype prediction using recombinant inbred line population in tobacco. Gene 928, 148765. doi: 10.1016/j.gene.2024.148765
Tong, Z., Ullah, A., Kamran, M., Chen, X., Lin, F., Zhu, T., et al. (2025). QTL mapping and association analysis revealed complicate genetic architecture of 17 smoke and chemical traits in tobacco (Nicotiana tabacum L.). Ind. Crops Prod 225, 120599. doi: 10.1016/j.indcrop.2025.120599
Tong, Z., Xiao, B., Jiao, F., Fang, D., Zeng, J., Wu, X., et al. (2016). Large-scale development of SSR markers in tobacco and construction of a linkage map in flue-cured tobacco. Breed Sci. 66, 381–390. doi: 10.1270/jsbbs.15129
Tong, Z., Xiu, Z., Ming, Y., Fang, D., Chen, X., Hu, Y., et al. (2021). Quantitative trait locus mapping and genomic selection of tobacco (Nicotiana tabacum L.) based on high-density genetic map. Plant Biotechnol. Rep. 15, 845–854. doi: 10.1007/s11816-021-00713-1
Tong, Z., Xu, M., Zhang, Q., Lin, F., Fang, D., Chen, X., et al. (2023). Construction of a high-density genetic map and dissection of genetic architecture of six agronomic traits in tobacco (Nicotiana tabacum L.). Front. Plant Sci. 14. doi: 10.3389/fpls.2023.1126529
Wang, J., Zhang, Q., Tung, J., Zhang, X., Liu, D., Deng, Y., et al. (2024). High-quality assembled and annotated genomes of Nicotiana tabacum and Nicotiana benthamiana reveal chromosome evolution and changes in defense arsenals. Mol. Plant 17, 423–437. doi: 10.1016/j.molp.2024.01.008
Wang, P., Pang, J., Zhang, H., Liao, H., Xiong, D., Zhu, L., et al. (2024). Composition, structural, and thermal analysis of cellulose, hemicellulose, and lignin of reconstituted cut stems in tobacco. Ind. Crops Prod 222, 119614. doi: 10.1016/j.indcrop.2024.119614
Wilson, C., Anglmayer, R., Vicente, O., and Heberle-Bors, E. (1995). Molecular cloning, functional expression in escherichia coli, and characterization of multiple mitogen-activated-protein kinases from tobacco. Eur. J. Biochem. 233, 249–257. doi: 10.1111/j.1432-1033.1995.249_1.x
Xiao, B., Tan, Y., Long, N., Chen, X., Tong, Z., Dong, Y., et al. (2015). SNP-based genetic linkage map of tobacco (Nicotiana tabacum L.) using next-generation RAD sequencing. J. Biol. Res. (Thessalon) 22, 1–11. doi: 10.1186/s40709-015-0034-3
Xu, M., Tong, Z., Jin, C., Zhang, Q., Lin, F., Fang, D., et al. (2024). Dissection of genetic architecture of nine hazardous component traits of mainstream smoke in tobacco (Nicotiana tabacum L.). Front. Plant Sci. 15. doi: 10.3389/fpls.2024.1358953
Yang, J., Hu, C., Hu, H., Yu, R., Xia, Z., Ye, X., et al. (2008). QTLNetwork: Mapping and visualizing genetic architecture of complex traits in experimental populations. Bioinformatics 24, 721–723. doi: 10.1093/bioinformatics/btm494
Ye, C., Zhao, W., Liu, D., Yang, R., Cui, Z., Zou, D., et al. (2024). Screening, identification, engineering, and characterization of Bacillus-derived α-amylase for effective tobacco starch degradation. Int. J. Biol. Macromol 282, 137364. doi: 10.1016/j.ijbiomac.2024.137364
Yu, G., Wang, L. G., Han, Y., and He, Q. Y. (2012). ClusterProfiler: An R package for comparing biological themes among gene clusters. OMICS 16, 284–287. doi: 10.1089/omi.2011.0118
Keywords: tobacco leaf chemistry, QTL mapping, QTL by environment interaction, epistasis, genome wide association study, GO and KEGG enrichment, candidate gene
Citation: Ullah A, Tong Z, Kamran M, Lin F, Zhu T, Shahzad M, Umaira, Chen X, Xiao B and Xu H (2025) Integration of QTL mapping and GWAS reveals the complicated genetic architecture of chemical composition traits in tobacco leaves. Front. Plant Sci. 16:1616591. doi: 10.3389/fpls.2025.1616591
Received: 23 April 2025; Accepted: 03 June 2025;
Published: 25 June 2025.
Edited by:
Yang-Jun Wen, Nanjing Agricultural University, ChinaReviewed by:
Jin Zhang, Nanjing Agricultural University, ChinaShibo Wang, University of California, United States
Copyright © 2025 Ullah, Tong, Kamran, Lin, Zhu, Shahzad, Umaira, Chen, Xiao and Xu. This is an open-access article distributed under the terms of the Creative Commons Attribution License (CC BY). The use, distribution or reproduction in other forums is permitted, provided the original author(s) and the copyright owner(s) are credited and that the original publication in this journal is cited, in accordance with accepted academic practice. No use, distribution or reproduction is permitted which does not comply with these terms.
*Correspondence: Bingguang Xiao, eGlhb2Jnc3VibWlzc2lvbkAxMjYuY29t; Haiming Xu, aG14dUB6anUuZWR1LmNu
†These authors have contributed equally to this work and share first authorship