 Peisen Yuan
 Lushuo Jiang1
 Zhanghao Cheng
 Cheng He
- 1College of Artificial Intelligence, Nanjing Agricultural University, Nanjing, China
- 2State Key Laboratory of Agricultural and Forestry Biosecurity, College of Plant Protection, Nanjing Agricultural University, Nanjing, China
Artificial intelligence for science is a methodology that integrates artificial intelligence into scientific research to improve the precision and efficiency of data analysis and experimental processes. Specifically in potato late blight severity grading, due to the demand for both accuracy and cost-effective deployment, traditional methods are limited by subjective evaluation and timeconsuming manual measurement. In this paper, a lightweight grading model based on an enhanced YOLOv8-UNet3Plus network is proposed to enable objective and accurate potato late blight severity grading. In detail, the YOLOv8 network is optimized by integrating Spatial and Channel Reconstruction Convolution module, Bi-directional Feature Pyramid Network and Powerful-IoU loss, the UNet3Plus network is optimized by embedding Ghost convolution and Multi-Scale Local Response Attention. Experiments on real-world potato late blight datasets demonstrate that our model achieves an precision of 95.73% for leaf localization and an mean Intersection over Union of 82.65% for infected region segmentation with reduced parameters and computational cost. This AI4Science-based model provides an effective solution for potato late blight severity grading.
1 Introduction
In recent years, artificial intelligence for science (AI4Science) has transformed the scientific facility fundamental research and achieved numerous breakthroughs in many frontier fields (Wang et al., 2023; Xu et al., 2021). Through deeply integrating the latest artificial intelligence with scientific methods, this approach advances the analysis and processing of complex scientific data in different fields, such as biological sciences (Bhardwaj et al., 2022), plant disease (Shoaib et al., 2023) et al. Currently, the application of AI4Science has shown remarkable potentials in the field of plant disease phenotype data research, particularly for diseases such as potato late blight (Mohanty et al., 2016; Kamilaris and Prenafeta-Boldú, 2018).
Potato late blight, caused by Phytophthora infestans, is a severe disease that affects global agricultural production, leading to annual yield losses of 20%-30% (Fry et al., 2015). To mitigate these severe agricultural losses and develop resistant varieties (Lu et al., 2021), precise grading of late blight severity is essential for effective disease management and breeding programs (Elumalai and Faritha Banu, 2023). However, conventional manual grading methods are time-consuming and highly dependent on subjective experience, which increases grading costs and leads to inconsistent evaluation results. Compared with manual grading limitations, AI4Science could combine advanced data processing techniques and intelligent analysis methods to improve the accuracy of potato late blight severity grading (Li et al., 2022; Yang et al., 2024a).
As one of the core technologies of AI4Science, deep learning has demonstrated notable advantages in plant disease research with its efficient high-dimensional data processing and automatic feature learning capabilities. Based on these advantages, recent advances in deep learning have brought various powerful models for plant disease research, including HRNet (Wang et al., 2019), ConvNeXt (Liu et al., 2022; Woo et al., 2023; Tang et al., 2023), and ViT (Bhuyan and Singh, 2024; He et al., 2024). These models have achieved high accuracy in the tasks, however, their application in agricultural research is constrained by high computational complexity. Therefore, developing a lightweight intelligent grading method with high accuracy is significant for the analysis of late blight disease of potato (Howard et al., 2019).
To achieve this goal, an accurate and lightweight model for potato late blight severity grading was proposed in this paper. Specifically, by utilizing an improved YOLOv8 network (Miao et al., 2025; Lu et al., 2024; Li et al., 2025) and an enhanced UNet3Plus network (Huang et al., 2020; Chen et al., 2025), our method enabled precise leaf localization and fine-grained segmentation of the infected regions. Then, we combine the localization and segmentation results to evaluate the severity grading for each leaf based on infection area ratios.
Besides the development of lightweight and effective grading model, high-quality datasets and scientific evaluation metrics are equally crucial for ensuring reliable potato late blight severity grading. To achieve accurate grading, the inoculation assay with Phytophthora infestans was conducted at 6–8 weeks post potato planting (seedling stage with 7–10 compound leaves). Specifically, the 3rd, 4th, and 5th fully expanded compound leaves from the top of each plant were detached. A 40 µL droplet of zoospore suspension (2 × 10⁴ spores/mL) was pipetted onto one side of the mid-vein on the abaxial surface of each leaflet. Three biological replicates were included per material, with each replicate consisting of at least 6 compound leaves. Phenotypic observations and photographic documentation were performed at 5 days post-inoculation (dpi). Based on these images, this paper developed the first open-source potato late blight leaf disease dataset for leaf localization and infected region segmentation, which was further enriched through systematic data augmentation methods. Furthermore, according to infected area proportion, a quantitative grading metric was established to evaluate potato late blight severity. As shown in Figure 1, the metrics defines six severity levels (0-5): level 0 (negligible infection, ≤ 0.1%), level 1 (initial symptoms, 0.1% - 10%), levels 2-3 (moderate infection, 10% - 50%), and levels 4-5 (severe infection, > 50%). Representative leaf images illustrate the distinct characteristics of each severity level.
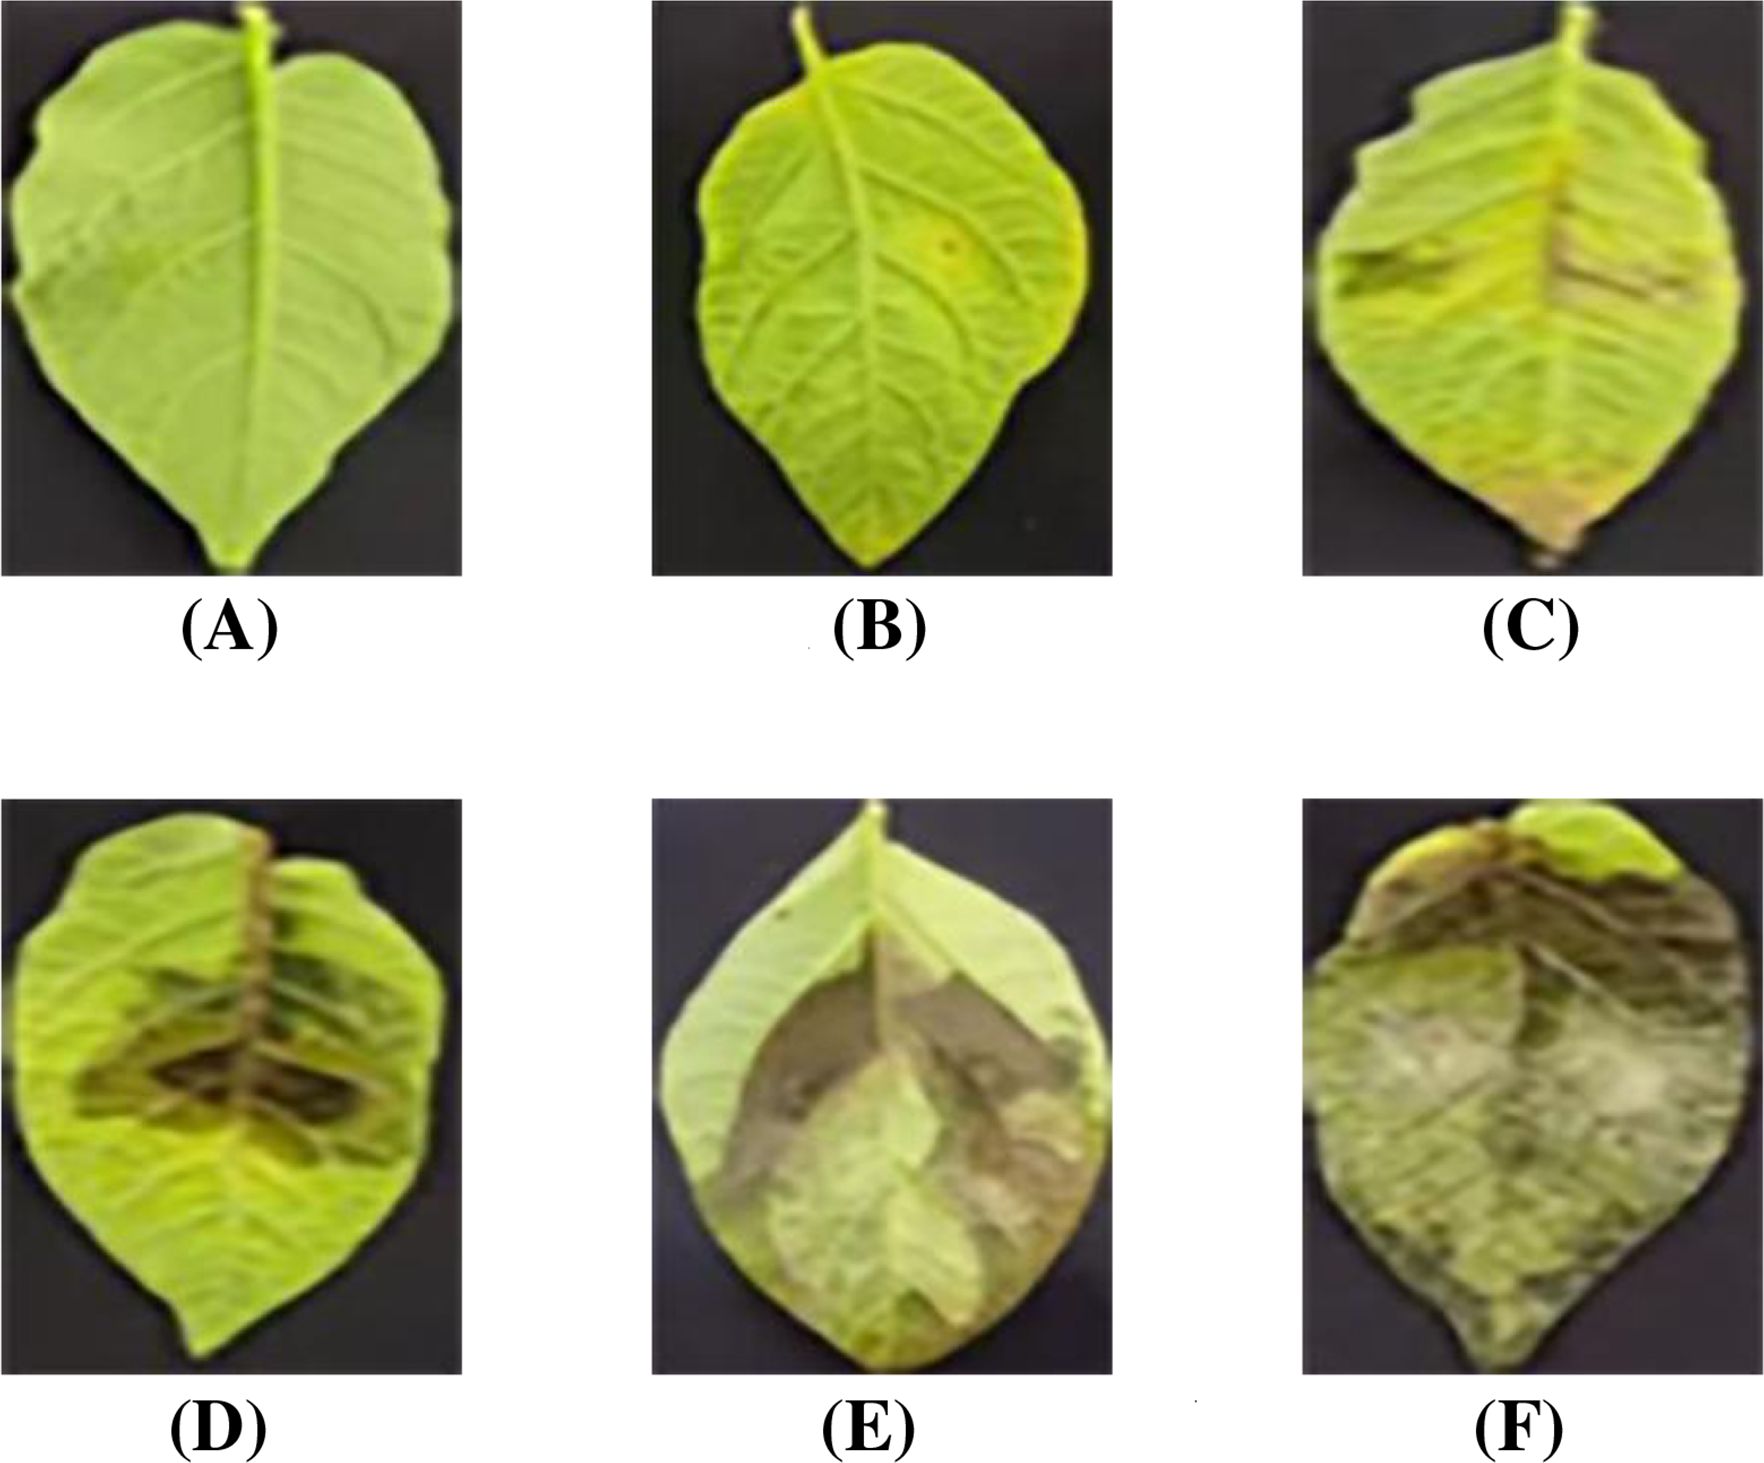
Figure 1. Infection levels of potato late blight. (A) Level: 0. (B) Level: 1. (C) Level: 2. (D) Level: 3. (E) Level: 4. (F) Level: 5.
The main contributions of this paper are summarized as follows:
1. An open-source dataset of potato late blight leaf disease was constructed for leaf localization and infected region segmentation, providing a reliable foundation for deep learning research in the field of potato late blight disease.
2. An improved YOLOv8-UNet3Plus network is proposed for potato late blight severity grading, which implements accurate and cost-effective disease assessment.
3. A quantitative severity grading system is established based on the proportion of infected leaf area, which provides scientific and objective evaluation metrics for potato late blight grading.
2 Methods
2.1 System framework
The proposed model consists of three core processing stages: (1) leaf localization based on enhanced YOLOv8; (2) infected region segmentation based on enhanced UNet3Plus; (3) disease severity grading. Through the integration of these stages, our model effectively implements potato late blight severity grading. Specifically, the processing pipeline shown in Figure 2 transforms input data through sequential stages to generate severity grading results, which can be summarized as follows:
1. Leaf localization: The enhanced YOLOv8 network processes the input data and generates feature maps containing localization information that enable precise localization of leaves and provide foundational data for downstream analysis.
2. Infected region segmentation: The enhanced UNet3Plus network generates fine-grained segmentation maps that differentiate between healthy and infected regions, providing quantitative data for disease severity assessment.
3. Disease severity grading: In this final stage, the severity level is computed by calculating infected area proportions based on both the leaf localization feature maps and infected region segmentation feature maps, generating quantitative severity grades for each leaf.
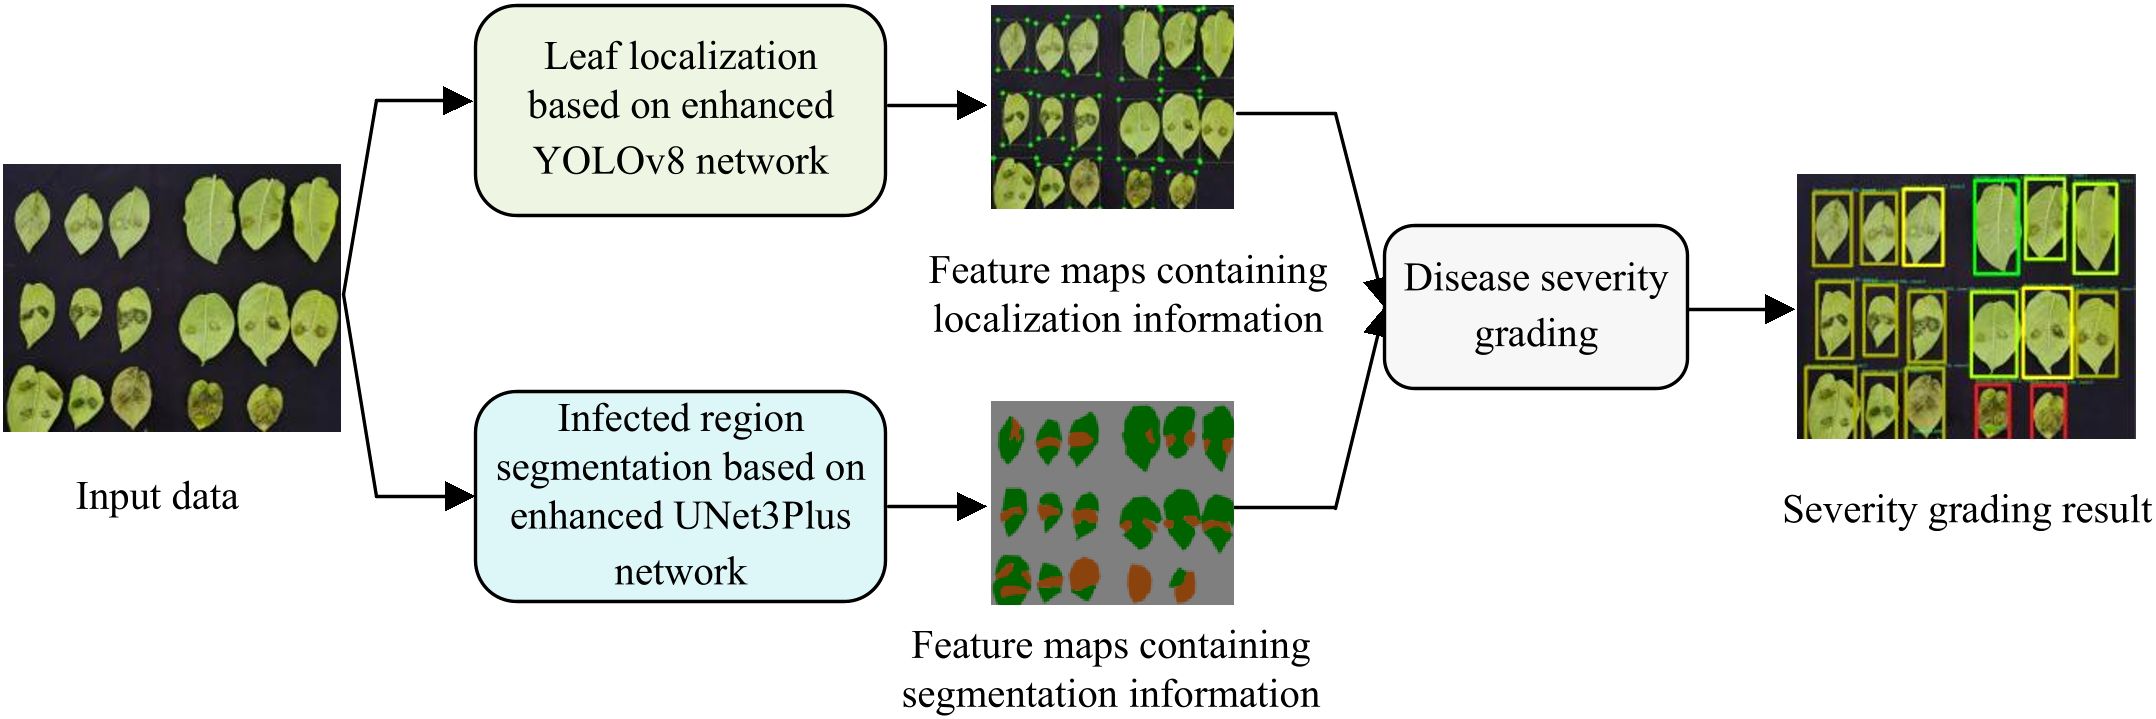
Figure 2. Framework of lightweight potato late blight severity grading.
2.2 YOLOv8-optimized leaf localization
YOLOv8 is a lightweight single-stage object detection model that implements efficient and accurate leaf localization (Yang et al., 2024b; Orchi et al., 2023; Muthulakshmi et al., 2024). Structurally, Figure 3 illustrates the architecture of enhanced YOLOv8, which consists of three main components:
1. Backbone: By extracting features from input images through convolutional operations and C2f modules, this component constructs multi-level feature maps to provide fundamental information for the neck network.
2. Neck: The backbone and head networks are connected through this intermediate component, where feature pyramid architecture is adopted for feature fusion and enhancement.
3. Head: Based on features extracted by preceding networks, the head generates final leaf localization results, providing foundational data support for subsequent severity grading.

Figure 3. Network structure of leaf location based on YOLOv8.
Based on the baseline YOLOv8n which is the lightest model in the YOLOv8 series, an enhanced network for leaf location is proposed with the following innovations, whose detailed parameters are presented in Table 1:
1. ScConv module is integrated into the backbone to implement a lightweight model.
2. BiFPN structure is adopted in the neck to enhance localization capability for leaves which have different sizes.
3. PIoU loss function is adopted to improve the accuracy of leaf bounding box regression.
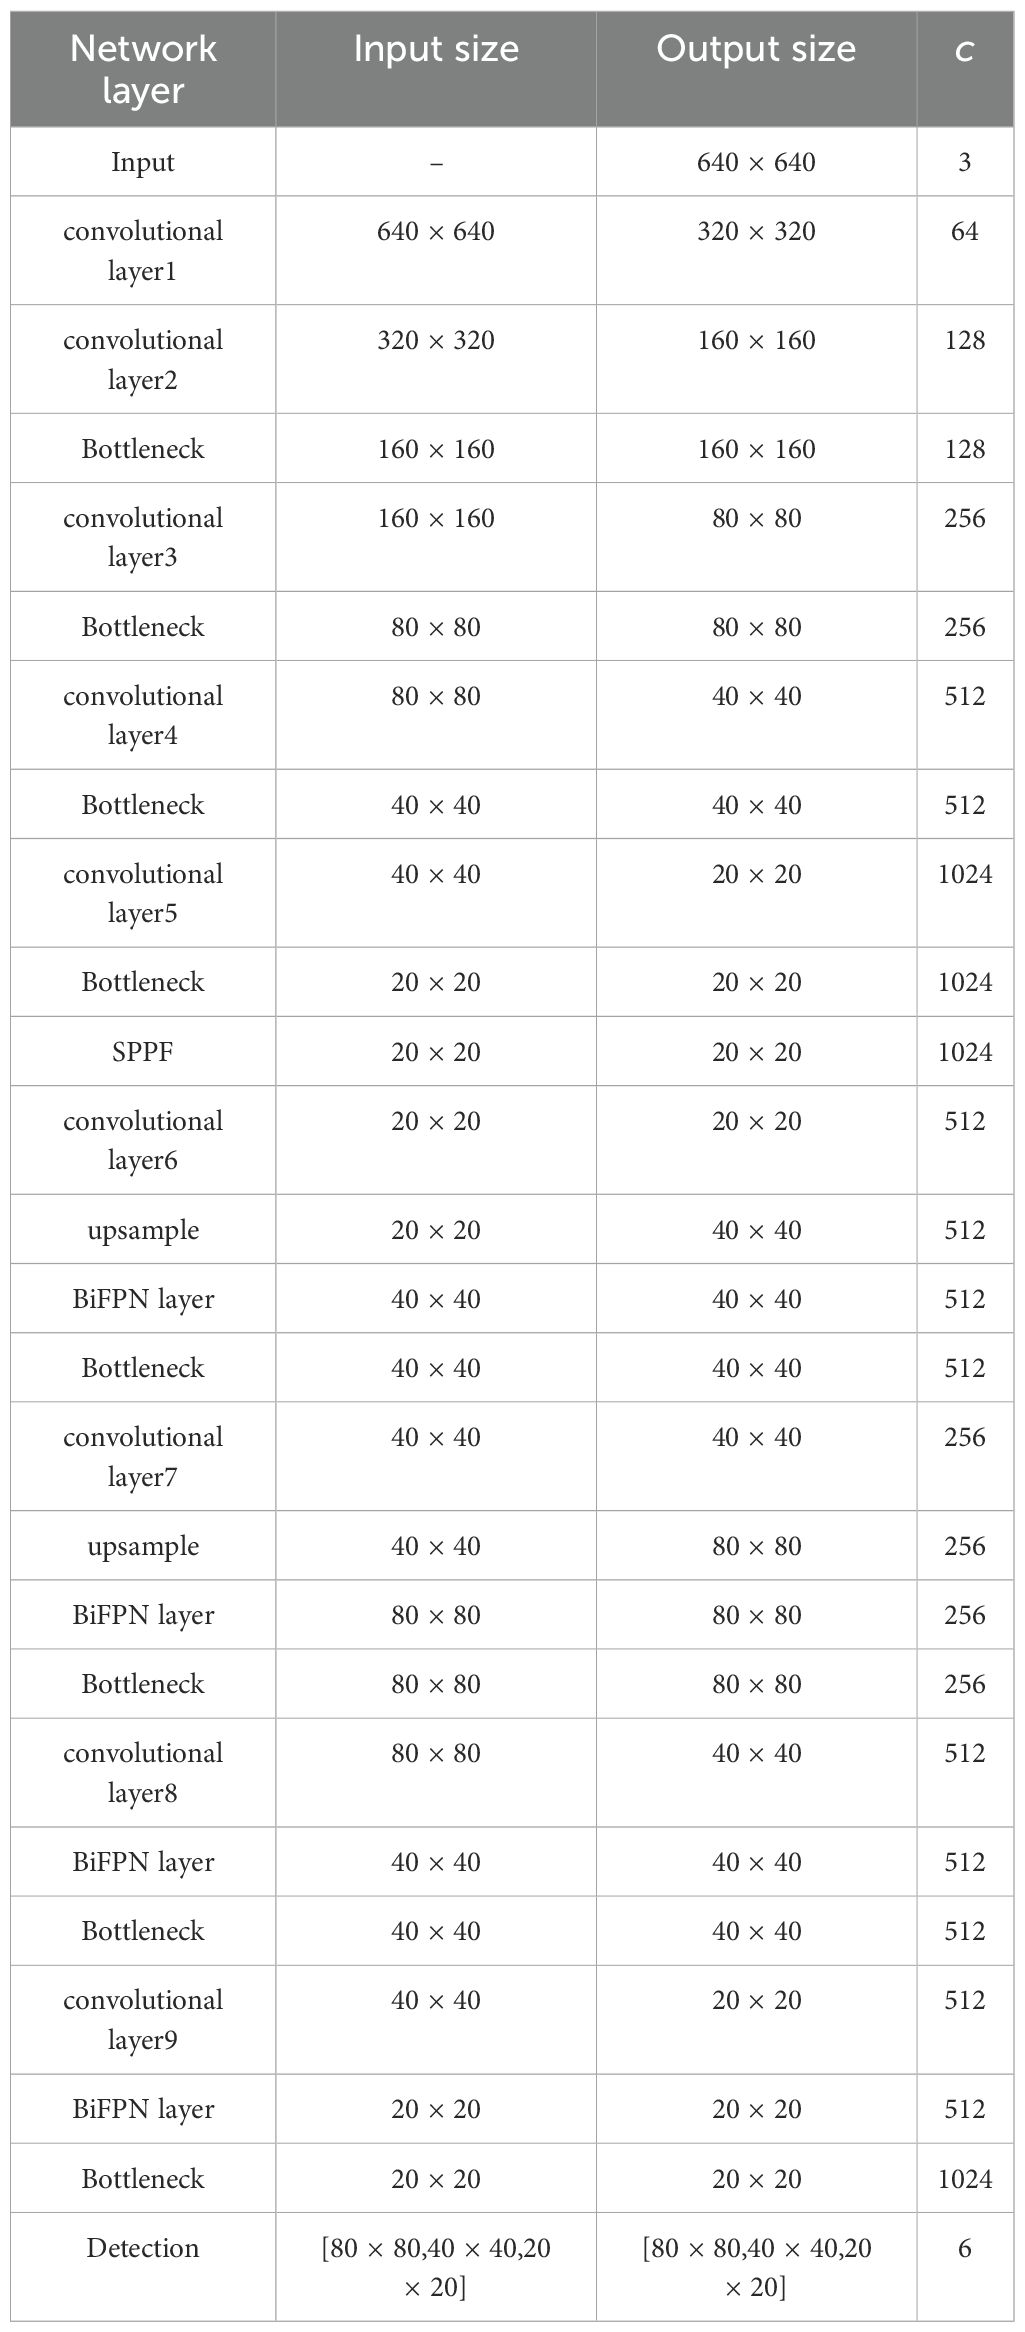
Table 1. Parameters of improved YOLOv8 network.
2.2.1 ScConv-optimized YOLOv8 backbone network
The ScConv module (Li et al., 2023; Jiang et al., 2024) is a lightweight module that reduces feature redundancy through two units: SRU (Spatial Redundancy Unit) and CRU (Channel Redundancy Unit), whose structure is shown in Figure 4. To implement lightweight leaf localization, this paper embeds the ScConv module into the Bottleneck of YOLOv8’s C2f module. In detail, as shown in the comparison between YOLOv8 bottleneck and ScConv-bottleneck in Figure 5, ScConv replaces the second 3×3 convolution in the bottleneck, which effectively reduces network parameters. Specifically, the processing pipeline of ScConv module in this paper consists of the following steps:
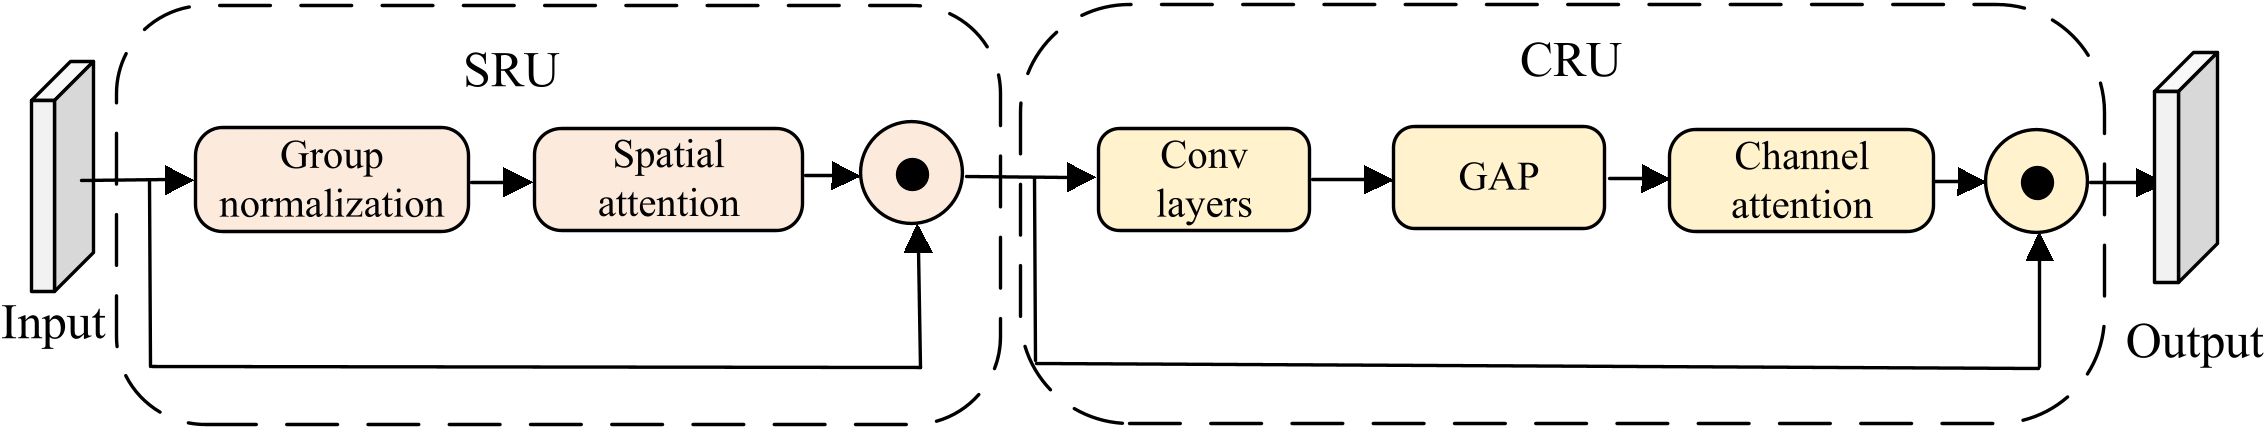
Figure 4. Framework of potato late blight severity grading.

Figure 5. Comparison of YOLOv8 bottleneck and ScConv-Bottleneck.
Step 1: The input feature map is reconstructed along spatial dimensions in the SRU. Given an input feature map , SRU first applies group normalization (GN) to the input features, as formulated in Equation 1:
Here, denotes the group index; and represent learnable affine transformation parameters; and indicate the mean and standard deviation of the g-th group; ϵ serves as a small constant for numerical stability.
Next, as shown in Equation 2, a spatial attention mechanism is utilized to generate attention map As from the normalized features , where Ws is a trainable convolutional kernel, ∗ denotes convolution operation, and σ(·) is the sigmoid function.
After the above processing, the element-wise multiplication (⊙) between attention map As and input feature X produces the reconstructed feature map Xs as defined in Equation 3:
Step 2: Via convolution layers and global average pooling (GAP), Xs is processed through channel-wise refinement to generate a channel attention vector Ac in the CRU. Subsequently, as formulated in Equation 4, the element-wise multiplication between Acand Xs generates the final output Y:
2.2.2 BiFPN-optimized YOLOv8 neck network
BiFPN (Bidirectional Feature Pyramid Network) is a feature fusion architecture that combines bidirectional paths and skip connections for multi-scale feature processing (Tan et al., 2020; Feng et al., 2025). Through this design, BiFPN enhances feature fusion efficiency and multi-scale object detection capability. Considering these advantageous characteristics, BiFPN is incorporated into the neck of YOLOv8 to handle the wide-ranging scale variations in potato leaves. Figure 6 shows the FPN and PAN structure which is used in original YOLOv8, and Figure 7 presents the BiFPN structure. As illustrated, compared to the original FPN and PAN structure, BiFPN introduces additional cross-scale connections and weighted feature fusion, which enables more effective information flow between different scales and enhances the model’s ability to handle multi-scale features.

Figure 6. Structure of YOLOv8’s FPN and PAN.
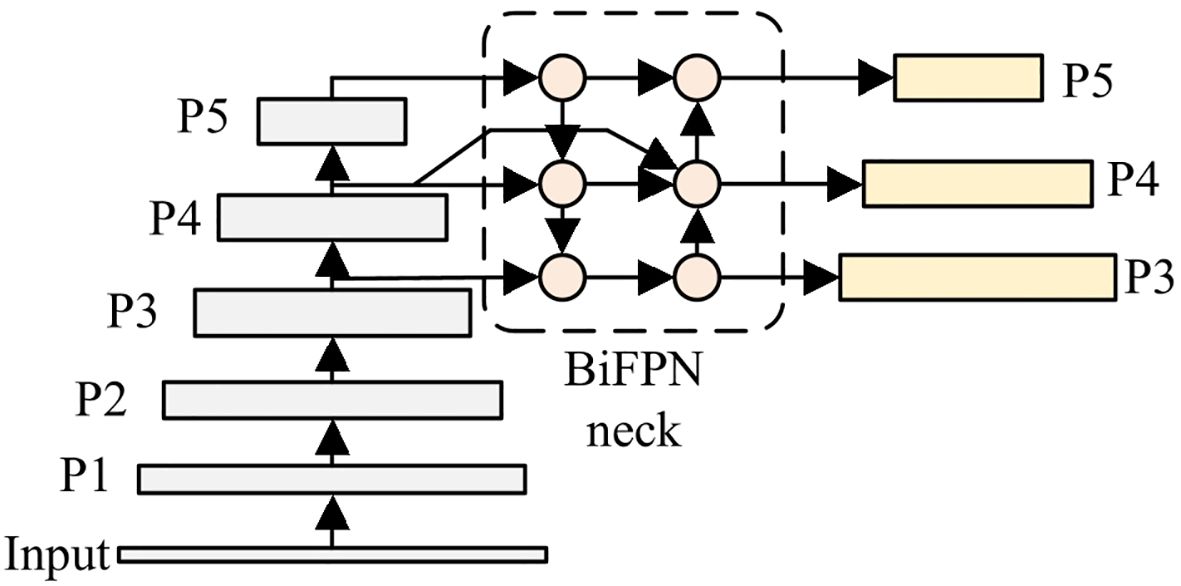
Figure 7. Structure of YOLOv8-BiFPN.
In reconstructing the neck network, 1 × 1 convolution is initially applied to process the input features, which aims to achieve two objectives: (1) enhance the non-linear representation and semantic expression capabilities; (2) adjust the number of channels, which ensures dimensional compatibility between feature maps and BiFPN input. Subsequent to this initial processing, the features then enter two sequential pathways: top-down and bottom-up.
Top-down pathway: This pathway utilizes upsampling operations to increase feature resolution. At each layer, the upsampled features are combined with backbone features through element-wise addition to merge semantic and spatial information. Let denote the output feature map of the top-down pathway at the i-th layer, which is computed in Equation 5:
Here, Pi is the backbone feature map; is the upsampling operation; w1 and w2 are learnable weights; ϵ is a small constant for stability and Conv(·) is a convolutional layer.
Bottom-up pathway: Features at different scales are fused through downsampling operations in this pathway. Each layer in the bottom-up pathway combines information from three sources: (1) top-down features; (2) previous bottom-up features; (3) backbone features. Let denote the output feature map of the bottom-up pathway at the i-th layer, which is evaluated in Equation 6:
where is the downsampling operation, and w3 is the weight for backbone features.
Finally, these refined features are sent to the head for multi-scale leaf detection.
2.2.3 PIoU-based loss function
In this paper, due to the CIoU loss’s limitation in evaluating bounding box quality for irregularly shaped objects like leaves, the Powerful-IoU(PIoU) loss (Liu et al., 2024) is adopted to replace the CIoU for better leaf location. Compared with CIoU loss, PIoU loss calculates the relative positions between predicted and target boxes’ enclosing matrix, which achieves a more precise balance between box size and position accuracy. Based on this optimized calculation method, PIoU demonstrates particularly effective performance in handling leaves with irregular shapes and varying scales.
Specifically, the PIoU loss function combines the standard IoU loss with a geometric penalty term, as shown in Equation 7:
where is the intersection-over-union loss between predicted and ground truth boxes, and is the geometry-sensitive penalty component. The penalty coefficient P is defined in Equation 8:
Here, as shown in Figure 8, which illustrates PIoU-based bounding box calculation, and are the width and height of the ground truth box. The width difference terms dw1 and dw2 measure the maximum width excess: dw1 = max(wb) − wgt represents the excess between the ground truth box and its minimum enclosing rectangle containing the prediction box, dw2 = max(wp) − wgt represents the excess between the prediction box and their joint minimum enclosing rectangle. The height difference terms dh1 and dh2 are defined similarly for the height dimension.
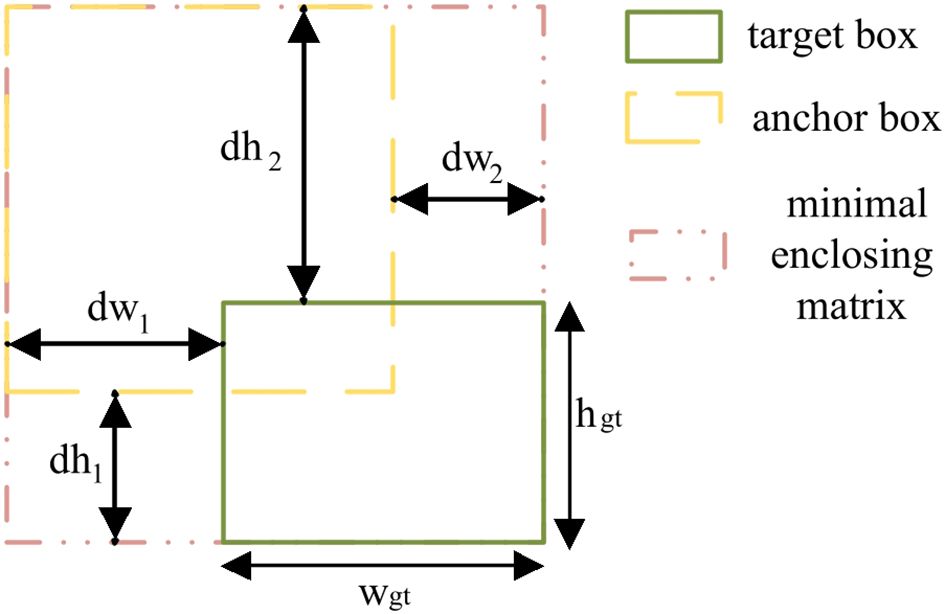
Figure 8. PIoU-based losses.
2.3 UNet3Plus-optimized infected region segmentation
UNet3Plus is a fine-grained semantic segmentation model that implements pixel-level infected region segmentation. Architecturally, the network consists of two parts:
1. Encoder: The input image sequentially passes through five encoding stages, each of which contains a convolutional layer and a 2 × 2 max pooling layer. Specifically, at each stage, the feature map size is reduced by half, and the number of channels is doubled. Through these encoding operations, a multi-scale feature pyramid is formed.
2. Decoder: The decoder contains five stages. By utilizing feature fusion and convolution operations, each decoder stage integrates features from three sources: (1) the encoder at the same level; (2) upsampled features from other decoder layers; and (3) upsampled features from all deeper encoder stages. Through these decoding operations, pixel-wise infected region segmentation results are generated by the final layer.
Based on the UNet3Plus network, two modifications are implemented in this paper, which can be visualized in the structural diagram presented in Figure 9: (1) The convolution modules are replaced with Ghost convolution in both encoder and decoder, which reduces the model parameters; (2) Multi-Scale Local Response Attention(MLSRA) is integrated into the decoder’s feature fusion module to enhance the infected region segmentation performance. Table 2 presents the network parameters in the infected region segmentation model.
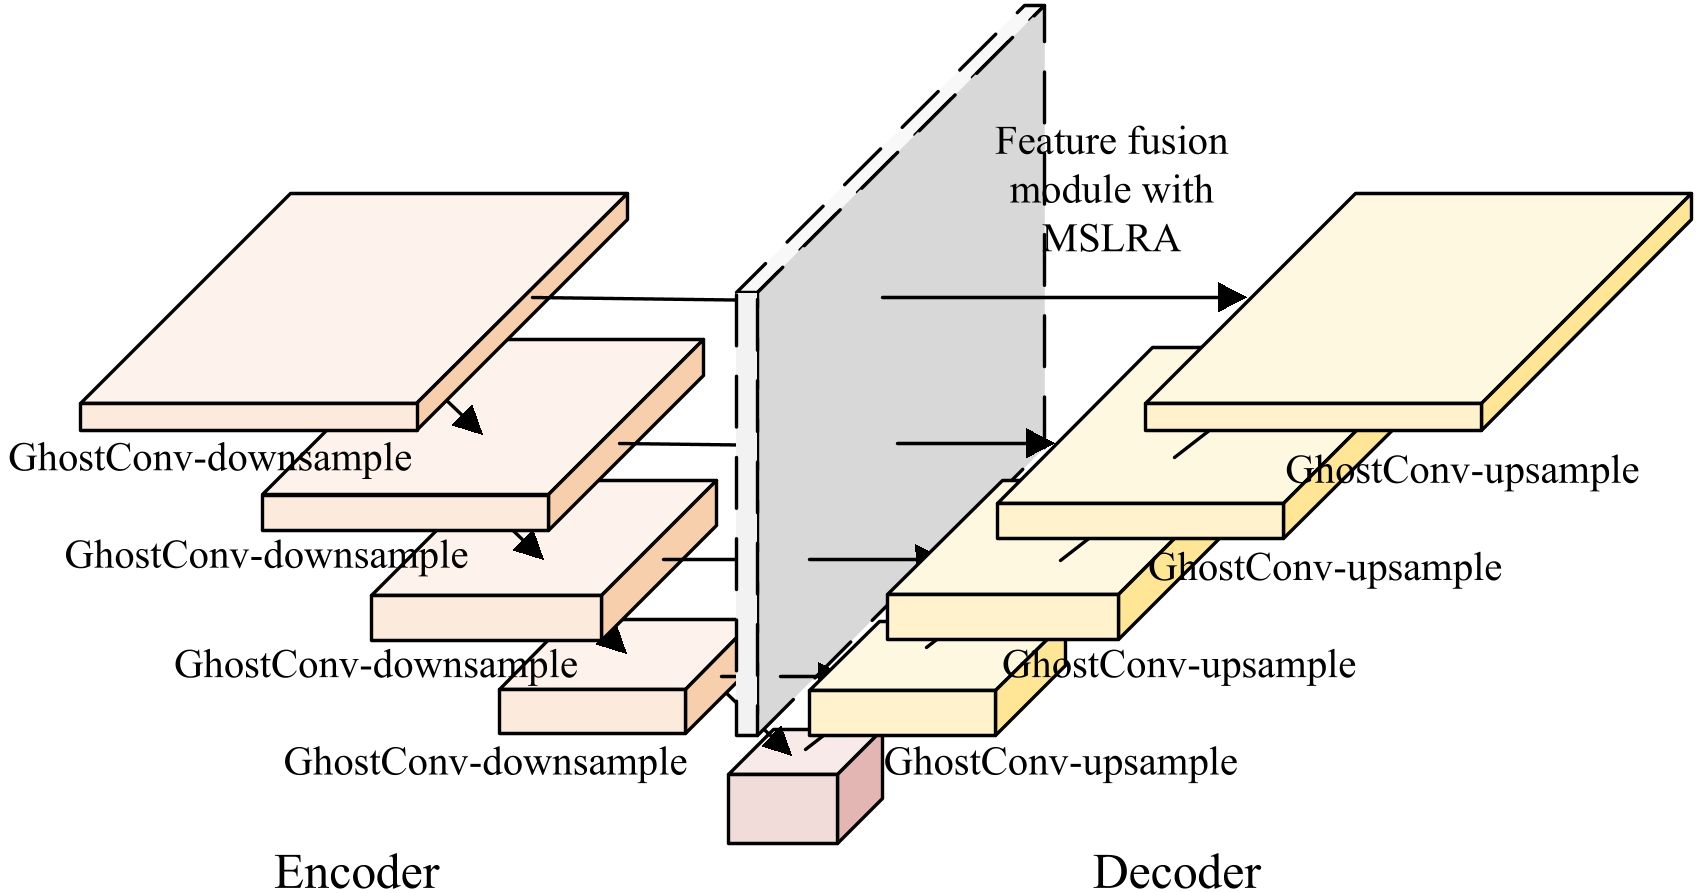
Figure 9. Network structure of infected region segmentation.

Table 2. Parameters of improved UNet3Plus network.
2.3.1 Lightweight encoder-decoder module based on Ghost convolution
To implement lightweight model’s construction, Ghost convolution (Tang et al., 2022; Han et al., 2020, 2022) is utilized to replace the conventional convolution operations in both encoder and decoder of UNet3Plus, which reduces the number of parameters and computational cost (Zhang et al., 2024; Bui and Do Le, 2025). Specifically, the Ghost convolution consists of three steps:
Step 1: The Ghost convolution module first extracts enriched feature representations through combining standard and lightweight convolutions, as shown in Equations 9.
Here, PrimaryConv(·) and CheapConv(·) represent standard convolution and depthwise separable convolution respectively, and ⊕ denotes feature concatenation.
Then the LightSE module of the Ghost convolution module enhances these concatenated features with cross-dimensional dependencies, as shown in Equations 10:
Step 2: For efficient feature transformation, depthwise separable convolution is utilized in the Ghost convolution. For input channels Cin, output channels Cout, and kernel size k, depthwise separable convolution reduces the parameter count from to , which significantly reduces computational complexity.
After the above processing, the Ghost convolution applies channel attention to highlight informative features, as shown in Equations 11 and 12, where σ represents the sigmoid function, GAP(·) denotes global average pooling, and ⊙ indicates channel-wise multiplication.
Similar to the initial step, the subsequent stage of the Ghost module also utilizes both primary and cheap convolutions in parallel to process output, as shown in Equations 9, maintaining structural consistency and enhancing feature diversity.
Step 3: By incorporating residual connection, the network enhances feature propagation capability and mitigates information loss, as formulated in Equations 13:
2.3.2 Decoder architecture based on MSLRA
In order to improve infected region segmentation accuracy for leaves of different scales and reduce computational complexity, Multi-Scale Local Response Attention (MSLRA) is proposed and integrated into the decoder’s feature fusion module to replace the 1 × 1 convolution. The proposed MSLRA, based on Coord attention (Hou et al., 2021), incorporates a multi-scale local response mechanism that extracts local features through multi-scale windows to generate attention maps, which strengthens the ability to focus on important features at different scales and orientations.
To implement this mechanism, MSLRA processes input features through coordinated spatial enhancement and multi-scale enhancement, which effectively captures both global context and local details. In detail, the processing pipeline consists of two main steps:
Step 1: The input features are first compressed by applying global average pooling separately along height and width dimensions, as shown in Equations 14. Here, zh and zw preserve the structural patterns.
Subsequently, these features are concatenated along the channel dimension and processed through a reduction convolution with compression ratio r to generate intermediate features . Based on these intermediate features, the attention weights are computed as shown in Equation 15, where Wh and Ww denote 1 × 1 convolutional kernels and σ represents the sigmoid activation.
Finally, by utilizing element-wise multiplication (⊗) and outer product (⊕) operations between the attention weights and input features, enhanced features Y are generated as shown in Equation 16.
Step 2: The enhanced features Y from Step 1 are passed through four distinct pathways, each of which consists of two steps. Firstly, each pathway uses adaptive average pooling(AAP) to generate feature maps of different sizes: [1 × 1,3 × 3,5 × 5,7 × 7], which enables the model to focus on various scales of information. Subsequently, in each pathway, the number of channels of feature maps is reduced by Conv1×1 and activated by ReLU activation. Then, the number of channels of the feature maps is restored to its original dimension by Conv1×1 to expand the feature representation, as shown in Equation 17.
Next, as shown in Equation 18, in order to form a unified feature representation, a learnable weighted mechanism is utilized to fuse the attention maps which are generated from the four pathways. Here, λkrepresents the learnable weight for each pathway.
Finally, this unified attention map is combined with the original input feature map Y to generate the final output, as formulated in Equation 19.
2.4 Severity grading
In the above two stages, the leaf localization stage generates bounding box G for each leaf, and the infected region segmentation stage implements pixel-wise segmentation, categorizing pixels into background pixels, healthy pixels and infected pixels. Subsequently, for each detected leaf, the severity parameter S is calculated based on the segmented pixels within its corresponding bounding box G, as shown in Equation 20, where Illness represents the infected area and Health denotes the healthy area.
Based on the severity parameter S, the infection level R of each leaf is graded according to Equation 21:
3 Experimental results
3.1 Experimental environment
The hardware environment is 14 vCPU Intel(R) Xeon(R) Platinum 8362 CPU @ 2.80GHz; Memory 45GB; RTX3090 GPU 24GB. The software environment is ubuntu20.04 operating system, Python 3.8, Pytorch 1.10.0, and Cuda 11.3.
3.2 Dataset
The dataset consists of approximately 4,700 potato late blight leaf samples across 6 severity levels, which were collected by the equipment shown in Figure 10. In this equipment, an adjustable lifting mechanism is featured to capture leaves at different scales, and a flexible lighting system is featured to adapt to varying shooting conditions. With this professional equipment, the collected images are of high quality and show clear gradation in both disease coloration and infection coverage, providing solid support for potato late blight grading.

Figure 10. Potato late blight data acquisition equipment.
Furthermore, the data augmentation methods are applied in this paper to enrich the potato late blight dataset. As a fundamental technology in deep learning (Shorten and Khoshgoftaar, 2019), data augmentation enriches the original dataset through various transformation methods (Pandian et al., 2019; Wagle et al., 2021). To meet practical application requirements, different augmentation strategies were adopted for leaf localization and infected region segmentation tasks because of the differing characteristics and challenges of each task.
For leaf localization, we utilized the built-in data augmentation strategy of YOLOv8, which includes standard transformations such as random cropping, scaling, and color adjustments. These augmentations are sufficient for our task because leaf localization primarily requires robustness to variations in leaf position, size, and lighting conditions, which are effectively addressed by YOLOv8’s default augmentations.
For infected region segmentation, more diverse and intensive augmentations were used because of the task’s higher complexity and sensitivity to variations in infection patterns. The following augmentation methods were applied with specific justifications:
1. Horizontal flip(probability 0.5): This augmentation could not only helps the model generalize to different orientations of leaves and infection patterns but also doubles the effective training data by creating mirrored versions of each image.
2. Vertical flip(probability 0.5): This strategy ensures the model learn invariant features regardless of vertical orientation, which is particularly important for capturing spatial symmetry in segmentation tasks.
3. Random 90° rotation(probability 0.5): To enable robust segmentation of irregularly oriented infections which may appear at any angle on leaves, we employed 90° rotation augmentation. This method could not only maintain the pathological feature integrity but also provide essential orientation diversity for model training.
4. Random translation, scaling, and rotation(probability 0.5, rotation angle less than 45°, scale ratio 0.1): By simulating real-world variations in camera distance, angle, and leaf positioning, these augmentations ensure the model handle off-center leaves and improve the generalization ability to field conditions.
These augmentations were chosen to address the specific challenges of infected region segmentation, such as the irregular shapes and sizes of infections, their varying locations on leaves, and the need for precise pixel-level predictions. By introducing controlled variability, the model becomes more robust to the diverse appearances of diseased regions in practical scenarios, ultimately improving generalization to unseen data.
Through these augmentation methods, the dataset was enriched to approximately 140,000 leaf samples. Figure 11 demonstrates representative augmentation results of a sample image, illustrating the effectiveness of these transformation methods. What’s more, in order to ensure effective model training and reliable evaluation, the dataset was split into training and testing sets with ratio of 7:3.

Figure 11. Data augmentation results. (A) Original sample. (B) Augmented sample. (C) Augmented sample. (D) Augmented sample.
3.3 Results evaluation
Evaluation metrics provide quantitative measures to assess model performance in deep learning (Sokolova and Lapalme, 2009). Therefore, appropriate metrics selection enables objective comparison among different models and identifies optimal solutions for specific tasks.
3.3.1 Leaf localization
For leaf localization, this paper used Precision, Recall, F1-score and mean Average Precision at 50% Intersection over Union (mAP50) that range between 0 and 1 (Powers, 2011; Ronneberger et al., 2015). In detail, higher values of these metrics indicate better performance. Mathematically, these metrics are defined as Equations 22–25 where TPi denotes the number of true positive samples, FPi represents the number of false positive samples, FNi indicates the number of false negative samples, and AP50i is the Average Precision at IoU threshold 0.5 for class i.
3.3.2 Infected region segmentation
For infected region segmentation task, precision, recall, F1-score, and mean intersection over union (mIoU) are used to evaluate the model performance (Long et al., 2017). Among these metrics, mIoU is defined as Equation 26:
3.3.3 Model complexity
Model complexity is evaluated through the total number of parameters and floating point operations (FLOPs). In detail, the parameters represent the total trainable weights in the model and FLOPs represent the computational cost of a single forward pass. Both of them indicate a more lightweight and efficient model when their values are lower. Mathematically, these metrics are calculated as Equations 27 and 28, where L represents the total number of layers, paramldenotes the number of parameters in layer l, and flopsl represents the floating point operations in layer l.
3.4 Model training and parameters tunning
3.4.1 Training for leaf localization
To achieve high-precision leaf localization, this paper employs the SGD optimizer with a learning rate warmup mechanism to enhance training stability.
In order to evaluate the effectiveness of this leaf localization training strategy, this paper analyzed the training process. Specifically, Figure 12 reveals several distinctive characteristics in train loss curves across different training phases between our enhanced YOLOv8 and the baseline YOLOv8 model, where the horizontal axis represents epochs and the vertical axis represents loss values. Starting from similar initial loss values around 3.62, our model demonstrates superior convergence behavior in multiple phases. Through the first 10 epochs, our model shows a steeper descent trajectory to 2.0433. Then during the intermediate phase (epochs 11-30), our model exhibits a more stable and consistent descent pattern.

Figure 12. Comparative loss curves of leaf localization.
Notably, between epochs 20-25, the loss of our model decreases steadily from 1.5894 to 1.4443, suggesting superior learning stability. Finally, in the epochs 31-50, our model achieves a lower loss value than the base model (1.0483 versus 1.0567), which maintains consistent minor oscillations that demonstrate both successful convergence and robust model stability. Based on these training results, it can be concluded that our model achieves better feature extraction capabilities and demonstrates stronger generalization ability.
3.4.2 Training for infected region segmentation
In the infected region segmentation task, Adam optimizer (Duchi et al., 2011) combined with WeightDICE loss (Jadon, 2020) function is utilized as the basic training strategy to enable adaptive parameter updates and enhance segmentation accuracy. Initially, Figure 13 demonstrates the comparative loss curves between our model and the baseline under fixed learning rate, where the horizontal axis represents training epochs and the vertical axis represents loss values. In detail, our model initially showed higher starting loss (57.29) and slower convergence compared to the baseline model (48.75), which was primarily due to our adoption of a lightweight network with fewer parameters that might make it difficult to learn features quickly.

Figure 13. Comparative loss curves of infected region segmentation without optimized training strategy.
To address the slow convergence issue, an improved learning rate scheduling strategy is designed as shown in Figure 14, where the horizontal axis represents training epochs and the vertical axis represents learning rate values. Specifically, the learning rate starts from 0.0001, gradually increases during the first 10 epochs (warm-up phase) to reach 0.001, then follows a cosine curve decreasing to 0.0000225. This strategy was designed considering the characteristics of lightweight models: the warm-up phase allows the model to gradually adapt to data distribution, and cosine annealing enables fine-tuning of parameters in later stages, which maximizes the use of model capacity.

Figure 14. Learning rate schedule under warmup-cosine annealing.
Based on the above improved strategy, Figure 15 demonstrates the comparative training performance between our model and the baseline, where the horizontal axis represents training epochs and the vertical axis represents loss values, revealing that our model effectively overcame the slow convergence challenge of lightweight networks:
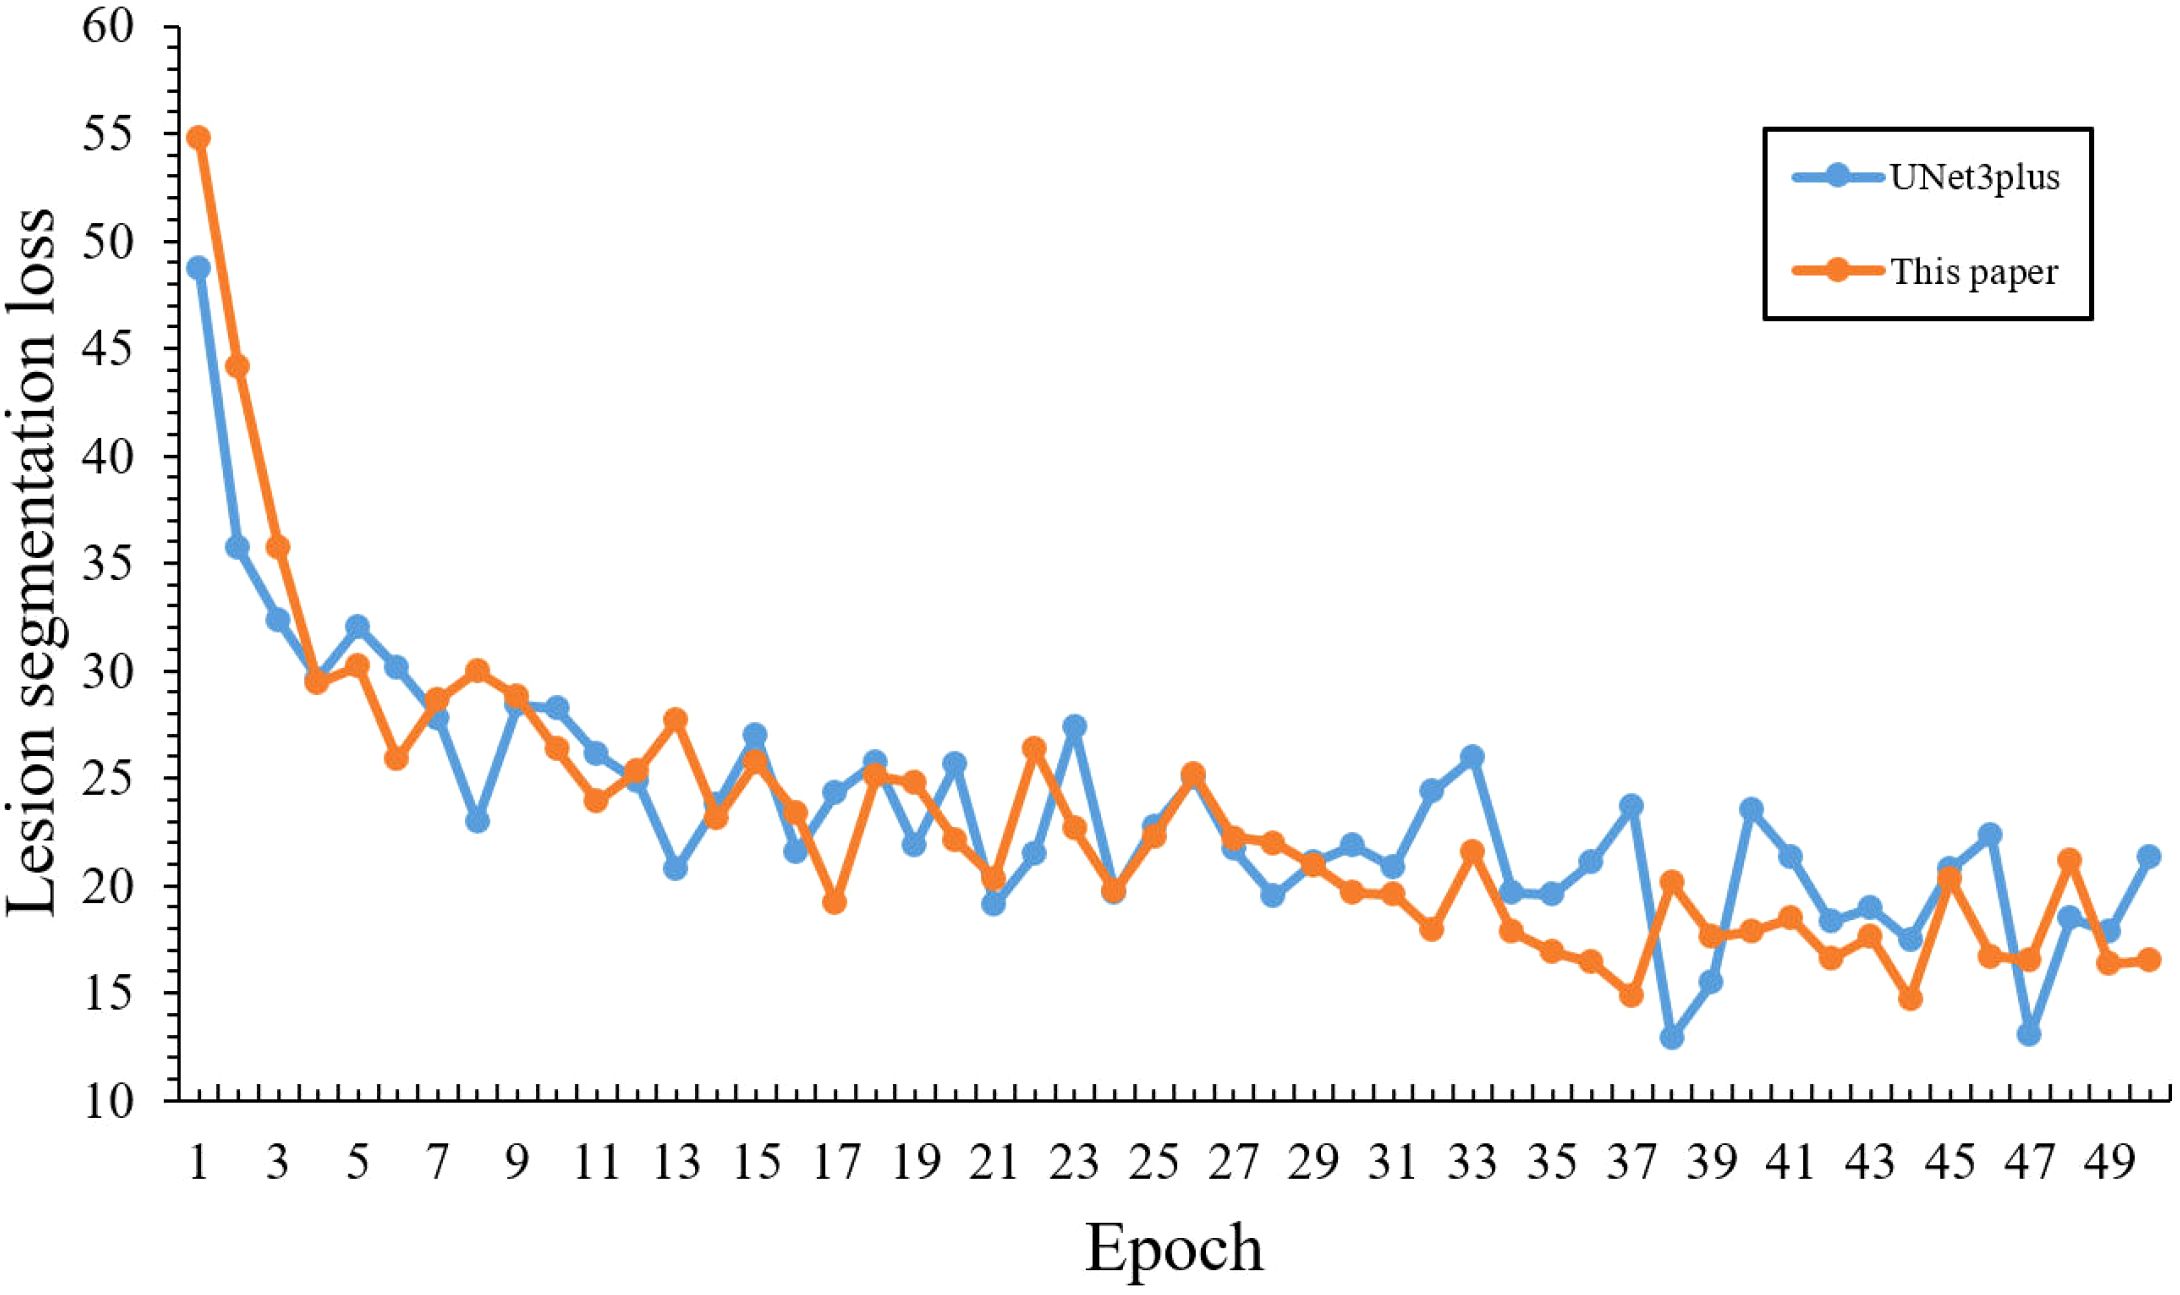
Figure 15. Comparative loss curves of infected region segmentation with optimized training strategy.
Initial training performance: Although our model showed a higher initial loss (54.75) compared to the baseline (48.75) in the first epoch, it quickly achieved better performance by epoch 5 with a loss of 30.18, surpassing the baseline’s 32.05, which demonstrates the effectiveness of our warm-up strategy in overcoming early training challenges.
Training Efficiency: During epochs 10-20, our model’s loss steadily decreased from 26.33 to 22.08, outperforming the baseline model’s range (28.63-25.66). This demonstrates that our learning rate scheduling strategy enabled more efficient parameter optimization during the middle training phase.
Convergence Performance: The most notable improvements emerged during the later training stages (epochs 20-50), where our model’s loss steadily decreased from 22.08 to 16.48. Such stable optimization and superior final performance validate the effectiveness of our learning rate scheduling strategy in addressing the convergence challenges of lightweight models.
3.5 Ablation experiments
3.5.1 Ablation experiments of leaf localization
To validate the effectiveness of our proposed components in leaf localization, Tables 3 and 4 summarize the ablation experiments of this paper, where ‘–’ indicates that the corresponding module is not used in the model and ‘✓’ denotes that the corresponding module is used in the model. According to the results, the baseline YOLOv8 achieves 95.54% precision and 90.89% recall. When integrating ScConv, the model significantly reduces computational complexity, although at the cost of a slight decrease in detection metrics. Subsequently, incorporating BiFPN with ScConv improves the F1 score to 95.94% and maintains computational efficiency, surpassing the baseline performance. Similarly, the integration of PIOU enhances the model’s precision to 96.66%, which demonstrates the highest precision among all configurations. It can be attributed to PIOU’s explicit optimization of localization accuracy. However, this combination shows relatively lower recall compared to our full model, indicating potential over-suppression of positive detections.

Table 3. Evaluation results of ablation experiments on leaf localization stage.
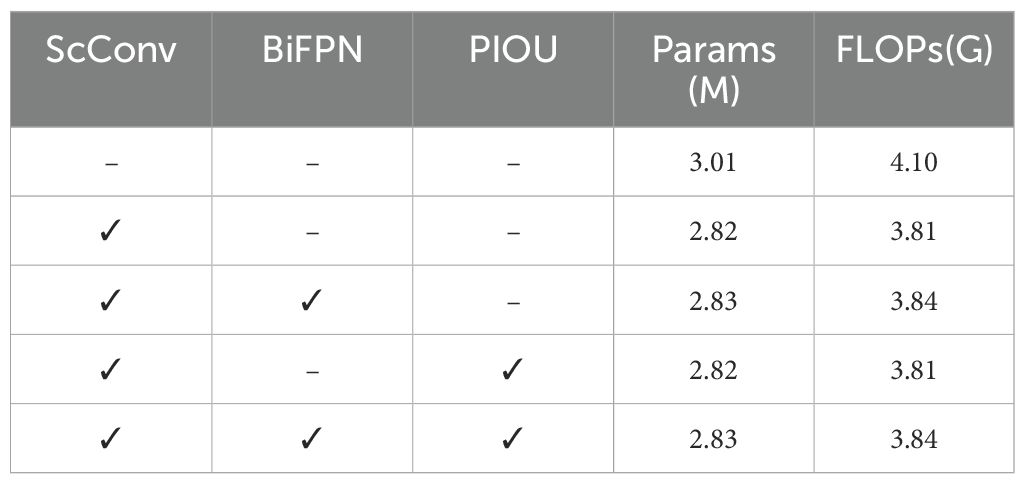
Table 4. Parameter and FLOPs comparison of ablation experiments for leaf localization.
Finally, by combining all three components, our model achieves optimal performance with 95.73% precision, 92.78% recall, and 97.40% F1 score. While the precision of our model is 0.93% lower than the YOLOv8-ScConv-PIOU variant, the difference is offset by two critical advantages:
1. The 2.62% improvement in recall and 0.93% higher F1 score demonstrate our model’s superior overall detection capability.
2. This precision-recall trade-off directly results from BiFPN’s multi-scale feature fusion mechanism, whose intentional preservation of more potential leaf regions across different scales could address the critical agricultural requirement of minimizing missed detections in real scenarios.
Most importantly, our model’s superior performance is achieved with reduced computational complexity (2.83M parameters and 3.84G FLOPs) compared to the baseline model. These experimental results confirm the success of our proposed modifications in both enhancing detection capability and reducing computational costs.
3.5.2 Ablation experiments of infected region segmentation
To evaluate the effectiveness of our proposed components in infected region segmentation, Tables 5 and 6 summarize the ablation experiments of this paper, where ‘–’ indicates that the corresponding module is not used in the model and ‘✓’ denotes that the corresponding module is used in the model. Firstly, the baseline UNet3Plus achieves a foundation performance with 79.27% precision, 72.35% recall, and 75.65% F1-score. When integrating GhostConv into the network, an improvement in precision could be observed to 81.22% with a slight decrease in recall to 70.49%. Notably, this modification brings significant benefits in computational efficiency, reducing the model complexity from 26.98M parameters and 800.48G FLOPs to 8.45M parameters and 455.84G FLOPs. In a separate experiment, incorporating MSLR demonstrates more substantial improvements in both precision (82.78%) and recall (74.89%), which lead to an enhanced F1-score of 78.64%.

Table 5. Ablation experiments metrics for lesion segmentation.

Table 6. Parameter and FLOPs comparison of ablation experiments for lesion segmentation.
Building upon these individual improvements, our model, which combines both components, achieves optimal performance with 85.10% precision, 75.44% recall, and 79.98% F1 score. What’s more, this superior performance is achieved with dramatically reduced computational complexity (4.88M parameters and 134.40G FLOPs) compared to the baseline model. These experimental results validate the effectiveness of our proposed modifications in both enhancing segmentation capability and reducing computational costs.
3.6 Comparative experiments
3.6.1 Comparative experiments of leaf localization
Table 7 presents a comprehensive comparison of different models for leaf localization. As shown in the comparison results, our model achieves optimal performance across multiple metrics, demonstrating the highest mAP50 of 97.40% and F1-score of 94.23% with reduced computational resources (3.89G FLOPs). Among the baseline models, YOLOv11 achieves the second-best performance with 96.56% mAP50 and 93.92% F1-score, followed by YOLOv8 with 95.75% mAP50 and 93.16% F1-score. What’s more, YOLOv10 exhibits the lowest performance across all metrics, with both precision and recall around 72%. Additionally, despite achieving the highest precision of 99.78%, FCOS (Tian et al., 2019; Yehia et al., 2024) shows significantly lower recall (74.09%), resulting in a reduced F1-score of 85.04%. Moreover, FCOS requires substantially higher computational resources with 32.12M parameters, approximately 11.37 times larger than our model’s 2.83M parameters. Notably, DETR achieves near-perfect precision of 99.64% but limited recall of 79.28%, resulting in an intermediate F1-score of 88.30%. This performance comes at the cost of heavy computational overhead, which makes it impractical for field deployment.
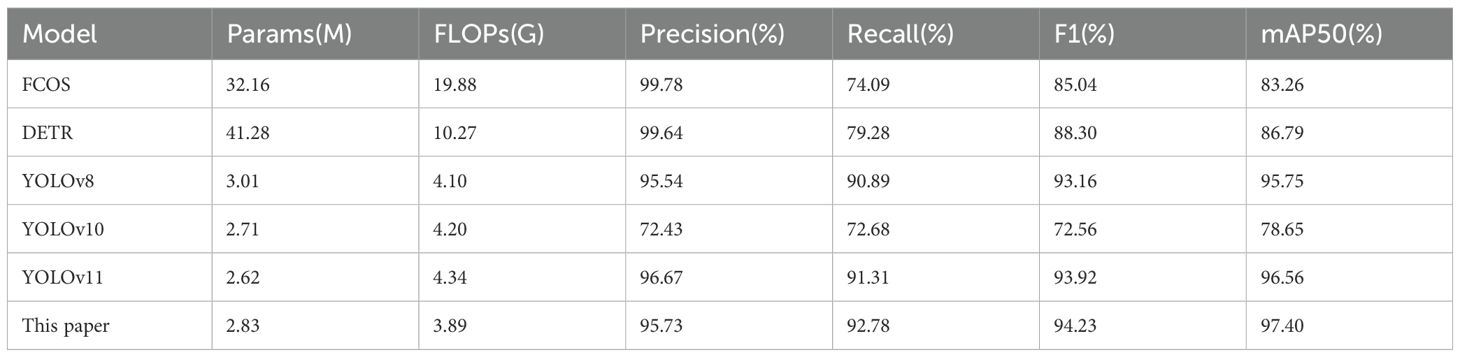
Table 7. Evaluation metrics for leaf localization stage.
From the above experiments, we found that there exists a consistent precision-recall trade-off in highparameter models. Both FCOS and DETR sacrifice 20%-25% recall for less than 4%-5% precision improvement, which is a suboptimal balance for agricultural applications that prioritize comprehensive detection over individual prediction confidence. This phenomenon primarily stems from the fundamental architectural biases of FCOS detector and Transformer-based DETR, which intrinsically prioritize highconfidence predictions at the expense of diminished sensitivity to small targets. Therefore, their inherent limitations in cross-scale leaf detection sensitivity consequently result in 15%-20% lower recall rates compared to YOLO-series models.
3.6.2 Comparative experiments of infected region segmentation
Table 8 presents a comprehensive comparison of different models for infected region segmentation. As demonstrated in the comparison results, our model achieves optimal performance with the highest precision (85.10%), recall (75.44%), and F1-score (79.98%), and requires significantly lower computational resources (134.90G FLOPs and 4.88M parameters). Among the baseline models, UNet3Plus demonstrates the highest mIOU of 86.95% and the second-best F1-score of 75.65%, but requires substantially higher computational cost (800.48G FLOPs), approximately 5.9 times larger than our model. UNet and SegNet (Badrinarayanan et al., 2017) exhibit moderate performance with F1-scores of 72.03% and 74.76% respectively, and PSPNet (Zhao et al., 2017) shows the lowest performance with an F1-score of 59.29%.

Table 8. Evaluation metrics for infected region segmentation stage.
3.6.3 Comparative experiments of attention mechanism
Table 9 presents a comprehensive comparison of different attention mechanisms under identical experimental conditions. By using the same Ghost convolution-based UNet3Plus architecture, all models were evaluated with consistent hyperparameters, which includes learning rate, training epochs and optimizer settings. In addition, each attention mechanism was integrated at the same position in the network architecture to ensure fair comparison.
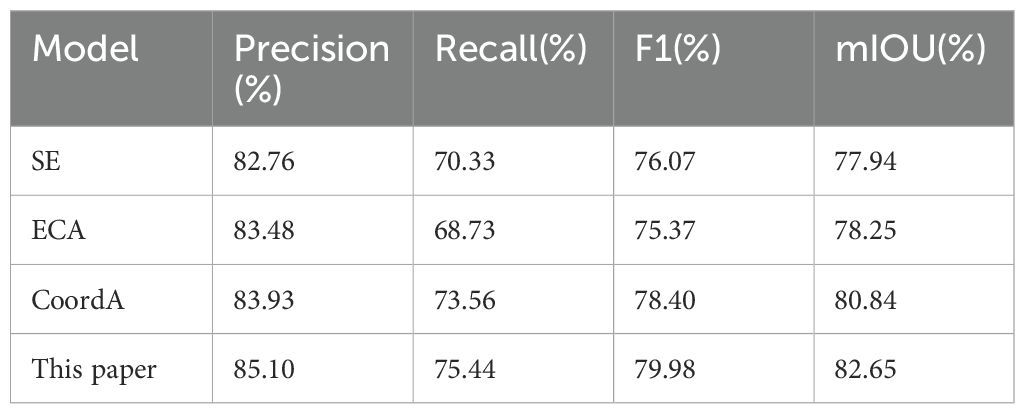
Table 9. Comparative experiments on attention mechanisms.
As shown in the comparison results, our model achieves optimal performance across multiple metrics, with the highest precision (85.10%), recall (75.44%), and F1-score (79.98%). Among the baseline mechanisms, CoordA demonstrates the second-best performance with a precision of 83.93%, recall of 73.56%, and F1-score of 78.40%. For the other baseline mechanisms, SE (Hu et al., 2018) achieves an F1-score of 76.07% (precision 82.76%, recall 70.33%), and ECA (Wang et al., 2020) yields an F1-score of 75.37% (precision 83.48%, recall 68.73%).
3.7 Results visualization
3.7.1 Results visualization of leaf localization
Figure 16 illustrates representative leaf localization results from test set samples. Specifically, the generated bounding boxes precisely encompass the target leaves and minimize background inclusion, which effectively handles variations in leaf size, shape, and orientation. Through these visualization results, our model’s robust leaf localization capability has been validated.
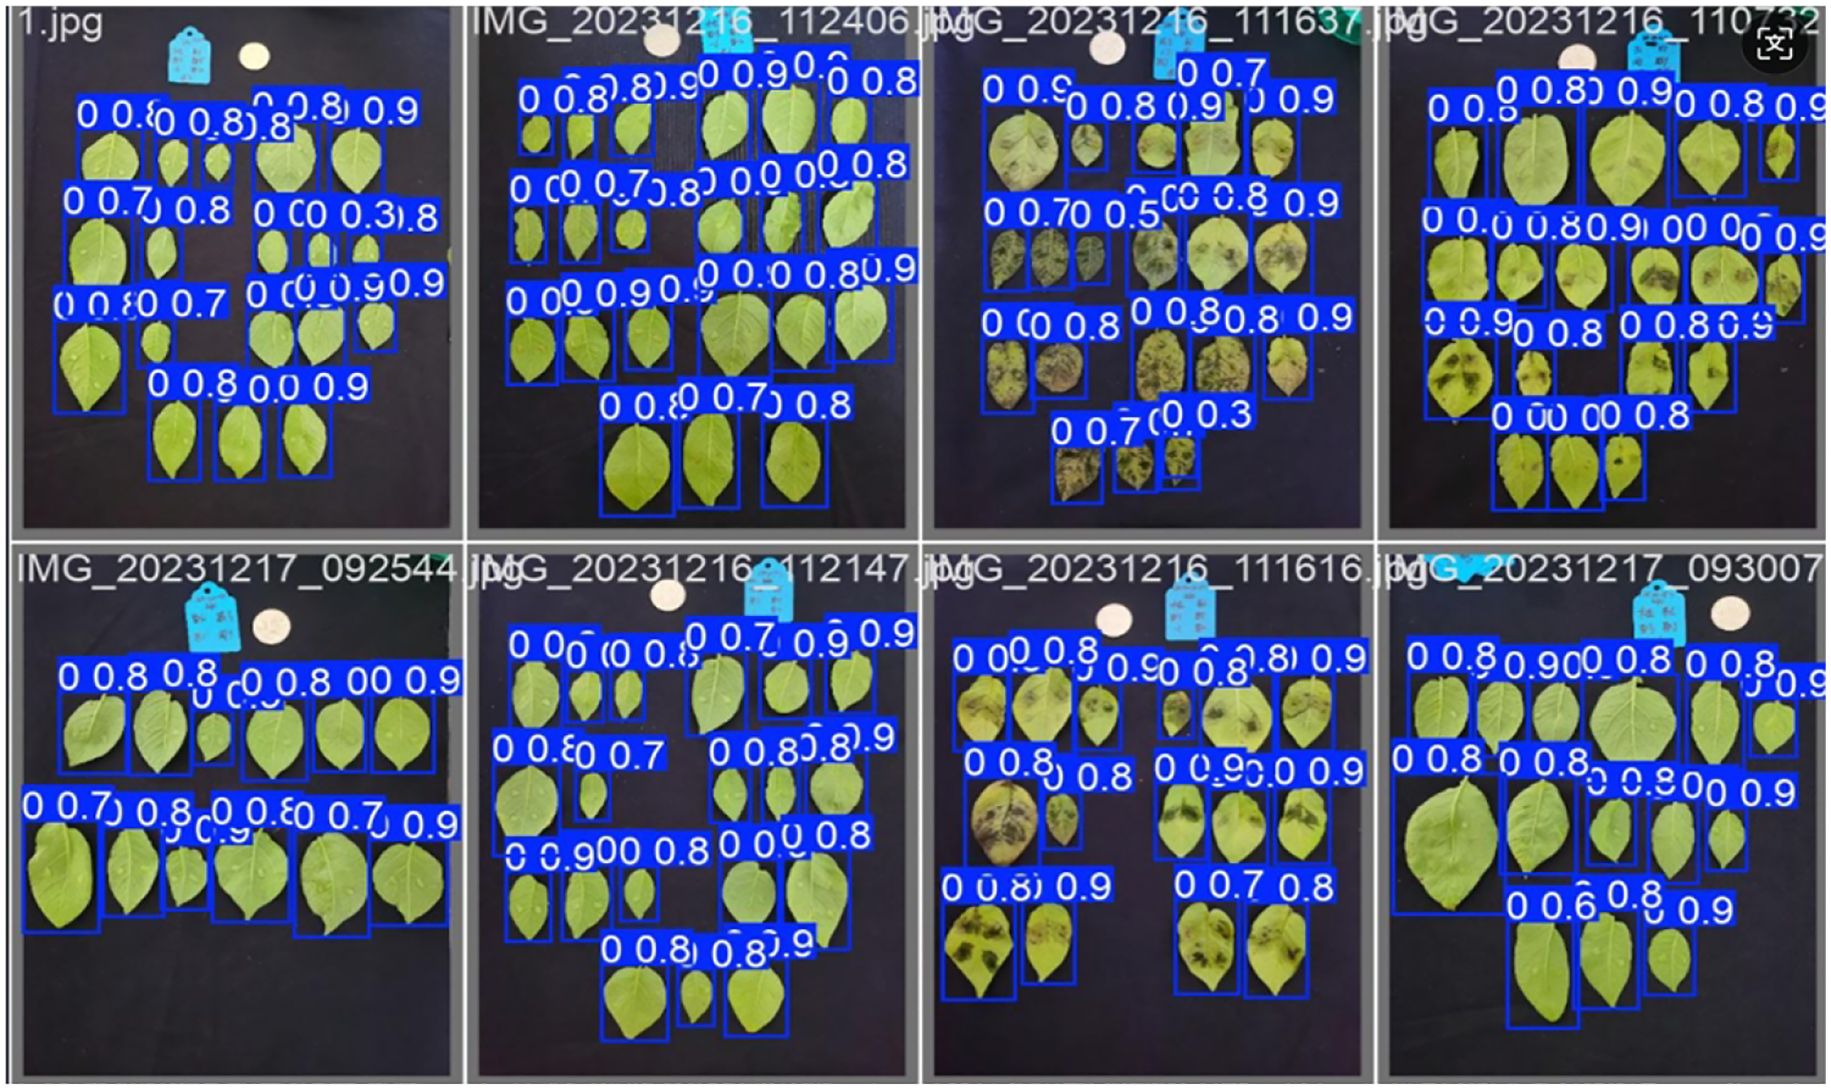
Figure 16. Visualization of leaf localization results.
3.7.2 Results visualization of infected region segmentation
Figure 17 demonstrates that the segmentation results achieve high consistency with ground truth annotations. Based on these visualization results, our model exhibits three significant advantages: (1) accurate boundary delineation of irregular infected regions, particularly in areas with complex morphological characteristics; (2) reliable segmentation of small infection spots, even for early-stage lesions with subtle features; (3) effective suppression of false positives in healthy tissue areas, maintaining high specificity in disease identification. These results comprehensively demonstrate our model’s superior capability in fine-grained infected region segmentation.
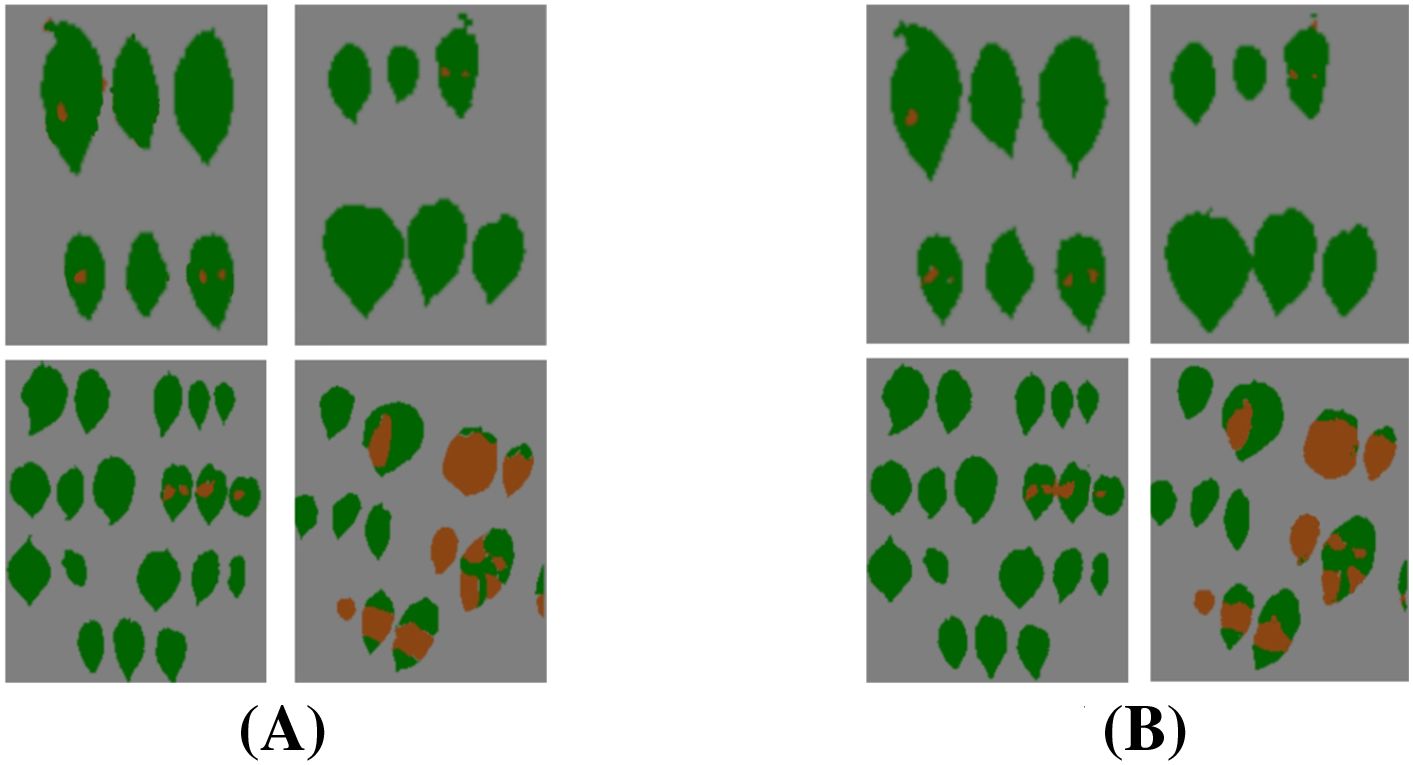
Figure 17. Visualization of infected region segmentation results. (A) Segmentation labels. (B) Predicted results.
3.7.3 Results visualization of severity grading
Figure 18 illustrates the practical application of our potato late blight severity grading model. Validated by the consistent grading results, the area-based grading method demonstrates two principal advantages: (1) scientific and accurate severity grading through precise quantification of infected regions, and (2) efficient batch processing capability for applications.
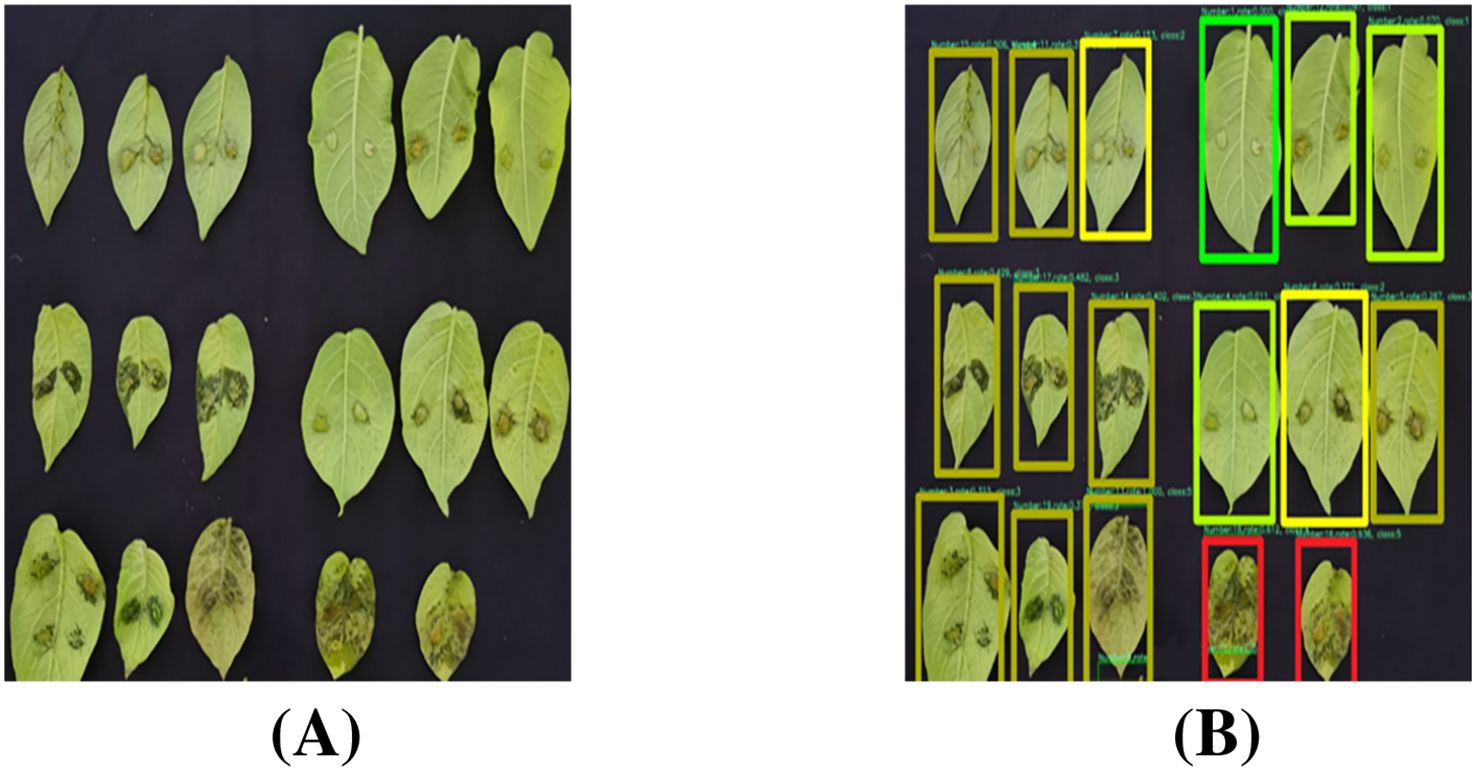
Figure 18. Visualization of severity grading results. (A) Ungraded data. (B) Grading results.
4 Conclusions
1. Dataset for potato late blight leaf disease is collected in this paper, focusing on leaf localization and infected region segmentation tasks. This dataset establishes a reliable foundation for deep learning research in potato late blight disease grading.
2. The severity grading metric based on infected leaf area proportion is established, which transforms traditional experience-based assessment into standardized evaluation. This metric enables objective evaluation of potato late blight severity through precise calculation of infection ratios.
3. A lightweight deep learning model utilizing enhanced YOLOv8-UNet3Plus network is proposed to enable accurate potato late blight severity grading. In terms of individual components, the enhanced YOLOv8 achieves superior leaf localization performance with an F1-score of 94.23% and mAP of 97.40% and an 5.86% reduction in parameters. Similarly, the enhanced UNet3Plus demonstrates improved infected region segmentation with an accuracy of 82.65% and an 87.17% reduction in parameters. Through these optimization, our model demonstrates exceptional efficiency and accuracy for potato late blight severity grading.
Data availability statement
The data analyzed in this study is subject to the following licenses/restrictions: be requested. Requests to access these datasets should be directed to cGVpc2VueUAxNjMuY29t.
Author contributions
PY: Conceptualization, Supervision, Funding acquisition, Resources, Writing – review & editing, Writing – original draft. LJ: Visualization, Writing – original draft, Formal Analysis, Methodology, Investigation, Data curation, Software, Validation. ZC: Data curation, Software, Writing – review & editing, Visualization. YT: Resources, Investigation, Writing – review & editing, Data curation. YY: Data curation, Writing – review & editing. CH: Funding acquisition, Resources, Writing – review & editing, Supervision, Conceptualization.
Funding
The author(s) declare financial support was received for the research and/or publication of this article. This work is supported by the College Students Entrepreneurship Training Program (No.202426XX023) and National Key R&D Program of China (No.2022YFD1400400).
Conflict of interest
The authors declare that the research was conducted in the absence of any commercial or financial relationships that could be construed as a potential conflict of interest.
Generative AI statement
The author(s) declare that no Generative AI was used in the creation of this manuscript.
Publisher’s note
All claims expressed in this article are solely those of the authors and do not necessarily represent those of their affiliated organizations, or those of the publisher, the editors and the reviewers. Any product that may be evaluated in this article, or claim that may be made by its manufacturer, is not guaranteed or endorsed by the publisher.
References
Badrinarayanan, V., Kendall, A., and Cipolla, R. (2017). Segnet: A deep convolutional encoder-decoder architecture for image segmentation. IEEE Trans. Pattern Anal. Mach. Intell. 39, 2481–2495. doi: 10.1109/TPAMI.34
Bhardwaj, A., Kishore, S., and Pandey, D. K. (2022). Artificial intelligence in biological sciences. Life 12, 1430. doi: 10.3390/life12091430
Bhuyan, P. and Singh, P. K. (2024). “Evaluating deep cnns and vision transformers for plant leaf disease classification. DISTRIBUTED COMPUTING AND INTELLIGENT TECHNOLOGY, ICDCIT 2024. (Cham, Switzerland: Springer). Lect. Notes Comput. Sci. 14501, 293–306.
Bui, T. D. and Do Le, T. M. (2025). Ghost-attention-yolov8: Enhancing rice leaf disease detection with lightweight feature extraction and advanced attention mechanisms. AgriEngineering 7, 93. doi: 10.3390/agriengineering7040093
Chen, Z., Peng, Y., Jiao, J., Wang, A., Wang, L., Lin, W., et al. (2025). Md-unet for tobacco leaf disease spot segmentation based on multi-scale residual dilated convolutions. Sci. Rep. 15, 2759. doi: 10.1038/s41598-025-87128-y
Duchi, J., Hazan, E., and Singer, Y. (2011). Adaptive subgradient methods for online learning and stochastic optimization. J. Mach. Learn. Res. 12, 2121–2159. doi: 10.5555/1953048.2021068
Elumalai, S. and Faritha Banu, J. H. (2023). Utilizing deep convolutional neural networks for multi-classification of plant diseases from image data. Traitement du Signal 40, 1479–1490. doi: 10.18280/ts.400416
Feng, H., Chen, X., and Duan, Z. (2025). Lcddn-yolo: Lightweight cotton disease detection in natural environment, based on improved yolov8. AGRICULTURE-BASEL 15, 421. doi: 10.3390/agriculture15040421
Fry, W. E., Birch, P. R. J., Judelson, H. S., Grünwald, N. J., Danies, G., Everts, K. L., et al. (2015). Five reasons to consider Phytophthora infestans a reemerging pathogen. Phytopathology 105, 966–981. doi: 10.1094/PHYTO-01-15-0005-FI
Han, K., Wang, Y., Tian, Q., Guo, J., Xu, C., Xu, C., et al. (2022). Ghostnetv2: Enhance cheap operation with long-range attention. Adv. Neural Inf. Process. Syst 35, 9969–9982.
Han, K., Wang, Y., Tian, Q., Guo, J., Xu, C., and Xu, C. (2020). “Ghostnet: More features from cheap operations,” in 2020 IEEE/CVF Conference on Computer Vision and Pattern Recognition (CVPR). (Piscataway NJ USA: IEEE Publishing), 1577–1586. doi: 10.1109/CVPR42600.2020.00165
He, F., Liu, Y., and Liu, J. (2024). “Eca-vit: Leveraging eca and vision transformer for crop leaves diseases identification in cultivation environments,” in 2024 4th International Conference on Machine Learning and Intelligent Systems Engineering (MLISE). (Cham, Switzerland: Springer), 101–104.
Hou, Q., Zhou, D., and Feng, J. (2021). “Coordinate attention for efficient mobile network design,” in 2021 IEEE/CVF Conference on Computer Vision and Pattern Recognition (CVPR). (Piscataway, NJ, USA: IEEE), 13708–13717.
Howard, A., Sandler, M., Chen, B., Wang, W., Chen, L. C., Tan, M., et al. (2019). “Searching for mobilenetv3,” in 2019 IEEE/CVF International Conference on Computer Vision (ICCV). (Piscataway NJ USA: IEEE Publishing), 1314–1324.
Hu, J., Shen, L., Albanie, S., Sun, G., and Wu, E. (2018). “Squeeze-and-excitation networks,” in 2018 IEEE/CVF Conference on Computer Vision and Pattern Recognition (CVPR), 7132–7141. doi: 10.1109/CVPR.2018.00745
Huang, H., Lin, L., Tong, R., Hu, H., Zhang, Q., Iwamoto, Y., et al. (2020). “Unet 3+: A full-scale connected unet for medical image segmentation,” in ICASSP 2020–2020 IEEE International Conference on Acoustics, Speech and Signal Processing (ICASSP). (Piscataway NJ USA: IEEE Publishing), 1055–1059.
Jadon, S. (2020). “A survey of loss functions for semantic segmentation,” in 2020 IEEE Conference on Computational Intelligence in Bioinformatics and Computational Biology (CIBCB). (Piscataway NJ USA: IEEE Publishing), 1–7.
Jiang, W., Yang, L., and Bu, Y. (2024). Research on the identification and classification of marine debris based on improved yolov8. J. Mar. Sci. Eng. 12, 1748. doi: 10.3390/jmse12101748
Kamilaris, A. and Prenafeta-Boldú, F. X. (2018). Deep learning in agriculture: A survey. Comput. Electron. Agric. 147, 70–90. doi: 10.1016/j.compag.2018.02.016
Li, B., Tang, J., Zhang, Y., and Xie, X. (2022). Ensemble of the deep convolutional network for multiclass of plant disease classification using leaf images. Int. J. Pattern Recognition Artif. Intell. 36, 2250016. doi: 10.1142/S0218001422500161
Li, J., Wen, Y., and He, L. (2023). “Scconv: Spatial and channel reconstruction convolution for feature redundancy,” in 2023 IEEE/CVF Conference on Computer Vision and Pattern Recognition (CVPR). (Piscataway, NJ, USA: IEEE), 6153–6162.
Li, Z., Wu, W., Wei, B., Li, H., Zhan, J., Deng, S., et al. (2025). Rice disease detection: Tli-yolo innovative approach for enhanced detection and mobile compatibility. SENSORS 25, 2494. doi: 10.3390/s25082494
Liu, Z., Mao, H., Wu, C. Y., Feichtenhofer, C., Darrell, T., and Xie, S. (2022). “A convnet for the 2020s,” in 2022 IEEE/CVF Conference on Computer Vision and Pattern Recognition (CVPR). (Piscataway NJ USA: IEEE Publishing), 11966–11976.
Liu, C., Wang, K., Li, Q., Zhao, F., Zhao, K., and Ma, H. (2024). Powerful-iou: More straightforward and faster bounding box regression loss with a nonmonotonic focusing mechanism. Neural Networks 170, 276–284. doi: 10.1016/j.neunet.2023.11.041
Long, J., Shelhamer, E., and Darrell, T. (2017). Fully convolutional networks for semantic segmentation. IEEE Trans. Pattern Anal. Mach. Intell. (TPAMI) 39, 640–651. doi: 10.1109/TPAMI.2016.2572683
Lu, J., Tan, L., and Jiang, H. (2021). Review on convolutional neural network (cnn) applied to plant leaf disease classification. Agriculture 11, 707. doi: 10.3390/agriculture11080707
Lu, Y., Yu, J., Zhu, X., Zhang, B., and Sun, Z. (2024). Yolov8-rice: A rice leaf disease detection model based on yolov8. Paddy Water Environ. 22, 695–710. doi: 10.1007/s10333-024-00990-w
Miao, Y., Meng, W., and Zhou, X. (2025). Serpensgate-yolov8: An enhanced yolov8 model for accurate plant disease detection. Front. Plant Sci. 15, 1514832. doi: 10.3389/fpls.2024.1514832
Mohanty, S. P., Hughes, D. P., and Salathé, M. (2016). Using deep learning for image-based plant disease detection. Front. Plant Sci. 7, 1419. doi: 10.3389/fpls.2016.01419
Muthulakshmi, M., Aishwarya, N., Kumar, R. K. V., and Suresh, B. R. T. (2024). Potato leaf disease detection and classification with weighted ensembling of yolov8 variants. J. Phytopathol. 172, e13433. doi: 10.1111/jph.13433
Orchi, H., Sadik, M., Khaldoun, M., and Sabir, E. (2023). “Real-time detection of crop leaf diseases using enhanced yolov8 algorithm,” in 2023 International Wireless Communications and Mobile Computing (IWCMC). (Piscataway, NJ, USA: IEEE), 1690–1696.
Pandian, A. J., Geetharamani, G., and Annette, B. (2019). “Data augmentation on plant leaf disease image dataset using image manipulation and deep learning techniques,” in 2019 IEEE 9th International Conference on Advanced Computing (IACC). (Piscataway, NJ, USA: IEEE), 199–204.
Powers, D. M. W. (2011). Evaluation: From precision, recall and f-measure to roc, informedness, markedness and correlation. J. Mach. Learn. Technol. 2, 37–63. doi: 10.48550/arXiv.2010.16061
Ronneberger, O., Fischer, P., and Brox, T. (2015). “U-net: Convolutional networks for biomedical image segmentation,” in Medical Image Computing and Computer-Assisted Intervention (MICCAI). (Cham, Switzerland: Springer), Vol. 9351. 234–241.
Shoaib, M., Shah, B., Ei-Sappagh, S., Ali, A., Ullah, A., Alenezi, F., et al. (2023). An advanced deep learning models-based plant disease detection: A review of recent research. Front. Plant Sci. 14, 1158933. doi: 10.3389/fpls.2023.1158933
Shorten, C. and Khoshgoftaar, T. M. (2019). A survey on image data augmentation for deep learning. J. Big Data 6, 60. doi: 10.1186/s40537-019-0197-0
Sokolova, M. and Lapalme, G. (2009). A systematic analysis of performance measures for classification tasks. Inf. Process. Manage. 45, 427–437. doi: 10.1016/j.ipm.2009.03.002
Tan, M., Pang, R., and Le, Q. V. (2020). “Efficientdet: Scalable and efficient object detection,” in 2020 IEEE/CVF Conference on Computer Vision and Pattern Recognition (CVPR). (Piscataway NJ USA: IEEE Publishing), 10778–10787.
Tang, X., Li, B., Guo, J., Chen, W., Zhang, D., and Huang, F. (2023). A cross-modal feature fusion model based on convnext for rgb-d semantic segmentation. Mathematics 11, 1828. doi: 10.3390/math11081828
Tang, Y., Han, K., Guo, J., Xu, C., Xu, C., and Wang, Y. (2022). Ghostnetv2: Enhance cheap operation with long-range attention. Adv Neural Inf Process Syst. 35, 9969–9982. doi: 10.48550/564arXiv.2211.12905
Tian, Z., Shen, C., Chen, H., and He, T. (2019). “Fcos: Fully convolutional one-stage object detection,” in 2019 IEEE/CVF International Conference on Computer Vision (ICCV). (Piscataway NJ USA: IEEE Publishing), 9626–9635.
Wagle, S. A., Harikrishnan, R., Sampe, J., Mohammad, F., and Ali, S. H. M. (2021). Effect of data augmentation in the classification and validation of tomato plant disease with deep learning methods. Traitement du Signal 38, 1657–1670. doi: 10.18280/ts.380609
Wang, J., Sun, Ke., Cheng, T., Jiang, B., Deng, C., Zhao, Y., et al. (2019). Deep high-resolution representation learning for visual recognition. IEEE Trans. Pattern Anal. Mach. Intell. 43, 3349–3364. doi: 10.1109/TPAMI.2020.2983686
Wang, H., Fu, T., Du, Y., Gao, W., Huang, K., Liu, Z., et al. (2023). Scientific discovery in the age of artificial intelligence. Nature 620, 47–60. doi: 10.1038/s41586-023-06221-2
Wang, Q., Wu, B., Zhu, P., Li, P., Zuo, W., and Hu, Q. (2020). Eca-net: Efficient channel attention for deep convolutional neural networks (Piscataway, NJ, USA: IEEE), Vol. 2020. 11531–11539.
Woo, S., Debnath, S., Hu, R., Chen, X., Liu, Z., Kweon, I. S., et al. (2023). “Convnext v2: Co-designing and scaling convnets with masked autoencoders,” in 2023 IEEE/CVF Conference on Computer Vision and Pattern Recognition (CVPR). (Piscataway NJ USA: IEEE Publishing), 16133–16142.
Xu, Y., Liu, X., Cao, X., Huang, C., Liu, E., Qian, S., et al. (2021). Artificial intelligence: A powerful paradigm for scientific research. Innovation 2, 100179. doi: 10.1016/j.xinn.2021.100179
Yang, S., Yao, J., and Teng, G. (2024b). Corn leaf spot disease recognition based on improved yolov8. Agriculture-Basel 14, 666. doi: 10.3390/agriculture14050666
Yang, W., Yuan, Y., Zhang, D., Zheng, L., and Nie, F. (2024a). An effective image classification method for plant diseases with improved channel attention mechanism aecanet based on deep learning. Symmetry 16, 451. doi: 10.3390/sym16040451
Yehia, M. N. A., Elfeky, S. M. M., and Hamdi, A. (2024). Enhanced drone-based plant disease detection with visual data augmentation and optimized training. Proc. IEEE Int. Mobile Intell. Ubiquitous Comput. Conf. (MIUCC). 478–483. doi: 10.1109/MIUCC62295.2024.10783525
Zhang, H., Li, Q., and Luo, Z. (2024). Efficient online detection device and method for cottonseed breakage based on light-yolo. Front. Plant Sci. 15, 1418224. doi: 10.3389/fpls.2024.1418224
Keywords: AI for science, potato late blight, lightweight model, feature fusion, plant disease phenotyping, deep learning
Citation: Yuan P, Jiang L, Cheng Z, Tan Y, Yang Y and He C (2025) Lightweight grading method for potato late blight severity based on enhanced YOLOv8-Unet3Plus network. Front. Plant Sci. 16:1616864. doi: 10.3389/fpls.2025.1616864
Received: 23 April 2025; Accepted: 23 July 2025;
Published: 02 September 2025.
Edited by:
Wen-Hao Su, China Agricultural University, ChinaReviewed by:
Kelly Lais Wiggers, Federal Technological University of Paraná, BrazilShunhao Qing, Northwest A&F University Hospital, China
Copyright © 2025 Yuan, Jiang, Cheng, Tan, Yang and He. This is an open-access article distributed under the terms of the Creative Commons Attribution License (CC BY). The use, distribution or reproduction in other forums is permitted, provided the original author(s) and the copyright owner(s) are credited and that the original publication in this journal is cited, in accordance with accepted academic practice. No use, distribution or reproduction is permitted which does not comply with these terms.
*Correspondence: Peisen Yuan, cGVpc2VueUBuamF1LmVkdS5jbg==; Cheng He, aGVjaGVuZ0BuamF1LmVkdS5jbg==