Abstract
Introduction:
Increases in the frequency of higher-than-optimum air temperatures can substantially reduce cotton production. Little is known about the influence of different combinations of day/nighttime temperature on cotton flowering and boll maturation under ambient and elevated CO2 conditions.
Methods:
This study examined the impacts of air temperature variations on the morphology of cotton flowers and seed yield under air CO2 concentrations at 425 ppm (ambient, aCO2) and elevated at 725 ppm (eCO2) in controlled Soil-Plant Atmospheric Research (SPAR) chambers. The four temperature conditions were: optimum (OT; 33/21°C, day/night), high temperature (HT; 36/24°C, day/night), high nighttime (OT+HNT; 33/24 °C, day/night), and high day/nighttime (HT+HNT; 36/28 °C, day/night).
Results:
Various reproductive and seed yield traits, as well as the phenology of the plants, differed significantly (p < 0.001) under the treatments. The boll maturation period significantly decreased in plants grown under HT+HNT, with only 39 days under aCO2 and 38 days under eCO2 compared to 47 days at OT. In the HT and OT+HNT conditions, the duration was 42 days at aCO2 and 46 days at eCO2, as opposed to 41 and 44 days, respectively, under aCO2. Furthermore, there was a significant reduction in the number of pollen grains per anther, 13% for OT+HNT, 24% for HT, and 39% for HT+HNT, relative to OT treatments. The seed cotton weight also showed a drastic decline, decreasing from 105 g plant-1 under OT to 90 g under OT+HNT, 47 g under HT, and 12 g plant-1 under HT+HNT conditions. In the HT+HNT environment, lint percentage and seed weight per plant were reduced by 26% and 86%, respectively, when compared to OT. The eCO2 did not alleviate the reductions in cotton yield caused by higher air temperature exposure.
Discussion:
This study highlights that high air temperature induces flower abscission and anther indehiscence, while diverting biomass allocation towards vegetative organs. The resulting source-sink imbalances between vegetative and reproductive structures resulted in significant reductions in seed and lint yield and growth patterns across CO2 and temperature environments. These findings provide insights into cotton management strategies under future environmental scenarios.
1 Introduction
Globally, cotton is the most widely produced and utilized natural fiber, with an annual economic value of around 600 billion USD (Khan et al., 2020). Among different cotton species, Upland cotton (Gossypium hirsutum L.) cultivars are the most widely cultivated, constituting 97% of the US production (USDA-ERS, 2024). In 2024, global cotton production reached 25 million tons, with the US contributing about 2.6 million tons from 11.2 million acres (MacDonald, 2024), accounting for 11% of total global production after China (24%), India (22%), and Brazil (13%) (USDA-FAS, 2024a). However, the US leads the cotton export market with an estimated export value of 5 billion USD (USDA-FAS, 2024b) holding a key role in the global cotton market. In 2024, the US cotton yield reduced by 7% compared to the previous year (USDA-NASS, 2024). This is attributed to the crop’s sensitivity to environmental cues like increased occurrences of heatwaves, prolonged drought, and other extreme weather events during crop growth and development (Amin et al., 2017). Increased carbon dioxide (CO2) emissions from fossil fuel consumption and land use changes have elevated the atmospheric CO2 concentration (|CO2|) to about 425 ppm in 2024 (Lindsey, 2024). The rate of increase in CO2 is currently around 2.5 ppm per year, and the consequent increase in absorbed heat energy in the atmosphere drives the rise in global temperatures.
According to NASA’s global air temperature monitoring and assessments, the average global annual temperature in 2024 was up by 1.28°C from its average during 1951 to 1980 (NASA, 2024). Notably, 2024 marked the warmest year on record since recordkeeping began in 1880. Since the 1970s, unusually hot summer days with both high day and nighttime temperatures have become more common over the last few decades in the United States (EPA, 2016). More specifically, the nighttime temperature in most locations is rising faster than the daytime temperature (Xia et al., 2014), contributing to a reduction in the diurnal temperature range (Easterling et al., 2000). In line with this trend, the global daily mean minimum temperature increased by 0.8°C per century, compared to a daily maximum temperature increase of 0.4 °C (NCEI, 2024). Plants exhibit modifications in physiological and growth characteristics under these changing temperature conditions (Impa et al., 2019). The rate of plant growth is dependent on the temperature, and the critical temperature for the crop (Hatfield and Prueger, 2015; Soni et al., 2025). Quantifying these modifications in plant growth and yield provides a rationale for exploring key traits that will help breed heat-stress-resilient cotton in the future.
The thermal kinetic window of cotton for optimum metabolic activity with maximum photosynthesis is at about 26-28°C (Burke et al., 1985). Higher than optimum temperatures promote growth and early maturation in cotton; however, they prevent plants from fully achieving their genetic potential (Reddy and Zhao, 2005; Saini et al., 2023). The response of plants to high-temperature conditions also depends on the growing conditions. Few field-based studies have reported that plant height, number of nodes, and internodal length decline under high-temperature conditions where the maximum growing temperature exceeds 40°C (Abro et al., 2021; Yousaf et al., 2023). At the same time, studies conducted under control conditions with optimum water and nutrients observed an increase in plant height and number of nodes with increasing growing temperatures (Reddy et al., 1992, 1998). However, all these studies agreed that high temperatures have an adverse effect on boll retention and cottonseed and lint yield. It can be explained by the imbalance between the source and sink, which adversely affects the yield of cotton (Nie et al., 2020; Qin et al., 2023). Similar to most crops, cotton is susceptible to heat stress during the reproductive phase (Salman et al., 2019; Farooq et al., 2023). It has been reported that high temperature stress deforms the reproductive organs, disrupting pollen maturation, germination, and ovule development, ultimately resulting in lower seed set and crop yield (Snider et al., 2009; Hatfield et al., 2018; Raja et al., 2019; Masoomi-Aladizgeh et al., 2021). The high night temperature (HNT) of 29-31°C is reported to have a disruptive effect on pollen development, leading to male sterility, mainly due to the limited supply of storage lipids and fatty acids as a result of increased respiration (Khan et al., 2020). These modifications have contributed to the increased square and flower abscission observed under high day and night conditions (Song et al., 2015; Loka and Oosterhuis, 2016; Bista et al., 2025).
High temperatures reduce the yield and yield-related parameters such as boll and seed number and lint yield in cotton (Abro et al., 2021; Yousaf et al., 2023). Research indicates that the impact of high-temperature stress becomes more severe when both day and night temperatures rise together, compared to an increase in either one alone (Zafar et al., 2021; Saini et al., 2023; Parkash et al., 2024). As high as a 50-60% reduction in seed and lint yield was observed under a high day and night temperature of 37/26 °C (Mishra et al., 2017). Similarly, the quality of cotton fiber is affected by the growing temperature conditions. A single seed generates around 10,000 to 20,000 fibers under ideal temperature conditions, which is around 26-28°C (Reddy et al., 1997). Temperatures above 35 °C can negatively impact the quality properties of the fiber, affecting its marketable value (Manan et al., 2022). A lower rate of photosynthesis, coupled with the disruption of enzymes involved in sucrose metabolism and cellulose synthesis, is the primary cause of reduced fiber quality under high-temperature conditions (Chen et al., 2017; Ding et al., 2021).
Although studies have been conducted to investigate the impact of high day and night temperatures on cotton yield and quality, a systematic study on the sole and combined effects of high day and nighttime temperatures on reproductive and yield-related traits under ambient and elevated CO2 concentrations has not been attempted before. The study aimed to (i) understand the boll production and retention over time under various combinations of high day and/or night temperatures and CO2, (ii) evaluate the effects of high day and/or night temperature stress on flower characteristics under different CO2 levels, and (iii) estimate the impact of these temperature and CO2 combinations on seed and lint yields and fiber quality, all under optimum water and nutrient conditions.
2 Materials and methods
2.1 Experimental facility
The study was conducted in environment-controlled plant growth chambers at the Soil-Plant-Atmospheric-Research (SPAR) facility, Environmental Plant Physiology Laboratory, Mississippi State University, Mississippi, USA, during the summer of 2023. The SPAR chambers precisely monitor and control the set CO2 and temperature through an automated control system. Each SPAR chamber consists of a steel soil bin (1 m in height × 0.5 m in width) along with a clear, transparent Plexiglas acrylic chamber (2.5 m in height × 1.5 m in width), designed to house the plant canopy. Each SPAR unit is equipped with a heating and cooling system to control the temperature. These SPAR units were sealed to enable gas exchange monitoring but included a door for easy access to take measurements when necessary. The Plexiglas chambers are 1.27 cm thick and permit 97% visible solar radiation. The chambers were in the open sunlight; therefore, the plants grew under natural sunlight conditions. The details and specifications of the SPAR units have been presented by Reddy et al. (2001).
2.2 Experimental setup and treatments
An Upland cotton cultivar, DP 1646 B2 XF, a mid-full-season cultivar accounting for 21.35% of total US cotton acreage in 2020, was used in the study. The cultivar is characterized by triple-stacked herbicide tolerance (dicamba, glyphosate, and glufosinate) and insect control (Bollgard II technology), known as Bollgard II XtendFlex technology. Ninety-six pots (15 cm diameter × 65 cm height) filled with fine sand and topsoil mix in a 3:1 volume ratio (87% sand, 2% clay, and 11% silt) were used for growing the plants. Twelve pots were placed in each SPAR unit. The pots consisted of a hole of 1 cm diameter at the bottom and were filled with 250 g of gravel to facilitate easy drainage. Four seeds were sown in each pot and thinned to one plant per pot after the fourth leaf stage. The plants were grown under ambient outdoor conditions up to flowering. The water and nutrients were supplied through Hoagland’s nutrient solution (Hewit, 1953) thrice a day. The irrigation volume was adjusted according to the daily evapotranspiration (Reddy et al., 2001).
At flowering (60 days after planting), the plants were transferred to the SPAR chambers, which had been preconditioned to the specific temperature and CO2 concentrations. The treatments include four-day/night temperature conditions of optimum (OT, 33/21°C), high nighttime (OT+HNT, 33/24°C), high temperature (HT, 36/24°C), and high temperature with increased nighttime temperature (HT+HNT, 36/28°C) at two CO2 concentrations of 425 ppm (aCO2) and 725 ppm (eCO2). The experiment was conducted in a completely randomized design with 12 replications per treatment. The selection of the optimum temperature was based on the average summer temperature in Mississippi. Daytime temperatures were regulated from sunrise to sunset, while nighttime temperatures gradually changed over 30 minutes after sunset. Black netted shade cloths were installed around the edges of the Plexiglas chambers to mimic the effect of border plants. The shade netting was periodically adjusted according to plant growth.
2.3 Trait measurements
2.3.1 Plant growth traits
The plant height and number of mainstem nodes were measured during the harvest stage. The plants were harvested 135 days after sowing, which was 75 days after the treatment. The plant height was measured using a ruler from the cotyledonary node to the stem apex. The number of mainstem nodes (plant-1) was counted, eliminating the cotyledonary node up to the uppermost node with a fully unfolded leaf.
2.3.2 Boll production and retention
The bolls produced in each treatment were tagged daily with the date of flowering throughout the experiment for about 68 days (60–128 days after planting). The abscised bolls were collected and counted daily from each experimental SPAR unit, with the collection date recorded. At the end of the experiment, the bolls were monitored daily for their opening, which was indicated by the cracking of the boll and the appearance of lint. The boll opening date was marked on the tag beside the boll production date. This resulted in attaining the boll maturation period (BMP, days) as the time taken from the day of anthesis to the day of boll dehiscence. At the time of final harvest, 135 days after planting, the number of fruiting sites and bolls produced and retained were counted on all the plants. The boll retention (%) was accounted for by dividing the number of retained bolls at harvest by the total number of bolls produced per plant in each treatment.
2.3.3 Pollen and ovule production
The flowers were collected between 18.00 and 19.00 h before anthesis. The number of anthers per flower, ovules per boll, and pollen grains per anther were counted in each experiment in three replications. The pollen grains were counted using a Stereo microscope (Nikon SMZ800, Kanagawa, Japan), at 10X magnification by cutting the indehisced anther with a needle in a drop of water.
The pollen grains were collected from the newly opened flowers, to study their morphology. The anthers were tapped onto Petri plates to collect pollen grains from four different plants in each treatment. The pollen grains were then bulked to mount on a stub for scanning. The indehiscent anthers were burst open using a needle, and the pollen grains were collected into a Petri dish. The pollen grains were mounted onto a steel stub, and it was coated with platinum in an EMS150T ES sputter coater (Quorum Technologies, Electron Microscopy Sciences, PA, USA). The samples were viewed under a scanning electron microscope (JEOL JSM-6500F, JEOL USA, Inc., MA, USA) at an accelerating voltage of 5 kV. The images were taken at a magnification of 400.
2.3.4 Seed cotton and lint yield
The plants were harvested after 135 days of sowing. The opened bolls were collected at the time of harvest. Bolls were separated into burr, lint, and seed, and then weighed to obtain the seed cotton weight (g), lint weight (g), and lint (%). Lint yield was determined after ginning the seed cotton using a roller gin. Lint from each treatment was pooled across twelve plants, and three sub-samples of 15-20 g from each treatment were subjected to fiber quality assessment using High Volume Instrumentation (HVI) by the Fiber and Biopolymer Research Institute at Texas Tech University, Lubbock, TX, as described by (Davidonis and Hinojosa, 1994). The analysis provides the fiber length (mm), fiber strength (g tex-1), micronaire (unitless), and uniformity (%).
2.4 Data analysis
The analysis of variance was performed using a two-way factorial completely randomized design in R Studio using doebioresearch (Popat and Banakara, 2020). The Post-hoc tests were conducted to identify treatment differences at a 0.05 significance level using an LSD test. Graphical representations of the outcomes were generated using SigmaPlot 13.0 (Systat Software Inc., San Jose, CA, USA) and GraphPad Prism 8.00 (GraphPad Software, San Diego, CA, USA).
3 Results
The cotton cultivar exhibited significant responses to temperature differences during flowering and boll development periods. All measured parameters were significantly different (p < 0.001 and p < 0.05) due to temperature variations, except for fiber uniformity and fiber strength (Table 1). However, the eCO2 during the cotton reproductive stage only altered the boll maturation period (p <0.001). The flower characteristics and fiber micronaire were influenced by the interaction of temperature and CO2 treatments (p < 0.01 to p < 0.05).
Table 1
| Parameters | Temperature | CO2 | Temperature × CO2 |
|---|---|---|---|
| Plant height (cm) | 1.16e-09 *** | 0.425 | 0.537 |
| Nodes (no. plant-1) | 2.14e-10 *** | 0.709 | 0.524 |
| Bolls produced (no. plant-1) | <2e-16 *** | 0.149 | 0.175 |
| Boll maturation period (days) | < 2.2e-16 *** | 0.0003 *** | 0.329 |
| Anthers (no. flower-1) | 2.97e-6 *** | 0.564 | 0.003 ** |
| Ovules (no. boll-1) | 3.22e-6 *** | 0.425 | 0.008 ** |
| Pollen grains (no. anther-1) | 6.25e-13 *** | 0.949 | 0.007 ** |
| Micronaire (unitless) | 0.024 * | 0.522 | 0.007 ** |
| Fiber length (mm) | 0.0001*** | 0.314 | 0.525 |
| Uniformity (%) | 0.067 | 0.343 | 0.111 |
| Fiber strength (g tex-1) | 0.403 | 0.935 | 0.314 |
Significance levels of impact of ambient (aCO2, 425 ppm) and elevated (eCO2, 725 ppm) CO2 levels under varying day/night air temperatures: optimum (OT: 33/21°C), high nighttime (OT+HNT: 33/24°C), high temperature (HT: 36/24°C), and high day and nighttime (HT+HNT: 36/28°C) in controlled Soil-Plant Atmospheric Research (SPAR) chambers on growth, reproductive, and fiber quality parameters of cotton.
Values indicate the p-value at the 0.05 level of significance. *, **, and *** represent statistical significance at p <0.05, 0.01, and 0.001, respectively. p-values above 0.05 are non-significant.
3.1 Effect of day/night temperature differences on plant height and node number
The plants grown under HT and HT+HNT had higher plant heights compared to those under OT and OT+HNT (Figure 1A). However, plant height did not show a positive response to eCO2 in any of the temperature treatments. On average, plant height increased by 6% under OT+HNT compared to OT across both CO2 conditions. However, the difference was statistically nonsignificant. At the same time, a significantly higher increase of 28 and 37% was observed under HT and HT+HNT conditions, respectively, compared to OT. A similar observation was made for the number of nodes under various temperature treatments studied. The number of nodes under eCO2 was comparable to that under aCO2 in all temperature conditions (Figure 1B). In contrast, plants grown under HT and HT+HNT conditions produced 31 and 33 nodes per plant, respectively, compared to 26 under OT, representing 20% and 27.5% more nodes, respectively. At the same time, the plants under OT+HNT treatment had 27 nodes, which were on par with OT.
Figure 1
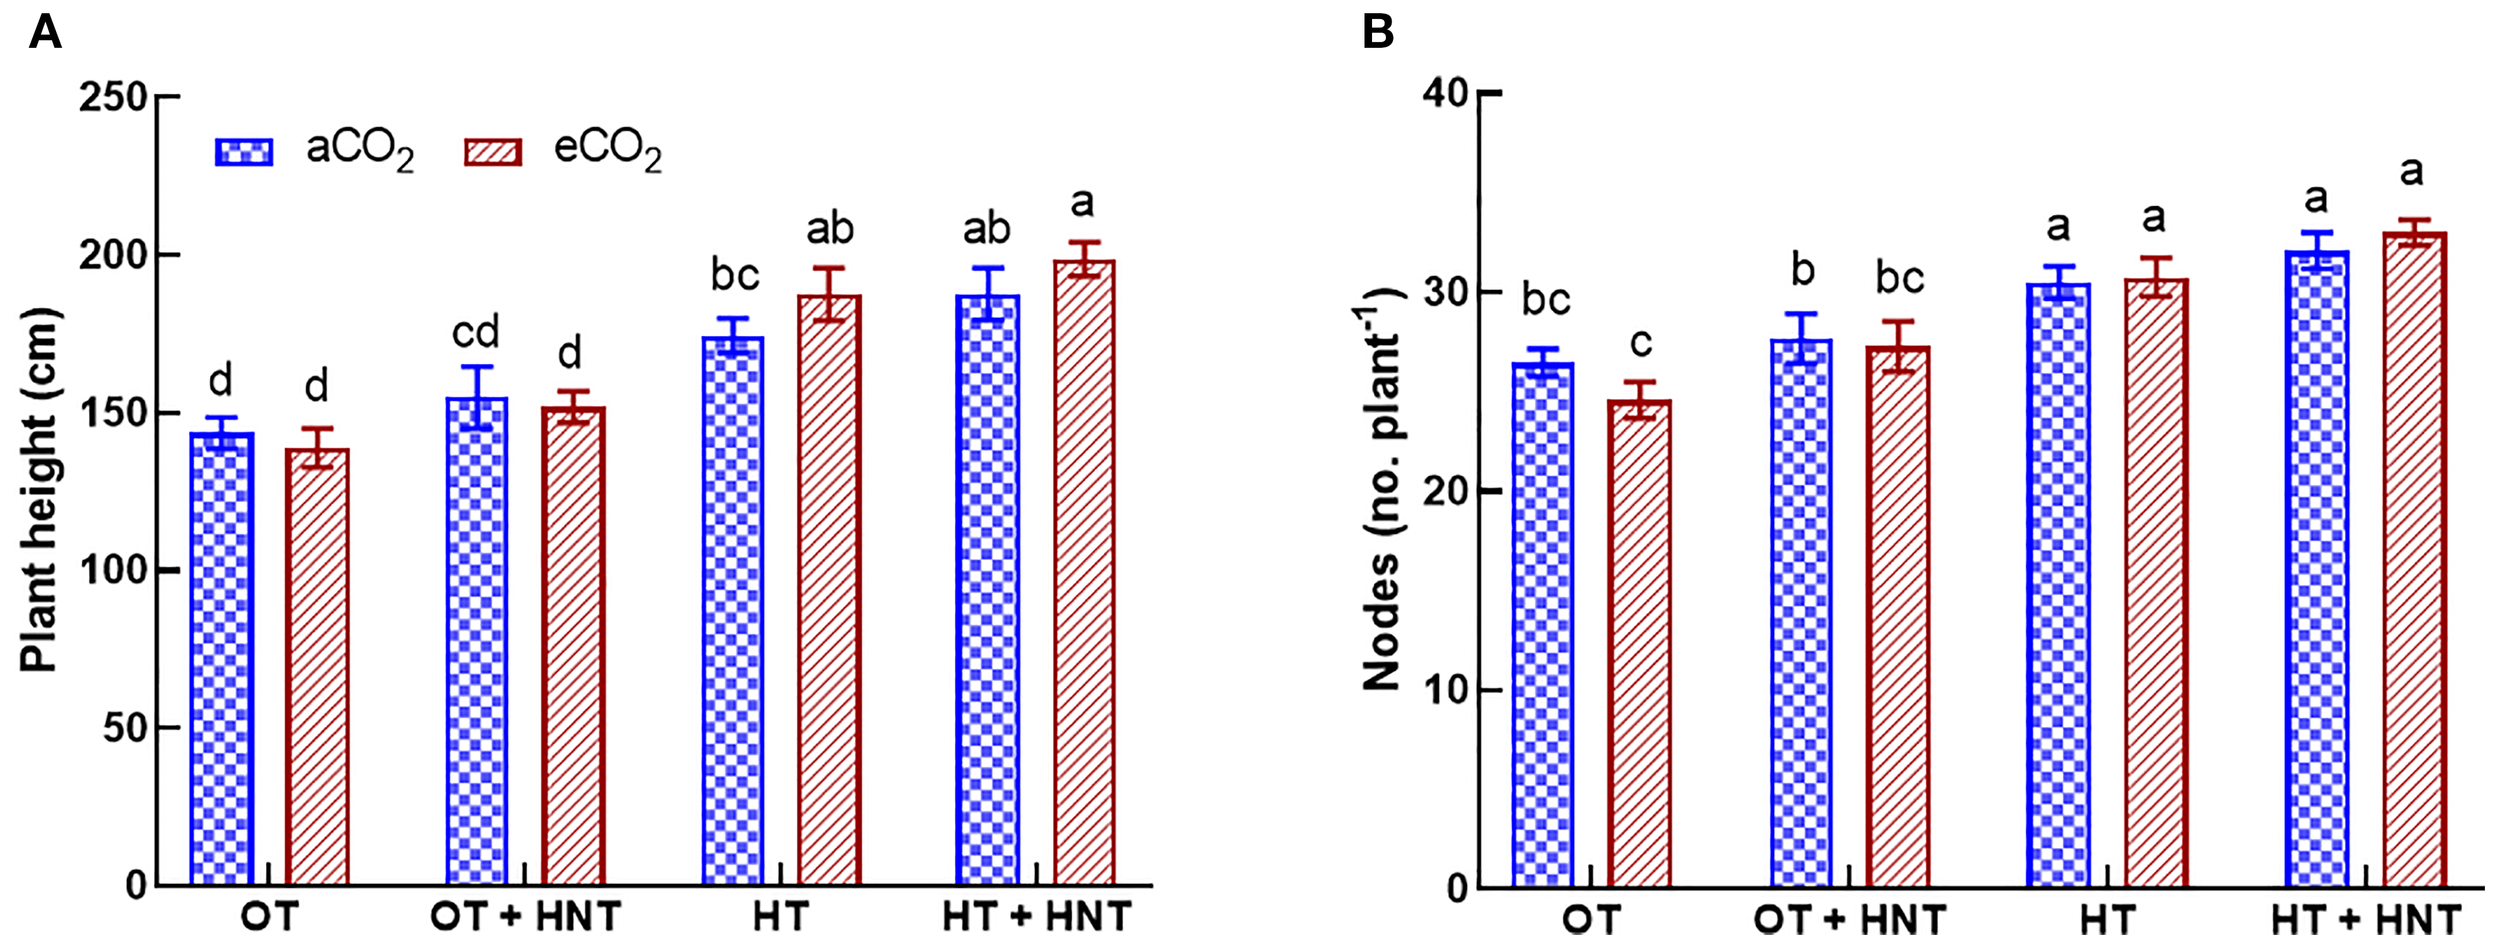
Day/Night air temperatures (OT: 33/21°C, OT+HNT: 33/24°C, HT: 36/24°C, HT+HNT: 36/28°C) and CO2 (aCO2: 425 ppm, eCO2: 725 ppm) effects on (A) plant height and (B) number of nodes (plant-1) during cotton boll development stage. The bars are the treatment mean ± SE of twelve replications. The letter above the bar indicates significance at p< 0.05. The treatments with the same letters are non-significant.
3.2 Effect of day/night temperature differences on boll production and retention
The cumulative number of cotton bolls produced and retained varied across CO2 concentrations and temperature treatments (Figure 2). The following results of boll production and retention are expressed on a per-plant basis. Plants grown under OT produced bolls at a constant rate from 7 days after treatment (DAT) to 36 DAT, incorporating an average of 0.6 bolls per day at aCO2 (Figure 2A), reaching a maximum of 25 bolls at 36 DAT. After 36 DAT, the plants ceased their boll production, incorporating only 3 additional bolls by the end of the experiment. The plants retained nearly all the bolls produced under OT and aCO2, showcasing a similar cumulative boll production curve. The boll production under OT and eCO2 conditions followed a similar pattern with a slight increase in boll production and retention (Figure 2B). The boll addition rate was static up to 38 days with an average production of 0.9 bolls per day. In the same way as OT, the plants exposed to OT+HNT produced bolls with minimal boll abscission under aCO2 and eCO2 conditions with a slightly higher number compared to OT (Figures 2C, D). In the initial days of OT+HNT treatment from 6 to 35 DAT, the plants produced an average of 0.7 and 0.8 bolls per day under aCO2 and eCO2 conditions, respectively. By the end of the experiment, the total number of bolls produced and retained were 28 and 23 under aCO2 and 36 and 30 under eCO2, respectively. However, when the plants are exposed to HT and HT+HNT conditions, the boll production increased towards the end of the experiment (Figures 2E-H). Plants grown under HT and eCO2 produced more bolls, reaching 57 bolls at 68 DAT compared to 43 bolls under aCO2. However, at the time of harvest, the number of retained bolls was 14 and 15 under aCO2 and eCO2, respectively. The plants exposed to HT+HNT conditions produced approximately 13 bolls by 35 DAT with 100% retention. While a sharp increase in boll production was observed after being exposed to HT+HNT conditions beyond 45 days, producing 2–4 flowers a day. However, the majority of the bolls abscised as the days progressed towards the end of the experiment, retaining only 10 bolls by 68 DAT, compared to 60 and 80 bolls produced under aCO2 and eCO2 conditions, respectively.
Figure 2
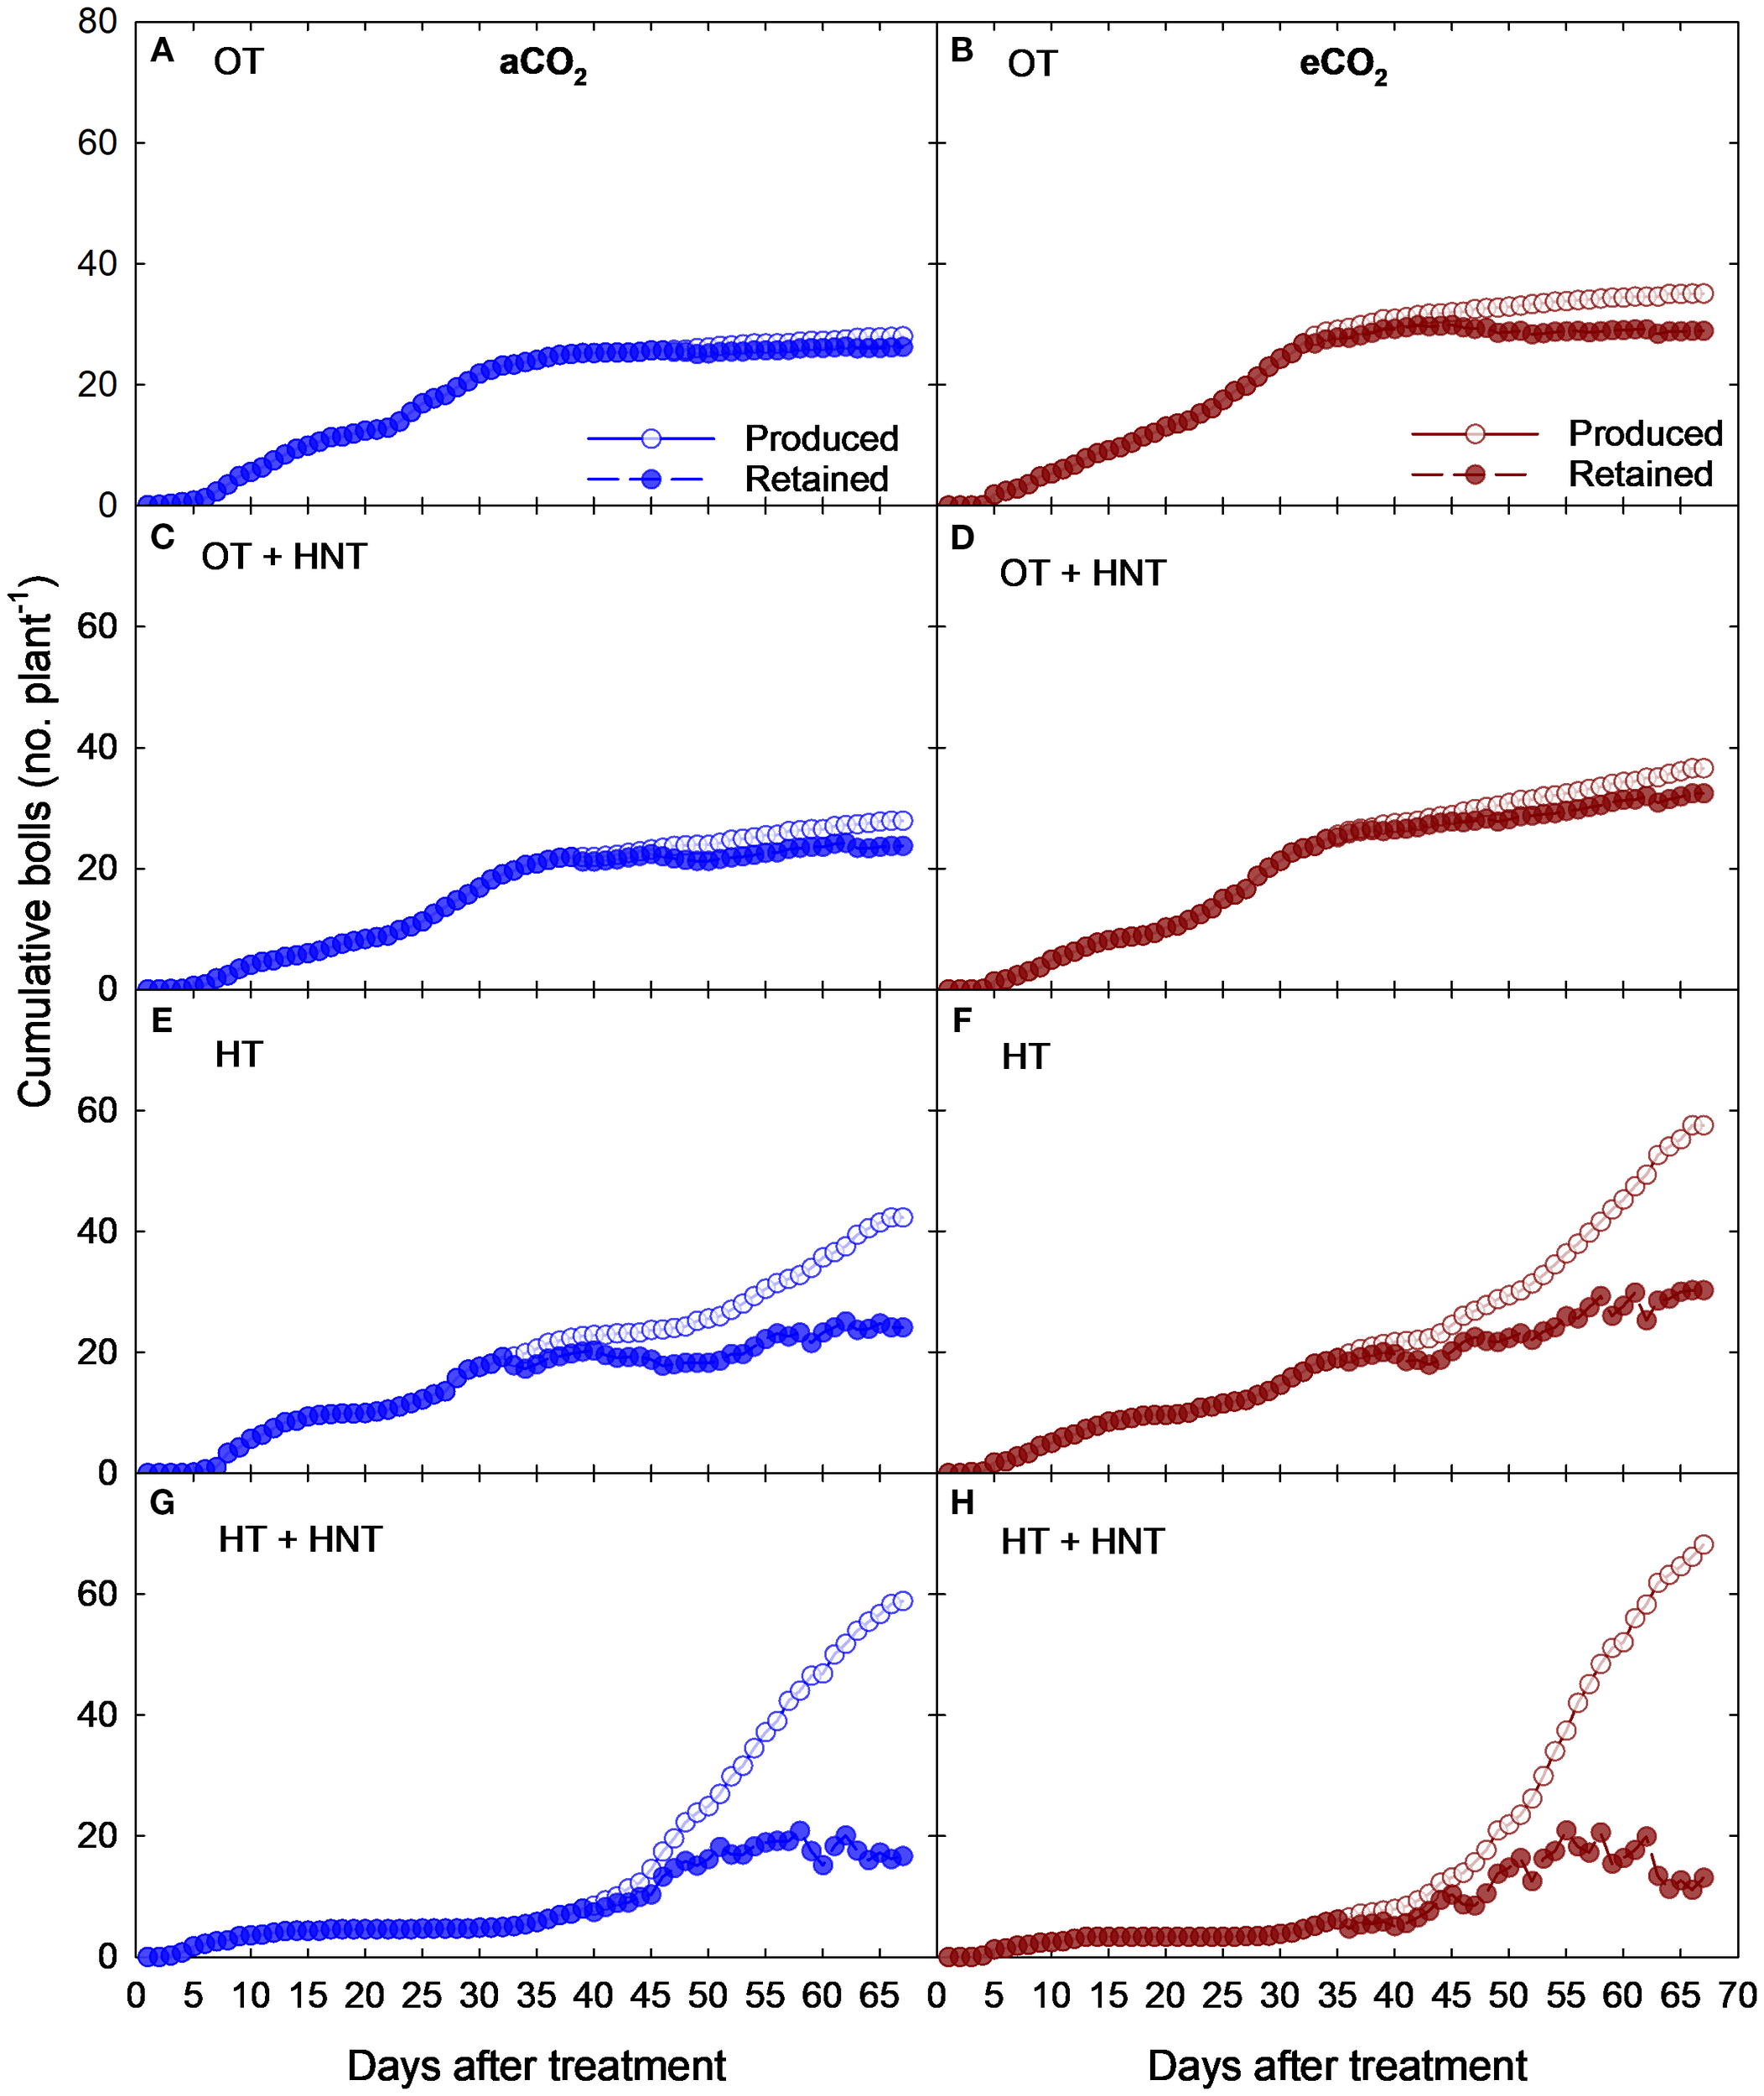
Cumulative number of boll production and retention (no. plant-1) at aCO2 (425 ppm) and eCO2 (725 ppm) concentrations under day/night temperatures of (A, B) OT (33/21°C), (C, D) OT + HNT (33/24°C), (E, F) HT (36/24°C), and (G, H) HT + HNT (36/28°C) in cotton. The X-axis indicates the days after treatment (0–68 days), which is equivalent to 60–128 days after sowing. The experiment consisted of 12 plants per square meter.
The flower tagging was terminated at 68 DAT. In contrast, the collection of abscised bolls continued until harvest. At the time of harvest, the bolls produced after 70 DAT were recorded and incorporated into the boll retention (%). The total number of open bolls significantly reduced under HT and HT+HNT conditions (Figure 3A). Under aCO2 conditions, the total number of open bolls reduced by 44% and 82% under HT and HT+HNT conditions compared to OT. Similarly, under eCO2, the reductions were 44% and 88% under HT and HT+HNT conditions, respectively, compared to OT. After the harvest, the boll retention (%) was estimated using the total number of bolls produced and retained at the time of harvest. The plants grown under OT retained 93% of the produced bolls under aCO2, while under eCO2, the retention rate decreased to 86% (Figure 3B). However, under OT+HNT conditions, the boll retention was 86% and 88% under aCO2 and eCO2 conditions. On the other hand, over half of the produced bolls were abscised under HT conditions under both aCO2 (45%) and eCO2 (32%) conditions. While the plants grown under HT+HNT retained only 21 and 25% bolls under aCO2 and eCO2 conditions. A reduction in boll retention (%) was observed with an increase in average temperature.
Figure 3
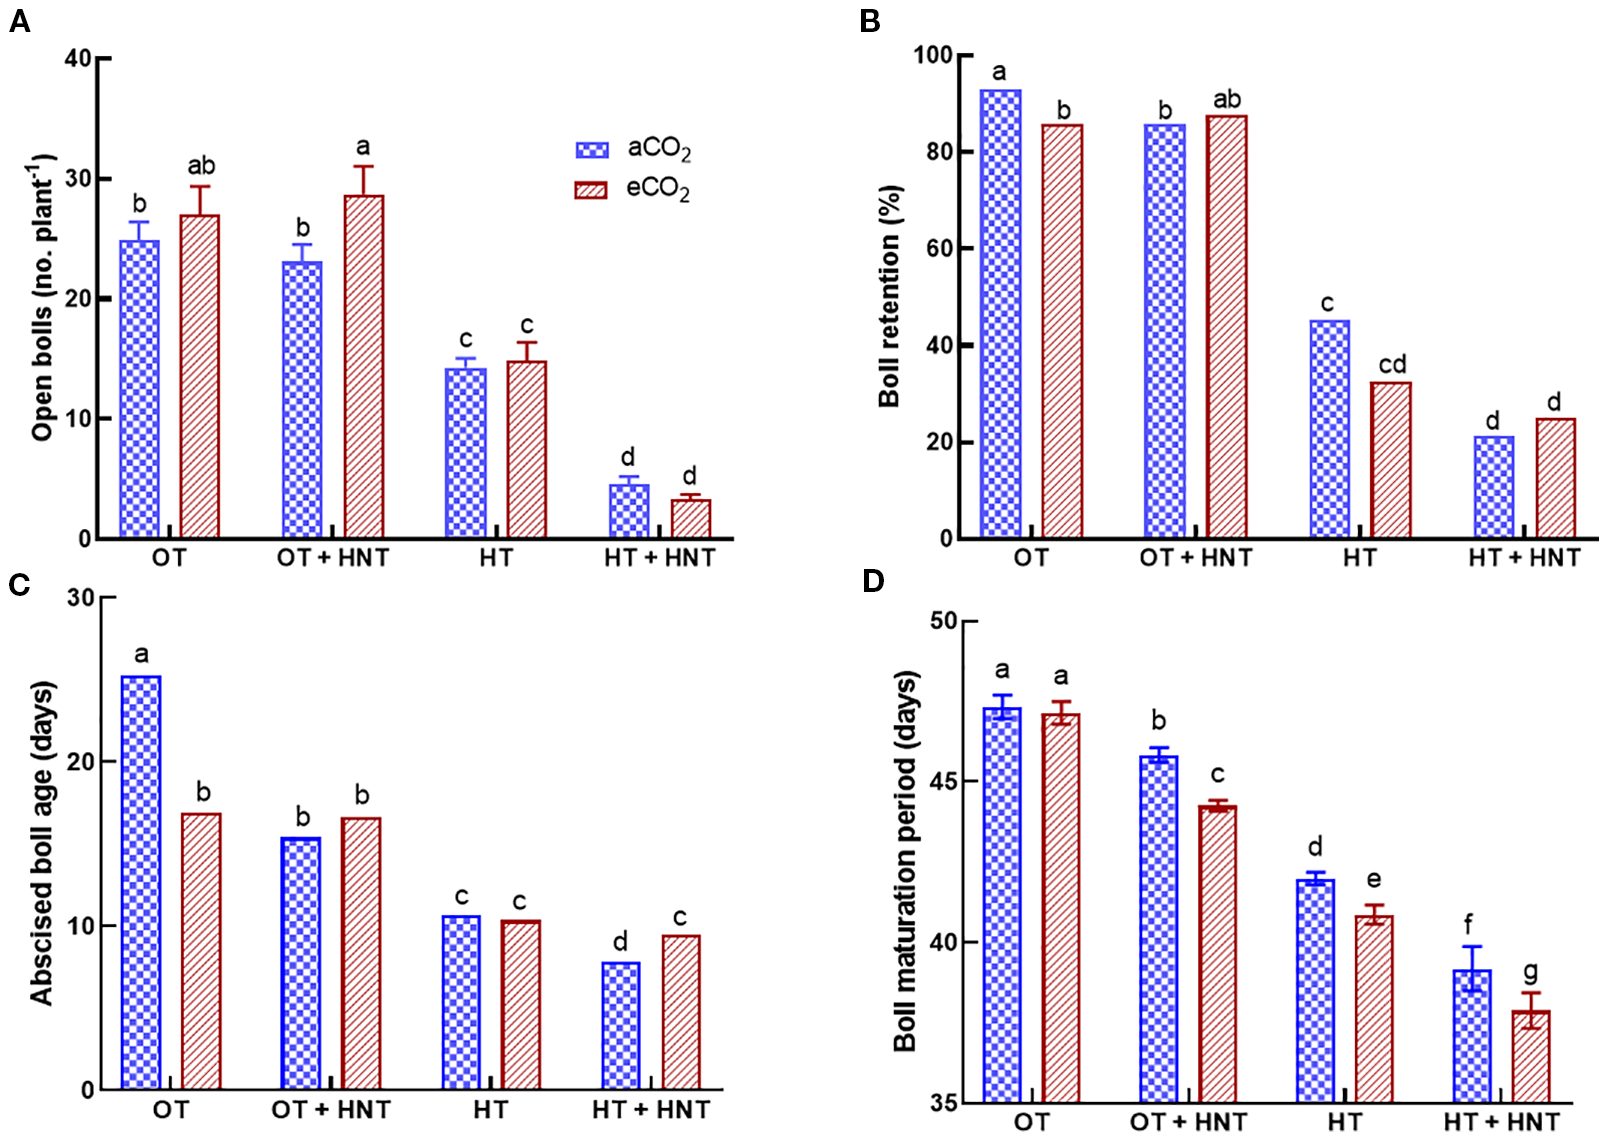
Day/Night air temperatures (OT: 33/21°C, OT+HNT: 33/24°C, HT: 36/24°C, HT+HNT: 36/28°C) and CO2 (aCO2: 425 ppm, eCO2: 725 ppm) effect on (A) number of open bolls, (B) boll retention (%), (C) abscised boll age (days), and (D) boll maturation period (days) on cotton. The bars are the treatment mean ± SE of 12 replications. The letter above the bar indicates statistical significance at p< 0.05. The treatments with the same letters are non-significant.
The days between boll production and the abscised boll collection date were used to estimate the age of the abscised bolls. The average age of abscised bolls produced under OT was 25 days under aCO2, whereas it decreased to 17 days under eCO2 (Figure 3C). Under OT+HNT conditions, the decrease was 39% and 34% under aCO2 and eCO2, respectively, compared to OT and aCO2. With the increase in temperature, the plants abscised their bolls quickly. Under HT, the bolls abscised within 10 days of production under both CO2 conditions, resulting in a 58% reduction compared to OT. While under HT+HNT conditions, the abscission occurred at 8 and 9.5 days under aCO2 and eCO2, respectively.
The BMP (days) decreased with an increase in average temperature (Figure 3D). The average BMP of bolls produced under OT was 47 days, regardless of the CO2 conditions. When the plants were exposed to OT+HNT, the days decreased to 46 (aCO2) and 44 (eCO2) days. Those exposed to OT+HNT also showed a significant decline in BMP under eCO2 compared to aCO2. Under HT and HT+HNT conditions, the BMP was further reduced to 42 and 39 under aCO2, respectively, while it was 41 and 38 under eCO2, respectively. This accounted for a decline of 12% and 18% in the number of days to BMP under HT and HT+HNT conditions, respectively, compared to OT. The outcome shows that eCO2 significantly reduces the BMP under higher temperature conditions beyond the optimal temperature (OT).
3.3 Effect of day/night temperature differences on ovule and pollen production
The number of ovules decreased under OT+HNT, HT, and HT+HNT conditions compared to OT under both CO2 environments (Figure 4A). The number of ovules in flowers produced under OT+HNT was reduced by 26% compared to OT at aCO2. In comparison, the reduction was 16% under eCO2 and OT+HNT conditions. Similarly, under HT, the number of ovules decreased by 30 and 20% under aCO2 and eCO2 conditions, respectively, compared to OT. On the other hand, in HT+HNT conditions, eCO2 did not result in any significant gain in ovule number, resulting in an average decline of 21% compared to OT. Under aCO2, flowers produced under HT had the highest reduction in number of anthers by 23%, followed by OT+HNT and HT+HNT conditions, each with 11% reduction compared to OT (Figure 4B). While under eCO2, OT+HNT had a comparable number of anthers with OT, while under HT and HT+HNT conditions, the number reduced by 14 and 24, respectively, compared to OT. An 8% increase in pollen number per anther was observed under eCO2 conditions at OT compared to aCO2 (Figure 4C). However, at different high night and day temperature conditions, the eCO2 did not influence the pollen number. The flowers produced under OT+HNT, HT, and HT+HNT conditions had 13%, 24%, and 39% reductions in pollen number, respectively, compared to OT.
Figure 4
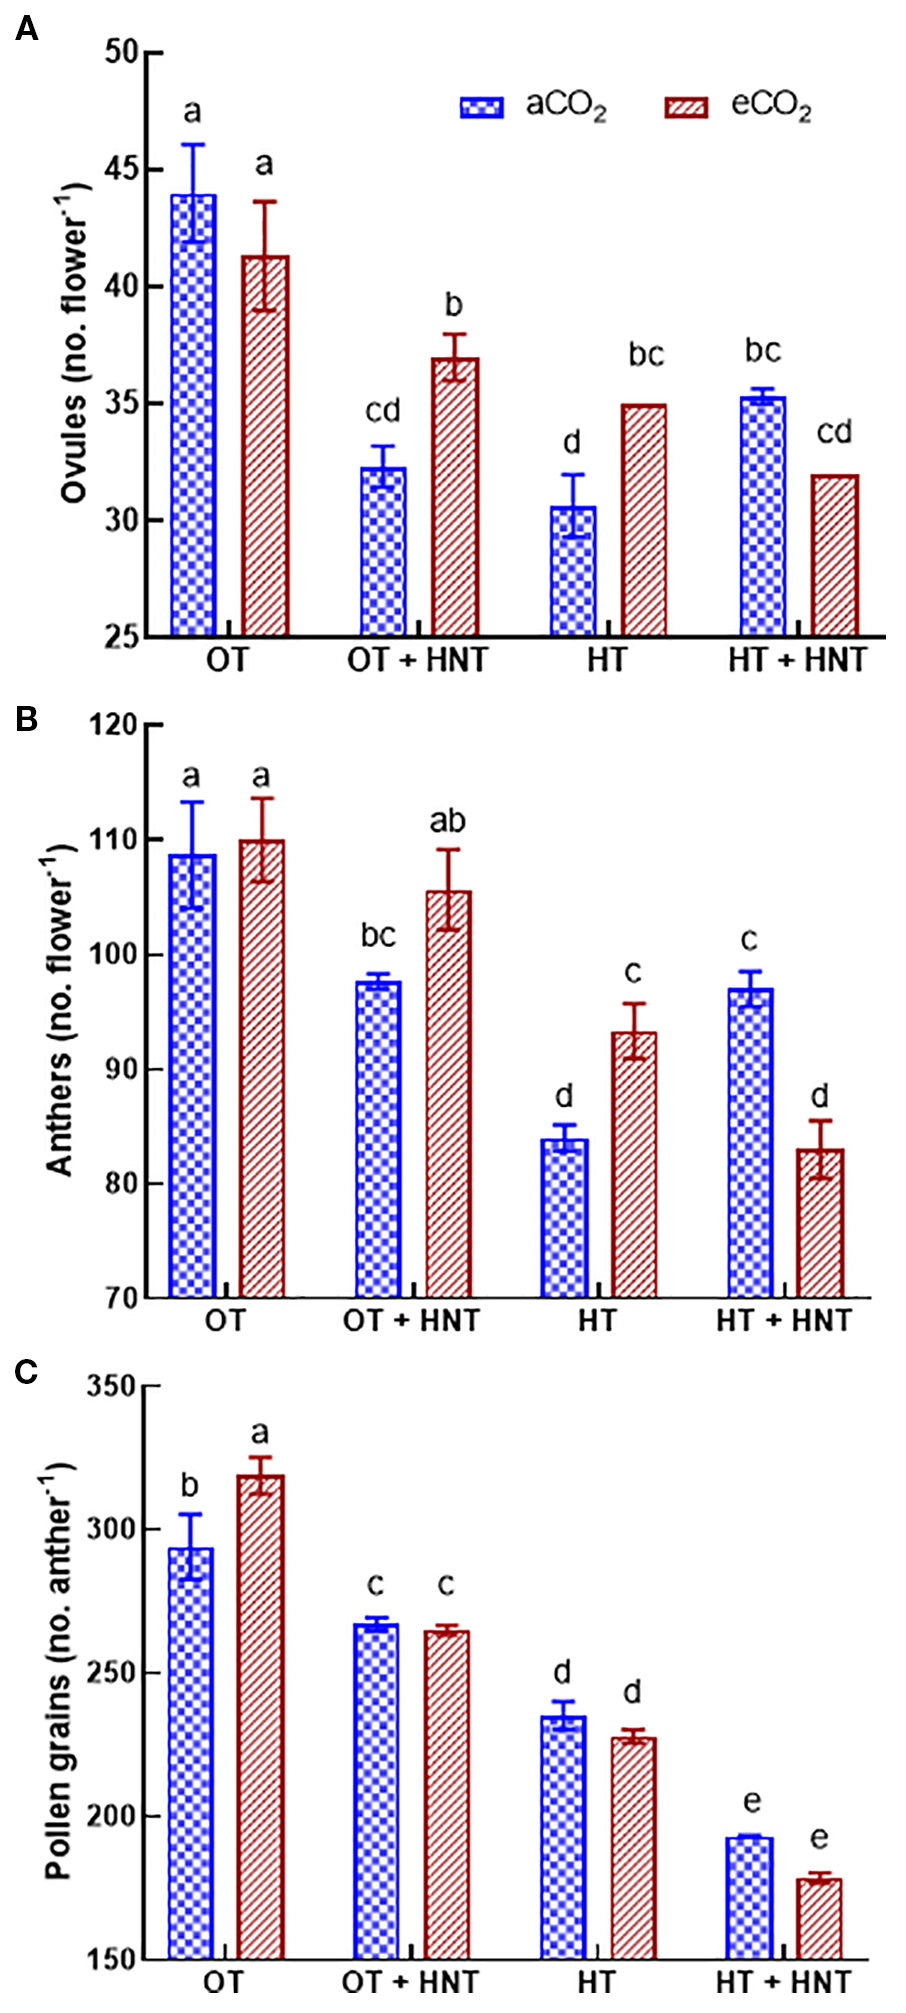
Day/Night air temperatures (OT: 33/21°C, OT+HNT: 33/24°C, HT: 36/24°C, HT+HNT: 36/28°C) and CO2 (aCO2: 425 ppm, eCO2: 725 ppm) effect on (A) ovules (no. boll-1), (B) anthers (no. flower-1), and (C) pollen grains (no. anther-1) of cotton. The bars are mean ± SE of 3 replications. The letter above the bar indicates significance at p< 0.05. The treatments with the same letters are non-significant.
Scanning electron microscopic images of pollen grains produced in plants grown under OT+HNT, HT, and HT+HNT showed morphological differences compared to pollen produced under OT (Figure 5). Pollen grains appeared round and uniform with spiny exine under OT. When plants were exposed to OT+HNT, pollen grains remained largely intact, with slight abnormalities in shape, indicating minor stress-induced changes. The abnormalities were more evident when the growing temperature increased to HT and HT+HNT conditions. The pollen grains produced under HT exhibit signs of shrinkage, deformation, and irregular shapes. The pollen grains under HT+HNT exhibited the most severe impact on morphology. Many of the pollen grains appeared shriveled, collapsed, or fragmented, indicating compromised viability. The eCO2 conditions during pollen development did not alleviate the high-temperature stress damage; in fact, under HT+HNT, the degradation was higher under eCO2 conditions. The anther indehiscence observed under HT and HT+HNT temperature conditions was primarily due to the reduced pollen volume and number.
Figure 5
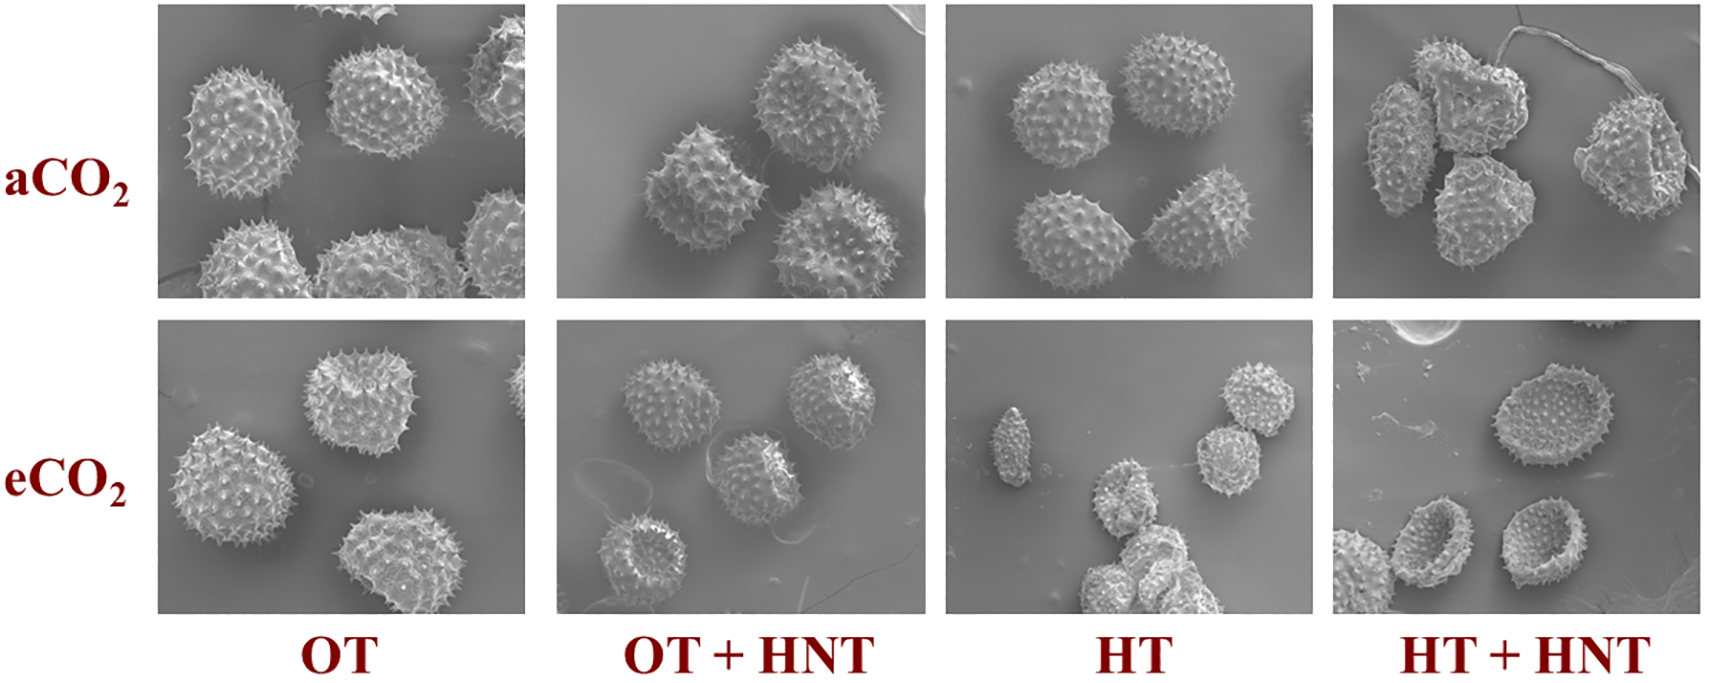
Day/Night air temperatures (OT: 33/21°C, OT+HNT: 33/24°C, HT: 36/24°C, HT+HNT: 36/28°C) and CO2 (aCO2: 425 ppm, eCO2: 725 ppm) effects on cotton pollen morphology. The figure is magnified at 10 µm.
3.4 Effect of day/night temperature differences on seed cotton and lint yield
The seed and lint yield of cotton was significantly influenced by the day and night temperature alterations in the growing environment (p < 0.001) (Figure 6; Table 2). While the eCO2 did not influence the yield parameters under either temperature condition. On the other hand, the interactions between temperature and CO2 influenced all the yield parameters (p < 0.05 to 0.001), except for lint percentage.
Figure 6
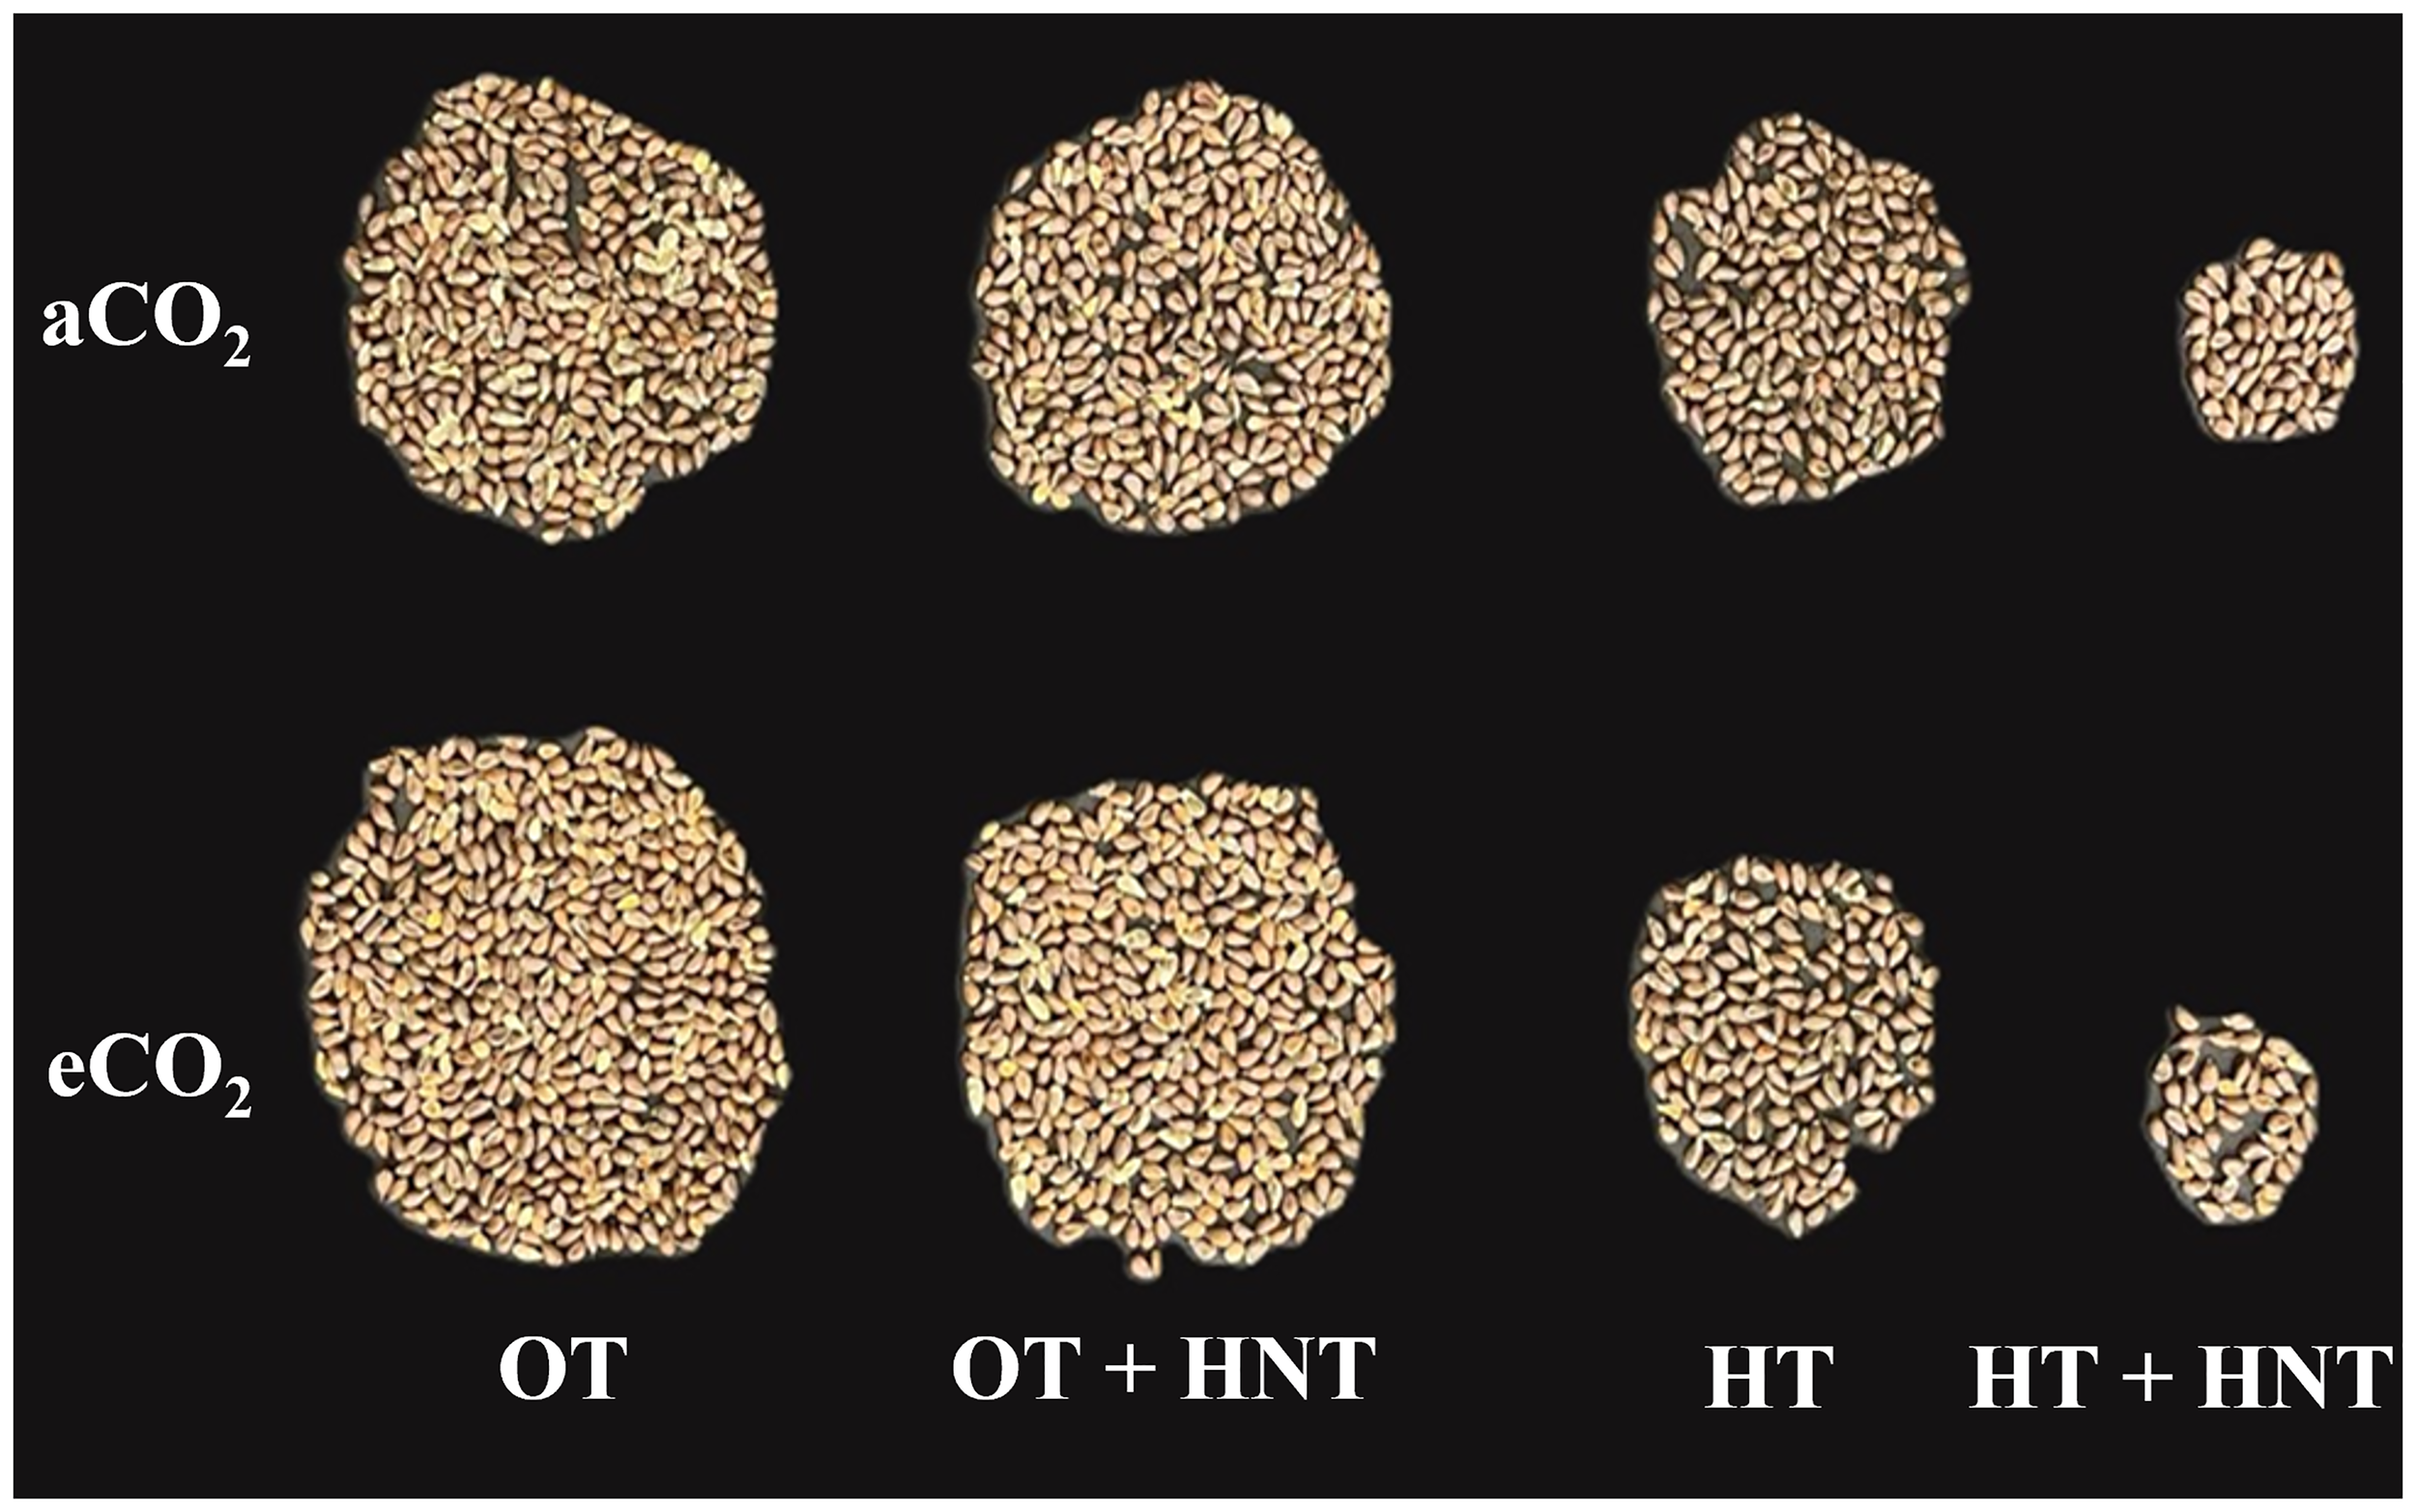
Seed yield under different Day/Night air temperatures (OT: 33/21°C, OT+HNT: 33/24°C, HT: 36/24°C, HT+HNT: 36/28°C) and CO2 (aCO2: 425 ppm, eCO2: 725 ppm) treatments in cotton. Image represents 50% yield of a plant.
Table 2
| Temperature | CO2 | Seed cotton weight (g) | Lint weight(g) | Seed weight (g) | Lint (%) | 100 seed weight (g) |
|---|---|---|---|---|---|---|
| OT (33/21 °C) | aCO2 | 94.77bc | 38.48b | 51.48b | 42.39a | 8.01c |
| eCO2 | 114.88a | 48.24a | 66.42a | 44.26a | 8.08c | |
| OT + HNT (33/24 °C) | aCO2 | 79.44c | 31.65c | 43.85c | 41.06a | 7.39de |
| eCO2 | 99.69ab | 35.34bc | 51.03b | 39.31a | 7.55d | |
| HT (36/24 °C) | aCO2 | 50.67d | 19.38d | 31.31d | 39.48a | 8.26b |
| eCO2 | 43.92d | 13.13e | 27.62d | 31.72c | 8.54a | |
| HT + HNT (36/28 °C) | aCO2 | 14.35e | 4.72f | 9.59e | 31.51c | 7.51d |
| eCO2 | 9.55e | 2.91f | 6.75e | 32.30c | 7.28e | |
| p-value | Temperature | < 2e-16 *** | < 2.2e-16 *** | < 2.2e-16 *** | 7.8e-05 *** | 5.07e-15 *** |
| CO2 | 0.13 | 0.37 | 0.07 | 0.32 | 0.11 | |
| Temperature × CO2 | 0.04 * | 0.0002*** | 0.003 ** | 0.20 | 0.002 ** |
Different diurnal air temperatures (optimum (OT): 33/21°C, high temperature (HT): 36/24°C, high nighttime (OT+HNT): 33/24°C, and high day and nighttime (HT+HNT): 36/28°C) and CO2 (aCO2: 425 ppm; eCO2: 725 ppm) effects on cotton seed and lint yields in controlled Soil-Plant Atmospheric Research (SPAR) chambers.
*, **, and *** represent statistical significance at p <0.05, 0.01, and 0.001, respectively. The letter near the values indicates significance at p< 0.05. The treatments with the same letters are non-significant.
Seed cotton weight was reduced by 16% and 13% under OT+HNT conditions in aCO2 and eCO2 environments, respectively, compared to OT under the corresponding CO2 conditions. However, these differences were comparable to those of OT. Under both OT and OT+HNT conditions, seed cotton weight increased by 21% and 25%, respectively, due to eCO2 levels compared to aCO2. When the plants were exposed to HT conditions, the seed cotton weight declined sharply by 47%, reaching 50.7 g compared to 95 g under OT at aCO2. While under eCO2, the reduction was 62% compared to OT. The most severe reduction in seed cotton weight was observed under HT+HNT, at 85% and 92% under aCO2 and eCO2 conditions, respectively, compared to the corresponding CO2 environments under OT. Under high temperatures, the effect of eCO2 was non-significant.
The lint and seed weights were higher in plants grown under OT at eCO2 conditions by 25% and 29%, respectively, compared to those grown under aCO2. However, the CO2 did not influence temperature effects, except for OT+HNT, which affected seed weight, and HT, which affected lint weight. A reduction of 18, 50, and 88% lint weight was observed in plants grown under OT+HNT, HT, and HT+HNT, respectively, compared to OT under aCO2. Although the lint weight did not differ significantly between CO2 conditions under OT+HNT, the seed weight showed a 16% increase under eCO2 compared to aCO2. The average seed weight under HT and HT+HNT was 29.5 and 8.17 g, respectively, representing approximately 43% and 84% reductions compared to OT under aCO2. The lint percentage remained relatively stable under OT and OT+HNT, with values ranging from 39% to 44%, showing no significant decline under eCO2. However, a notable reduction was observed under HT and HT+HNT, with lint percentages dropping to 31.72% and 32.30%, respectively, under eCO2. The 100-seed weight was significantly reduced under both high night temperature treatments, including OT+HNT and HT+HNT. Under OT+HNT, the 100-seed weight declined to 7.47 g compared to 8.05 g observed under OT conditions. A similar reduction was noted under HT+HNT, with a recorded weight of 7.39 g. However, the 100 seed weight increased under HT conditions (8.26 g), which was further enhanced under the eCO2 conditions, reaching 8.54 g.
3.5 Effect of day/night temperature differences on fiber quality
The cotton fiber produced under different temperature conditions only influenced the fiber micronaire and fiber length (Figures 7A, B). The fiber strength and uniformity were not affected by the change in growing temperature or CO2 conditions (Figures 7C, D). The lowest micronaire number was observed under HT and eCO2 environments, with a reduction of 25% compared to OT and aCO2 (Figure 7A). Similarly, the fiber produced under HT had the lowest fiber length, with a decline of 7% compared to OT and aCO2 (Figure 7B).
Figure 7
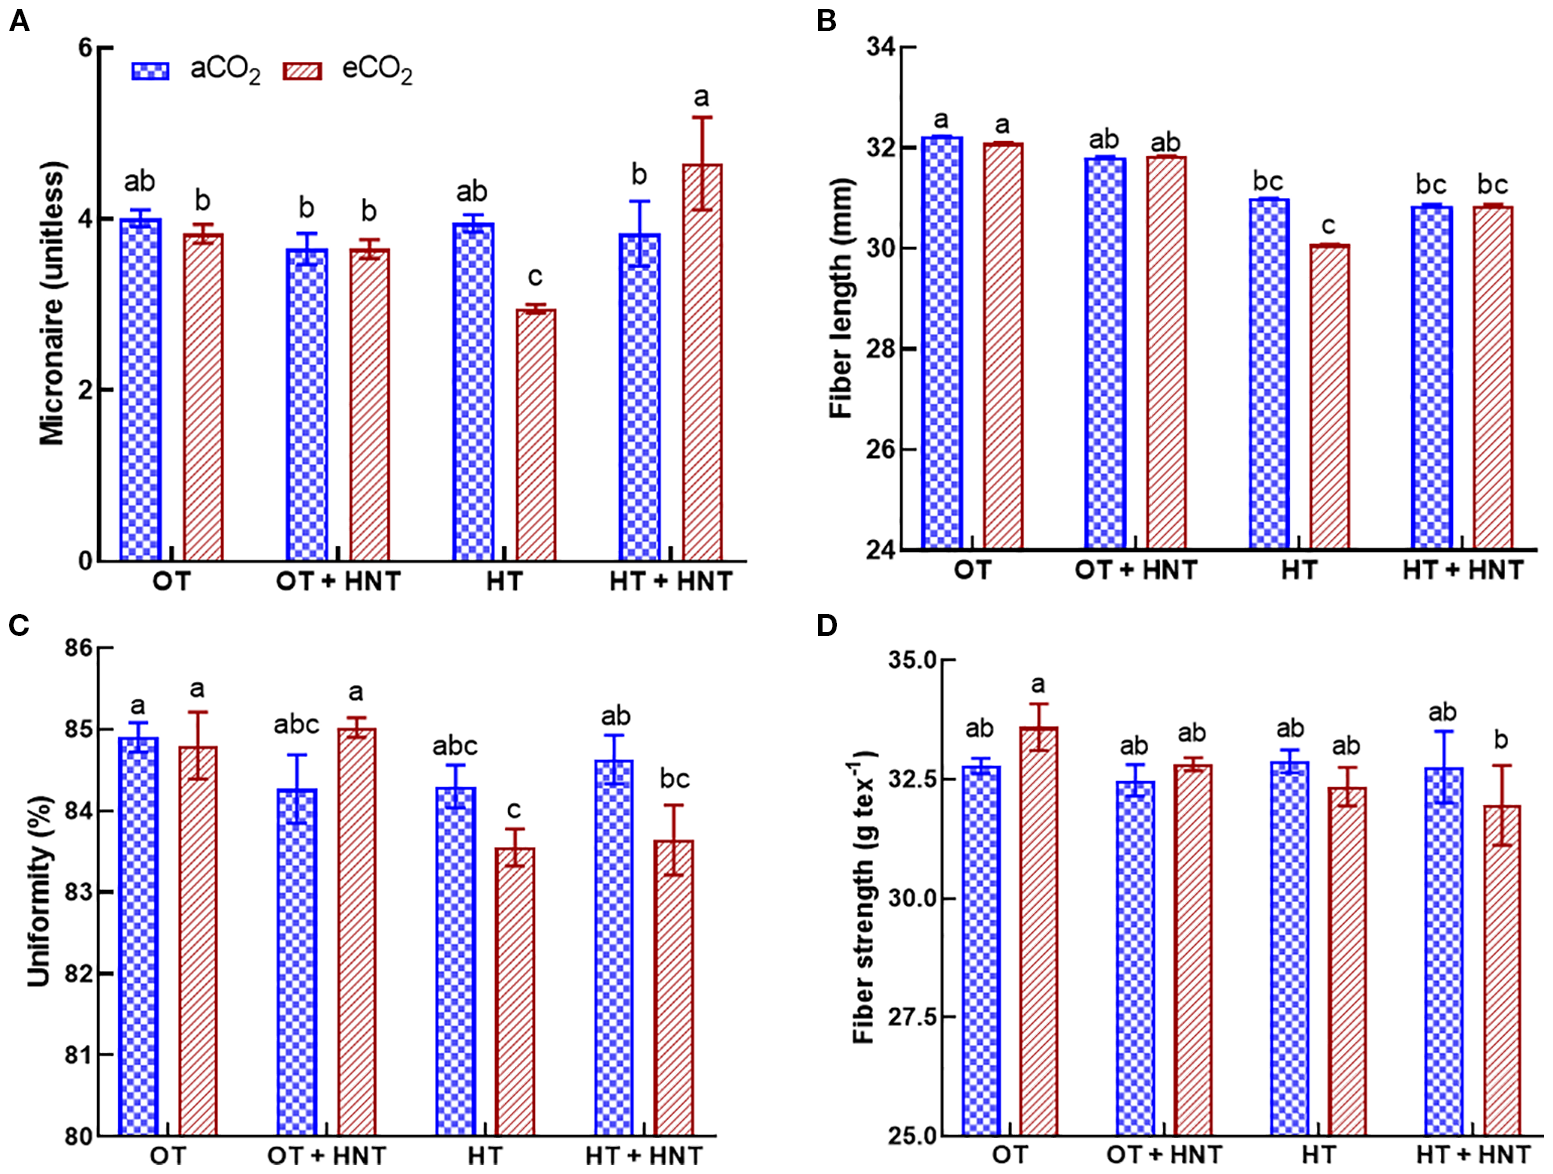
Day/Night air temperatures (OT: 33/21°C, OT+HNT: 33/24°C, HT: 36/24°C, HT+HNT: 36/28°C) and CO2 (aCO2: 425 ppm, eCO2: 725 ppm) effect on (A) micronaire, (B) fiber length, (C) uniformity, and (D) fiber strength of cotton lint. Bars represent the treatment mean ± SE of 3 replications. The letters above the bars indicate a statistically significant difference at p < 0.05. The treatments with the same letters are non-significant.
4 Discussion
The study highlights the decline in reproductive performance and yield potential of cotton plants grown under increased daytime and/or nighttime temperatures in both ambient and elevated CO2 environments. The study specifically focuses on the boll production and retention efficiency of cotton when exposed to temperature fluctuations during the reproductive stage. It reports the temporal changes in boll production during the crop season. We observed a drastic increase in boll production under HT and HT+HNT conditions towards the end of the season, with approximately 50 bolls produced under HT and 70 bolls under HT+HNT conditions, averaged across the CO2 environments. However, the produced bolls were affected by temperature, resulting in boll abscission. Significant changes in plant growth, flower characteristics, and seed yield were recorded in the study.
The plant height of cotton is a geometric trait that contributes to the biomass and harvest index (Jiang et al., 2016). The height of plants grown under HT and HT+HNT conditions increased by 28 and 37%, respectively, compared to OT, reaching almost 2 meters tall at HT+HNT and eCO2 conditions. In our study, we observed an increase in flower abscission towards the end of the experiment, resulting in greater availability of carbon sources in the plant under high temperatures. Temperatures damaging to fruit production may alter the balance between vegetative and reproductive growth, leading to increased growth of both the main stem and branches (Hatfield and Prueger, 2015; Allen et al., 2018). Cotton, being plastic in nature with an indeterminate growth habit, it translocated the photosynthates to the growing meristematic cells, adding more nodes and internodes, leading to increased plant height (Emara and El-Sayed, 2021; Naveed et al., 2023). This is manifested by an increased number of nodes observed under HT and HT+HNT conditions in both CO2 environments, resulting in 33 nodes under HT+HNT compared to 26 nodes under OT. It is also important to note that the plants under eCO2 had slightly higher plant height and a non-significant increase in the number of nodes, which is attributed to the increased rate of photosynthesis under CO2 fertilization (Zhang et al., 2017; Wang et al., 2020; Gong et al., 2025). These changes in plant height and nodes contributed to an increased number of leaves and a higher leaf area index (Li et al., 2015), which in turn contributed to a higher rate of light interception and a subsequent increase in carbon fixation. In turn, this contributes to the availability of a carbon source for further addition of nodes and internodes. The plant height and number of nodes grown under OT+HNT conditions were similar to those in plants under OT.
As the plant grows and adds more nodes, it contributes to the production of fruiting sites. This is evident from the increased production of bolls towards the end of the growing season under HT and HT+HNT conditions with less boll retention (Figure 2). The final yield of seed and lint depends on the number of bolls produced and their retention. The plants allocated more carbon sources towards the first-formed bolls up to 35 days after treatment, retaining all the developed bolls. Upon increased exposure to HT and HT+HNT conditions, the plants were unable to support the bolls, resulting in abscission. The increased availability of carbon source contributed to the increased production of bolls under eCO2 conditions in all the temperature environments (Reddy et al., 1995b; Jans et al., 2021; Gong et al., 2025). Under high temperatures, the number of fruiting sites on vegetative branches also increased, as observed in other studies (Reddy et al., 1995a; Abro et al., 2025). On average, the boll retention percent under normal conditions exceeds 80%, which is essential for achieving a good lint yield. However, under HT and HT+HNT conditions, most of the bolls failed to reach maturity and dropped within 7 to 10 days. As a result, boll retention was significantly reduced to only 28% under HT and 19% under HT+HNT conditions. The BMP is the time interval between flowering and boll opening. The study also observed a reduction in the BMP with an increase in temperature, whether during daytime or nighttime. The eCO2 further reduced the BMP compared to aCO2 at all temperature conditions above OT. Under increased temperatures (HT and HT+HNT) above the optimum, the plants attempt to shorten the life cycle of a boll to 40 days, compared to 47 days under optimal temperatures (OT). Even the BMP under OT+HNT was reduced by 2–3 days compared to OT.
The reduced seed and lint yield observed in the study can be attributed to multiple reasons. The number of male and female reproductive organs is a yield-determining factor as the number of seeds per boll depends on the number of ovules per locule, and successful fertilization depends on the pollen load and its quality (Song et al., 2015). The study observed a significant reduction in both crucial traits, including the number of anthers per flower (Figure 4). Reproductive development is susceptible to high temperatures, both before and after anthesis (Lokhande and Reddy, 2014; Song et al., 2015; Bista et al., 2025). The number of ovules flower-1 was reduced by 26% and 30% under OT+HNT and HT conditions, respectively, under aCO2, compared to OT. Increased carbon availability under eCO2 minimized the adverse effect of increased temperatures under OT+HNT and HT conditions, resulting in only 16 and 20% lower numbers of ovules, respectively. However, CO2 fertilization did not help mitigate the adverse effect of increased day and night temperatures on cotton. As discussed earlier, cotton plants under high temperatures divert photosynthate to vegetative biomass rather than to reproductive structures, thereby limiting available resources for producing ovules (Lokhande and Reddy, 2014; Snider and Adegbenro, 2025). A similar observation was made for several pollen grains anther-1, resulting in a reduction of 24% and 39% under HT and HT+HNT conditions, respectively, compared to OT. At OT, however, it did not enhance pollen production under increased temperatures above OT. The reduced availability of non-structural carbohydrates in the floral buds under high temperatures may have caused a reduction in male and female gametophyte development in cotton plants (Borghi et al., 2019).
The quality and integrity of pollen are crucial for successful fertilization of the ovule and thus the boll and seed set. Pollen development consists of two sequential stages: microsporogenesis and microgametogenesis, which are highly sensitive to temperature fluctuations (Masoomi-Aladizgeh et al., 2021; Lohani et al., 2025). The study observed significant structural alteration of pollen grains with increasing temperature, regardless of CO2 availability. The shrinkage and deformation observed at temperatures above OT indicate a reduced availability of potential pollen grains for fertilization, resulting in insufficient pollen germination and pollen tube growth (Song et al., 2014; Qian et al., 2025). It is independent of carbon availability and is mainly influenced by temperature conditions. The release of pollen grains from the anther, termed anther dehiscence, is critical for successful fertilization as it ensures the transfer of viable pollen to the stigma, facilitating pollination and subsequent fruit development (Deng et al., 2021). Both growing conditions and genetic regulations influence this process (Wilson et al., 2011; Zheng et al., 2019; Miglani et al., 2025). We observed anther indehiscence under HT and HT+HNT conditions at both aCO2 and eCO2, highlighting the impacts of temperatures on cotton flowering and fertilization. This indehiscence could be due to a reduced number of pollen grains per anther and distorted pollen structure, leading to insufficient pressure for anther opening. Alternatively, it may result from temperature-induced disruption in gene expression required for anther dehiscence (Sakata and Higashitani, 2008; Lohani et al., 2025). The anther indehiscence was not observed under OT+HNT conditions, suggesting that a slight increase in night-time temperature (33/24 °C) compared to 33/21 °C does not affect the genes responsible for anther dehiscence. Additionally, our findings indicate that a minimum of 265 pollen grains of anther-1 is sufficient for successful anther dehiscence. A positive correlation between anther sterility and high temperatures was reported 15 and 16 days prior to anthesis, indicating that microgametophyte development was susceptible to high temperatures immediately after meiosis of the microspore mother cells (Song et al., 2014). This may have resulted in the retention of early-formed flowers under high-temperature conditions.
The seed and lint yield in cotton is a function of boll production and retention. The study showed that the reduction in boll retention, either due to unsuccessful fertilization and/or limited translocate allocation, contributed to the decline in seed and lint yield in cotton. This is also exacerbated by the shortened BMP, which reduces the time required to incorporate sufficient biomass into the developing bolls (Lokhande and Reddy, 2014). The highest seed cotton, lint, and seed weights were observed under OT conditions at eCO2 (Table 2). This is attributed to enhanced boll production, number of retained bolls, and the number of pollen grains in anther-1 under CO2 fertilization, due to increased availability of photosynthates. The increasing temperatures beyond 33/24 °C resulted in a drastic reduction, causing a decline of almost 90%, 88%, and 84% in seed cotton, lint, and seed weights compared to OT across the CO2 treatments. The reproductive failure of flowers developed under high-temperature conditions, accompanied by limited biomass partitioning towards the bolls, has led to the observed results. It is also important to note that the lint yield of plants under OT+HNT was reduced by 18% compared to OT, indicating the sensitivity of lint development to HNT conditions. The increased respiration under HNT conditions and limited cellulose supply to the bolls resulted in reduced lint weight under these conditions (Xu et al., 2021; Yang et al., 2023). This also contributed to the reduced weight of seeds under OT+HNT and HT+HNT conditions.
Fiber is the main economic product of the cotton crop, and the market value depends on its quality. The slight reduction in fiber length under HT and HT+HNT conditions is possibly affected by the limited biomass allocation to the boll development (Lokhande and Reddy, 2014; Xu et al., 2017; Abro et al., 2025). At optimum temperatures, the cotton fiber elongates over 2000-3000-fold within approximately 20 days after anthesis (Ruan et al., 2005). High temperatures during this period adversely affect the fiber elongation, in turn, shortening the fiber length (Lokhande and Reddy, 2014; Ali et al., 2025). The micronaire is an indirect measure of fiber fitness and maturity. Premium-quality fiber requires a micronaire value between 3.8 and 4.9 (Bange et al., 2009). In the eCO2 environment, fibers produced under HT and HT+HNT conditions had micronaire values of 2.95 and 4.65, respectively. The micronaire value below 3.8 indicates fiber immaturity, while values above 4.9 suggest coarser fibers with undesirable spinning characteristics (Luo et al., 2016). The temperature and eCO2 had no notable effects on fiber uniformity and strength. These fiber properties are likely primarily determined by the plant’s genetics and are only minimally influenced by growing conditions.
5 Conclusion
This study highlights the adverse effects of high air temperatures on cotton reproduction and yield, both in ambient and elevated CO2 conditions. Although boll production increased later in the season in response to high temperatures, high rates of abscission led to poor retention and ultimately reduced seed and lint yields. The observed increase in plant height and node numbers suggests a shift in resource allocation from reproductive growth to vegetative growth. High daytime and nighttime temperatures significantly hindered pollen production, anther dehiscence, and ovule formation, resulting in decreased fertilization success. While eCO2 levels improved photosynthesis, they did not fully counteract the yield losses caused by reproductive failures due to high temperatures. Under these high temperature conditions, seed cotton, lint, and seed yields experienced a sharp decline. These findings emphasize cotton’s vulnerability to rising air temperatures and the limited ability of elevated CO2 to mitigate these adverse effects. These findings should be further validated under field conditions to gain a more comprehensive understanding of plant behavior under current and future CO2 and temperature conditions.
Statements
Data availability statement
The original contributions presented in the study are included in the article/supplementary material. Further inquiries can be directed to the corresponding author/s.
Author contributions
NT: Visualization, Formal Analysis, Writing – original draft, Writing – review & editing, Data curation, Methodology, Investigation, Software. MA: Investigation, Writing – review & editing. SA: Writing – review & editing. KNR: Writing – review & editing. WG: Writing – review & editing. KRR: Validation, Funding acquisition, Project administration, Supervision, Formal Analysis, Investigation, Data curation, Software, Writing – review & editing, Methodology, Visualization, Conceptualization, Resources.
Funding
The author(s) declare financial support was received for the research and/or publication of this article. This work is supported by the United States Department of Agriculture, Agricultural Research Service under Agreement No. 58-8042-9-072, the USDA NIFA 2022-34263-38472 and MIS 430030, and USDA-ARS NACA 58-6066-2-030.
Acknowledgments
The authors thank Mr. David Brand and Mr. Ali Alsughayyir for their assistance in conducting the experiment. We acknowledge Dr. Rooban Venkatesh Thirumalai, Institute for Imaging & Analytical Technologies, for his help during SEM studies.
Conflict of interest
The authors declare that the research was conducted in the absence of any commercial or financial relationships that could be construed as a potential conflict of interest.
Generative AI statement
The author(s) declare that no Generative AI was used in the creation of this manuscript.
Any alternative text (alt text) provided alongside figures in this article has been generated by Frontiers with the support of artificial intelligence and reasonable efforts have been made to ensure accuracy, including review by the authors wherever possible. If you identify any issues, please contact us.
Publisher’s note
All claims expressed in this article are solely those of the authors and do not necessarily represent those of their affiliated organizations, or those of the publisher, the editors and the reviewers. Any product that may be evaluated in this article, or claim that may be made by its manufacturer, is not guaranteed or endorsed by the publisher.
References
1
Abro A. A. Qasim M. Younas M. U. Ali I. Abbas M. Muhammad N. et al . (2025). Impact of elevated temperatures on the genetic and morpho-physiological traits of cotton genotypes cultivation. Genet. Resour. Crop Evol.72, 2533–2560. doi: 10.1007/s10722-024-02126-9
2
Abro S. Rizwan M. Deho Z. A. Abro S. A. Sial M. A. (2021). Identification of heat tolerant cotton lines showing genetic variation in cell membrane thermostability, stomata, and trichome size and its effect on yield and fiber quality traits. Front. Plant Sci.12. doi: 10.3389/fpls.2021.804315
3
Ali S. Shafqat Chattha W. Ullah A. Ishan M. Z. Shafqat W. Ghazy A.-H. et al . (2025). Assessment of climate-resilient cotton genotypes exhibiting high-temperature tolerance. J. Crop Health77, 75. doi: 10.1007/s10343-025-01132-w
4
Allen L. H. Jr Zhang L. Boote K. J. Hauser B. A. (2018). Elevated temperature intensity, timing, and duration of exposure affect soybean internode elongation, mainstem node number, and pod number per plant. Crop J.6, 148–161. doi: 10.1016/j.cj.2017.10.005
5
Amin A. Nasim W. Mubeen M. Nadeem M. Ali L. Hammad H. M. et al . (2017). Optimizing the phosphorus use in cotton by using CSM-CROPGRO-cotton model for semi-arid climate of Vehari-Punjab. Pakistan Environ. Sci. pollut. Res.24, 5811–5823. doi: 10.1007/s11356-016-8311-8
6
Bange M. P. Constable G. A. Gordon S. G. Naylor G. van der Sluijs M. (2009). FIBREpak: a guide to improving Australian cotton fibre quality. CSIRO and the Cotton Catchment Communities Coop (Narrabri, New South Wales, Australia: Research Centre), 30–42.
7
Bista M. K. Kodadinne N. N. Chakravaram A. Pieralisi B. Dhillon J. Reddy K. R. et al . (2025). Intensifying heat stress impacts cotton flowering and boll development efficiency. BMC Plant Biol.25, 984. doi: 10.1186/s12870-025-06934-8
8
Borghi M. Perez de Souza L. Yoshida T. Fernie A. R. (2019). Flowers and climate change: a metabolic perspective. New Phytol.224, 1425–1441. doi: 10.1111/nph.16031
9
Burke J. J. Hatfield J. L. Klein R. R. Mullet J. E. (1985). Accumulation of heat shock proteins in field-grown cotton. Plant Physiol.78, 394–398. doi: 10.1104/pp.78.2.394
10
Chen Y. Wang H. Hu W. Wang S. Snider J. L. Zhou Z. (2017). Co-occurring elevated temperature and waterlogging stresses disrupt cellulose synthesis by altering the expression and activity of carbohydrate balance-associated enzymes during fiber development in cotton. Environ. Exp. Bot.135, 106–117. doi: 10.1016/j.envexpbot.2016.12.012
11
Davidonis G. Hinojosa O. (1994). Influence of seed location on cotton fiber development in planta and in vitro. Plant Sci.103, 107–113. doi: 10.1016/0168-9452(94)03967-4
12
Deng F. Zeng Y. Li Q. He C. Li B. Zhu Y. et al . (2021). Decreased anther dehiscence contributes to a lower fertilization rate of rice subjected to shading stress. Field Crops Res.273, 108291. doi: 10.1016/j.fcr.2021.108291
13
Ding X. Li X. Wang L. Zeng J. Huang L. Xiong L. et al . (2021). Sucrose enhanced reactive oxygen species generation promotes cotton fibre initiation and secondary cell wall deposition. Plant Biotechnol. J.19, 1092–1094. doi: 10.1111/pbi.13594
14
Easterling D. R. Meehl G. A. Parmesan C. Changnon S. A. Karl T. R. Mearns L. O. (2000). Climate extremes: observations, modeling, and impacts. Sci. (New York N.Y.)289, 2068–2074. doi: 10.1126/science.289.5487.2068
15
Emara M. El-Sayed S. (2021). Effect of transplanting cotton on growth, earliness, productivity and fiber quality as compared with early and late direct seeding under spraying with pix. J. Plant Prod.12, 385–397. doi: 10.21608/jpp.2021.169548
16
EPA O. U. (2016). Climate change indicators: Weather and climate. Available online at: https://www.epa.gov/climate-indicators/weather-climate (Accessed March 15, 2025).
17
Farooq A. Shakeel A. Saeed A. Farooq J. Rizwan M. Chattha W. S. et al . (2023). Genetic variability predicting breeding potential of upland cotton (Gossypium hirsutum L.) for high temperature tolerance. J. Cotton. Res.6, 1–17. doi: 10.1186/s42397-023-00144-z
18
Gong Z. Zhang X. Zong Y. Zhang D. Shi X. Hao X. et al . (2025). Co-elevated CO2 concentration and temperature enhance the carbon assimilation and lipid metabolism in a high-oil soybean (Glycine max (L.) Merr.) variety. Plant Physiol. Biochem.228, 110243. doi: 10.1016/j.plaphy.2025.110243
19
Hatfield J. L. Prueger J. H. (2015). Temperature extremes: Effect on plant growth and development. Weather Clim. Extrem.10, 4–10. doi: 10.1016/j.wace.2015.08.001
20
Hatfield J. L. Wright-Morton L. Hall B. (2018). Vulnerability of grain crops and croplands in the Midwest to climatic variability and adaptation strategies. Clim. Change146, 263–275. doi: 10.1007/s10584-017-1997-x
21
Hewit E. J. (1953). Sand and water culture methods used in the study of plant nutrition. Technical communication No. 22 (United Kingdom: Commonwealth Bureau of Horticulture and Plantation Crops, Commonwealth Agricultural Bureaux, Farnham Royal, Buckinghamshire).
22
Impa S. M. Sunoj V. S. J. Krassovskaya I. Bheemanahalli R. Obata T. Jagadish S. V. K. (2019). Carbon balance and source-sink metabolic changes in winter wheat exposed to high night-time temperature. Plant. Cell Environ.42, 1233–1246. doi: 10.1111/pce.13488
23
Jans Y. von Bloh W. Schaphoff S. Müller C. (2021). Global cotton production under climate change – Implications for yield and water consumption. Hydrol. Earth Syst. Sci.25, 2027–2044. doi: 10.5194/hess-25-2027-2021
24
Jiang Y. Li C. Paterson A. H. (2016). High throughput phenotyping of cotton plant height using depth images under field conditions. Comput. Electron. Agric.130, 57–68. doi: 10.1016/j.compag.2016.09.017
25
Khan A. H. Min L. Ma Y. Wu Y. Ding Y. Li Y. et al . (2020). High day and night temperatures distinctively disrupt fatty acid and jasmonic acid metabolism, inducing male sterility in cotton. J. Exp. Bot.71, 6128–6141. doi: 10.1093/jxb/eraa319
26
Li X. Liu Q. Yang R. Zhang H. Zhang J. Cai E. (2015). The design and implementation of the leaf area index sensor. Sensors. (Basel Switzerland)15, 6250–6269. doi: 10.3390/s150306250
27
Lindsey R. (2024). Climate change: atmospheric carbon dioxide. Available online at: https://www.climate.gov/news-features/understanding-climate/climate-change-atmospheric-carbon-dioxide (Accessed March 11, 2025).
28
Lohani N. Singh M. B. Bhalla P. L. (2025). Deciphering the vulnerability of pollen to heat stress for securing crop yields in a warming climate. Plant. Cell Environ.48, 2549–2580. doi: 10.1111/pce.15315
29
Loka D. A. Oosterhuis D. M. (2016). Increased night temperatures during cotton’s early reproductive stage affect leaf physiology and flower bud carbohydrate content decreasing flower bud retention. J. Agron. Crop Sci.202, 518–529. doi: 10.1111/jac.12170
30
Lokhande S. Reddy K. R. (2014). Quantifying temperature effects on cotton reproductive efficiency and fiber quality. Agron. J.106, 1275–1282. doi: 10.2134/agronj13.0531
31
Luo Q. Bange M. Johnston D. (2016). Environment and cotton fibre quality. Clim. Change138, 207–221. doi: 10.1007/s10584-016-1715-0
32
MacDonald S. (2024). The world and U.S. cotton outlook for 2024/25. Available online at: https://www.usda.gov/sites/default/files/documents/AOF-2024-MacDonald.pdf (Accessed February 12, 2025).
33
Manan A. Zafar M. M. Ren M. Khurshid M. Sahar A. Rehman A. et al . (2022). Genetic analysis of biochemical, fiber yield and quality traits of upland cotton under high-temperature. Plant Prod. Sci.25, 105–119. doi: 10.1080/1343943X.2021.1972013
34
Masoomi-Aladizgeh F. Najeeb U. Hamzelou S. Pascovici D. Amirkhani A. Tan D. K. Y. et al . (2021). Pollen development in cotton (Gossypium hirsutum) is highly sensitive to heat exposure during the tetrad stage. Plant. Cell Environ.44, 2150–2166. doi: 10.1111/pce.13908
35
Miglani N. Agarwal P. Ranjan R. Mohanty A. Mishra R. (2025). Transcription factors: major regulators of anther development in rice. J. Plant Growth Regul.44, 4227–4246. doi: 10.1007/s00344-025-11687-7
36
Mishra N. Sun L. Zhu X. Smith J. Prakash A. Srivastava Yang X. et al . (2017). Overexpression of the rice SUMO E3 ligase gene OsSIZ1 in cotton enhances drought and heat tolerance, and substantially improves fiber yields in the field under reduced irrigation and rainfed conditions. Plant Cell Physiol.58, 735–746. doi: 10.1093/pcp/pcx032
37
NASA (2024). Global Climate Change. Global Surface Temperature. Climate Change: Vital Signs of the Planet. Available online at: https://climate.nasa.gov/vital-signs/global-temperature/?intent=121 (Accessed February 27, 2025).
38
Naveed S. Gandhi N. Billings G. Jones Z. Campbell B. T. Jones M. et al . (2023). Alterations in growth habit to channel end-of-season perennial reserves towards increased yield and reduced regrowth after defoliation in upland cotton (Gossypium hirsutum L.). Int. J. Mol. Sci.24, 14174. doi: 10.3390/ijms241814174
39
NCEI (2024). National Centers for Environmental Information. Monthly climate reports. Available online at: https://www.ncdc.noaa.gov/sotc/global/201813 (Accessed March 26, 2025).
40
Nie J. Qin D. Mao L. Liu Y. Dong H. Song X. et al . (2020). Genotypic variance in 13C-photosynthate partitioning and within-plant boll distribution in cotton. J. Cotton. Res.3, 1–10. doi: 10.1186/s42397-020-00055-3
41
Parkash V. Snider J. Awori K. J. Katta J. R. Pilon C. Tishchenko V. (2024). Distinguishing high daytime from nighttime temperature effects during early vegetative growth in cotton. J. Agron. Crop Sci.210, e12757, 1–14. doi: 10.1111/jac.12757
42
Popat R. Banakara K. (2020). Package Doebioresearch. Available online at: https://cran.rproject.org/web/packages/doebioresearch/doebioresearch.pdf (Accessed January 29, 2025).
43
Qian D. Li T. Zheng C. Wang M. Chen S. Li C. et al . (2025). Heat-stable protein PGSL1 enhances pollen germination and tube growth at high temperature. Nat. Commun.16, 3642. doi: 10.1038/s41467-025-58869-1
44
Qin A. Aluko O. O. Liu Z. Yang J. Hu M. Guan L. et al . (2023). Improved cotton yield: can we achieve this goal by regulating the coordination of source and sink? Front. Plant Sci.14. doi: 10.3389/fpls.2023.1136636
45
Raja M. M. Vijayalakshmi G. Naik M. L. Basha P. O. Sergeant K. Hausman J. F. et al . (2019). Pollen development and function under heat stress: from effects to responses. Acta Physiol. Plant41, 1–20. doi: 10.1007/s11738-019-2835-8
46
Reddy K. R. Hodges H. F. McKinion J. M. (1995a). Carbon dioxide and temperature effects on pima cotton growth. Agric. Ecosys. Environ.54, 17–29. doi: 10.1016/0167-8809(95)00593-H
47
Reddy K. R. Hodges H. F. Mckinion J. M. (1997). A comparison of Scenarios for the effect of global climate change on cotton growth and yield. Aust. J. Plant Physiol.24, 707–713. doi: 10.1071/PP96138
48
Reddy K. R. Hodges H. F. Read J. J. Mckinion J. M. Baker J. T. Tarpley L. et al . (2001). Soil-plant-atmosphere-research (SPAR) facility: a tool for plant research and modeling. Biotronics30, 27–50.
49
Reddy V. R. Reddy K. R. Acock B. (1995b). Carbon dioxide and temperature interactions on stem extension, node initiation, and fruiting in cotton. Agric. Ecosys. Environ.55, 17–28. doi: 10.1016/0167-8809(95)00606-S
50
Reddy K. R. Reddy V. R. Hodges H. F. (1992). Temperature effects on early season cotton growth and development. Agron. J.84, 229–237. doi: 10.2134/agronj1992.00021962008400020021x
51
Reddy K. R. Robana R. R. Hodges H. F. Liu X. J. McKinion J. M. (1998). Interactions of CO2 enrichment and temperature on cotton growth and leaf characteristics. Environ. Exp. Bot.39, 117–129. doi: 10.1016/S0098-8472(97)00028-2
52
Reddy K. R. Zhao D. (2005). Interactive effects of elevated CO2 and potassium deficiency on photosynthesis, growth, and biomass partitioning of cotton. Field Crops Res.94, 201–213. doi: 10.1016/j.fcr.2005.01.004
53
Ruan Y.-L. Llewellyn D. J. Furbank R. T. Chourey P. S. (2005). The delayed initiation and slow elongation of fuzz-like short fibre cells in relation to altered patterns of sucrose synthase expression and plasmodesmata gating in a lintless mutant of cotton. J. Exp. Bot.56, 977–984. doi: 10.1093/jxb/eri091
54
Saini D. K. Impa S. M. McCallister D. Patil G. B. Abidi N. Ritchie G. et al . (2023). High day and night temperatures impact on cotton yield and quality—current status and future research direction. J. Cotton. Res.6, 16. doi: 10.1186/s42397-023-00154-x
55
Sakata T. Higashitani A. (2008). Male sterility accompanied with abnormal anther development in plants-genes and environmental stresses with special reference to high temperature injury. Int. J. Plant Dev. Biol.2, 42–51.
56
Salman M. Majeed S. Rana I. A. Atif R. M. Azhar M. T. (2019). Novel breeding and biotechnological approaches to mitigate the effects of heat stress on cotton. In Recent Approaches in Omics for Plant Resilience to Climate Change (Cham, Switzerland: Springer International Publishing), 251–277. doi: 10.1007/978-3-030-21687-0_11
57
Snider J. L. Adegbenro C. O. (2025). Elevated temperature effects on functional yield drivers in cotton. Crop Sci.65, e70149. doi: 10.1002/9781119385523.ch2
58
Snider J. L. Oosterhuis D. M. Skulman B. W. Kawakami E. M. (2009). Heat stress-induced limitations to reproductive success in Gossypium hirsutum. Physiol. Plant137, 125–138. doi: 10.1111/j.1399-3054.2009.01266.x
59
Song G. Chen Q. Tang C. (2014). The effects of high-temperature stress on the germination of pollen grains of upland cotton during square development. Euphytica; Netherlands J. Plant Breed.200, 175–186. doi: 10.1007/s10681-014-1141-1
60
Song G. Wang M. Zeng B. Zhang J. Jiang C. Hu Q. et al . (2015). Anther response to high-temperature stress during development and pollen thermotolerance heterosis as revealed by pollen tube growth and in vitro pollen vigor analysis in upland cotton. Planta241, 1271–1285. doi: 10.1007/s00425-015-2259-7
61
Soni M. Sheshukov A. Y. Aguilar J. (2025). The critical role of temperature in determining optimal planting schedule for cotton: a review. Agric. For. Meteorol.373, 110741. doi: 10.1016/j.agrformet.2025.110741
62
USDA-ERS (2024). Cotton and wool – cotton sector at a glance. USDA- Economic Research Service. Available online at: https://www.ers.usda.gov/topics/crops/cotton-and-wool/cotton-sector-at-a-glance (Accessed September 4, 2025).
63
USDA-FAS (2024a). Cotton-production. Available online at: https://www.fas.usda.gov/data/production/commodity/2631000 (Accessed February 12, 2025).
64
USDA-FAS (2024b). U.S. cotton export in 2024. USDA Foreign Agricultural Service. Available online at: https://www.fas.usda.gov/data/commodities/cotton (Accessed February 12, 2025).
65
USDA-NASS (2024). USDA - National Agricultural Statistics Service - charts and maps - cotton: Yield map by state. Available online at: https://www.nass.usda.gov/Charts_and_Maps/Field_Crops/cotnmap.php (Accessed February 12, 2025).
66
Wang F. Gao J. Yong J. W. H. Wang Q. Ma J. He X. (2020). Higher atmospheric CO2 levels favor C3 plants over C4 plants in utilizing ammonium as a nitrogen source. Front. Plant Sci.11. doi: 10.3389/fpls.2020.537443
67
Wilson Z. A. Song J. Taylor B. Yang C. (2011). The final split: the regulation of anther dehiscence. J. Exp. Bot.62, 1633–1649. doi: 10.1093/jxb/err014
68
Xia J. Chen J. Piao S. Ciais P. Luo Y. Wan S. (2014). Terrestrial carbon cycle affected by non-uniform climate warming. Nat. Geosci.7, 173–180. doi: 10.1038/ngeo2093
69
Xu J. Misra G. Sreenivasulu N. Henry A. (2021). What happens at night? Physiological mechanisms related to maintaining grain yield under high night temperature in rice. Plant. Cell Environ.44, 2245–2261. doi: 10.1111/pce.14046
70
Xu B. Zhou Z.-G. Guo L.-T. Xu W.-Z. Zhao W.-Q. Chen B.-L. et al . (2017). Susceptible time window and endurable duration of cotton fiber development to high temperature stress. J. Integr. Agric.16, 1936–1945. doi: 10.1016/S2095-3119(16)61566-6
71
Yang L. Song W. Xu C. Sapey E. Jiang D. Wu C. (2023). Effects of high night temperature on soybean yield and compositions. Front. Plant Sci.14. doi: 10.3389/fpls.2023.1065604
72
Yousaf M. I. Hussain Q. Alwahibi M. S. Aslam M. Z. Khalid M. Z. Hussain S. et al . (2023). Impact of heat stress on agro-morphological, physio-chemical and fiber related paramters in upland cotton (Gossypium hirsutum L.) genotypes. J. King. Saud. Univ. Sci.35, 102379. doi: 10.1016/j.jksus.2022.102379
73
Zafar M. M. Jia X. Shakeel A. Sarfraz Z. Manan A. Imran A. et al . (2021). Unraveling heat tolerance in upland cotton (Gossypium hirsutum L.) using univariate and multivariate analysis. Front. Plant Sci.12. doi: 10.3389/fpls.2021.727835
74
Zhang S. Fu W. Zhang Z. Fan Y. Liu T. (2017). Effects of elevated CO2 concentration and temperature on some physiological characteristics of cotton (Gossypium hirsutum L.) leaves. Environ. Exp. Bot.133, 108–117. doi: 10.1016/j.envexpbot.2016.10.001
75
Zheng L. Nagpal P. Villarino G. Trinidad B. Bird L. Huang Y. et al . (2019). miR167 limits anther growth to potentiate anther dehiscence. Dev. (Cambridge England)146, dev174375. doi: 10.1242/dev.174375
Summary
Keywords
boll production, boll retention, fiber quality, ovules, pollen grains
Citation
Thenveettil N, Allam MKR, Anapalli SS, Reddy KN, Gao W and Reddy KR (2025) Impacts of varying day and night environmental conditions on cotton flowering, yield, and fiber quality. Front. Plant Sci. 16:1616982. doi: 10.3389/fpls.2025.1616982
Received
23 April 2025
Accepted
17 September 2025
Published
02 October 2025
Volume
16 - 2025
Edited by
Sheng Chen, University of Western Australia, Australia
Reviewed by
Ravikesavan Rajasekaran, Tamil Nadu Agricultural University, India
Jatinderpal Singh, Indian Agricultural Research Institute (ICAR), India
Updates
Copyright
© 2025 Thenveettil, Allam, Anapalli, Reddy, Gao and Reddy.
This is an open-access article distributed under the terms of the Creative Commons Attribution License (CC BY). The use, distribution or reproduction in other forums is permitted, provided the original author(s) and the copyright owner(s) are credited and that the original publication in this journal is cited, in accordance with accepted academic practice. No use, distribution or reproduction is permitted which does not comply with these terms.
*Correspondence: Naflath Thenveettil, nt544@msstate.edu; K. Raja Reddy, krreddy@pss.msstate.edu
Disclaimer
All claims expressed in this article are solely those of the authors and do not necessarily represent those of their affiliated organizations, or those of the publisher, the editors and the reviewers. Any product that may be evaluated in this article or claim that may be made by its manufacturer is not guaranteed or endorsed by the publisher.