 Yuru Hu1,2,3
 Xueyan Zhang
 Xin Ma
- 1Key Laboratory of Land Surface Pattern and Simulation, Institute of Geographic Sciences and Natural Resources Research, Chinese Academy of Sciences, Beijing, China
- 2Institute of Environment and Sustainable Development for Agriculture, Chinese Academy of Agricultural Sciences, Beijing, China
- 3Huanggang Meteorological Service, Huanggang, China
Agrivoltaics has the potential to enable simultaneous energy and food production. However, its impact on crop quality and the underlying mechanisms remain insufficiently understood, which poses a significant challenge to the development of agrivoltaic systems. This study aims to investigate the process and pathways through which agrivoltaic systems influence soybean protein concentration by examining crop responses to three types of photovoltaic structures: traditional photovoltaic panels, checkerboard photovoltaic panels, and translucent photovoltaic panels. The results indicate that: 1) soybeans grown under translucent photovoltaic panels exhibited no significant decrease in nitrogen accumulation or crude protein concentration compared to the control group; 2) logistic model analysis revealed that translucent photovoltaic panels outperformed traditional panels in terms of maximum nitrogen accumulation potential and the timing of peak accumulation, highlighting their relative advantage in preserving soybean protein concentration; 3) the effect of agrivoltaics on grain protein concentration is multifaceted, primarily involving nitrogen accumulation in leaves prior to the grain-filling stage and nitrogen translocation during the grain-filling stage. These findings provide robust empirical evidence and a theoretical framework for understanding how photovoltaic systems affect soybean quality and for developing strategies to mitigate any decline in quality. This research contributes to the future promotion and adoption of agrivoltaic systems.
1 Introduction
Agrivoltaics has been shown to effectively utilize solar radiation for both energy generation and food production (Dupraz et al., 2011), enhance agricultural economic efficiency (Choi et al., 2023), and support low-carbon agricultural practices (Pascaris et al., 2021; Ravi et al., 2016). The development of innovative technologies holds the potential to reduce photovoltaic installation costs, thereby improving the feasibility of agrivoltaic systems (China Meteorological Administration, 2023). By 2023, China’s installed agrivoltaic capacity had exceeded 40 GW, with more than 500 grid-connected projects completed (Xu, 2023). The widespread integration of field-grown crops is expected to play a crucial role in advancing agricultural emission reductions and climate change adaptation through agrivoltaics.
Soybean, a shade-tolerant and economically significant oil crop, has emerged as a promising candidate for agrivoltaic applications (Walston et al., 2022). Existing studies have demonstrated that integrating soybean cultivation with agrivoltaics can lower photovoltaic module temperatures, thereby enhancing photovoltaic conversion efficiency (Williams et al., 2023), as well as increasing land use efficiency and economic returns (Cuppari et al., 2021). Kim et al. (2021) explored the optimal combination of photovoltaics and soybean cultivation, with recent findings indicating that a shading level of up to 23% maximizes both energy output and farm income (Kim and Kim, 2023). While research has primarily focused on the impact of photovoltaic installations on soybean yield, prevailing evidence suggests that agrivoltaics may lead to yield reductions. For instance, Lee et al. (2022) reported an 18% decrease in soybean yield under a 28% shading rate due to an increase in seedless pods. Similarly, large-scale commercial agrivoltaic systems have shown an average 8% reduction in yield, accompanied by fewer pods (Potenza et al., 2022a). However, there remains a limited number of studies examining the effects of photovoltaic installations on soybean quality. Hu et al. (2024) proposed that photovoltaic modules may reduce levels of crude fat, soluble sugar, and starch in soybeans. Notably, the influence of agrivoltaic systems on soybean protein concentration an essential quality indicator has not yet been thoroughly investigated. Soybeans containing more than 42% protein are classified as high-quality. Meanwhile, photovoltaic installations reduce photosynthetically active radiation (PAR), potentially affecting carbon cycling. Yet, the mechanisms underlying nitrogen metabolism and their specific impacts on protein biosynthesis remain unclear and warrant systematic investigation.
The plant growth curve serves as a fundamental method for describing crop dry matter accumulation. Archontoulis and Miguez (2015) introduced a nonlinear model with improved horizontal asymptotes and fewer parameters for modeling the S-shaped growth curve. Commonly used models include the Richards, Gompertz, and Logistic models. The Richards model is particularly suitable for dense crop populations, where density significantly influences parameter estimation (Damgaard et al., 2002). Both the Gompertz and Logistic models are widely applied for estimating plant growth (Paine et al., 2012), with the Logistic model offering superior accuracy in representing growth dynamics (Jane et al., 2020). Yao et al. (2011) proposed a logistic curve specifically tailored for modeling nitrogen accumulation in soybeans. Moustakas et al. (2011) further refined this approach by dividing the growth stage into three phases, enabling precise description of nitrogen accumulation using the logistic equation. The Logistic model has been extensively employed in analyzing optimal farmland management strategies (Wang et al., 2019; Jahangirlou et al., 2023) and predicting yields (Wang et al., 2022), providing a reliable framework for assessing crop nitrogen uptake under agrivoltaic conditions.
In this study, a logistic model was employed to simulate the dynamic nitrogen accumulation process in agrivoltaic systems. This research aimed to address the current knowledge gap regarding the impact of photovoltaic modules distinguished by material, structure, and positioning on soybean nitrogen concentration and accumulation. Additionally, a modeling approach was developed to investigate the nitrogen absorption dynamics during soybean kernel development, identifying key parameters and pathways through which photovoltaic modules influence grain nitrogen accumulation. This model offers a scientific basis for optimizing photovoltaic module configurations and mitigating their impact on soybean nutrient uptake.
2 Materials and methods
2.1 Photovoltaic device design
The experiment was carried out in Beijing’s Shunyi. The average temperature is 11.5°C per year. In this area, there is an average of 2,750 hours of sunshine every year, and there are roughly 195 days without frost. The average precipitation is about 625 millimeters per year, and the average relative humidity is 50%. Four treatments were used in the experiment: CK (control), SPM (translucent photovoltaic panel), CPM (checkerboard photovoltaic panel), and TPM (traditional photovoltaic panel). Furthermore, the impact of photovoltaic panel position on crop yield was considered, with two positions designated: beneath the panel (B) and rear the panel (R). For each of the aforementioned treatments, three replicate cells were established. As demonstrated in Figure 1, each constituent element of the photovoltaic system is affixed by four ground stakes, four columns and four crossbars. Photovoltaic panels are positioned above the crossbars and connected to the lines for power generation. The tilt angle of the modules was set at 36°, optimized for maximum solar energy capture based on Beijing’s latitude. The front column measures 80 cm in length, which is the minimum height stipulated to ensure optimal growth conditions for soybeans. This height is also the most commonly employed for ground-mounted power stations.
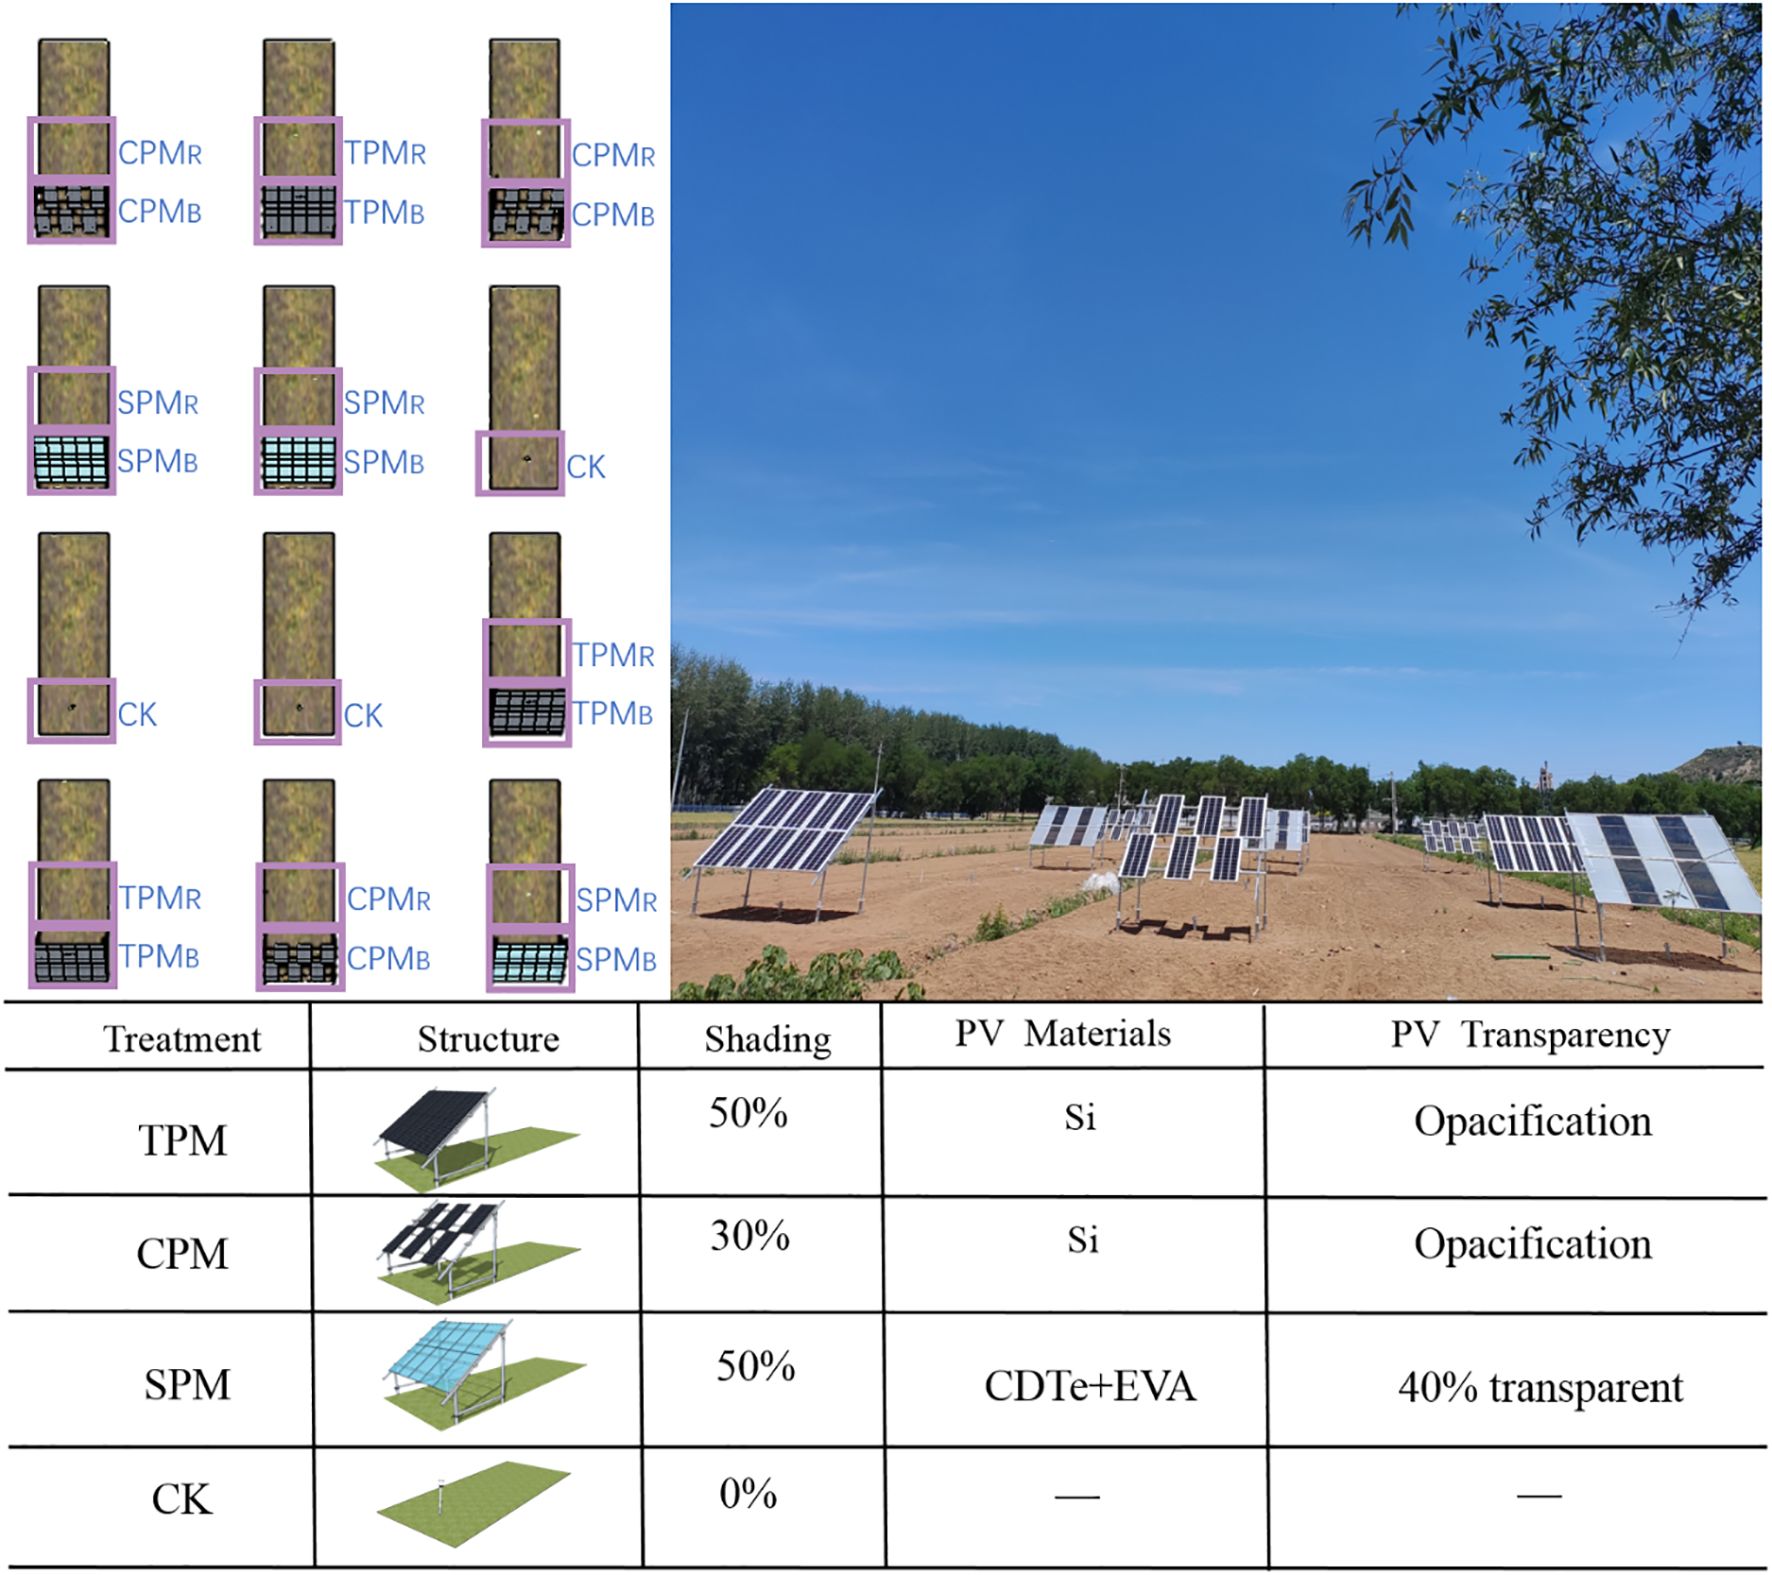
Figure 1. Agrivoltaics cell distribution. Among them, TPM stands for traditional photovoltaic panel, CPM stands for checkerboard photovoltaic panel, SPM stands for translucent photovoltaic panel, and CK represents control treatment. B represents the bottom of the photovoltaic panel, and R represents the rear of the photovoltaic panel.
2.2 Crop and field management
The soybean cultivar Zhonghuang 13 was used in this study. Before sowing, 750 kg/km² organic fertilizer was applied (total nitrogen concentration ≥12%, organic matter concentration ≥30%), and the nutrient status of the field soil was determined (active phosphorus 21.66 mg·kg−1, available potassium 103.6 mg·kg−1, hydrolyzed nitrogen 89.44 mg·kg−1). Soybeans were sown on June 22, 2023, with a row spacing of 40 cm and a plant spacing of 10 cm. The grain-filling stage commenced on 31 August 2023, at which point the first sampling was conducted. Subsequent samplings were performed at 11, 20, and 41 days after the onset of grain filling (four samplings total), with final harvest occurring after the last sampling. Figure 2 illustrates soybean growth dynamics during the grain-filling stage alongside corresponding meteorological data. Other treatments such as weeding (herbicide was applied after seeding and during flowering), and insecticide application (insecticide was applied during flowering) were consistent with local farming practices.
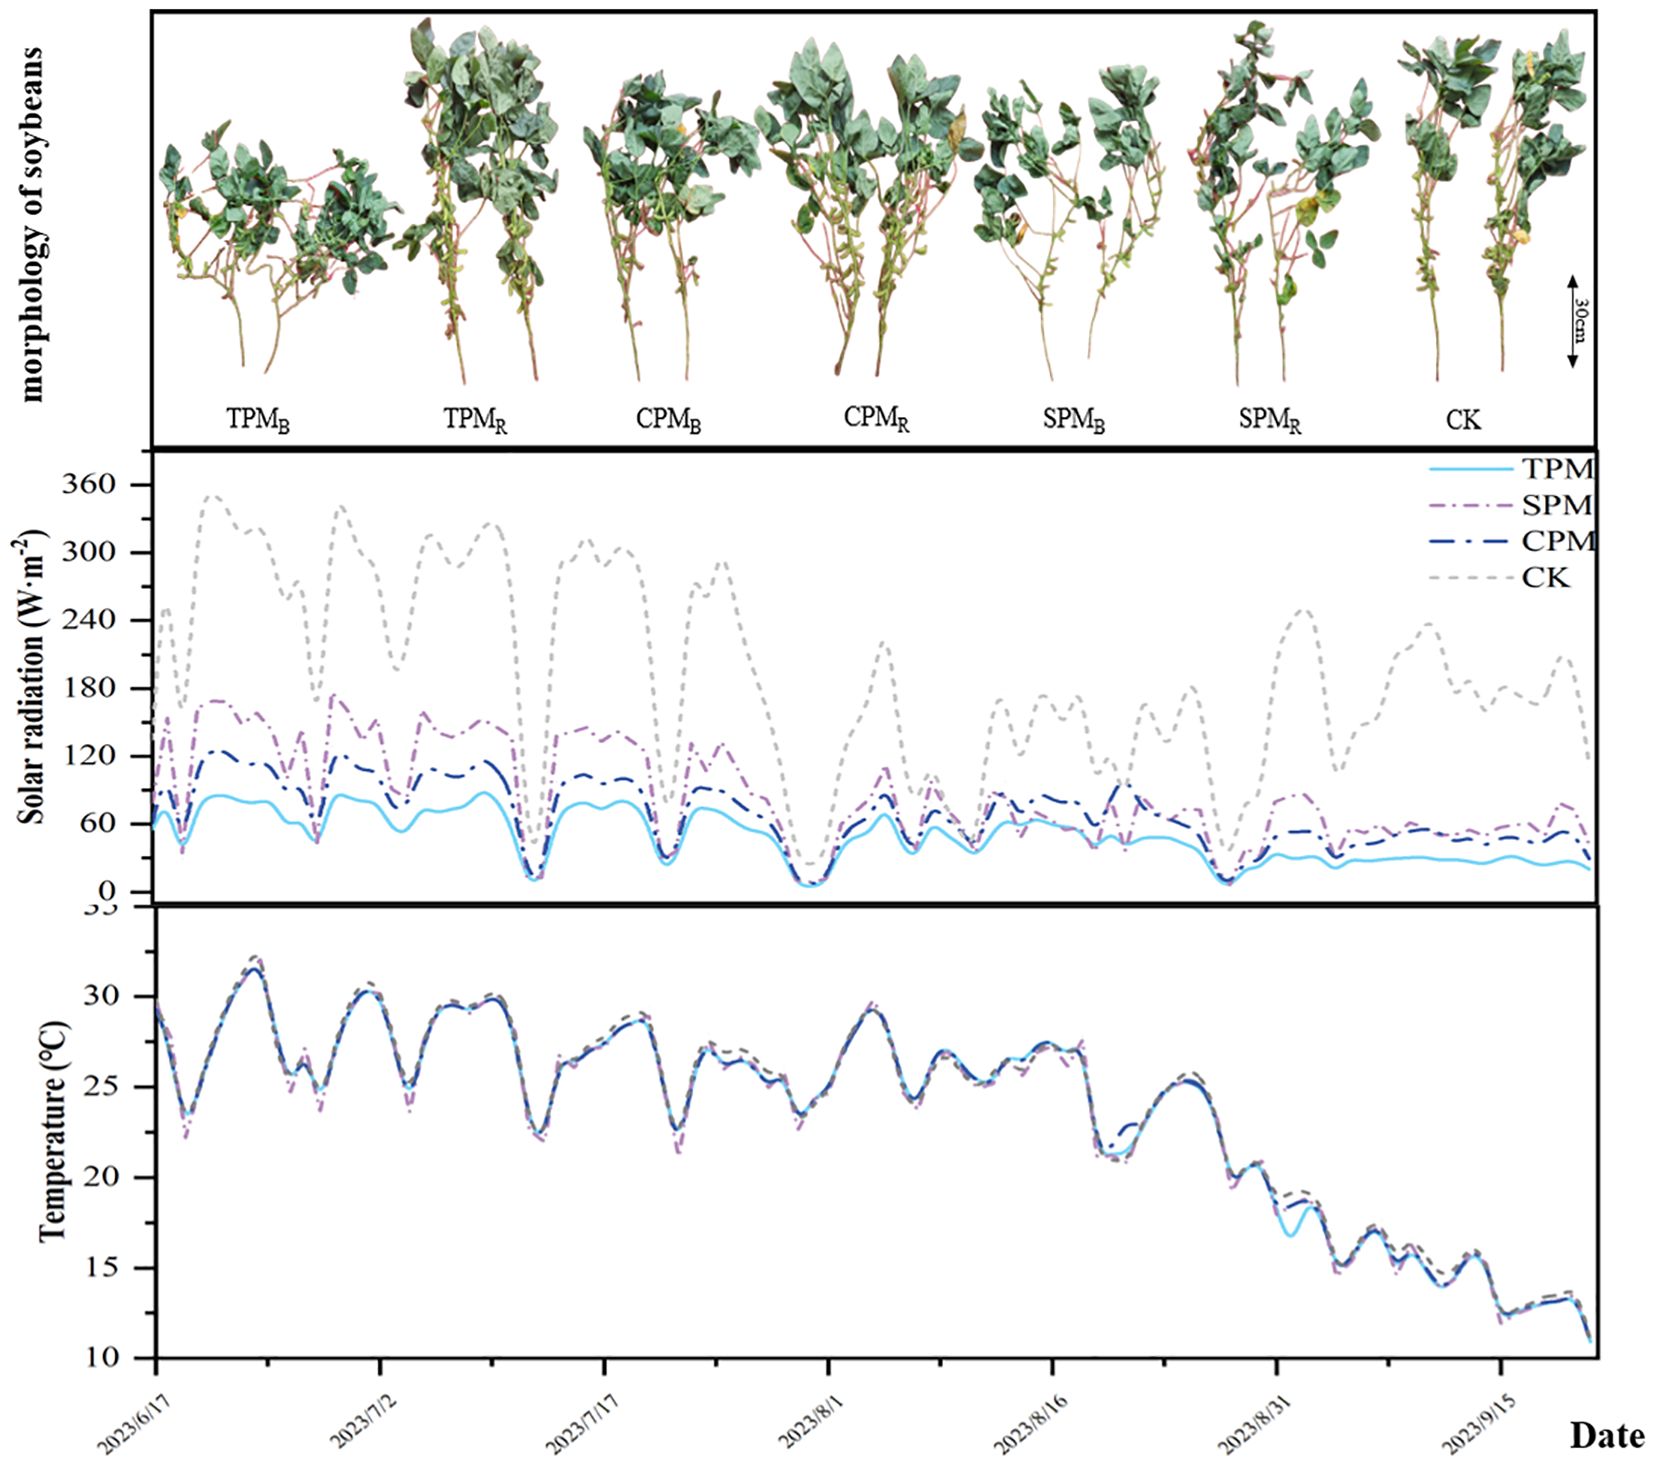
Figure 2. Meteorological conditions and the growth status of crops during the grain filling stage.
2.3 Detection and processing
2.3.1 Net photosynthetic rate
Net photosynthetic rate (Pn) measurements were conducted between 9:00 and 11:00 AM on clear, windless days with minimal cloud cover. For each experimental plot, six healthy plants with uniform leaf development and no visible signs of disease or pest damage were selected. The net photosynthetic rate was measured on functional leaves (middle leaflets of the second fully expanded trifoliate leaves from the apex) using a portable photosynthesis system (LI-6400XT, LI-COR Biosciences, USA). The monitoring was carried out once at the branch stage, flowering stage, pod stage and maturity stage of soybean, while the grain filling stage was monitored three times.
2.3.2 Nitrogen concentration
In this experiment, four times of samples were collected from the grain filling stage to the maturity stage, with four soybean plants randomly selected from each plot during the grain filling stage. The soybean seeds were separated from other organs (stems, leaves, and pods). Samples were oven-dried at 105°C for 30 min, followed by drying at 80°C to constant weight. Dried samples were weighed and ground (< 0.5 mm) for subsequent analysis. Total nitrogen concentration in soybean grains and other organs was determined by Kjeldahl method. The formula for calculating nitrogen accumulation in soybean is as follows (Equations 1, 2):
represents the grain nitrogen accumulation, represents the grain nitrogen concentration, and represents the grain dry matter weight. represents total nitrogen accumulation, represents nitrogen concentration of other organs, and represents dry matter weight of other organs.
2.3.3 Crude protein concentration
Crude protein concentration was determined using near-infrared spectroscopy (NIRS). For each plot, harvested soybean samples were homogenized and placed in the analyzer’s sample cell. Each sample underwent duplicate measurements following standard NIRS protocols: after initial analysis, samples were thoroughly remixed before the second measurement to ensure representative sampling. The mean value of the two measurements was recorded as the plot’s crude protein concentration.
2.3.4 Model fitting and processing
In this study, the logistic model was used to simulate the grain nitrogen concentration of soybean at the grain filling stage. Since the earliest detection of grain nitrogen accumulation can only start from the grain filling stage, the simulation period of grain nitrogen accumulation in this study was from the grain filling stage to the maturity stage. The specific formula (Yao et al., 2011) is as follows (Equations 3, 4):
Where are the constant parameters of the model. Among them, represents the maximum nitrogen accumulation potential, which is the potential of soybean grain nitrogen to reach nitrogen accumulation. stands for primary growth rate, which is the ability of soybean grains to absorb nitrogen in the early stage. represents the time it takes to reach the maximum growth rate; represents the maximum nitrogen absorption efficiency of soybean grains and the maximum capacity of soybean grains to absorb nutrients.
2.3.5 Path analysis
Path analysis has been shown to provide a more flexible modeling approach in situations characterized by complex multicollinearity issues. The path analysis in this study was conducted using SPSSAU. During the model construction process, the leaf and stem indicators of above-ground parts were initially defined as exogenous variables, the parameters of the logistic model as mediating variables, and the crude protein concentration of soybean grains as the endogenous variable. However, this initial specification failed to meet the required model fit criteria. Consequently, the model was revised by allowing the indicators prior to the grain filling stage to directly influence the crude protein concentration of soybean grains. After a series of iterative modifications, the model achieved an acceptable level of fit: the chi-square to degrees of freedom ratio (χ²/df) was below the commonly accepted threshold of 5, P > 0.05, and multiple fit indices—including the Normed Fit Index (NFI), Relative Fit Index (RFI), Incremental Fit Index (IFI), Comparative Fit Index (CFI), and Tucker-Lewis Index (TLI)—all exceeded the recommended threshold of 0.90.
2.4 Data analysis
The primary objective of this study is to elucidate the impact pathway of photovoltaic agriculture on nitrogen dynamics in soybean. To achieve this, one-way ANOVA was conducted to analyze nitrogen concentration, nitrogen accumulation, and crude protein concentration in soybean. The pattern of grain nitrogen accumulation was modeled using the least squares method, and the associated nitrogen accumulation parameters were further examined through two-factor ANOVA. Finally, path analysis was employed to quantify the effects of photovoltaic agriculture on the crude protein concentration of soybean. All data analyses were performed using SPSS and SPSSAU software.
3 Results
3.1 Net photosynthetic rate and nitrogen transfer in leaves and stems
As demonstrated in Figure 3a, the position of the agrivoltaics treatments exerted a substantial influence on the net photosynthetic rate of soybean. The net photosynthetic rates of the TPMB, CPMB, and SPMB treatments, located directly below the photovoltaic panel, exhibited significant decreases of 59.10%, 44.84%, and 43.32%, respectively, compared to the CK treatment. As demonstrated in Figures 3b, d, the leaf nitrogen accumulation and transfer volume of TPMB, CPMB, and SPMB were significantly reduced in comparison with the CK treatment. As demonstrated in Figures 3c, e, the stem nitrogen accumulation and transfer volume under agrivoltaics treatment were found to be significantly lower compared to the CK treatment.
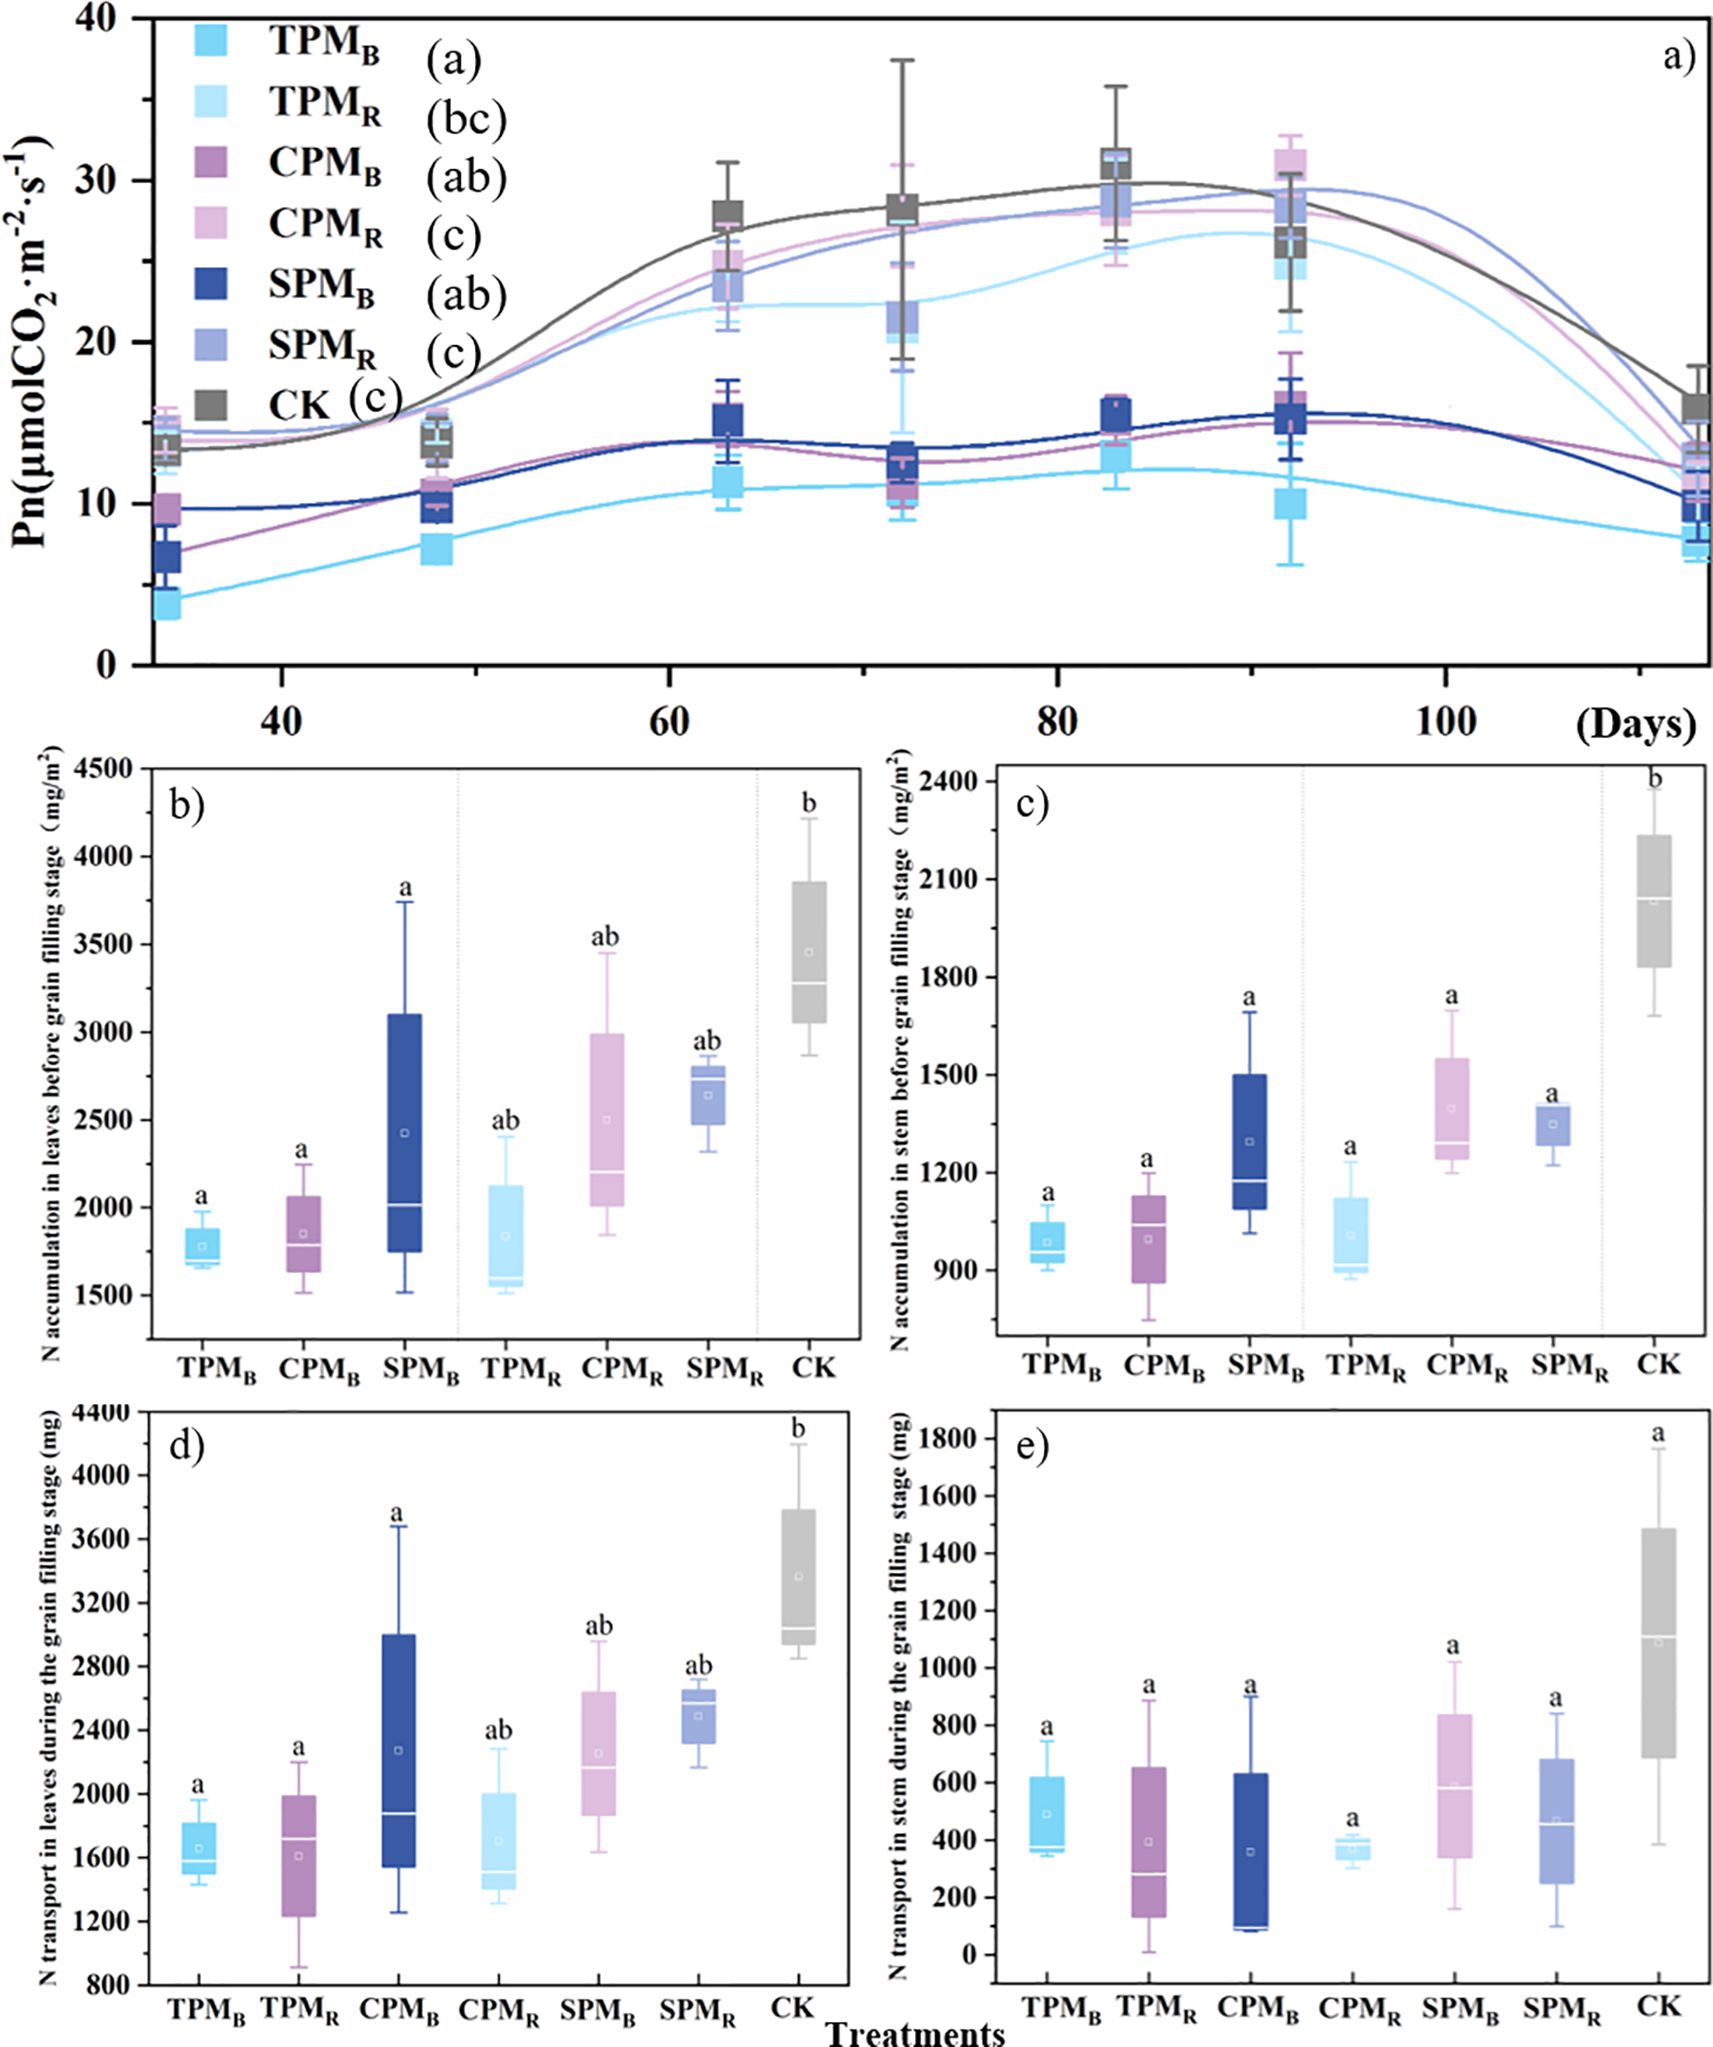
Figure 3. Photosynthetic rate, nitrogen accumulation, and transfer in leaves and stems. In (a–e), TPM, CPM, SPM, and CK represent an ordinary photovoltaic panel, a checkerboard photovoltaic panel, a translucent photovoltaic panel (with a light transmittance of 40%), and a comparison with field treatment, respectively. B and R denote the positions directly below and rear of the photovoltaic panel, respectively. Different lowercase letters represent significant differences between treatments at the 5% level. In (a), the number represents the number of days entering the grain filling stage.
3.2 Crude protein concentration and nitrogen accumulation in soybean grains
The translucent PV panels demonstrated superior performance in terms of yield and quality concentration in comparison to alternative PV treatments. As demonstrated in Figure 4a, regarding yield, the TPMB treatment yielded a significantly lower result compared to the control treatment. The results for crude protein concentration and grain nitrogen concentration demonstrated no significant difference between soybeans treated directly below and rear the translucent PV panels and the control treatment (Figures 4b, d). In contrast, all PV treatments were significantly lower than the control treatment in terms of seed nitrogen accumulation (Figure 4c).
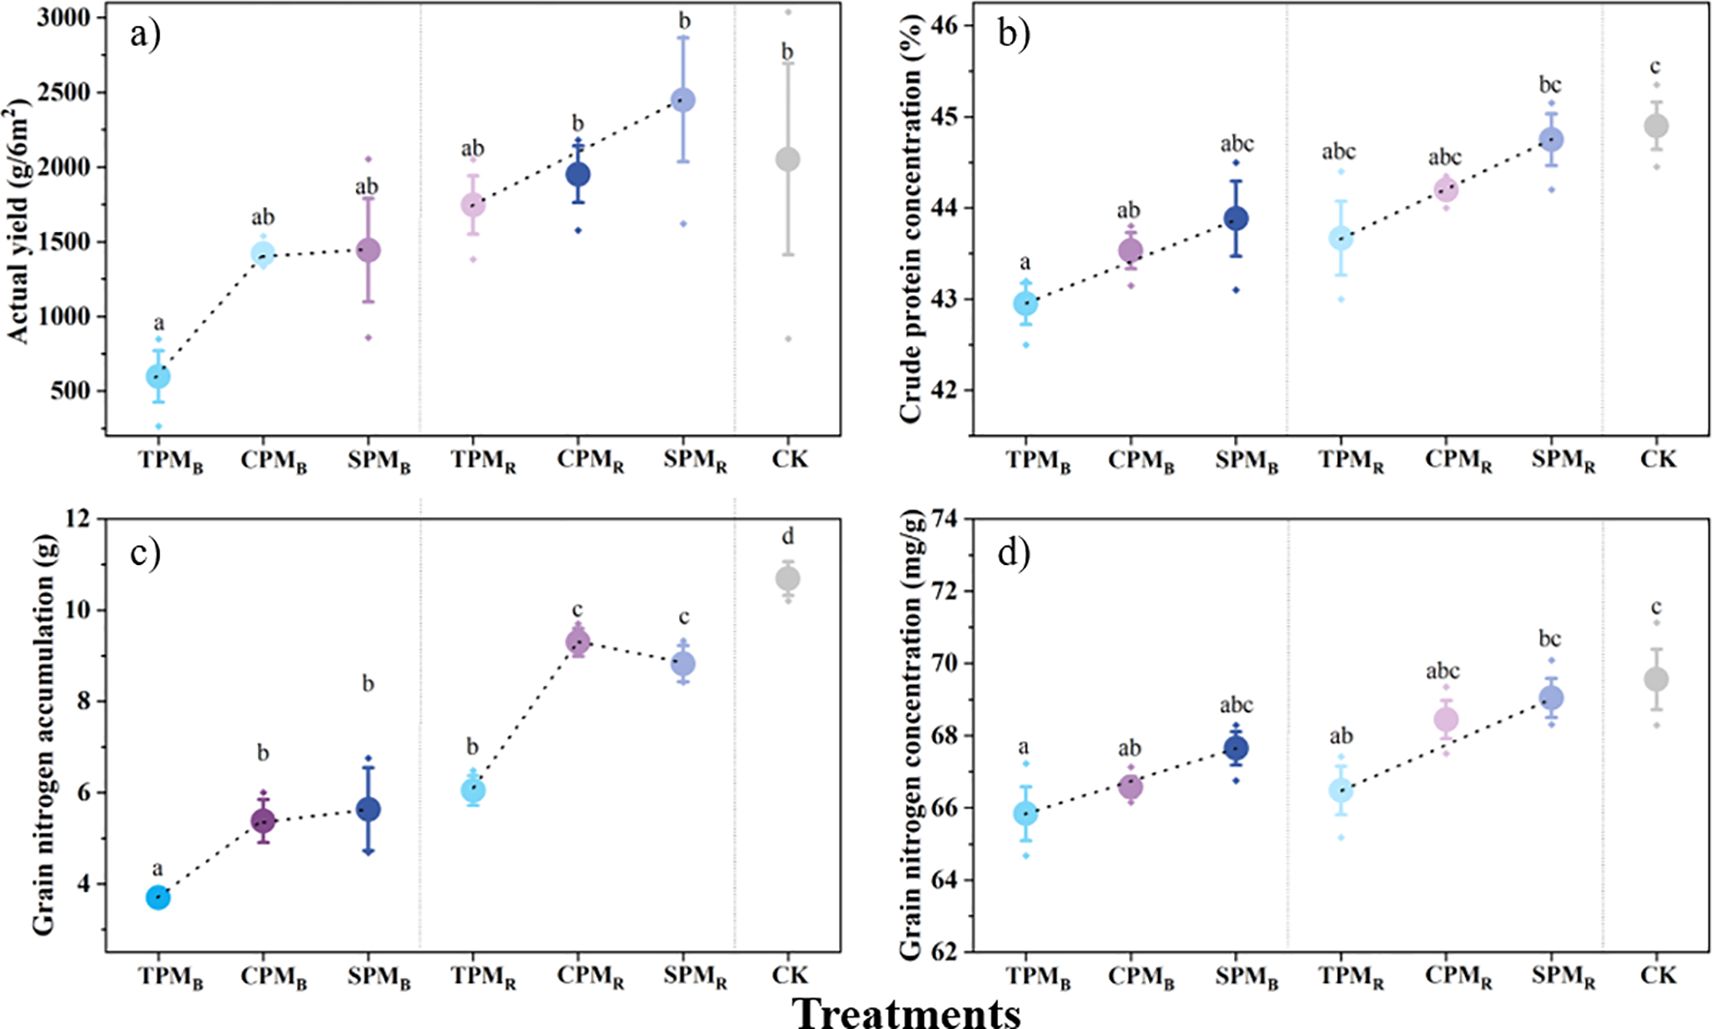
Figure 4. Grain yield and protein levels between treatments. In (a-d), TPM, CPM, SPM, and CK represent an ordinary photovoltaic panel, a checkerboard photovoltaic panel, a translucent photovoltaic panel (with a light transmittance of 40%), and a comparison with field treatment, respectively. B and R denote the positions directly below and rear of the photovoltaic panel, respectively. Different lowercase letters represent significant differences between treatments at the 5% level.
As illustrated in Figure 5, the growth dynamics of soybean grain nitrogen during the grain-filling stage exhibited consistency with the logistic model, and the simulated correlation coefficients were all greater than 0.87. As demonstrated in Table 1, the treatments, locations, and interaction of photovoltaic modules have substantial effects on the parameters of soybean grain accumulation. The maximum nitrogen accumulation potential (k) of grain exhibited a substantial response to treatments and locations. A comparison of treatments revealed that the k value of grain nitrogen accumulation under CPM and SPM treatment was significantly higher than that under TPM treatment. Moreover, the k value of grain nitrogen accumulation in rear photovoltaic treatment was found to be significantly higher than that observed in the below photovoltaic treatment. The maximum nitrogen absorption efficiency (Imax) reflected the maximum rate of grain nitrogen absorption, which was primarily influenced by the location of photovoltaic treatment. The Imax values of TPMR, CPMR, and SPMR exhibited a substantial increase of 117.16%, 16.82%, and 92.68%, respectively, compared to TPMB, CPMB, and SPMB. The t value of grain nitrogen accumulation in agrivoltaics is defined as the number of days required to reach the maximum accumulation rate. A substantial t value suggests that the process of nitrogen accumulation is inadequate. The t value of grain nitrogen accumulation under TPM treatment was significantly delayed in comparison with that under SPM treatment.
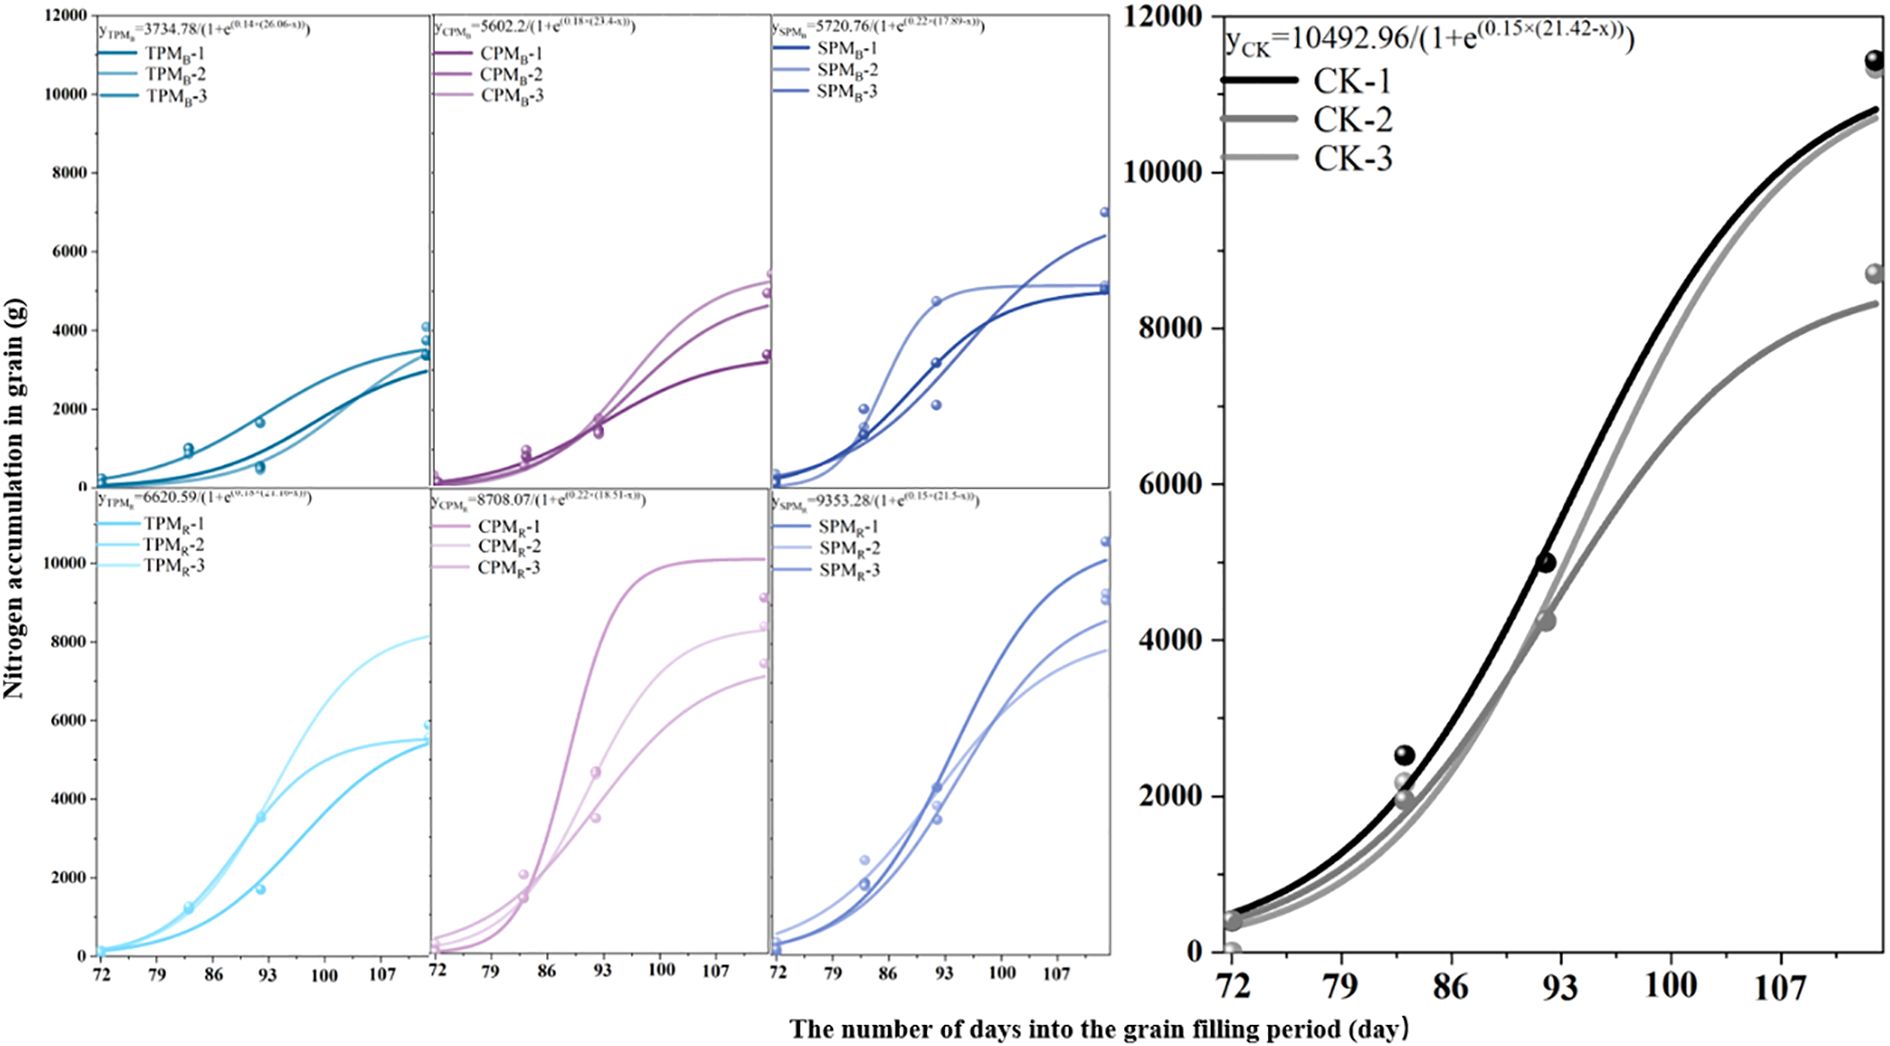
Figure 5. Grain nitrogen accumulation and its parameters. TPM, CPM, SPM, and CK represent an ordinary photovoltaic panel, a checkerboard photovoltaic panel, a translucent photovoltaic panel (with a light transmittance of 40%), and a comparison with field treatment, respectively. B and R represent the positions directly below and rear of the photovoltaic panel, respectively. The use of lowercase letters in Figures 2a, b denotes statistical significance at the 5% level among the various treatments. In Figure 2c, grain-1, grain-2, and grain-3 represent the three replicates of the same treatment, respectively. The equations were obtained by logistic simulation.
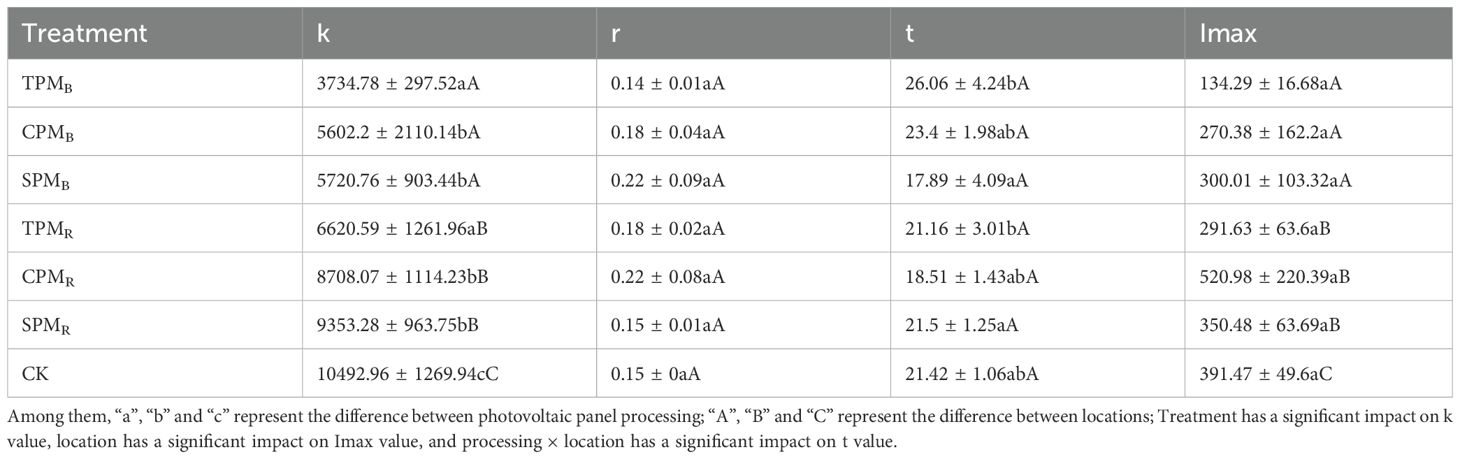
Table 1. Parameters of nitrogen accumulation in soybean seeds under photovoltaic treatment.
3.3 Analysis of the influence path of photovoltaic treatment on crude protein concentration
Following the implementation of agrivoltaics, a shift in the photosynthetic activity of plants was observed, which affected the nitrogen accumulation in grains. Gaju et al. (2014) proposed that grain nitrogen accumulation was affected by two paths of nitrogen re-mobilization after flowering and nitrogen accumulation before flowering. The present experiment demonstrated that the specific influence path of photovoltaic panel erection on soybean quality (Figure 6) was as follows: (1) Crude protein concentration was found to be influenced by the amount of leaf nitrogen transferred during the grain-filling stage. (2) The accumulation of nitrogen in leaves before the filling period affects the nitrogen absorption process of grains, and thereby influences the concentration of crude protein. The course of leaf nitrogen accumulation prior to the grain filling stage exhibits two divergent trajectories in grain nitrogen uptake. On the one hand, it exerts a positive influence on grain crude protein concentration by modulating the maximum potential of grain nitrogen accumulation. On the other hand, it hurts the grain crude protein concentration by influencing the maximum nitrogen accumulation efficiency. In contrast, the amount of stem nitrogen accumulation prior to the grain filling stage, as well as the amount of stem nitrogen transfer during the grain filling stage, exhibited no significant impact on the grain crude protein concentration.
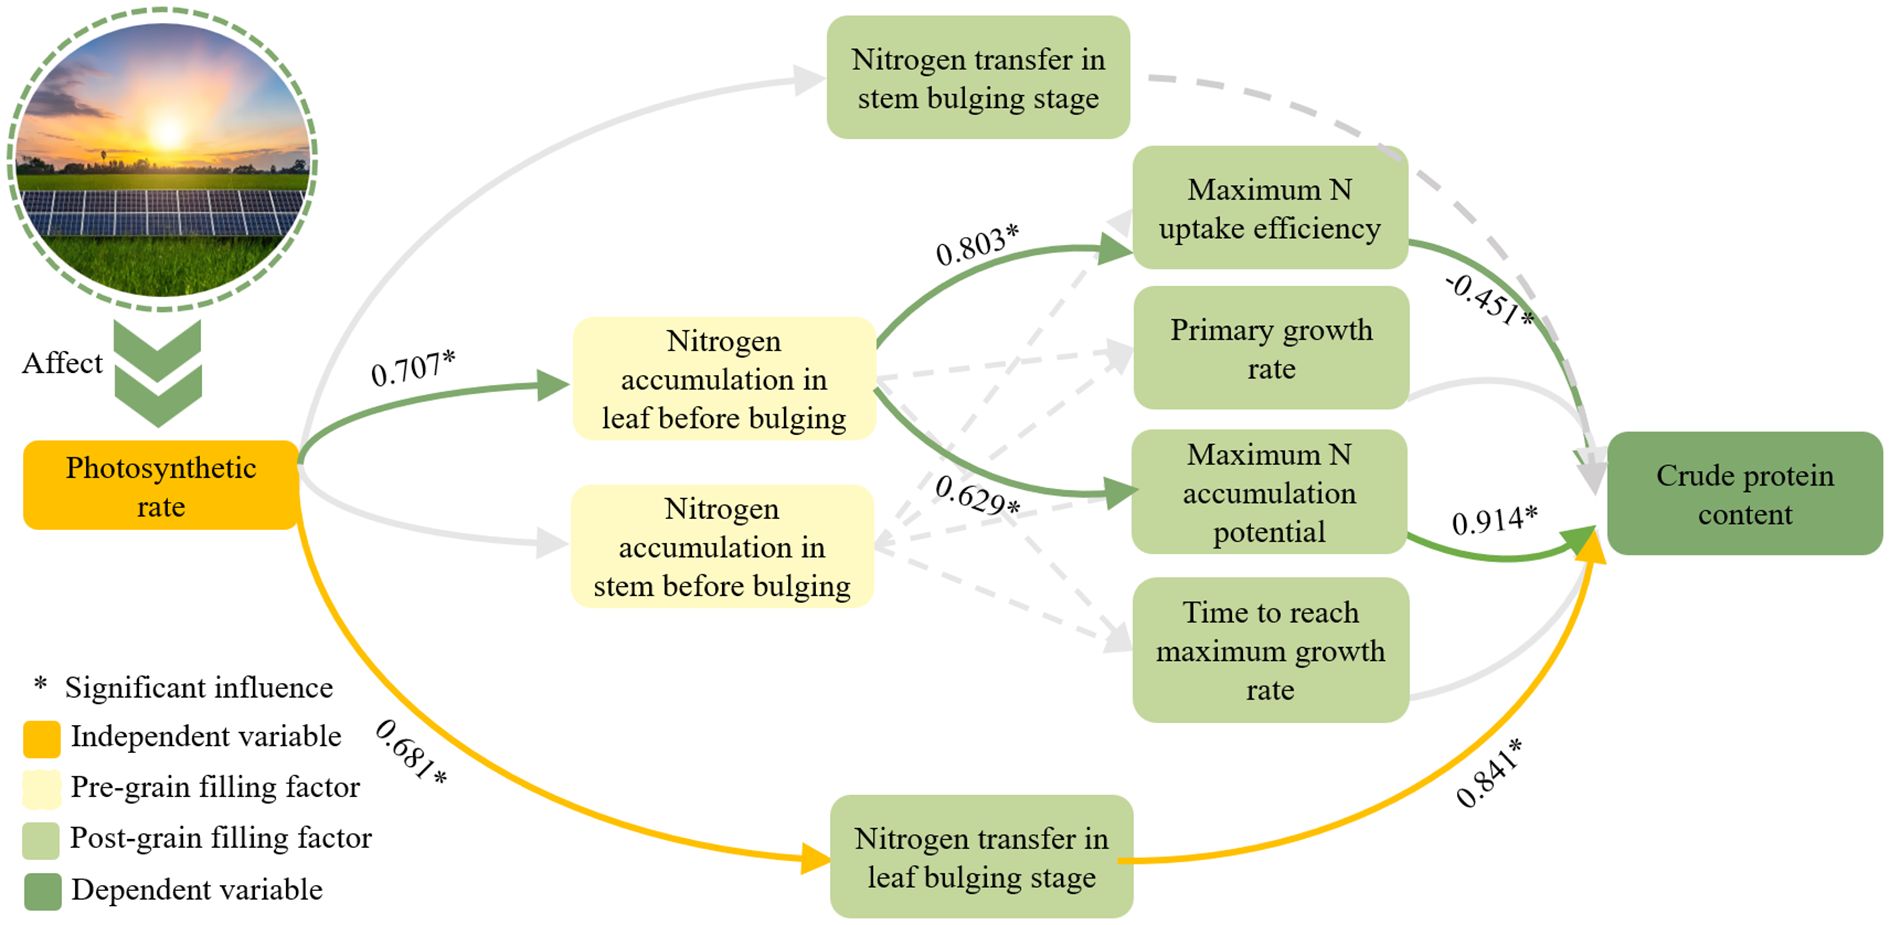
Figure 6. The influence path of grain crude protein concentration.
The net photosynthetic rate had a substantial positive impact on leaf nitrogen accumulation and transfer prior to the grain filling stage. The influencing factors were determined to be 0.707 and 0.681, respectively. Through path analysis, Path 1 was identified as the effect of leaf nitrogen accumulation on promoting grain nitrogen accumulation prior to the grain filling stage. This ultimately affected the crude protein of the grain. The effects of k value and Imax on crude protein concentration were found to be 0.914 and -0.451, respectively. Path 2 was that the nitrogen transfer of leaves would directly affect the crude protein concentration positively, with the influencing factor reaching 0.841. In general, the maximum nitrogen accumulation potential and the amount of nitrogen accumulated by leaves before the grain-filling stage had significant positive effects on crude protein. They were the key factors affecting the production of soybean protein.
Among them, the independent variable refers to the primary variable that affects the installation of agrivoltaics; the pre-grain filling factor refers to the factors that change in response to the independent variable before the soybean enters the grain filling stage. Post-grain filling factor, conversely, refers to the factors that change with the independent variable or pre-grain filling factor after the soybean enters the grain filling stage. The dependent variable is defined as the variable that is influenced by the aforementioned three variables. In this study, the primary focus is on the concentration of crude protein.
4 Discussion
In this study, soybean cultivation under photovoltaic modules showed no significant difference in leaf nitrogen accumulation between the SPMR treatment and the control. However, the TPMB, CPMB, and SPMB treatments exhibited a marked decline in leaf nitrogen concentration (Figure 3). These findings are consistent with previous studies on shading, which have reported that altered phytohormone levels can affect leaf development (Oritani, 1978; Hu et al., 2021), ultimately leading to reduced leaf nitrogen concentration and premature leaf abscission (Pons and Pearcy, 1994). Notably, translucent PV panels appear to mitigate nitrogen depletion in vegetative tissues, resulting in higher foliar nitrogen concentrations compared to traditional PV systems (Potenza et al., 2022b; Thompson et al., 2020). Since leaf and stem nitrogen dynamics directly influence soybean quality, these results underscore the importance of PV panel selection in agrivoltaic systems.
As shown in Figure 4, the SPMB and SPMR treatments did not significantly reduce crude protein concentration or nitrogen accumulation in soybeans. In contrast, other agrivoltaic treatments led to a decline in crude protein concentration. Specifically, the TPMB and CPMB treatments exhibited significant reductions in crude protein concentration by 4.34% and 3.04%, respectively, compared to the control. Similarly, nitrogen accumulation decreased substantially by 5.35% and 4.28% in these treatments. This effect may be linked to shading-induced inhibition of nitrogen translocation to grains, ultimately compromising soybean protein quality (Asanome and Ikeda, 2000). However, recent studies by Lu et al. (2024) and Zaky et al. (2024) suggest that while grain protein concentration may decrease under certain agrivoltaic conditions, strategic panel placement (e.g., behind photovoltaic modules) or the use of translucent panels can enhance light availability for crops, thereby maintaining grain quality.
Furthermore, we employed a Logistic model to analyze nitrogen accumulation dynamics in grains across different treatments. The SPMR treatment demonstrated the highest maximum nitrogen accumulation potential, reaching 9353.28 ± 963.75 mg (Table 1), consistent with findings by Li et al. (2008) and Pan et al. (2006). They found that lower reductions in solar radiation intensity corresponded to smaller decreases in grain nitrogen accumulation. Furthermore, the difference in treatment duration between SPMR and CK was merely 0.08 days. Previous studies have indicated that premature attainment of the maximum nitrogen accumulation rate in grains can shorten the crop growth period (Zhang et al., 2015), while a delayed reduction in the average nitrogen accumulation rate can also affect crop development (Giunta and Motzo, 2005). These results collectively indicate that SPMR exhibits superior nitrogen capture efficiency and demonstrates the best stability during nitrogen accumulation processes.
As illustrated in Figure 6, the Logistic model revealed a substantial impact of grain nitrogen accumulation parameters on crude protein concentration. Notably, the maximum grain nitrogen accumulation rate exhibited a significant negative correlation with crude protein concentration (-0.451). Pan et al. (2006) and Fabre and Planchon (2000) posited that the maximum rate of nitrogen accumulation exhibited a positive correlation with crude protein concentration. This is because Pan et al. regarded the rate of nitrogen accumulation as a constant value; thus, an elevated rate of nitrogen accumulation corresponded to an enhanced quality. In this study, the nitrogen accumulation rate was dynamic. The larger the maximum nitrogen accumulation rate is, the narrower the integral area consisting of the rate will be. This phenomenon resulted in a reduction in both grain nitrogen accumulation and crude protein concentration (Imsande, 1992; Nehe et al., 2020). A significant positive correlation was identified between maximum nitrogen accumulation potential and crude protein concentration (r = 0.914). One potential explanation for this phenomenon is that the source restriction of reduced photosynthesis hindered the transport of nitrogen from vegetative organs to grains (Gao et al., 2020), thereby reducing the potential for nitrogen accumulation in grains and consequently affecting the quality of soybeans (Makino, 2011). The leaf nitrogen transfer during the grain-filling stage exhibited a significant positive correlation with crude protein concentration (r = 0.841). In contrast, no significant correlation was observed between stem nitrogen transfer and crude protein concentration (Figure 6). This phenomenon can be attributed to the fact that leaves and roots serve as primary nitrogen sinks during the vegetative development stage (Masclaux-Daubresse et al., 2010) and therefore contain higher levels of nitrogen. During the grain filling stage, nitrogen from the leaves is translocated to the grains (Mikesell and Paulsen, 1971), thereby limiting grain protein synthesis due to the depletion of the leaf nitrogen pool (Barneix and Guitman, 1993). Consequently, to prioritize the expansion of leaf area, the allocation of nitrogen to stems and other structures is decreased (Gastal and Lemaire, 2002). Therefore, nitrogen transfer in the stem was lower than that in the leaf, and was not strongly correlated with crude protein concentration.
Leaf nitrogen accumulation prior to the grain-filling stage, the amount of leaf nitrogen transferred, and grain nitrogen accumulation potential during the grain-filling stage had significant positive effects on crude protein concentration. Sarakhsi et al. (2010) suggested that the application of foliar fertilizers could enhance leaf nitrogen accumulation. Furthermore, Zakeri et al. (2015) proposed that utilizing available nitrogen during the grain nitrogen absorption process could promote nitrogen accumulation in grains, thereby increasing the potential for nitrogen accumulation. Based on the existing literature, it can be inferred that under agrivoltaics installation conditions, the judicious application of foliar fertilizer prior to the grain filling stage and the utilization of available nitrogen during this stage may mitigate the adverse effects of agrivoltaics installations on soybean quality.
5 Conclusion
This study elucidates the effects of agrivoltaics systems on crop quality and nutrient accumulation processes in the field. Through experiments, Experimental results reveal a continuous and quantitative pathway of agrivoltaics affecting crude protein concentration. The reduction in solar irradiance within agrivoltaics systems impacted leaf nitrogen accumulation and transfer prior to the grain filling stage, consequently decreased in crude protein concentration. These findings enhance our understanding of grain quality variations under agrivoltaic conditions. During the implementation of agrivoltaic systems, foliar fertilizer application can enhance leaf nitrogen accumulation, thereby mitigating potential adverse effects on soybean quality. Moreover, the treatment involving translucent photovoltaic panels installed at the rear position exhibited the maximum nitrogen accumulation rate and total nitrogen accumulation most similar to those of the control treatment. The influence of solar radiation intensity on crude protein concentration became negligible in this configuration, highlighting the potential application of translucent photovoltaic panels in agrivoltaic systems. Under field conditions, these panels can help preserve soybean protein quality and provide innovative strategies for climate change adaptation.
Data availability statement
The data analyzed in this study is subject to the following licenses/restrictions: Readers can request the data by contacting the author. Requests to access these datasets should be directed to ODIxMDEyMjIwMDNAY2Fhcy5jbg==.
Author contributions
YH: Conceptualization, Data curation, Formal Analysis, Methodology, Writing – original draft. XZ: Conceptualization, Writing – review & editing. XM: Conceptualization, Writing – review & editing, Investigation.
Funding
The author(s) declare financial support was received for the research and/or publication of this article. The authors gratefully thank the financial support provided by the National Natural Science Foundation of China (Nos.32271638 and 32171561), the National Key R&D Program of China (No. 2023YFF0805904), Central Public-interest Scientific Institution Basal Research Fund (No. BSRF202502), and the Low Carbon Science Center of the Agricultural Science and Technology Innovation Program (ASTIP—CAAS).
Conflict of interest
The authors declare that the research was conducted in the absence of any commercial or financial relationships that could be construed as a potential conflict of interest.
Generative AI statement
The author(s) declare that no Generative AI was used in the creation of this manuscript.
Any alternative text (alt text) provided alongside figures in this article has been generated by Frontiers with the support of artificial intelligence and reasonable efforts have been made to ensure accuracy, including review by the authors wherever possible. If you identify any issues, please contact us.
Publisher’s note
All claims expressed in this article are solely those of the authors and do not necessarily represent those of their affiliated organizations, or those of the publisher, the editors and the reviewers. Any product that may be evaluated in this article, or claim that may be made by its manufacturer, is not guaranteed or endorsed by the publisher.
References
Archontoulis, S. V. and Miguez, F. E. (2015). Nonlinear regression models and applications in agricultural research. Agron. J. 107, 786–798. doi: 10.2134/agronj2012.0506
Asanome, N. and Ikeda, T. (2000). Effect of light interception difference in soybean canopy on leaf nitrogen concentration, nitrogen accumulation and nitrogen partitioning into pod. Japanese J. Crop Sci. 69, 201–208. doi: 10.1626/jcs.69.201
Barneix, A. J. and Guitman, M. R. (1993). Leaf regulation of the nitrogen concentration in the grain of wheat plants. J. Exp. Bot. 44 (10), 1607–1612.
China Meteorological Administration. (2023). The World Meteorological Organization released the "Greenhouse Gas Bulletin" : United Nations News Network. Available online at:https://www.cma.gov.cn/ztbd/2023zt/20231201/2023120103/202312/t20231201_5923213.html (Accessed August 15, 2023).
Choi, C. S., Macknick, J., Li, Y., Bloom, D., McCall, J., and Ravi, S. (2023). Environmental co-benefits of maintaining native vegetation with solar photovoltaic infrastructure. Earth’s Future 11, e2023EF003542. doi: 10.1029/2023EF003542
Cuppari, R. I., Higgins, C. W., and Characklis, G. W. (2021). Agrivoltaics and weather risk: A diversification strategy for landowners. Appl. Energy 291, 116809. doi: 10.1016/j.apenergy.2021.116809
Damgaard, C., Weiner, J., and Nagashima, H. (2002). Modelling individual growth and competition in plant populations: growth curves of Chenopodium album at two densities. J. Ecol. 90, 666–671. doi: 10.1046/j.1365-2745.2002.00700.x
Dupraz, C., Marrou, H., Talbot, G., Dufour, L., Nogier, A., and Ferard, Y. (2011). Combining solar photovoltaic panels and food crops for optimising land use: Towards new agrivoltaic schemes. Renewable Energy 36, 2725–2732. doi: 10.1016/j.renene.2011.03.005
Fabre, F. and Planchon, C. (2000). Nitrogen nutrition, yield and protein content in soybean. Plant Science 152 (1), 51–58.
Gaju, O., Allard, V., Martre, P., Le Gouis, J., Moreau, D., Bogard, M., et al. (2014). Nitrogen partitioning and remobilization in relation to leaf senescence, grain yield and grain nitrogen concentration in wheat cultivars. Field Crops Res. 155, 213–223. doi: 10.1016/j.fcr.2013.09.003
Gao, J., Liu, Z., Zhao, B., Dong, S., Liu, P., and Zhang, J. (2020). Shade stress decreased maize grain yield, dry matter, and nitrogen accumulation. Agron. J. 112 (4), 2768–2776.
Gastal, F. and Lemaire, G. (2002). N uptake and distribution in crops: an agronomical and ecophysiological perspective. J. Exp. Bot. 53 (370), 789–799.
Giunta, F. and Motzo, R. (2005). Grain yield, dry matter, and nitrogen accumulation in the grains of durum wheat and spring triticale cultivars grown in a Mediterranean environment. Aust. J. Agric. Res. 56, 25–32. doi: 10.1071/AR04125
Hu, Y., Zhang, X., and Ma, X. (2024). Agrivoltaics with semitransparent panels can maintain yield and quality in soybean production. Solar Energy 282, 112978. doi: 10.1016/j.solener.2024.112978
Hu, J., Yu, H., Li, Y., Wang, J., Lv, T., Liu, C., et al. (2021). Variation in resource allocation strategies and environmental driving factors for different life-forms of aquatic plants in cold temperate zones. J. Ecol. 109, 3046–3059. doi: 10.1111/1365-2745.13719
Imsande, J. (1992). Agronomic characteristics that identify high yield, high protein soybean genotypes. Agron. J. 84 (3), 409–414.
Jahangirlou, M. R., Morel, J., Akbari, G. A., Alahdadi, I., Soufizadeh, S., and Parsons, D. (2023). Combined use of APSIM and logistic regression models to predict the quality characteristics of maize grain. Eur. J. Agron. 142, 126629. doi: 10.1016/j.eja.2022.126629
Jane, S. A., Fernandes, F. A., Silva, E. M., Muniz, J. A., Fernandes, T. J., and Pimentel, G. V. (2020). Adjusting the growth curve of sugarcane varieties using nonlinear models. Ciec. Rural 50, e20190408. doi: 10.1590/0103-8478cr20190408
Kim, S., Kim, S., and Yoon, C. Y. (2021). An efficient structure of an agrophotovoltaic system in a temperate climate region. Agronomy 11, 1584. doi: 10.3390/agronomy11081584
Kim, S. and Kim, S. (2023). Optimization of the design of an agrophotovoltaic system in future climate conditions in South Korea. Renewable Energy, 206, 928–938
Lee, H. J., Park, H. H., Kim, Y. O., and Kuk, Y. I. (2022). Crop cultivation underneath agro-photovoltaic systems and its effects on crop growth, yield, and photosynthetic efficiency. Agronomy 12, 1842. doi: 10.3390/agronomy12081842
Li, Y., Horsman, M., Wang, B., Wu, N., and Lan, C. Q. (2008). Effects of nitrogen sources on cell growth and lipid accumulation of green alga Neochloris oleoabundans. Appl. Microbiol. Biotechnol. 81, 629–636. doi: 10.1007/s00253-008-1681-1
Lu, S. M., Zainali, S., Zidane, T. E. K., Hörndahl, T., Tekie, S., Khosravi, A., et al. (2024). Data on the effects of a vertical agrivoltaic system on crop yield and nutrient concentration of barley (Hordeum vulgare L.) in Sweden. Data Brief, 110990. doi: 10.1016/j.dib.2024.110990
Makino, A. (2011). Photosynthesis, grain yield, and nitrogen utilization in rice and wheat. Plant Physiol. 155 (1), 125–129.
Masclaux-Daubresse, C., Daniel-Vedele, F., Dechorgnat, J., Chardon, F., Gaufichon, L., and Suzuki, A. (2010). Nitrogen uptake, assimilation and remobilization in plants: challenges for sustainable and productive agriculture. Ann. Bot. 105, 1141–1157.
Mikesell, M. E. and Paulsen, G. M. (1971). Nitrogen translocation and the role of individual leaves in protein accumulation in wheat grain 1. Crop Science 11 (6), 919–922.
Moustakas, N. K., Akoumianakis, K. A., and Passam, H. C. (2011). Patterns of dry biomass accumulation and nutrient uptake by okra (‘abelmoschus esculentus’(L.) Moench.) Under different rates of nitrogen application. Aust. J. Crop Sci. 5, 993–1000.
Nehe, A. S., Misra, S., Murchie, E. H., Chinnathambi, K., Tyagi, B. S., Foulkes, M. J., et al. (2020). Nitrogen partitioning and remobilization in relation to leaf senescence, grain yield and protein concentration in Indian wheat cultivars. Field Crops Research 251, 107778.
Oritani, T. (1978). Studies on Nitrogen Metabolism in Crop Plants XV. The effects of light intensity and TIBA on the photosynthetic capacity and nitrogen metabolism in the two contrasting varieties of soybean plants. Japanese J. Crop Sci. 47, 124–132. doi: 10.1626/jcs.47.124
Paine, C. T., Marthews, T. R., Vogt, D. R., Purves, D., Rees, M., Hector, A., et al. (2012). How to fit nonlinear plant growth models and calculate growth rates: an update for ecologists. Methods Ecol. Evol. 3, 245–256. doi: 10.1111/j.2041-210X.2011.00155.x
Pan, J., Zhu, Y., Jiang, D., Dai, T., Li, Y., and Cao, W. (2006). Modeling plant nitrogen uptake and grain nitrogen accumulation in wheat. Field Crops Res. 97, 322–336. doi: 10.1016/j.fcr.2005.11.006
Pascaris, A. S., Schelly, C., Burnham, L., and Pearce, J. M. (2021). Integrating solar energy with agriculture: Industry perspectives on the market, community, and socio-political dimensions of agrivoltaics. Energy Res. Soc. Sci. 75, 102023. doi: 10.1016/j.erss.2021.102023
Pons, T. L. and Pearcy, R. W. (1994). Nitrogen reallocation and photosynthetic acclimation in response to partial shading in soybean plants. Physiologia Plantarum 92, 636–644. doi: 10.1111/j.1399-3054.1994.tb03034.x
Potenza, E., Colauzzi, M., and Amaducci, S. (2022a). “A case study of soybean (Glycine max L.) under agrivoltaic system and modelling simulation,” in AgriVoltaics Conference Proceedings, Vol. 1.
Potenza, E., Croci, M., Colauzzi, M., and Amaducci, S. (2022b). Agrivoltaic system and modelling simulation: a case study of soybean (Glycine max L.) in Italy. Horticulturae 8 (12), 1160. doi: 10.3390/horticulturae8121160
Ravi, S., Macknick, J., Lobell, D., Field, C., Ganesan, K., Jain, R., et al. (2016). Colocation opportunities for large solar infrastructures and agriculture in drylands. Appl. Energy 165, 383–392. doi: 10.1016/j.apenergy.2015.12.078
Sarakhsi, H. S., Yarnia, M., and Amirniya, R. (2010). Effect of nitrogen foliar application in different concentration and growth stage of corn (Hybrid 704). Adv. Environ. Biol., 291–299.
Thompson, E. P., Bombelli, E. L., Shubham, S., Watson, H., Everard, A., D’Ardes, V., et al. (2020). Tinted semi-transparent solar panels allow concurrent production of crops and electricity on the same cropland. Advanced Energy Materials 10, 2001189. doi: 10.1002/aenm.202001189
Walston, L. J., Barley, T., Bhandari, I., Campbell, B., McCall, J., Hartmann, H. M., et al. (2022). Opportunities for agrivoltaic systems to achieve synergistic food-energy-environmental needs and address sustainability goals. Front. Sustain. Food Syst. 6, 932018. doi: 10.3389/fsufs.2022.932018
Wang, R., Sun, Z., Yang, D., and Ma, L. (2022). Simulating cucumber plant heights using optimized growth functions driven by water and accumulated temperature in a solar greenhouse. Agric. Water Manage. 259, 107170. doi: 10.1016/j.agwat.2021.107170
Wang, X., Zhang, R., Li, S., Xu, N., Mu, Y., and Zhang, C. (2019). Simulation of dry matter accumulation and nitrogen absorption in a maize/soybean intercropping system supplied with different nitrogen levels. Chin. J. Eco-Agriculture 27, 1354–1363. doi: 10.13930/j.cnki.cjea.190075
Williams, H. J., Hashad, K., Wang, H., and Zhang, K. M. (2023). The potential for agrivoltaics to enhance solar farm cooling. Appl. Energy 332, 120478. doi: 10.1016/j.apenergy.2022.120478
Yao, Y., Jin, X., Di, W., Ge, H., Ma, C., and Gong, Z (2011). Regularity of nitrogen accumulation in soybean and its simulation. J. Northeast Agric. Univ. (English Edition) 18, 1–5. doi: 10.1016/S1006-8104(13)60075-6
Zakeri, H. and Bueckert, R. (2015). Post‐flowering biomass and nitrogen accumulation of lentil substantially contributes to pod production. Crop Science 55 (1), 411–419.
Zaky, M., Abd-El Wanis, M., Medany, M., and Radwan, G. (2024). Effect of integrating photovoltaic panels with greenhouses for energy production on greenhouse microclimate, and cucumber growth and production in the greenhouse. Research Square. doi: 10.21203/rs.3.rs-4952434/v1
Keywords: agrivoltaics, soybean protein, critical pathways, nitrogen, logistic model
Citation: Hu Y, Zhang X and Ma X (2025) The influencing pathway of agrivoltaics on soybean protein concentration. Front. Plant Sci. 16:1618027. doi: 10.3389/fpls.2025.1618027
Received: 25 April 2025; Accepted: 30 July 2025;
Published: 02 September 2025.
Edited by:
Junfei Gu, Yangzhou University, ChinaReviewed by:
Zina Flagella, University of Foggia, ItalyRobert C. Abaidoo, Kwame Nkrumah University of Science and Technology, Ghana
Kailou Liu, Jiangxi Institute of Red Soil, China
Copyright © 2025 Hu, Zhang and Ma. This is an open-access article distributed under the terms of the Creative Commons Attribution License (CC BY). The use, distribution or reproduction in other forums is permitted, provided the original author(s) and the copyright owner(s) are credited and that the original publication in this journal is cited, in accordance with accepted academic practice. No use, distribution or reproduction is permitted which does not comply with these terms.
*Correspondence: Xueyan Zhang, eHl6aGFuZ0BpZ3NucnIuYWMuY24=