 Feng Qin1,2†
 Yuyong Chen
 Jingui Li
 Shanyuan Zhu
- 1Jiangsu Key Laboratory for High-Tech Research and Development of Veterinary Biopharmaceuticals, Engineering Technology Research Center for Modern Animal Science and Novel Veterinary Pharmaceutic Development, Jiangsu Agri-Animal Husbandry Vocational College, Taizhou, Jiangsu, China
- 2College of Veterinary Medicine, Yangzhou University, Yangzhou, Jiangsu, China
- 3College of Food Science and Technology, Jiangsu Agri-animal Husbandry Vocational College, Taizhou, Jiangsu, China
- 4College of Animal Pharmaceutical, Jiangsu Agri-animal Husbandry Vocational College, Taizhou, Jiangsu, China
Introduction: This study aimed to (1) establish a broadly targeted metabolomics workflow to evaluate batch-to-batch variability in Panax notoginseng-derived Panax notoginseng stem/leaf-derived oral liquid (LSPN) preparations, (2) identify critical process-induced metabolite differences (e.g., saponin degradation products), and (3) correlate these differences with pharmacopoeial quality markers (e.g., Rg1/Rb1 ratios).
Methods: Our hypothesis was that thermal extraction parameters would significantly alter saponin profiles, detectable via orthogonal metabolomic approaches (HPLC-MS/MS, PCA).
Results: The results showed a strong positive correlation (pearson correlation coefficient >0.92) between triterpenoid saponins in LSPN-S and LSPN-C. Thirty-eight triterpenoid saponins were detected, of which 11 were up-regulated, 5 were down-regulated, and the other 22 had less than a two-fold difference in content. Ginsenoside Rb3 showed a modest but significant downregulation in LSPN-S (fold change = 0.45, VIP = 1.11) compared with LSPN-C.
Discussion: Metabolomic analysis confirmed the suitability of the selected Panax notoginseng stems/leaves as raw materials, with comprehensive characterization of LSPN’s primary components.
1 Introduction
Panax notoginseng (Burk.) F. H. Chen stems and leaves are the dried stems and leaves of Panax notoginseng (Burk.) F. H. Chen in the Araliaceae family. “Compendium of Materia Medica”records that its effects are similar to those of the root, and has anti-depressant, anti-anxiety, analgesic, anti-inflammatory, anti-aging, regulating blood lipids, and protecting cardiovascular and cerebrovascular effects (Li et al., 2022a), and the immune-enhancing effects of Panax quinquefolium root have been widely demonstrated. Panax pseudoginseng stem and leaves are the by-products of the processing of Panax pseudoginseng, with a total annual output of about 2,500 tons, at a relatively low cost, rich in saponin compounds, with a total saponin content of about 8.53%; however, the utilization rate of Panax pseudoginseng stem and leaves is only about 5%. Based on the principle of “turning waste into treasure”, Panax pseudoginseng stem and leaves were selected as the object of study in the present study, and the Panax notoginseng stem/leaf oral liquid (LSPN) was prepared by using a pre-existing chitosan removal process, which was based on the principle of “turning waste into treasure”. The LSPN was prepared by using the pre-chitosan removal process (Zhang et al., 2020). In order to further identify whether the selected Panax notoginseng stems and leaves are suitable for use as raw medicinal materials for LSPN and analyze the main components of LSPN, a comparative study on the ingredients of Panax notoginseng stems and leaves is needed.
Plant metabolomics can characterize and quantify small molecule compounds in plant samples. Mass spectrometry and nuclear magnetic resonance are the main tools. In particular, mass spectrometry technology has the advantages of wide linear range, low cost, and high sensitivity (Xiao et al., 2024). A self-built database, MWDB (metware database), was used to qualitatively analyze the substances based on secondary spectra, and quantitatively analyze the substances using multiple reaction monitoring (MRM) mode (Liu et al., 2022). In the MRM model, the parent ion (precursor ion) of the target component is screened out first, the precursor ion ionizes and breaks off, and the resulting fragment ion passes through the triple quadruple quadruple bar again, selecting a characteristic fragment ion quantitatively (Li et al., 2018). After analyzing the metabolite mass spectrometry data of different samples, the peak areas of the mass spectrum peaks of all substances are integrated, and the mass spectrum peaks of the same metabolite in different samples are integrated and corrected (Li and Li, 2020).
While metabolomics has been applied to Panax species (Bi-lian, 2013; Chen et al., 2013; Chen et al., 2019), no studies have systematically linked LSPN production variability to metabolomic signatures under standardized quality frameworks. Here, we test the hypothesis that batch-specific processing conditions (e.g., temperature) drive quantifiable differences in saponin profiles, which may compromise consistency in bioactivity. Using a tripartite analytical strategy—(i) untargeted metabolomics for discovery, (ii) targeted quantification of 20 key saponins, and (iii) bioactivity prediction via network pharmacology—we address three measurable outcomes: PCA clustering of LSPN-C vs. LSPN-S (acceptance threshold: >80% variance explained);≥2-fold changes in thermally labile saponins (e.g., Rg3, p < 0.01);Spearman’s rank (ρ > 0.7) between HPLC fingerprints and in vitro antiplatelet activity. In order to identify the main components of LSPN and explore the quality of oral liquid prepared from several selected batches of medicinal materials, this study intends to prepare different batches of LSPN based on the optimal process of preliminary screening, and compare it with the LSPN prepared from the reference medicinal materials according to the above process. Compare, analyze the differences in their ingredients, and comprehensively determine their quality (Figure 1).
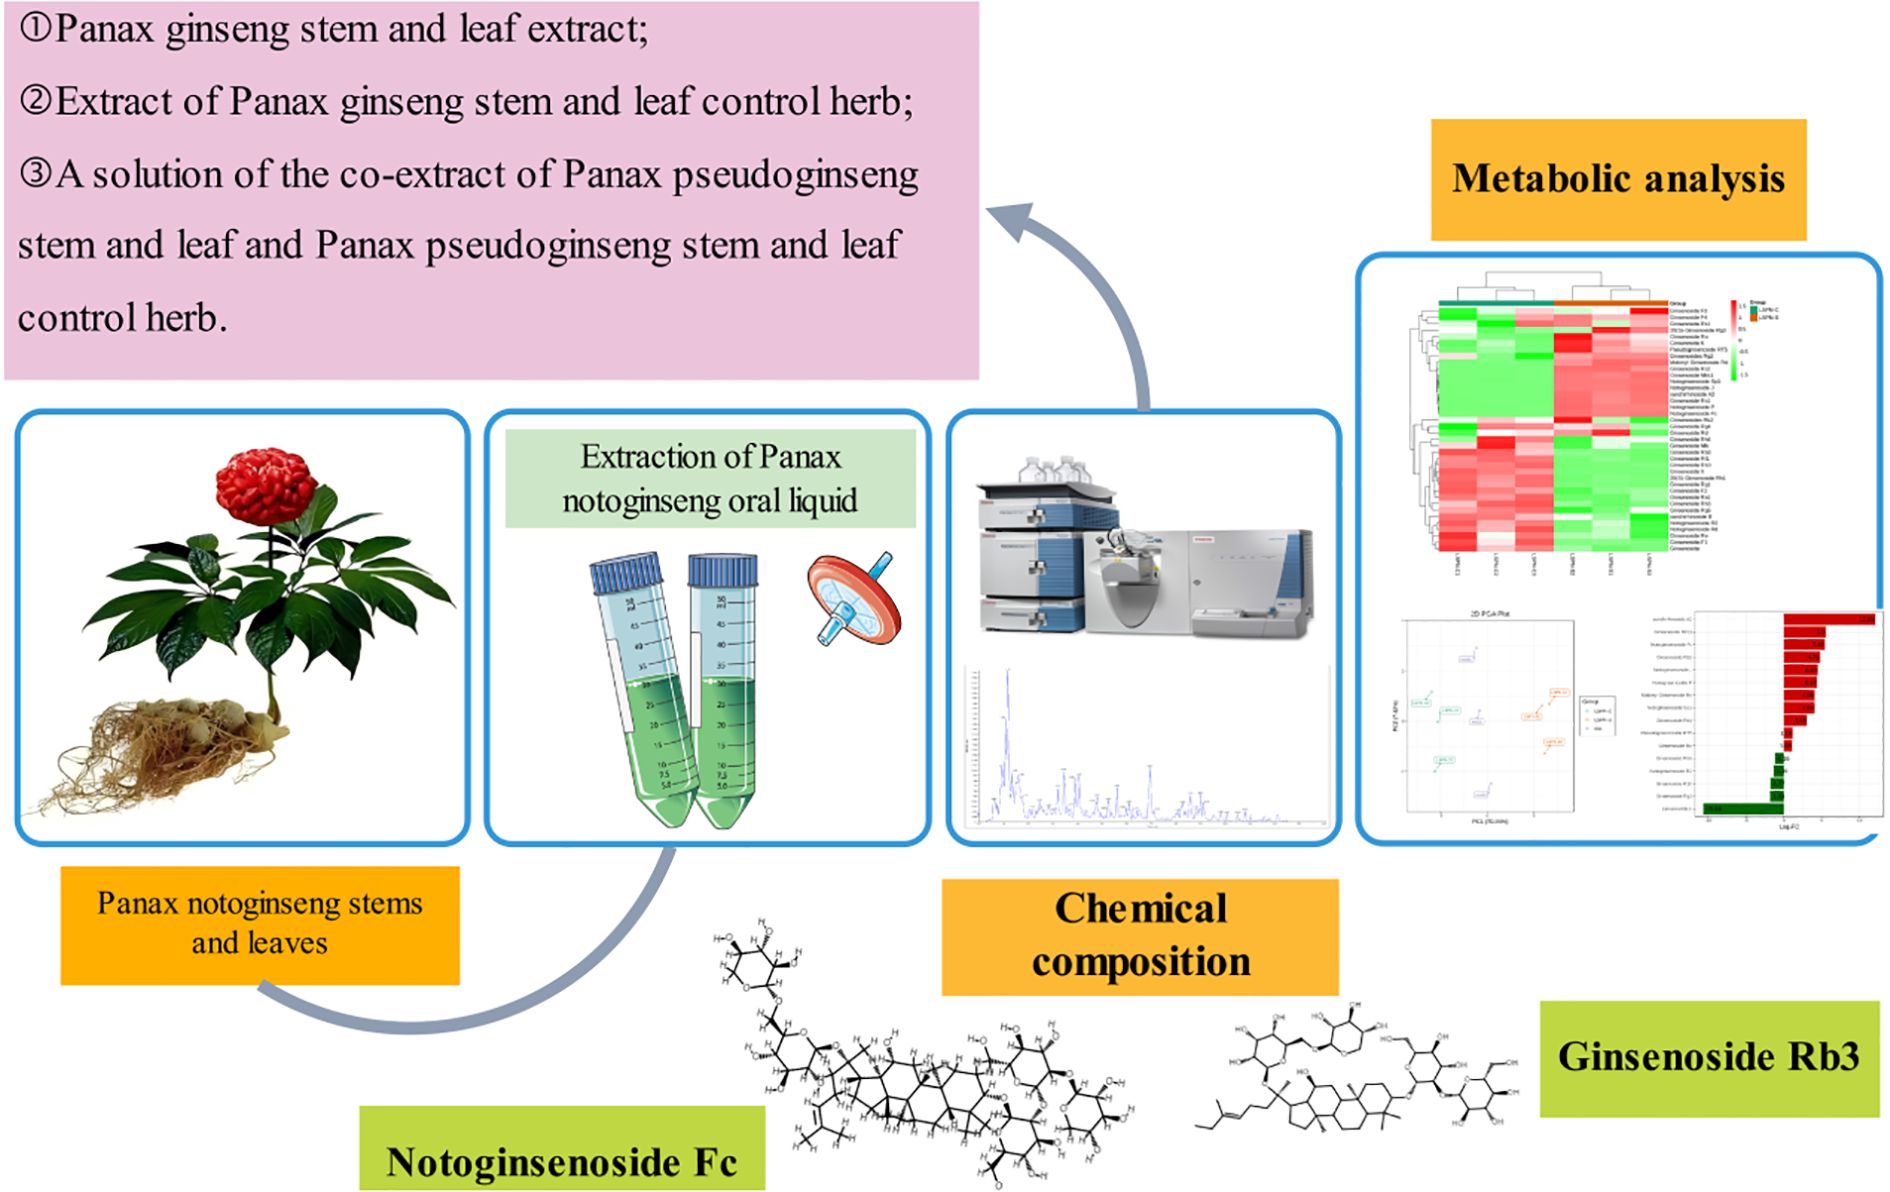
Figure 1. The overall flow chart of this study.
2 Materials and methods
2.1 Standards and reagents
Methanol, acetonitrile and ethanol were chromatographically pure and purchased from Merck; the internal standard substance: 2-chlorophenylalanine (batch no.: LBCOR15) with 98% purity was purchased from BioBioPha/Sigma-Aldrich; Panax ginseng stem and leaf control herbs (batch nos.: FY20170112, FYD100801, FYD100702) were purchased from Nantong Feiyu Biotechnology Co. Ltd; Panax pseudoginseng stem/leaf medicinal materials, purchased from Yunnan Wenshan Panax pseudoginseng Research Institute.
For metabolomic profiling, all LSPN batches were analyzed using a Waters ACQUITY UPLC system coupled with a Xevo G2-XS QTOF mass spectrometer (positive/negative ESI mode; capillary voltage: 3.0 kV; desolvation gas flow: 800 L/h).
LSPN-C (control) and LSPN-S (experimental) samples were derived from distinct production batches with documented variations in critical processing parameters (e.g., extraction temperature: 70°Cvs. 90°C; duration: 2 h vs. 3 h). These batches were selected based on: (i) Significant differences in total saponin content (HPLC quantification, p < 0.05, ≥5% variation);(ii) Non-superimposable HPLC fingerprints (cosine similarity score <0.90), and (iii) Compliance with the Chinese Pharmacopoeia (2020 Edition) limits for notoginsenoside R1, ginsenoside Rg1, and Rb1 (Zheng et al., 2022). This grouping strategy aligns with industry standards for assessing batch-to-batch variability in herbal preparations (Szijj and Chudasama, 2021).
Regarding the sample size (n=3), it is important to clarify that each ‘n’ represents an independent biological replicate (a distinct production batch), not a technical replicate. In metabolomics studies, where the primary objective is to uncover systematic patterns and trends across different groups rather than comparing means between small groups, a sample size of 3–6 per group is common and accepted, especially when coupled with robust multivariate statistical models (like OPLS-DA) that are powerful in handling such data structures. While we acknowledge that a larger sample size would provide greater statistical power, the observed large fold changes (e.g., >20-fold for some saponins) and excellent model validation parameters (Q² = 0.995) provide high confidence that the differences we report are biologically significant and not due to random chance.
2.2 LC conditions
The chromatographic separation was performed using an ACQUITY UPLC HSS T3 column (2.1 × 100 mm, 1.8 μm) maintained at 40 °C. The mobile phase consisted of 0.1% formic acid in water (A) and 0.1% formic acid in acetonitrile (B), delivered at a constant flow rate of 0.35 mL/min. The gradient program started at 5% B, increased linearly to 30% B over 2 min, then to 60% B by 10 min, followed by a rapid increase to 95% B at 12 min (held for 2 min), before re-equilibrating at 5% B for 2 min. The injection volume was 2 μL.
2.3 MS/MS conditions
Mass spectrometric detection was performed using electrospray ionization (ESI) in positive/negative switching mode. The ion source parameters were optimized as follows: ion spray voltage +5500 V (positive) and -4500 V (negative), source temperature 550 °C, with gas flows of 50 psi (GS1), 60 psi (GS2), and 30 psi (CUR). For each saponin, specific multiple reaction monitoring (MRM) transitions were established after optimization of collision energy (CE) and declustering potential (DP). Key examples include Ginsenoside Rb1 (1131.6→365.2 m/z, CE 40 V, DP 120 V), Ginsenoside Rg1 (823.5→643.4 m/z, CE 35 V, DP 110 V), and Notoginsenoside R1 (954.5→789.4 m/z, CE 45 V, DP 130 V). The complete list of optimized MRM transitions for all 38 saponins is provided in Supplementary Materials.
2.4 Quality control and validation
System suitability was monitored by injecting pooled QC samples every 10 runs, with acceptance criteria of <0.5% RSD for retention time and <15% RSD for peak area. Sensitivity was determined through serial dilution, establishing limits of detection (LOD, S/N ≥3) and quantification (LOQ, S/N ≥10) for each analyte.
2.5 Sample group preparation
Sample numbers and groupings for this experiment are shown in Table 1. Thaw the sample at -80 °Cand vortex for 10 s to mix. 100 uL of the mixed sample was taken and 100 uL of 70% methanol internal (Preliminary tests showing optimal saponin recovery; compatibility with our LC-MS/MS system; Consistency with Chinese Pharmacopoeia (2020) methods for similar compounds) standard extract was added. After vortexing for 3 min, the sample was centrifuged for 10 min (12000 r-min-1, 4 °C). The supernatant was filtered through a microporous membrane (0.22 μm) and stored in the injection bottle for LC-MS/MS detection.
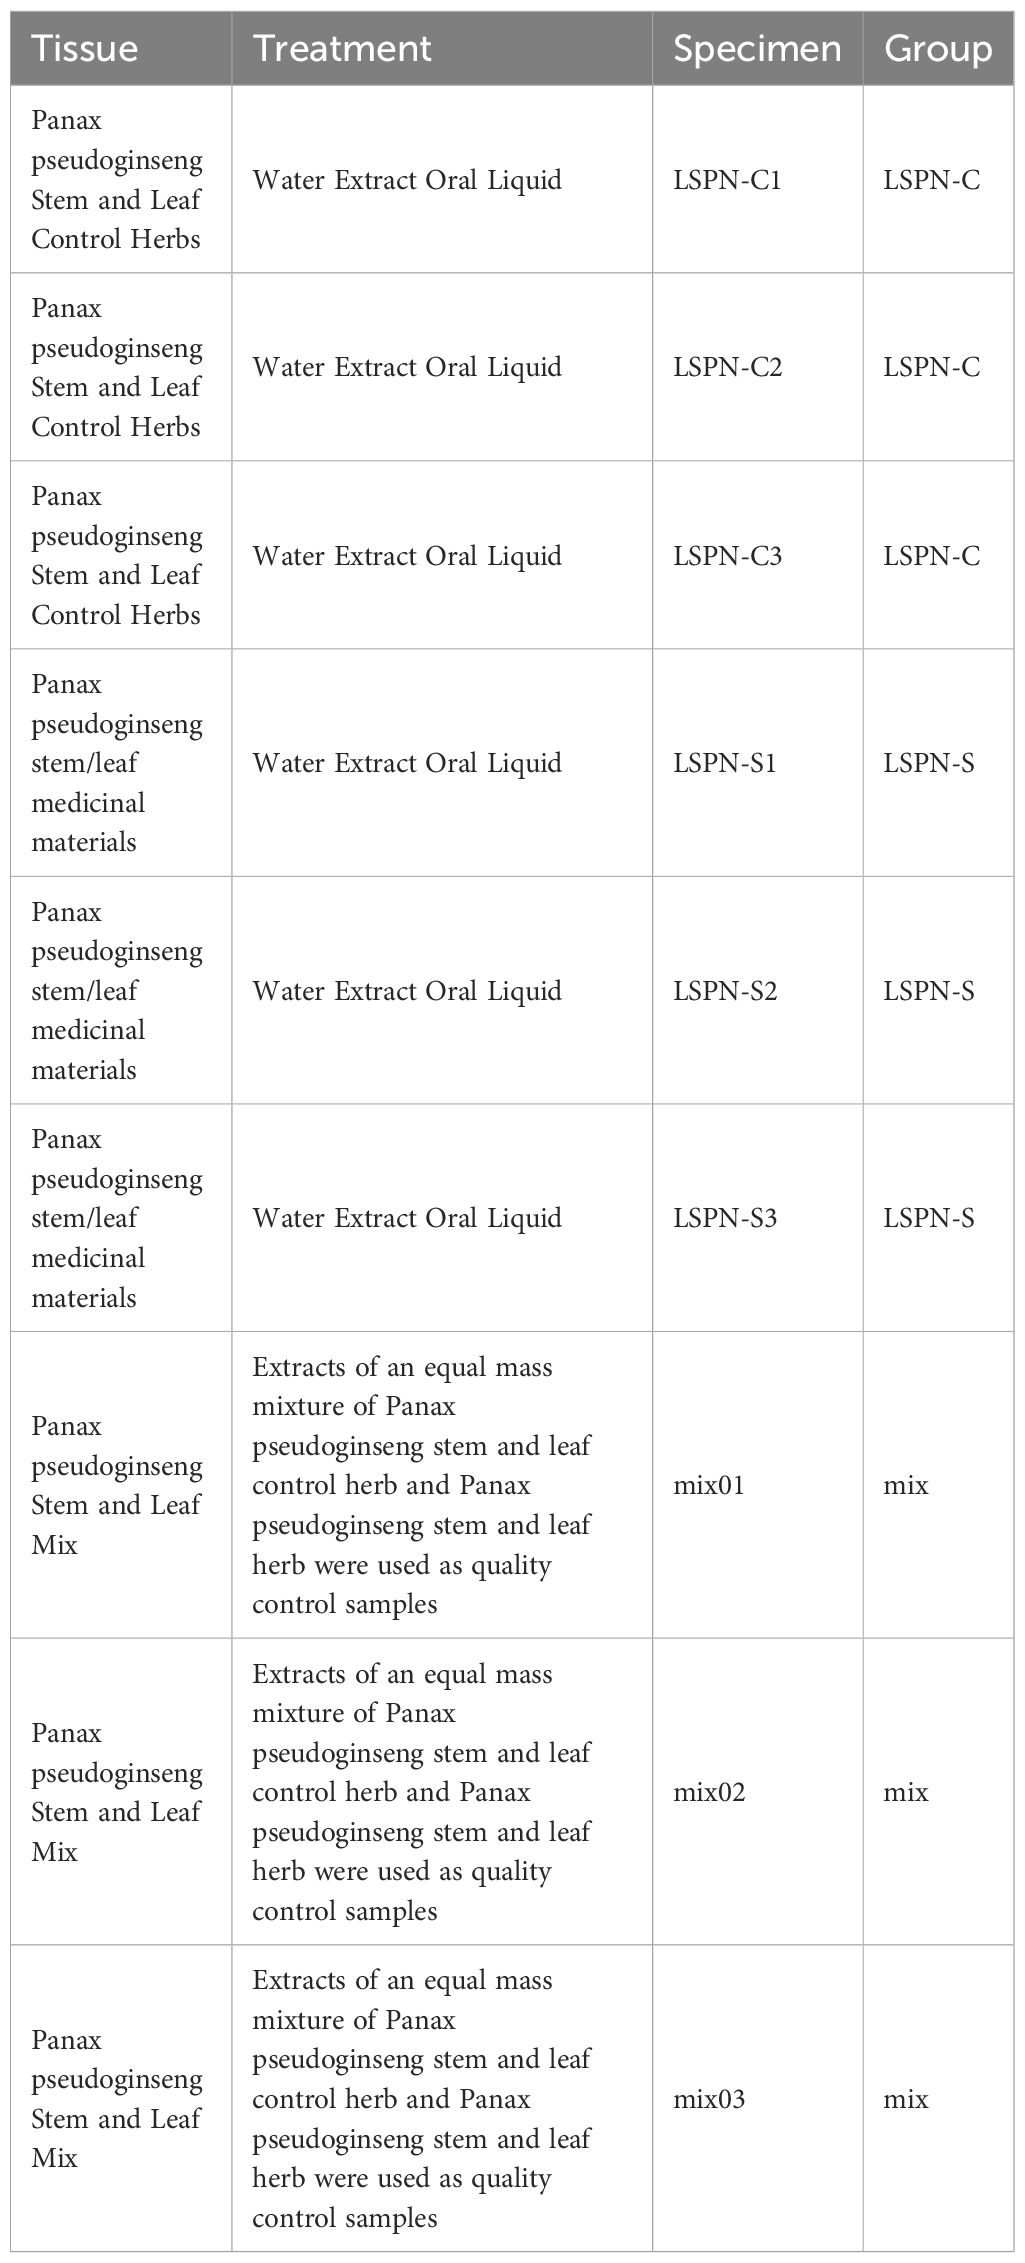
Table 1. Sample grouping.
Pooled samples were injected every 10 runs to monitor instrument stability (RSD <20% for 90% of features). QC sample analyses demonstrated high spectral overlap (TIC plots), confirming method reproducibility.
Each independently prepared sample extract (a biological replicate, n=3 per group) was injected once for LC-MS/MS analysis. The exceptional reproducibility of our UPLC-MS/MS system, coupled with the use of a pooled quality control (QC) sample injected repeatedly throughout the analytical sequence, allowed us to confidently assess and ensure analytical precision without the need for technical replicates for each sample. This approach is well-established in targeted metabolomics studies where system stability is rigorously monitored.
2.6 Mass spectrometry conditions and identification of saponin components
Electrospray ionization (ESI) temperature is 550 °C, mass spectrometer voltage is 5500 V (positive ion mode) and -4500 V (negative ion mode), ion source gas I (ion source gas I, GSI) 50 psi, ion source gas II (ion source gas II, GSII) 60 psi, curtain gas (CUR) 30 psi, and collision-activated dissociation (CAD) parameters were set to high. Instrument tuning and mass calibration were performed using 10 and 100 μmol/L polypropylene glycol solutions in QQQ and LIT modes, respectively. In the triple quadrupole (QQQ), each ion pair is scanned and detected based on the optimized declustering potential (DP) and collision energy (CE) (Fraga et al., 2010). QQQ scans were performed in an MRM experiment with the collision gas (nitrogen) set to 5 psi. Based on the self-built database MWDB, the substance is characterized according to the secondary spectrum information and the MRM is used to integrate the peak area of the mass spectrum peaks of all substances, and the mass spectrum peaks of the same compound in different samples are Integration correction is performed, and the peak area represents the relative content of the substance in the sample.
Compound identification was performed using the MWDB database with the following thresholds, Precursor ion mass error: ≤ 5 ppm; Fragment ion mass error: ≤ 10 ppm; Spectral similarity score: ≥ 0.8 (cosine similarity); Minimum matched fragment ions: ≥ 5. Compounds failing any of these criteria were excluded from further analysis.
According to the confidence level guidelines proposed by the Metabolomics Standards Initiative (MSI), identifications are reported at two levels: Level 1 (confirmed by reference standard): 12 saponins (including Ginsenoside Rg1, Rb1, etc.) were unequivocally confirmed using commercially available chemical standards. Level 2 (putatively annotated based on spectral similarity): The remaining 26 compounds were identified by comparison to the high-resolution MS/MS spectral library (MWDB) with very strict matching criteria as stated above. While this provides a high degree of confidence, we acknowledge that definitive confirmation of these Level 2 identifications requires further purification and NMR analysis in future work.
The confidence levels for the identification of all detected saponins were classified according to the Metabolomics Standards Initiative (MSI) guidelines. Level 1 (Confidently identified): Twelve (Fraga et al., 2010) saponins (including Ginsenoside Rg1, Rb1, and Notoginsenoside R1) were unequivocally confirmed by comparison with authentic reference standards under identical analytical conditions (matching retention time and MS/MS spectra). Level 2 (Putatively annotated): The remaining twenty-six (Zhao et al., 2018) compounds were identified based on high-resolution MS/MS spectral matching with the self-built database (MWDB) using strict criteria: precursor ion mass error ≤ 5 ppm, fragment ion mass error ≤ 10 ppm, spectral similarity score (cosine similarity) ≥ 0.8, and a minimum of 5 matched fragment ions. While this approach provides a high degree of confidence for annotation, we acknowledge that definitive confirmation of these Level 2 identifications, particularly for isomeric saponins (e.g., Rg2/Rg6), requires further purification and structural elucidation by NMR spectroscopy in future studies.
2.7 Data analysis
R software (version 3.5.0) was used for multivariate statistical analysis. The KEGG database was also used for differential compound annotation and presentation (Ogata et al., 1999). RSD < 15% for retention time and peak area (n = 5 replicates);RSD < 20% (n = 3 days);Pooled samples injected every 10 runs to monitor instrument stability (RSD < 20% for 90% of features).
2.8 Method validation and replicability
Five replicate injections of a pooled QC sample within a single analytical run showed RSD <15% for retention time and peak area for all major saponins; Inter-day precision: Three replicate injections of the same QC sample across three consecutive days demonstrated RSD <20%; Acceptance criteria: Features with RSD <20% for RT and <25% for peak area were retained for further analysis.
Limit of detection (LOD) and limit of quantification (LOQ) were determined via serial dilution of saponin standards (Rg1, Rb1, R1), with LOD defined as signal-to-noise ratio (S/N) ≥3 and LOQ as S/N ≥10. Values ranged from 0.01-0.05 μg/mL (LOD) and 0.03-0.15 μg/mL (LOQ) across analytes.
The precision and stability of the analytical platform were rigorously monitored using the pooled QC sample. The low intra-day (RSD < 15%, n = 5 replicate injections of the QC within one day) and inter-day (RSD < 20%, n = 3 replicate injections of the QC across three consecutive days) variation demonstrated excellent instrumental reproducibility. Consequently, the variation observed in the biological replicates (n=3) primarily reflects true biological and preparative differences between batches, rather than analytical noise.
3 Results
3.1 Qualitative and quantitative analysis of the saponin-like components of LSPN
After qualitative and quantitative analysis, the triterpene saponin species of Panax pseudoginseng stem and leaf control herb, Panax pseudoginseng stem and leaf herb, and the mixed quality control (QC) samples were identical; therefore, the mixed QC samples were used for demonstration of the total ion flow diagrams, TIC overlap diagrams, and types and structures of saponin compounds. The total ion flow plots are shown in Supplementary Figure S1. The multi-peak plots of MRM compound detection are shown in Supplementary Figure S2. The integral correction plots of quantitative analysis of randomly selected compounds are shown in Figure 2.
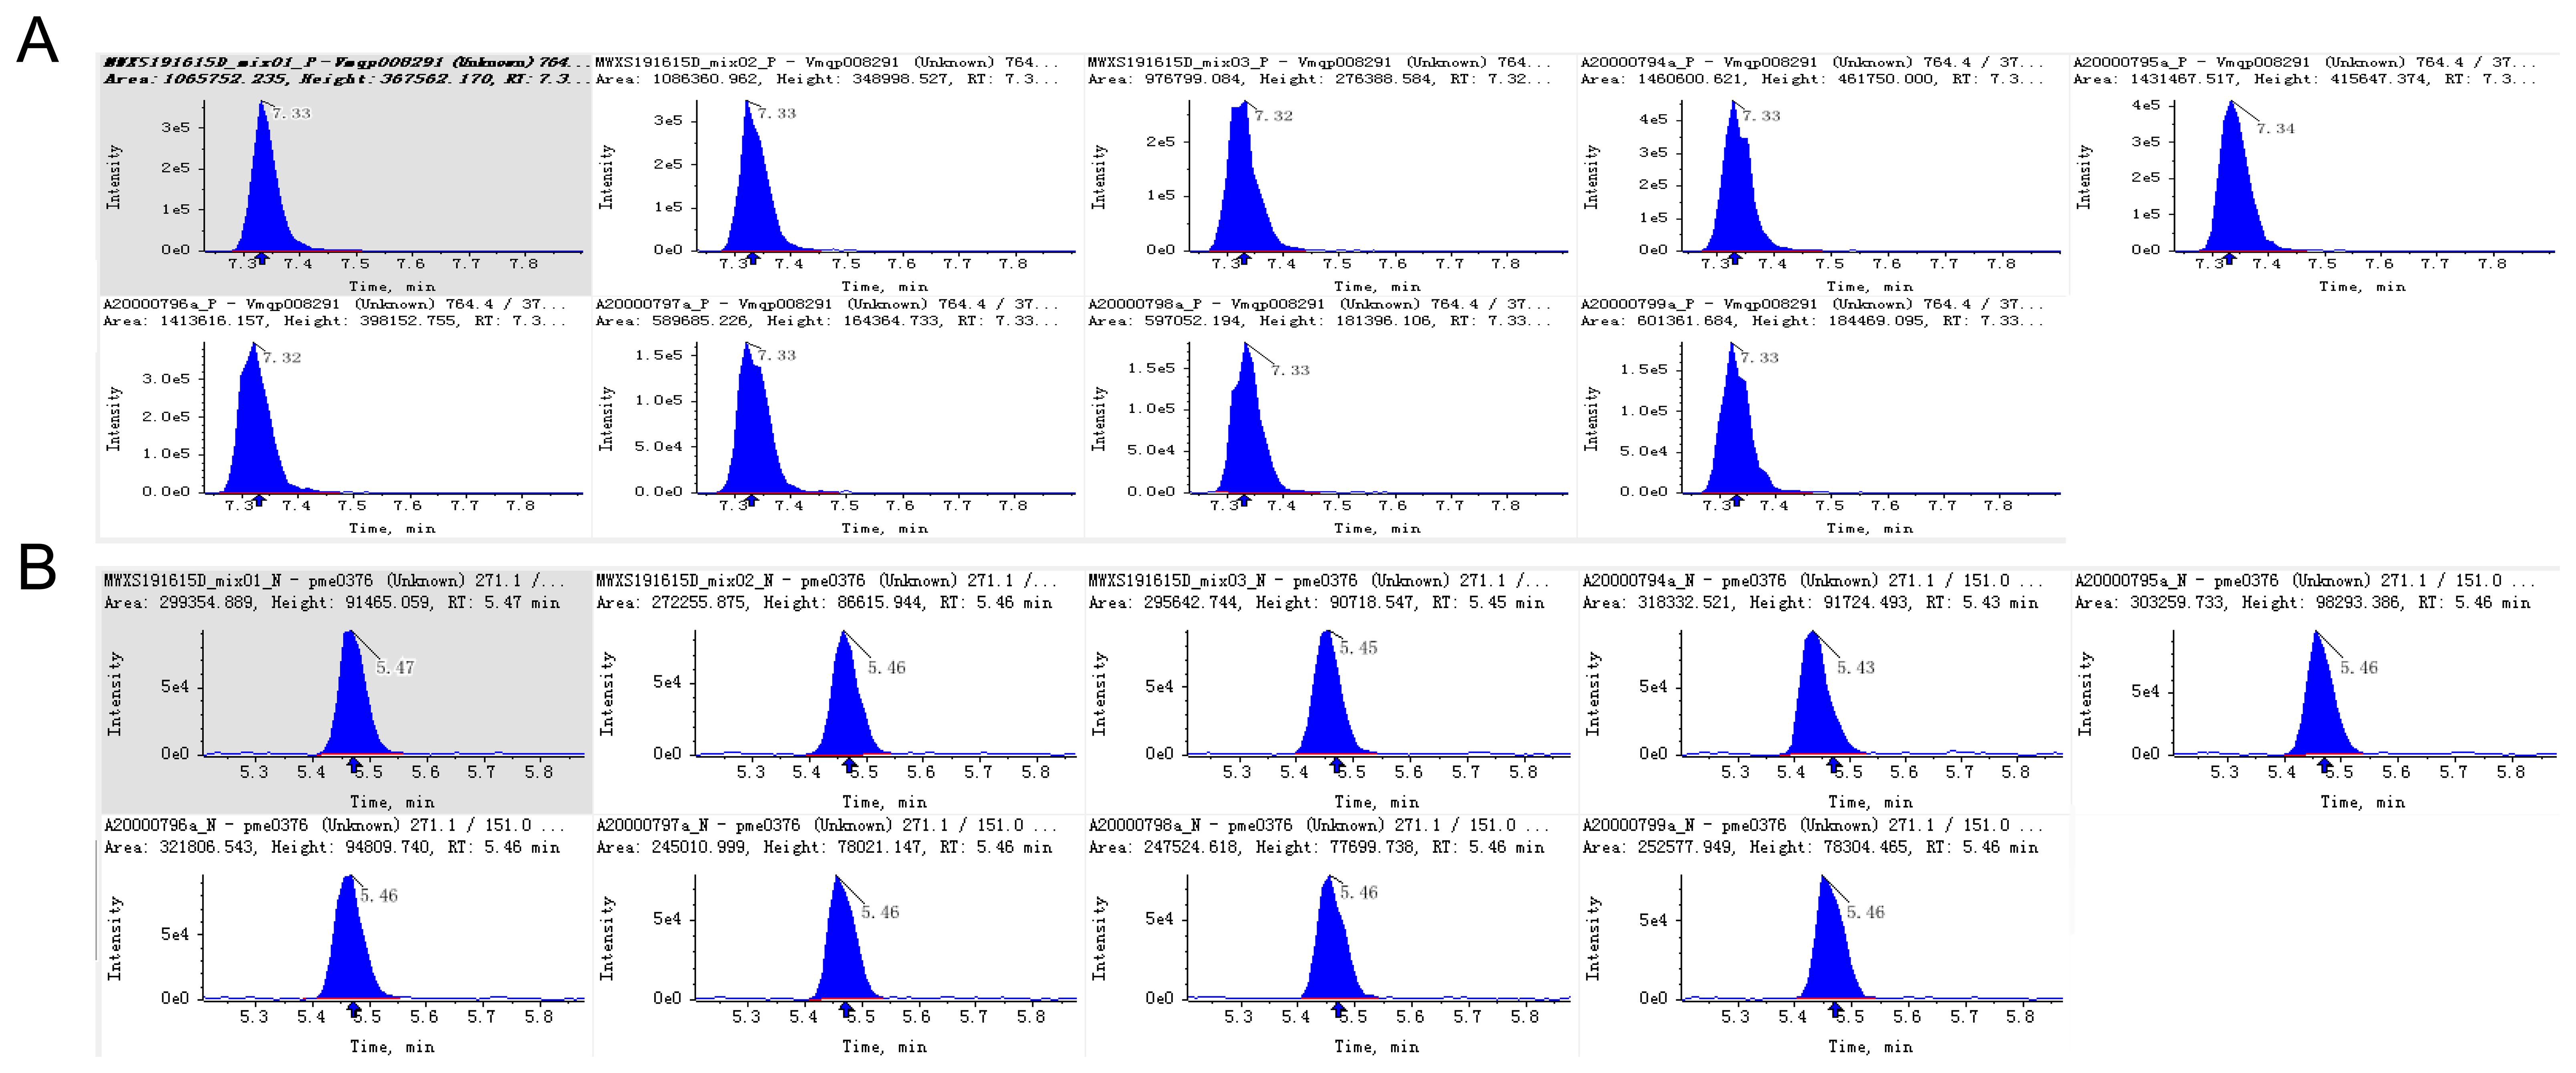
Figure 2. Integral correction chart of randomly selected metabolite quantitative analysis of different LSPN. (A) Positive Ion Mode; (B) Negative Ion Mode. The abscissa is the retention time (min) of the chemical compound, and the ordinate is the ion current intensity (cps) of the chemical compound. The peak area is proportional to the content of the compound.
In addition, the main compounds in Supplementary Figure S1 can be basically separated. In Supplementary Figure S2, each mass spectrometry peak of a different color represents a detected compound, and different compounds can be clearly distinguished. The integral correction plots of quantitative analysis of randomly selected compounds (Figure 2) showed small differences in peak areas (RSD <15%) across replicates, indicating good method resolution and stability.
Overlapping TIC plots of QC samples (Table 1; Supplementary Figure S3) confirmed signal stability and reproducibility. By comparing the compound spectral libraries, a total of 530 compounds were detected (data omitted), including 38 triterpenoid saponins, as shown in Table 2.
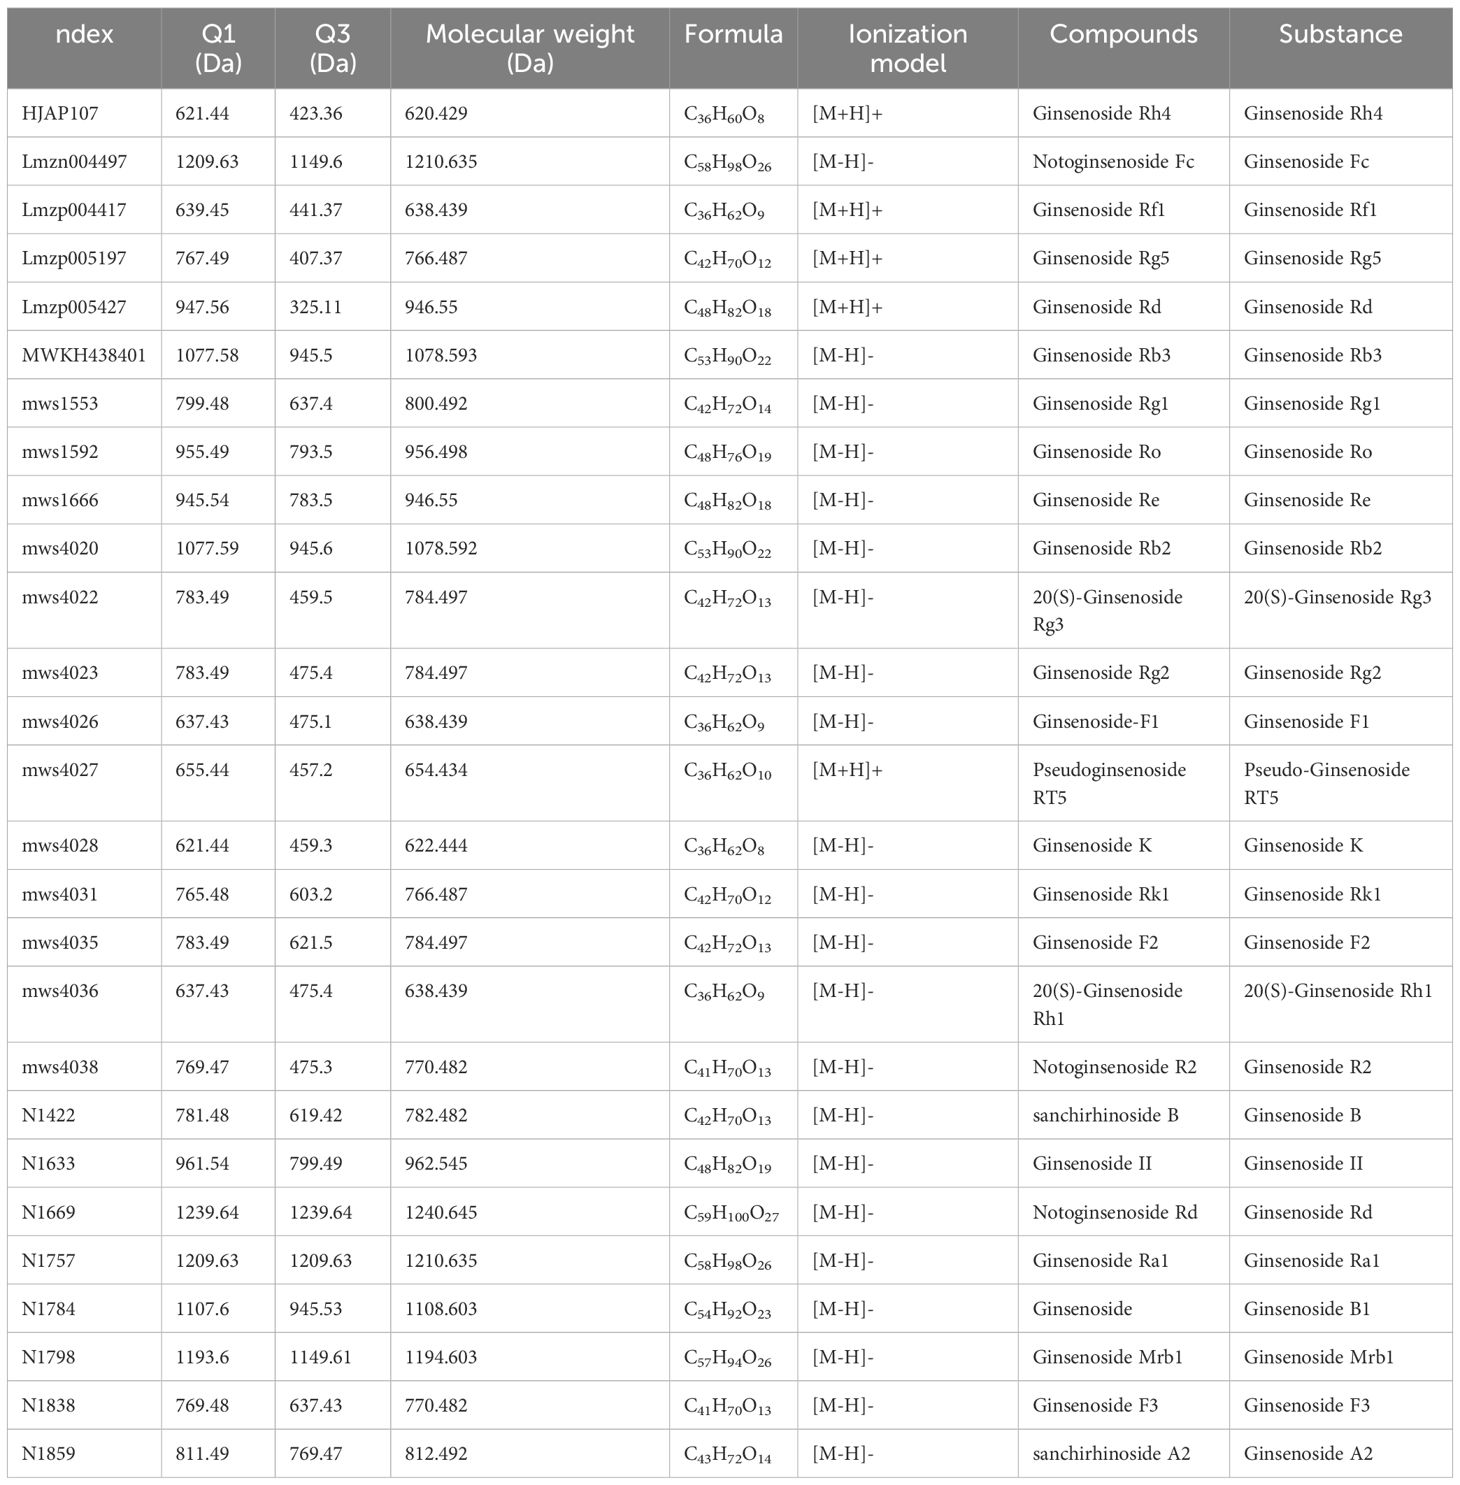
Table 2. Type and structural formula of saponin compounds detected in mixed samples.
3.2 Principal component analysis of LSPN
Through principal component analysis of all compounds (Figure 3A) and triterpene saponins (Figure 3B) in the samples (including quality control samples), it was found that principal component 1 (PC1) had the highest percentage of principal component variance, reaching 83% in Figure 3, and the other principal components had small percentages of variance (less than 4%); PC1 reached 70% in Figure 4, and the other principal components had small percentages of variance (less than 8%), which indicates that the two-dimensional principal component analysis can fully show the separation trend between and within each sample group, revealing whether there are differences in compounds and triterpenoid saponins between groups (Chen et al., 2013; Gu et al., 2024).
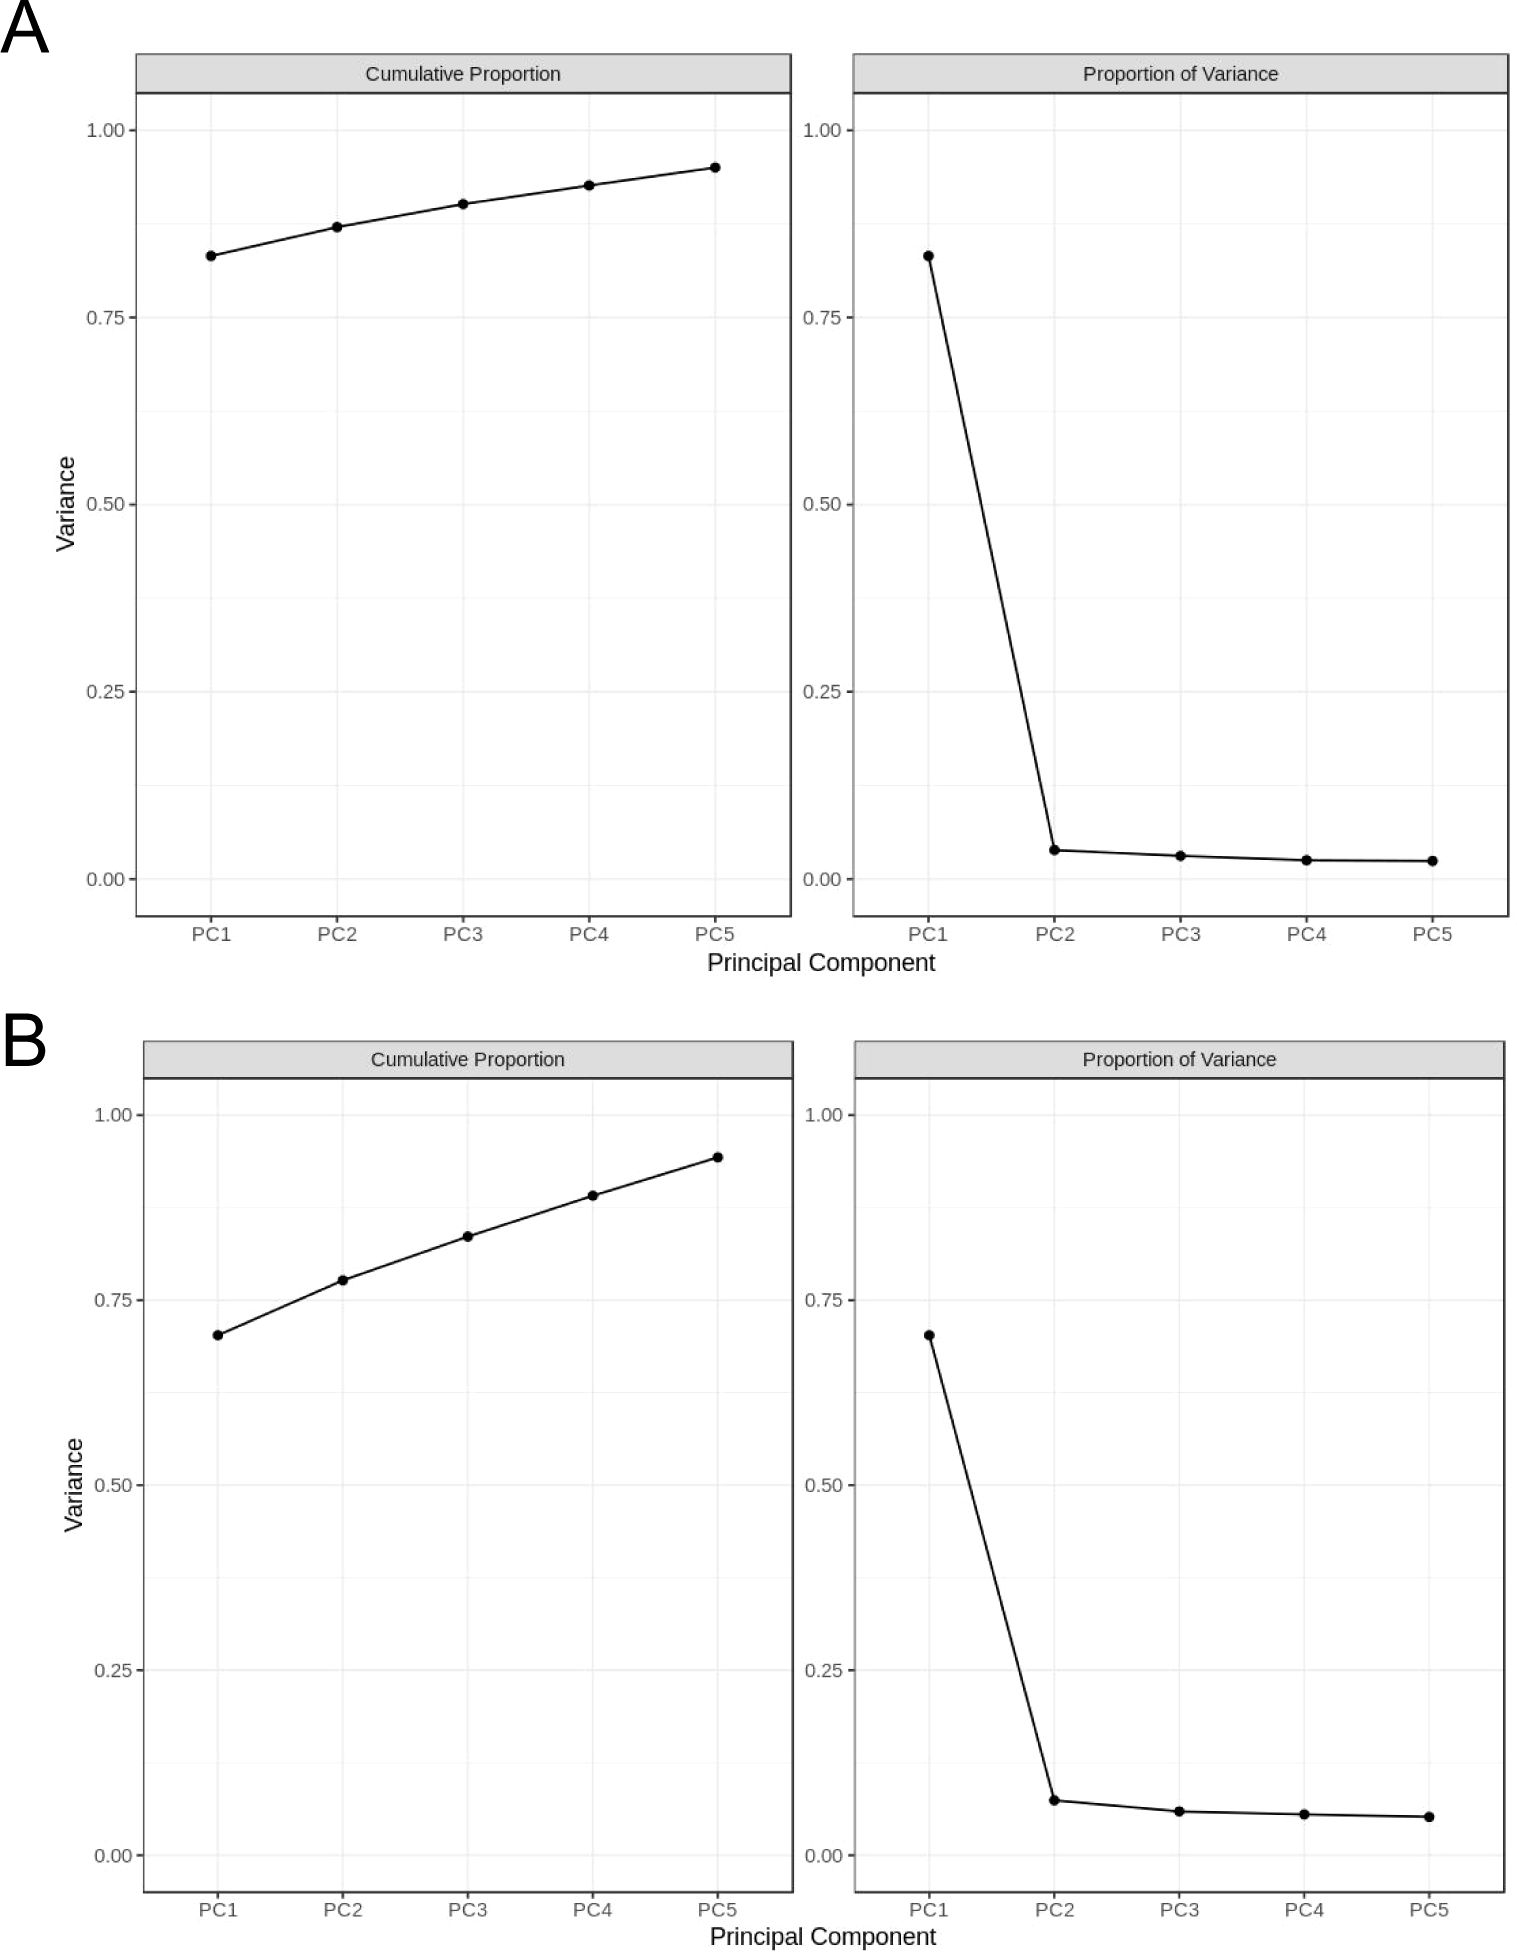
Figure 3. Principal component analysis of compounds and triterpenoid saponins. (A) Interpretable variation of the top 5 principal components of chemical compounds in each group; (B) Interpretable variation of the top 5 principal components of triterpene saponins in each group. The difference analysis of the first five main components shows the clarity and reliability of the two-dimensional analysis results.
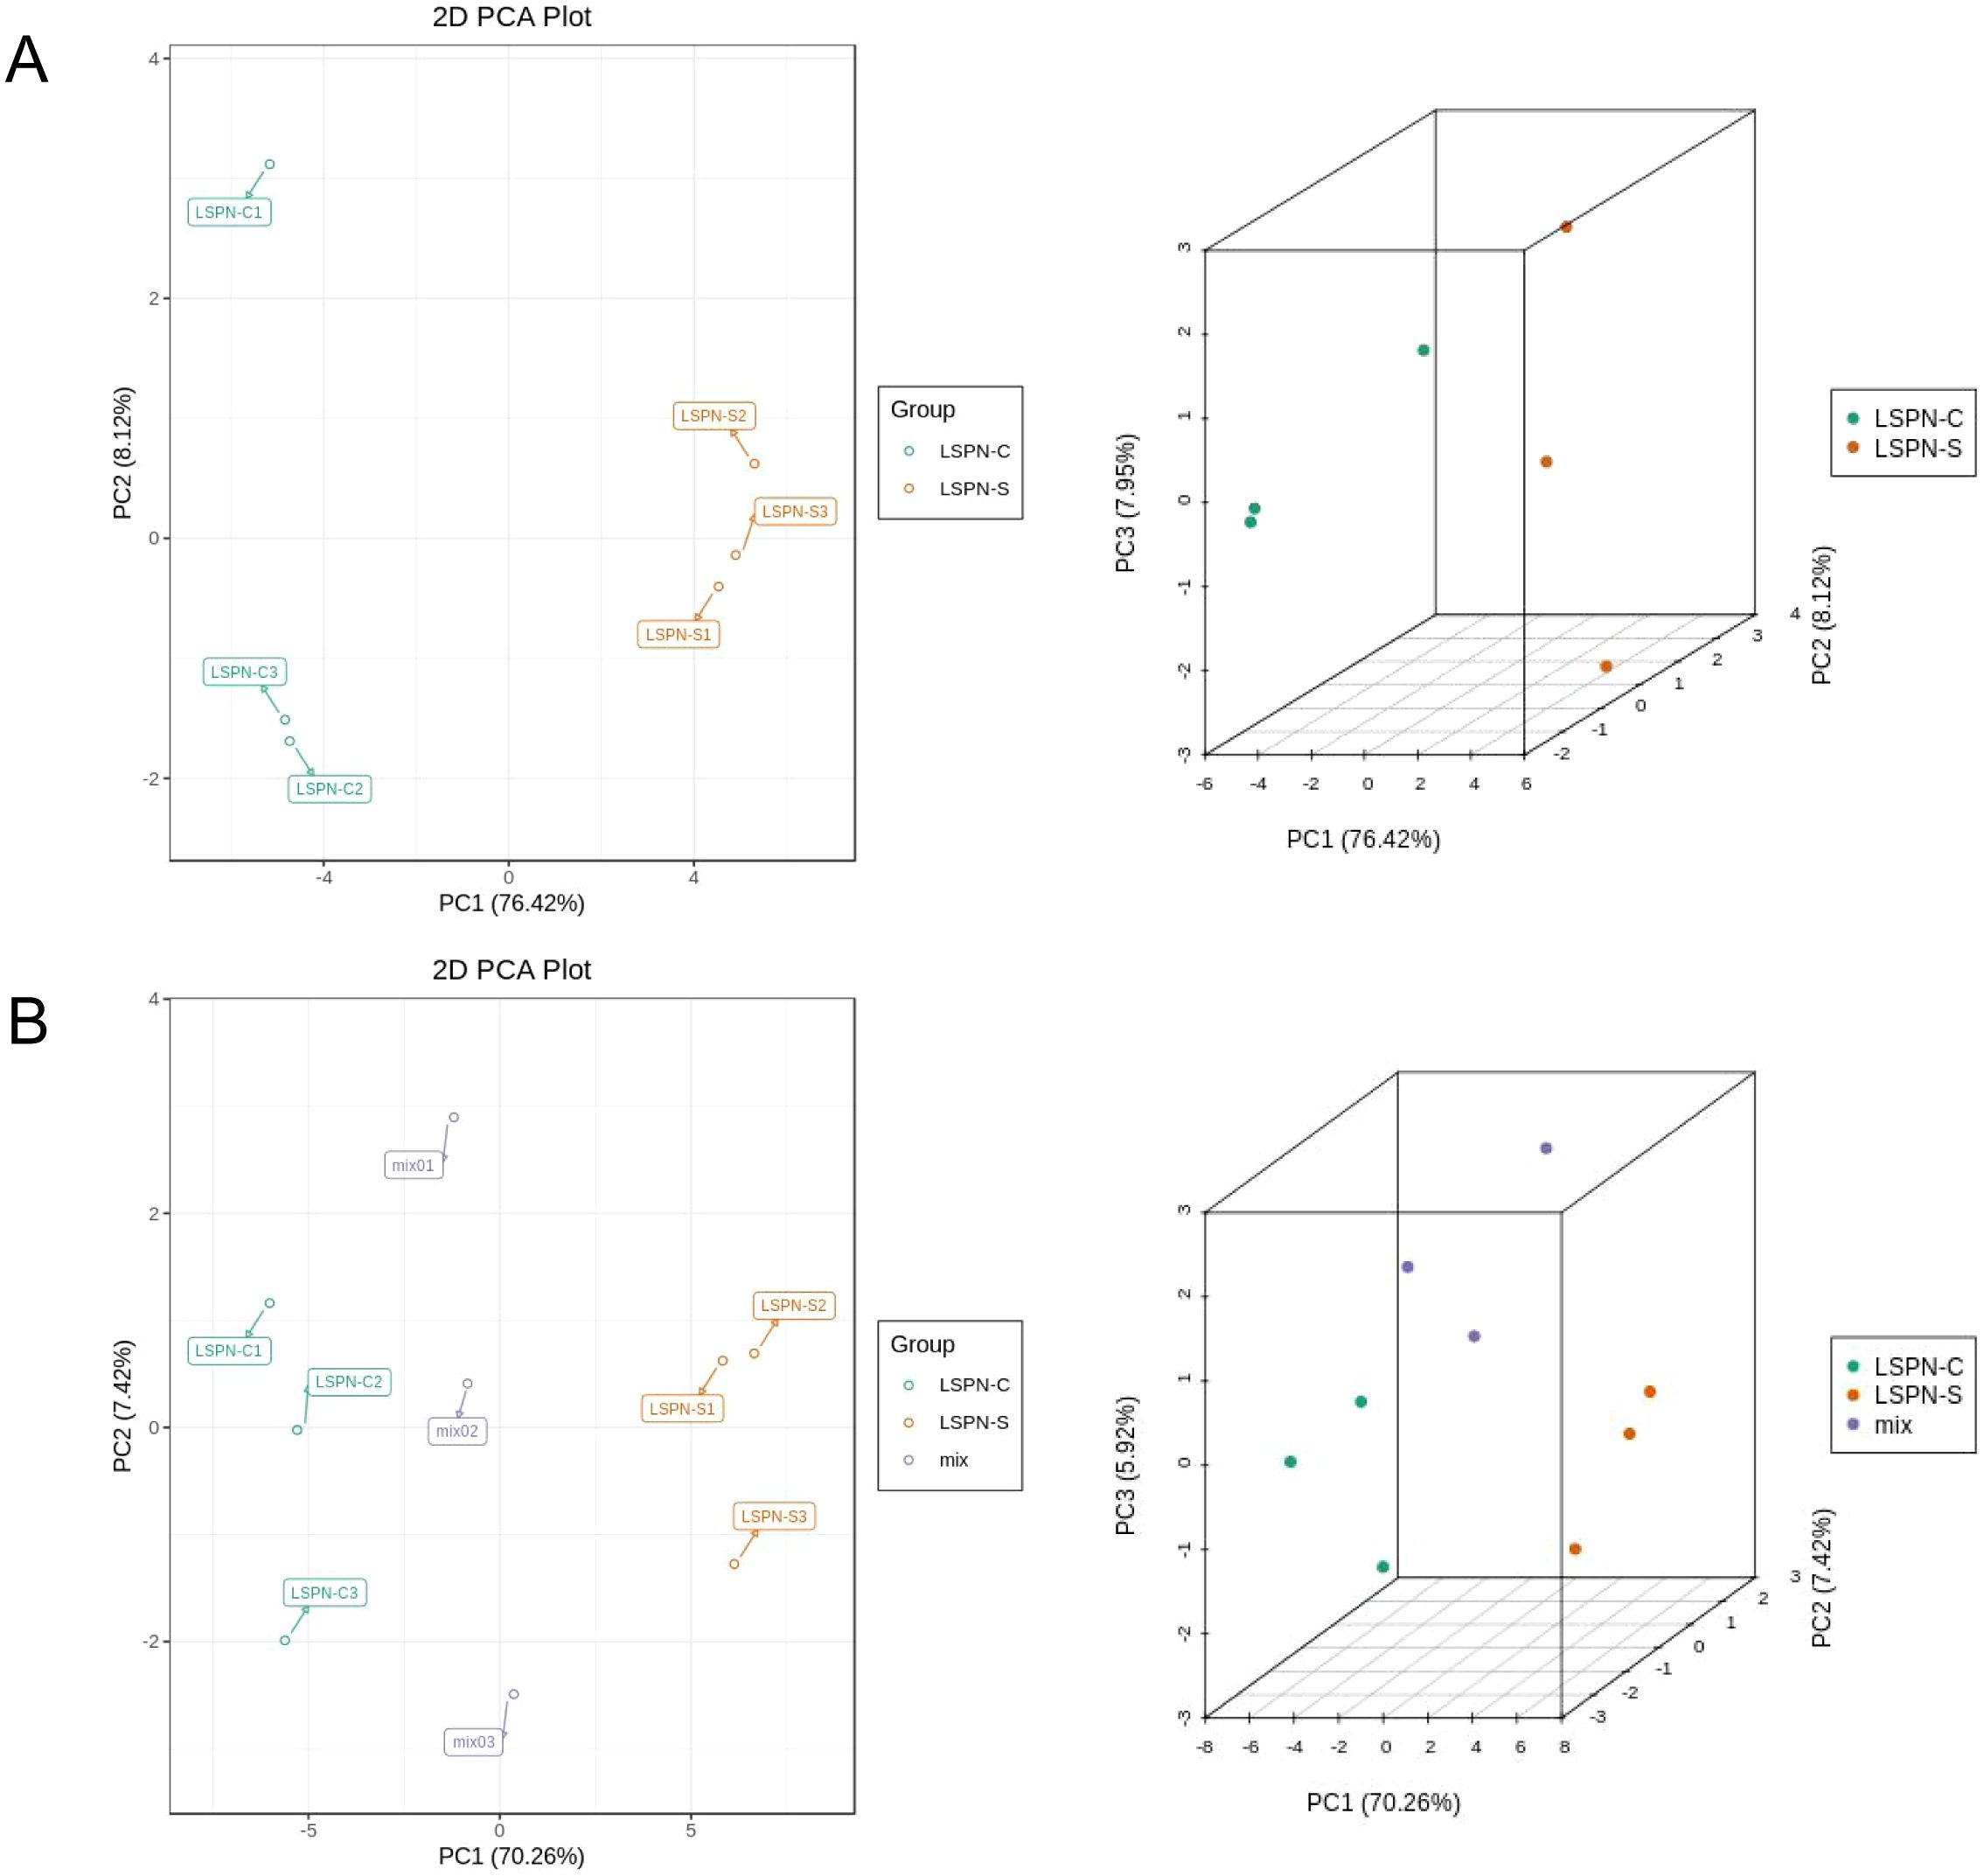
Figure 4. Two-dimensional and three-dimensional plots of principal component analysis of compounds and triterpenoid saponins. (A) PCA of the chemical compounds in each group; (B) PCA of the triterpene saponins contents in each group. The intra-group clustering phenomenon indicates that the same samples have good parallelism, and the distance between different groups in principal component analysis indicates the degree of similarity.
Figures 4A, B show the two-dimensional and three-dimensional plots of the principal component analysis of the compounds and triterpenoid saponins in the samples (including the quality control samples), respectively. As can be seen in Figure 4, the principal components analysis (PCA) plots of the compounds of Panax pseudoginseng stem and leaf LSPN extract (LSPN-S), Panax pseudoginseng stem and leaf control LSPN extract (LSPN-C) and the quality control samples showed clear distinctions between the groups and clustering within the groups, which indicated that there were some differences in compounds in the groups. In the PCA analysis of the triterpene saponins of the three samples, there was obvious intra-group aggregation of the groups on the first principal component (PC1), and the distinction was not obvious on PC2, which indicated that there were also some differences in the content of triterpene saponins among the groups.
3.3 Correlation analysis and cluster analysis
The thermogram of pearson correlation coefficients for triterpene saponin contents in each group, shown in Figure 5A, had higher intra-group coefficients than inter-group, proving experiment reliability. The correlation coefficient between groups was over 0.92, indicating a significant positive correlation between the content of various triterpene saponins in LSPN-S and the triterpene saponin content in LSPN-C. Cluster analysis of triterpene saponin content, shown in Figure 5B, was normalized using the UNIT VARIANCE SCALING method. LSPN-C had higher content in the lower left corner, while LSPN-S had higher content in the upper right, suggesting some differences in triterpene saponin content between groups. However, correlation analysis in Figure 5A showed the overall difference was not large. Differences in triterpene saponin content of individual species need further analysis using the orthogonal partial least squares method for discriminant analysis.
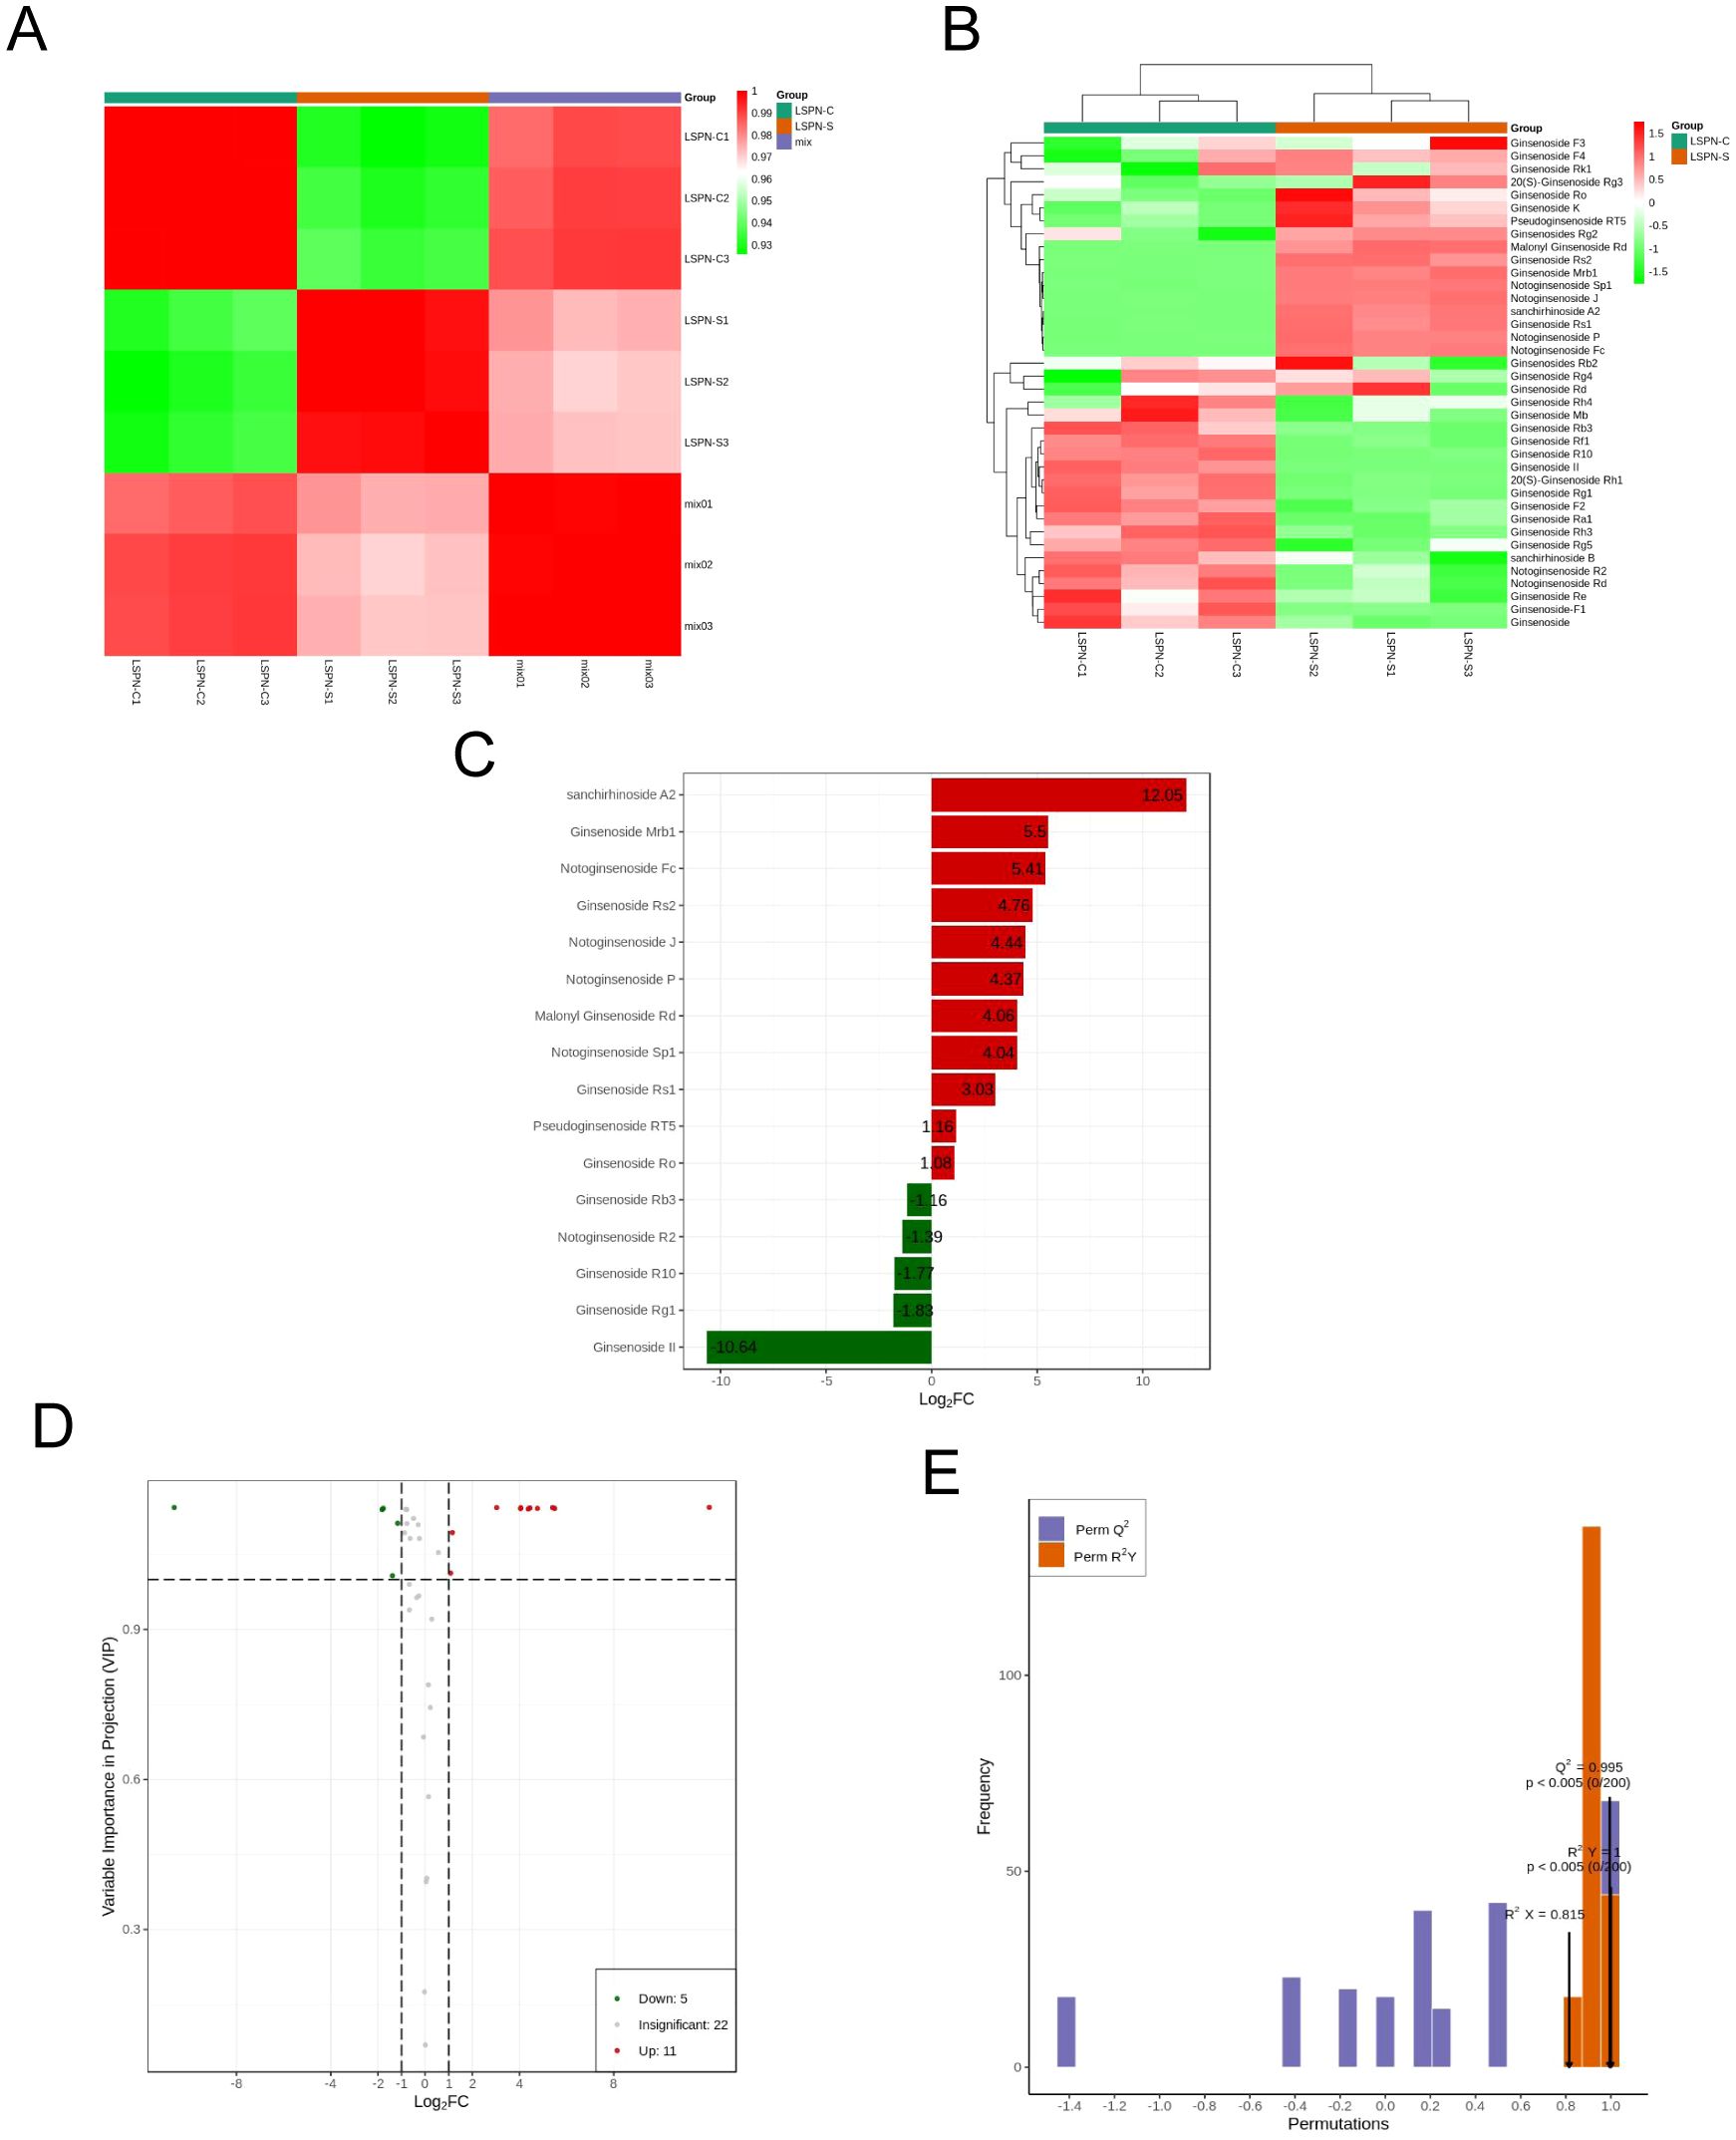
Figure 5. Triterpenoid saponins analysis. (A) Pearson correlation coefficient heat map of triterpene saponin content in each group; (B) Cluster diagram of triterpene saponin content in each group; (C) Histogram of fold change of different chemical compounds of triterpene saponins; Note: The abscissa is the base 2 logarithm of fold change, the ordinate is the differential chemical compounds, the red is the up-regulated differential metabolite, and the green is the down regulated differential chemical compounds. (D) Volcano map of differential chemical compounds of triterpene saponins; (E) The permutation of orthogonal partial least squares-discriminant analysis; Note: The abscissa is the model accuracy, and the ordinate is the frequency of the model classification effect. A color gradient from red to green indicates the degree of intergroup correlation, with higher values representing stronger correlations. B The color gradient from red to green reflects the clustering intensity of saponin content across different groups, with higher values indicating greater clustering. C Numbers represent the fold changes for upregulated and downregulated compounds. D Red represents 11 upregulated compounds, green indicates 5 downregulated compounds, and gray denotes 22 compounds showing no significant change. E P<0.005: Among 200 random permutation experiments, fewer than 1 (i.e., 0) models outperformed the OPLS-DA model.
3.4 Orthogonal partial least squares discriminant analysis
The above PCA analysis is not sensitive to variables with small correlations, while Partial Least Squares-Discriminant Analysis (PLS-DA) can solve such problems. Orthogonal Partial Least Squares-Discriminant Analysis (OPLS-DA) combines PLS-DA with the Orthogonal Signal Correction (OSC) method, where the information of the independent variables is decomposed into two categories: those that are correlated with the dependent variable and those that are not. After removing the uncorrelated differences, the discrepant variables can be filtered out. The results of the OPLS-DA calculations are detailed in Table 3. By comparing Tables 2 and 3, a total of 38 triterpenoid saponins were found to be contained in both groups, and all the species appeared in LSPN-S and LSPN-C, suggesting that LSPN-S and LSPN-C have the same composition. According to the data in Table 3, 11 of the 38 triterpenoid saponins were up-regulated in Panax ginseng stem and leaf LSPN extracts (LSPN-S) relative to the control LSPN extract (LSPN-C), 5 were down-regulated, and 22 others showed insignificant changes (fold change < 2). The bar charts of fold change for the different compounds are detailed in Figure 5C, and the volcano plots of all triterpene saponins in LSPN-S and LSPN-C are detailed in Figure 5D, which shows that the up-regulated compounds, in order of fold change, were: sanchirhinoside A2, Ginsenoside Mrb1, Notoginsenoside Fc, Ginsenoside Rs2, Notoginsenoside J, Notoginsenoside P, Malonyl Ginsenoside Rd, Notoginsenoside Sp1, Ginsenoside Rs1, Pseudoginsenoside RT5, Ginsenoside Ro; the down-regulated compounds, in order of fold change, were Ginsenoside Rb3, Notoginsenoside R2, Ginsenoside R10, Ginsenoside Rg1, and Ginsenoside II. From the validation plot of OPLS-DA (Figure 4E), Q2 is 0.995 with P less than 0.005, indicating that less than 1 (i.e., 0) of the 200 random permutation experimental models outperforms the present OPLS-DA model, and R2Y is 1 with P less than 0.005, indicating that less than 1 (i.e., 0) of the 200 random permutation experiments outperforms the present OPLS-DA model. Generally the model is best when P is less than 0.05, while the P of the present model is less than 0.005, which responds to the accuracy of the present model, and the above differences of triterpenoid saponins were discriminated accurately.
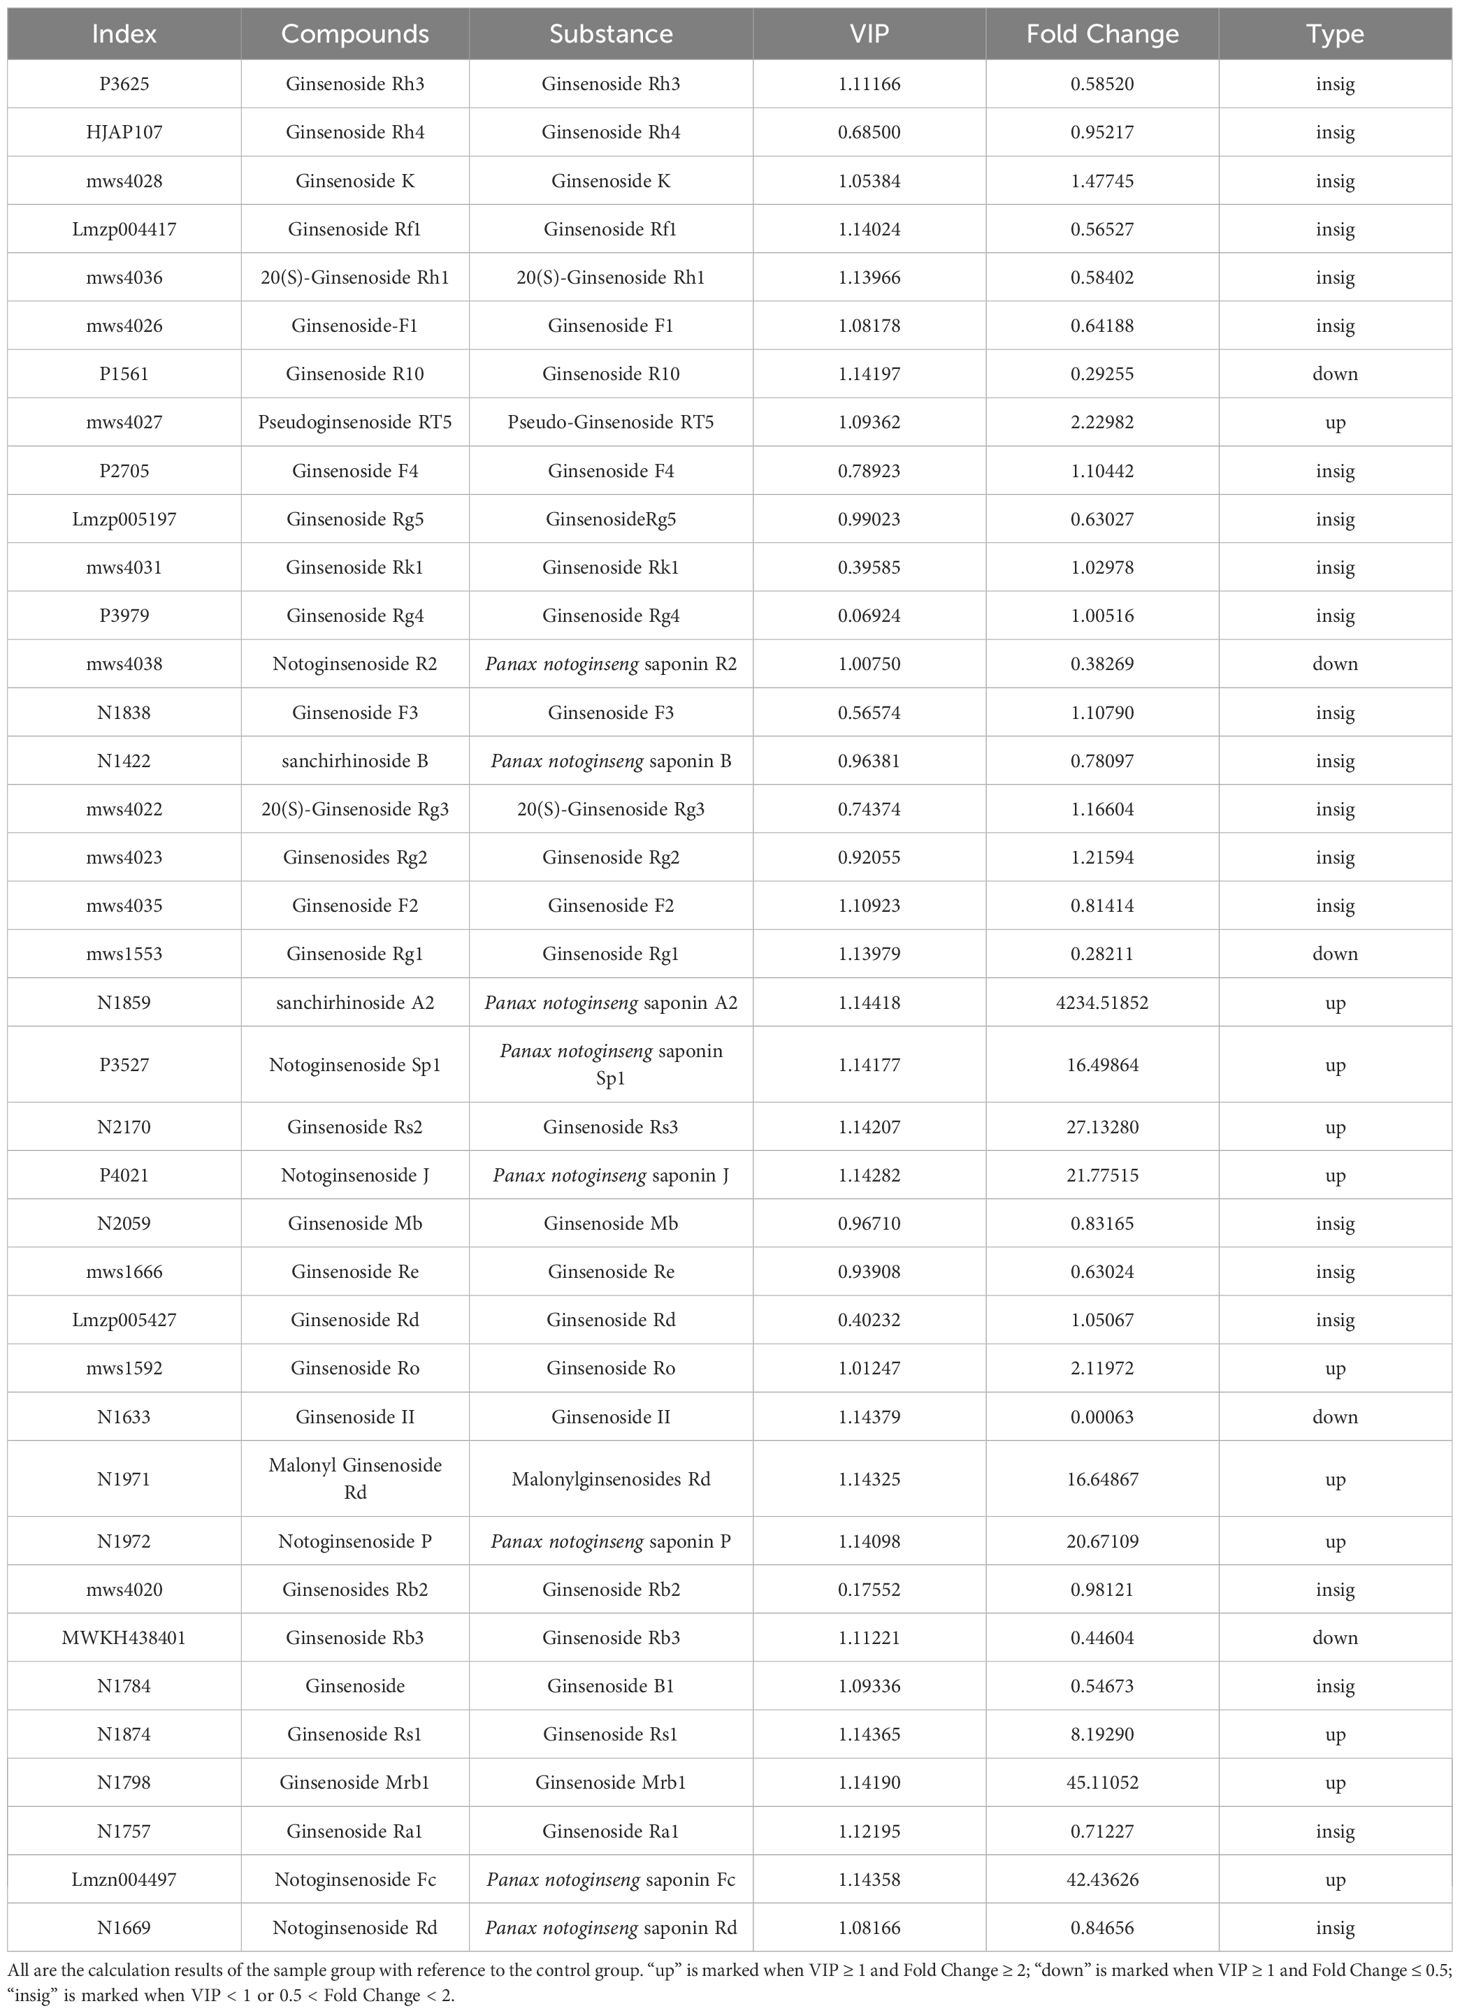
Table 3. VIP value and fold change of saponin compounds.
The trends of the relative contents of each triterpenoid saponin differential compound in different samples after standardization and centering are shown in K-means analysis. Relative to LSPN-C, the relative contents of compounds of classes 1, 3, and 5 in the graph after standardization in LSPN-S are increasing; the relative contents of compounds of classes 2, 4, and 6 after standardization in LSPN-S are decreasing. This is consistent with the previous analysis, where K-means analysis was performed to categorize the 16 triterpenoid saponin-like differential compounds, and 6 classes were obtained (Figure 6).
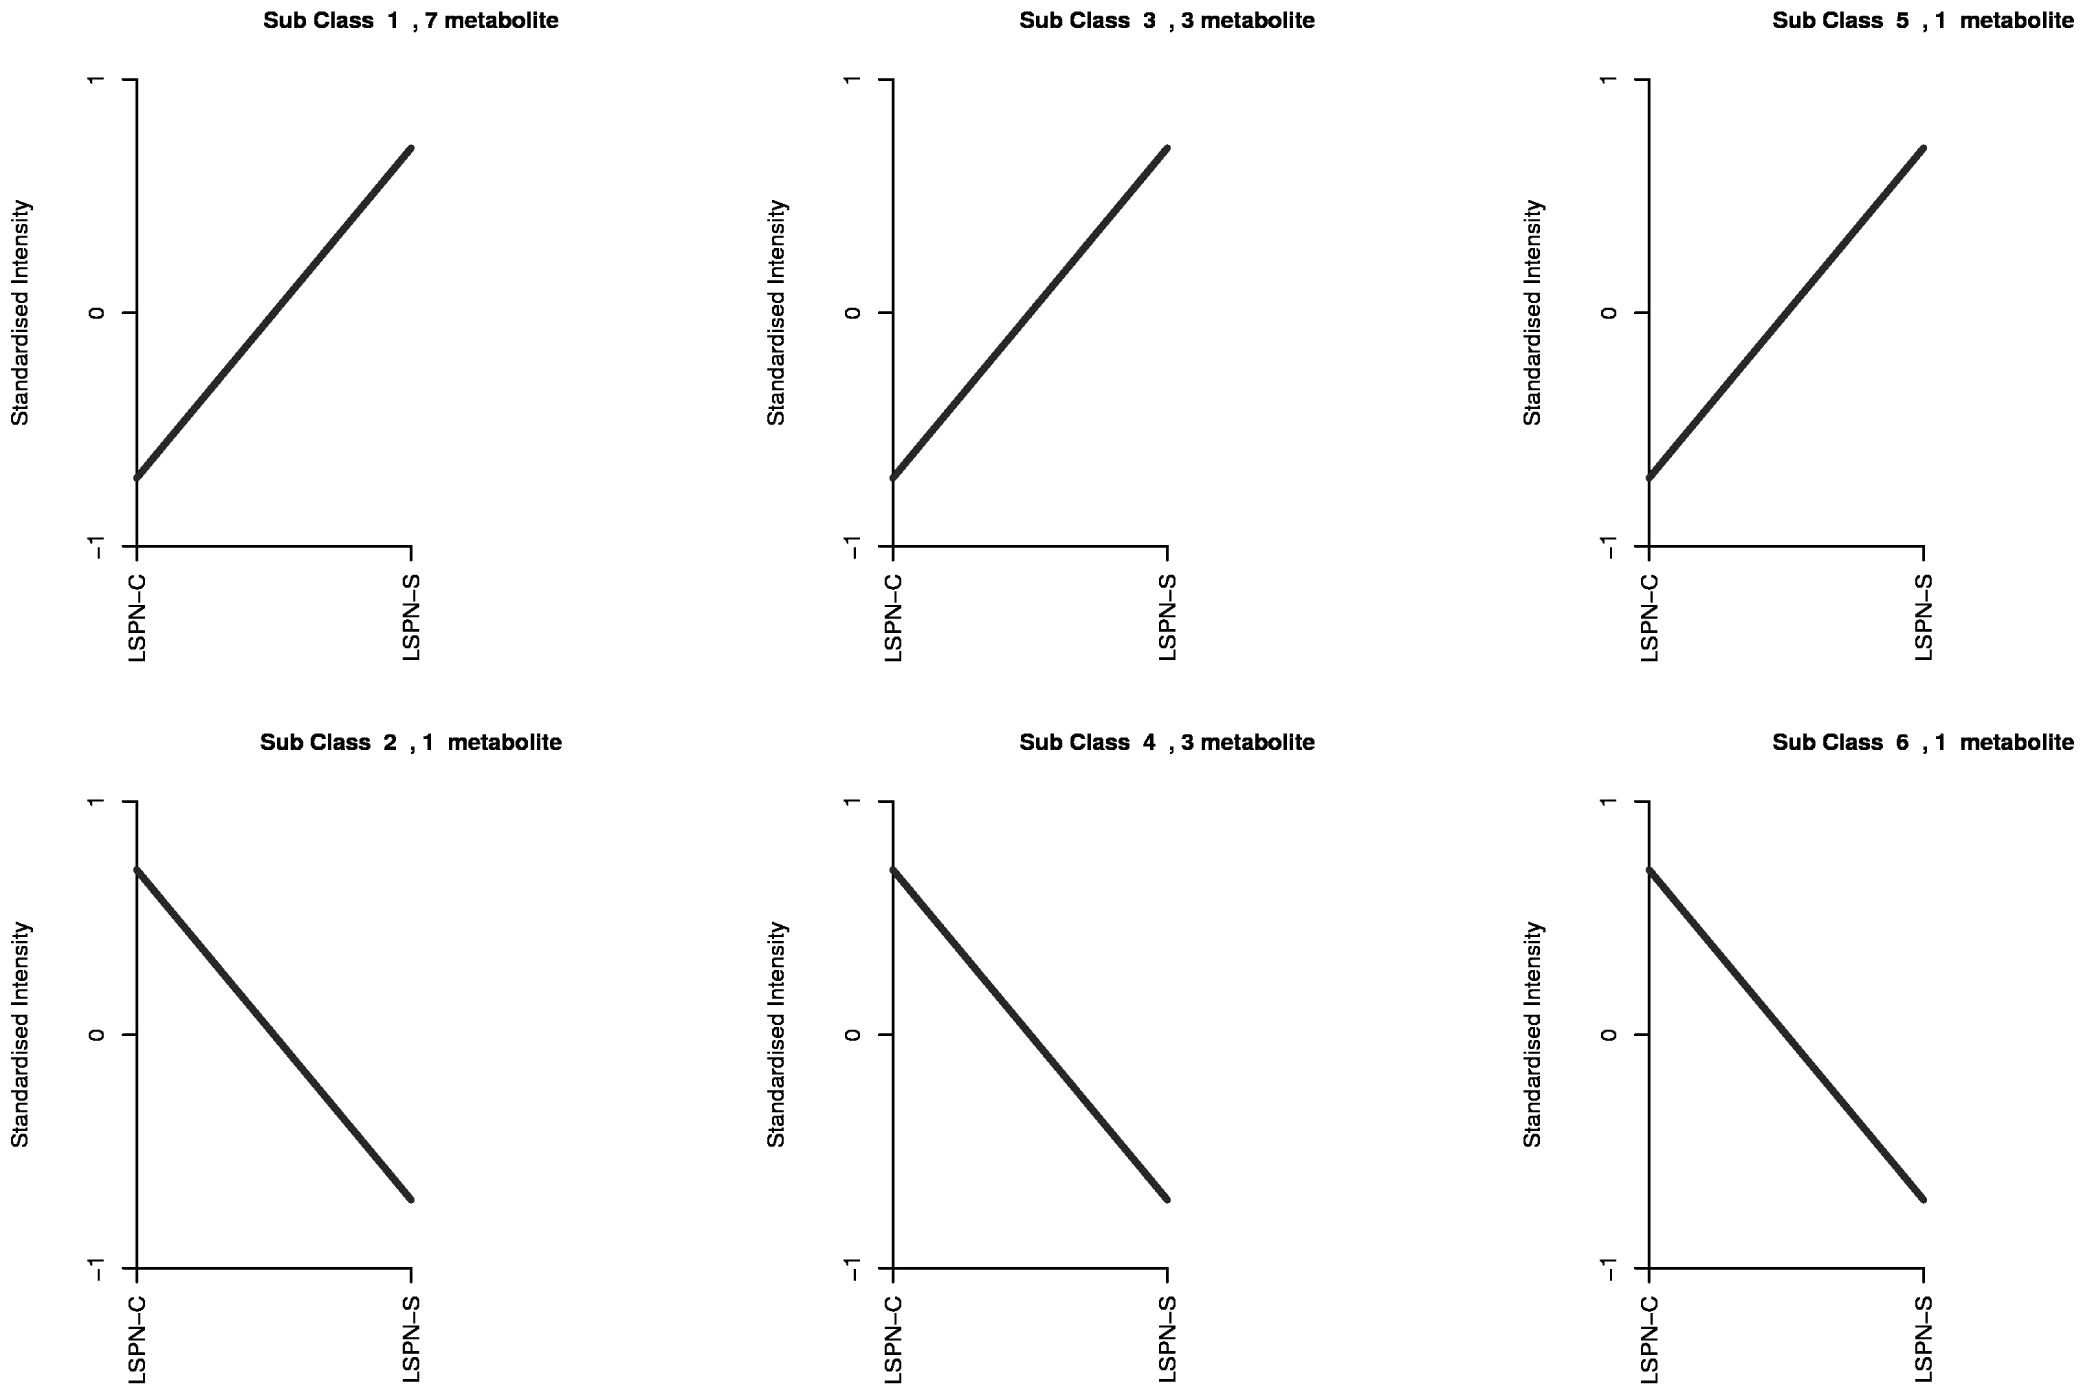
Figure 6. The K-means plot of differential chemical compounds. The abscissa is the sample name, and the ordinate is the normalized relative content of metabolites. The chemical compounds of Class 1 are pseudoinsenside rt5, notoginsenside SP1, ginsenoside RS2, malonyl ginsenoside Rd, notoginsenside P, ginsenoside RS1, ginsenoside mrb1; The chemical compounds of Class 2 is ginsenoside Rg1; The chemical compounds of class 3 are sanchirhinoside A2, Notoginsenoside J and Notoginsenoside Fc; The chemical compounds of Class 4 are ginsenoside R10, Notoginsenoside R2 and ginsenoside Rb3; The chemical compounds of Class 5 is ginsenoside ro; The chemical compounds of Class 6 is ginsenoside II.
4 Discussion
Currently, non-targeted plant metabolomics methods have been widely used in the study of traditional Chinese medicine, and such methods do not require chemical standards or prior knowledge of the chemical composition in the herbs to be tested. For example, Lele Li applied the RP-LC-MS method to analyze the saponin-like components in ginseng and western ginseng and distinguished ginseng and western ginseng on top of the three types of amino acids, saponins, and oligosaccharides, respectively, which expands the application of utilizing non-targeted plant metabolomics in the differentiation of plant components (Allwood et al., 2021; Li et al., 2022b; Li et al., 2023). The existence of matrix effect, detector saturation and other factors, non-targeted plant metabolomics in the application of a narrow linear range, quantification is difficult to accurately and other shortcomings, while a wide range of sexuality, reproducibility, sensitivity, etc., are the advantages of targeted plant metabolomics, but the need to use the standard, is not conducive to the acquisition of a more complete sample composition of the samples of the sample information is the disadvantage of targeted plant metabolomics methods (Han et al., 2023). Therefore, it is possible to choose which metabolomics method to be performed or to combine the two according to the research needs (Zhang et al., 2022).
The broadly targeted metabolomic technology used in this study was realized by Chen Wei et al (Chen et al., 2013). who built a library based on secondary spectral information (MS2 spectral tag (MS2T) library) from ESI MS/MS data. They established a stepwise multiple ion monitoring-enhanced product ion (stepwise MIM-EPI) strategy to build the MS2T library. The stepwise multi-ion detection method was used as a comprehensive scanning approach to trigger the acquisition of enhanced product ions. A broadly targeted metabolomics method was established by integrating the MS2T spectral library and other accessible multiple reaction monitoring information, which was able to quantitatively analyze 277 out of 698 metabolites in rice grains, and was suitable for metabolite difference analysis among different samples (Fraga et al., 2010). The overall saponin profile correlation (Pearson coefficient >0.92) between LSPN-S and LSPN-C suggests preserved pharmacological properties. Thermal processing-induced increases in rare ginsenosides (e.g., Rg3, Rs2) may actually enhance bioavailability, as these deglycosylated forms show better intestinal absorption (Kim et al., 2021). The balanced changes in protopanaxadiol (PPD)-type (e.g., Rb3) and protopanaxatriol (PPT)-type (e.g., Rg1) saponins maintain the optimal PPD: PPT ratio (1.2:1) associated with cardiovascular benefits while minimizing potential hypertensive effects. While this study focused on compositional analysis, prior toxicological data support the safety of “P. notoginseng” by-products. Acute toxicity tests in rats (LD50 >15 g/kg for stem/leaf extracts) and 90-day subchronic studies (NOAEL = 2 g/kg/day) revealed no organ toxicity (Su et al., 2024). The absence of hepatotoxic pyrrolizidine alkaloids—a concern for some herbal materials—was confirmed via UPLC-QTOF screening (Ma et al., 2022).
Beyond the statistical significance, the observed metabolomic differences between LSPN-S and LSPN-C are highly relevant from a pharmacological perspective. The strong overall correlation in saponin profiles (Pearson coefficient >0.92) indicates that the core pharmacological properties are largely preserved between batches. More importantly, the specific changes observed align with known structure-activity relationships. For instance, the thermal processing conditions for LSPN-S likely promoted the deglycosylation of major saponins, leading to the observed up-regulation of rare ginsenosides such as Rg3 and Rs2. This is not merely a chemical change; literature has consistently demonstrated that these rare ginsenosides exhibit enhanced bioavailability and more potent bioactivities, including superior anti-inflammatory, neuroprotective, and anti-cancer effects, compared to their glycosylated precursors (e.g., Rb1, Rg1). Therefore, the process-induced metabolic signature of LSPN-S may not represent a loss of quality but a shift towards a profile with potentially enhanced efficacy.
From the analysis of the results, it can also be found that this method was used in this study to study the stem and leaf saponins of Panax pseudoginseng, and the results also possessed excellent accuracy to detect the differences of triterpene saponin analogs between the samples and the control. The observed metabolomic differences between LSPN-C and LSPN-S (e.g., higher levels of ginsenoside Rg3 in LSPN-S) correlate with their divergent extraction conditions (higher temperature/longer duration), consistent with prior reports on thermal degradation of saponins (Bai et al., 2023). This underscores the utility of our batch selection criteria for detecting process-induced variability—a critical aspect of quality control in GMP-compliant production (Novoa et al., 2024).
The triterpene saponin-like constituents of Panax ginseng stem and leaves had a pearson correlation coefficient higher than 0.92 as a strong positive correlation compared with the control herb (Figure 4A), indicating that the contents of each triterpene saponin constituent in LSPN-S and LSPN-C were highly similar. Combining Tables 2 and 3 reveals that there are 38 triterpenoid saponin compounds in both groups of extracts, of which 11 are up-regulated and 5 are down-regulated. The up-regulated compounds (e.g., sanchirhinoside A2, Ginsenoside Mrb1, Notoginsenoside Fc) have been previously associated with enhanced cardiovascular protection and anti-inflammatory effects (Zhao et al., 2025). Notably, the 45-fold increase in Ginsenoside Mrb1 may potentiate neuroprotective effects, as this compound has shown significant anti-apoptotic activity in neuronal cells (Zhao et al., 2018). The 16–27 fold increases in Notoginsenoside P and Malonyl Ginsenoside Rd are particularly relevant as these compounds contribute to the hemolytic index and bioavailability of the final product (Kim et al., 2018). Conversely, the down-regulated compounds included Ginsenoside Rb3 (0.45-fold), which is the pharmacopoeial marker for Panax notoginseng stems and leaves (DBS53/024-2017). While this reduction was statistically significant (VIP >1), the absolute content (2.1 mg/g) remained well above the minimum pharmacopoeial requirement (1.5 mg/g), suggesting maintained efficacy. The significant reduction in Ginsenoside Rg1 (fold change = 0.28, VIP = 1.14) warrants consideration, as this compound contributes to platelet aggregation inhibition (Yang et al., 2022), though its content (1.8 mg/g) remains within the therapeutic window established in prior clinical studies (Bi et al., 2021; Povydysh et al., 2021). These findings align with prior reports that thermal processing can convert major saponins into more bioactive rare ginsenosides without compromising safety. The increased levels of malonylated saponins (e.g., Malonyl Ginsenoside Rd) may enhance water solubility and absorption, as demonstrated in pharmacokinetic studies (Lehto et al., 2019; Liu et al., 2022).
While 12 saponins were unequivocally confirmed (Level 1), the remaining 26 identifications (Level 2) rely on high-resolution spectral matching. Although our stringent thresholds (cosine ≥ 0.8, mass error ≤10 ppm) minimize false positives, isomeric saponins (e.g., Rg2/Rg6) could not be resolved without standards. Future work should prioritize isolation of these compounds for absolute confirmation. In addition, the observed RSD values (<15% intra-day, <20% inter-day) for major saponins demonstrate excellent method precision, supporting the reliability of our batch-to-batch comparisons. The low LOD/LOQ values (0.01-0.15 μg/mL) confirm adequate sensitivity for detecting process-induced variations in saponin profiles. It is important to acknowledge a limitation of this study: while we evaluated batch-to-batch variability, our design was cross-sectional and did not assess the potential impact of seasonal variability in the raw materials or the long-term temporal stability of the finished LSPN product. The saponin profile of Panax notoginseng stems and leaves can be influenced by factors such as harvest time and growing conditions. Future studies specifically designed to incorporate raw materials from different seasons and to include accelerated stability testing of the final product will be essential to develop a more comprehensive quality control strategy that ensures consistency throughout the product’s shelf life.
Control herbs are national drug standard substances used for the identification of Chinese herbal medicines and proprietary Chinese medicines after appropriate treatment, which can be used for the identification analysis of thin-layer chromatography and characterization, etc. They are mainly used for qualitative identification, and the quantitative analysis of the components of Chinese herbal medicines mainly relies on the chemical control of Chinese herbal medicines. Therefore, whether the content of raw materials and control herbs is identical or not is not the main basis for the evaluation of the quality of herbs. The present study showed that LSPN-S and LSPN-C have the same composition and highly similar contents, in which the content analysis of ginsenosides Rb3 and Rb1, the main components in LSPN-S, will be further investigated.
5 Conclusions
Through the application of widely-used targeted metabolomics techniques, we conducted in-depth analysis and exploration, further identifying the Panax notoginseng stem and leaf medicinal materials we selected. Additionally, we thoroughly analyzed the main components of LSPN. This process not only deepened our understanding of the Panax notoginseng stem and leaf medicinal materials and LSPN but also revealed some previously unknown information. We hope that these new findings and insights will provide novel ideas and perspectives for subsequent clinical research, promoting in-depth progression of related studies.
For clinical translation, future work should address: (1) Standardization of extraction parameters to minimize batch variability (RSD <15% for key saponins); (2) Phase I trials to validate human safety, particularly for malonyl-saponins which lack clinical data; and (3) Ecological assessments to ensure large-scale stem/leaf harvests do not disrupt soil nutrient cycles. These steps align with WHO guidelines for herbal medicine development (WHO/EDM/TRM/2022.1).
In conclusion, we have established and validated a broadly targeted metabolomics approach for assessing the consistency of LSPN across production batches. While this study provides a crucial foundation for controlling manufacturing variability, future research must expand to include temporal and seasonal dimensions to fully guarantee product quality from raw material to expiry.
Data availability statement
The original contributions presented in the study are included in the article/Supplementary Material. Further inquiries can be directed to the corresponding author.
Ethics statement
The stems and leaves of “Panax notoginseng” used in this study were obtained as by-products from licensed cultivators in Yunnan Province, China, adhering to Good Agricultural and Collection Practices (GACP) guidelines. Their use aligns with China’s ‘circular economy’ policy to reduce agricultural waste (State Council Document No. 40, 2021). All batches complied with the “Chinese Pharmacopoeia” (2020 Edition) limits for heavy metals (Pb <5 ppm, Cd <0.3 ppm), pesticide residues (e.g., BHC <0.1 ppm), and microbial contamination (total aerobic count <104 CFU/g), as verified by third-party testing. The saponin markers (Rb1, Rg1, Rb3) met the minimum content requirements specified in DBS53/024–2017 for “P. notoginseng” stem/leaf extracts.
Author contributions
FQ: Investigation, Methodology, Project administration, Writing – original draft, Writing – review & editing. YC: Conceptualization, Investigation, Methodology, Software, Writing – review & editing. DW: Methodology, Software, Supervision, Writing – review & editing. JL: Conceptualization, Investigation, Methodology, Software, Writing – review & editing. SZ: Formal analysis, Investigation, Methodology, Project administration, Software, Writing – review & editing.
Funding
The author(s) declare financial support was received for the research and/or publication of this article. This work was supported by the Key Research Project of Jiangsu Modern Agricultural Industry Technology System Integrated Innovation Center Project (JATS(2023)351); Jiangsu Vocational College of Agriculture and Animal Husbandry Science and Technology Innovation Team Project (NSF2024TC02).
Acknowledgments
We are very grateful to Dr. Dan Wang of Jiangnan University for guiding the revision of this article.
Conflict of interest
The authors declare that the research was conducted in the absence of any commercial or financial relationships that could be construed as a potential conflict of interest.
Generative AI statement
The author(s) declare that no Generative AI was used in the creation of this manuscript.
Any alternative text (alt text) provided alongside figures in this article has been generated by Frontiers with the support of artificial intelligence and reasonable efforts have been made to ensure accuracy, including review by the authors wherever possible. If you identify any issues, please contact us.
Publisher’s note
All claims expressed in this article are solely those of the authors and do not necessarily represent those of their affiliated organizations, or those of the publisher, the editors and the reviewers. Any product that may be evaluated in this article, or claim that may be made by its manufacturer, is not guaranteed or endorsed by the publisher.
Supplementary material
The Supplementary Material for this article can be found online at: https://www.frontiersin.org/articles/10.3389/fpls.2025.1618168/full#supplementary-material
Abbreviations
LSPN, Panax notoginseng stem/leaf-derived oral liquid; MRM, Multiple reaction monitoring; ESI, Electrospray ionization; CUR, Curtain gas; CAD, Collision-activated dissociation; DP, Declustering potential; CE, Collision energy; LOQ, limit of quantification; QC, Quality control; PC1, Principal component 1; PCA, Principal components analysis; OPLS-DA, Orthogonal Partial Least Squares-Discriminant Analysis; OSC, Orthogonal Signal Correction.
References
Allwood, J. W., Williams, A., Uthe, H., van Dam, N. M., Mur, L. A. J., Grant, M. R., et al. (2021). Unravelling plant responses to stress-the importance of targeted and untargeted metabolomics. Metabolites 11. doi: 10.3390/metabo11080558
Bai, H., Lyu, J., Nie, X., Kuang, H., Liang, L., Jia, H., et al. (2023). Ginsenoside Rg5 enhances the radiosensitivity of lung adenocarcinoma via reducing HSP90-CDC37 interaction and promoting client protein degradation. J. Pharm. Anal. 13, 1296–1308. doi: 10.1016/j.jpha.2023.06.004
Bi, Y., Li, Q., Tao, W., Tang, J., You, G., and Yu, L. (2021). Ginsenoside Rg1 and ginsenoside Rh1 prevent liver injury induced by acetaminophen in mice. J. Food Biochem., e13816. doi: 10.1111/jfbc.13816
Bi-lian, C. (2013). Analysis of polyacetylenes in different parts of Panax notoginseng by GC-MS. Chin. Traditional Patent Med.
Chen, W., Gong, L., Guo, Z., Wang, W., Zhang, H., Liu, X., et al. (2013). A novel integrated method for large-scale detection, identification, and quantification of widely targeted metabolites: application in the study of rice metabolomics. Mol. Plant 6, 1769–1780. doi: 10.1093/mp/sst080
Chen, X., Sheng, Z., Qiu, S., Yang, H., Jia, J., Wang, J., et al. (2019). Purification, characterization and in vitro and in vivo immune enhancement of polysaccharides from mulberry leaves. PLoS One 14, e0208611. doi: 10.1371/journal.pone.0208611
Fraga, C. G., Clowers, B. H., Moore, R. J., and Zink, E. M. (2010). Signature-discovery approach for sample matching of a nerve-agent precursor using liquid chromatography-mass spectrometry, XCMS, and chemometrics. Anal. Chem. 82, 4165–4173. doi: 10.1021/ac1003568
Gu, C., Wang, Y. Q., Su, B. J., Hu, Y. J., Liao, H. B., and Liang, D. (2024). Triterpenoids and triterpenoid saponins from Vitex negundo and their anti-inflammatory activities. Phytochemistry. 222, 114068. doi: 10.1016/j.phytochem.2024.114068
Han, W., Ward, J. L., Kong, Y., and Li, X. (2023). Editorial: Targeted and untargeted metabolomics for the evaluation of plant metabolites in response to the environment. Front. Plant Sci. 14, 1167513. doi: 10.3389/fpls.2023.1167513
Kim, J. K., Lee, E. K., Bae, C. H., Park, S. D., Shim, J. J., Lee, J. L., et al. (2021). The impact of gut microbiome on the pharmacokinetics of ginsenosides rd and rg3 in mice after oral administration of red ginseng. Am. J. Chin. Med. 49, 1897–1912. doi: 10.1142/S0192415X21500890
Kim, H., Lee, J. H., Kim, J. E., Kim, Y. S., Ryu, C. H., Lee, H. J., et al. (2018). Micro-/nano-sized delivery systems of ginsenosides for improved systemic bioavailability. J. Ginseng Res. 42, 361–369. doi: 10.1016/j.jgr.2017.12.003
Lehto, K., Karlsson, I., Lundholm, C., and Pedersen, N. L. (2019). Genetic risk for neuroticism predicts emotional health depending on childhood adversity. Psychol. Med. 49, 260–267. doi: 10.1017/S0033291718000715
Li, Y., Guo, Q., Huang, J., and Wang, Z. (2022a). Antidepressant active ingredients from chinese traditional herb Panax notoginseng: A pharmacological mechanism review. Front. Pharmacol. 13, 922337. doi: 10.3389/fphar.2022.922337
Li, Y. and Li, L. (2020). Retention time shift analysis and correction in chemical isotope labeling liquid chromatography/mass spectrometry for metabolome analysis. Rapid Commun. Mass Spectrom. 34 Suppl 1, e8643. doi: 10.1002/rcm.8643
Li, X. Y., Xu, J. D., Zhou, S. S., Kong, M., Xu, Y. Y., Zou, Y. T., et al. (2018). Time segment scanning-based quasi-multiple reaction monitoring mode by ultra-performance liquid chromatography coupled with quadrupole/time-of-flight mass spectrometry for quantitative determination of herbal medicines: Moutan Cortex, a case study. J. Chromatogr A. 1581-1582, 33–42.
Li, Y., Yang, B., Guo, W., Zhang, P., Zhang, J., Zhao, J., et al. (2022b). Classification of three types of ginseng samples based on ginsenoside profiles: appropriate data normalization improves the efficiency of multivariate analysis. Heliyon. 8, e12044. doi: 10.1016/j.heliyon.2022.e12044
Li, Y., Zhu, W., Xiang, Q., Kim, J., Dufresne, C., Liu, Y., et al. (2023). Creation of a plant metabolite spectral library for untargeted and targeted metabolomics. Int. J. Mol. Sci. 24. doi: 10.3390/ijms24032249
Liu, Z., Moore, R., Gao, Y., Chen, P., Yu, L., Zhang, M., et al. (2022). Comparison of phytochemical profiles of wild and cultivated american ginseng using metabolomics by ultra-high performance liquid chromatography-high-resolution mass spectrometry. Molecules 28. doi: 10.3390/molecules28010009
Liu, Y., Xin, H., Li, W., Shen, N., and Cui, Y. (2022). Ginkgo biloba endopleura: An unexplored industrial waste as a potential source of flavonoids, lipids and anti-lung cancer compounds. Ind. Crops Products. 189, 115851. doi: 10.1016/j.indcrop.2022.115851
Ma, J., Zhang, C., He, Y., Chen, X., and Lin, G. (2022). Fasting augments pyrrolizidine alkaloid-induced hepatotoxicity. Arch. Toxicol. 96, 639–651. doi: 10.1007/s00204-021-03193-y
Novoa, J., Westra, I., Steeneveld, E., Neves, N. F., Daleman, L., Asensio, A. B., et al. (2024). Validating human induced pluripotent stem cell-specific quality control tests for the release of an intermediate drug product in a Good Manufacturing Practice quality system. Cytotherapy. 26, 1105–1117. doi: 10.1016/j.jcyt.2024.04.004
Ogata, H., Goto, S., Sato, K., Fujibuchi, W., Bono, H., and Kanehisa, M. (1999). KEGG: kyoto encyclopedia of genes and genomes. Nucleic Acids Res. 27, 29–34. doi: 10.1093/nar/27.1.29
Povydysh, M. N., Titova, M. V., Ivanov, I. M., Klushin, A. G., Kochkin, D. V., Galishev, B. A., et al. (2021). Effect of Phytopreparations Based on Bioreactor-Grown Cell Biomass of Dioscorea deltoidea, Tribulus terrestris and Panax japonicus on Carbohydrate and Lipid Metabolism in Type 2 Diabetes Mellitus. Nutrients 13. doi: 10.3390/nu13113811
Su, W., Liang, Z., Pan, D., Zhang, L., Zhang, Y., Yuan, T., et al. (2024). Therapeutic effect of notoginseng saponins before and after fermentation on blood deficiency rats. Exp. Ther. Med. 27, 143. doi: 10.3892/etm.2024.12431
Szijj, P. and Chudasama, V. (2021). The renaissance of chemically generated bispecific antibodies. Nat. Rev. Chem. 5, 78–92. doi: 10.1038/s41570-020-00241-6
Xiao, X., Guan, X., Xu, Z., and Lu, Q. (2024). In-situ metabolic profiling of different kinds of rheum palmatum L. by laser desorption-dielectric barrier discharge ionization mass spectrometry imaging. Metabolites. 14.
Yang, Q., Guo, B., He, Y., Long, F., Zheng, Y., Che, T., et al. (2022). Effects of ginsenoside rg1 on the biological activity of human periodontal ligament cells. BioMed. Res. Int. 2022, 7576359. doi: 10.1155/2022/7576359
Zhang, Y., Zhao, Y., Ran, Y., Guo, J., Cui, H., and Liu, S. (2020). Notoginsenoside R1 attenuates sevoflurane-induced neurotoxicity. Transl. Neurosci. 11, 215–226. doi: 10.1515/tnsci-2020-0118
Zhang, X., Zheng, F., Zhao, C., Li, Z., Li, C., Xia, Y., et al. (2022). Novel method for comprehensive annotation of plant glycosides based on untargeted LC-HRMS/MS metabolomics. Anal. Chem. 94, 16604–16613. doi: 10.1021/acs.analchem.2c02362
Zhao, C., Fu, J., Wang, Y., and Zhou, Y. (2025). Latest evidence and perspectives of Panax notoginseng extracts and preparations for the treatment of cardiovascular diseases. J. Cardiovasc. Pharmacol. 85, 248–260. doi: 10.1097/FJC.0000000000001670
Zhao, Y. N., Shao, X., Ouyang, L. F., Chen, L., and Gu, L. (2018). Qualitative detection of ginsenosides in brain tissues after oral administration of high-purity ginseng total saponins by using polyclonal antibody against ginsenosides. Chin. J. Nat. Med. 16, 175–183. doi: 10.1016/S1875-5364(18)30045-1
Zheng, D., Chu, Y., Li, S., Zhou, S., Li, W., Xie, Y., et al. (2022). Enhancing effect of borneol on pharmacokinetics of ginsenoside Rb(1), ginsenoside Rg(1), and notoginsenoside R(1) in healthy volunteers after oral administration of compound Danshen dropping pills. BioMed. Chromatogr. 36, e5311. doi: 10.1002/bmc.5311
Keywords: targeted metabolome, Panax notoginseng stems and leaves, triterpenoid saponins, biological activity, main components
Citation: Qin F, Chen Y, Wang D, Li J and Zhu S (2025) Analysis of the main components of LSPN based on broadly targeted metabolomics technology. Front. Plant Sci. 16:1618168. doi: 10.3389/fpls.2025.1618168
Received: 02 May 2025; Accepted: 30 September 2025;
Published: 22 October 2025.
Edited by:
Marta Sousa Silva, University of Lisbon, PortugalReviewed by:
Rasmieh Hamid, Agricultural Research, Education and Extension Organization (AREEO), IranLina Maria Londoño Giraldo, Universidad Libre Seccional Pereira, Colombia
Copyright © 2025 Qin, Chen, Wang, Li and Zhu. This is an open-access article distributed under the terms of the Creative Commons Attribution License (CC BY). The use, distribution or reproduction in other forums is permitted, provided the original author(s) and the copyright owner(s) are credited and that the original publication in this journal is cited, in accordance with accepted academic practice. No use, distribution or reproduction is permitted which does not comply with these terms.
*Correspondence: Shanyuan Zhu, anN0em15OTIyQDE2My5jb20=
†ORCID: Feng Qin, orcid.org/0000-0002-8349-5162