 Jieyin Zhao
 Xuening Su
 Wenju Gao
 Quanjia Chen
 Yanying Qu
- Xinjiang Key Laboratory of Crop Biological Breeding, Engineering Research Centre of Cotton, Ministry of Education, College of Agriculture, Xinjiang Agricultural University, Urumqi, China
F-box-LRR (FBL) genes play crucial roles in the response of plants to pathogen stress. This study involved a systematic analysis of the evolution of the FBL gene family in Gossypium hirsutum from a whole-genome perspective, and through expression pattern analysis combined with virus-induced gene silencing (VIGS), Gh_FBL43 was identified as a gene associated with resistance to Verticillium wilt in G. hirsutum. Further RNA-seq analysis revealed key pathways and genes regulated by Gh_FBL43. The G. hirsutum genome contains 57 FBL genes, which can be divided into five subgroups that were relatively conserved during the evolution of cotton. Expression analysis revealed that the expression level of Gh_FBL43 significantly increased under Verticillium wilt stress, with notable differences observed among extreme varieties. VIGS-meditated silencing of Gh_FBL43 was performed, and the leaves of the silenced plants presented chlorosis and necrosis, with the disease severity index (DSI) and disease severity rate (DSR) being significantly greater than those of the empty vector control plants. RNA-seq data from Gh_FBL43-silenced and control plants at 0 h and 24 h post-infection revealed 10,928 differentially expressed genes (DEGs), including 2,051 shared DEGs. Enrichment analysis combined with expression pattern analysis indicated that the silencing of Gh_FBL43 reduced the expression of genes in jasmonic acid (JA) and flavonoid-related pathways. In conclusion, our findings demonstrate the important role of the Gh_FBL43 gene family in conferring resistance to Verticillium wilt in G. hirsutum, potentially regulating this resistance through JA and flavonoid-related pathways, thereby laying a foundation for further elucidation of the molecular mechanisms by which Gh_FBL43 confers resistance to Verticillium wilt.
Introduction
Cotton is not only an important raw material for the textile industry but also a significant source of feed and biofuels (Saleem et al., 2024). Gossypium hirsutum plays a crucial role in cotton production; however, Verticillium wilt, a disease caused by the pathogen Verticillium dahliae, severely restricts the yield and quality of G. hirsutum (Zhu et al., 2023). Each year, the average yield loss due to cotton wilt is approximately 10–35%. Verticillium wilt is the most severe vascular disease affecting cotton, and the primary causative pathogen is V. dahliae, a semibiotrophic filamentous fungus that mainly infects plant roots through the soil (Kowalska, 2021). The mycelia penetrate the root surface and reside in the vascular bundles, leading to plant death. The main pathogenic mechanism involves the obstruction of xylem vessels and the production of toxins (Zhang et al., 2022). Increased transpiration and respiration in the aerial parts of the cotton plant lead to an imbalance of moisture within the plant, resulting in symptoms such as leaf wilting, yellowing, and browning of vascular bundles, ultimately leading to plant death (Bhandari et al., 2020).
Plants experience attacks from various pathogens during their growth and development. To resist such attacks, plants have developed multiple defense mechanisms, one of which is controlled by resistance (R) genes (Kourelis and Van Der Hoorn, 2018). R genes are capable of directly conferring disease resistance and can specifically recognize and activate plant defense responses and systemic acquired resistance (Kiraly et al., 2007). In recent years, several R genes have been cloned for research on plant disease resistance. Systematic analysis of R genes has revealed that they have similar structures and that most possess conserved domains (TIR-NBS-LRR) (Zhou et al., 2022). Since F-box-LRR (FBL) genes contains R gene structural domains, they play a crucial role in the process of plant disease resistance (Dou et al., 2025). The F-box protein ACRE189/ACIF1 can regulate the activation of programmed cell death and defense responses in tobacco and tomato in response to pathogens (van den Burg et al., 2008). In rice, overexpression of the F-box protein-encoding gene OsDRF1 enhances disease resistance (Cao et al., 2008). In maize, overexpression of ZmFBL41 leads to decreased resistance to gray leaf spot disease, whereas knockout of ZmFBL41 increases resistance (Li et al., 2019). Further experimentation has shown that ZmFBL41 can interact with ZmCAD, regulating resistance to gray leaf spot disease by modulating the accumulation of lignin. Increasing evidence indicates the significant role of F-box proteins in plant disease resistance (Yang et al., 2024). Many hormone receptors contain F-box structural domains, such as the Arabidopsis thaliana MAX2 protein, which is an F-box protein with an LRR domain at the C-terminus. AtMAX2 blocks bacterial invasion by closing stomata (Zheng et al., 2023). Silencing the LRR gene GbRVd in cotton through virus-induced gene silencing (VIGS) significantly decreased the levels of salicylic acid (SA), nitric oxide (NO) and hydrogen peroxide, resulting in decreased resistance to wilt disease (Yang et al., 2016).
RNA-seq has high sequencing throughput, a wide range of applications, and high sensitivity, offering significant convenience for screening differentially expressed genes (DEGs) and investigating key DEGs (Ren et al., 2024). Through RNA-seq, many key regulatory networks and pathways related to plant growth, development, and stress resistance have been revealed, providing important clues and insights for elucidating the molecular mechanisms associated with important genes and traits (Ebeed and Ceasar, 2024). Transcriptomic analysis of transgenic A. thaliana overexpressing ScDREB10 suggested that ScDREB10 may regulate plant tolerance to abiotic stress by affecting phenylpropanoid biosynthesis and starch and sucrose metabolism (Liang et al., 2024). Transcriptomic sequencing of transgenic peanut lines overexpressing MYB revealed that the MAPK cascade, ethylene, auxin, and abscisic acid-related genes are crucial for the response to abiotic stress (Raziq et al., 2024). An analysis of the transcriptome and metabolome of A. thaliana lines transformed with the rice Os-LBD37/ASL39 gene revealed significant changes in nitrogen-containing metabolites in the transgenic lines, leading to the identification of Os-LBD37/ASL39 as a nitrogen metabolism regulatory gene in rice (Kusano and Saito, 2012). These results indicate that transcriptomics has significant potential for revealing the regulatory mechanisms of important functional genes.
By studying the evolution of gene families, sufficient information can be gained regarding their diversity and biological functions (Goyal et al., 2023). In recent years, with advancements in sequencing technologies and a reduction in sequencing costs, the sequences of plant genomes have been continuously improved and updated, laying the foundation for the identification and study of gene family evolution and function at the whole-genome level (Cheng et al., 2021). Although candidate genes related to Verticillium wilt have been identified in cotton, analyses of the regulatory mechanisms are severely lacking (Zhao et al., 2021; Cui et al., 2021; Ayyaz et al., 2025). The FBL family of genes is potentially involved in plant disease resistance. However, the evolution, function, and classification of this gene family in G. hirsutum have not been systematically studied. This study analyzes the evolutionary relationships, gene structures, and promoter cis-regulatory elements of G. hirsutum FBL genes. Through expression pattern analysis combined with VIGS, it was determined that Gh_FBL43 plays a significant role in the resistance of G. hirsutum to Verticillium wilt. The RNA-seq data before and after infection of the silenced and control plants revealed the regulatory pathways through which Gh_FBL43 confers resistance to Verticillium wilt. These results will further broaden our understanding of the role of FBL genes in plants and provide valuable insights for deeper analysis of the regulatory mechanisms of Gh_FBL43 in combating Verticillium wilt.
Materials and methods
Plant material
The wilt-resistant variety Zhongzhimian 2 and the wilt-susceptible variety Junmian 1 were selected for expression analysis under wilt disease stress. The materials were provided by the Cotton Innovation Team of the College of Agriculture at Xinjiang Agricultural University and were planted in the Cotton Cultivation Laboratory of the Key Laboratory of Agriculture and Biotechnology at Xinjiang Agricultural University. Seeds of uniform fullness were selected and sown in a mixture of perlite and sterilized soil (ratio of 1:2), with three seeds per pot. The laboratory was maintained at a daytime temperature of 25.0 to 28.0°C and illuminated with incandescent lighting. Germination occurred under a cycle of 16 hours of light and 8 hours of darkness, with a relative humidity of 80%. When the cotton plants developed three true leaves, the bottom-tear root method was used to inoculate the plants with the wilt pathogen V991, with three replicates for each treatment. Root tissue samples were collected at 0, 1, 3, 6, 12, 24 and 48 h post-wilt stress. All the samples were quickly frozen in liquid nitrogen and stored at -80°C.
Identification of cotton FBL gene family members and analysis of their physiochemical properties
The genomic data of G. hirsutum, G. barbadense, G. arboreum and G. raimondii were downloaded from the CottonGen database (https://www.cottongen.org/). The hidden Markov model of the F-box domain (PF00646) and HMMER 3.2.1 software (http://hmmer.org/) were used to identify the F-box protein sequences in G. hirsutum, G. barbadense, G. arboreum and G. raimondii (Prakash et al., 2017). We verified whether the candidate sequences possessed complete F-box and LRR domains using the CDD database (https://www.ncbi.nlm.nih.gov/Structure/cdd/wrpsb.cgi), ultimately obtaining the FBL protein sequences for G. hirsutum, G. barbadense, G. arboreum and G. raimondii. The physicochemical properties of G. hirsutum FBL proteins were predicted via the online tool ExPASy (https://web.expasy.org/protparam/).
Phylogenetic analysis of the FBL gene family in G. hirsutum
With the default parameters of ClustalW in MEGA X software, multiple sequence alignments of FBL protein sequences from G. hirsutum, G. barbadense, G. arboreum and G. raimondii were performed (Kumar et al., 2018). The phylogenetic tree was constructed using the neighbor-joining (NJ) method with a bootstrap value of 1000. The online tool EvolView (https://www.evolgenius.info/evolview/) was employed to enhance the visualization of the phylogenetic tree. The MEME online tool (http://alternate.meme-suite.org/tools/meme) was used to analyze the motifs of the G. hirsutum FBL gene family, with the number of functional domains set to 10. The xml file generated by MEME, the nwk file of the phylogenetic tree, and the GFF3 file of gene structures were visualized using TBtools software (Chen et al., 2023).
Analysis of cis-acting elements and expression patterns of G. hirsutum FBL genes
The 2000 bp sequence upstream of the start codon of the FBL gene from G. hirsutum was extracted and submitted to the PlantCARE (http://bioinformatics.psb.ugent.be/webtools/plantcare/html/) online tool to predict the cis-regulatory elements in the gene promoter, and TBtools software was used for visualization (Chen et al., 2023). The transcriptome sequencing data of G. hirsutum were downloaded from the NCBI database (accession numbers: PRJNA248163 and PRJNA532694). Fastp (version 0.23.4) software was used for filtering and quality control of the raw data (Chen et al., 2018). HISAT2 software was used to align the filtered data with the G. hirsutum TM-1 reference genome (https://www.cottongen.org/species/Gossypium_hirsutum/ZJU-AD1_v2.1), and StringTie software was used for expression quantification (Kim et al., 2019). Gene expression levels were determined via the FPKM method, and expression heatmaps were created via TBtools software.
qRT–PCR analysis
Total RNA extraction was performed using an RNA extraction kit (Tiangen, China). cDNA was synthesized from RNA using the M-MLV RTase cDNA Synthesis Kit (TaKaRa, Japan). The qRT–PCR primers used were designed using Primer Premier 5.0 software (Supplementary Table S1), with the GhUBQ7 gene from G. hirsutum used as the internal control. The qRT–PCRs were conducted using the ChamQ Universal SYBR qPCR Master Mix (Novogene Bioinformatics Technology Co., Ltd., Nanjing). The reaction program consisted of 30 seconds at 95°C for initial denaturation, followed by 40 cycles of 10 seconds at 95°C for denaturation, 30 seconds at 60°C for annealing, and 20 seconds at 72°C for extension. Each sample was examined in triplicate. The quantitative data were analyzed using the 2–ΔΔCT method (Livak and Schmittgen, 2001).
Cotton VIGS
VIGS experiments involving tobacco rattle virus (TRV) were conducted on cotton (Bachan and Dinesh-Kumar, 2012). The vectors pTRV2 and pTRV1 containing specific regions of Gh_FBL43 were subsequently transformed into Agrobacterium GV3101. The restriction sites selected were BamHI and KpnI, and the primer sequences for amplifying the Gh_FBL43 fragment are shown in Supplementary Table S1. A mixture of Agrobacterium cells containing pTRV1, pTRV2, or the derived plasmids was transformed into 7-day-old seedlings. After inoculation, the seedlings were washed with deionized water to remove excess Agrobacterium residue and were grown at 25°C under a 16 hour/8 hour light/dark cycle. After 2 weeks of cultivation, the plants were inoculated with the yellow wilt pathogen strain V991. At least 30 seedlings were treated in each trial, and the experiments were repeated three times to evaluate plant disease severity at 21 days post-inoculation.
RNA-seq: sequencing and analysis
Additionally, RNA-seq with three biological replicates was conducted on samples from the control group with empty vectors and the Gh_FBL43-silenced plants at 0 h and 24 h post-inoculation. The samples were transported to Aide Sen Biotechnology Co., Ltd., in Xinjiang (Urumqi, China) for sequencing using dry ice. RNA was extracted via a polysaccharide and polyphenol plant total RNA extraction kit, and the extraction process was carried out according to the instructions. After RNA extraction, a Nanodrop was used to determine the RNA purity (OD260/280) and concentration and to determine whether the nucleic acid absorption peak was normal. The integrity of the RNA was accurately detected with an Agilent 2100 instrument. The detection indicators included the following: the RIN value, 28S/18S ratio, whether the chromatogram baseline was increased, and the 5S peak. After the concentration and purity of the extracted RNA samples were determined, a library was constructed using an initial total amount of 1 μg for each sample. Preliminary quantification was performed using a Qubit 3.0 fluorometer, followed by detection of the inserted fragments in the library using the Qsep400 high-throughput analysis system. The effective concentration of the library was accurately quantified using the Q–PCR method to ensure library quality (effective library concentration > 2 nM). The libraries were sequenced on an Illumina HiSeq 2500 (California, USA) platform to generate 150 bp paired-end reads. Fastp (version 0.23.4) software was used to remove reads containing adapters and low-quality reads, resulting in clean data (Chen et al., 2018). The clean reads were aligned to the G. hirsutum TM-1 reference genome (https://www.cottongen.org/species/Gossypium_hirsutum/ZJU-AD1_v2.1) using HISAT2 software, and the aligned reads were quantified with StringTie (Kim et al., 2019). DEGs were screened on the basis of gene count values in various samples using DEseq2 software, applying |log2fold change| ≥ 1 and FDR < 0.01 as selection criteria (Love et al., 2014). The fragments per kilobase of exon model per million mapped fragments (FPKM) for each gene was calculated based on its length, and the expression amount mapped to that gene was calculated. R language PCAtools was used to decompose the expression data (FPKM) of all genes into n principal components to describe the characteristics of the original dataset. For all DEGs, Gene Ontology (GO) and Kyoto Encyclopedia of Genes and Genomes (KEGG) enrichment analyses were conducted via the hypergeometric test method with the R language ClusterProfiler (version 4.14.4) package (Wu et al., 2021).
Results
Identification of the FBL gene family in cotton
To study the variation in the copy number of the FBL gene family during the evolution of cotton, a total of 171 FBL family genes were identified in the genomes of G. hirsutum, G. barbadense, G. arboreum and G. raimondii. In the two diploid cotton species (G. arboreum and G. raimondii), the number of FBL family genes is close to half of that in G. hirsutum. On the basis of the positions of 57 sequences in the chromosomes of G. hirsutum, the FBL genes in this species were named sequentially as Gh_FBL1 to Gh_FBL57 (Supplementary Table S2). The 57 G. hirsutum FBL genes are distributed across 24 chromosomes, with two FBL genes (Gh_FBL28 and Gh_FBL34) located on scaffold chromosomes (Supplementary Figure S1). The A subgenome contains 28 FBL genes, whereas the D subgenome contains 29 FBL genes. Except for there being one more FBL gene on chromosome D07 than on chromosome A07, the numbers of A subgenome and D subgenome genes in the remaining chromosomes are completely consistent. Overall, there remains a strong correspondence between the A subgenome and the D subgenome, which is consistent with the evolutionary relationships of cotton.
Evolutionary analysis of the FBL gene family
To better understand the evolutionary relationships of the cotton FBL gene family, a phylogenetic tree was constructed based on 171 FBL protein sequences from G. hirsutum, G. barbadense, G. arboreum and G. raimondii. Evolutionary tree analysis indicated that the cotton FBL gene family can be divided into five subgroups (Figure 1). Group 1 contains 50 FBL genes, Group 2 contains 17 FBL genes, Group 3 contains 35 FBL genes, Group 4 contains 14 FBL genes, and Group 5 contains 55 FBL genes. The number of FBL genes in each subgroup in both G. hirsutum and G. barbadense was approximately twice that in G. arboreum and G. raimondii. This finding is consistent with the earlier analysis results and aligns with the evolutionary relationships among the cotton species, suggesting that the FBL genes are relatively conserved during the evolution of cotton. Although Group 4 has fewer members, they have been conserved throughout the evolution of cotton, indicating that they may play crucial roles in biological processes.
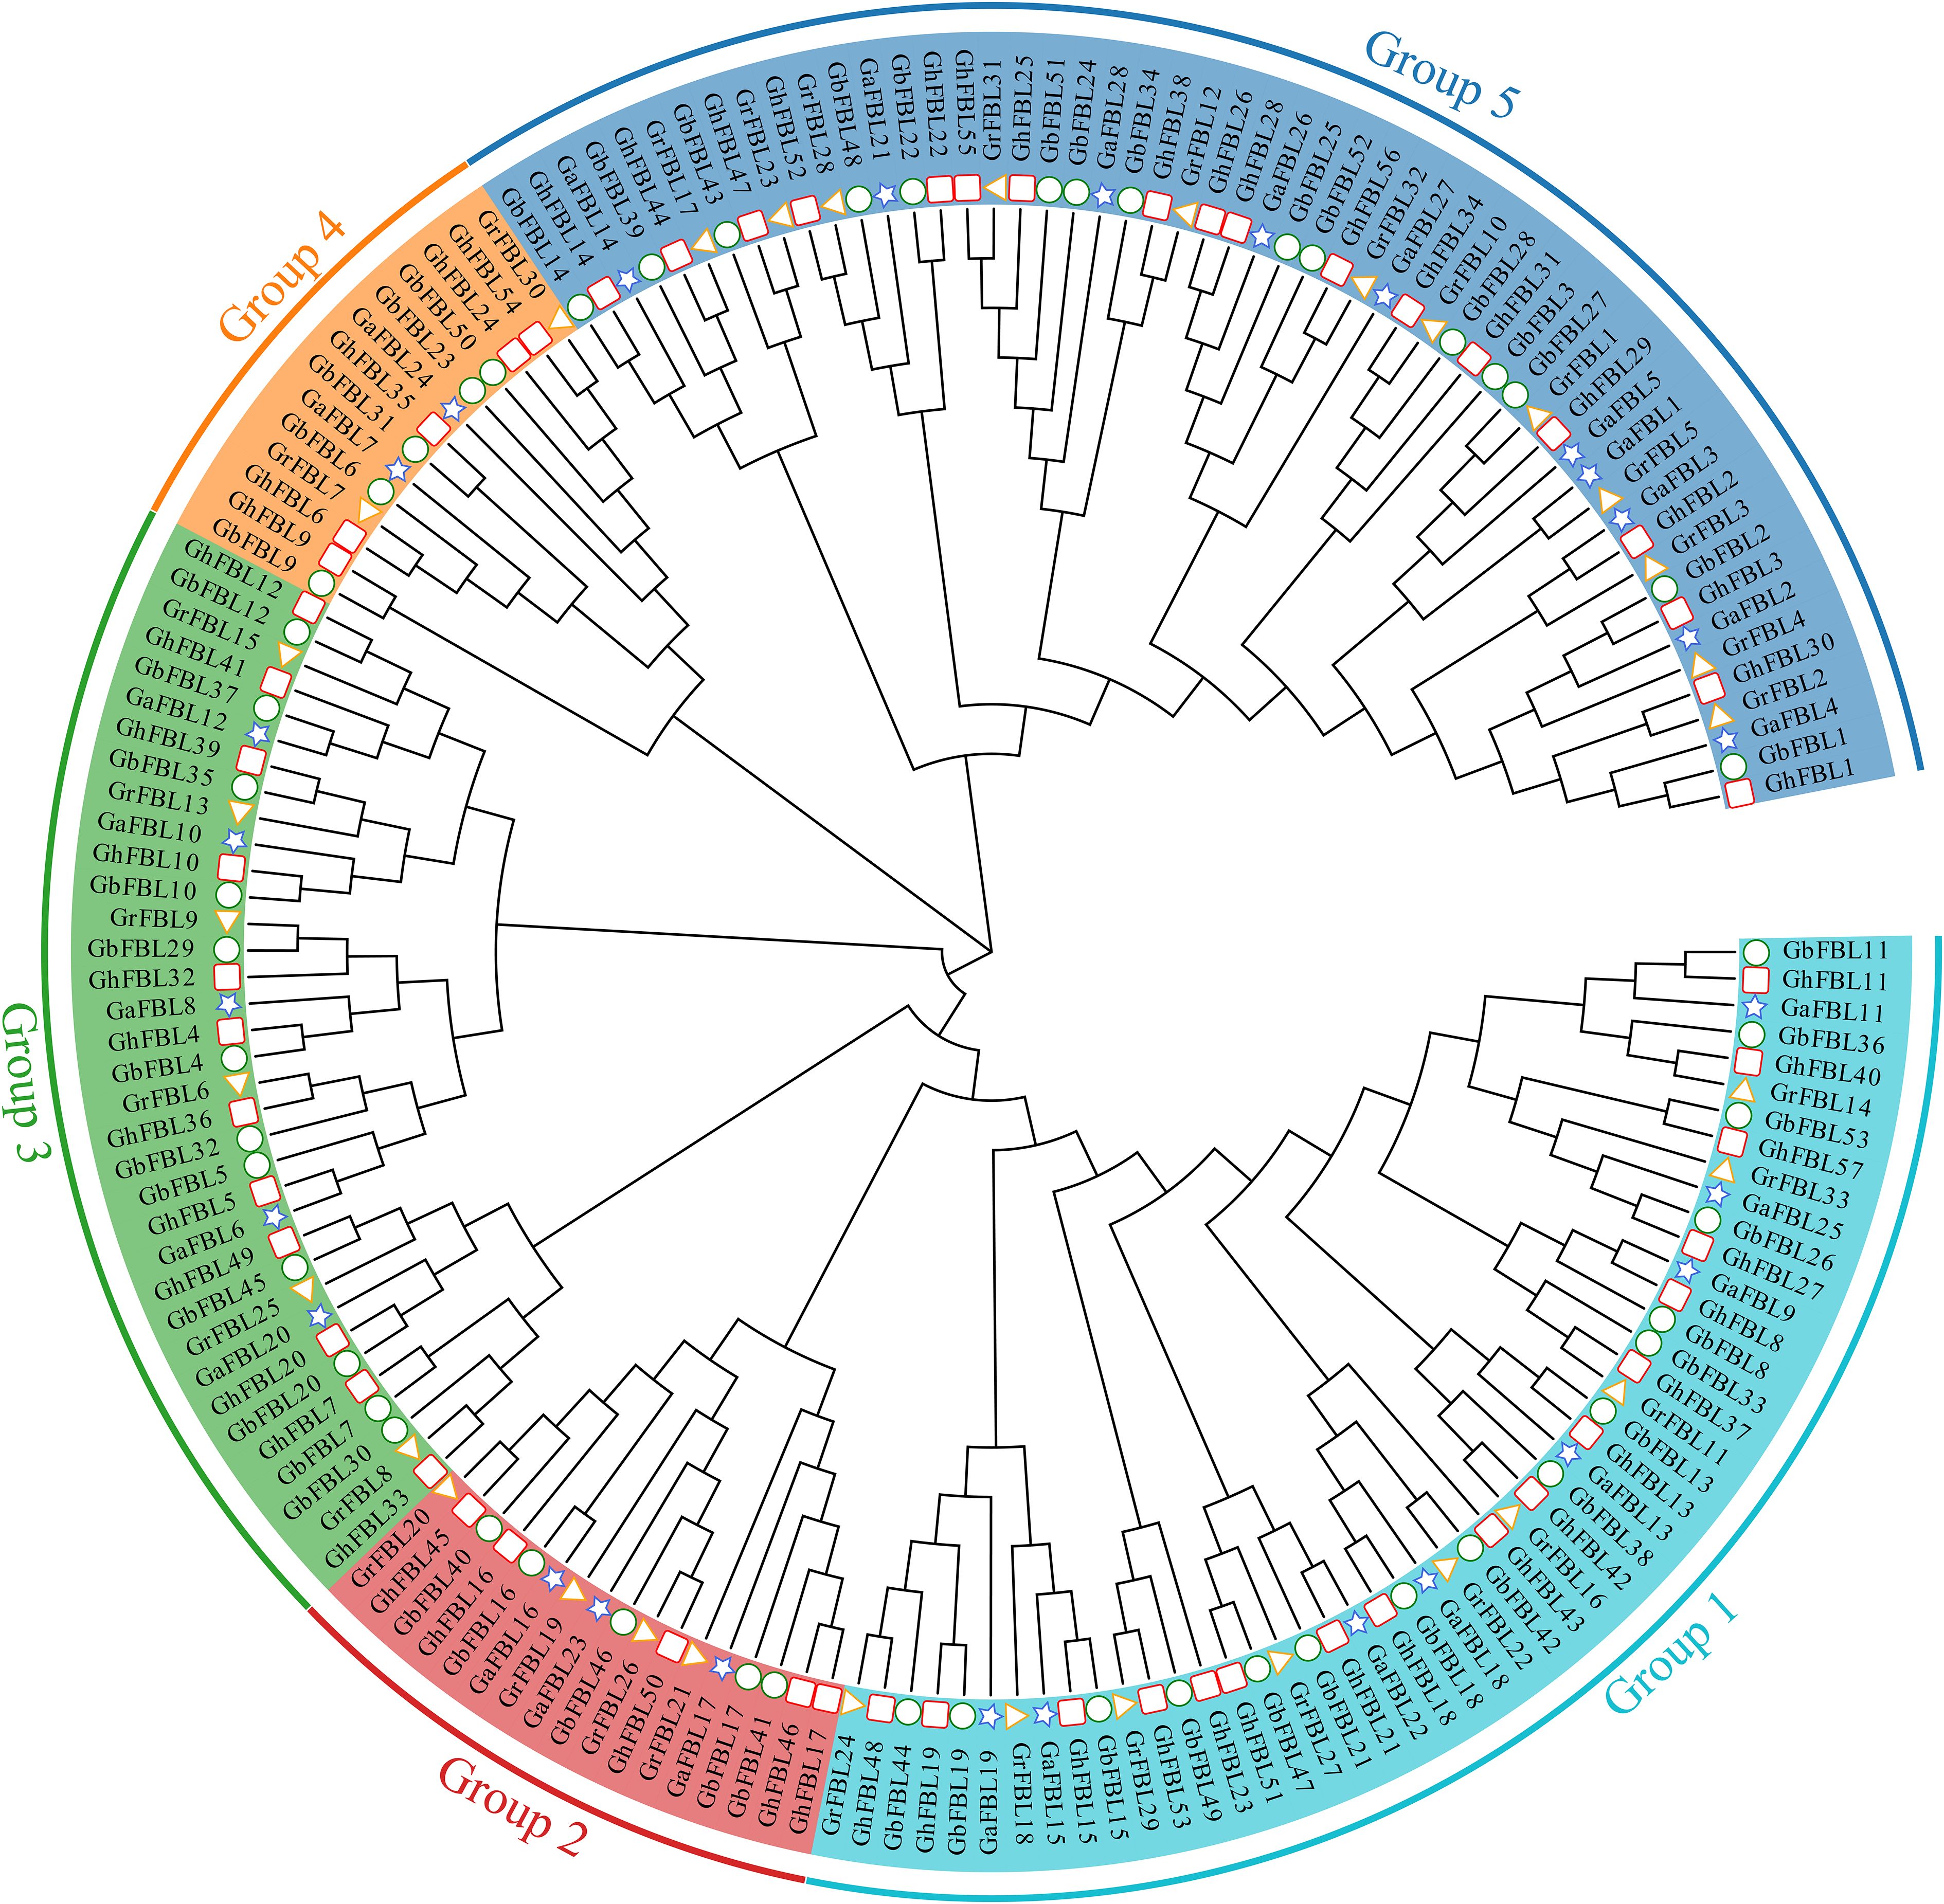
Figure 1. Phylogenetic tree of the cotton FBL gene family, with different colors representing different groups. The pentagon represents the G. arboreum FBL genes, the triangle represents the G. raimondii FBL genes, the circle denotes the G. barbadense FBL genes, and the square indicates the G. hirsutum FBL genes.
Evolution, gene structure, and motif analysis of the FBL gene family in G. hirsutum
Analysis of the phylogenetic tree, gene structure, and motifs was conducted on the basis of the full-length sequences, coding sequences (CDSs), and protein sequences of the G. hirsutum FBL genes (Figure 2). Most genes in Group 1 contain three exons and consist of two motifs (motif 3 and motif 10). In Group 2, genes contain either one or three exons and include seven motifs (motif 1, motif 3, motif 4, motif 7, motif 8, motif 9, and motif 10). Group 3 genes possess four or seventeen exons and comprise five motifs (motif 1, motif 2, motif 3, motif 7, and motif 8). Genes in Group 4 have either one or five exons and consist of four motifs (motif 1, motif 3, motif 4, and motif 8). Most genes in Group 5 contain two exons and encompass eight motifs (motif 1, motif 2, motif 3, motif 4, motif 5, motif 6, motif 7, and motif 9).
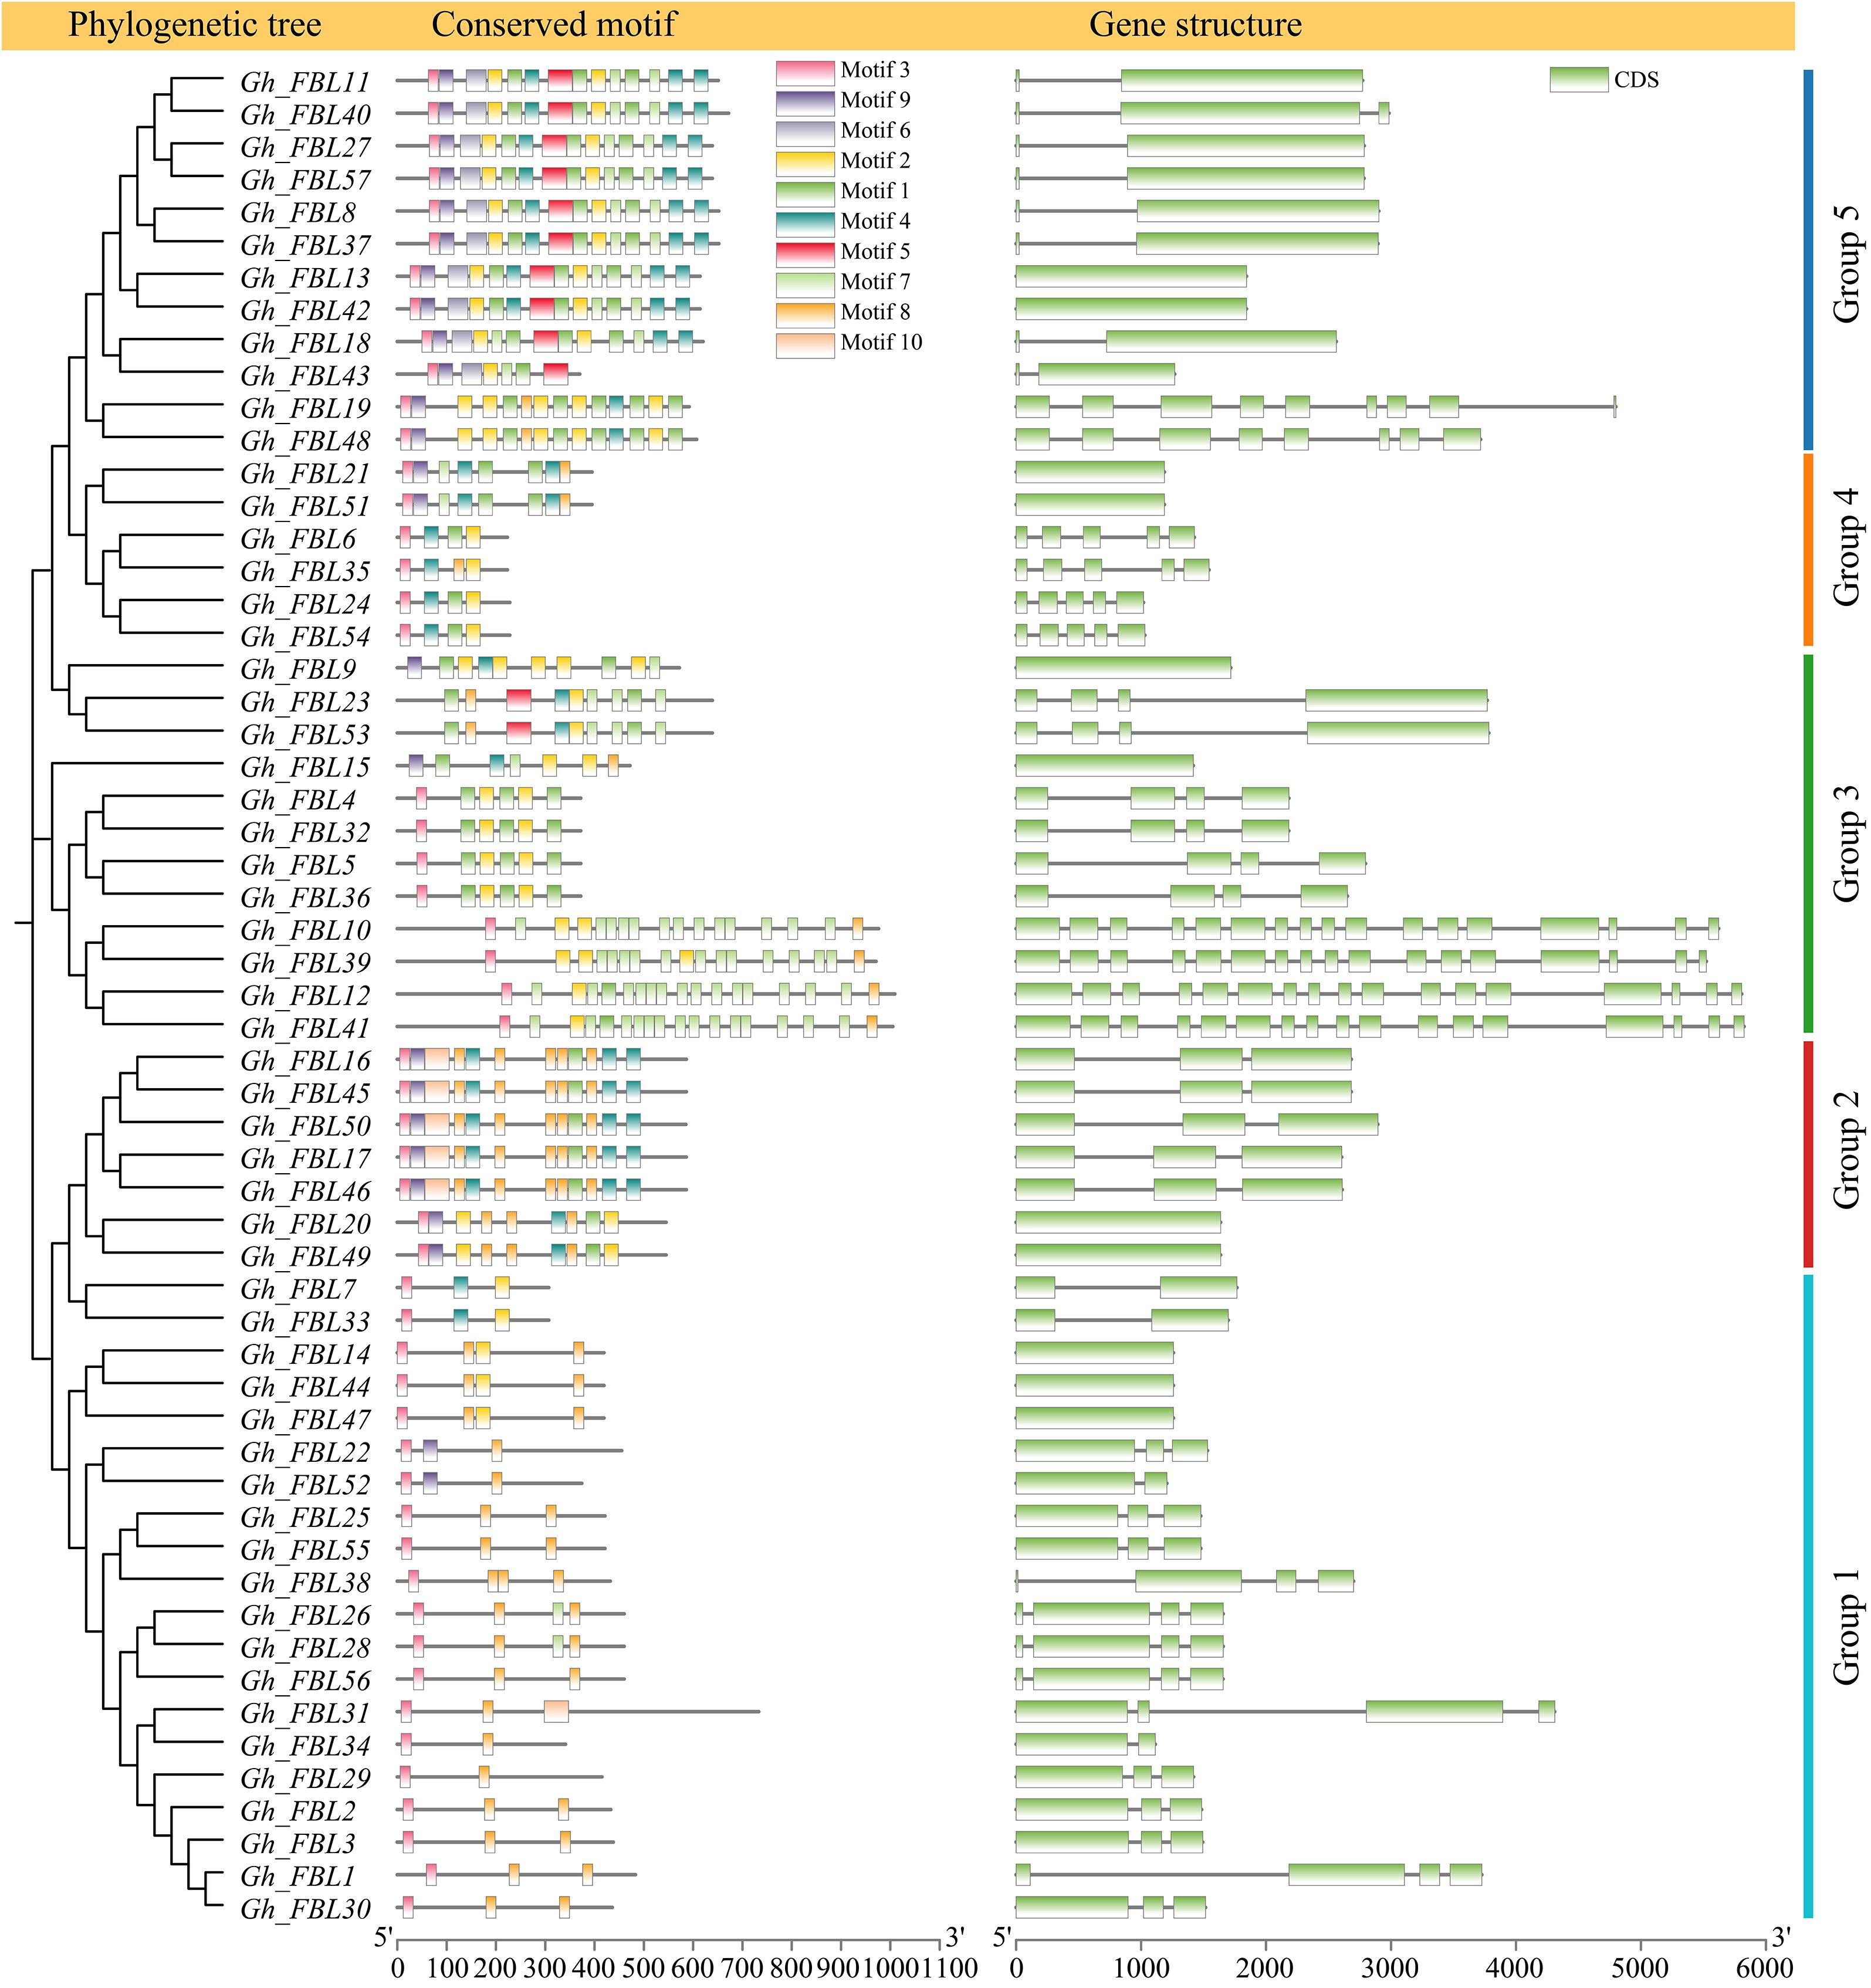
Figure 2. Gene structure and motif analysis of the FBL gene family in G. hirsutum.
Analysis of promoter homeopathic elements of the G. hirsutum FBL gene family
To investigate the potential functions of the FBL gene in G. hirsutum, the promoter region 2000 bp upstream of the GhFBL gene was analyzed, revealing a varying number of stress- and hormone-responsive cis-acting elements (Figure 3). A total of three types of cis-acting elements related to the stress response were identified: the MYB-binding site involved in drought inducibility (MBS), the cis-acting element involved in defense and stress responsiveness (TC-rich repeats), and the cis-acting element involved in low-temperature responsiveness (LTR). Additionally, eight hormone-related cis-acting elements were identified, including the cis-acting element involved in abscisic acid responsiveness (ABRE), the cis-acting regulatory elements involved in methyl jasmonate (MeJA) responsiveness (the CGTCA motif and TGACG motif), the cis-acting element involved in salicylic acid responsiveness (the TCA element), the auxin-responsive element (the TGA element), and the gibberellin-responsive elements (the P-box, GARE motif, and TATC box). Among these, the elements related to MeJA and abscisic acid were the most abundant, with 124 and 123 such elements, respectively. Each GhFBL promoter contained a different number and type of cis-acting elements, suggesting that these elements may participate in cotton growth and development and in response to environmental stress through different signaling pathways.
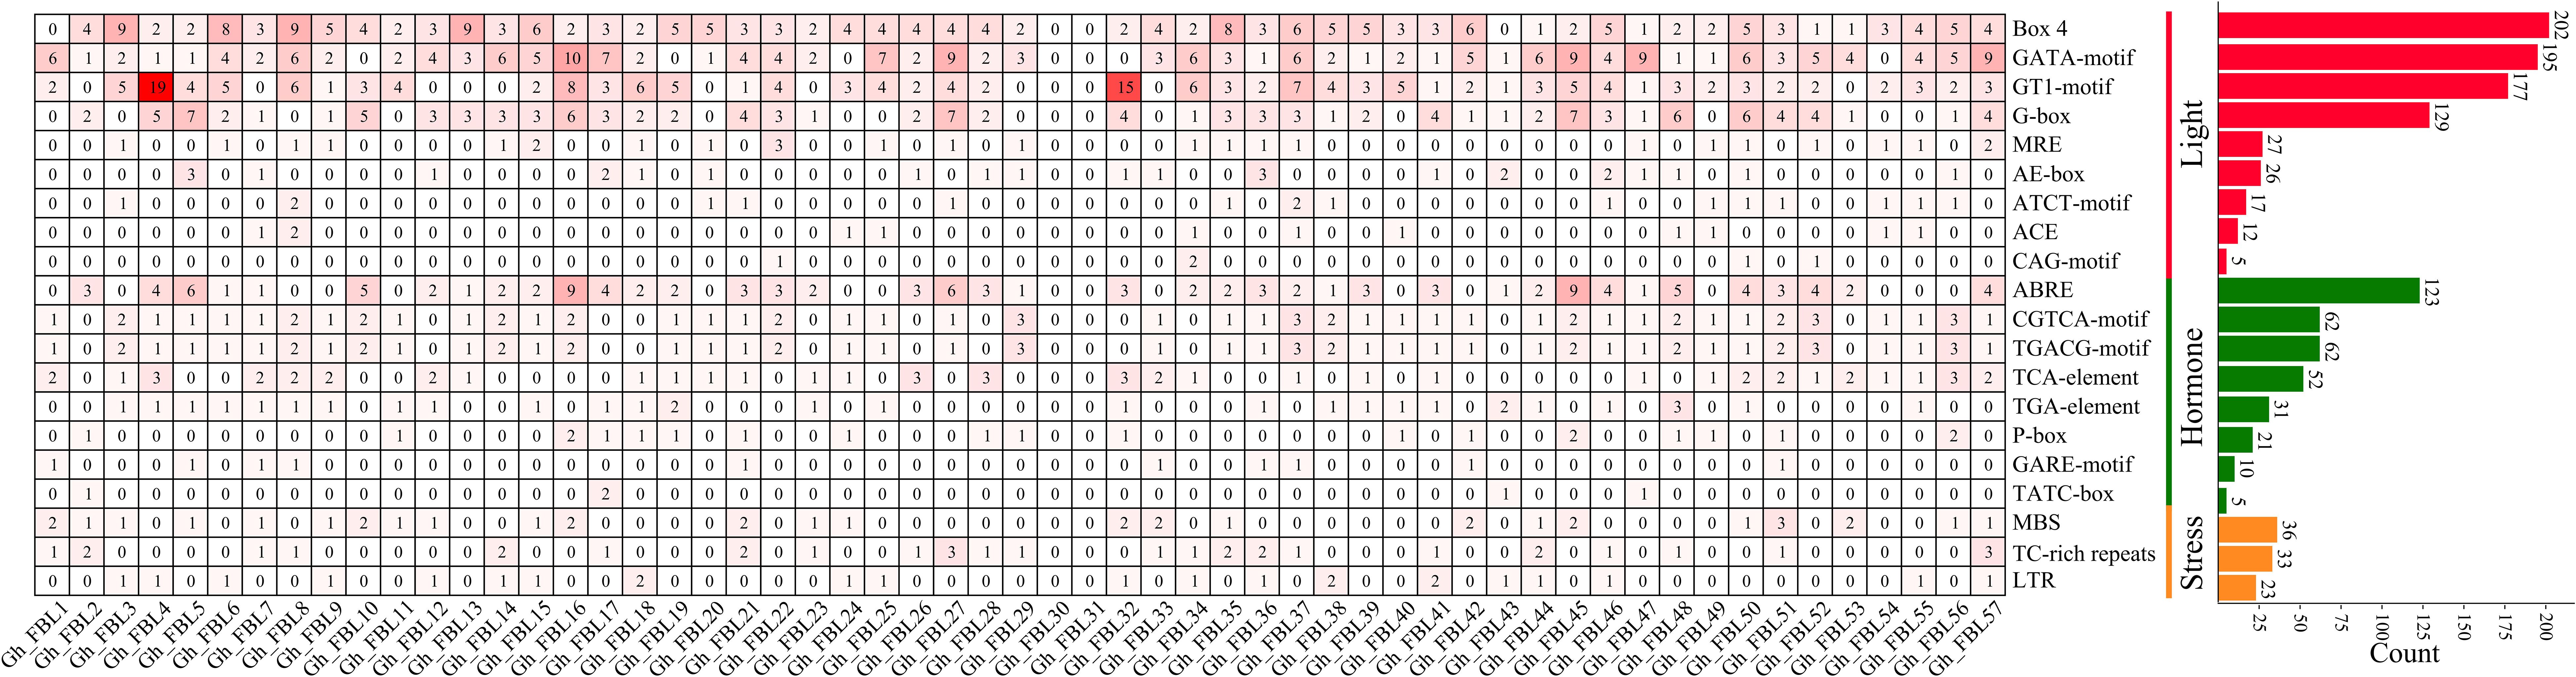
Figure 3. Analysis of homeopathic elements of FBL gene family promoters in G. hirsutum. The numbers in the heatmap represent the number of cis-acting elements of a specific gene, and the bar graph on the right represents the number of cis-acting elements of all FBL genes in G. hirsutum.
An analysis of the tissue-specific organization and expression patterns of the FBL gene family in G. hirsutum under wilt disease stress
Gene expression patterns are typically related to the functions of genes. The expression patterns of cotton FBL genes in different tissues and at various time points under Verticillium wilt stress were examined via RNA-seq analysis (Figure 4). The analysis of tissue-specific expression patterns revealed that 78.95% of the cotton FBL genes presented tissue-specific expression, with the highest expression levels observed primarily in the calyx, petal, stamen, and torus (Figure 4a). Following Verticillium wilt occurrence, more than 64.91% of the cotton FBL genes presented changes in expression levels, indicating that FBL family genes may play a significant role in the response of cotton to Verticillium wilt stress (Figure 4b). Among them, the five genes (Gh_FBL20, Gh_FBL24, Gh_FBL36, Gh_FBL43 and Gh_FBL48) that presented the most pronounced changes were selected as candidate genes for further validation of cotton resistance to Verticillium wilt.
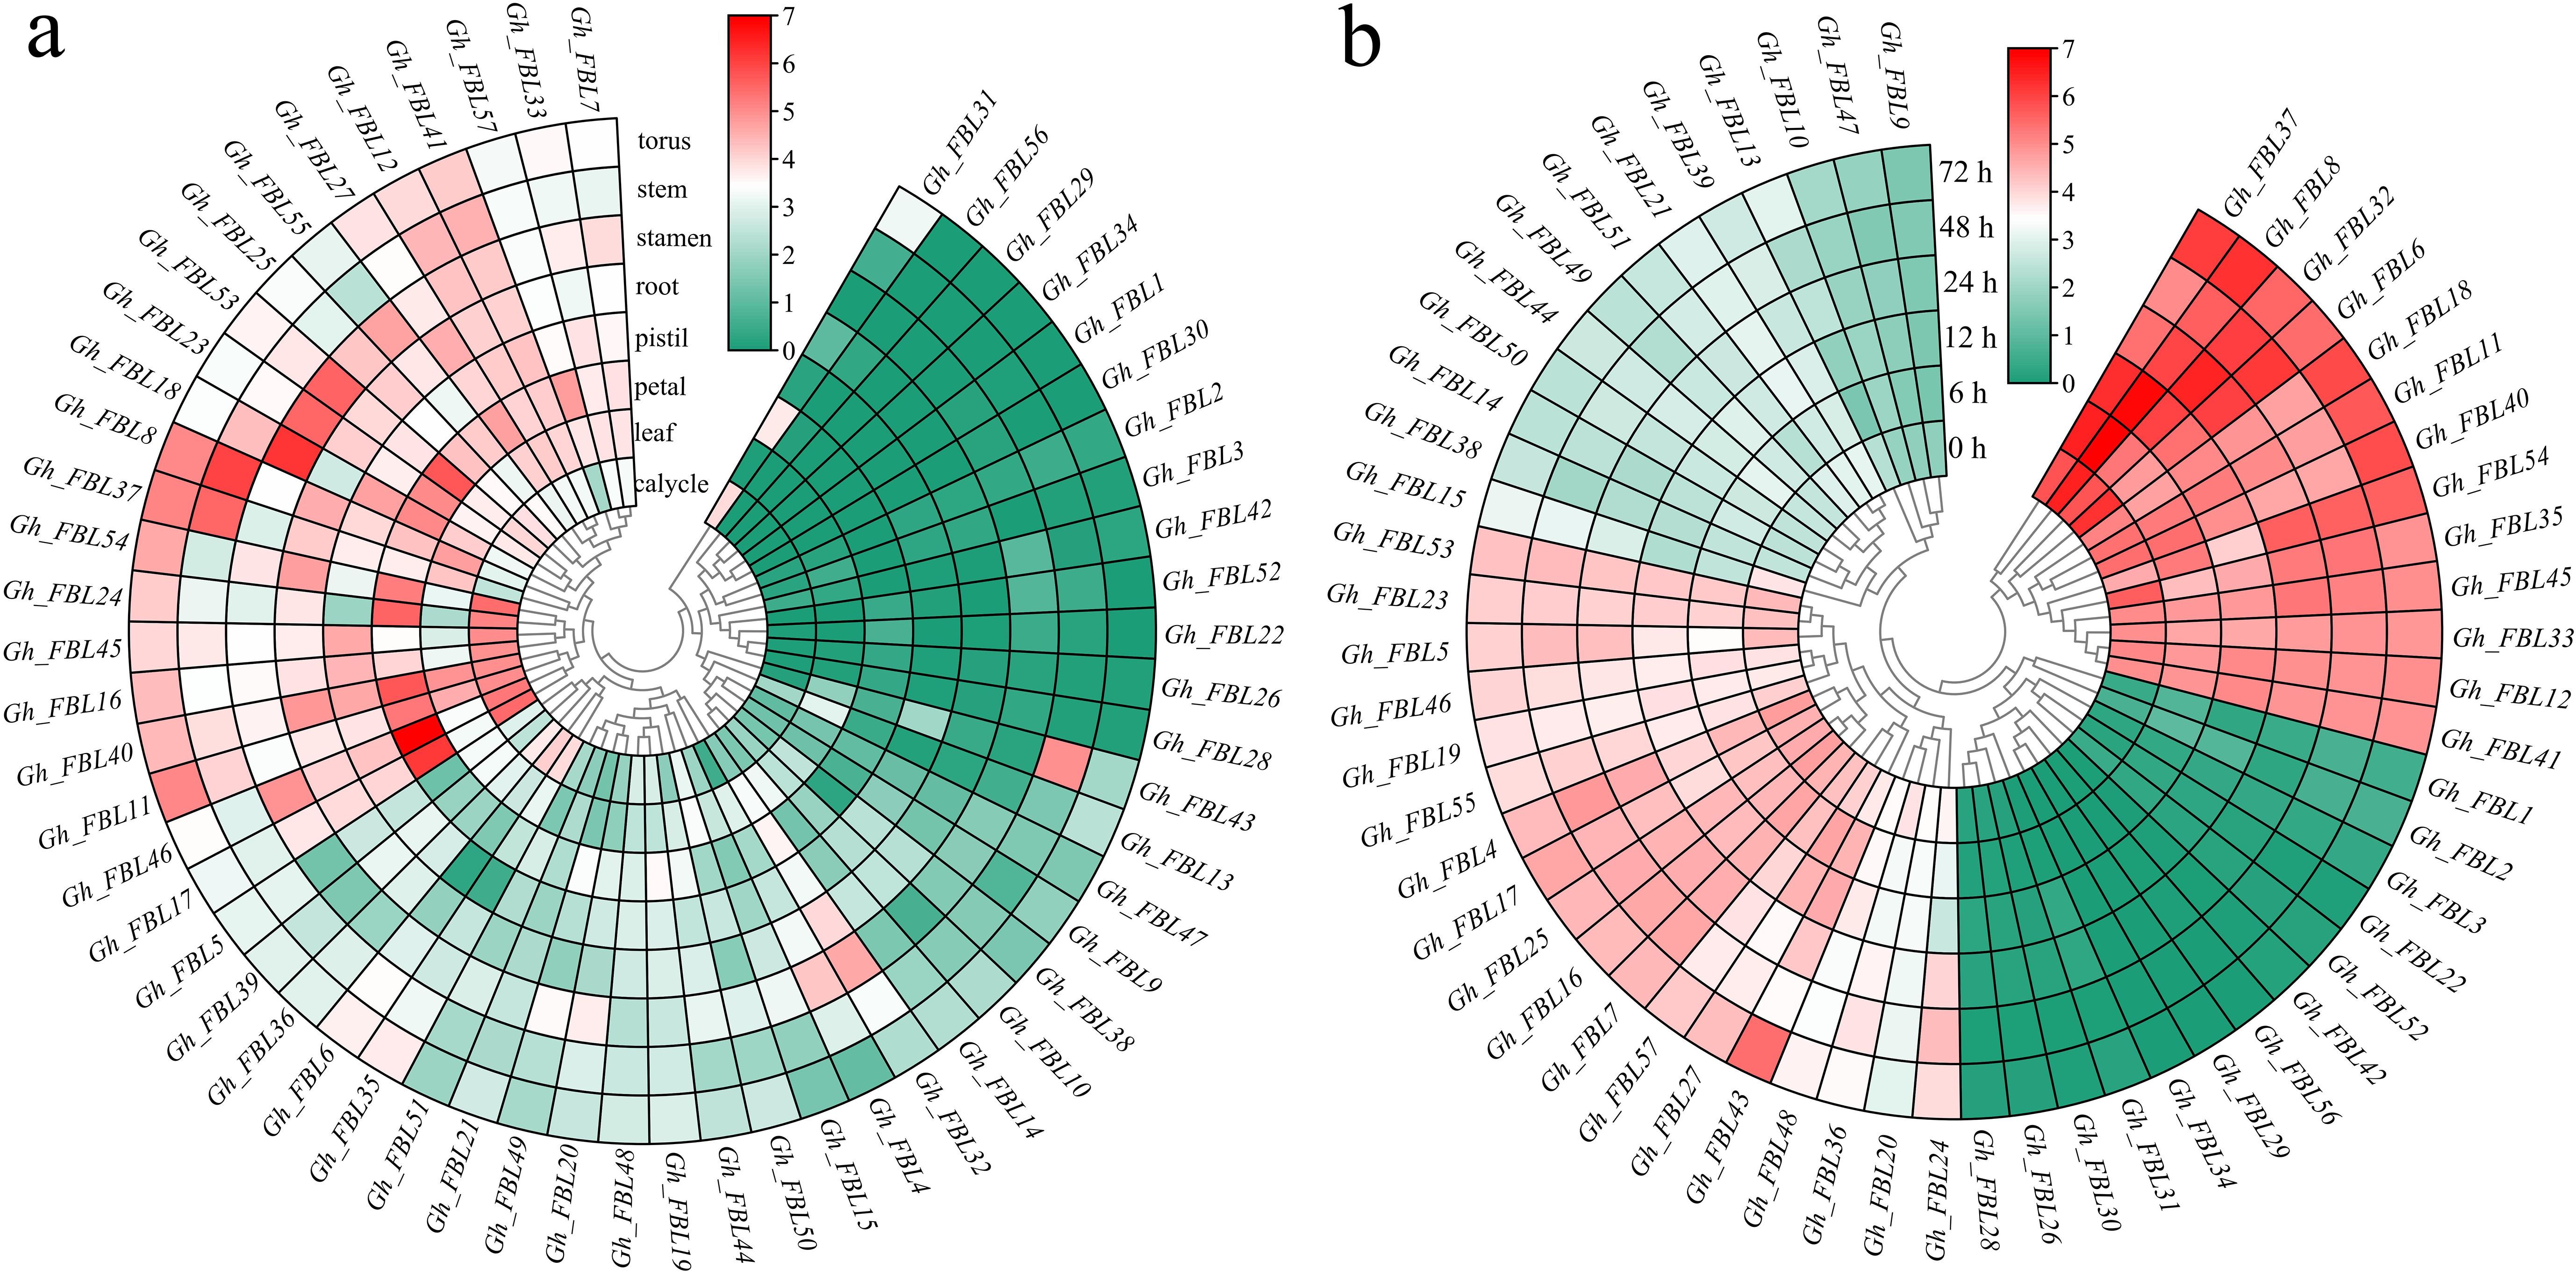
Figure 4. Analysis of the expression patterns of the land cotton FBL gene family. (a) Heatmap of tissue-specific expression, log10 (FPKM+1) was used to standardize gene expression. (b) Heatmap of expression levels at different time points under Verticillium wilt stress, log10 (FPKM+1) was used to standardize gene expression.qRT–PCR analysis of the FBL gene in cotton under Verticillium wilt stress.
Through RNA-seq, five candidate genes (Gh_FBL20, Gh_FBL24, Gh_FBL36, Gh_FBL43 and Gh_FBL48) involved in the resistance of cotton to Verticillium wilt were ultimately screened. The transcription levels of these five genes were measured under Verticillium wilt stress conditions via qRT–PCR in resistant (Zhongzhimian 2) and susceptible (Junmian 1) extreme varieties (Figure 5). Four genes (Gh_FBL24, Gh_FBL36, Gh_FBL43 and Gh_FBL48) presented significantly increased expression across different time points in both extreme varieties under Verticillium wilt stress, whereas Gh_FBL20 presented a significant decrease in expression in expression post-infection. Notably, Gh_FBL43 expression peaked (fold change > 9) at 24 hours post-infection, and this gene presented significant differences in expression levels between the two extreme varieties at 3 hours post-infection. Gh_FBL43 is suggested as a candidate gene for further functional analysis of cotton resistance to Verticillium wilt.
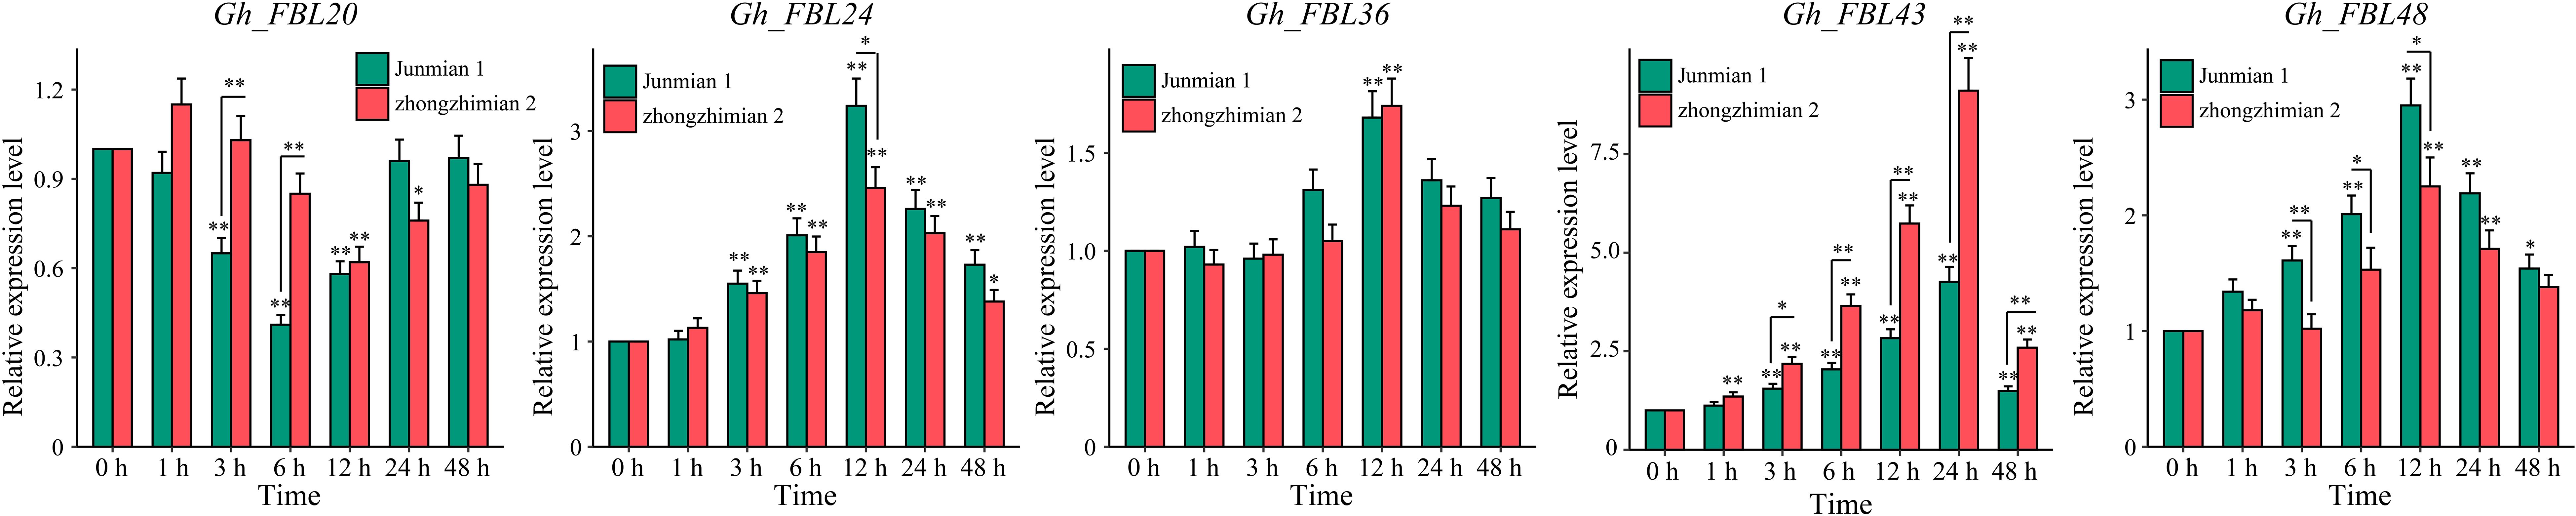
Figure 5. Expression patterns of five candidate genes under yellow wilt disease stress. The results are presented as the means ± SDs (p values were calculated via t-test, n = 3, *p < 0.05, **p < 0.01).
Cotton VIGS
To validate the role of Gh_FBL43 in cotton resistance to Verticillium wilt, we silenced Gh_FBL43 in G. hirsutum using VIGS. Cotyledons of seven-day-old cotton seedlings were injected with Agrobacterium cells carrying pTRV1 or pTRV2-GhCLA. Fifteen days later, the new true leaves presented a distinct chlorosis phenotype, indicating that the VIGS system used in this study successfully silenced the gene (Figure 6a). The results of the qRT–PCR analysis of the Gh_FBL43-silenced plants compared with the control plants revealed that the expression level of Gh_FBL43 in the silenced plants was significantly lower than that in the control plants treated with an empty vector (Figure 6b). After confirming the silencing of the Gh_FBL43 gene, we inoculated the silenced and control plants with the V991 strain of the Verticillium wilt fungus using a root injury-based method. Twenty-one days post-inoculation, the leaves of the silenced plants presented significant yellowing and necrosis, whereas those of the control plants remained in good growth conditions with no noticeable loss of greenness (Figure 6c). Further phenotypic investigation revealed that the disease severity and disease index of the Gh_FBL43-silenced plants were significantly greater than those of the control plants (Figures 6d, e).
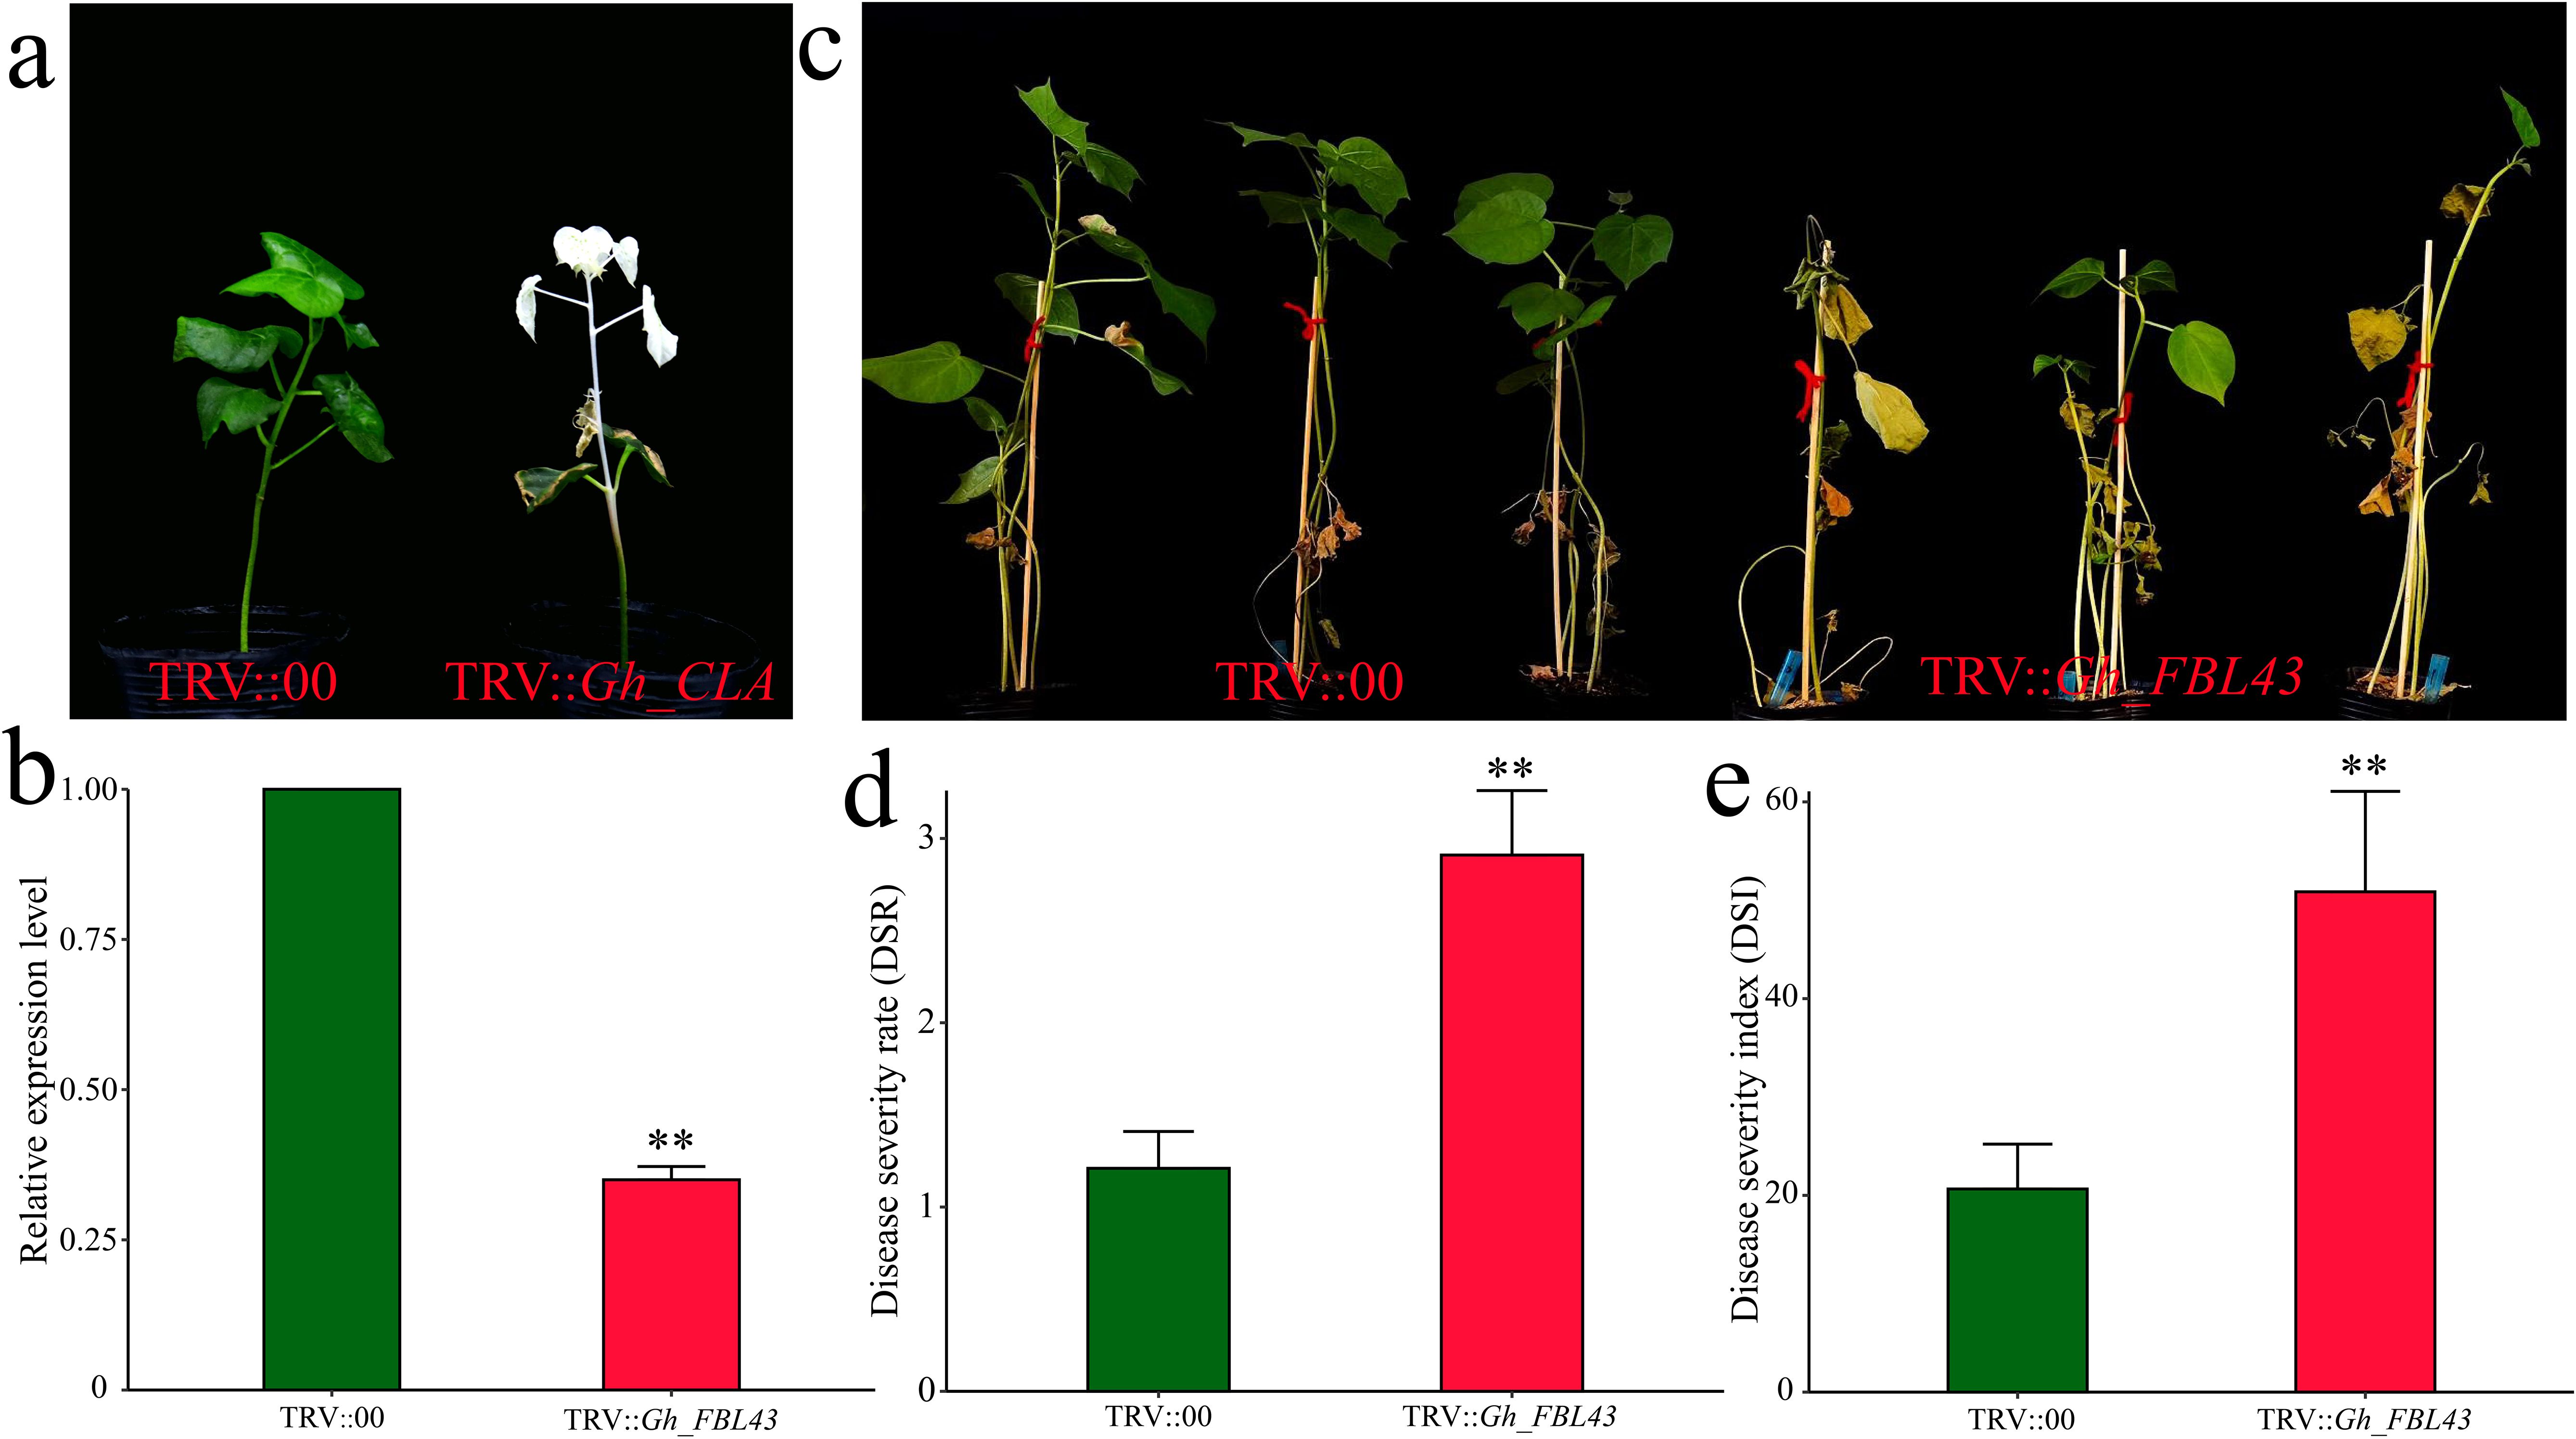
Figure 6. VIGS phenotype and disease severity index of Gh_FBL43 in cotton. (a) Chlorosis phenotype observed 14 days after TRV::CLA injection. (b) Determination of Gh_FBL43 silencing efficiency. (c) Phenotype 21 days post bacterial wilt infection after silencing Gh_FBL43. (d) Disease severity after silencing Gh_FBL43. (e) Disease index after silencing Gh_FBL43. The error bars represent the mean values of three repeats ± SDs (p values were calculated via a t-test, n = 3, **p < 0.01).
Comprehensive analysis of RNA-seq data
To clarify the pathway by which Gh_FBL43 regulates cotton resistance to V. dahliae, RNA-seq was conducted on both Gh_FBL43-silenced and control cotton plants at 0 hours and 24 hours post-inoculation with the pathogen, with three biological replicates for each sample. A total of 81.52 Gb of clean data was obtained after the raw data were filtered, with each sample yielding more than 6.05 Gb of clean data. The percentage of Q20 bases was above 98.23%, and the percentage of Q30 bases exceeded 94.58%, with the GC content exceeding 44.14% (Supplementary Table S3). The Pearson correlation coefficients among the three replicates of the same sample were greater than 0.97 (Figure 7a). Principal component analysis (PCA) revealed that samples of the same biological replicate clustered together, indicating high reliability and reproducibility of the transcriptomic data (Figure 7b). Through differential expression analysis, a total of 6,255 DEGs were identified between the Gh_FBL43-silenced and control plants at 0 hours post-inoculation, of which 3,726 were upregulated and 2,529 were downregulated (Figure 7c). At 24 hours post-inoculation, 6,760 DEGs were identified between the two groups, consisting of 4,746 upregulated and 2,014 downregulated genes (Figure 7d). Overall, 10,928 DEGs were identified between Gh_FBL43-silenced and control plants pre- and post-inoculation, with 4,204 unique DEGs at 0 h and 4,709 unique DEGs at 24 h, including 2,015 shared DEGs (Figure 7e).
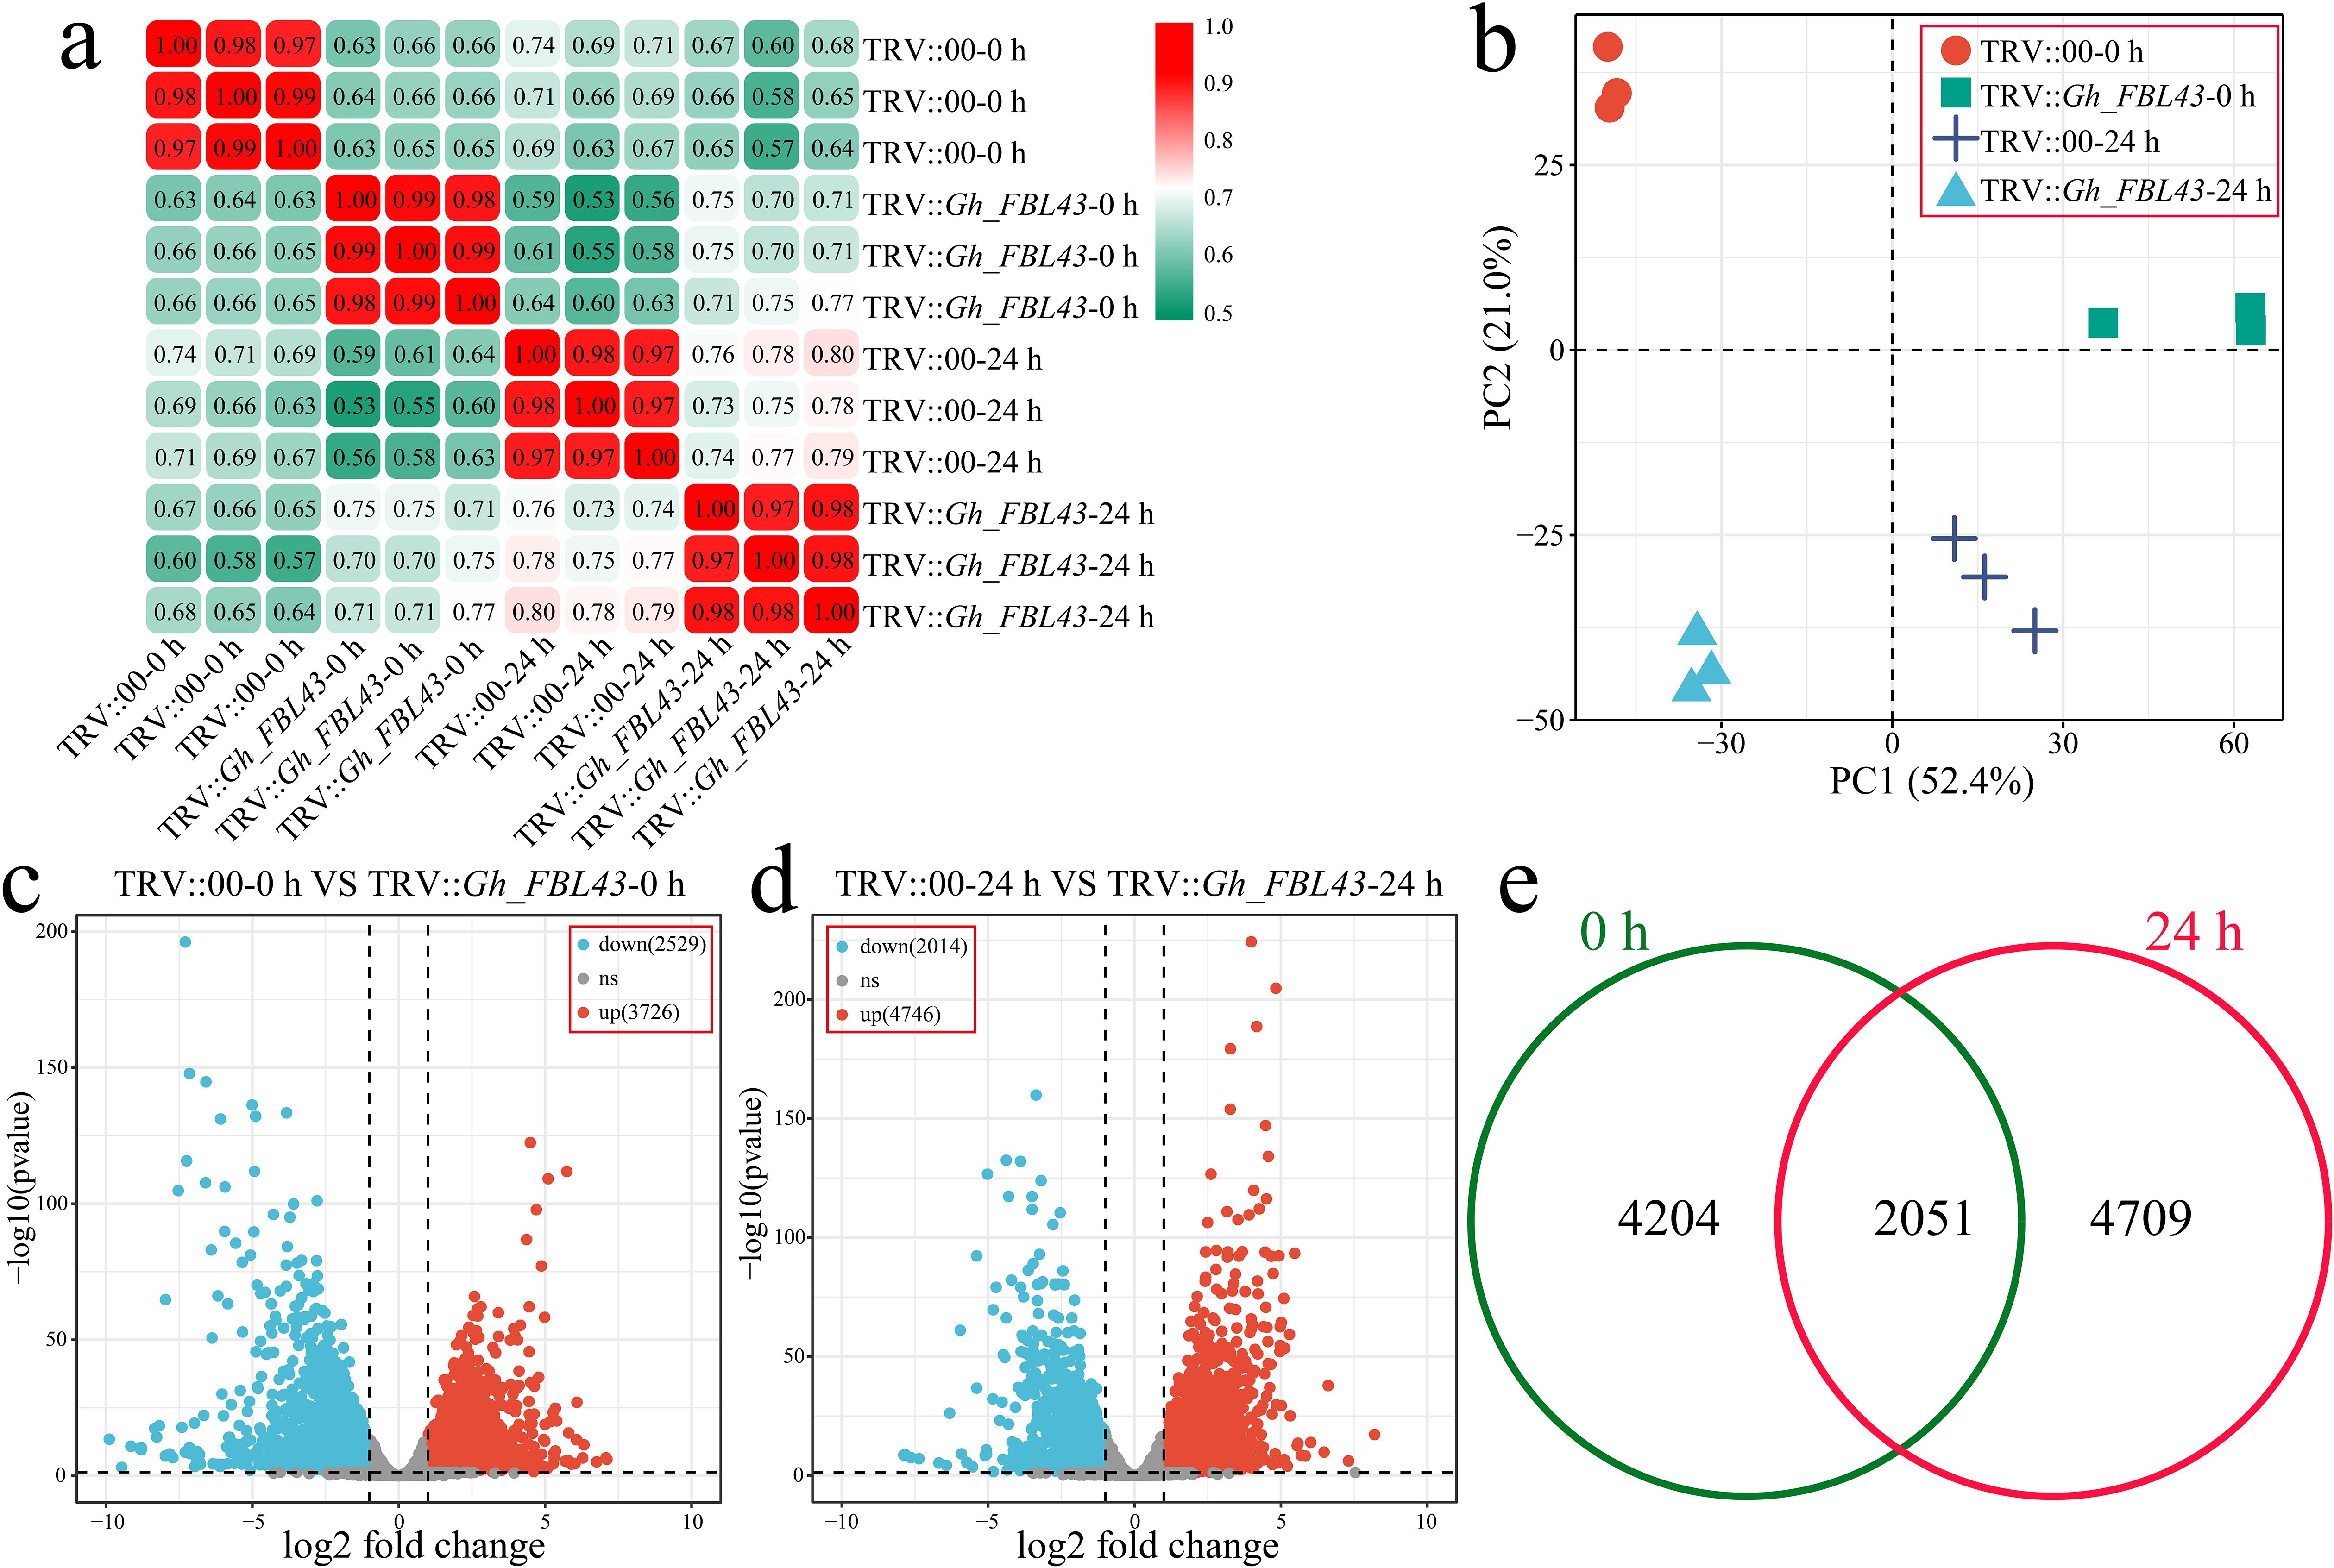
Figure 7. Overall RNA-seq analysis of Gh_FBL43-silenced and control cotton plants at 0 h and 24 h post infection with the Verticillium wilt pathogen. (a) Correlation analysis of samples. (b) PCA of samples. (c) Volcano plot of differential expression analysis results at 0 h post infection. (d) Volcano plot of differential expression analysis results at 24 h post infection. (e) Venn diagram of specific and shared DEGs at different time points post infection.
Enrichment analysis of DEGs
To further elucidate the functions and pathways associated with the 10,928 DEGs, a Gene Ontology (GO) enrichment analysis was first conducted on these DEGs. Notable enrichment was observed in biological process terms such as the jasmonic acid (JA)-mediated signaling pathway, response to light intensity, cellular response to fatty acid, induced systemic resistance, response to hydrogen peroxide, salicylic acid metabolic process, photosynthesis, leaf senescence, phenol-containing compound metabolic process, and plant organ senescence (Figure 8a). Additionally, a KEGG enrichment analysis highlighted significant enrichment in the following pathways: photosynthesis - antenna proteins, alpha-linolenic acid metabolism, flavonoid biosynthesis, phenylalanine metabolism, photosynthesis, beta-alanine metabolism, fatty acid degradation, tyrosine metabolism, glycerolipid metabolism, carotenoid biosynthesis and thiamine metabolism (Figure 8b).
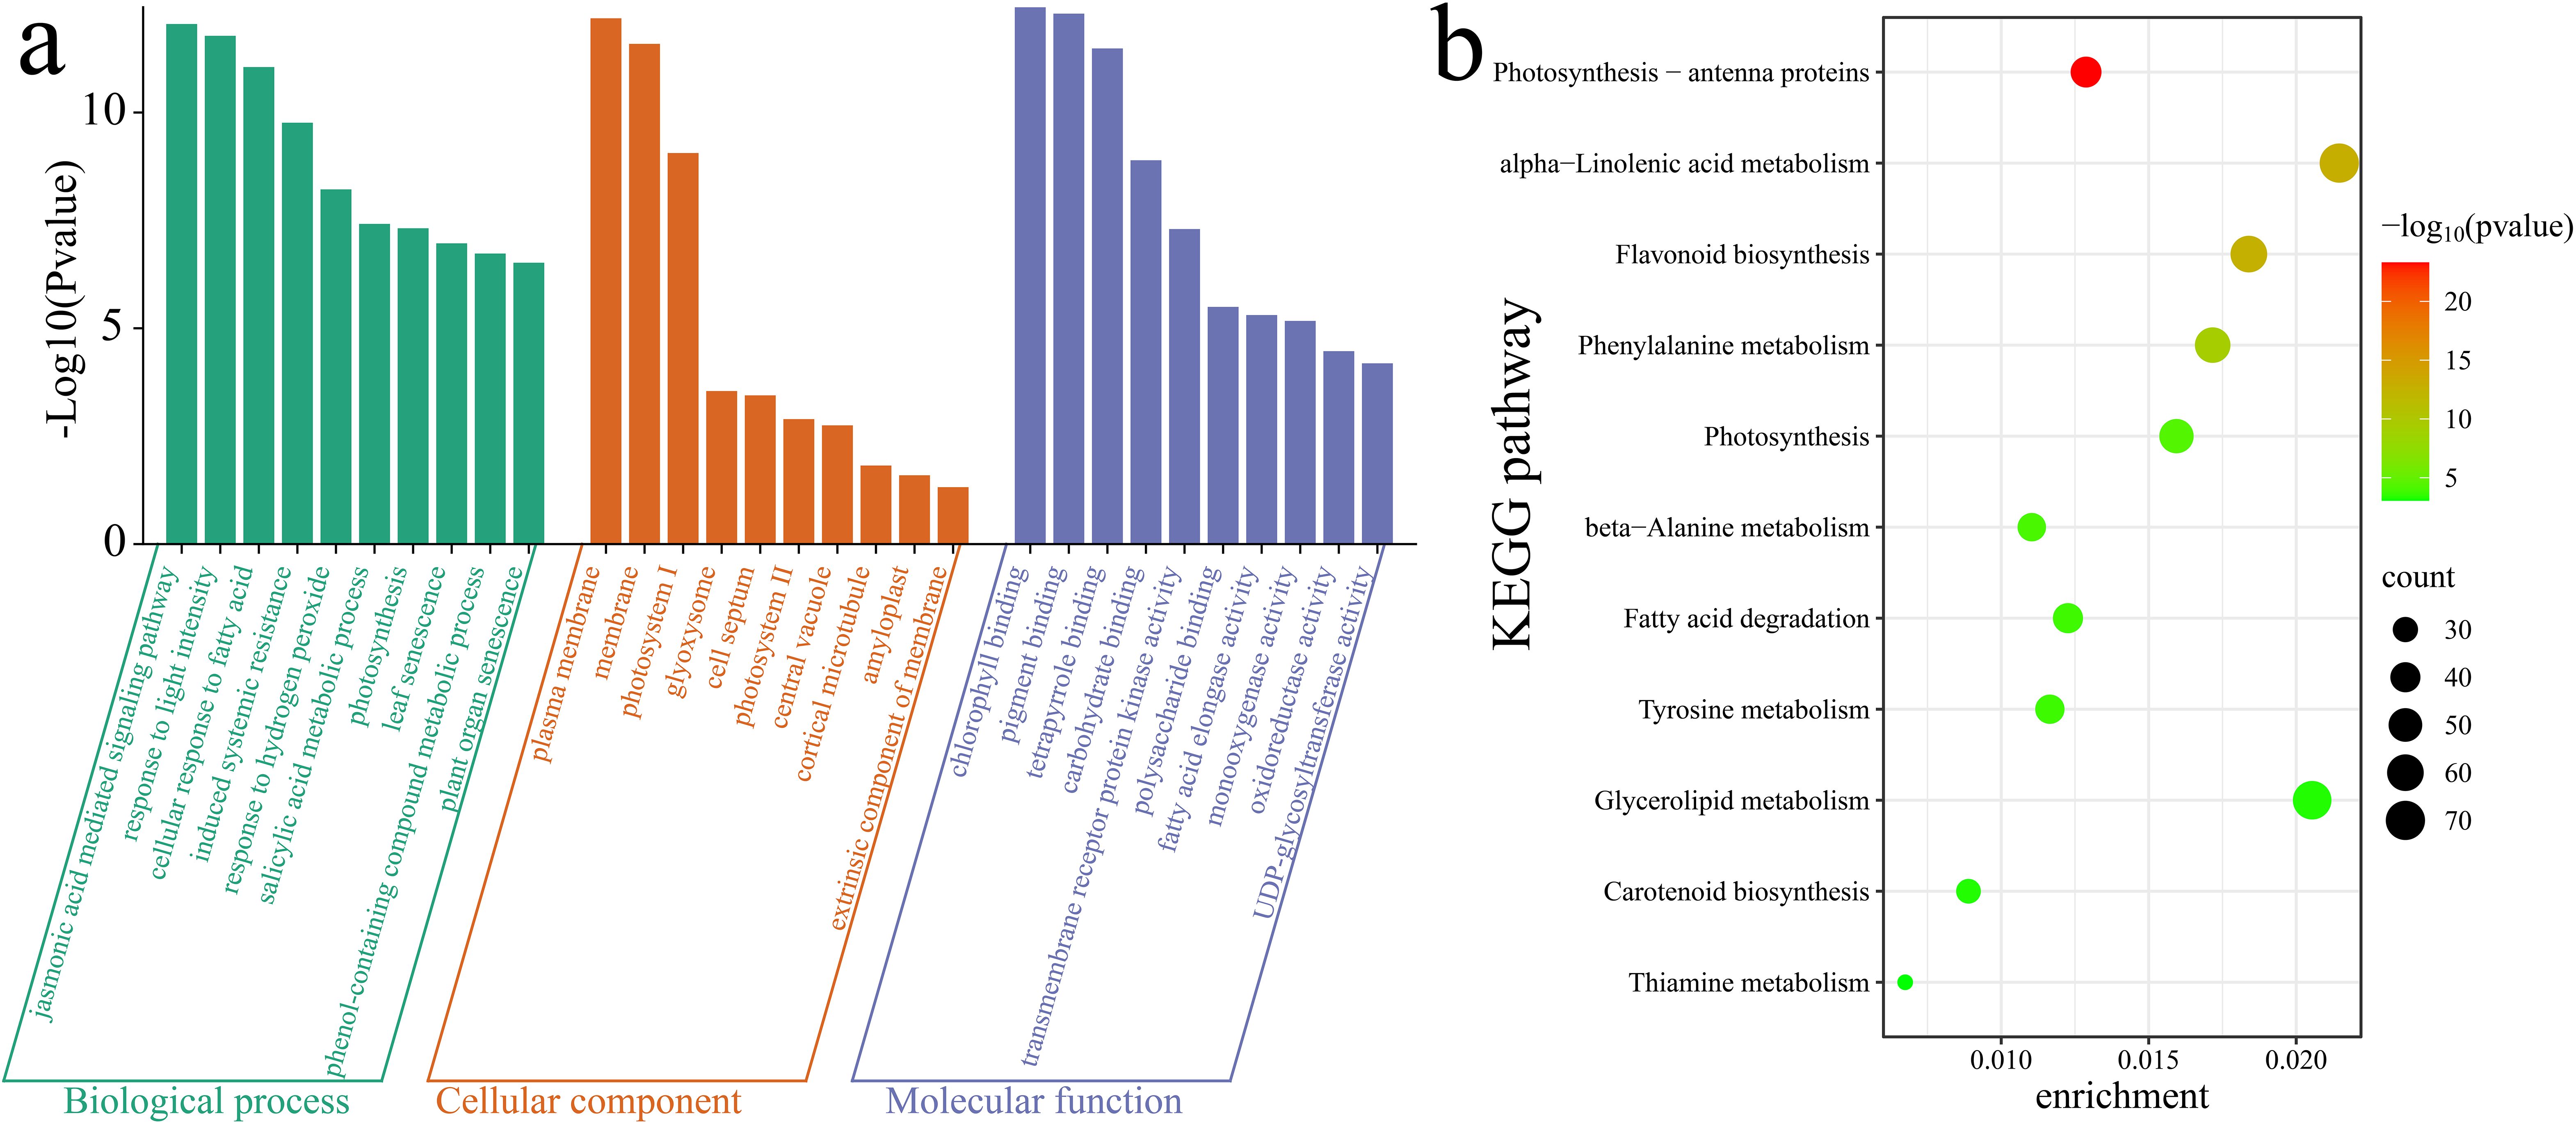
Figure 8. Enrichment analysis of DEGs. (a) GO enrichment analysis of DEGs. (b) KEGG enrichment analysis of DEGs.
Cluster analysis of DEGs
Using k-means clustering, the 10,928 DEGs were analyzed, and the pathways involved in each cluster were annotated. Four clusters with statistical significance were identified (Figure 9a). Cluster 1 presented the highest expression level at 24 hours post-inoculation in the control plants, encompassing 4,355 DEGs that were significantly enriched in the flavonoid biosynthesis, phenylalanine metabolism, and alpha-linolenic acid metabolism pathways (Figures 9a, b). Cluster 2 presented the highest expression level in the control plants prior to inoculation, with expression levels decreasing in both the control and silenced plants post-inoculation, with 3,242 DEGs that were significantly enriched in the photosynthesis, porphyrin metabolism, and cutin, suberin and wax biosynthesis pathways. Cluster 3 had the highest expression level at 24 h post-inoculation in the silenced plants, with a slight increase in expression levels following inoculation. Cluster 3 included 1,486 DEGs that were significantly enriched in the glycerophospholipid metabolism, circadian entrainment and beta-alanine metabolism pathways. Cluster 4 presented minimal changes in expression levels before and after inoculation in the control plants, however, the expression levels in the Gh_FBL43-silenced plants decreased post-inoculation. Cluster 4 included 1,881 DEGs that were significantly enriched in the circadian entrainment, carotenoid biosynthesis and fatty acid degradation pathways.
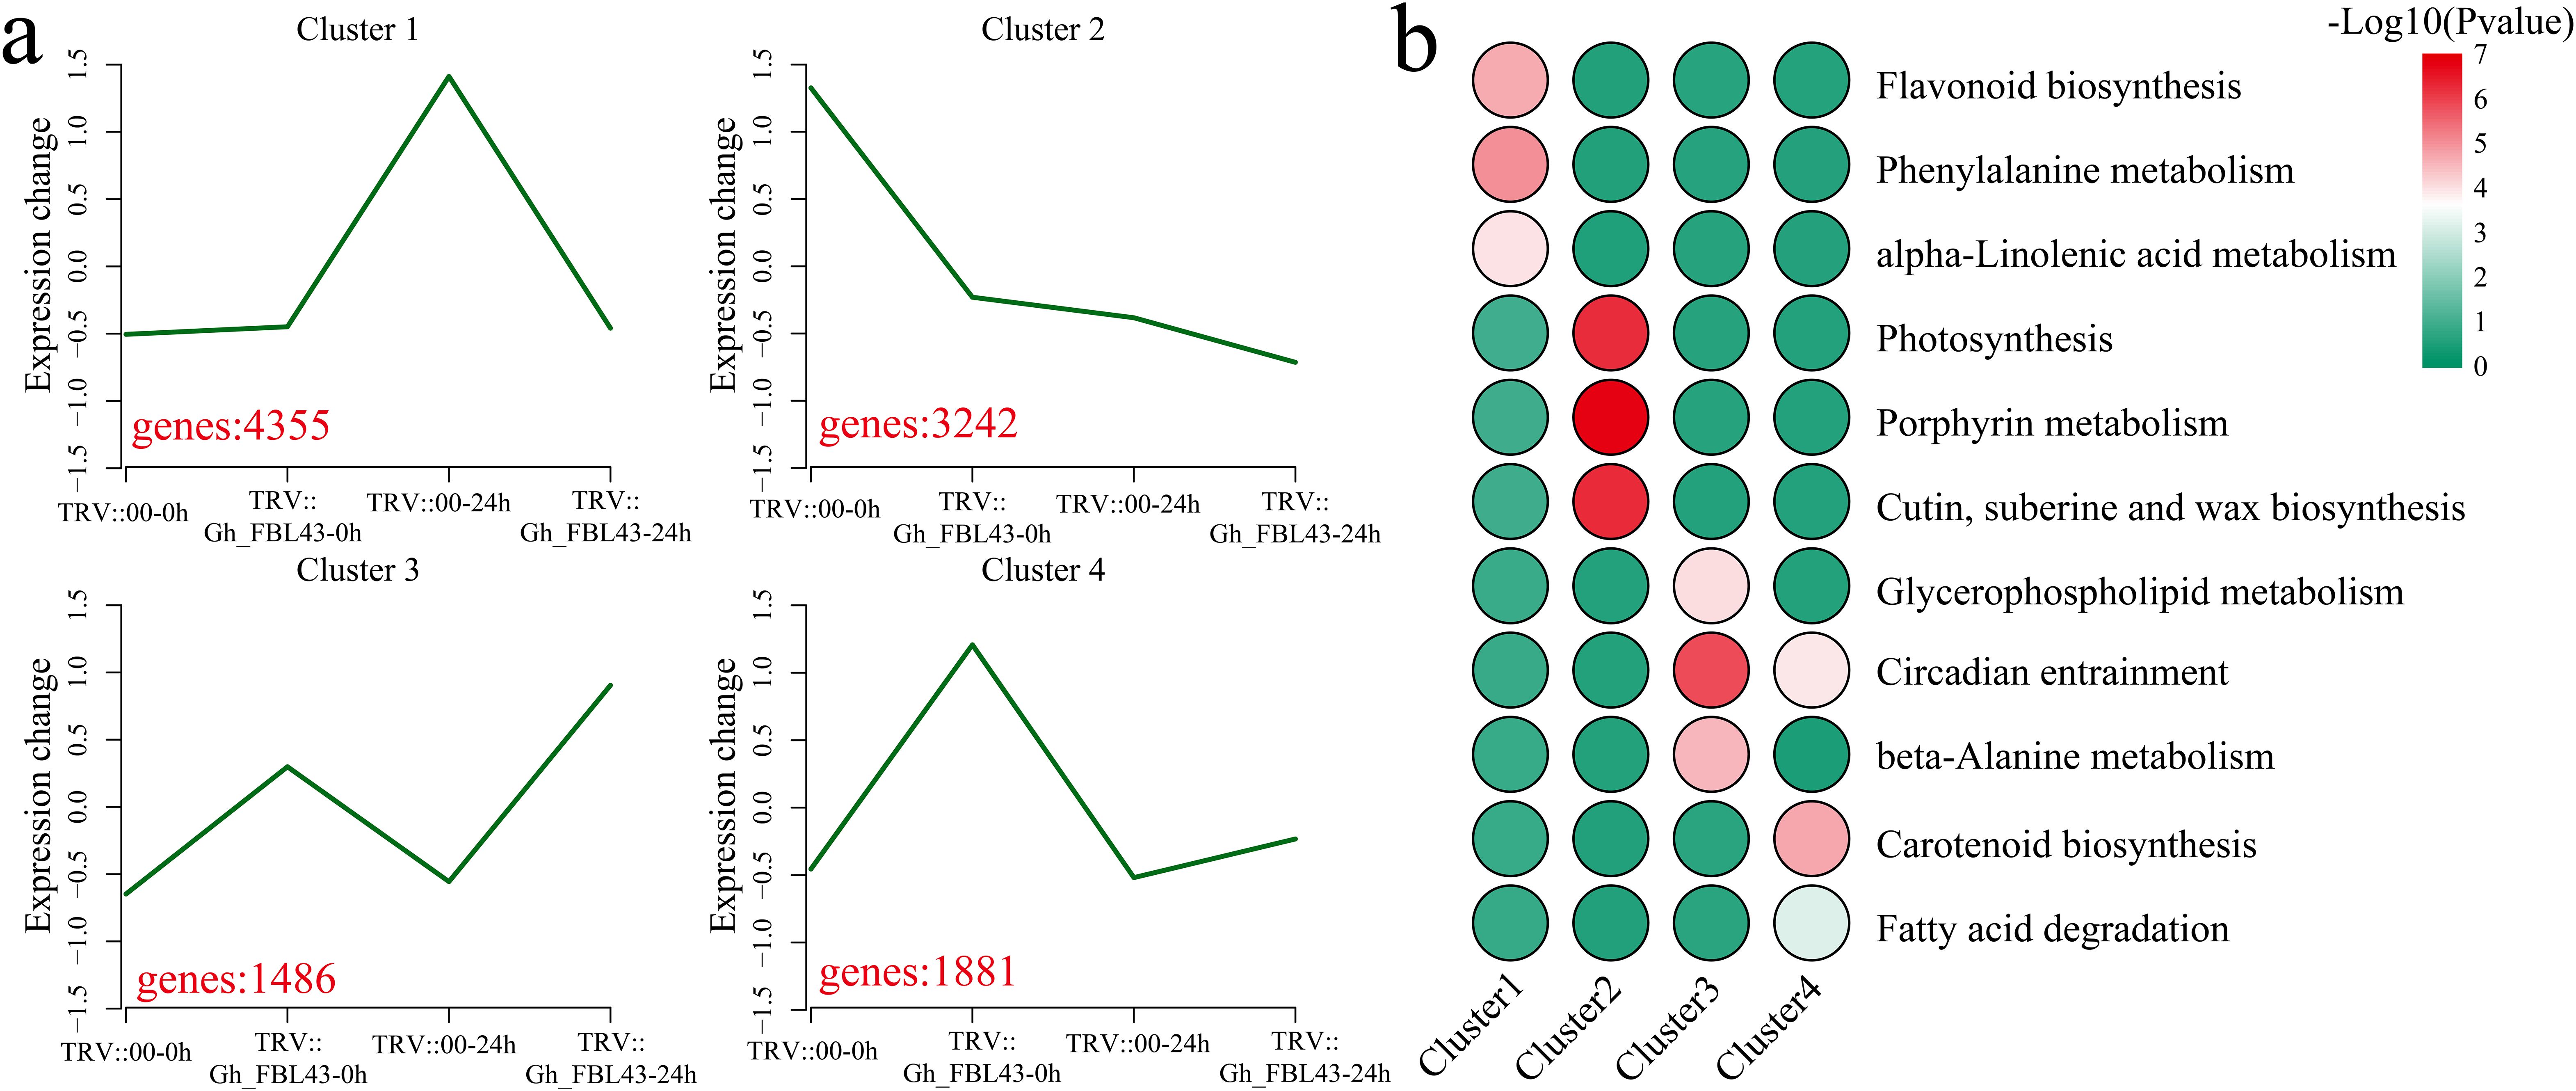
Figure 9. Clustering and KEGG enrichment analysis of DEGs between Gh_FBL43-silenced and control plants. (a) Clustering analysis of DEGs, with red numbers representing the number of DEGs contained in each cluster. (b) Heatmap of the results of the KEGG enrichment analysis for each cluster.
Analysis of the biochemical synthesis pathways of JA and flavonoids
The enrichment analysis of all the DEGs revealed that jasmonic acid (JA) metabolism, alpha-linolenic acid metabolism and flavonoid-related pathways were significantly enriched. The alpha-linolenic acid metabolism pathway is an important route for the synthesis of JA in plants. Therefore, the expression patterns of JA synthesis genes were first analyzed. The results indicated that the expression levels of most JA synthesis genes decreased after infection in the Gh_FBL43-silenced plants, whereas the control plants presented the highest expression levels 24 hours post infection (Figure 10a). Among the rate-limiting enzyme allene oxide synthase (AOS)-encoding genes involved in JA synthesis, all the genes except for GH_A06G0128 and GH_D06G0110 presented peak expression in the control plants at 24 hours post infection. Additionally, a gene encoding another rate-limiting enzyme, allene oxide cyclase (AOC), also presented peak expression in the control plants at this time point. With respect to the genes involved in the flavonoid synthesis pathway, all the genes except for GH_D05G2350 (flavanone 3-hydroxylase, F3H) presented higher expression levels in the control plants than in the Gh_FBL43-silenced plants, with expression levels increasing with infection and peaking at 24 hours post infection in the control plants (Figure 10b). These results suggest that Gh_FBL43 may regulate the resistance of G. hirsutum to wilt disease by modulating the expression of genes involved in JA and flavonoid biosynthesis.
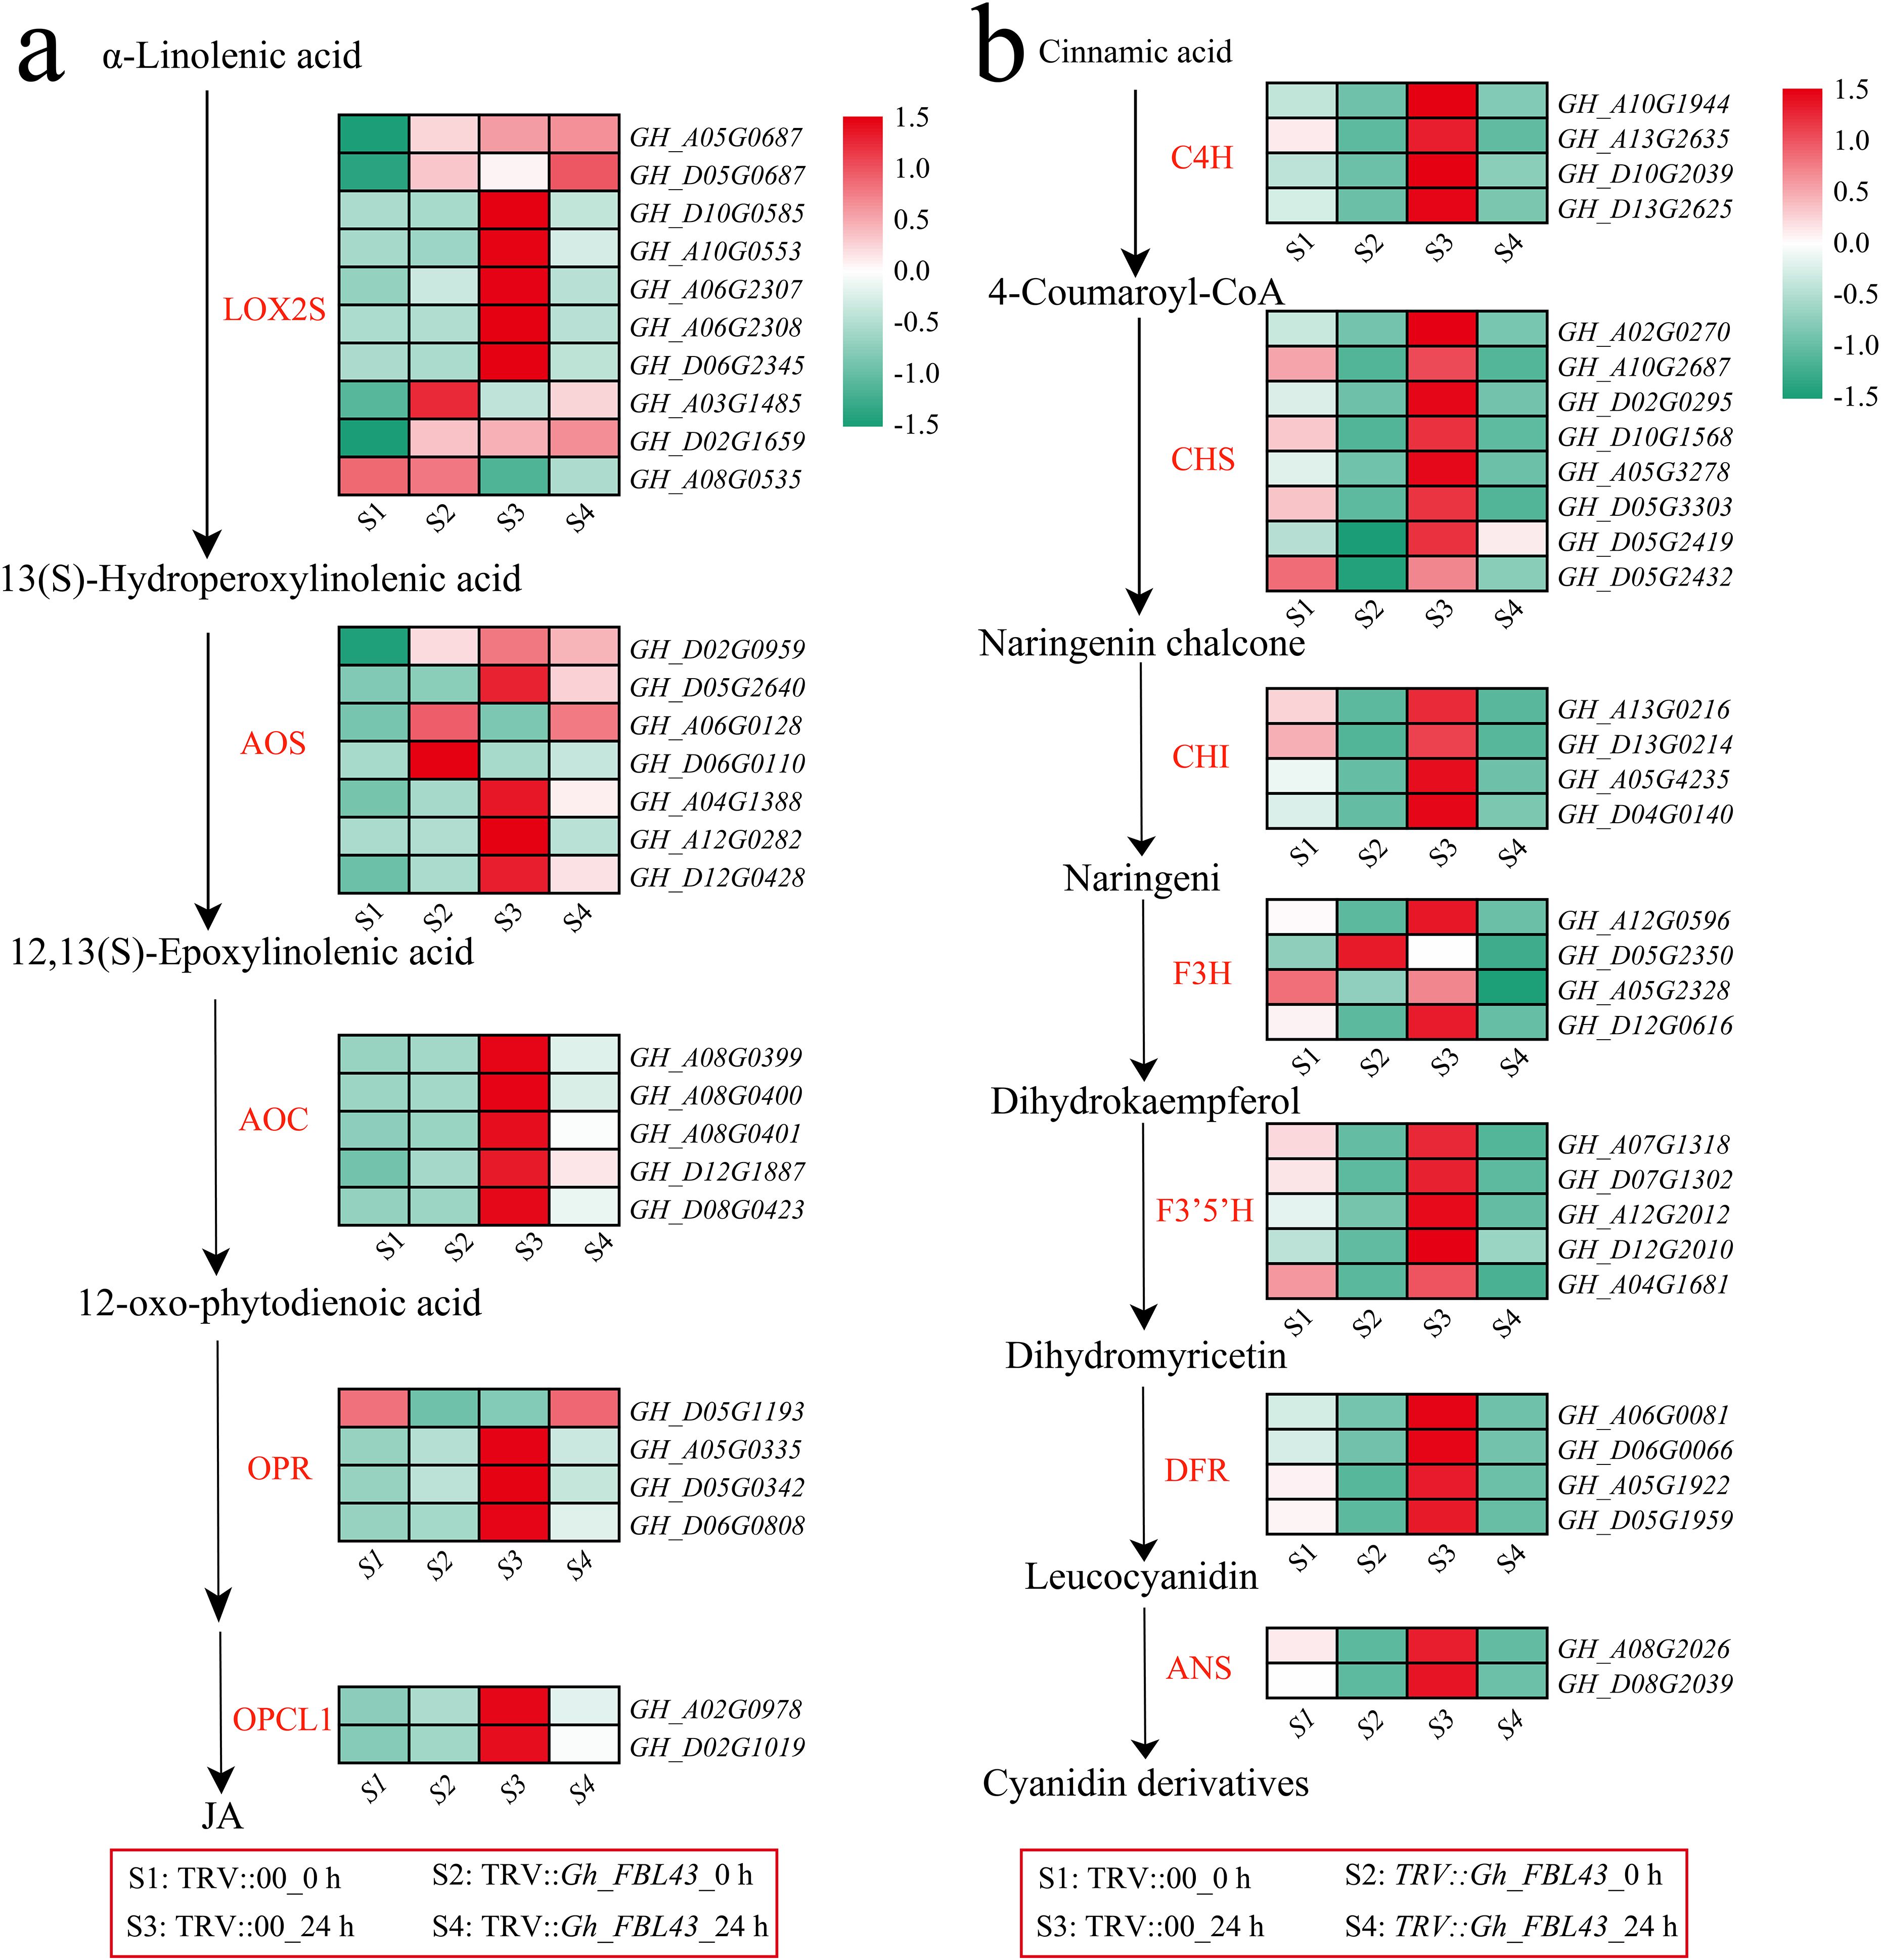
Figure 10. Analysis of the memory expression patterns of the JA and flavonoid pathways in the Gh_FBL43-silenced and control plants. (a) Analysis of gene expression patterns in the JA pathway, standardized scoring was used, with values standardized to range from -1.5 to 1.5. (b) Analysis of gene expression patterns in the flavonoid pathway, standardized scoring was used, with values standardized to range from -1.5 to 1.5.
Discussion
In recent years, advancements in sequencing technology and the continuous reduction in sequencing costs have led to the ongoing refinement and updating of cotton genome sequencing efforts, laying a foundation for studying gene functions at the whole-genome level (Wang et al., 2019; Hu et al., 2019; Huang et al., 2020). Recently, the successful assembly and publication of the telomere-to-telomere (T2T) genomes of diploid G. raymondii and allotetraploid G. hirsutum (TM-1 and Zhongmian 113) have improved our understanding of cotton genomics and genetics, providing a solid foundation for exploring gene families in cotton and elucidating their phylogenetic relationships (Huang et al., 2024; Hu et al., 2025a, Hu et al., 2025b). Genetic evolutionary analyses indicate that G. raymondii and G. arboreum are the ancestors of the allotetraploid cotton species (G. hirsutum and G. barbadense) (Wang et al., 2019; Hu et al., 2019). FBL genes play crucial roles in plant growth and development, as well as in the response to various stresses, such as drought, salinity, and pathogens, and have been widely characterized in numerous plants (Elzanati et al., 2017). Therefore, the identification and characterization of the FBL gene family in G. hirsutum, G. barbadense and their two ancestral species will improve the understanding of the evolution and functions of FBL genes. This study identified FBL genes in cotton and revealed that the number of FBL family genes in G. raymondii is slightly greater than half that in G. hirsutum, possibly because of the use of the T2T genome of G. raymondii, which also indicates that the assembly of the T2T genome provides a basis for identifying additional new genes. An analysis of the number of FBL family genes and the results of the phylogenetic tree revealed that the FBL gene family has remained relatively conserved throughout the long evolutionary history of cotton.
The role of F-box-LRR genes in plant disease resistance has been well validated. The gene FBS1, which encodes an F-box protein in A. thaliana, positively regulates the resistance of A. thaliana to pathogens by activating the genes involved in JA biosynthesis (Gonzalez et al., 2017). Additionally, the F-box protein constitutive expression regulator (CPR1), which is associated with pathogenesis-related (PR) genes, modulates resistance to Pseudomonas syringae by inhibiting the accumulation of the R protein SNC1, acting as a negative regulatory factor in plant defense (Zribi et al., 2021). Furthermore, the rice F-box protein OsFBX156 interacts with the heat shock protein OsHSP71.1, promoting its degradation, which activates the reactive oxygen species (ROS) and salicylic acid (SA) signaling pathways, thereby increasing rice disease resistance (Zhao et al., 2024). Although these studies indicate that F-box proteins play a significant role in plant defense against pathogens, the regulatory pathways involved differ. Expression pattern analysis revealed that the expression level of Gh_FBL43 significantly increased following the occurrence of Verticillium wilt, and the difference in expression level between resistant and susceptible materials was statistically significant. Silencing of Gh_FBL43 in plants resulted in decreased resistance to Verticillium wilt, indicating that Gh_FBL43 is a positive regulatory gene for Verticillium wilt resistance in G. hirsutum.
Flavonoid synthesis occurs through the phenylpropanoid pathway and involves the collaborative action of related genes such as those encoding chalcone isomerase (CHI) and chalcone synthase (CHS) (Liu et al., 2021). Within plants, flavonoid metabolites can exhibit antioxidant effects, including disease and pest resistance, ultraviolet resistance, and free radical scavenging effects (Ramaroson et al., 2022). Additionally, flavonoids can modulate the immune signaling pathways of plants, activating defense mechanisms that facilitate a rapid response to pathogenic infections, thus increasing disease resistance (Kumar et al., 2023). Treatment with exogenous kaempferol and apigenin at the spike significantly increased wheat resistance to fusarium head blight caused by Fusarium graminearum (Zhao et al., 2022). Research has shown that anthocyanins, such as glycosylated cyanin 3-D-galactoside and 7-O-methyl-cyanin 3-O-β-D-pyranagalactoside, as well as flavonols, are present at relatively high concentrations on the red side of red mango fruit, with the red side proving more effective than the green side in inhibiting Colletotrichum (Sudheeran et al., 2021). Glucosidase can hydrolyze anthocyanins and flavonols, with the generated glycoside moieties exhibiting strong toxicity against fungal pathogens (Sudheeran et al., 2020). In the PalbHLH1 and PalMYB90 overexpression lines of poplar, structural genes related to flavonoids, such as F3H, FLS, DFR, ANS, and ANR, were upregulated, promoting the accumulation of quercetin, kaempferol, and anthocyanins and thereby increasing the resistance of poplar trees to Melampsora larici-populina (Bai et al., 2020). In soybean, knocking out GmF3H1, GmF3H2 and GmFNSII-1 can increase the isoflavone content, thus improving the resistance of soybean leaves to soybean mosaic virus (Zhang et al., 2020). Enrichment analysis of the DEGs revealed significant enrichment in the biosynthetic pathways of flavonoids and phenylpropanoids, with genes in the flavonoid synthesis pathway showing higher expression levels in the control plants than in the Gh_FBL43-silenced plants, and their expression increased under pathogen inoculation. These results suggest that Gh_FBL43 may regulate the resistance of G. hirsutum to yellow wilt by modulating the expression of flavonoid biosynthesis genes, indicating the crucial role of flavonoids in the resistance of G. hirsutum to yellow wilt.
Hormones, as signaling molecules within plants, play crucial roles in signal transduction processes under pathogen stress (Verma et al., 2016). Among these, JA plays a critical role in regulating plant disease resistance-related signaling pathways (Ding et al., 2022). The synthesis of JA is initiated by the release of α-linolenic acid from membrane lipids through various enzymes involved in the lipoxygenase pathway (Huan et al., 2022). Research conducted in rice has shown that viral transcription suppression factors (RBSDVP8, SRBSDVSP8, RSVP2 and RSMVM) inhibit the key functional module OsJAZ-OsMYC3-OsMED25 in the JA signaling pathway, thereby decreasing disease resistance in rice (Li et al., 2021). OsGSK2 inhibits the repressor OsJAZ4 through phosphorylation and promotes its degradation, thereby activating the JA response and the JA mediated antiviral defense response in rice and increasing the resistance to black-streaked dwarf disease (He et al., 2020). A. thaliana mutants deficient in JA synthesis (fad3/fad7/fad8, dde1/opr3 and dde2/aos) exhibit significantly weakened resistance to pathogenic fungi (Chini et al., 2007; McConn and Browse, 1996; von Malek et al., 2002). Furthermore, JA can be transported over long distances within vascular bundles and via air, transmitting invasion signals from infected sites to the entire plant and thereby inducing systemic resistance (Li et al., 2020). Analysis of DEGs before and after inoculation of the control plants and Gh_FBL43-silenced plants revealed significant enrichment in the α-linolenic acid and JA metabolic pathways. The expression of the rate-limiting enzymes for JA synthesis, AOC (GH_A08G0399, GH_A08G0400, GH_A08G0401, GH_D12G1887 and GH_D08G0423) and AOS (GH_D02G0959, GH_D05G2640, GH_A04G1388, GH_A12G0282 and GH_D12G0428), was highest in the control plants 24 hours post-inoculation. In conclusion, these comprehensive results suggest that Gh_FBL43 may regulate the expression of JA and flavonoid biosynthesis genes to modulate resistance to wilt disease in G. hirsutum.
Conclusion
By studying the origin and evolution of genes and performing functional analysis, sufficient information can be gained for further mechanistic elucidation. This study identified 57 FBL genes in the G. hirsutum genome. These genes can be classified into five subgroups and were relatively conserved during the evolution of cotton. Expression analyses combined with VIGS revealed that Gh_FBL43 is associated with resistance to Verticillium wilt in G. hirsutum. RNA-seq analysis revealed that silencing of Gh_FBL43 reduced the expression of genes involved in JA and flavonoid-related pathways. In summary, our findings demonstrate that the Gh_FBL43 gene plays a significant role in the resistance of G. hirsutum to Verticillium wilt and that JA- and flavonoid-related pathways are important contributors to this resistance, identifying new genes and potential regulatory pathways for further research on G. hirsutum resistance to Verticillium wilt.
Data availability statement
The RNA-seq data used in the study have been uploaded to the Genome Sequence Archive of the National Genomics Data Center, China National Center for Bioinformation, under project PRJCA039530.
Author contributions
JZ: Data curation, Formal Analysis, Investigation, Methodology, Software, Validation, Visualization, Writing – original draft, Writing – review & editing. XS: Data curation, Formal Analysis, Investigation, Writing – review & editing. WG: Formal Analysis, Investigation, Software, Writing – review & editing. TW: Methodology, Software, Visualization, Writing – review & editing. YW: Data curation, Methodology, Visualization, Writing – review & editing. QC: Conceptualization, Data curation, Methodology, Visualization, Writing – review & editing. YQ: Conceptualization, Data curation, Investigation, Methodology, Writing – review & editing.
Funding
The author(s) declare that financial support was received for the research and/or publication of this article. This work was supported by the National Natural Science Foundation of China Regional Fund Project (3246150579), National Science and Technology Innovation 2030-Major Project (2023ZD04041), Xinjiang Uygur Autonomous Region Science and Technology Innovation Leading Talents “Tianshan Talents” Training Program (2023TSYCLJ0012), Autonomous Region Talent Development Fund “Tianchi Talents” Introduction Program and Molecular Mechanism of Verticillium Wilt Resistance in Upland Cotton Gh_SCPL42 Gene (XJEDU2024J039).
Conflict of interest
The authors declare that the research was conducted in the absence of any commercial or financial relationships that could be construed as a potential conflict of interest.
Generative AI statement
The author(s) declare that no Generative AI was used in the creation of this manuscript.
Publisher’s note
All claims expressed in this article are solely those of the authors and do not necessarily represent those of their affiliated organizations, or those of the publisher, the editors and the reviewers. Any product that may be evaluated in this article, or claim that may be made by its manufacturer, is not guaranteed or endorsed by the publisher.
Supplementary material
The Supplementary Material for this article can be found online at: https://www.frontiersin.org/articles/10.3389/fpls.2025.1620947/full#supplementary-material
Supplementary Figure 1 | Chromosomal localization of FBL genes in G. hirsutum.
References
Ayyaz, M., Chang, Z., Ding, S., Han, P., Xu, L., Abudukeyoumu, A., et al. (2025). QTL mapping associated with Verticillium wilt resistance in cotton based on MAGIC population. J. Cotton Res. 8, 1–15. doi: 10.1186/s42397-025-00211-7
Bachan, S. and Dinesh-Kumar, S. P. (2012). Tobacco rattle virus (TRV)-based virus-induced gene silencing. Antiviral resistance plants: Methods Protoc. 894, 83–92. doi: 10.1007/978-1-61779-882-5_6, PMID: 22678574
Bai, Q., Duan, B., Ma, J., Fen, Y., Sun, S., Long, Q., et al. (2020). Coexpression of PalbHLH1 and PalMYB90 genes from Populus alba enhances pathogen resistance in poplar by increasing the flavonoid content. Front. Plant Sci. 10.1772 doi: 10.3389/fpls.2019.01772, PMID: 32174927
Cao, Y., Yang, Y., Zhang, H., Li, D., Zheng, Z., Song, F., et al. (2020). Fusarium and Verticellum wilt in cotton: A review. Environ. Contaminants Rev. 3, 48–52. doi: 10.26480/ecr.01.2020.48.52
Cao, Y., Yang, Y., Zhang, H., et al. (2008). Overexpression of a rice defense-related F-box protein gene OsDRF1 in tobacco improves disease resistance through potentiation of defense gene expression. Physiologia Plantarum 134, 440–452. doi: 10.1111/j.1399-3054.2008.01149.x, PMID: 18573188
Chen, C., Wu, Y., Li, J., Wang, X., Zeng, Z., Xu, J., et al. (2023). TBtools-II: A “one for all, all for one” bioinformatics platform for biological big-data mining. Mol. Plant 16, 1733–1742. doi: 10.1016/j.molp.2023.09.010, PMID: 37740491
Chen, S., Zhou, Y., Chen, Y., and Gu, J. (2018). fastp: an ultra-fast all-in-one FASTQ preprocessor. Bioinformatics 34, i884–i890. doi: 10.1093/bioinformatics/bty560, PMID: 30423086
Cheng, Q., Ouyang, Y., Tang, Z., Lao, C., Zhang, Y., Cheng, C., et al. (2021). Review on the development and applications of medicinal plant genomes. Front. Plant Sci. 12, 791219. doi: 10.3389/fpls.2021.791219, PMID: 35003182
Chini, A., Fonseca, S., Fernández, G., Adie, B., Chico, J., Lorenzo, O., et al. (2007). The JAZ family of repressors is the missing link in jasmonate signalling. Nature 448, 666–671. doi: 10.1038/nature06006, PMID: 17637675
Cui, Y., Ge, Q., Zhao, P., Chen, W., Sang, X., Zhao, Y., et al. (2021). Rapid mining of candidate genes for Verticillium wilt resistance in cotton based on BSA-seq analysis. Front. Plant Sci. 12, 703011. doi: 10.3389/fpls.2021.703011, PMID: 34691091
Ding, L., Li, Y., Wu, Y., Li, T., Geng, R., Cao, J., et al. (2022). Plant disease resistance-related signaling pathways: recent progress and future prospects. Int. J. Mol. Sci. 23, 16200. doi: 10.3390/ijms232416200, PMID: 36555841
Dou, X., Xie, S., Wang, J., Shen, X., Liu, S., and Tian, N. (2025). Genome-wide identification of F-box-LRR gene family and the functional analysis of CsFBXL13 transcription factor in tea plants. Funct. Integr. Genomics 25, 57. doi: 10.1007/s10142-025-01569-2, PMID: 40063120
Ebeed, H. and Ceasar, S. (2024). Genomics and bioinformatics applications in crop stress: Unraveling molecular mechanisms for sustainable agriculture. South Afr. J. Bot. 170, 38–47. doi: 10.1016/j.sajb.2024.05.015
Dou, X., Xie, S., Wang, J., Shen, X., Liu, S., Tian, N., et al. (2017). Genome-wide analysis, classification, expression and interaction of Physcomitrella patens SKP1-like (PpSKP) and F-box (FBX) genes. Plant Gene 12, 13–22. doi: 10.1016/j.plgene.2017.05.015
Gonzalez, L., Keller, K., Chan, K., Gessel, M., and Thines, B. (2017). Transcriptome analysis uncovers Arabidopsis F-BOX STRESS INDUCED 1 as a regulator of jasmonic acid and abscisic acid stress gene expression. BMC Genomics 18, 1–15. doi: 10.1186/s12864-017-3864-6, PMID: 28716048
Goyal, P., Devi, R., Verma, B., Hussain, S., Arora, P., Tabassum, R., et al. (2023). WRKY transcription factors: Evolution, regulation, and functional diversity in plants. Protoplasma 260, 331–348. doi: 10.1007/s00709-022-01794-7, PMID: 35829836
He, Y., Hong, G., Zhang, H., Tan, X., Li, L., Kong, Y., et al. (2020). The OsGSK2 kinase integrates brassinosteroid and jasmonic acid signaling by interacting with OsJAZ4. Plant Cell 32, 2806–2822. doi: 10.1105/tpc.19.00499, PMID: 32586913
Hu, Y., Chen, J., Fang, L., Zhang, Z., Ma, W., Niu, Y., et al. (2019). Gossypium barbadense and Gossypium hirsutum genomes provide insights into the origin and evolution of allotetraploid cotton. Nat. Genet. 51, 739–748. doi: 10.1038/s41588-019-0371-5, PMID: 30886425
Hu, Y., Han, J., Jin, S., Han, Z., Si, Z., Yan, S., et al. (2025a). Post-polyploidization centromere evolution in cotton. Nat. Genet., 57 (4), 1021–1030. doi: 10.1038/s41588-025-02115-3, PMID: 40033059
Hu, G., Wang, Z., Tian, Z., Wang, K., Ji, G., Wang, X., et al. (2025b). A telomere-to-telomere genome assembly of cotton provides insights into centromere evolution and short-season adaptation. Nat. Genet., 57 (4), 1031–1043. doi: 10.1038/s41588-025-02130-4, PMID: 40097785
Huan, C., Yang, X., Wang, L., Kebbeh, M., Wang, Y., Dai, B., et al. (2022). Methyl jasmonate treatment regulates α-linolenic acid metabolism and jasmonate acid signaling pathway to improve chilling tolerance in both stony hard and melting flesh peaches. Postharvest Biol. Technol. 190, 111960. doi: 10.1016/j.postharvbio.2022.111960
Huang, G., Bao, Z., Feng, L., Zhai, J., Wendel, J., Cao, X., et al. (2024). A telomere-to-telomere cotton genome assembly reveals centromere evolution and a Mutator transposon-linked module regulating embryo development. Nat. Genet. 56, 1953–1963. doi: 10.1038/s41588-024-01877-6, PMID: 39147922
Huang, G., Wu, Z., Percy, R., Bai, M., Li, Y., Frelichowski, J., et al. (2020). Genome sequence of Gossypium herbaceum and genome updates of Gossypium arboreum and Gossypium hirsutum provide insights into cotton A-genome evolution. Nat. Genet. 52, 516–524. doi: 10.1038/s41588-020-0607-4, PMID: 32284579
Kim, D., Paggi, J., Park, C., Bennett, C., and Salzberg, S. (2019). Graph-based genome alignment and genotyping with HISAT2 and HISAT-genotype. Nat. Biotechnol. 37, 907–915. doi: 10.1038/s41587-019-0201-4, PMID: 31375807
Kiraly, L., Barna, B., and Király, Z. (2007). Plant resistance to pathogen infection: forms and mechanisms of innate and acquired resistance. J. Phytopathol. 155, 385–396. doi: 10.1111/j.1439-0434.2007.01264.x
Kourelis, J. and Van Der Hoorn, R. A. (2018). Defended to the nines: 25 years of resistance gene cloning identifies nine mechanisms for R protein function. Plant Cell 30, 285–299. doi: 10.1105/tpc.17.00579, PMID: 29382771
Kowalska, B. (2021). Management of the soil-borne fungal pathogen–Verticillium dahliae Kleb. causing vascular wilt diseases. J. Plant Pathol. 103, 1185–1194. doi: 10.1007/s42161-021-00937-8
Kumar, A., Bhasker, P., Nikhil, K., Srinivas, K., et al. (2023). Role of phenylpropanoids and flavonoids in plant defense mechanism. Int. J. Environ. Clim Change 13, 2951–2960. doi: 10.9734/ijecc/2023/v13i92534
Kumar, S., Stecher, G., Li, M., Knyaz, C., and Tamura, K. (2018). MEGA X: molecular evolutionary genetics analysis across computing platforms. Mol. Biol. Evol. 35, 1547–1549. doi: 10.1093/molbev/msy096, PMID: 29722887
Kusano, M. and Saito, K. (2012). Role of metabolomics in crop improvement. J. Plant Biochem. Biotechnol. 21, 24–31. doi: 10.1007/s13562-012-0131-4
Li, N., Lin, B., Wang, H., Li, X., Yang, F., Ding, X., et al. (2019). Natural variation in Zm FBL41 confers banded leaf and sheath blight resistance in maize. Nat. Genet. 51, 1540–1548. doi: 10.1038/s41588-019-0503-y, PMID: 31570888
Li, M., Wang, F., Li, S., Yu, G., Wang, L., Li, Q., et al. (2020). Importers drive leaf-to-leaf jasmonic acid transmission in wound-induced systemic immunity. Mol. Plant 13, 1485–1498. doi: 10.1016/j.molp.2020.08.017, PMID: 32889174
Li, L., Zhang, H., Chen, C., Huang, H., Tan, X., Wei, Z., et al. (2021). A class of independently evolved transcriptional repressors in plant RNA viruses facilitates viral infection and vector feeding. Proc. Natl. Acad. Sci. 118, e2016673118. doi: 10.1073/pnas.2016673118, PMID: 33836579
Liang, Y., Li, X., Lei, F., Yang, R., Bai, W., Yang, Q., et al. (2024). Transcriptome profiles reveals ScDREB10 from Syntrichia caninervis Regulated Phenylpropanoid biosynthesis and Starch/Sucrose Metabolism to enhance plant stress tolerance. Plants 13, 205. doi: 10.3390/plants13020205, PMID: 38256758
Liu, W., Feng, Y., Yu, S., Fan, Z., Li, X., Li, J., et al. (2021). The flavonoid biosynthesis network in plants. Int. J. Mol. Sci. 22, 12824. doi: 10.3390/ijms222312824, PMID: 34884627
Livak, K. J. and Schmittgen, T. D. (2001). Analysis of relative gene expression data using real-time quantitative PCR and the 2– ΔΔCT method. methods 25, 402–408. doi: 10.1006/meth.2001.1262, PMID: 11846609
Love, M. I., Huber, W., and Anders, S. (2014). Moderated estimation of fold change and dispersion for RNA-seq data with DESeq2. Genome Biol. 15, 1–21. doi: 10.1186/s13059-014-0550-8, PMID: 25516281
McConn, M. and Browse, J. (1996). The critical requirement for linolenic acid is pollen development, not photosynthesis, in an Arabidopsis mutant. Plant Cell 8, 403–416. doi: 10.2307/3870321, PMID: 12239389
Prakash, A., Jeffryes, M., Bateman, A., and Finn, R. (2017). The HMMER web server for protein sequence similarity search. Curr. Protoc. Bioinf. 60, 3–15. doi: 10.1002/cpbi.40, PMID: 29220076
Ramaroson, M., Koutouan, L., Helesbeux, C., Hamama, V., et al. (2022). Role of phenylpropanoids and flavonoids in plant resistance to pests and diseases. Molecules 27.8371, PMID: 36500459
Raziq, A., Zhang, K., Sun, W., Ahmad, N., Zhao, H., Raza, M., et al. (2024). Transcriptome profiling of MYB-overexpressed transgenic lines provides crucial molecular insights into anthocyanin and remodel the biosynthesis regulatory network in Nicotiana tabacum. Ind. Crops Products 213, 118374. doi: 10.1016/j.indcrop.2024.118374
Ren, H., Zhang, B., Zhang, F., Liu, X., Wang, X., Zhang, C., et al. (2024). Integration of physiological and transcriptomic approaches in investigating salt-alkali stress resilience in soybean. Plant Stress 11, 100375. doi: 10.1016/j.stress.2024.100375
Saleem, M., Khan, S., Ahmad, A., Rana, I., Naveed, A., et al. (2024). The 4Fs of cotton: genome editing of cotton for fiber, food, feed, and fuel to achieve zero hunger. Front. Genome Editing 6, 1401088. doi: 10.3389/fgeed.2024.1401088, PMID: 39328243
Sudheeran, P., Ovadia, K., Galsarker, R., Maoz, O., Sela, I., Maurer, N., et al. (2020). Glycosylated flavonoids: fruit’s concealed antifungal arsenal. New Phytol. 225, 1788–1798. doi: 10.1111/nph.16251, PMID: 31598980
Sudheeran, P., Sela, K., Carmeli-Weissberg, N., Ovadia, M., Panda, R., Feygenberg, S., et al. (2021). Induced defense response in red mango fruit against Colletotrichum gloeosporioides. Horticulture Res. 8, 1–11. doi: 10.1038/s41438-020-00452-4, PMID: 33423039
van, den, Burg, H, A., Tsitsigiannis, D, I., Rowland, O., Lo, J., Rallapalli, G., Maclean, D., et al. (2008). The F-box protein ACRE189/ACIF1 regulates cell death and defense responses activated during pathogen recognition in tobacco and tomato. Plant Cell 20, 697–719. doi: 10.1105/tpc.107.056978, PMID: 18375657
Verma, V., Ravindran, P., and Kumar, P. P. (2016). Plant hormone-mediated regulation of stress responses. BMC Plant Biol. 16, 1–10. doi: 10.1186/s12870-016-0771-y, PMID: 27079791
von, Malek, B., van der, Graaff, E., Schneitz, K., and Keller, B. (2002). The Arabidopsis male-sterile mutant dde2–2 is defective in the ALLENE OXIDE SYNTHASE gene encoding one of the key enzymes of the jasmonic acid biosynthesis pathway. Planta 216, 187–192. doi: 10.1007/s00425-002-0906-2, PMID: 12430030
Wang, M., Tu, L., Yuan, D., Zhu, D., Shen, C., Li, J., et al. (2019). Reference genome sequences of two cultivated allotetraploid cottons, Gossypium hirsutum and Gossypium barbadense. Nat. Genet. 51, 224–229. doi: 10.1038/s41588-018-0282-x, PMID: 30510239
Wu, T., Hu, E., Xu, S., Chen, M., Guo, P., Dai, Z., et al. (2021). clusterProfiler 4.0: A universal enrichment tool for interpreting omics data. Innovation 2 (3), 1–10. doi: 10.1016/j.xinn.2021.100141, PMID: 34557778
Yang, J., Ma, Q., Zhang, Y., Wang, X., Zhang, G., Ma, Z., et al. (2024). The F-box protein ZmFBL41 negatively regulates disease resistance to Rhizoctonia solani by degrading the abscisic acid synthase ZmNCED6 in maize. Plant Cell Rep. 43, 48. doi: 10.1007/s00299-023-03132-4, PMID: 38300347
Yang, Z., Liang, G., Liu, C., Chu, Z., and Li, N. (2016). Molecular cloning and functional analysis of GbRVd, a gene in Gossypium barbadense that plays an important role in conferring resistance to Verticillium wilt. Gene 575, 687–694. doi: 10.1016/j.gene.2015.09.046, PMID: 26407869
Zhang, D., Dai, X., Klosterman, S., Subbarao, K., and Chen, J. (2022). The secretome of Verticillium dahliae in collusion with plant defence responses modulates Verticillium wilt symptoms. Biol. Rev. 97, 1810–1822. doi: 10.1111/brv.12863, PMID: 35478378
Zhang, P., Du, H., Wang, J., Pu, Y., Yang, C., Yan, R., et al. (2020). Multiplex CRISPR/Cas9-mediated metabolic engineering increases soya bean isoflavone content and resistance to soya bean mosaic virus. Plant Biotechnol. J. 18, 1384–1395. doi: 10.1111/pbi.13302, PMID: 31769589
Zhao, Y., Chen, W., Cui, Y., Sang, X., Lu, J., Jing, H., et al. (2021). Detection of candidate genes and development of KASP markers for Verticillium wilt resistance by combining genome-wide association study, QTL-seq and transcriptome sequencing in cotton. Theor. Appl. Genet. 134, 1063–1081. doi: 10.1007/s00122-020-03752-4, PMID: 33438060
Zhao, L., Su, P., Hou, B., Wu, H., Fan, Y., Li, W., et al. (2022). The black necrotic lesion enhanced Fusarium graminearum resistance in wheat. Front. Plant Sci. 13, 926621. doi: 10.3389/fpls.2022.926621, PMID: 35845685
Zhao, Y., Zhong, X., Xu, G., Zhu, X., Shi, Y., Liu, M., et al. (2024). The F-box protein OsFBX156 positively regulates rice defence against the blast fungus Magnaporthe oryzae by mediating ubiquitination-dependent degradation of OsHSP71. 1. Mol. Plant Pathol. 25, e13459. doi: 10.1111/mpp.13459, PMID: 38808386
Zheng, X., Liu, F., Yang, X., Li, W., Chen, S., Yue, X., et al. (2023). The MAX2-KAI2 module promotes salicylic acid-mediated immune responses in Arabidopsis. J. Integr. Plant Biol. 65, 1566–1584. doi: 10.1111/jipb.13463, PMID: 36738234
Zhou, L., Deng, S., Xuan, H., Fan, X., Sun, R., Zhao, J., et al. (2022). A novel TIR-NBS-LRR gene regulates immune response to Phytophthora root rot in soybean. Crop J. 10, 1644–1653. doi: 10.1016/j.cj.2022.03.003
Zhu, Y., Zhao, M., Li, T., Wang, L., Liao, C., Liu, D., et al. (2023). Interactions between Verticillium dahliae and cotton: Pathogenic mechanism and cotton resistance mechanism to Verticillium wilt. Front. Plant Sci. 14, 1174281. doi: 10.3389/fpls.2023.1174281, PMID: 37152175
Keywords: Gossypium hirsutum, Verticillium wilt, Gh_FBL43, RNA-Seq, jasmonic acid
Citation: Zhao J, Su X, Gao W, Wang T, Wang Y, Chen Q and Qu Y (2025) Gh_FBL43 regulates the resistance of Gossypium hirsutum to Verticillium wilt through jasmonic acid and flavonoid-related pathways. Front. Plant Sci. 16:1620947. doi: 10.3389/fpls.2025.1620947
Received: 30 April 2025; Accepted: 26 June 2025;
Published: 17 July 2025.
Edited by:
Guangqiang Zhang, Heze University, ChinaReviewed by:
Huan Peng, Chinese Academy of Agricultural Sciences, ChinaXiaofeng Su, Chinese Academy of Agricultural Sciences, China
Copyright © 2025 Zhao, Su, Gao, Wang, Wang, Chen and Qu. This is an open-access article distributed under the terms of the Creative Commons Attribution License (CC BY). The use, distribution or reproduction in other forums is permitted, provided the original author(s) and the copyright owner(s) are credited and that the original publication in this journal is cited, in accordance with accepted academic practice. No use, distribution or reproduction is permitted which does not comply with these terms.
*Correspondence: Quanjia Chen, Y2hxamlhQDEyNi5jb20=; Yanying Qu, eGp5eXE1MzIyQDEyNi5jb20=