 Lingyan Cao1,2,3
 Katie J. Porter2Wenbin Du3Emily J. Tallerday2†
 Moyang Liu3
 Wanqi Liang1Katherine W. Osteryoung2
 Cheng Chen3,4,5*
- 1Joint International Research Laboratory of Metabolic and Developmental Sciences, State Key Laboratory of Hybrid Rice, School of Life Sciences and Biotechnology, Shanghai Jiao Tong University, Shanghai, China
- 2Department of Plant Biology, Michigan State University, East Lansing, MI, United States
- 3Department of Plant Sciences, School of Agriculture and Biology, Shanghai Jiao Tong University, Shanghai, China
- 4Shanghai Collaborative Innovation Center of Agri-Seeds, Shanghai Jiao Tong University, Shanghai, China
- 5Joint Center for Single Cell Biology, Shanghai Jiao Tong University, Shanghai, China
The chloroplast FtsZ ring (Z ring) is assembled by two distinct FtsZ proteins, FtsZ2 and FtsZ1 (referred to as FtsZA and FtsZB in red algae). FtsZ2 confers stability to the Z ring, while FtsZ1 enhances its dynamics. Enhanced Z-ring dynamics is essential for Z-ring remodeling, which drives chloroplast constriction and division. However, the mechanisms underlying the distinct dynamic properties of the two FtsZs remain unclear. Here, we report that the conserved core regions are primarily responsible for the distinct dynamic properties observed in both plant and red algal FtsZs. We demonstrate that the conserved core region of FtsZ1 enhances the dynamics of FtsZ2 within coassembled filaments. Likewise, we show that the conserved core region of red algal FtsZB promotes the dynamics of coassembled FtsZA rings. Our findings provide evidence that the evolution of a second FtsZ protein represents a general mechanism to enhance the dynamics of the chloroplast Z ring.
Introduction
Chloroplasts originated through endosymbiosis when a free-living cyanobacterium was engulfed by a non-photosynthetic eukaryote approximately one billion years ago. The engulfed cyanobacterium gradually evolved to become a permanent organelle within the host cells (Gould et al., 2008; Sibbald and Archibald, 2020). Similar to their prokaryotic ancestors, chloroplasts are propagated through binary fission (division in the middle), ensuring their accurate inheritance during cytokinesis. Chloroplast division is orchestrated by a combination of proteins derived from both cyanobacteria and the host eukaryotes (Maple et al., 2005; TerBush et al., 2013; Osteryoung and Pyke, 2014; Chen et al., 2018). Among them, the cytoskeletal protein Filamentous temperature-sensitive Z (FtsZ) plays a central role, analogous to its function in bacterial cell division (Erickson et al., 2010).
The prokaryotic FtsZ is a tubulin-like GTPase that can self-assemble in the presence of GTP (Erickson, 1997). This protein is highly conserved across a range of species, from bacteria to algae and plants (Margolin, 2005; TerBush et al., 2013; McQuillen and Xiao, 2020). Each FtsZ harbors a conserved core region, which includes the GTP binding and GTPase activation domains, respectively, flanked by less conserved N- and C-terminal regions (Supplementary Figure S1). GTP-bound FtsZ monomers polymerize head to tail to form filamentous structures known as protofilaments (Oliva et al., 2004). The GTPase active site is formed longitudinally at the interface between adjacent FtsZ subunits (Scheffers et al., 2002). Upon GTP hydrolysis at the active site, the interface between two FtsZ subunits becomes less stable in the absence of GTP, leading to the disassociation of the GDP-bound subunit from the protofilament. This disassociated GDP-bound subunit is then recycled back into the soluble pool of FtsZ monomers, where it can be reactivated by binding to GTP (Mingorance et al., 2001). Consequently, the protofilaments exhibit dynamic behavior, effectively treadmilling at a steady state (Bisson-Filho et al., 2017; Yang et al., 2017; Corbin and Erickson, 2020). In bacteria, FtsZ protofilaments overlap to form a ring-like structure known as the FtsZ ring (Z ring) in the middle of the cell (Bi and Lutkenhaus, 1991; Du and Lutkenhaus, 2019; McQuillen and Xiao, 2020). The Z ring is anchored to the plasma membrane through interaction with membrane proteins and serves as a scaffold to recruit additional division proteins to form a mature divisome (Du and Lutkenhaus, 2019). The dynamics of the FtsZ protofilaments is critical for the constriction of the Z ring and thus for bacterial cell division in vivo (Redick et al., 2005; Osawa and Erickson, 2011; McQuillen and Xiao, 2020).
Unlike the bacterial Z ring, which is assembled from a single type of FtsZ, the chloroplast Z ring in the model organism Arabidopsis thaliana is composed of two distinct FtsZ proteins, AtFtsZ1 and AtFtsZ2 (Osteryoung and Vierling, 1995; Osteryoung et al., 1998; Vitha et al., 2001; Stokes and Osteryoung, 2003; TerBush et al., 2013). Both proteins are encoded by nuclear genes and are targeted to the chloroplasts via their N-terminal transit peptides (Osteryoung and Vierling, 1995; McAndrew et al., 2001), which are removed upon import into the chloroplast stroma, thus not being part of the mature protein. Studies have shown that AtFtsZ1 and AtFtsZ2 function non-redundantly and are both essential for the establishment of the chloroplast Z ring and for chloroplast division (Osteryoung et al., 1998; Schmitz et al., 2009). Immunolocalization studies have revealed that AtFtsZ1 and AtFtsZ2 colocalize to the chloroplast Z ring in both wild-type plants and numerous chloroplast division mutants (McAndrew et al., 2001; Vitha et al., 2001; Zhang et al., 2013). Additionally, they have been demonstrated to coassemble both in vitro (Olson et al., 2010) and ex vivo (TerBush and Osteryoung, 2012; TerBush et al., 2016; Yoshida et al., 2016; Chen et al., 2019). Phylogenetic analysis suggests that AtFtsZ2 originated from prokaryotic organisms, while AtFtsZ1 likely arose from the duplication of AtFtsZ2 (TerBush et al., 2013, 2018). AtFtsZ2 bears a conserved C-terminal peptide (CTP), a motif also found in bacterial FtsZs. Tethering of the chloroplast Z ring to the inner envelop membrane is primarily achieved through the interaction of the AtFtsZ2 CTP with the chloroplast membrane protein ARC6 (Maple et al., 2005). In contrast to AtFtsZ2, AtFtsZ1 lacks a defined CTP and does not interact with any known chloroplast membrane proteins, suggesting that the CTP may represent an important functional difference between the two FtsZs (Vitha et al., 2003; Maple et al., 2005; TerBush et al., 2013). Interestingly, recent studies have reported that AtFtsZ1 can directly associate with the inner envelop membrane through its C-terminal amphiphilic motif (Liu et al., 2022; An et al., 2024), indicating that AtFtsZ1 contributes to the tethering of the chloroplast Z ring in vivo as well.
Like the bacterial Z ring, the chloroplast Z ring is thought to be highly dynamic, although its substructure is not fully understood. Chloroplast Z-ring dynamics is challenging to study in planta due to their incorporation into a macromolecular complex with the rest of division machinery. Consequently, heterologous yeast systems, such as Schizosaccharomyces pombe (fission yeast) and Pichia pastoris (budding yeast), have been employed to probe the assembly and dynamics of chloroplast FtsZ filaments or rings (TerBush and Osteryoung, 2012; TerBush et al., 2016; Yoshida et al., 2016; Sung et al., 2018; TerBush et al., 2018; Chen et al., 2019; Porter et al., 2023). These yeast models offer a cellular environment, and their lack of endogenous FtsZ or other chloroplast division regulators makes them ideal for ex vivo investigation of the assembly and dynamic behaviors of the chloroplast FtsZ filaments and rings. Both AtFtsZ1 and AtFtsZ2 form homopolymerized filaments when expressed individually in S. pombe (TerBush and Osteryoung, 2012; TerBush et al., 2016). Coexpression analysis has revealed that AtFtsZ2 filaments exhibit slower turnover dynamics (subunit exchange) compared to AtFtsZ1, and that AtFtsZ1 can accelerate AtFtsZ2 dynamics in coassembled filaments (TerBush and Osteryoung, 2012; TerBush et al., 2018). Moreover, AtFtsZ1 and AtFtsZ2 heteropolymerize into a ring that can constrict in Pichia pastoris, with constriction correlating with increased dynamics of the reconstituted chloroplast Z ring (Yoshida et al., 2016). Overall, AtFtsZ2 appears to confer stability to the chloroplast Z ring, while AtFtsZ1 enhances its dynamics (TerBush et al., 2013). However, the underlying mechanisms governing the distinct dynamic properties of these two FtsZs remain largely elusive.
Rhodophyta (the lineage of red algae) diverged from the common ancestors of Viridiplantae (the lineage of green algae and land plants) and Glaucophyta (Strassert et al., 2021). In red algae, two FtsZ proteins, FtsZA and FtsZB, have been identified to be involved in chloroplast division (Miyagishima et al., 2004). FtsZA, similar to its green lineage counterpart FtsZ2, also possesses a CTP. However, it remains unclear whether the anchoring of the Z ring to the chloroplast membrane in red algae is mediated by interactions between the FtsZA CTP and membrane proteins. In contrast, FtsZB lacks a defined CTP and is believed to have duplicated from FtsZA, making it similar to FtsZ1 (Miyagishima et al., 2004). Both FtsZA and FtsZB are GTPases with conserved core regions flanked by less conserved C- and N-terminal regions, a structural feature common to FtsZ proteins across species. The core regions of FtsZA and FtsZB from the red alga Galdieria sulphuraria (Gs) have been shown to assemble in vitro, with coassembly promoting enhanced disassembly dynamics (Chen et al., 2017), a phenomenon not observed in the coassembly of AtFtsZ2 and AtFtsZ1 in vitro (Porter et al., 2021). These observations suggest that red algal FtsZs may possess unique assembly and dynamic properties. Notably, phylogenetic analysis indicates that the duplication of FtsZs in red algae occurred after the divergence of the red and green lineage (Stokes and Osteryoung, 2003; Miyagishima et al., 2011), suggesting that the evolution of a second FtsZ may be critical for chloroplast division in both lineages.
Previously, we assessed the biochemical behaviors of AtFtsZs using purified proteins and found that AtFtsZ2 assembled into protofilaments in vitro, whereas AtFtsZ1 did not (Porter et al., 2021). When coexpressed, AtFtsZ1 restrained the assembly of AtFtsZ2 protofilaments. We also discovered that the conserved core regions of these proteins largely recapitulated these biochemical features (Porter et al., 2021). However, a critical limitation of these in vitro assays, including those with GsFtsZs (Chen et al., 2017), is the limited ability to draw conclusions about the dynamic turnover of FtsZ filaments or rings. To delve into the mechanisms determining the distinct dynamic properties of the two chloroplast FtsZs, we utilized P. pastoris to examine the assembly and dynamics of chloroplast FtsZ filaments and rings. By directly measuring and comparing the turnover dynamics of Z rings reconstituted from both full-length and conserved core regions of FtsZs, we demonstrate that the conserved core regions predominantly govern the distinct dynamic properties of the two FtsZs in both plants and red algae. Furthermore, our study provides evidence that the evolution of a second FtsZ is a general mechanism to enhance the dynamics of the chloroplast Z ring.
Materials and methods
Construction of plasmids
All expression vector constructions were performed using the Gibson assembly method (Gibson et al., 2009). We prepared the backbone vectors from previously utilized single expression vectors, pPICZ A-AtFtsZ1FL-mCerulean and pPICZ A-AtFtsZ2FL-eYFP-MTS (Yoshida et al., 2016). These were then digested with EcoRI/XbaI or EcoRI/KpnI to excise the AtFtsZ1FL or AtFtsZ2FL fragment. For expression of the full-length FtsZ proteins in Pichia, the predicted transit peptides were excluded: AtFtsZ2 and AtFtsZ1 (1–48 aa and 1–57 aa, respectively), GsFtsZA and GsFtsZB (1–52 aa and 1–57 aa, respectively). The conserved core regions (CCRs) for FtsZs were defined as follows: AtFtsZ2C (119–424 aa), AtFtsZ1C (74–377 aa), GsFtsZAC (121–424 aa), and GsFtsZBC (91–404 aa). All the primers used in this study were listed in Supplementary Table S3.
To generate G. sulphuraria FtsZA and FtsZB constructs, synthesized GsFtsZA and GsFtsZB sequences, which were codon-optimized for A. thaliana for better comparison to their Arabidopsis counterparts (TerBush et al., 2018), were used as templates. Full-length GsFtsZs were amplified using primer sets LY33/LY34 and LY242/LY244, while the CCRs were amplified using primer sets LY36/LY37 and LY243/LY246. The obtained fragments were inserted into the EcoRI/XbaI digested pPICZ A-mCerulean backbone. Similarly, the CCRs of AtFtsZ2 and AtFtsZ1 were amplified using LY332/LY333 and LY330/LY331, and were inserted into the digested pPICZ A-mCerulean backbone. To obtain constructs expressing MTS, the EcoRI/KpnI digested pPICZ A-eYFP-MTS was used as backbone. The primer sets LY332/LY335, LY330/LY334, and LY34/LY35 were used to amplify corresponding fragments in order to yield pPICZ A-AtFtsZ1C-eYFP-MTS, pPICZ A-AtFtsZ2C-eYFP-MTS, and pPICZ A-GsFtsZAFL-eYFP-MTS.
The construction of the co-expression plasmid pPICZ A-AtFtsZ1FL-mCerulean-AtFtsZ2FL-eYFP-MTS was described previously (Yoshida et al., 2016). To generate pPICZ A-AtFtsZ1C-mCerulean-AtFtsZ2C-eYFP-MTS, the AtFtsZ1C-mCerulean expression cassette was amplified using primers CC229/LY190 and then inserted into the BglII digested pPICZ A-AtFtsZ2C-eYFP-MTS backbone. To obtain pPICZ A-GsFtsZAFL-mCerulean-GsFtsZBFL-eYFP, we first amplified the GsFtsZBFL-eYFP-MTS expression cassette using primers CC229/LY190 and then inserted into the BglII digested pPICZ A-GsFtsZAFL-mCerulean backbone. The obtained plasmid was further digested with BamHI/KpnI to excise the eYFP-MTS fragment and thus served as backbone. Finally, we used the primer pairs LY201/LY328 and LY329/LY192 to amplify the eYFP expression cassette lacking MTS, and inserted the cassette into the BamHI/KpnI digested backbone to yield pPICZ A-GsFtsZAFL-mCerulean-GsFtsZBFL-eYFP. Similar strategy was adopted to generate pPICZ A-GsFtsZAFL-mCerulean-GsFtsZBC-eYFP. In brief, the GsFtsZBC-eYFP-MTS expression cassette was first amplified using primers CC229/LY190 and the obtained fragment was inserted into the BglII digested pPICZ A-GsFtsZAFL-mCerulean backbone. The obtained plasmid was further digested with BamHI/KpnI to excise the eYFP-MTS fragment and used as backbone. The primer pairs LY410/LY328 and LY329/LY192 were used to amplify the eYFP expression cassette lacking MTS, and the resulting fragment was inserted into the digested backbone to obtain pPICZ A-GsFtsZAFL-mCerulean-GsFtsZBC-eYFP.
To generate the chimeric protein expression vector pPICZ A-AtFtsZ2NT-Z1C-Z2CT-mCerulean, primer pairs of LY336/LY337, LY338/LY339 and LY340/LY341 were used to amplify fragments of AtFtsZ2NT, AtFtsZ1C and AtFtsZ2CT, and then Gibson assembled into the digested pPICZ A-mCerulean backbone. Similarly, LY336/LY343, LY344/LY345, LY346/LY347 were used for amplification fragments of AtFtsZ1NT, AtFtsZ2C and AtFtsZ1CT, and then Gibson assembled into the digested pPICZ A-mCerulean backbone to yield pPICZ A-AtZ1NT-Z2C-Z1CT-mCerulean construct.
To obtain the pET11b-Z2NTZ1CZ2CT vector, the fragment of Z2NTZ1CZ2CT was amplified using the primer pair LY253/LY252 and then assembled into the BamHI/NdeI digested pET11b vector. Likewise, the fragment of Z1NTZ2CZ1CT was amplified using the primer pair LY251/LY254 and then assembled into the BamHI/NdeI digested pET11b vector to yield pET11b-Z1NTZ2CZ1CT.
Cell culture, transformation and induction of protein expression in Pichia
Pichia pastoris (P. pastoris) X-33 strain was used in this study. The pPICZ A expression vector (Invitrogen), harboring the genes of interest, was transformed into the X-33 strain and integrated into the host genome via homologous recombination. The transformation of Pichia was conducted as previously described, with minor modifications (Chen et al., 2019). Briefly, 10 μg of the pPICZ A vector was linearized using enzyme restriction and introduced into the X-33 strain via electroporation. The pPICZ A vector contains a phleomycin resistant gene for selection in both Escherichia coli (E. coli) and P. pastoris. To select positive transformants in Pichia, 10 μg mL-1 phleomycin (InvioGen) was added to YPDS (1% yeast extract, 2% peptone, 1 M sorbitol, 2% dextrose) plates containing 2% agar.
The pPICZ A vector features an inducible AOX1 promoter, which facilitates distinct levels of protein expression. During the growth phase, proteins are minimally expressed in BMGY medium (1% yeast extract, 2% peptone, 100 mM potassium phosphate at pH 6.0, 1.34% YNB, 0.00004% biotin, 1% glycerol), where glucose serves as the sole carbon source. In contrast, protein expression is induced upon transfer to BM medium (1% yeast extract, 2% peptone, 100 mM potassium phosphate at pH 6.0, 1.34% YNB, 0.00004% biotin), which lacks a carbon source.
To assess the expression of FtsZ proteins in P. pastoris, transformed Pichia cells were streaked out onto YPD (1% yeast extract, 2% peptone, 2% dextrose) plates. A single colony was selected, pre-cultured in 2.5 mL of BMGY medium overnight, and then centrifuge at 1,000 g for 2 min at room temperature. The pellet was resuspended in 500 μL of BM medium, and the culture was grown continuously in a shaker at 30°C until the indicated time.
Expression and purification of the recombinant proteins in E. coli
To express the recombinant chimeric His-Z2NTZ1CZ2CT and His-Z1NTZ2CZ1CT proteins, we transformed the corresponding vectors into E. coli DE3 Rosetta cells. The transformed bacterial cells were cultured in a shaker at 37°C overnight. The following day, they were subcultured into fresh LB medium and allowed to grow at 37°C until the OD600 reached between 0.6 and 0.8. Subsequently, the cultures were subjected to an ice shock for 10 min before the addition of Isopropyl β-D-1-thiogalactopyranoside (IPTG; 0.6 mM) to induce protein expression. After 36–42 hours of induction at 14°C, the cells were harvested by centrifugation and re-suspended in 20 mL of low salt buffer (LSB: 20 mM Tris pH 7.5, 50 mM NaCl, 10% glycerol). The re-suspended cell pellets were then stored at -80°C for further use.
Purification of the chimeric proteins was conducted according to the method previously described (Porter et al., 2021). In brief, the harvested cells were thawed and lysed using 1 mg/ml Lysozyme (Lab Scientific, Highlands, NJ) for 30 min at 4°C. After lysis, the cells were sonicated to further rupture the cells and release the expressed proteins. Following centrifugation to pellet the cell debris, the supernatant containing the soluble protein was loaded onto a Ni-NTA column (Qiagen). The column was then washed with a gradient of imidazole concentrations (from 20 to 50 mM) in LSB (20 mM Tris pH 7.5, 50 mM NaCl, 10% glycerol) to remove unbound proteins. The chimeric proteins were eluted using 300 mM imidazole in LSB. The eluted proteins were dialyzed against LSB to exchange the buffer and remove imidazole. Finally, the purified proteins were aliquoted and stored at -80°C for long-term preservation.
GTPase measurement
GTPase activity was measured following the procedures from Ingermann and Nunnari, with slightly modifications (Ingerman and Nunnari, 2005). The assay fundamentally measured the depletion of NADPH at 340 nm. The consumption of one NADPH molecule facilitates the regeneration of a GTP from a GDP, thereby reflecting the GTPase activities. All proteins used in the experiments were centrifuged at 80,000 g for 30 min at 4°C prior to the assay. In brief, a total volume of 180 µL was prepared, containing the desired protein concentrations in the reaction buffer (1 mM phosphoenolpyruvate, 0.4 mM NADH, and 20 U/mL pyruvate kinase/lactate dehydrogenase, in 50 mM HEPES–KOH, pH 7.5, 5 mM MgSO4, and 100 mM KCl). Finally, 20 µL of GTP (Sigma) was added to initiate the monitoring of absorbance at 340 nm using a SpectraMax M2 microplate reader (Molecular Devices). The GTPase activities were calculated according to the previous study (Porter et al., 2021).
Microscopy imaging and FRAP analysis
All images were collected at room temperature using a spectral-based FluoView 1000 laser scanning confocal microscope (Olympus) equipped with a UPlanSApo 100× (NA 1.40) oil immersion objective. FV1000 ASW software (Olympus) was used to capture either snapshots or time-lapse images during the FRAP experiment. For proteins fused with eYFP in single expression cells, a 515 nm laser was utilized, while for proteins fused with mCerulean, a 458 nm laser was utilized. FRAP analysis was conducted as previously described (Yoshida et al., 2016; Chen et al., 2019), with slight modifications. Briefly, three images with a 10 s interval were taken as the pre-bleached control, and then a ROI (Region of Interest) of 20 pixels in diameter was selected for photobleaching for 20 ms using the Tornado scanning tool within the FV1000 ASW software. Recovery of the fluorescence signals was monitored at 10 s intervals for a total of 260 s. To correct and normalize the FRAP data, ROIs with the same size were recorded during each experiment: one at a region of the fluorescence signal away from the photobleached spot to account for photobleaching due to continual acquisition, and another at a region of the background signal to account for random noise. Curve fitting was performed with ProFit 7 software. The data were fit to the function of a two-binding-state model (Sprague et al., 2004; Yoshida et al., 2016): f(t) = (1 - r) (1 - Ceq1 e-koff1*t - Ceq2 e-koff2*t), where t is time (s), Ceq1 and Ceq2 refer to the fractions of bound molecules, koff1 and koff2 refer to dissociation rate constants, and r is an additional parameter to account for incomplete recovery (Sprague et al., 2004). The corresponding parameters for each FRAP data were summarized in Supplementary Tables S1, S2. All image processing was conducted in Fiji.
Accession numbers
The GenBank accession numbers for the FtsZ genes are as follows: cDNAs of A. thaliana FtsZ2 (AF089738) and A. thaliana FtsZ1 (AY113896) and G. sulphuraria FtsZA (BBAA82099), and G. sulphuraria FtsZB (BAA82091).
Results
The conserved core regions determine the distinct dynamics of AtFtsZ1 and AtFtsZ2 filaments
The conserved core regions of AtFtsZ1 and AtFtsZ2 largely determine the distinct assembly properties of the purified proteins in vitro (Porter et al., 2021). We therefore asked whether the core regions govern the unique turnover dynamics of their assembled filaments in living cells. To test this, we fused mCerulean (mC) to the C-termini of full-length AtFtsZ1 (AtFtsZ1FL) and AtFtsZ2 (AtFtsZ2 FL) lacking the TPs (Figure 1a) to create AtFtsZ1FL-mC and AtFtsZ2FL-mC, as well as to their core regions (AtFtsZ1C and AtFtsZ2C) (Porter et al., 2021) to create AtFtsZ1C-mC and AtFtsZ2C-mC. The fusion proteins were then expressed separately in P. pastoris. Throughout this paper, we describe data for AtFtsZ2 before AtFtsZ1 because AtFtsZ2 is a more typical FtsZ as described above (TerBush et al., 2013), and to facilitate comparisons between the Arabidopsis and red algal FtsZ proteins in experiments described below.
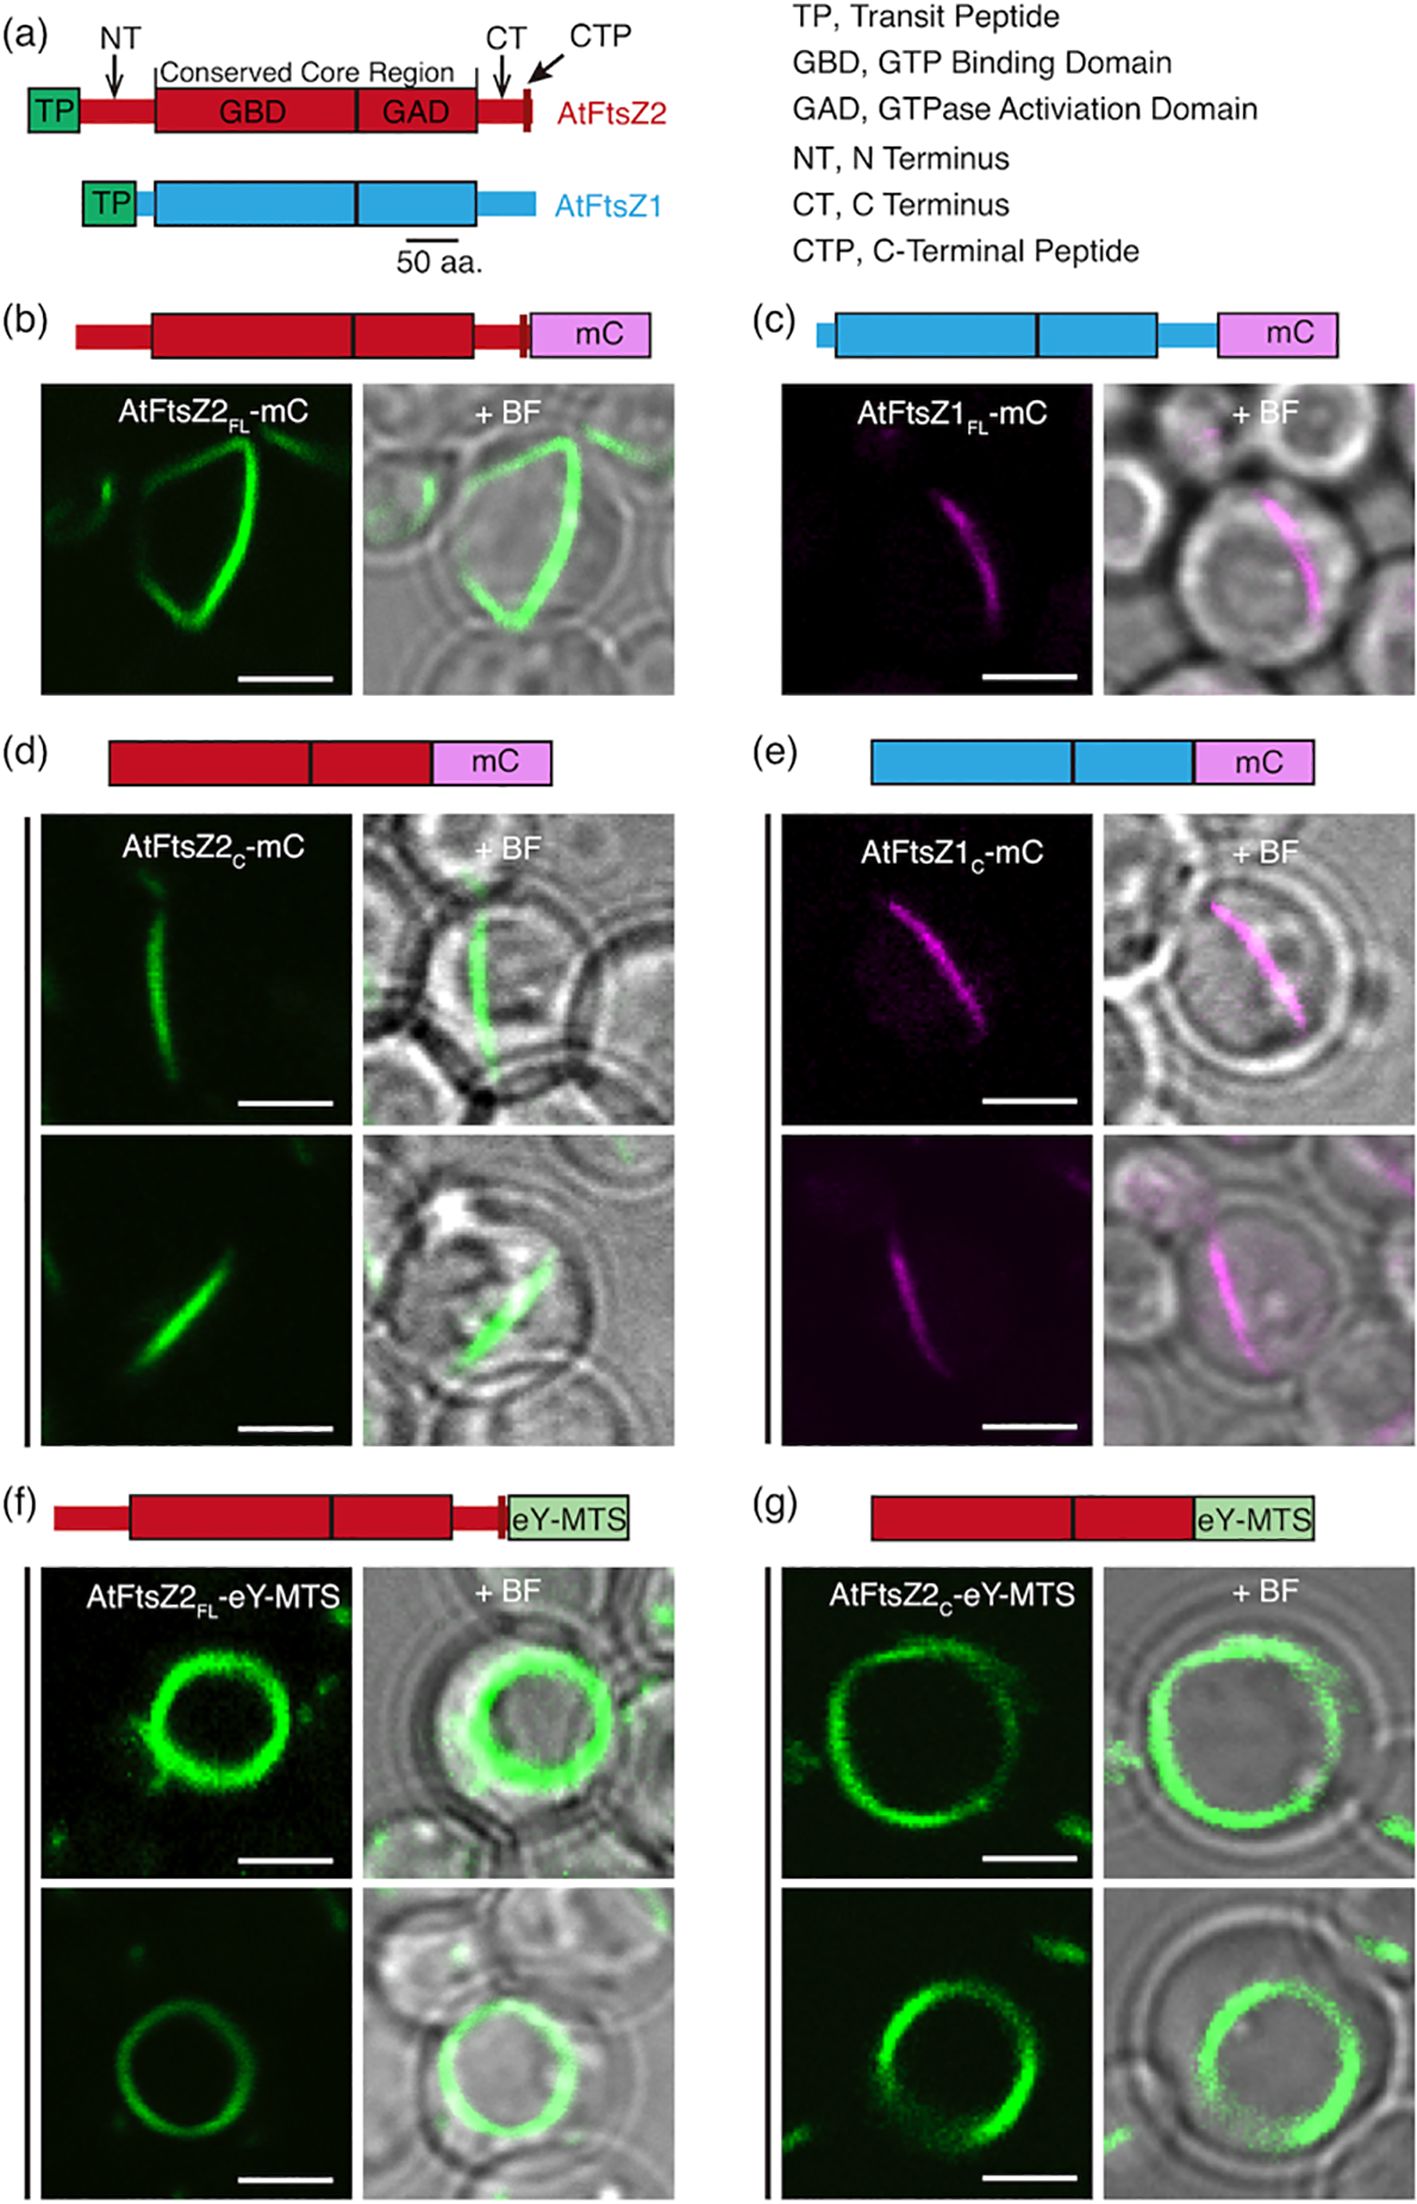
Figure 1. AtFtsZ Filament and Ring Morphologies in P. pastoris. (a) Structural features of AtFtsZ2 (top) and AtFtsZ1 (bottom). aa, amino acids. (b, c) Representative images of full-length A. thaliana FtsZs, lacking their predicted transit peptides (TPs) (Olson et al., 2010), expressed separately in P. pastoris. Specifically, the FtsZs expressed are as follows: FtsZ2-mCerulean (AtFtsZ2FL-mC), and FtsZ1-mCerulean (AtFtsZ1FL-mC). (b) AtFtsZ2FL-mC formed deep-curved but unclosed filamentous structures, while (c) AtFtsZ1FL-mC formed shallow-curved filaments. (d, e) Representative images of the core regions of AtFtsZ2-mCerulean (AtFtsZ2C-mC) or AtFtsZ1-mCerulean (AtFtsZ1C-mC) expressed separately in P. pastoris. Only shallow-curved filamentous structures were observed in cells expressing either (d) AtFtsZ2C-mC or (e) AtFtsZ1C-mC. (f, g) Representative images of FtsZ2FL-eYFP or FtsZ2C-eYFP fused to a membrane-tethering sequence (MTS) derived from Escherichia coli MinD (Szeto et al., 2003) at the C terminus (AtFtsZ2FL-eY-MTS), allowing AtFtsZ2FL-eY or FtsZ2C-eY filaments to associate with the membrane (Yoshida et al., 2016). Circular filamentous structures were observed in cells expressed with either (f) AtFtsZ2FL-eY-MTS or (g) AtFtsZ2C-eY-MTS. + BF, merge of fluorescent image with corresponding bright field. Bars are 2 μm.
In control experiments, AtFtsZ2FL-mC and AtFtsZ1FL-mC both formed filaments in P. pastoris resembling those reported previously (Yoshida et al., 2016). AtFtsZ2FL-mC filaments looped around the cell and were generally longer and more jagged in appearance than AtFtsZ1FL-mC filaments, which were shaped like shallow arcs (Figures 1b, c). AtFtsZ2C-mC and AtFtsZ1C-mC both formed arc-shaped filaments (Figures 1d, e). The latter results validated that the core regions alone are sufficient for assembly of both AtFtsZs in living cells (TerBush et al., 2016).
To compare the turnover dynamics of the filaments formed in P. pastoris, we performed fluorescence recovery after photobleaching (FRAP) experiments. Recovery of fluorescence into the bleached region was monitored for 260 s and a two-binding-state equation was used to fit the recovery curves (Sprague et al., 2004; Yoshida et al., 2016). Because a half-time of recovery cannot be derived from such curves, we instead used the percent of fluorescence recovered 130 s after photobleaching (R130) to allow direct statistical comparisons of dynamics between different FtsZ filaments, and indicated the statistics in Supplementary Figure S2 (Arabidopsis) and Supplementary Figure S6 (red alga). The R130 values for AtFtsZ2FL-mC and AtFtsZ1FL-mC were 11% and 19%, respectively (Figures 2a-c; Supplementary Figure S2A), indicating that AtFtsZ2FL filaments are significantly less dynamic than AtFtsZ1FL filaments, as shown previously in S. pombe (TerBush and Osteryoung, 2012). Similarly, AtFtsZ2C-mC (R130 = 17%) was significantly less dynamic than AtFtsZ1C-mC (R130 = 27%) (Figures 2d–f; Supplementary Figure S2A), revealing that the conserved core regions contribute substantially to the differences between AtFtsZ2 and AtFtsZ1 turnover dynamics. R130 was significantly lower for AtFtsZ2FL-mC (11%) than AtFtsZ2C-mC (17%) (Figures 2b, e; Supplementary Figures S2A, S3A), suggesting the N- and/or C-terminal flanking regions may constrain the turnover of FtsZ2 filaments. R130 was also lower for AtFtsZ1FL-mC (19%) than AtFtsZ1C-mC (27%) (Figures 2c, f), but the difference was not statistically significant (Supplementary Figure S2A). However, the fluorescence recovery curve of AtFtsZ1FL-mC exhibited a higher recovery trend than that of AtFtsZ1C-mC (Supplementary Figure S3B), implying that the N- and/or C-terminal flanking regions may also constrain the turnover of FtsZ1 filaments.
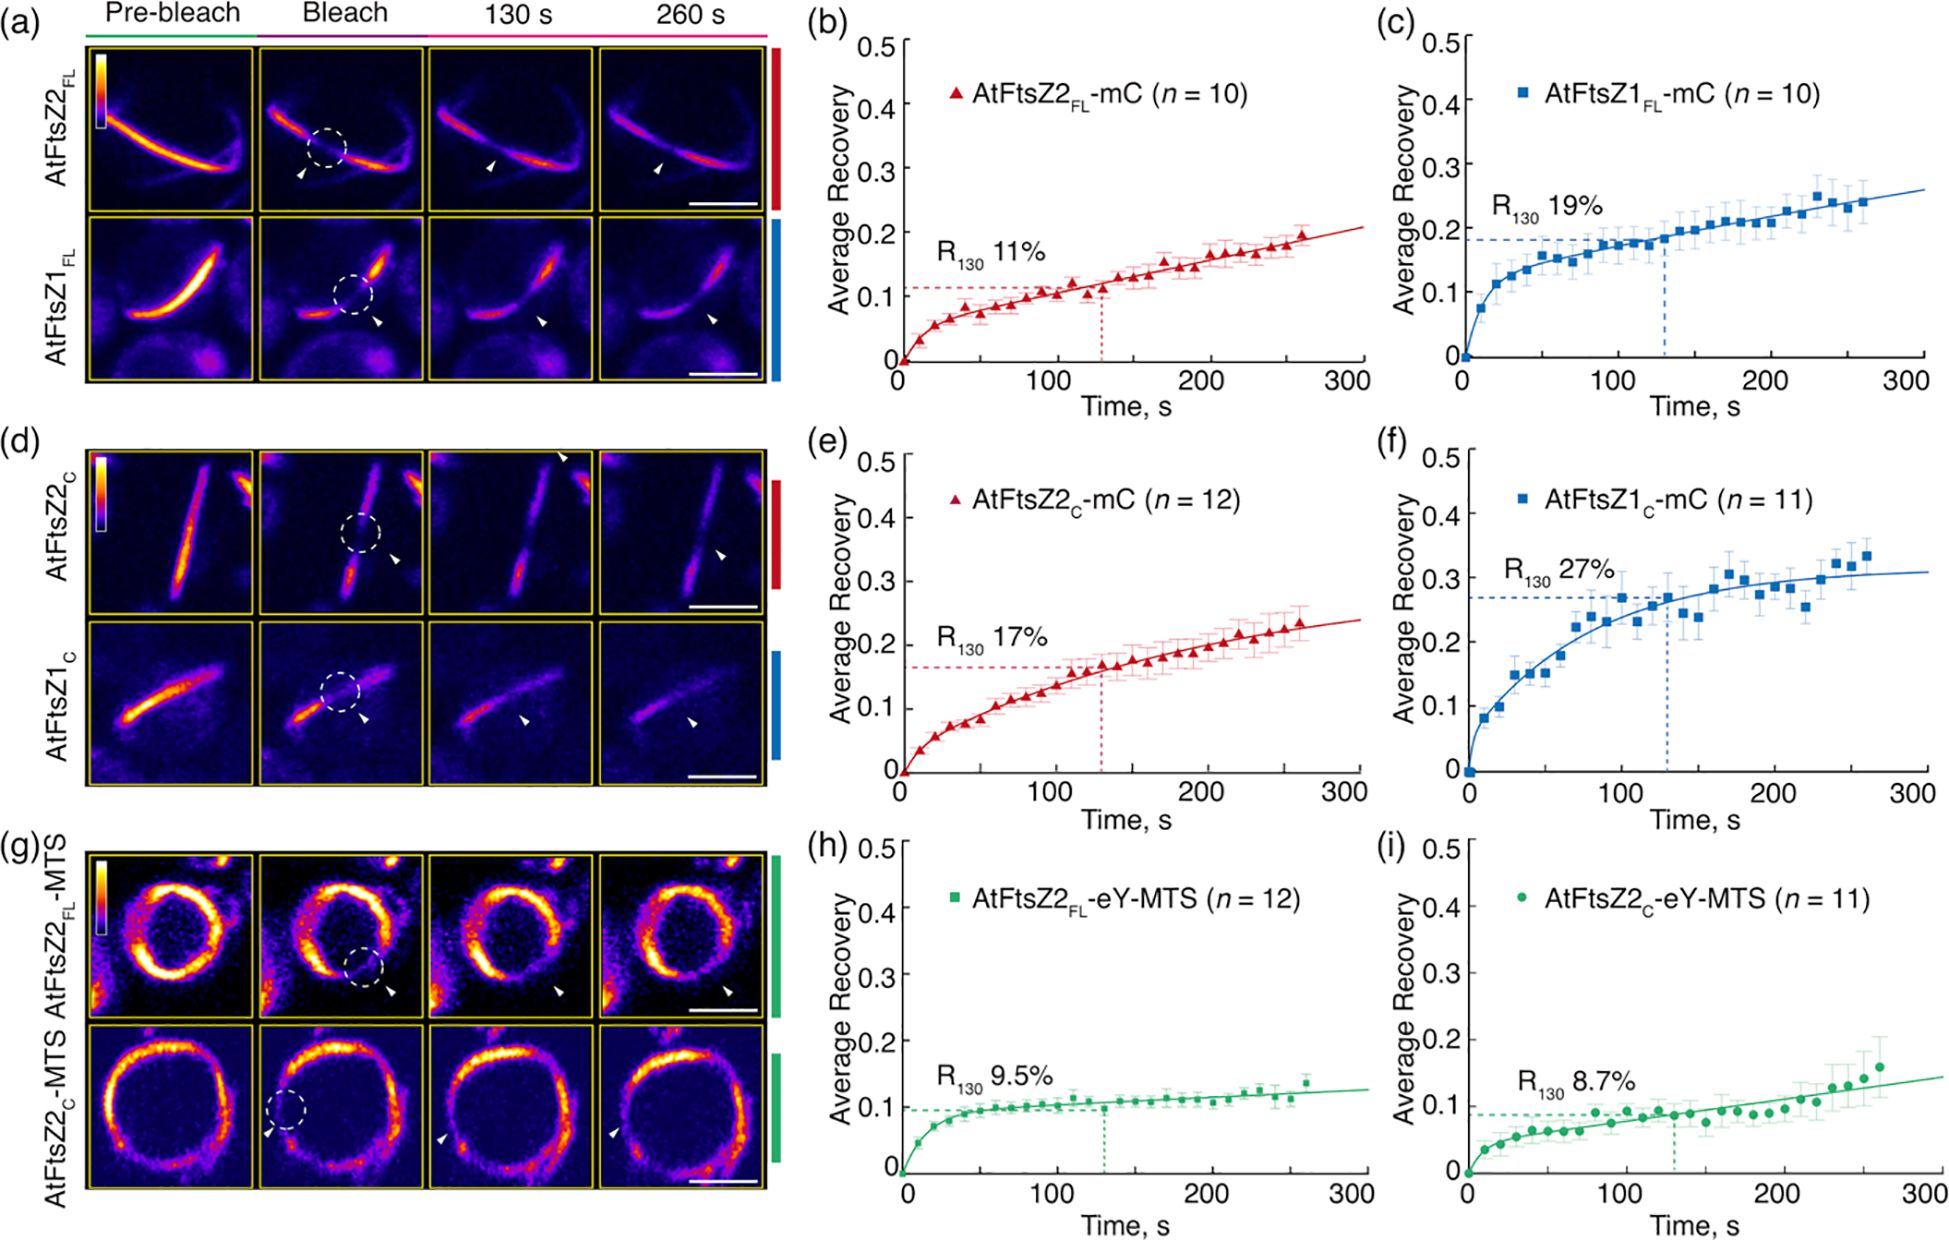
Figure 2. The Conserved Core Regions Determine the Distinct Turnover Dynamics of AtFtsZ1 and AtFtsZ2 Filaments. FRAP (fluorescence recovery after photobleaching) analysis of the AtFtsZ filaments and rings in Pichia. FRAP experiments were conducted with either (a–f) mCerulean (mC) or (g–i) eYFP (eY) signals in Pichia cells expressing AtFtsZ proteins separately, as described in Figure 1. Recovery of mC or eY fluorescence was recorded for 260 s following photobleaching. A two-binding-state equation was used to perform curve fitting using averaged recovery data (Sprague et al., 2004; Yoshida et al., 2016). R130 refers to the percentage of fluorescence recovered at 130 s post-bleaching. (a, d, g) Fluorescence images show AtFtsZ filaments and rings prior to photobleaching (Pre-bleach), at the time of photobleaching (Bleach), and at 130 and 260 s after photobleaching. The photobleached regions are indicated by white circles and arrowheads. The fluorescence intensity is indicated by the color scale bar with white the highest and black the lowest. Bars are 2 μm. Curve-fitting graphs derived from FRAP data collected from (b) AtFtsZ2FL-mC filaments, (c) AtFtsZ1FLmC filaments, (e) AtFtsZ2C-mC filaments, (f) AtFtsZ1C-mC filaments, (h) AtFtsZ2FL-eY-MTS rings, and (i) AtFtsZ2C-eY-MTS rings. Dashed lines show the average recovery of fluorescence 130 s after photobleaching (R130). Values represent mean ± SE; n indicates the number of FRAP cells.
Membrane tethering of AtFtsZs promotes ring formation
To study constriction of Escherichia coli FtsZ in vitro, Osawa et al. (2008) fused a membrane-tethering sequence (MTS) to the C-terminus of an FtsZ-eYFP fusion protein, which allowed it to form a membrane-tethered contractile ring inside liposomes. The chloroplast membrane proteins that interact with AtFtsZ2 are lacking in P. pastoris, but the same MTS also enabled full-length AtFtsZ2 fused to eYFP (AtFtsZ2FL-eY-MTS) to form a contractile ring in P. pastoris that was attached to the plasma membrane, whereas AtFtsZ2FL without the MTS was not attached (Yoshida et al., 2016). We used AtFtsZ2FL-eY-MTS and constructed AtFtsZ2C-eY-MTS to explore the effect of membrane tethering on the assembly and dynamics of the full-length and core AtFtsZ2 proteins. Unlike the proteins lacking the MTS (Figures 1b, d), both AtFtsZ2FL-eY-MTS and AtFtsZ2C-eY-MTS assembled into well-defined closed rings (Figures 1f, g). FRAP experiments showed that the R130 values for AtFtsZ2FL- eY-MTS and AtFtsZ2C-eY-MTS were 9.5% and 8.7%, respectively (Figures 2g–i; Supplementary Figure S2B). Statistical analysis demonstrated that the difference between the dynamics of AtFtsZ2FL-eY-MTS and AtFtsZ2C-eY-MTS was not significant (Supplementary Figure S2B), further indicating that AtFtsZ2 dynamics is dominated by its core region. To further explore the effect of membrane tethering on the assembly and dynamics of AtFtsZ1, we used AtFtsZ1FL-eY-MTS (Yoshida et al., 2016) and constructed AtFtsZ1C-eY-MTS. Unlike AtFtsZ1C-eY-MTS, which was not successfully expressed, AtFtsZ1FL-eY-MTS was successfully expressed and assembled into well-defined closed rings (Supplementary Figure S4A). The R130 value for AtFtsZ1FL-eY-MTS was 14% (Supplementary Figure S4B). Statistical analysis demonstrated that AtFtsZ1FL-eY-MTS rings were more dynamic than AtFtsZ2FL-eY-MTS rings (Supplementary Figure S2B), suggesting that membrane tethering does not alter the dynamic property difference between AtFtsZ2 and AtFtsZ1. Together, these results suggest that membrane tethering promotes the formation of AtFtsZ2FL, AtFtsZ2C and AtFtsZ1FL into rings.
The conserved core region of AtFtsZ1 enhances AtFtsZ2 dynamics in coassembled filaments
AtFtsZ2 is similar to bacterial FtsZs in that its primary function is to establish the structural framework of the chloroplast Z ring (Yoder et al., 2007; Erickson et al., 2010; Chen et al., 2018). In contrast, a critical role for AtFtsZ1 is to enhance Z-ring turnover dynamics by promoting AtFtsZ2 subunit exchange (TerBush and Osteryoung, 2012; Chen et al., 2018; TerBush et al., 2018). To ask whether the core region of AtFtsZ1 is sufficient for this activity, we coexpressed the full-length and core proteins in P. pastoris and compared the dynamics of the resulting filaments (Figures 3a–h). To mimic the membrane-tethering function of AtFtsZ2 in chloroplasts (Maple et al., 2005; Yoshida et al., 2016), in these experiments we only used AtFtsZ2FL-eY-MTS and AtFtsZ2C-eY-MTS.
In control experiments, AtFtsZ2FL-eY-MTS and AtFtsZ1FL-mC coassembled primarily into closed rings (Figure 3a) as observed previously (Yoshida et al., 2016). R130 for AtFtsZ2FL-eY-MTS was significantly higher when coassembled (13%) compared to when assembled separately (9.5%) (Figures 3c, d, 2h; Supplementary Figure S2B), which is consistent with prior findings showing that AtFtsZ2 dynamics is accelerated by coassembling with AtFtsZ1. AtFtsZ2C-eY-MTS and AtFtsZ1C-mC also coassembled, forming either deeply curved arcs wrapped around the cell or closed rings (Figures 3b, f). R130 for AtFtsZ2C-eY-MTS was also significantly higher when coassembled (11%) with AtFtsZ1C-mC compared to when assembled separately (8.7%) (Figures 3g, 2i; Supplementary Figure S2B). These results demonstrate that the core region of AtFtsZ1 contains the primary information required for enhancing the turnover of AtFtsZ2 subunits from coassembled rings.
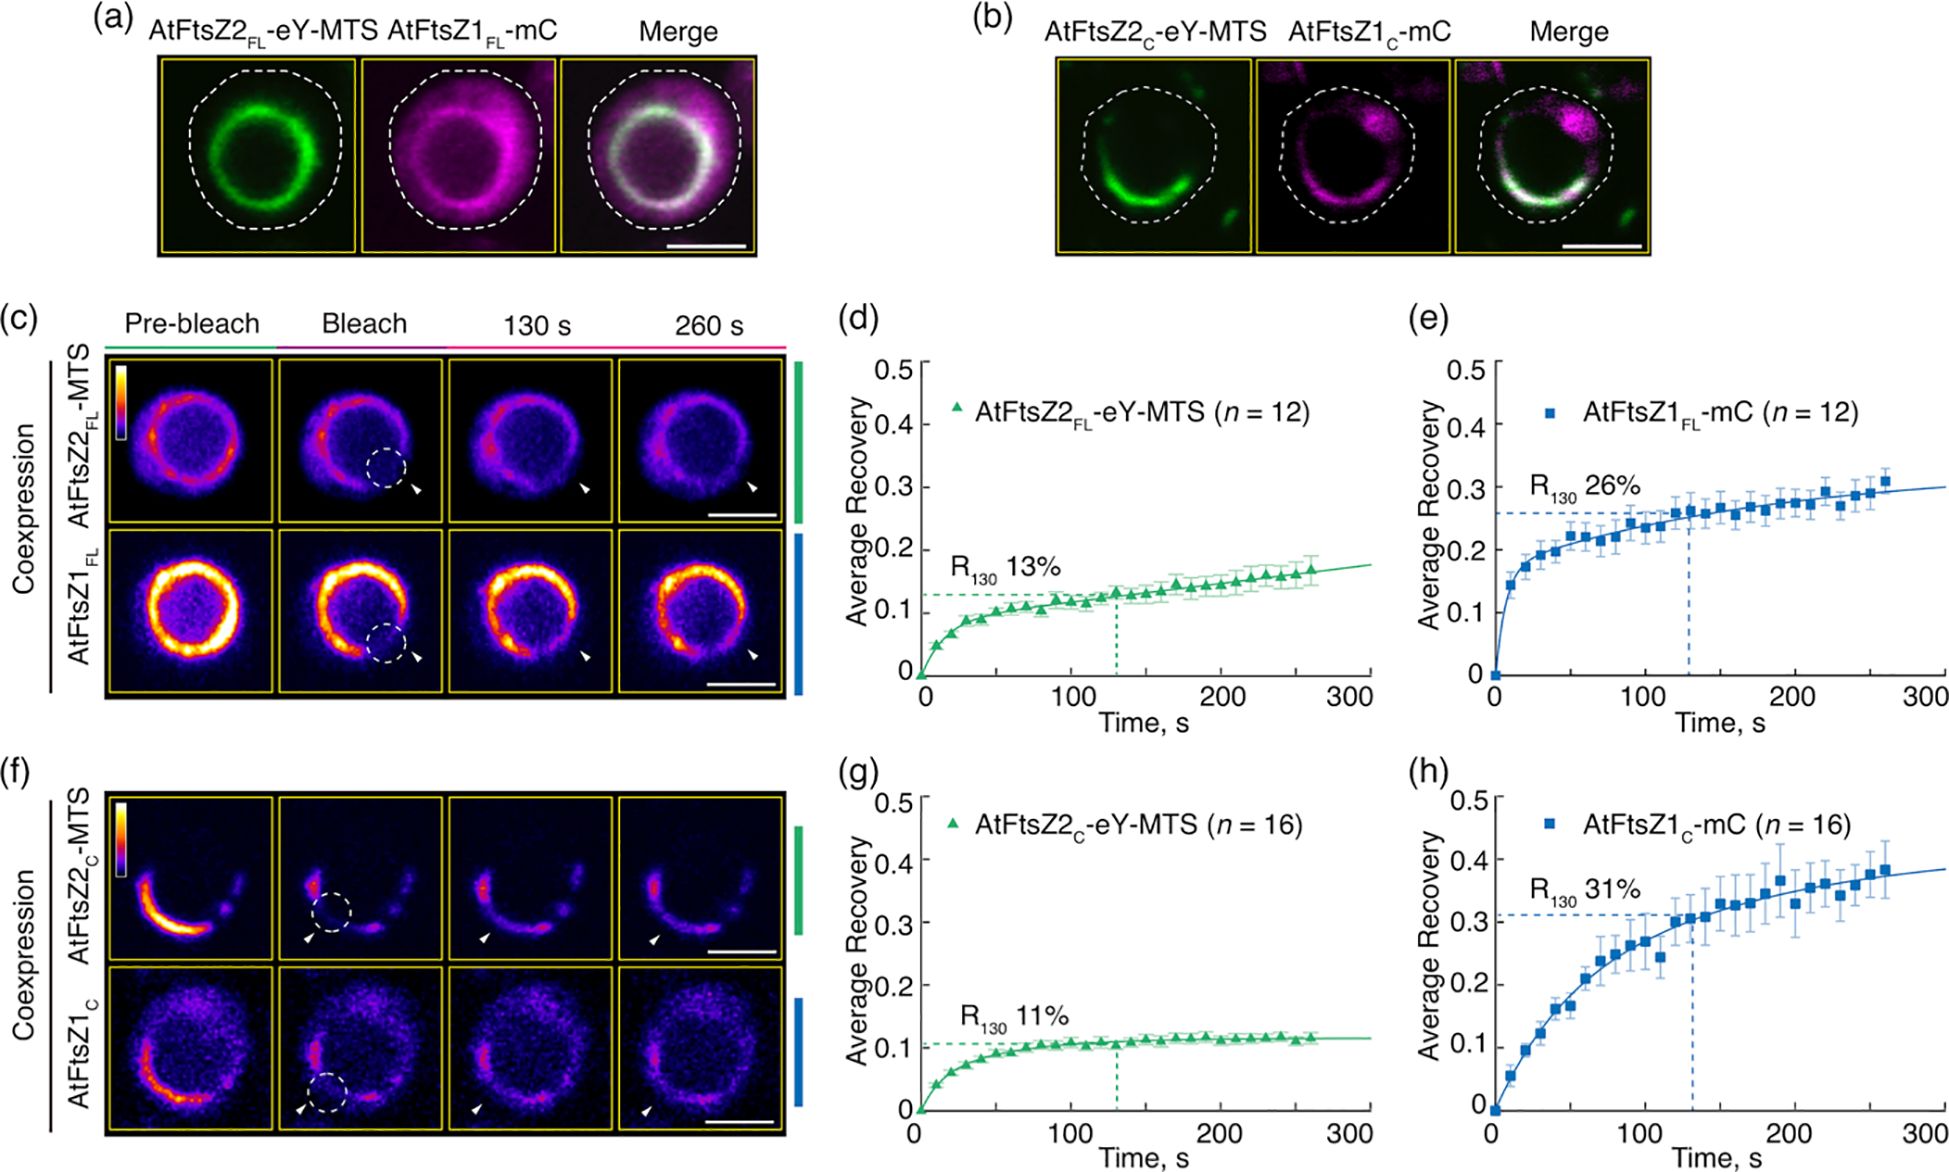
Figure 3. The Conserved Core Regions Are Sufficient for the Dynamic Regulation of Coassembled AtFtsZ1/AtFtsZ2 Filaments. (a, b) Coexpression of (a) the full-length AtFtsZ1-mCerulean (AtFtsZ1FL-mC) and AtFtsZ2FL-eYFP-MTS (AtFtsZ2FL-eY-MTS), or (b) the core regions of AtFtsZ1-mCerulean (AtFtsZ1c-mC) and AtFtsZ2C-eYFP-MTS (AtFtsZ2c-eY-MTS) in Pichia. White dashed lines indicate the outline of Pichia cells. Bars are 2 μm. (c–h) FRAP analysis of AtFtsZ rings and filaments when coexpressed in Pichia. FRAP experiments were conducted with either eYFP (eY) for AtFtsZ2 or mCerulean (mC) for AtFtsZ1. (c, f) Fluorescence images show AtFtsZ rings and filaments prior to photobleaching (Pre-bleach), at the time of photobleaching (Bleach), and at 130 and 260 s after photobleaching. The photobleached regions are indicated by white circles and arrowheads. The fluorescence intensity is indicated by a color scale bar with white the highest and black the lowest. Bars are 2 μm. Curve-fitting graphs derived from the FRAP data collected simultaneously from coexpression of (d) AtFtsZ2FL-eY-MTS and (e) AtFtsZ1FL-mC rings, or from coexpression of (g) AtFtsZ2C-eY-MTS and (h) AtFtsZ1C-mC filaments. Dashed lines show the average recovery of fluorescence 130 s after photobleaching (R130). Values represent mean ± SE; n indicates the number of FRAP cells.
The flanking regions have little influence on the relative dynamics of AtFtsZ2 and AtFtsZ1
While our results above show that the core regions dominate the distinct turnover dynamics of AtFtsZ2 and AtFtsZ1, a previous study of truncated AtFtsZs in S. pombe suggested the N- and C-terminal regions influence the dynamics of filaments assembled by corresponding AtFtsZs (TerBush et al., 2016). To further explore the contributions of the N-terminal (NT) and C-terminal (CT) flanking regions to the relative difference of the AtFtsZs dynamics, we generated two chimeric proteins, AtFtsZ1NT-AtFtsZ2C-AtFtsZ1CT (Z1NTZ2CZ1CT) and AtFtsZ2NT-AtFtsZ1C-AtFtsZ2CT (Z2NTZ1CZ2CT), in which the flanking regions were swapped (Figures 4a, b). This swap strategy was designed to explore whether the flanking regions of AtFtsZ1 would make AtFtsZ2C behaves like AtFtsZ1 (Figure 4a), and vice versa (Figure 4b). To evaluate their functionalities, we expressed them in E. coli, purified them, and measured their GTPase activities. The activities of Z1NTZ2CZ1CT and Z2NTZ1CZ2CT at 25°C were 0.39 ± 0.21 and 0.26 ± 0.10 GTP FtsZ-1 min-1, respectively, similar to the activities reported for AtFtsZ2 and AtFtsZ1, respectively (Porter et al., 2021), indicating both chimeras are functional GTPases.
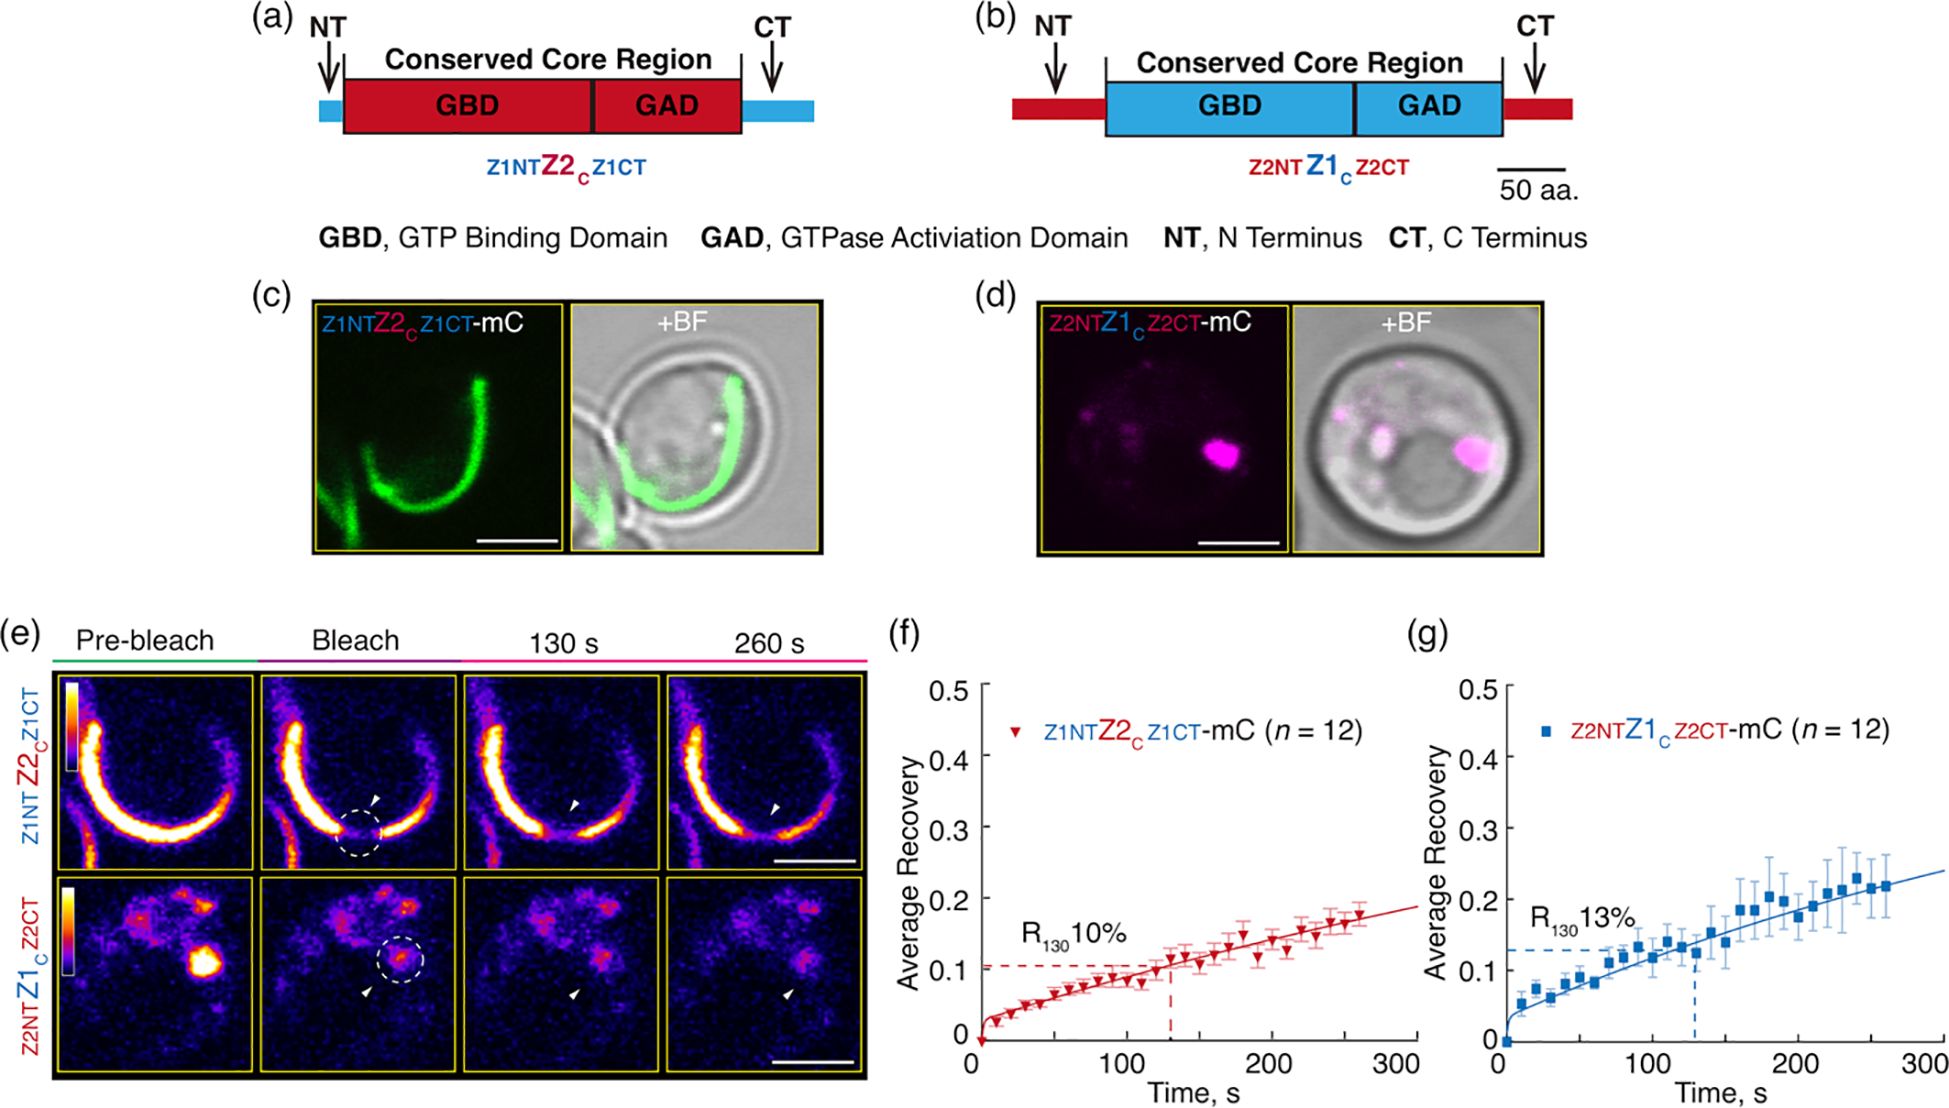
Figure 4. Flanking Regions Have Only Minor Influence on the Relative Dynamics of AtFtsZ1 and AtFtsZ2 Filaments. (a, b) Diagrams depicting the structures of the chimeric proteins (a) AtFtsZ2NT-Z1C-Z2CT (Z2NTZ1CZ2CT) and (b) AtFtsZ1NT-Z2C-Z1CT (Z1NTZ2CZ1CT). aa, amino acids. (c, d) Representative images of the chimeras, (c) Z2NTZ1CZ2CT-mCerulean (Z2NTZ1CZ2CT-mC) or (d) Z1NTZ2CZ1CT-mCerulean (Z1NTZ2CZ1CT-mC) expressed in Pichia. + BF, merge of fluorescent image with corresponding bright field. (e–g) FRAP analysis of the chimeric proteins Z2NTZ1CZ2CT-mC and Z1NTZ2CZ1CT-mC when expressed individually in Pichia. (e) Fluorescence images of the chimeras taken prior to photobleaching (Pre-bleach), at the time of photobleaching (Bleach), and at 130 and 260 s after photobleaching. White circles and arrowheads mark the photobleached regions. The fluorescence intensity of mCerulean (mC) is indicated by a color scale bar with white the highest and black the lowest. Bars are 2 μm. Curve-fitting graphs derived from the FRAP data collected from (f) Z2NTZ1CZ2CT-mC and (g) Z1NTZ2CZ1CT-mC. Dashed lines show the average recovery of fluorescence 130 s after photobleaching (R130). Values represent mean ± SE; n indicates the number of FRAP cells. Bars are as indicated.
The chimeric proteins were then fused to mCerulean and expressed in P. pastoris. Z1NTZ2CZ1CT-mC formed long arced filaments while Z2NTZ1CZ2CT-mC formed condensates (Figures 4c, d), indicating that the swap of AtFtsZ2’s flanking regions to AtFtsZ1C appears to prevent the Z2NTZ1CZ2CT chimeric protein from assembling into long filaments. In FRAP experiments, Z1NTZ2CZ1CT-mC (R130 = 10%) was less dynamic than Z2NTZ1CZ2CT-mC (R130 = 13%) (Figures 4e–g; Supplementary Figure S3C). However, the difference in R130 values was not statistically significant (Supplementary Figure S2C), unlike the difference between AtFtsZ2FL-mC and AtFtsZ1FL-mC (Supplementary Figure S2A). However, the dynamics of Z1NTZ2CZ1CT-mC and Z2NTZ1CZ2CT-mC were similar to those of AtFtsZ2FL-mC and AtFtsZ1FL-mC, respectively (Supplementary Figure S2C), implying the flanking regions of one protein did not alter the overall dynamics of the other. Both chimeric proteins (Figures 4f, g) were significantly less dynamic than their corresponding core proteins (Figures 2e, f; Supplementary Figure S2C), suggesting that the flanking regions of AtFtsZs generally suppress the dynamics of both proteins. Collectively, these results are consistent with the conclusion that the core regions predominate in determining the differences in the relative dynamics between AtFtsZ2 and AtFtsZ1.
Subunit exchange dynamics of red algal FtsZs are determined by their conserved core regions
The dominant role of the core regions in controlling AtFtsZ filament turnover dynamics led us to ask if this also applies to other chloroplast FtsZ pairs. To address this, we tagged full-length Galdieria sulphuraria (Gs) FtsZA (GsFtsZAFL) and GsFtsZB (GsFtsZBFL) and their corresponding core regions (GsFtsZAC and GsFtsZBC) with mCerulean (Figure 5a). These constructs did not include the TP of corresponding GsFtsZs, and each construct was expressed individually in P. pastoris. GsFtsZAFL-mC assembled into closed ring-like structures while GsFtsZBFL-mC formed straight or arc-shaped filaments (Figures 5b, c). In FRAP experiments, the fluorescence recovery curve of GsFtsZAFL-mC exhibited a slower recovery trend compared to that of GsFtsZBFL-mC (Figures 6a–c; Supplementary Figure S5A). The R130 values for GsFtsZAFL-mC and GsFtsZBFL-mC were 32% and 46%, respectively. The difference between these values was statistically significant (Supplementary Figure S6A), indicating that GsFtsZAFL-mC filaments are significantly less dynamic than GsFtsZBFL-mC filaments. While the core proteins of GsFtsZAC-mC and GsFtsZBC-mC both assembled into shallow arcs (Figures 5d, e), R130 values for GsFtsZAC-mC filaments (18%) were significantly lower than for GsFtsZBC-mC filaments (35%) (Figures 6d–f; Supplementary Figure S6A), indicating that the GsFtsZ core proteins behaved similarly to the full-length proteins. Combined with the data from AtFtsZ, these findings suggest that the core regions of FtsZs dominate their unique dynamics in living cells. However, both GsFtsZ core proteins were less dynamic than their corresponding full-length proteins (Supplementary Figures S5B, C), although statistically the difference was only significant for GsFtsZAFL-mC (R130 = 32%) vs. GsFtsZAC-mC (R130 = 18%) (Supplementary Figure S6A). These differences are opposite those observed between the AtFtsZ core and full-length proteins, and suggest that the flanking regions of the GsFtsZ proteins, particularly for GsFtsZA, influence their absolute dynamics.
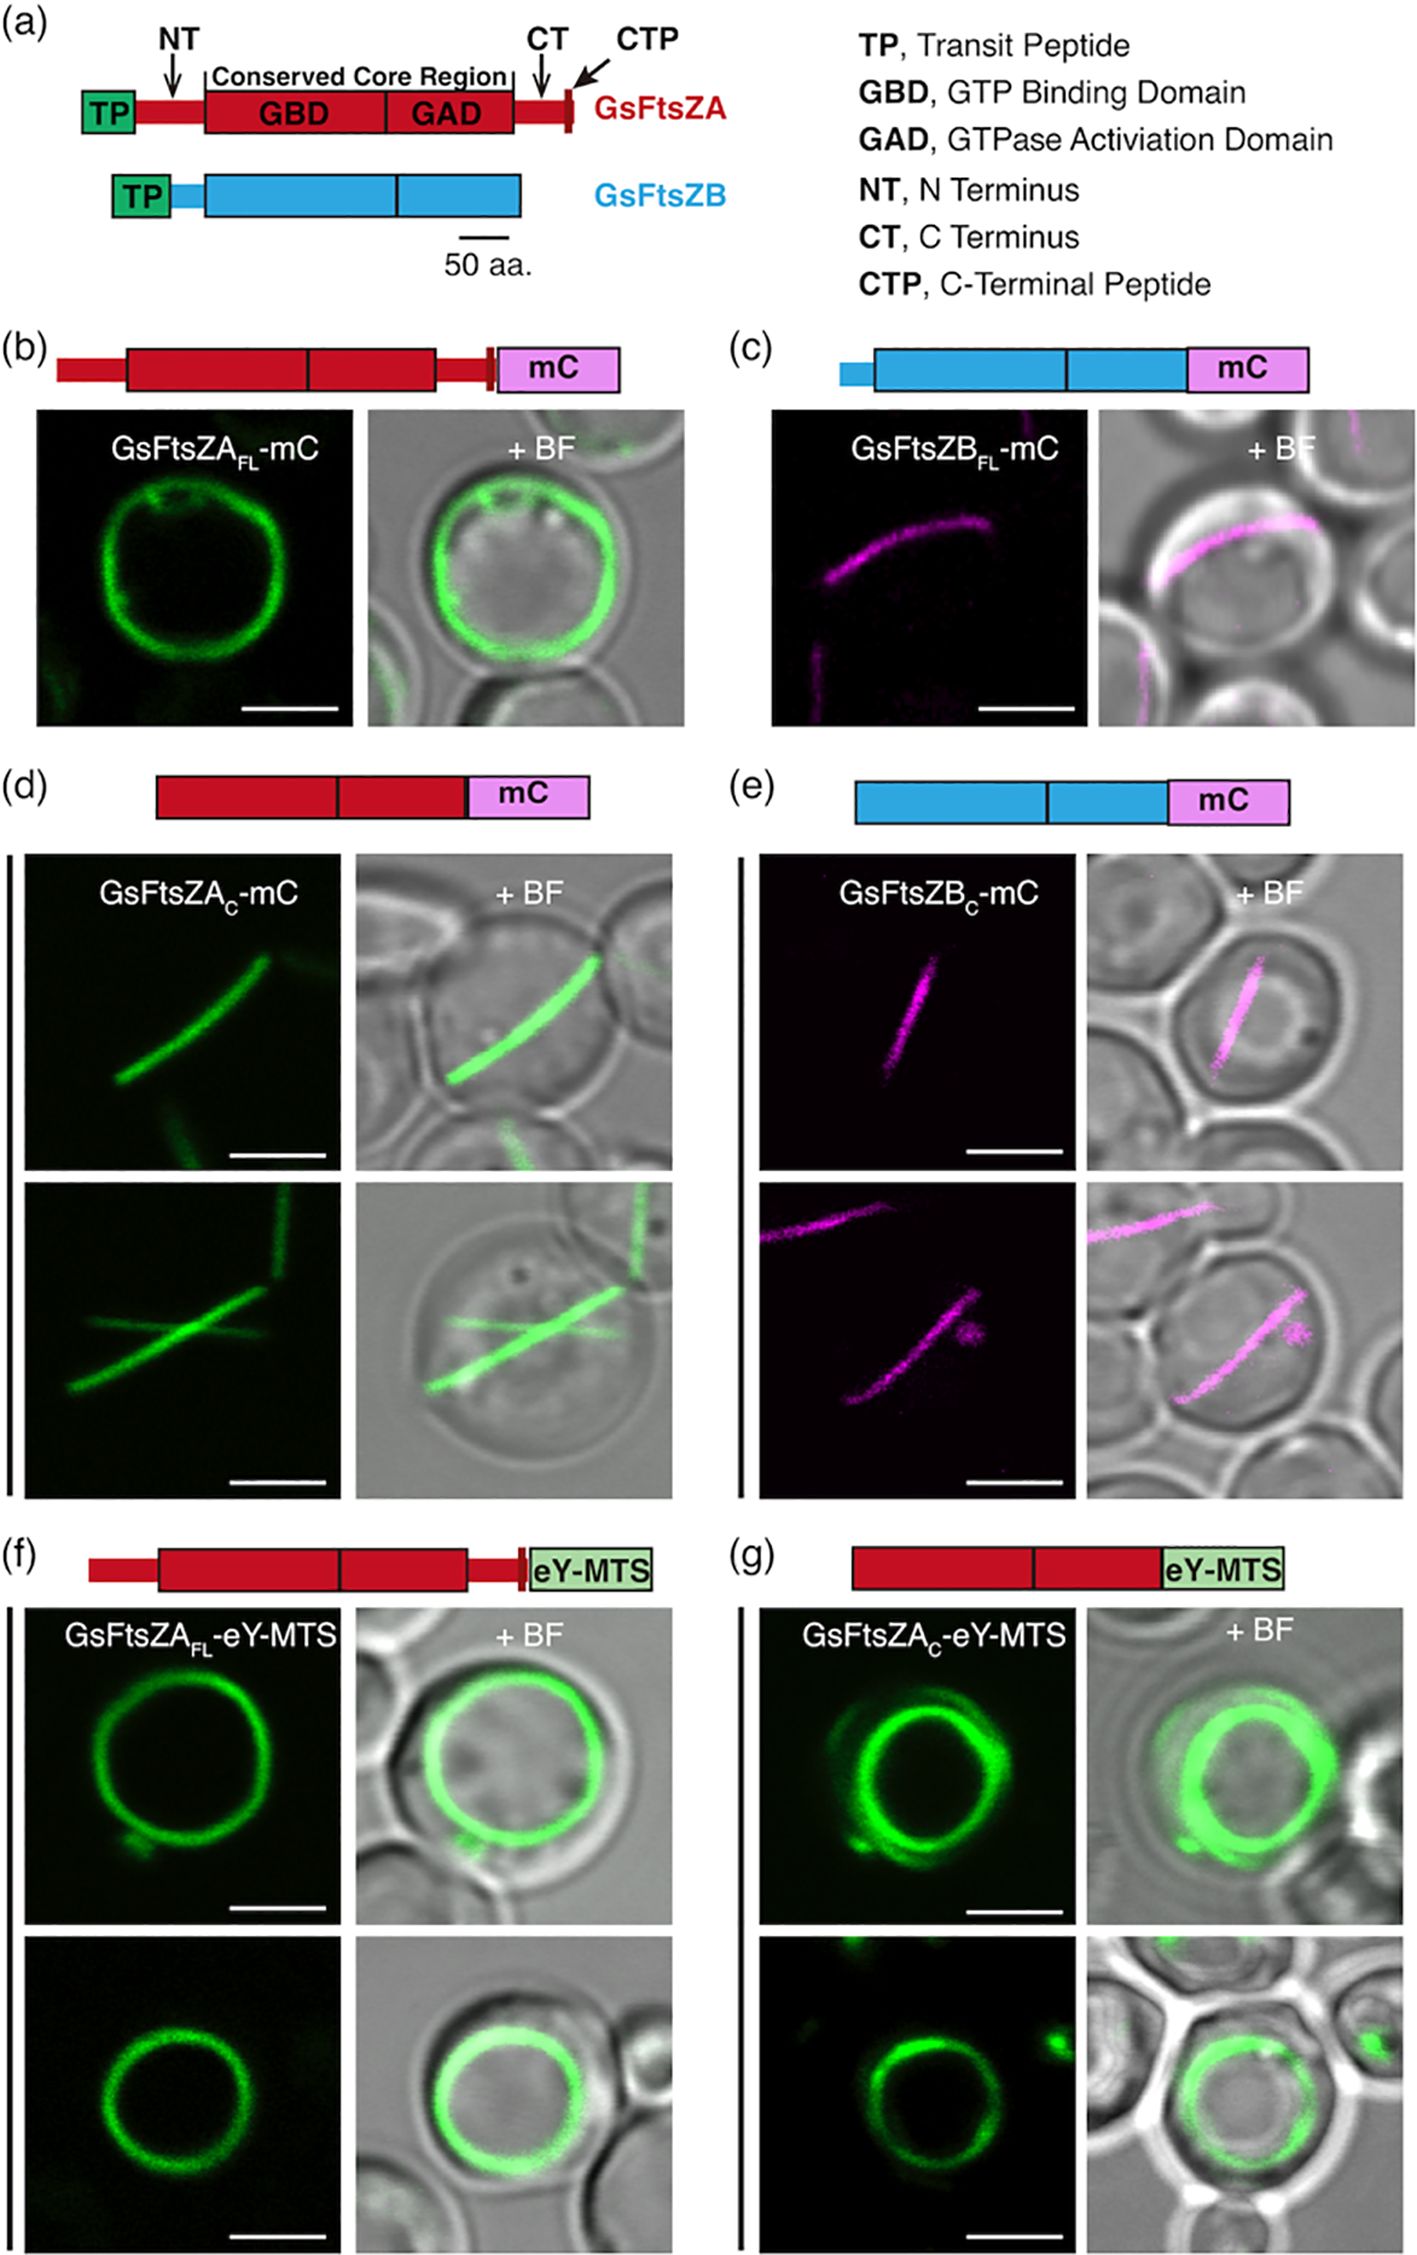
Figure 5. GsFtsZ Filament and Ring Morphologies in P. pastoris. (a) Structural feature of G. sulphuraria FtsZA (GsFtsZA; top) and FtsZB (GsFtsZB; bottom). aa, amino acids. (b, c) Representative images of full-length G. sulphuraria FtsZs, lacking their predicted transit peptides (TPs) (Olson et al., 2010), expressed separately in Pichia. Specifically, the FtsZs expressed are as follows: GsFtsZA-mCerulean (GsFtsZAFL-mC), and GsFtsZB-mCerulean (GsFtsZBFL-mC). (b) GsFtsZAFL-mC formed ring-like structures around the cell boundary, while (c) the GsFtsZBFL-mC assembled into straight filament. (d, e) Representative images of the core regions of GsFtsZA-mCerulean (GsFtsZAC-mC) or GsFtsZB-mCerulean (GsFtsZBC-mC) expressed separately in P. pastoris. Only shallow-curved filamentous structures were observed in cells expressing either (d) GsFtsZAC-mC or (e) GsFtsZBC-mC. (f, g) Representative images of GsFtsZAFL-eYFP or GsFtsZAC-eYFP fused to a membrane-tethering sequence (MTS) derived from Escherichia coli MinD (Szeto et al., 2003) at the C terminus. Fusion of MTS to GsFtsZAC-eY (GsFtsZAC-eY-MTS) led to the formation of ring-like structures around the cell boundary. + BF, merge of fluorescent image with corresponding bright field. Bars are 2 μm.
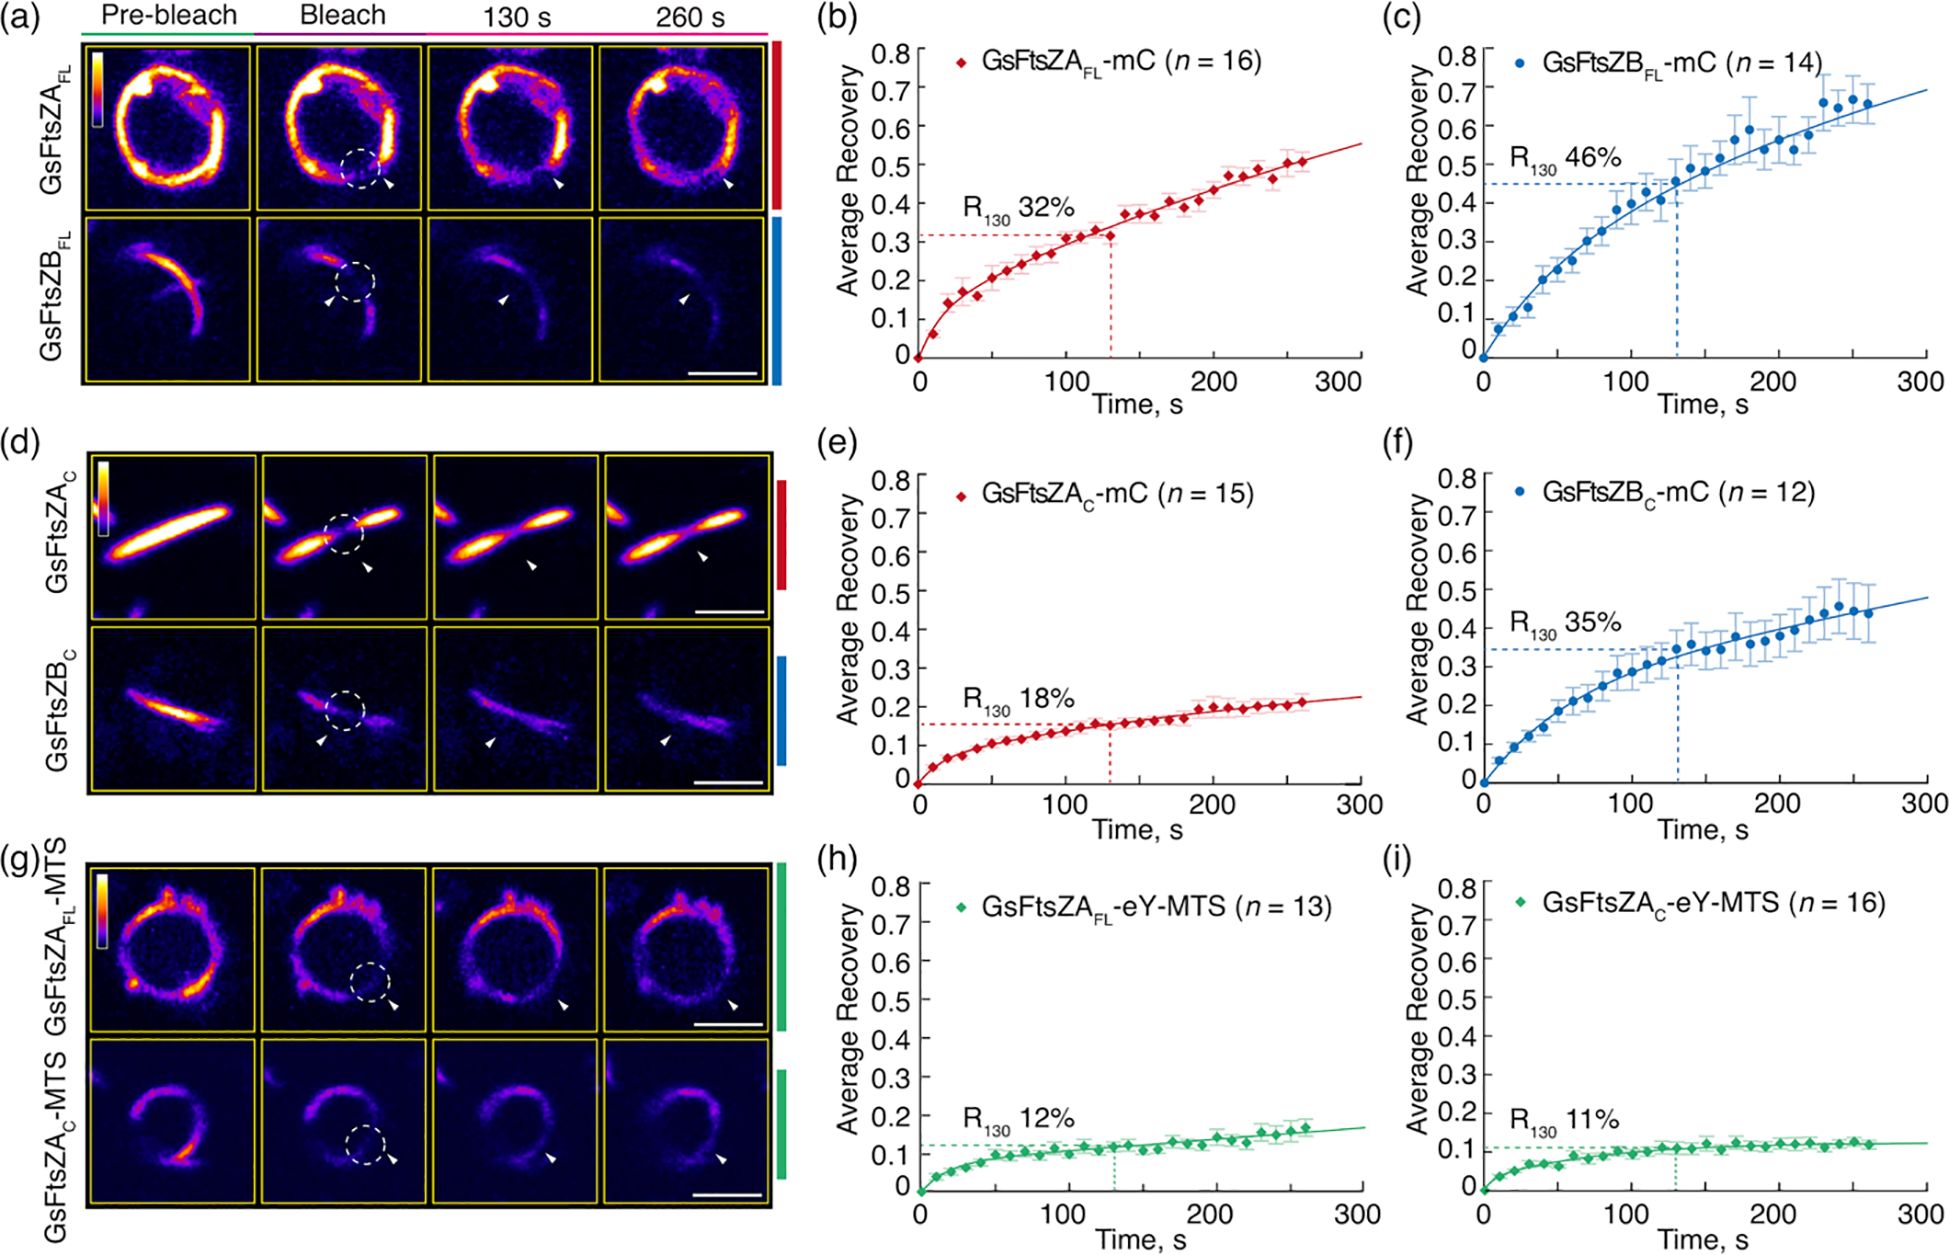
Figure 6. The Core Regions Determine the Distinct Dynamics of Red Algal FtsZA and FtsZB Filaments in Galdieria sulpuraria. FRAP analysis of the GsFtsZ rings and filaments in Pichia. FRAP experiments were conducted with either (a–f) mCerulean (mC) or (g–i) eYFP (eY) signals in Pichia cells expressing GsFtsZ proteins separately, as described in Figure 5. Recovery of mC or eY fluorescence was recorded for 260 s following photobleaching. A two-binding-state equation was used to perform curve fitting using averaged recovery data (Sprague et al., 2004; Yoshida et al., 2016). (a, d, g) Fluorescence images show GsFtsZ rings and filaments prior to photobleaching (Pre-bleach), at the time of photobleaching (Bleach), and at 130 and 260 s after photobleaching. The photobleached regions are indicated by white circles and arrowheads. The fluorescence intensity is indicated by a color scale bar with white the highest and black the lowest. Bars are 2 μm. Curve-fitting graphs derived from FRAP data collected from (b) GsFtsZAFL-mC rings, (c) GsFtsZBFLmC filaments, (e) GsFtsZAC-mC filaments, (f) GsFtsZBC-mC filaments, (H) GsFtsZAFL-eY-MTS rings, and (i) GsFtsZAC-eY-MTS rings. Dashed lines show the average recovery of fluorescence 130 s after photobleaching (R130). Values represent mean ± SE; n indicates the number of FRAP cells.
To investigate how membrane association affects the morphology and dynamics of the GsFtsZA full-length and core proteins, we generated GsFtsZAFL-eY-MTS and GsFtsZAC-eY-MTS. Both GsFtsZAFL-eY-MTS and GsFtsZAC-eY-MTS assembled into well-defined rings (Figures 5f, g), indicating that MTS fusions facilitate ring formation. R130 values for GsFtsZAFL-eY-MTS (12%) and GsFtsZAC-eY-MTS (11%) were both reduced compared to those of the equivalent proteins lacking the MTS (Figures 6b, e, g–i), in particular for GsFtsZAFL-mC (32%) though the fluorescent tags were not identical. Together with our AtFtsZ2 results, these data suggest that membrane tethering promotes the Z-ring assembly and likely constrains filament dynamics as well. However, the dynamics of GstFtsZAFL-eY-MTS (R130 = 12%) and GsFtsZAC-eY-MTS (R130 = 11%) were very similar (Figures 6h, i; Supplementary Figure S6A), further supporting that the core regions determine the dynamics of GsFtsZA, as observed for AtFtsZ2 (Figures 2h, i; Supplementary Figure S2B).
The conserved core region of GsFtsZB enhances the dynamics of the full-length GsFtsZA in coassembled rings
It has been proposed that FtsZB in red algae functions similarly to FtsZ1 in green lineage. In line with this, GsFtsZB has been reported to promote exchange of GsFtsZA subunits from coassembled filaments in S. pombe (TerBush et al., 2018). To test whether the core region of GsFtsZB is sufficient to enhance the dynamics of red algal chloroplast Z ring, we coexpressed the full-length of GsFtsZA with the full-length or core protein of GsFtsZB in P. pastoris and performed FRAP analysis on the reconstituted GsFtsZ rings (Figures 7a–h). Given that GsFtsZAFL forms ring-like structures in the absence of MTS (Figure 6a), we only used GsFtsZAFL-mC in the coexpression experiments. In contrast to singular expression, both GsFtsZBFL-eY and GsFtsZBC-eY coassembled primarily into ring-like structures when coexpressed with GsFtsZAFL-mC (Figures 7a, b), further supporting it is GsFtsZA that dominates the morphology of red algal chloroplast Z ring, as AtFtsZ2 does in green lineage.
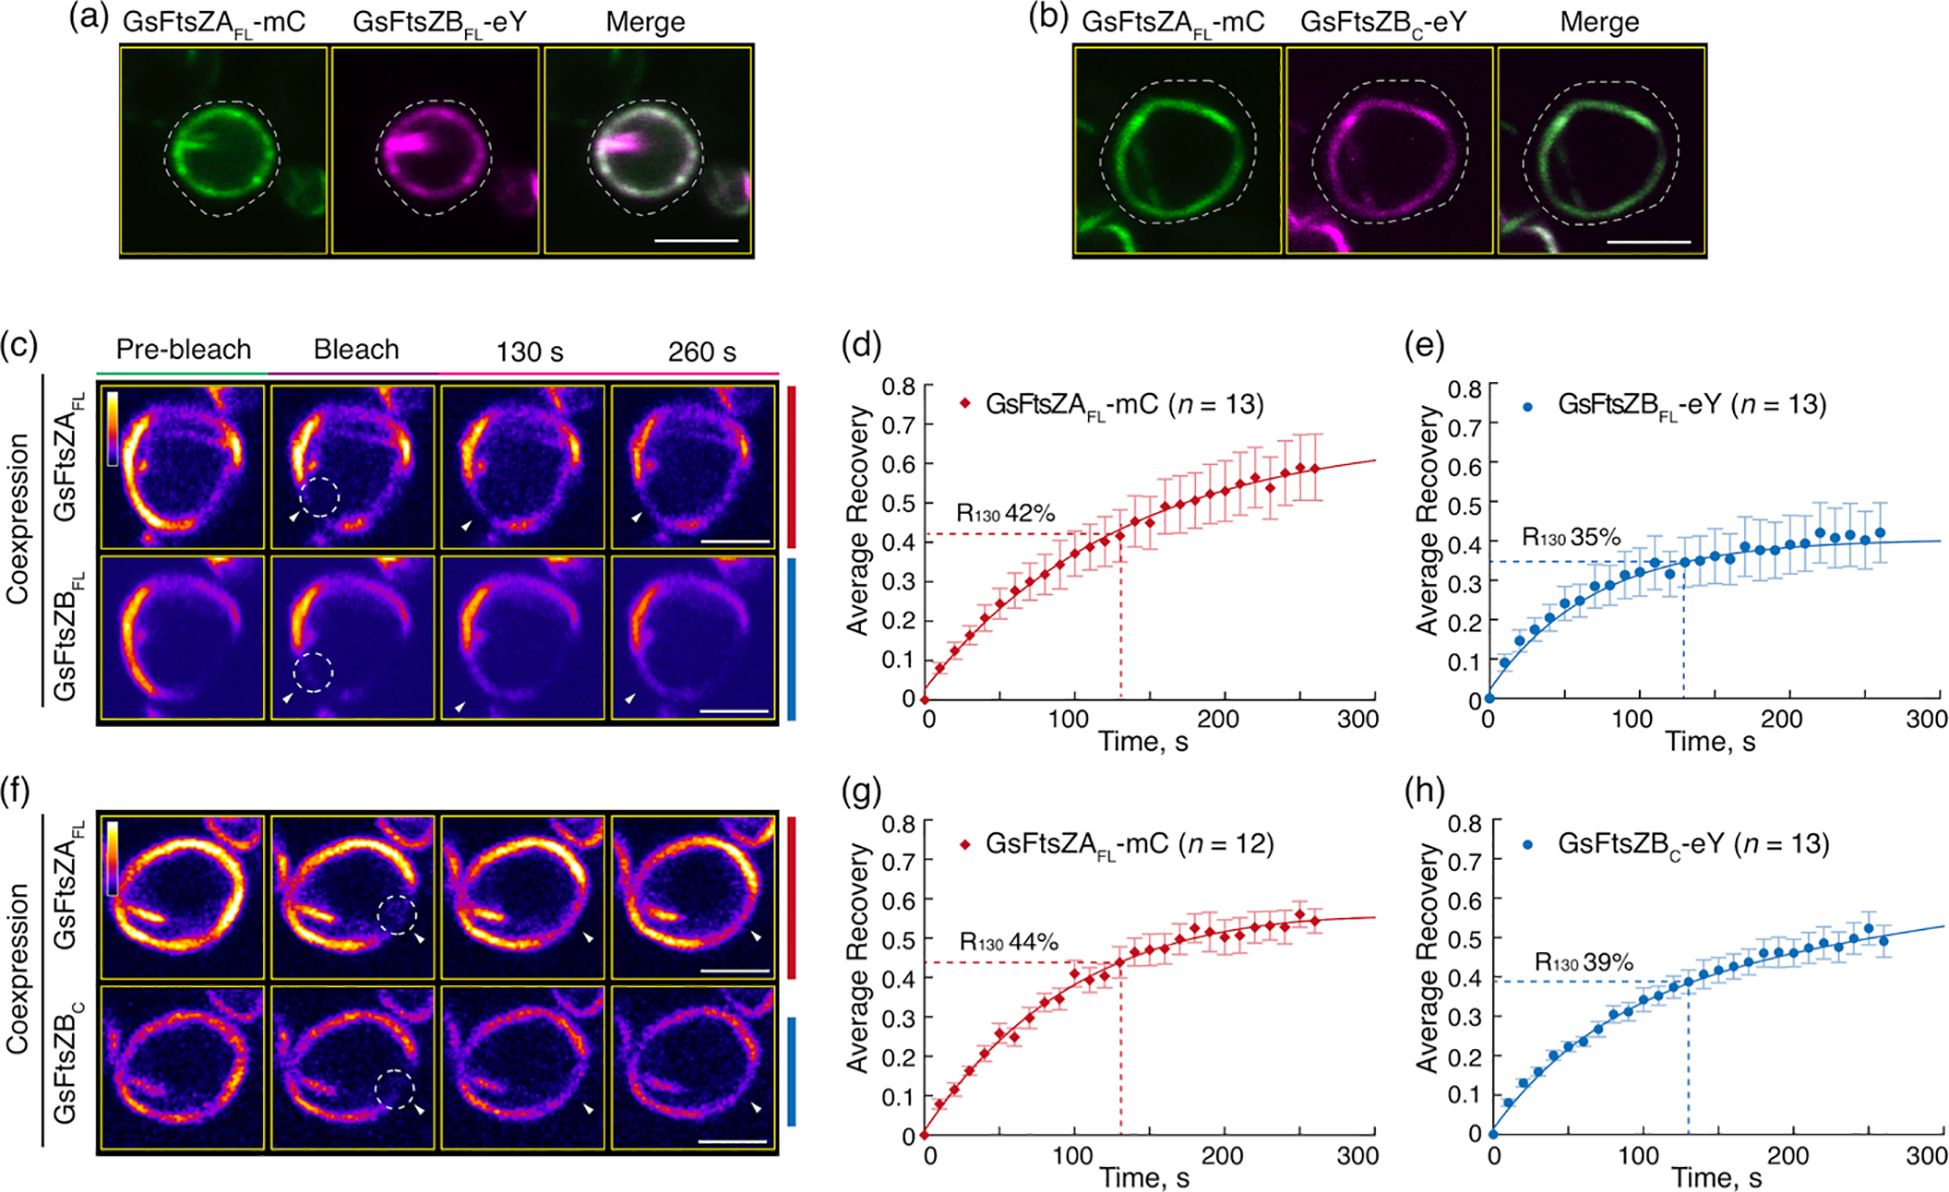
Figure 7. The Core Region of FtsZB Promote the Overall Dynamics of Coassembled Filaments with FtsZA. (a, b) Coexpression of (a) the full-length GsFtsZA-mCerulean (GsFtsZAFL-mC) and GsFtsZB-eYFP (GsFtsZBFL-eY), or (b) GsFtsZAFL-mC and the core region of GsFtsZB-eYFP (GsFtsZBC-eY) in Pichia. White dashed lines indicate the outline of Pichia cells. Bars are 2 μm. (c–h) FRAP analysis of GsFtsZ rings when coexpressed in Pichia. FRAP experiment was conducted with either mCerulean (mC) for GsFtsZA or eYFP (eY) for GsFtsZB. (c, f) Fluorescence images show GsFtsZ rings prior to photobleaching (Pre-bleach), at the time of photobleaching (Bleach), and at 130 and 260 s after photobleaching. The photobleached regions are indicated by white circles and arrowheads. The fluorescence intensity is indicated by a color scale bar with white the highest and black the lowest. Bars are 2 μm. Curve-fitting graphs derived from the FRAP data collected simultaneously from coexpression of (d) GsFtsZAFL-mC and (e) GsFtsZBFL-eY, or from coexpression of (g) GsFtsZAFL-mC and (h) GsFtsZBC-eY rings. Dashed lines show the average recovery of fluorescence 130 s after photobleaching (R130). Values represent mean ± SE; n indicates the number of FRAP cells.
FRAP analyses showed that R130 for GsFtsZAFL-mC was significantly increased when coassembled (42%) with GsFtsZBFL-eY compared to when assembled separately (32%) (Figures 7c, d, 6b; Supplementary Figure S6B), demonstrating that GsFtsZB can enhance the turnover dynamic of GsFtsZA in the reconstituted red algal chloroplast Z ring, as observed for AtFtsZ1 in green lineage. Likewise, R130 for GsFtsZAFL-mC was significantly increased when coassembled (44%) with GsFtsZBC-eY compared to when assembled separately (32%) (Figures 7f, g, 6b; Supplementary Figure S6B), indicating an enhancement of GsFtsZAFL-mC dynamics by GsFtsZBC-eY in the coassembled rings. These findings demonstrate that the core region of GsFtsZB is sufficient to promote the turnover dynamic of GsFtsZA submits from their coassembled rings.
Discussion
In this study, we have taken advantage of FRAP technology to investigate the dynamic turnover of plant and red algal chloroplast FtsZ proteins in a yeast system. While it has been hypothesized that the less conserved flanking regions of FtsZs might be responsible for the functional differences between the duplicated FtsZ pairs in chloroplasts (TerBush et al., 2016), our findings directly demonstrate that the conserved core regions are the primary determinants of the dynamic behaviors exhibited by FtsZ filaments or rings when reconstituted in yeast.
Previous studies have shown that AtFtsZ2 and AtFtsZ1 coassemble and are both required for chloroplast division (Osteryoung et al., 1998; Olson et al., 2010; TerBush and Osteryoung, 2012). AtFtsZ2 likely determines the morphology and stability of chloroplast FtsZ protofilaments and rings, whereas AtFtsZ1 functions to enhance their turnover dynamics (TerBush and Osteryoung, 2012; Yoshida et al., 2016; TerBush et al., 2018). Here we have shown that AtFtsZ2C, similar to AtFtsZ2FL, can form ring-like structures when anchored to the cell membrane via an MTS (Figure 1g). Moreover, AtFtsZ2C exhibited slower dynamics than AtFtsZ1C, as revealed by a direct comparison of the R130 values when they were assembled separately with the identical fluorescent tags (Figures 2e, f; Supplementary Figure S2A). We also demonstrated that AtFtsZ1C, like AtFtsZ1FL (TerBush and Osteryoung, 2012), accelerates the turnover dynamics of AtFtsZ2C in coassembled filaments and rings (Figures 2i, 3g, h; Supplementary Figure S2B). Consequently, our results indicate that the core regions of AtFtsZ2 and AtFtsZ1 are primarily responsible for their distinct functions. This property appears to extend to the red algal FtsZs, as filaments assembled from the core regions of GsFtsZA and GsFtsZB exhibit behaviors analogous to their full-length counterparts (Figures 6b, c, e, f). Recent in vitro study has demonstrated that the assembly dynamics of the two FtsZ proteins from Arabidopsis is also governed by their core regions (Porter et al., 2021). These findings are consistent with our current studies and underscore the critical role of the FtsZ core regions in the dynamic behavior of the chloroplast Z ring.
The conserved core regions of FtsZ proteins consist of GTP binding and GTPase activating domains (Figure 1a). The GTPase activating domain is situated within the C-terminus of the FtsZC protein. It has been proposed that the GTPase active site forms at the longitudinal interface between two FtsZ subunits (Scheffers et al., 2002). GTP hydrolysis at this active site weakens the interface, promoting the disassociation of GDP-bound subunits from the protofilaments, which ultimately leads to the turnover dynamics of the FtsZ protofilaments and rings. A recent biochemical study showed that the GTPase activities of AtFtsZ2C and AtFtsZ1C are distinct, with AtFtsZ2C exhibiting lower GTPase activity than AtFtsZ1C (Porter et al., 2021). Consistent with this, we observed that the dynamics of AtFtsZ2C filaments were significantly slower than those of AtFtsZ1C (Figures 2e, f; Supplementary Figure S2A). Thus, we suggest that the GTPase activating domain within the conserved core regions may play a significant role in determining the turnover dynamics of FtsZ protofilaments. To begin testing this hypothesis, we compared the turnover dynamics of filaments assembled from two chimeric proteins constructed previously to examine AtFtsZ1/AtFtsZ2 heteropolymerization (Yoshida et al., 2016): Z2-Z1 chimera, containing the GTPase activating domain of AtFtsZ1 (Supplementary Figure S7A) and Z1-Z2 chimera, containing the GTPase activating domain of AtFtsZ2 (Supplementary Figure S7B). Our data indicated that Z2-Z1 chimera (R130 = 28%) filaments were more dynamic than Z1-Z2 chimera (R130 = 8%) (Supplementary Figures S7C, D), suggesting that the GTPase activating domain contributes significantly to the overall turnover dynamics of the chimeric AtFtsZs. We note that because these chimeric proteins retain the C-terminal flanking regions associated with their respective GTPase activating domains (Supplementary Figures S7A, B), we cannot rule out the possibility that these regions also influence the dynamics of the chimeric AtFtsZ filaments. However, as shown in Figures 4f, g and Supplementary Figure S2C, the dynamics of Z1NTZ2CZ1CT and Z2NTZ1CZ2CT filaments did not differ significantly, suggesting that the C-terminal flanking region of AtFtsZ1 is unlikely to accelerate the dynamics of the chimeric Z2-Z1 filaments. Despite this, the GTPase activating domain within AtFtsZ1C is likely not the sole key factor determining the dynamics of AtFtsZ1 filaments, since mutation of a key amino acid for GTPase activity (D275A) did not completely abolish the dynamics of AtFtsZ1 filaments (TerBush and Osteryoung, 2012; TerBush et al., 2018). This is unlike the effects of a similar mutation in AtFtsZ2 (D332A) (TerBush and Osteryoung, 2012; TerBush et al., 2018). Nevertheless, the GTPase activating domain within AtFtsZs appears to be crucial in regulating the turnover dynamics of AtFtsZ filaments, although the underlying mechanisms remain to be elucidated.
Although the dynamics of the AtFtsZ filaments is primarily governed by their core regions, the flanking regions also appear to have an influence (TerBush et al., 2016). The dynamics of filaments assembled from either chimeric Z1NTZ2CZ1CT or Z2NTZ1CZ2CT proteins (Figures 4f, g) were significantly reduced compared to their corresponding core proteins (Figures 2e, f; Supplementary Figure S2C), implying that the flanking regions suppress the dynamics of both AtFtsZs. AtFtsZ1FL and AtFtsZ1C exhibited similar dynamics (Figures 2c, f; Supplementary Figure S2A), whereas the Z2NTZ1CZ2CT dynamics were significantly reduced compared to AtFtsZ1C dynamics (Figures 4g, 2f; Supplementary Figure S2C), suggesting that the AtFtsZ2 flanking regions impose a stronger effect on restricting turnover dynamics than those from AtFtsZ1. Consistent with this speculation AtFtsZ2FL dynamics were significantly lower than AtFtsZ2C dynamics (Figures 2b, e; Supplementary Figure S2A). These dynamic differences may be associated with previous findings that the bundling of AtFtsZ2C was reduced compared to AtFtsZ2FL, suggesting a role for the flanking regions in protofilament bundling (Porter et al., 2021). Bundling of the FtsZ protofilaments leads to their stabilization and a consequent reduction in dynamics (Shaik et al., 2018). The difference in bundling between full-length and core AtFtsZ2 proteins may be partly due to the absence of positively charged residues at the extreme C-terminus in AtFtsZ2C, which are known to promote bundling (Buske and Levin, 2013; TerBush et al., 2016). These residues are not present in the C-terminal flanking region of AtFtsZ1. Such difference may contribute to the distinct dynamics of the filaments assembled from the two AtFtsZs, although the core regions remain the dominant determinants of their dynamic properties.
In general, the morphology and dynamic behavior of red algal GsFtsZs were similar to those of their A. thaliana counterparts. However, they exhibited some unique properties. Unlike AtFtsZ2FL (Figure 1b), GsFtsZAFL could assemble into a ring-like structure without the need for membrane attachment via an MTS (Figure 5b). Moreover, GsFtsZAFL was significantly more dynamic than GsFtsZAC filaments (Figures 6b, e; Supplementary Figure S6A), suggesting that the flanking regions of GsFtsZA contribute positively to the turnover dynamics of the filaments. These findings contrast with the data from AtFtsZ2, where the flanking regions were shown to suppress the overall dynamics of the filaments (Figures 2b, e; Supplementary Figure S2A). Interestingly, a prior study indicated that the N-terminal truncated GsFtsZA (GsFtsZAΔNT) displayed relatively slow filament dynamics in S. pombe (TerBush et al., 2018). Thus, we propose that the N-terminal flanking region of GsFtsZA plays a role in accelerating the dynamics of GsFtsZA filaments. Nevertheless, the core regions still determine the distinct dynamics of the GsFtsZs filaments. Combined with the results from AtFtsZs, our data provide evidence supporting the proposal that the emergence of a second FtsZ protein is a conserved mechanism across chloroplasts from both green and red lineage, acting to enhance the dynamics of the structurally determinant FtsZ subunits. Furthermore, our results highlight that the core regions are the principal determinants of the unique dynamic characteristics of FtsZs in both green and red lineage.
Data availability statement
The original contributions presented in the study are included in the article/Supplementary Material. Further inquiries can be directed to the corresponding authors.
Author contributions
LC: Investigation, Writing – review & editing, Formal analysis, Funding acquisition, Writing – original draft. KP: Writing – review & editing, Investigation. WD: Methodology, Writing – review & editing. ET: Writing – review & editing, Methodology. ML: Data curation, Writing – review & editing, Formal analysis. WL: Supervision, Writing – review & editing. KO: Writing – original draft, Funding acquisition, Writing – review & editing, Supervision, Conceptualization. CC: Writing – original draft, Funding acquisition, Writing – review & editing, Conceptualization.
Funding
The author(s) declare that financial support was received for the research and/or publication of this article. This research was sponsored by National Science Foundation of the United States (1719376 to K.W.O.), National Natural Science Foundation of China (32200292 to L.C. and 32170333 to C.C.), the Shanghai Pujiang Program from Science and Technology Commission of Shanghai Municipality (20PJ1405700 to C.C.), and the Shanghai Super Postdoctoral Researchers program from the Shanghai Human Resources and Social Security Bureau (2021177 to L.C.).
Acknowledgments
We thank Dr. Allan D. TerBush for his technical assistance with FRAP experiments and data analysis, and Yamato Yoshida for help with transformation and observation of Pichia pastoris.
Conflict of interest
The authors declare that the research was conducted in the absence of any commercial or financial relationships that could be construed as a potential conflict of interest.
Generative AI statement
The author(s) declare that no Generative AI was used in the creation of this manuscript.
Publisher’s note
All claims expressed in this article are solely those of the authors and do not necessarily represent those of their affiliated organizations, or those of the publisher, the editors and the reviewers. Any product that may be evaluated in this article, or claim that may be made by its manufacturer, is not guaranteed or endorsed by the publisher.
Supplementary material
The Supplementary Material for this article can be found online at: https://www.frontiersin.org/articles/10.3389/fpls.2025.1622675/full#supplementary-material
References
An, J., Wang, L., Hong, C., and Gao, H. (2024). Evolution and functional differentiation of the C-terminal motifs of FtsZs during plant evolution. Mol. Biol. Evol. 41, 1–15. doi: 10.1093/molbev/msae145
Bi, E. F. and Lutkenhaus, J. (1991). FtsZ ring structure associated with division in Escherichia coli. Nature 354, 161–164. doi: 10.1038/354161a0
Bisson-Filho, A. W., Hsu, Y. P., Squyres, G. R., Kuru, E., Wu, F., Jukes, C., et al. (2017). Treadmilling by FtsZ filaments drives peptidoglycan synthesis and bacterial cell division. Science 355, 739–743. doi: 10.1126/science.aak9973
Buske, P. J. and Levin, P. A. (2013). A flexible C-terminal linker is required for proper FtsZ assembly in vitro and cytokinetic ring formation in vivo. Mol. Microbiol. 89, 249–263. doi: 10.1111/mmi.12272
Chen, C., Cao, L., Yang, Y., Porter, K. J., and Osteryoung, K. W. (2019). ARC3 activation by PARC6 promotes FtsZ-ring remodeling at the chloroplast division site. Plant Cell 31, 862–885. doi: 10.1105/tpc.18.00948
Chen, C., MacCready, J. S., Ducat, D. C., and Osteryoung, K. W. (2018). The molecular machinery of chloroplast division. Plant Physiol. 176, 138–151. doi: 10.1104/pp.17.01272
Chen, Y., Porter, K., Osawa, M., Augustus, A. M., Milam, S. L., Joshi, C., et al. (2017). The Chloroplast Tubulin Homologs FtsZA and FtsZB from the Red Alga Galdieria sulphuraria Co-assemble into Dynamic Filaments. J. Biol. Chem. 292, 5207–5215. doi: 10.1074/jbc.M116.767715
Corbin, L. C. and Erickson, H. P. (2020). A unified model for treadmilling and nucleation of single-stranded FtsZ protofilaments. Biophys. J. 119, 792–805. doi: 10.1016/j.bpj.2020.05.041
Du, S. and Lutkenhaus, J. (2019). At the heart of bacterial cytokinesis: the Z ring. Trends Microbiol. 27, 781–791. doi: 10.1016/j.tim.2019.04.011
Erickson, H. P. (1997). FtsZ, a tubulin homologue in prokaryote cell division. Trends Cell Biol. 7, 362–367. doi: 10.1016/S0962-8924(97)01108-2
Erickson, H. P., Anderson, D. E., and Osawa, M. (2010). FtsZ in bacterial cytokinesis: cytoskeleton and force generator all in one. Microbiol. Mol. Biol. Rev. 74, 504–528. doi: 10.1128/MMBR.00021-10
Gibson, D. G., Young, L., Chuang, R. Y., Venter, J. C., Hutchison, C. A., 3rd, and Smith, H. O. (2009). Enzymatic assembly of DNA molecules up to several hundred kilobases. Nat. Methods 6, 343–345. doi: 10.1038/nmeth.1318
Gould, S. B., Waller, R. F., and McFadden, G. I. (2008). Plastid evolution. Annu. Rev. Plant Biol. 59, 491–517. doi: 10.1146/annurev.arplant.59.032607.092915
Ingerman, E. and Nunnari, J. (2005). A continuous, regenerative coupled GTPase assay for dynamin-related proteins. Methods Enzymol. 404, 611–619. doi: 10.1016/S0076-6879(05)04053-X
Liu, X., An, J., Wang, L., Sun, Q., An, C., Wu, B., et al. (2022). A novel amphiphilic motif at the C-terminus of FtsZ1 facilitates chloroplast division. Plant Cell 34, 419–432. doi: 10.1093/plcell/koab272
Maple, J., Aldridge, C., and Moller, S. G. (2005). Plastid division is mediated by combinatorial assembly of plastid division proteins. Plant J. 43, 811–823. doi: 10.1111/j.1365-313X.2005.02493.x
Margolin, W. (2005). FtsZ and the division of prokaryotic cells and organelles. Nat. Rev. Mol. Cell Biol. 6, 862–871. doi: 10.1038/nrm1745
McAndrew, R. S., Froehlich, J. E., Vitha, S., Stokes, K. D., and Osteryoung, K. W. (2001). Colocalization of plastid division proteins in the chloroplast stromal compartment establishes a new functional relationship between FtsZ1 and FtsZ2 in higher plants. Plant Physiol. 127, 1656–1666. doi: 10.1104/pp.010542
McQuillen, R. and Xiao, J. (2020). Insights into the structure, function, and dynamics of the bacterial cytokinetic FtsZ-ring. Annu. Rev. Biophys. 49, 309–341. doi: 10.1146/annurev-biophys-121219-081703
Mingorance, J., Rueda, S., Gomez-Puertas, P., Valencia, A., and Vicente, M. (2001). Escherichia coli FtsZ polymers contain mostly GTP and have a high nucleotide turnover. Mol. Microbiol. 41, 83–91. doi: 10.1046/j.1365-2958.2001.02498.x
Miyagishima, S. Y., Nakanishi, H., and Kabeya, Y. (2011). Structure, regulation, and evolution of the plastid division machinery. Int. Rev. Cell Mol. Biol. 291, 115–153. doi: 10.1016/B978-0-12-386035-4.00004-5
Miyagishima, S. Y., Nozaki, H., Nishida, K., Nishida, K., Matsuzaki, M., and Kuroiwa, T. (2004). Two types of FtsZ proteins in mitochondria and red-lineage chloroplasts: the duplication of FtsZ is implicated in endosymbiosis. J. Mol. Evol. 58, 291–303. doi: 10.1007/s00239-003-2551-1
Oliva, M. A., Cordell, S. C., and Lowe, J. (2004). Structural insights into FtsZ protofilament formation. Nat. Struct. Mol. Biol. 11, 1243–1250. doi: 10.1038/nsmb855
Olson, B. J., Wang, Q., and Osteryoung, K. W. (2010). GTP-dependent heteropolymer formation and bundling of chloroplast FtsZ1 and FtsZ2. J. Biol. Chem. 285, 20634–20643. doi: 10.1074/jbc.M110.122614
Osawa, M., Anderson, D. E., and Erickson, H. P. (2008). Reconstitution of contractile FtsZ rings in liposomes. Science 320, 792–794. doi: 10.1126/science.1154520
Osawa, M. and Erickson, H. P. (2011). Inside-out Z rings–constriction with and without GTP hydrolysis. Mol. Microbiol. 81, 571–579. doi: 10.1111/j.1365-2958.2011.07716.x
Osteryoung, K. W. and Pyke, K. A. (2014). Division and dynamic morphology of plastids. Annu. Rev. Plant Biol. 65, 443–472. doi: 10.1146/annurev-arplant-050213-035748
Osteryoung, K. W., Stokes, K. D., Rutherford, S. M., Percival, A. L., and Lee, W. Y. (1998). Chloroplast division in higher plants requires members of two functionally divergent gene families with homology to bacterial ftsZ. Plant Cell 10, 1991–2004. doi: 10.1105/tpc.10.12.1991
Osteryoung, K. W. and Vierling, E. (1995). Conserved cell and organelle division. Nature 376, 473–474. doi: 10.1038/376473b0
Porter, K. J., Cao, L., Chen, Y., TerBush, A. D., Chen, C., Erickson, H. P., et al. (2021). The Arabidopsis thaliana chloroplast division protein FtsZ1 counterbalances FtsZ2 filament stability in vitro. J. Biol. Chem. 296, 100627. doi: 10.1016/j.jbc.2021.100627
Porter, K. J., Cao, L., and Osteryoung, K. W. (2023). Dynamics of the Synechococcus elongatus cytoskeletal GTPase FtsZ yields mechanistic and evolutionary insight into cyanobacterial and chloroplast FtsZs. J. Biol. Chem. 299, 102917. doi: 10.1016/j.jbc.2023.102917
Redick, S. D., Stricker, J., Briscoe, G., and Erickson, H. P. (2005). Mutants of FtsZ targeting the protofilament interface: effects on cell division and GTPase activity. J. Bacteriol 187, 2727–2736. doi: 10.1128/JB.187.8.2727-2736.2005
Scheffers, D. J., de Wit, J. G., den Blaauwen, T., and Driessen, A. J. (2002). GTP hydrolysis of cell division protein FtsZ: evidence that the active site is formed by the association of monomers. Biochemistry 41, 521–529. doi: 10.1021/bi011370i
Schmitz, A. J., Glynn, J. M., Olson, B. J., Stokes, K. D., and Osteryoung, K. W. (2009). Arabidopsis FtsZ2–1 and FtsZ2–2 are functionally redundant, but FtsZ-based plastid division is not essential for chloroplast partitioning or plant growth and development. Mol. Plant 2, 1211–1222. doi: 10.1093/mp/ssp077
Shaik, R. S., Sung, M. W., Vitha, S., and Holzenburg, A. (2018). Chloroplast division protein ARC3 acts on FtsZ2 by preventing filament bundling and enhancing GTPase activity. Biochem. J. 475, 99–115. doi: 10.1042/BCJ20170697
Sibbald, S. J. and Archibald, J. M. (2020). Genomic insights into plastid evolution. Genome Biol. Evol. 12, 978–990. doi: 10.1093/gbe/evaa096
Sprague, B. L., Pego, R. L., Stavreva, D. A., and McNally, J. G. (2004). Analysis of binding reactions by fluorescence recovery after photobleaching. Biophys. J. 86, 3473–3495. doi: 10.1529/biophysj.103.026765
Stokes, K. D. and Osteryoung, K. W. (2003). Early divergence of the FtsZ1 and FtsZ2 plastid division gene families in photosynthetic eukaryotes. Gene 320, 97–108. doi: 10.1016/S0378-1119(03)00814-X
Strassert, J. F. H., Irisarri, I., Williams, T. A., and Burki, F. (2021). A molecular timescale for eukaryote evolution with implications for the origin of red algal-derived plastids. Nat. Commun. 12, 1879. doi: 10.1038/s41467-021-22044-z
Sung, M. W., Shaik, R., TerBush, A. D., Osteryoung, K. W., Vitha, S., and Holzenburg, A. (2018). The chloroplast division protein ARC6 acts to inhibit disassembly of GDP-bound FtsZ2. J. Biol. Chem. 293, 10692–10706. doi: 10.1074/jbc.RA117.000999
Szeto, T. H., Rowland, S. L., Habrukowich, C. L., and King, G. F. (2003). The MinD Membrane Targeting Sequence Is a Transplantable Lipid-binding Helix. J. Biolog. Chem. 278, 40050–40056. doi: 10.1074/jbc.M306876200
TerBush, A. D., MacCready, J. S., Chen, C., Ducat, D. C., and Osteryoung, K. W. (2018). Conserved dynamics of chloroplast cytoskeletal FtsZ proteins across photosynthetic lineages. Plant Physiol. 176, 295–306. doi: 10.1104/pp.17.00558
TerBush, A. D. and Osteryoung, K. W. (2012). Distinct functions of chloroplast FtsZ1 and FtsZ2 in Z-ring structure and remodeling. J. Cell Biol. 199, 623–637. doi: 10.1083/jcb.201205114
TerBush, A. D., Porzondek, C. A., and Osteryoung, K. W. (2016). Functional analysis of the chloroplast division complex using Schizosaccharomyces pombe as a heterologous expression system. Microsc Microanal 22, 275–289. doi: 10.1017/S1431927616000143
TerBush, A. D., Yoshida, Y., and Osteryoung, K. W. (2013). FtsZ in chloroplast division: structure, function and evolution. Curr. Opin. Cell Biol. 25, 461–470. doi: 10.1016/j.ceb.2013.04.006
Vitha, S., Froehlich, J. E., Koksharova, O., Pyke, K. A., van Erp, H., and Osteryoung, K. W. (2003). ARC6 is a J-domain plastid division protein and an evolutionary descendant of the cyanobacterial cell division protein Ftn2. Plant Cell 15, 1918–1933. doi: 10.1105/tpc.013292
Vitha, S., McAndrew, R. S., and Osteryoung, K. W. (2001). FtsZ ring formation at the chloroplast division site in plants. J. Cell Biol. 153, 111–120. doi: 10.1083/jcb.153.1.111
Yang, X., Lyu, Z., Miguel, A., McQuillen, R., Huang, K. C., and Xiao, J. (2017). GTPase activity-coupled treadmilling of the bacterial tubulin FtsZ organizes septal cell wall synthesis. Science 355, 744–747. doi: 10.1126/science.aak9995
Yoder, D. W., Kadirjan-Kalbach, D., Olson, B. J., Miyagishima, S. Y., Deblasio, S. L., Hangarter, R. P., et al. (2007). Effects of mutations in Arabidopsis FtsZ1 on plastid division, FtsZ ring formation and positioning, and FtsZ filament morphology in vivo. Plant Cell Physiol. 48, 775–791. doi: 10.1093/pcp/pcm049
Yoshida, Y., Mogi, Y., TerBush, A. D., and Osteryoung, K. W. (2016). Chloroplast FtsZ assembles into a contractible ring via tubulin-like heteropolymerization. Nat. Plants 2, 16095. doi: 10.1038/nplants.2016.95
Keywords: chloroplast, FtsZ-ring, dynamics, division, evolution
Citation: Cao L, Porter KJ, Du W, Tallerday EJ, Liu M, Liang W, Osteryoung KW and Chen C (2025) Chloroplast Z-ring dynamics is governed by conserved core regions of evolutionarily divergent FtsZs. Front. Plant Sci. 16:1622675. doi: 10.3389/fpls.2025.1622675
Received: 04 May 2025; Accepted: 30 June 2025;
Published: 30 July 2025.
Edited by:
Shanjin Huang, Tsinghua University, ChinaReviewed by:
Jiejie Li, Beijing Normal University, ChinaRonghui Pan, Zhejiang University, China
Min Zhang, Capital Normal University, China
Copyright © 2025 Cao, Porter, Du, Tallerday, Liu, Liang, Osteryoung and Chen. This is an open-access article distributed under the terms of the Creative Commons Attribution License (CC BY). The use, distribution or reproduction in other forums is permitted, provided the original author(s) and the copyright owner(s) are credited and that the original publication in this journal is cited, in accordance with accepted academic practice. No use, distribution or reproduction is permitted which does not comply with these terms.
*Correspondence: Cheng Chen, Y2djaGVuQHNqdHUuZWR1LmNu
†Present address: Emily J. Tallerday, Department of Biology, University of North Carolina, Chapel Hill, NC, United States