 Wenhui Ma
 Jian Zhang2,3,4
 Yan Li
 Hongxiang Zhang
- 1College of Ecology and Environment, Xinjiang University, Urumqi, China
- 2State Key Laboratory of Desert and Oasis Ecology, Key Laboratory of Ecological Safety and Sustainable Development in Arid Lands, Xinjiang Institute of Ecology and Geography, Chinese Academy of Sciences, Urumqi, China
- 3Xinjiang Key Laboratory of Conservation and Utilization of Gene Resources, Urumqi, China
- 4Specimen Museum of Xinjiang Institute of Ecology and Geography, Chinese Academy of Sciences, Urumqi, China
- 5College of Life Sciences, Xinjiang Agricultural University, Urumqi, China
Introduction: Understanding the genetic basis of local adaptation in non-model species is one of the fundamental goals in ecological and evolutionary biology. Researches on the genetic mechanisms of local adaptation in desert plants is crucial to comprehend how species adapt to heterogeneous environments in arid regions under the background of climate warming.
Methods: In this study, the typical superxerophytic constructive species of Nitraria sphaerocarpa, which is fragmentarily distributed in arid northwestern China, was sampled with 20 populations. A total of 10,828 high-quality SNPs were obtained by ddRAD-seq from 200 individuals of N. sphaerocarpa populations across the northwestern China, based on which the population genetic and local adaptation of N. sphaerocarpa was investigated.
Results: The results showed that the population genetic diversity of N. sphaerocarpa was low. Twenty populations could be clustered into four lineages, which began to diverge in the Pleistocene. Mantel test showed that population differentiation was caused by geographical and environmental factors. Through gradient forest (GF), redundancy analysis (RDA) and niche comparison analyses, it was found that both temperature and precipitation factors affected the genetic differentiation of N. sphaerocarpa populations. Twenty-two loci associated with local adaptation were identified by environmental association analysis (EAA) using LFMM and RDA. Three successfully annotated environmental adaptive loci (EAL) were related to physiological processes in response to abiotic stresses such as drought, heat and cold.
Discussion: In conclusion, the spatial genetic structure of N. sphaerocarpa populations showed a fragmented pattern in the latitude gradient. The main pressure of environmental adaptation was the changes of temperature and precipitation. Physiological adaptation appears to be an important mechanism in response to environmental stress.
1 Introduction
The fragmented distribution of desert plants is a key feature of the biogeographic patterns in arid northwestern China. This fragmented pattern was reported in Nitraria sphaerocarpa Maxim. and N. roborowskii Kom (Su et al., 2016), Malus sieversii (Ledeb.) M. Roem. (Zhang et al., 2021) and Convolvulus gortschakovii Schrenk (Jia and Zhang, 2021). Available hypotheses suggest that the species fragmented distribution are mainly caused by the changes of historical environment (Guu et al., 2010; Su et al., 2011; Li et al., 2012; Luqman et al., 2023) and environmental heterogeneity (Sang et al., 2022; Fu et al., 2023; Yan et al., 2023). Arid lands had experienced long-term of intensified aridification due to the retreat of the proto-Paratethys and global cooling (Bougeois et al., 2018), during which extensive deserts and mountains promote fragmentation of xeromorphic plants in arid northwestern China (Zhang et al., 2020). Meanwhile, the glacial-interglacial cycles occurred in the Pleistocene also strongly influences the geographical distribution of species, leading to local extinction, species migration and allopatric speciation (Hewitt, 2004; Willis and Niklas, 2004). For example, the geographical distribution and genetic structure of desert plants have changed significantly under the influence of Pleistocene climate changes (Ma et al., 2012; Su et al., 2012; Su and Zhang, 2013). In addition, orogeny also has greatly influenced on habitat fragmentation of species, such as Tianshan Mountains, Altai Mountains and Pamir Mountains in response to uplift of Qinghai-Tibet Plateau (Yang et al., 2011b). The uplift of mountains formed geological isolation with high mountains and deep valleys, which hinders the gene flow among species, leads to speciation, and further aggravates the fragmentation of distribution (Liu et al., 2006).
Historical climatic changes and geological events have shaped the early distribution patterns of species, laying the evolutionary foundation for the distribution of drought-adapted taxa. Against this backdrop, the present-day distribution and genetic structure of species are increasingly driven by contemporary climate change and local environmental factors. Current climate change is one of the most important driving factors of species distribution (Araújo and Rahbek, 2006; Hu et al., 2021). Under the heterogeneity of climate environment, plant populations are adapted to the local environment in order to survive (Kawecki and Ebert, 2004; Savolainen et al., 2013; Rellstab et al., 2015). Plant species adapted to local environments face selection pressures, and different selection pressures may lead to genetic variation and differentiation of species throughout the genome (Li et al., 2018). Local adaptation is common across plant populations (Leimu and Fischer, 2008), and is particularly evident in drylands or other environments with strong selective pressures (Baughman et al., 2019). For example, the distribution of fragmentation leaded to the genetic variation of M. sieversii (Zhang and Zheng, 2020), and the main environmental factor that determines the genetic variation was temperature (Zhang et al., 2022). Previous understanding of local adaptation or genetic structure differentiation mainly comes from a model plant Arabidopsis thaliana (Fournier-Level et al., 2011), but there is a lack of evidence on the genetic basis of local adaptation for non-model species. In the context of biodiversity research, the integration of non-model organism studies with the established genetic tools and methodologies of model organisms offers significant potential for large-scale data generation. Through advanced population genomics and landscape genomics analysis, the discovery of new population adaptive evolutionary molecular genetic mechanisms in non-model species is expected to be achieved in a broader and deeper dimension.
In recent years, with the development of high-throughput technology, the investigation of the genetic basis of local adaptation in non-model species has become the focus (Di Pierro et al., 2017). High-throughput sequencing technologies produce substantial high-density single nucleotide polymorphism (SNP) information, which provides opportunities for the development of population genetics research. Among them, Restriction site-associated DNA sequencing (RAD-seq) has become the most widely used genomic method for high-throughput SNP discovery in ecological and evolutionary studies of non-model organisms (Andrews et al., 2016). It has proven to be an effective and low-cost sequencing technology for obtaining genome-wide information, which is widely used because it is not constrained by “reference genome” (Miller et al., 2007; Wang et al., 2014; Zhou et al., 2018). RAD-seq can deeply explore the genetic lineage structure that the traditional molecular markers and a small number of DNA fragments cannot clarify (Emerson et al., 2010; Catchen et al., 2011; Lozier, 2014; Jeffries et al., 2016; Bai et al., 2018). More importantly, by comparing with annotated reference genomes, the genetic basis of species response and adaptation to environmental changes can be further revealed (Jia et al., 2020; Zhang et al., 2022).
The development of landscape genomics provides critical insights into the local adaptation of species which help us deepen our understandings of the response of natural populations to climate change (Savolainen et al., 2013). It integrates geographical and environmental information and uses a large number of genetic loci to quantify the degree of environmental heterogeneity of genetic variation in natural populations (Joost et al., 2007; Li et al., 2017; McKinney et al., 2017; Cushman et al., 2018). Identifying genetic variations associated with local adaptation is critical to elucidate the molecular mechanisms of adaptive evolution (Ahrens et al., 2019; Li et al., 2020). Through environmental association analysis (EAA), it can identify environmental and genetic factor driving local adaptation (Rellstab et al., 2015; Hoban et al., 2016). EAA uses high-throughput sequencing and high-resolution environmental data to correlate abiotic data with genomic data to explore the genetic basis of local adaptation of non-model species (Manel and Holderegger, 2013; Ellegren, 2014). Therefore, under multiple spatial scales and multiple geographical backgrounds of a single species, understanding how the environment shapes genetic variation can reveal the evolutionary molecular mechanism of local adaptation in natural populations (Sork et al., 2013; Gugger et al., 2021).
Drylands are defined as regions where precipitation is counter-balanced by land surface evapotranspiration. It is an important part of terrestrial ecosystem and covers about 40% of the terrestrial surface (Wang et al., 2022b). Drylands are one of the most vulnerable ecological areas characterized by low precipitation and high evapotranspiration (Reynolds et al., 2007), which leads to sparse vegetation, but hosts a variety of drought-adapted species (Maestre et al., 2021). Under the climate warming, the global water cycle is gradually accelerating (Wang et al., 2022a), which raises the frequency and severity of drought. The arid areas in northwestern China includes the Xinjiang, Hexi Corridor, and western Helan Mountain (Alxa Desert) (Dang et al., 2002) which is dominated by mountains and deserts, with dry climate and scarce precipitation. The plants inhabiting in this area have special structures and functions, such as Haloxylon and Calligonum, which provide important ecological benefits in windbreak and sand fixation, hydrological regulation, soil conservation and biodiversity protection (Cheng et al., 2020). Therefore, it is of great significance to study the adaptation mechanism of plants in this ecosystem. Especially in the context of global warming, the adaptive strategies of desert plants can provide valuable guidance for future wild resource protection and stress resistance breeding.
In the arid regions of northwestern China, N. sphaerocarpa exhibits a fragmented distribution pattern and strong adaptability, making it an ideal model for studying genetic differentiation and local adaptation of plants in arid environments. More specifically, N. sphaerocarpa is a xerophytic shrub, which is common in gravelly desert, piedmont, and gravelly sand substrates (Figure 1A). It is one of the important constructive species in arid northwestern China, mainly distributed in Xinjiang, Gansu, and Inner Mongolia, and plays an important role in maintaining the stability of the ecological environment (Su and Zhang, 2013). For example, N. shaerocarpa, with its near-ground clumped growth form, helps reduce soil erosion. Its well-developed root system stabilizes sand and traps sediments, while long-term litter accumulation creates a “fertile island effect,” enhancing soil organic matter, supporting plant diversity, and maintaining ecological balance. At present, N. sphaerocarpa owns fragmented distributions extending from the west of the Tarim Basin, through the Hami Basin and the Hexi Corridor, to the Alxa Desert in the east, (Figure 2A), making it an ideal material for studying the adaptation mechanism of plants in extremely habitats. It has white flowers and leathery leaves (Figures 1B, C), and chiefly reproduces sexually by means of insect pollination (Wang et al., 2012). Compared with other Nitraria species occurred in China, N. sphaerocarpa has the unique morphological characteristic that the exocarp becomes dry membrane and expands to form micro-transparent ball when the fruit matures (Figure 1D). Nitraria sphaerocarpa has excellent characteristics such as salt tolerance, drought resistance, sand fixation and soil improvement (Li et al., 2004b). Thus, this shrub plays a vital role in windbreak and sand fixation, soil and water conservation, as well as in desert management.
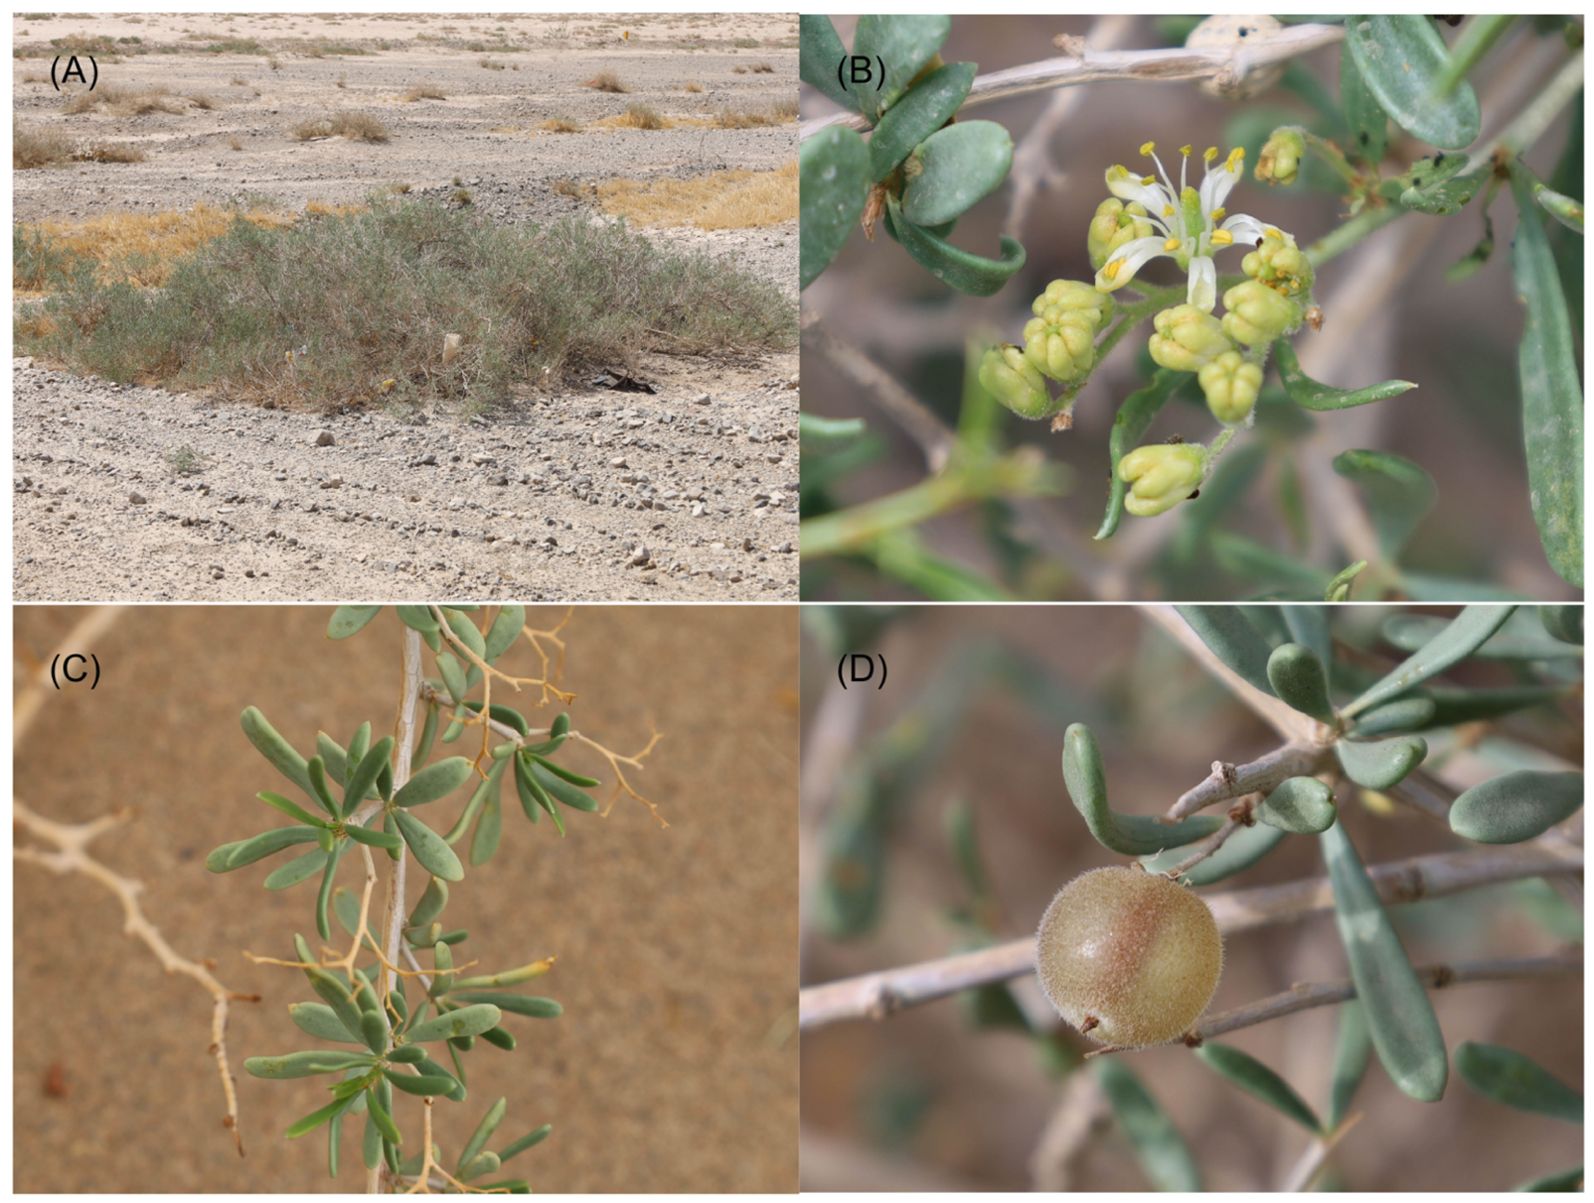
Figure 1. Morphology of Nitraria sphaerocarpa. (A) Habitat; (B) Flowers; (C) Leaves; and (D) Fruit.
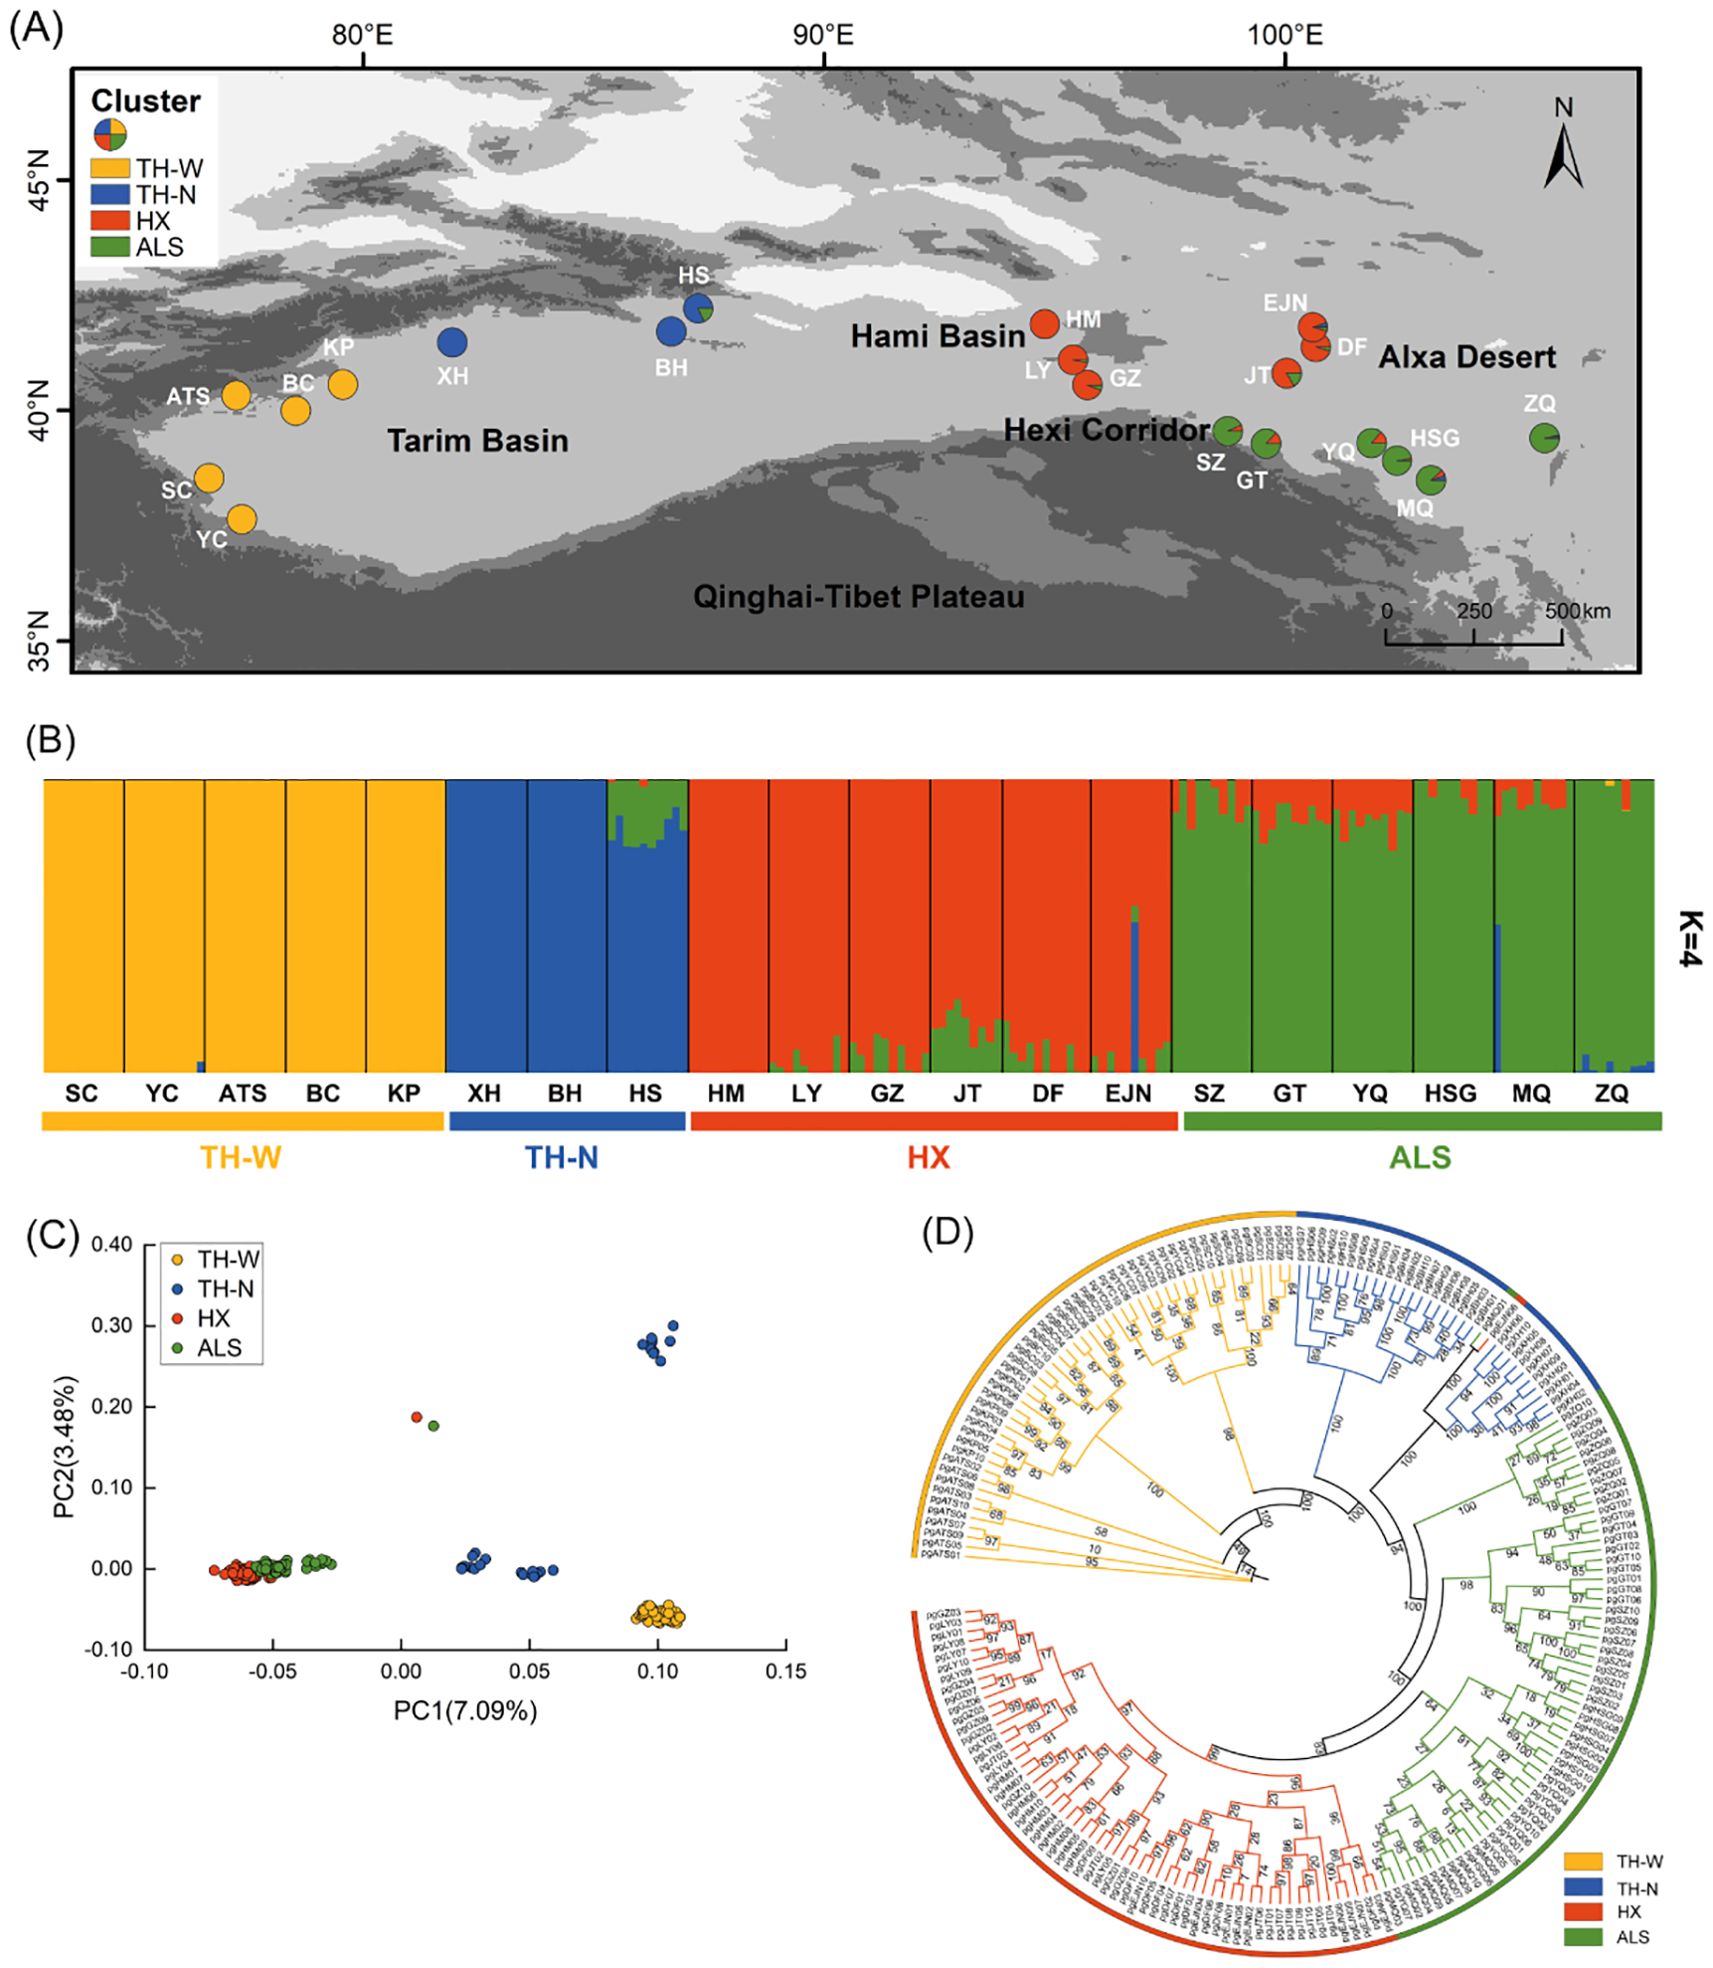
Figure 2. Population genetic structure of N. sphaerocarpa. (A) Geographic distribution of 20 populations (pie chart) where colors represent ancestral components inferred by ADMIXTURE (K = 4). (B) Population genetic structure estimated by ADMIXTURE analysis with K = 4. Each vertical bar represents an individual, the x-axis represents each population and four clusters and the y-axis represents the proportion of ancestors contained in each individual. (C) PCA. Each point represents an individual in which colors distinguish groups. (D) Phylogenetic tree of N. sphaerocarpa based on IQ-tree employing the maximum likelihood (ML) method. Degree of confidence was evaluated by ultrafast bootstrap approximation with 1,000 replicates. A color represents a cluster and the number on the node represents the degree of confidence.
Taken together, previous observations and the heterogeneous habitats (e.g., soil type, aridity) across the species’ distribution range suggest that N. sphaerocarpa populations may exhibit genetic differentiation and local adaptability. However, the genomic basis underlying such potential adaptations remains largely unexplored. We used population genomics and landscape genomics, based on ddRAD-seq and environmental association analysis (EAA), to analyze the response and adaptation mechanism of desert constructive plant N. sphaerocarpa to arid environment. We aimed to: (1) evaluate the genetic diversity and population structure related to fragmented distribution patterns; (2) clarify the relationship between environmental factors and genetic variation; and (3) analyze the molecular mechanism of population adaptive evolution of N. sphaerocarpa. This study helps provide a theoretical basis for elucidating the molecular genetic mechanism of local adaptive evolution of N. sphaerocarpa driven by environmental factors, and shed lights on the adaptive evolution of other plants in extreme desert environment.
2 Materials and methods
2.1 Sampling
The spatial distribution of N. sphaerocarpa was initially referenced from the Flora of China, the Chinese Virtual Herbarium (CVH; https://www.cvh.ac.cn/), and prior research (Su and Zhang, 2013). In the summer of 2023, fresh leaves of 200 N. sphaerocarpa samples were collected from 20 different sites, covering nearly its entire geographical range in China (Table 1, Figure 2A). No specific permissions were required for sampling and collection from these localities. Voucher specimens are deposited in the Herbarium of the Xinjiang Institute of Ecology and Geography Chinese Academy of Sciences (XJBI) (Supplementary Table S1). Plant identifications were conducted by Hongxiang Zhang and Haowen Tian. Among the sampled populations, eight (pgSC, pgATS, pgYC, pgBC, pgKP, pgXH, pgBH, and pgHS) were from the Tarim Basin, one (pgHM) was from the Hami Basin, seven (pgLY, pgGZ, pgJT, pgSZ, pgGT, pgHSG, and pgMQ) were from the Hexi Corridor, and four (pgDF, pgEJN, pgYQ, and pgZQ) were from the Alxa Desert (Supplementary Table S1). Within each population, 10 individuals were sampled at least 10 m apart from each other to avoid collecting from the same female parent. Fresh leaves were harvested and dehydrated using silica gel.
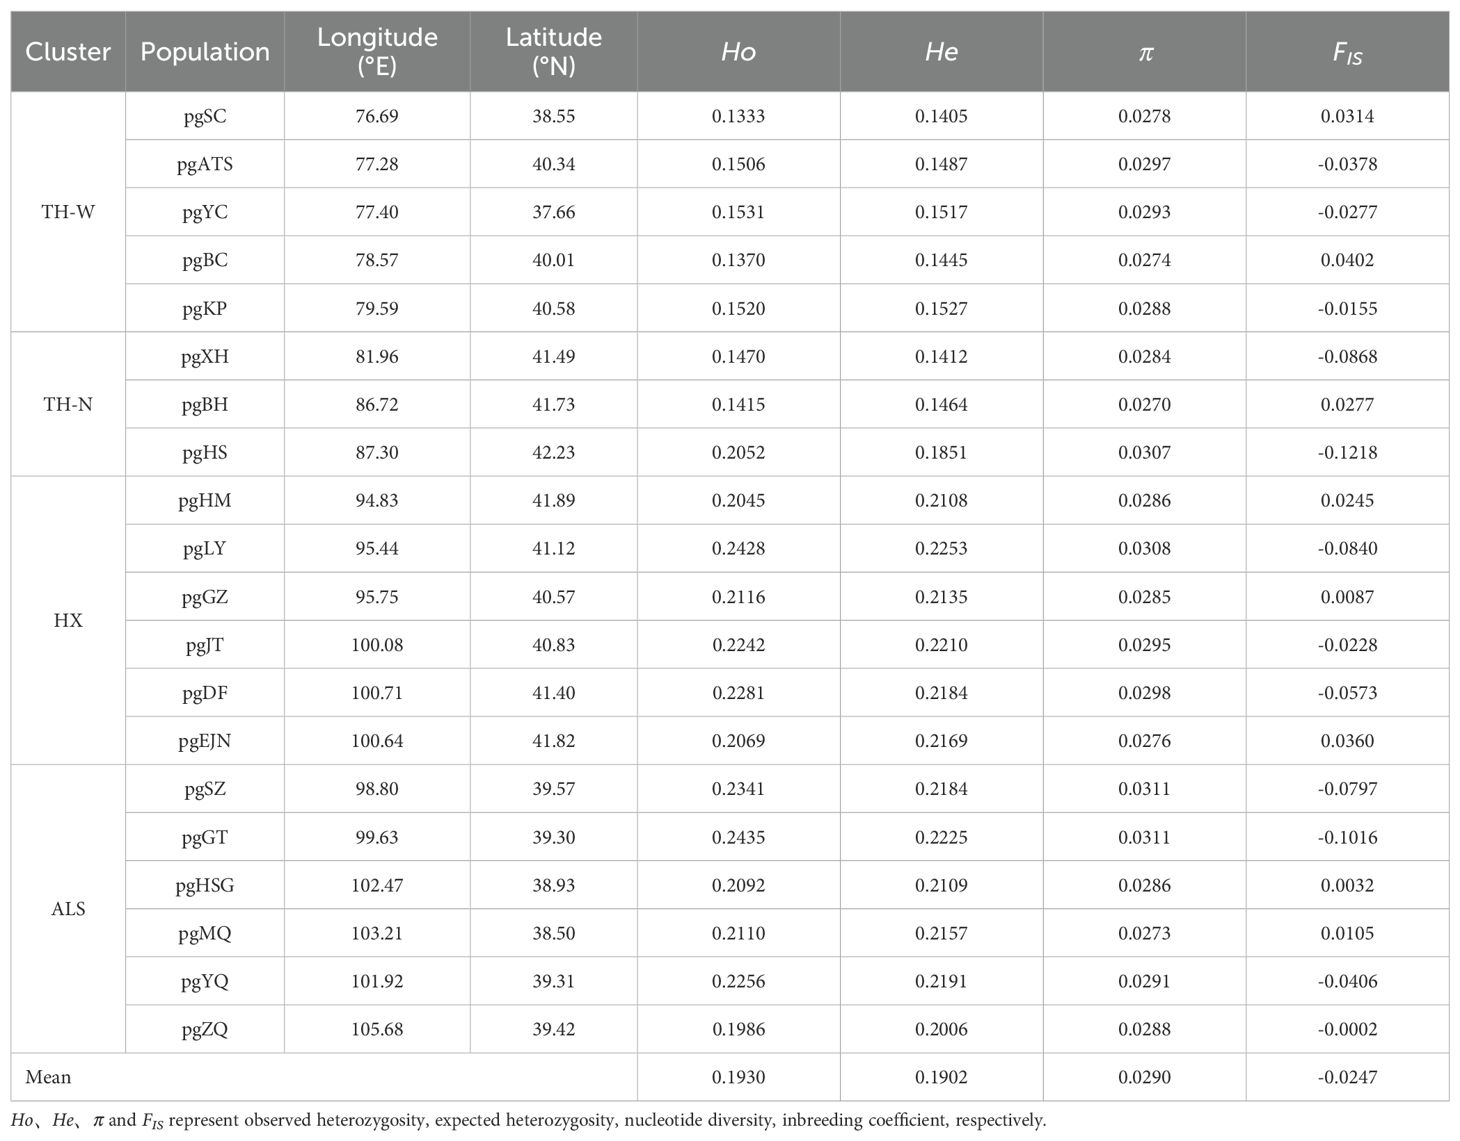
Table 1. Population locations and summary of genetic statistics of N. sphaerocarpa.
2.2 ddRAD-seq and SNP filtering
Molecular samples of N. sphaerocarpa were submitted to Paisano Biotechnology Co., Ltd (Shanghai, China) for double-digest restriction-site-associated DNA sequencing (ddRAD-seq). The total genomic DNA was extracted by the kit method (Tiangen DP305 Plant Genomic DNA Kit), and the quality of DNA was detected by 0.8% agarose gel electrophoresis, while DNA was quantified by ultraviolet spectrophotometer (Thermo Scientific NanoDrop 2000/2000c, Thermo Fisher Scientific). Whole-genome DNA was digested with a restriction enzymes, DpnII and MspI, and size-selected DNA fragments (~300–500 bp) were used for library construction, following standard ddRAD-seq protocols. After sample quality inspection, the standard Illumina TruSeq Nano DNA LT library preparation experimental process was utilized to construct a library with an insert fragment of 400 bp, followed by Paired-end (PE) sequencing based on the Illumina NovaSeq sequencing platform for Next-Generation Sequencing (NGS). Subsequently, post-sequencing, the original offline data (raw data) was filtered to generate high-quality sequences (high quality data) using fastp v0.20.0, employing a sliding window method with a window size of 5 bp and a step size of 1 bp. Reads with a joint read length ≤ 50 bp were excluded during this filtering process. The obtained high-quality data was aligned to the reference genome N. sibirica (Ma et al., 2023) using BWA-MEM (0.7.17-r1188) (Li and Durbin, 2009) mem with default parameters. Moreover, Picard v1.107 (Zhao and Assoc Comput, 2018) and GATK (McKenna et al., 2010; DePristo et al., 2011) were employed to enhance the precision of SNP prediction.
We used PLINK v1.90 (Purcell et al., 2007) with the parameters “indep-pairwise 50 10 0.2” to filter out a Linkage Disequilibrium–pruned (LD-pruned) SNP set with a minor allele frequency < 0.05, significant deviation from Hardy-Weinberg equilibrium (HWE, 0.0001 level), linkage loci (statistical correlation coefficient R2 > 0.2 between gene loci) and SNP loci with individual deletion in the sample (plink –maf 0.05 –geno 0.2 –hwe 0.0001 –indep-pairwise 50 10 0.2). After filtration, 10,828 high-quality SNPs were yield for subsequent analysis.
2.3 Population genetic diversity, structure and differentiation
The observed and expected heterozygosity (Ho and He), nucleotide diversity (π) and inbreeding coefficient (FIS) were calculated using PLINK v1.90 (Purcell et al., 2007) with the filtered SNP dataset. The population differentiation (FST statistic) was measured using the software Arlequin v3.5.2.2 among N. sphaerocarpa populations (Excoffier and Lischer, 2010). The ADMIXTURE analysis, principal components analysis (PCA) and phylogenetic inferences were employed to explore the population genetic structure. Firstly, the optimal genetic clusters of the N. sphaerocarpa populations was identified by the cross-test error value (CV) of assumed clustering value K (1 ≤ K ≤ 10) implemented in ADMIXTURE v1.3.0 (Alexander et al., 2009). Next, PCA was conducted in GCTA (Genome-wide Complex Trait Analysis) v1.26.0 (Yang et al., 2011a) to assess the genetic variance. Finally, IQ-TREE v2.0.3 (Nguyen et al., 2015) was utilized for constructing the maximum likelihood (ML) tree with GTR+F+G4 model. Additionally, 1,000 ultra-fast bootstrap tests were employed to determine the node support rate.
2.4 Demographic history
Filtered 10,828 SNPs were further screened at 10 kb intervals using VCFtools v0.1.16 (Danecek et al., 2011), resulting in 4,648 SNPs. Logistic regression was performed with the DIYABC v1.2.1 software and Approximate Bayesian Computation (ABC) (Cornuet et al., 2008) with a 95% confidence interval. One percent of the observed data that had the closest match to the simulated data was used to estimate posterior probabilities (PP) for each evolutionary event. The scenario with the highest PP was considered the optimal solution, representing the most probable ancestral source of the four geographic groups. To align with the ADMIXTURE outcomes and the geographic distribution of 20 N. sphaerocarpa populations, eight competition scenarios were designed. These scenarios included: (1) the simultaneous divergence of four lineages from a shared ancestor at time point t3 (scenario 1; Supplementary Figure S2); (2) the initial split of the common ancestor into two lineages at t3, with the emergence of a third lineage at time t2 on one branch and a fourth lineage at time t1 on the same branch (scenario 2-4; Supplementary Figure S2); and (3) the division of the common ancestor into two lineages at t3, with subsequent re-diversification into new lineages at t2 and t1 on separate branches, respectively (scenario 5-8; Supplementary Figure S2).
2.5 Isolation by distance and isolation by environment
Based on the availability of data, environmental data, consisting of 19 climatic variables for 1979-2013, bio 1-bio 19, were obtained from PaleoClim (http://www.paleoclim.org) at a resolution of 30s (about 1 km) (Brown et al., 2018). Climate data corresponding to the geographic coordinates of 20 N. sphaerocarpa populations were extracted using the R package “raster” (Hijmans and Etten, 2010). To mitigate the biased estimation and false significance level of the model coefficients caused by multicollinearity, Pearson correlation analysis was performed using SPSS (IBM Corp. Released 2020. IBM SPSS Statistics for Windows, Version 27.0. Armonk, NY: IBM Corp) among 19 variables. Variables with a correlation coefficient exceeding |r| > 0.9 were deemed highly correlated and thus removed to reduced autocorrelation (Dormann et al., 2013). Ultimately, 13 environmental variables were retained for further analyses (Supplementary Table S3).
To explore the impact of geographical and environmental factors in the formation of spatial genetic differentiation, mantel tests were conducted to examine isolation by distance (IBD) and isolation by environment (IBE) with significance determined using 999 permutations in the R package “vegan” (Dixon, 2003). Three distinct datasets were employed for the analysis: (1) genetic distances were estimated using the formula FST/(1 – FST) (Rousset, 1997); (2) the geographical distance between populations was calculated using the R package “geosphere” (Hijmans, 2024); and (3) environmental distance was quantified by calculating the Euclidean distance across all scaled environmental variables.
2.6 Environmental association analyses
We ran the non-parametric, machine learning regression tree approach known as gradient forest (GF) in the R package “gradientForest” (Ellis et al., 2012b) to evaluate the effects of environmental factors on population genetic variation. This approach enables the analysis of nonlinear associations between environment and allele variables by dividing the allele frequency data into “split values” according to environmental gradients (Breiman, 2001). The split importance metric quantifies the amount of variation explained, appearing high along the gradient where allelic frequency change is large. In the GF analysis of the relationship between genetic variation and environmental factors, the split importance values are accumulated to produce a ladder curve for allele frequency change along the environmental gradient (Ellis et al., 2012a). Consequently, GF analysis was performed on 13 environmental variables (Supplementary Table S3) and allele frequency data to evaluate the relative importance of each environmental variable through R2 weighted importance, and to visualize the cumulative importance of alleles along environmental gradients.
2.7 Niche comparison analyses based on environmental variables
To quantitatively analyze the niche differentiation and environmental driving forces of N. sphaerocarpa populations distributed across four lineages, kernel density plots were first generated for each four lineages utilizing 13 environmental variables through the R package “ggplot2”. Subsequently, the key factor values of population distribution points were extracted for PCA to elucidate the primary factors influencing the niche differentiation of four lineage populations (Yan et al., 2021).
2.8 Environmental adaptive loci
The environmental association analysis (EAA) method was utilized to detect the genomic loci of N. sphaerocarpa populations that are adapted to the local environment. However, EAA has limitations, as they might lead to high rates of false positives (Frichot and François, 2015). To prevent false positives, one effective approach is to integrate multiple methods and utilize gene ontology (GO) analyses to connect positively identified SNPs with gene function (Rellstab et al., 2015).
Firstly, a univariate latent factor mixed model [LFMM; (Frichot et al., 2013)] was implemented in the R package LEA (Frichot and François, 2015) to find out environmental adaptive loci (EAL) linked with six environmental variables (Supplementary Table S3; bio 1, bio 2, bio 4, bio 11, bio 15 and bio 18). By determining the number of clusters through ADMIXTURE results, LFMM with latent factors (K = 4) was conducted to elucidate the population structure within the genotype data. For each environmental variable, we ran with 5 repetitions and burning of 5,000 steps followed by 10,000 iterations. The |z|-scores were averaged to enhance the genetic-environment association, with a false discovery rate (FDR) of 1% applied to identify significant loci (Frichot and François, 2015).
Secondly, redundancy analysis (RDA) was performed through the rdadapt function in the R package “vegan” (Dixon, 2003). A total of 10,828 SNP loci were considered as dependent variables, with six environmental factors (Supplementary Table S3) as explanatory variables. The first four axes (explaining 88% of the genetic variation) were used to assess genetic variation across SNP loci in the genome based on the degree of interpretation of different RDA axes for the variation. After that, the false positive probability (q) of FDR of SNP loci was calculated, ensuring a stringent threshold of q < 0.01 to identify candidate adaptive loci.
Finally, environmental adaptive loci (EAL) were identified using the combination of LFMM and RDA methods. The eggNOG (Huerta-Cepas et al., 2019) was used for GO annotation and enrichment to detect the gene function of the hypothetical EAL. Specifically, (1) the genetic coordinates of candidate SNPs were isolated by comparing the candidate loci with the reference genome of N. sibirica (Ma et al., 2023); (2) the corresponding protein sequences were obtained by searching the above genetic coordinates in the reference genome; and (3) the genome GO annotation was performed by submitting all the extracted protein sequences to eggNOG.
3 Results
3.1 ddRNA-seq and SNP calling
We constructed a ddRAD-Seq library for each sample, resulting in a total of 200 libraries and sequenced 150-bp paired-end from 200 individual N. sphaerocarpa, generating a total of 9.92 GB sequencing data from these individuals. This produced an average of 9,606,459 bp (range 6,464,386-19,313,540 bp) raw sequence reads per sample. Following the initial sequencing, the raw data underwent filtering to obtain high-quality sequence reads, yielding an average of 9,346,120 bp (6,114,880-19,102,036 bp). Subsequently, an average of 8,815,090 bp (5,822,354-18,132,655 bp) high-quality reads were successfully aligned to the reference genome. The identified SNPs were then subjected to filtration based on linkage disequilibrium (LD), resulting in the final 10,828 high-quality SNPs for further analysis.
3.2 Population structure and diversity
Nitraria sphaerocarpa among 20 populations exhibited low genetic diversity (He=0.1902). Notably, population pgGT, situated in ALS cluster, demonstrated the highest genetic diversity, as evidenced by the highest Ho (0.2435), He (0.2225) and π (0.0311). In contrast, TH-W cluster, pgSC, displayed the lowest level of genetic diversity (Ho = 0.1333 and He = 0.1405; Table 1). Overall, the populations in Tarim Basin exhibited low genetic diversity (e.g., pgSC, pgXH), while those in Hexi Corridor and Alxa Deser (e.g., pgJT, pgGT, pgYQ) showed higher genetic diversity, indicating a trend of increasing genetic diversity from west to east within the study area. Moreover, the genetic differentiation relationships among different populations were further explored through pairwise genetic differentiation (FST). The FST values calculated among the 20 populations ranged from 0.00 (pgGZ and pgLY) to 0.59 (pgBH and pgXH), with an average of 0.30 (Supplementary Table S2). Importantly, the TH-W lineage consistently displayed high pairwise FST values in comparison with other genetic clusters, providing preliminary evidence of genetic differentiation and limited gene flow. Conversely, populations within the HX and ALS lineages exhibited relatively low FST values, reflecting weak genetic differentiation and implying the presence of ongoing or historical gene flow between them.
The cross-validation error rate supported the optimal clustering of K = 4 for N. sphaerocarpa populations (Supplementary Figure S1A). These four genetic clusters were primarily correlated with the geographic distributions of the populations (Figure 2A, Supplementary Table S1). Specifically, a highly homogenous genetic cluster (TH-W) encompassed five populations from the western Tarim Basin, while three populations from the northern Tarim Basin were grouped into a distinct genetic cluster (TH-N) that exhibited genetically close to the western Tarim Basin. One Hami Basin, three western Hexi Corridor, and two western Alxa Desert populations formed a single cluster (HX), highlighting genetic similarities within these regions. Furthermore, the remaining six populations fell into one genetic clusters (ALS). Notably, a significant genetic divergence was observed between TH-W and the other genetic clusters. Further evidence indicates limited gene flow between these groups, whereas gene flow was clearly evident between the HX and ALS cluster (Figures 2A, B). Interestingly, when K = 3 (Supplementary Figure S1B), the populations from the Hexi Corridor and Alxa Desert merged into a single genetic group, further supporting the genetic relationships observed within the study populations. The population structure was further confirmed by the PCA and phylogenetic tree topology. PCA analysis revealed that only TH-W formed a clearly distinct cluster. TH-N showed internal subdivision into three subgroups but remained genetically differentiated from other populations. In contrast, HX and ALS populations displayed extensive admixture with highly overlapping distributions and scattered individuals, indicating substantial gene flow between these populations (Figure 2C). Additionally, the phylogenetic analysis using the IQ-tree method revealed that almost all individuals within each population clustered together, forming four well-supported evolutionary branches (Figure 2D).
3.3 Demographic history
In the analysis conducted using DIYABC software, it was found that scenario 8 demonstrated the highest consistency with the historical differentiation among the four lineages under study (Figure 3, Table 2). The generation time for N. sphaerocarpa was determined to be three years (Su and Zhang, 2013). The divergence time between each lineage was estimated by multiplying the generation time of N. sphaerocarpa by the expected values of time parameters (t1, t2, and t3) obtained from the parameter estimates of scenario 8. Specifically, the TH-N and HX lineages diverged from a common ancestor approximately 0.349 (3×116407×10-6≈0.349) million years ago (Mya; 95% CI) during the middle Pleistocene. Following this, the TH-W lineage separated from the TH-N lineage around 0.218 (3×72631.7×10-6≈0.218) Mya (95% CI) in the late middle Pleistocene, while the ALS lineage differentiated from the HX lineage at 0.007 (3×2413.52×10-6≈0.007) Mya (95% CI) in the Holocene (Figure 3, Table 3). The effective population size (Ne) of the HX lineage (N3) was estimated to be 1.06×10⁷. Furthermore, the effective population sizes of the TH-W, TH-N and ALS lineage were estimated to be 1.71×10⁵, 3.68×10⁵ and 0.25×10⁵ for lineage N1, N2 and N4, respectively (Table 3).
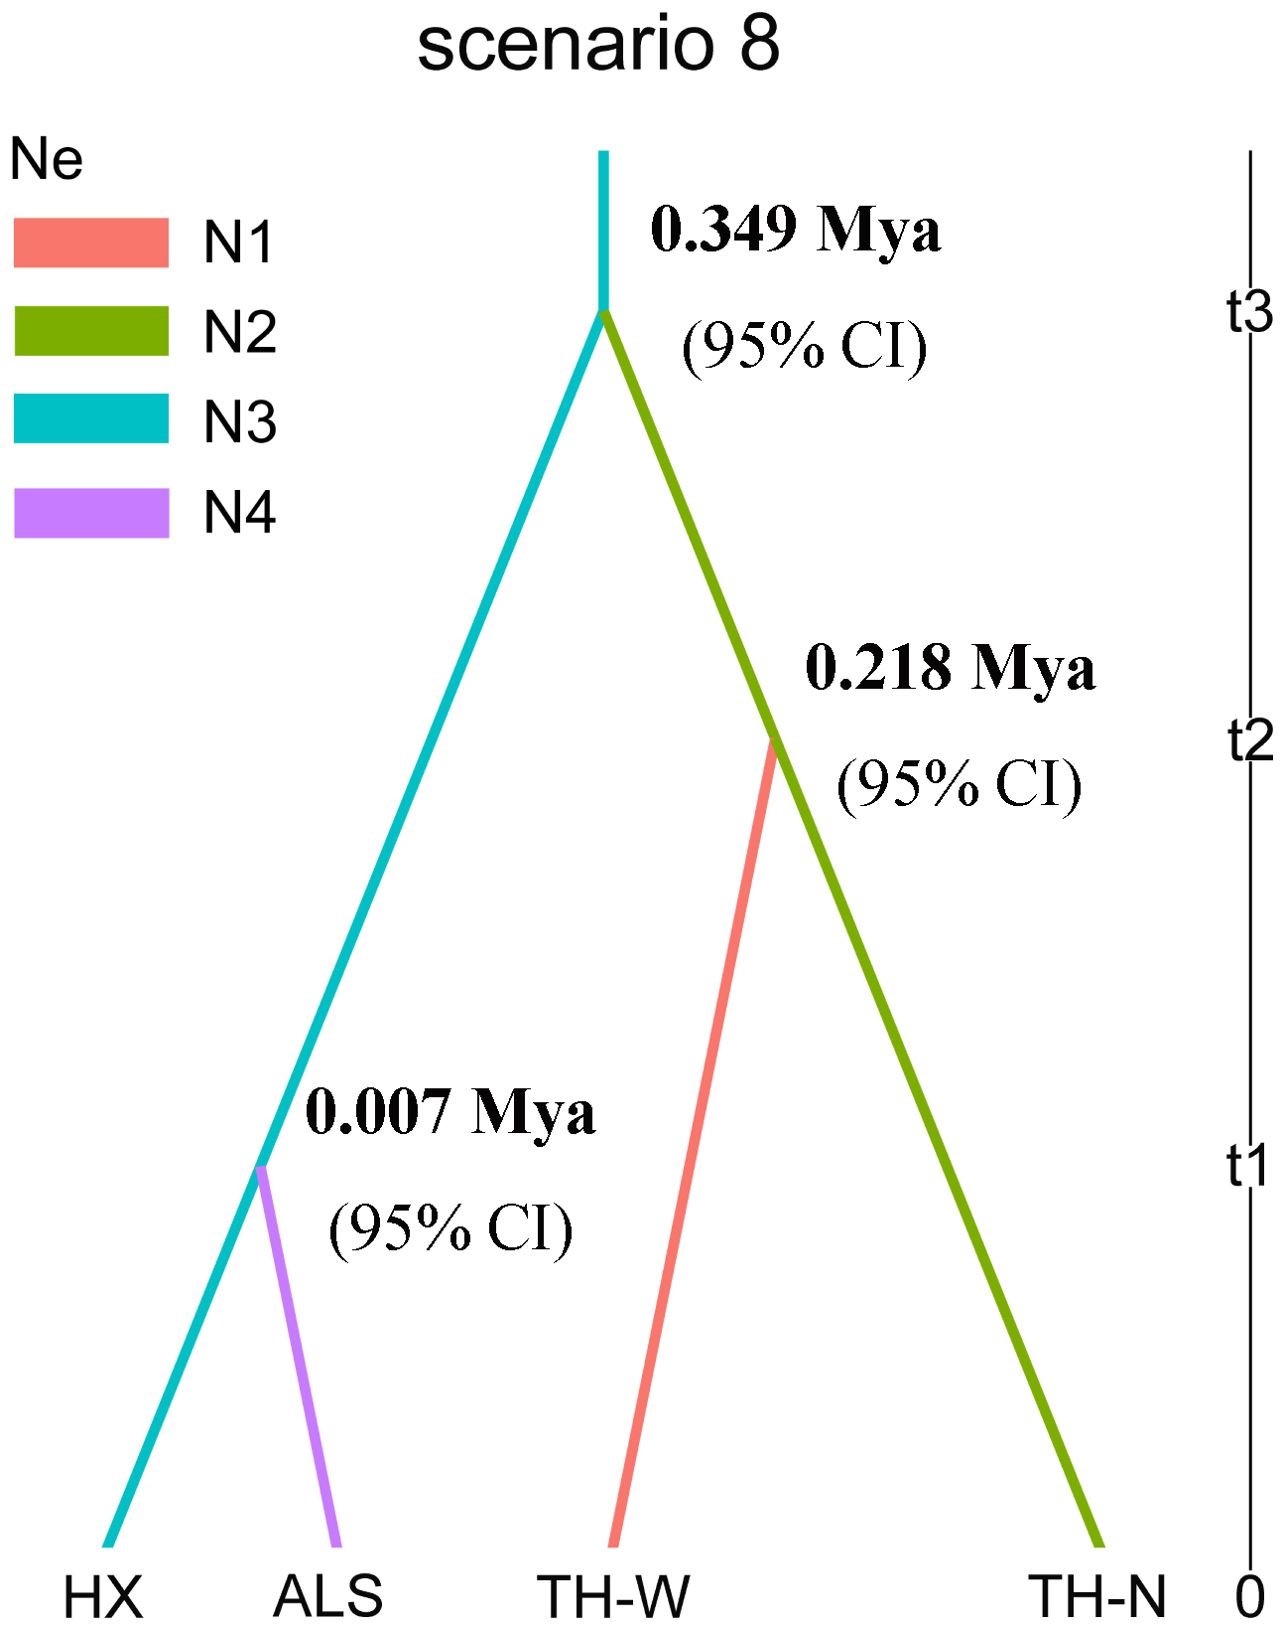
Figure 3. Scenario 8 of population history of four lineages in N. sphaerocarpa with DIYABC. N1, N2, N3 and N4 represent the effective population size of the four lineages. T1, t2 and t3, divergence times for the depicted event.

Table 2. 8 scenarios of votes and the optimal model based on DIYABC.
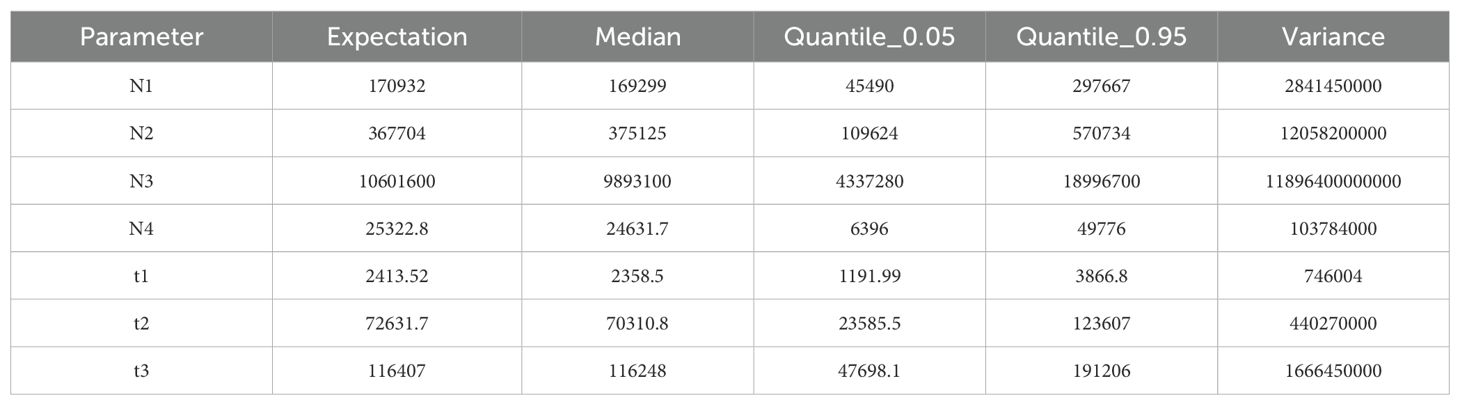
Table 3. Parameter estimation (point estimates) of optimal scenario (scenario 8) based on DIYABC.
3.4 IBD and IBE
Mantel test indicated a significant correlation between pairwise FST/(1 - FST) and geographic distance (R2 = 0.33, p < 0.001; Figure 4A), supporting the presence of isolation by distance (IBD). This suggests a potential pattern of local adaptation among populations that are geographically distant. Furthermore, the positive correlation observed between genetic distance and environmental distance (R2 = 0.10, p < 0.001; Figure 4B) among the 20 populations confirmed the pattern of isolation by environment (IBE). These findings provide evidence that genetic distance was strongly influenced by both geographical and environmental distances.
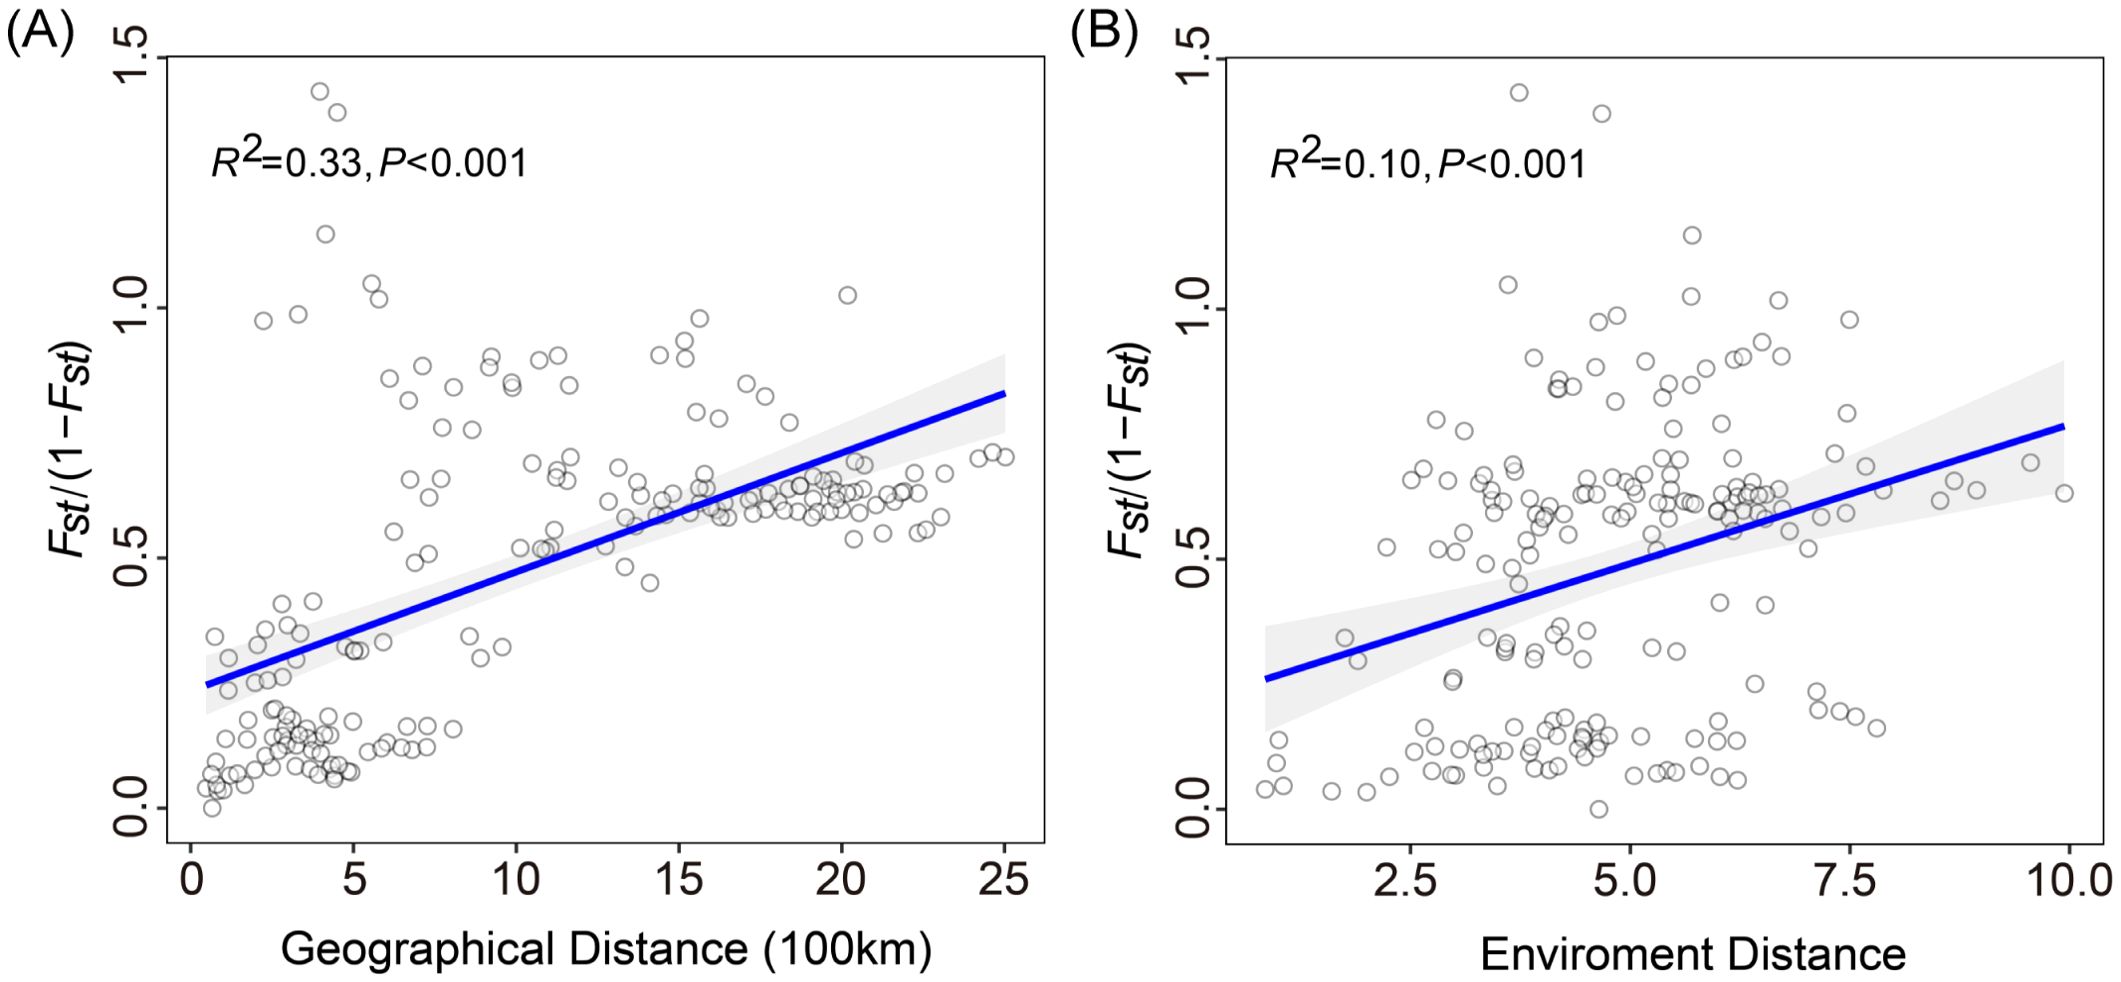
Figure 4. Mantel tests of genetic distance and geographical distance or environmental distance. (A) Genetic distance is significantly associated with geographic distance and (B) environmental distance.
3.5 Genetic variation associated with environmental factors
The GF model revealed a significant correlation between genetic variation and the mean diurnal temperature range (bio 2), with its R2 weighted importance value ranking highest, and other important factors included precipitation seasonality (bio 15), mean temperature of coldest quarter (bio 11), temperature seasonality (bio 4), precipitation of warmest quarter (bio 18) and annual mean temperature (bio 1) (Figure 5A). The remaining seven environmental factors exhibited low R2 weighted importance values, suggesting that their impact on genetic variation was relatively minor. Figure 5B illustrated the cumulative importance of all allele frequency changes with the environmental gradient across the top six climate variables. Moreover, through RDA analysis, it was also found that there was a significant correlation between genetic variation among populations and the six environmental factors (p = 0.001). The joint contribution of axes 1 and 2 in the RDA accounted for 68.1% of the total genetic variation (RDA1: 44.3%, RDA2: 23.8%; Figure 6). The ranking of each environmental factor in terms of population genetic variation as revealed by RDA was roughly in agreement with the GF analysis.
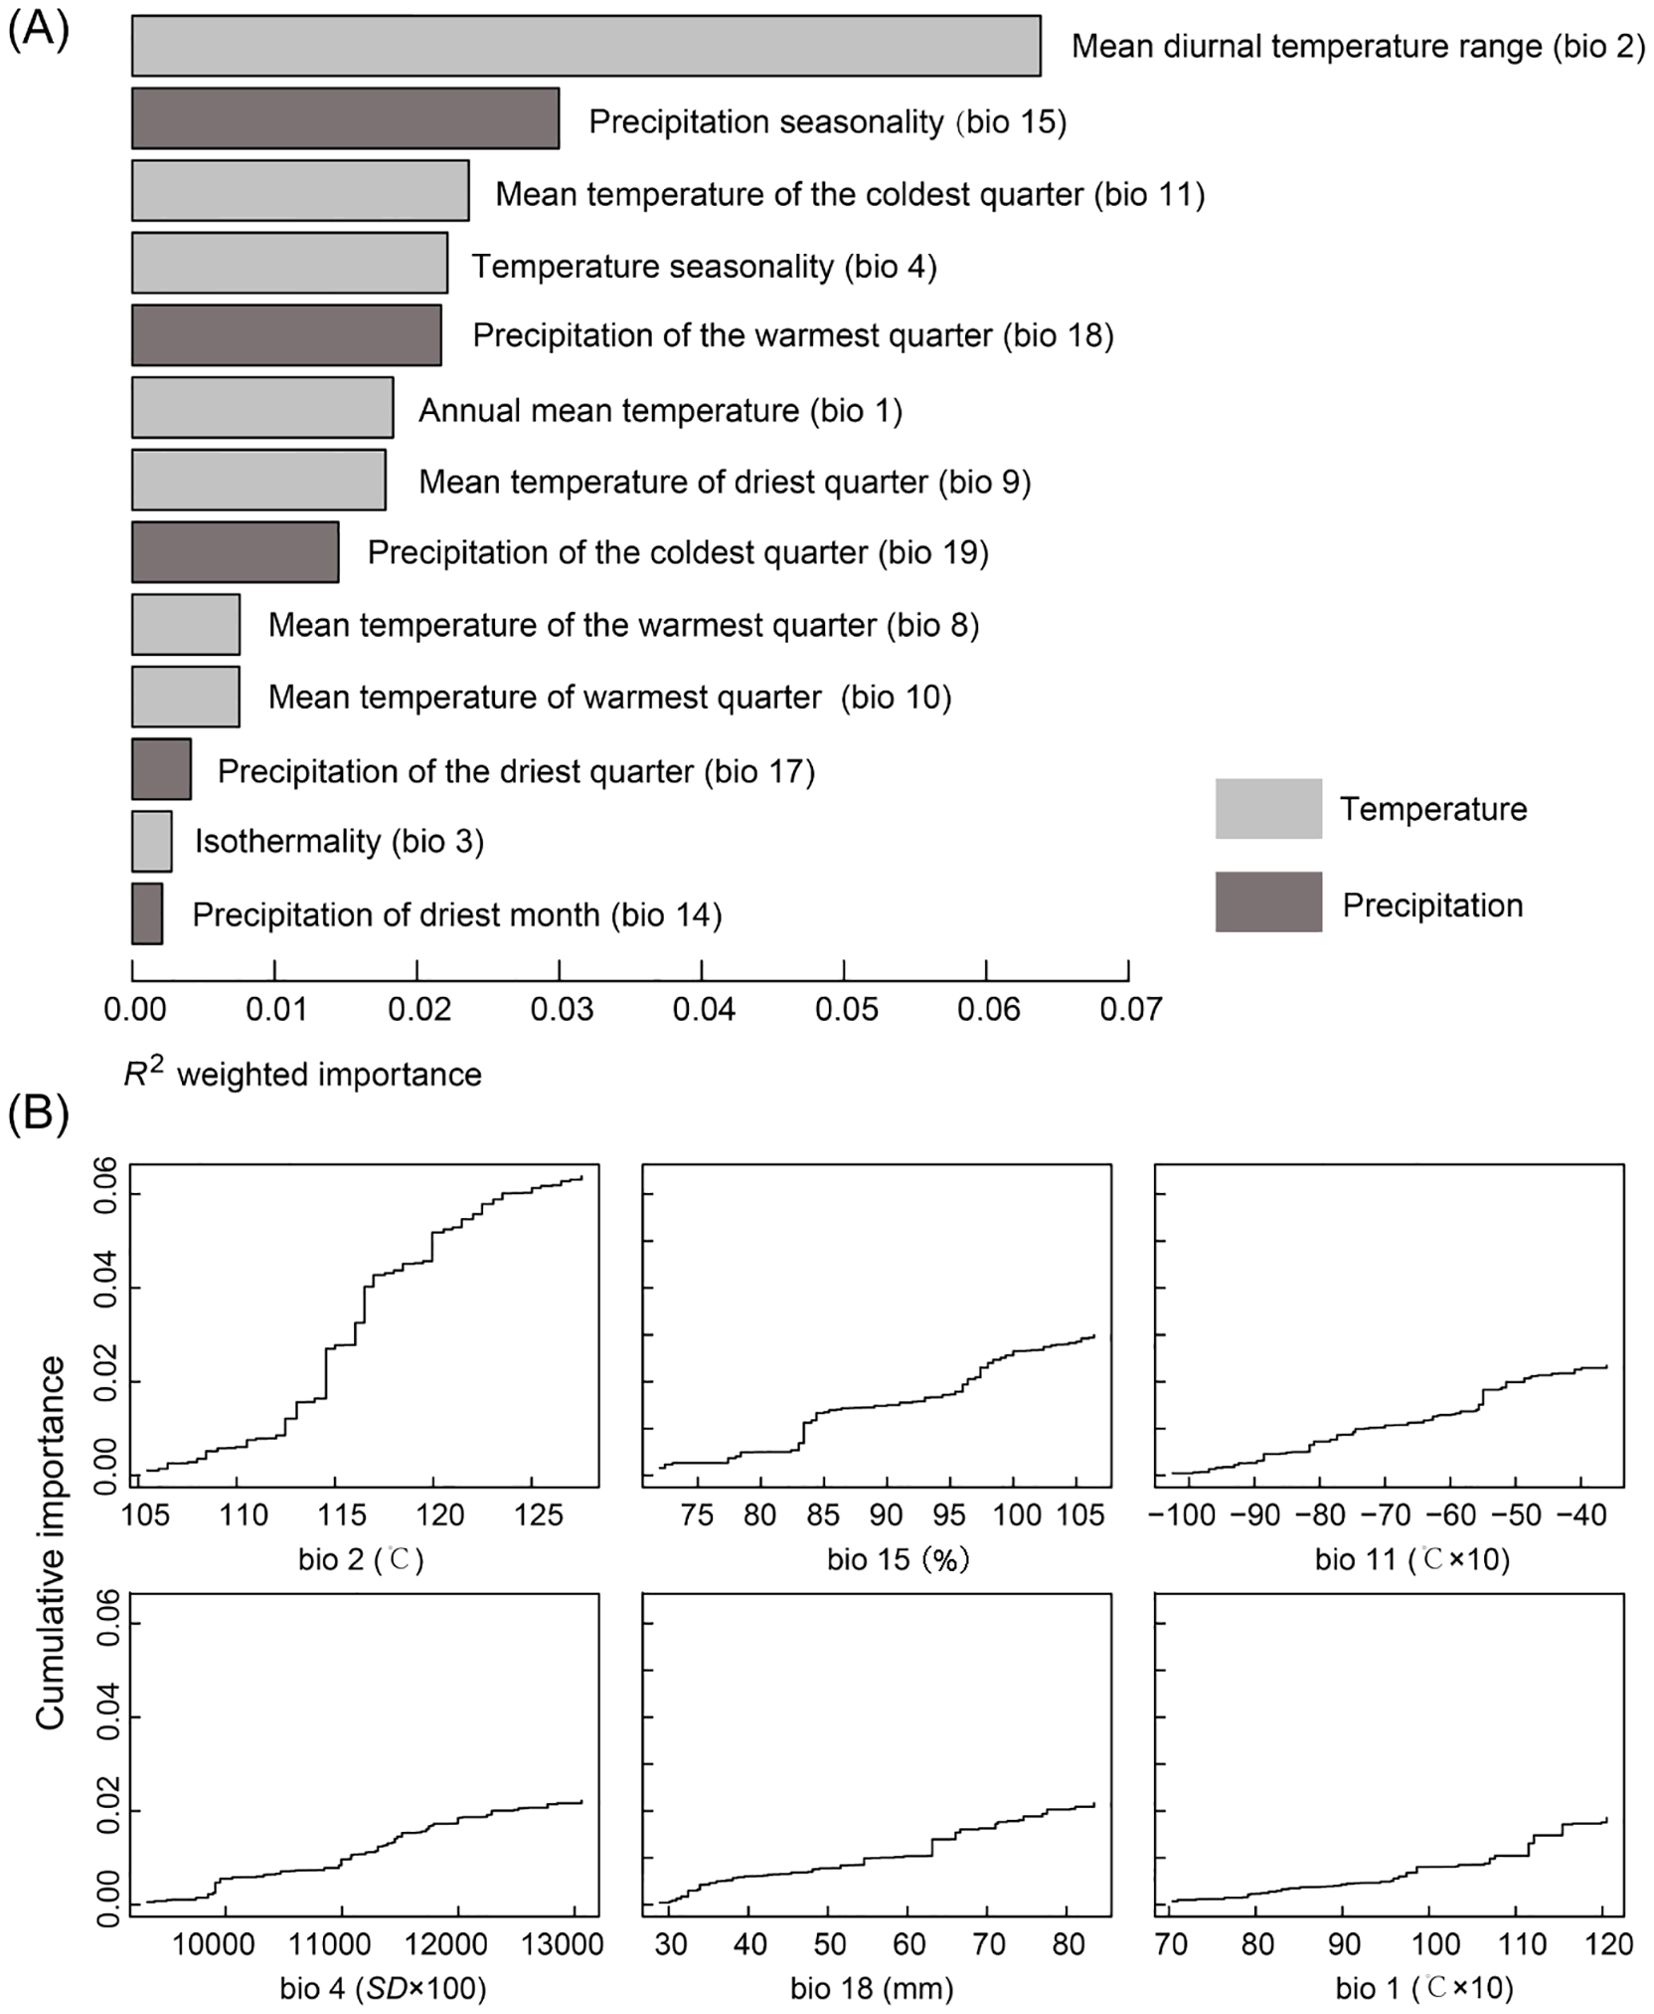
Figure 5. Gradient forest (GF) analysis. (A) R2 weighted importance of environmental variables. (B) Cumulative importance of allelic change along the first six environmental gradients.
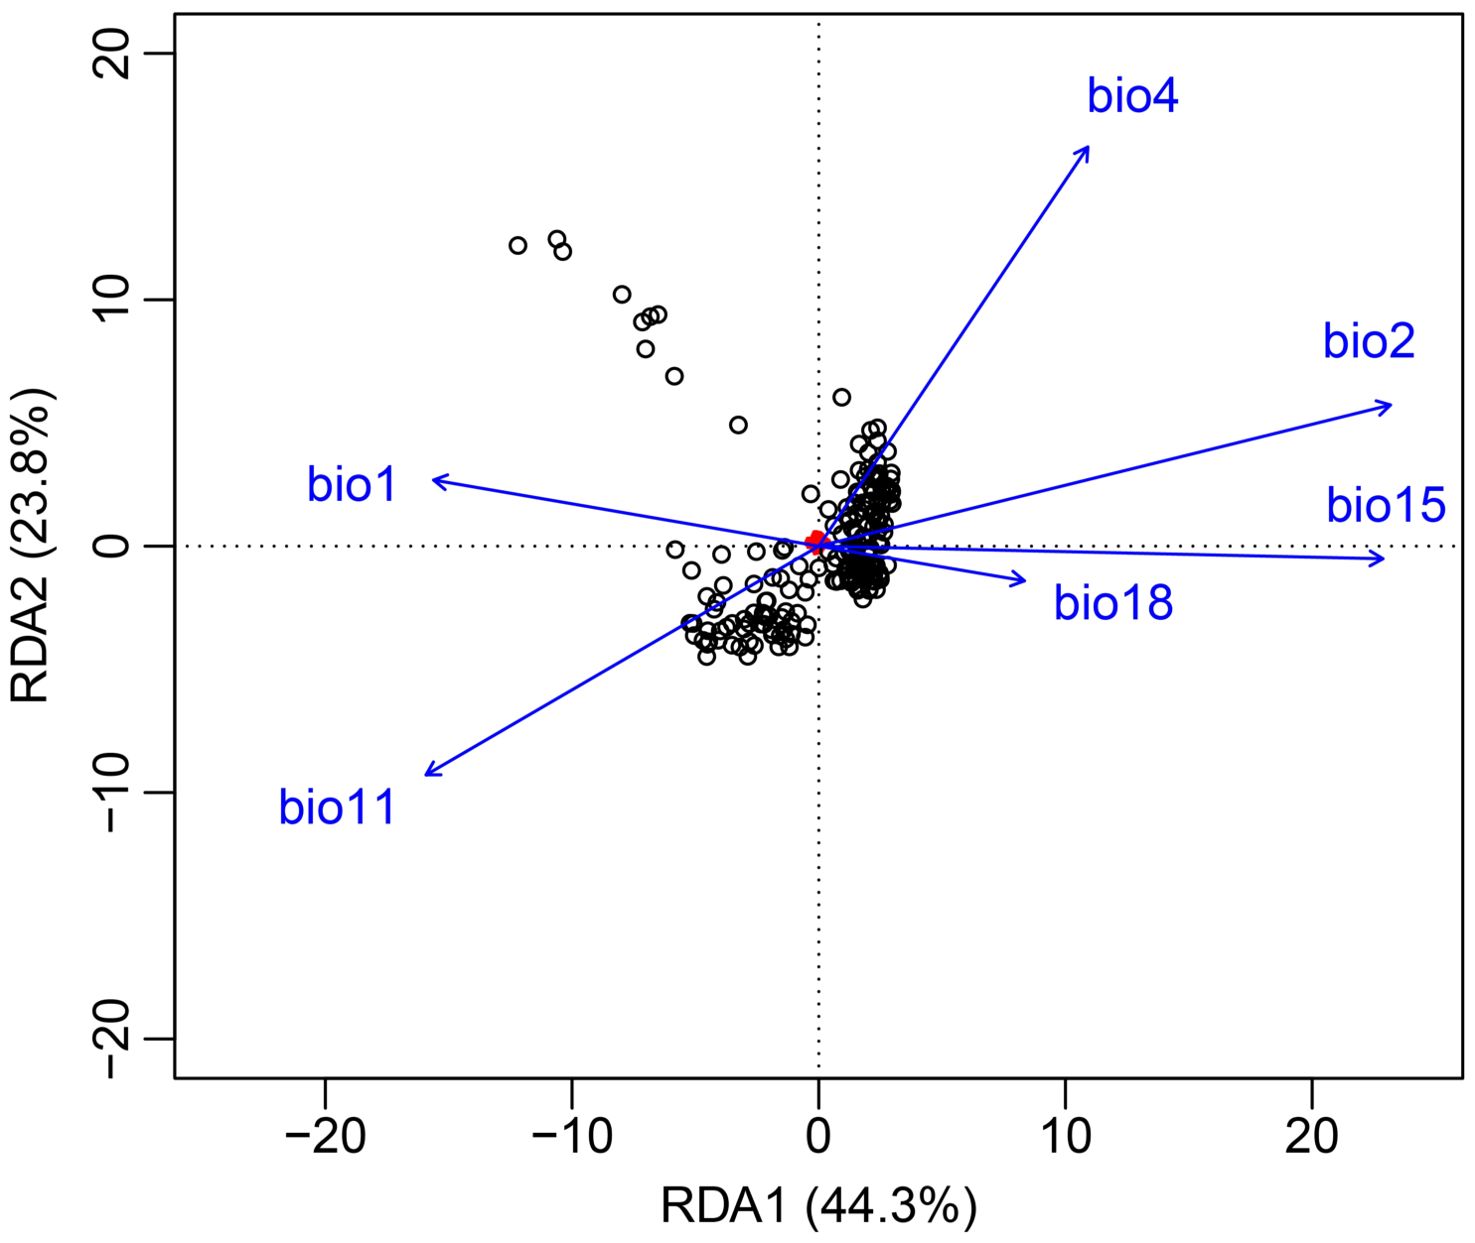
Figure 6. Redundancy analysis (RDA). It showed the relationship between environmental variables and genetic variations. Small red points are single nucleotide polymorphism (SNP). Individuals are black points.
3.6 Niche comparison analyses
Kernel density plots were first generated to illustrate the frequency distributions of 13 environment variables (Supplementary Table S3) in four distinct lineages. The results indicated that the four lineages exhibited significant differences in both temperature- and precipitation-related environmental variables, with precipitation factors showing more pronounced differentiation. (Figure 7A). Meanwhile, PCA-env analysis revealed that both temperature and precipitation variables were associated with genetic polymorphism, with temperature exhibiting a stronger correlation. Specifically, temperature seasonality (bio 4) prominently influenced niche differentiation in the first component, while annual mean temperature (bio 1) played a key role in driving differentiation in the second component. In addition, axis 1 (PC1) and axis 2 (PC2), accounted for a substantial 71.3% of the overall variability, with PC1 explaining 46.2% and PC2 explaining 25.1% of the total variance (Figure 7B). These findings were further supported by the outcomes of the GF and RDA analyses, which consistently indicated that N. sphaerocarpa experienced environmental adaptive pressures primarily driven by fluctuations in temperature and precipitation, demonstrating concordance across multiple analytical approaches.
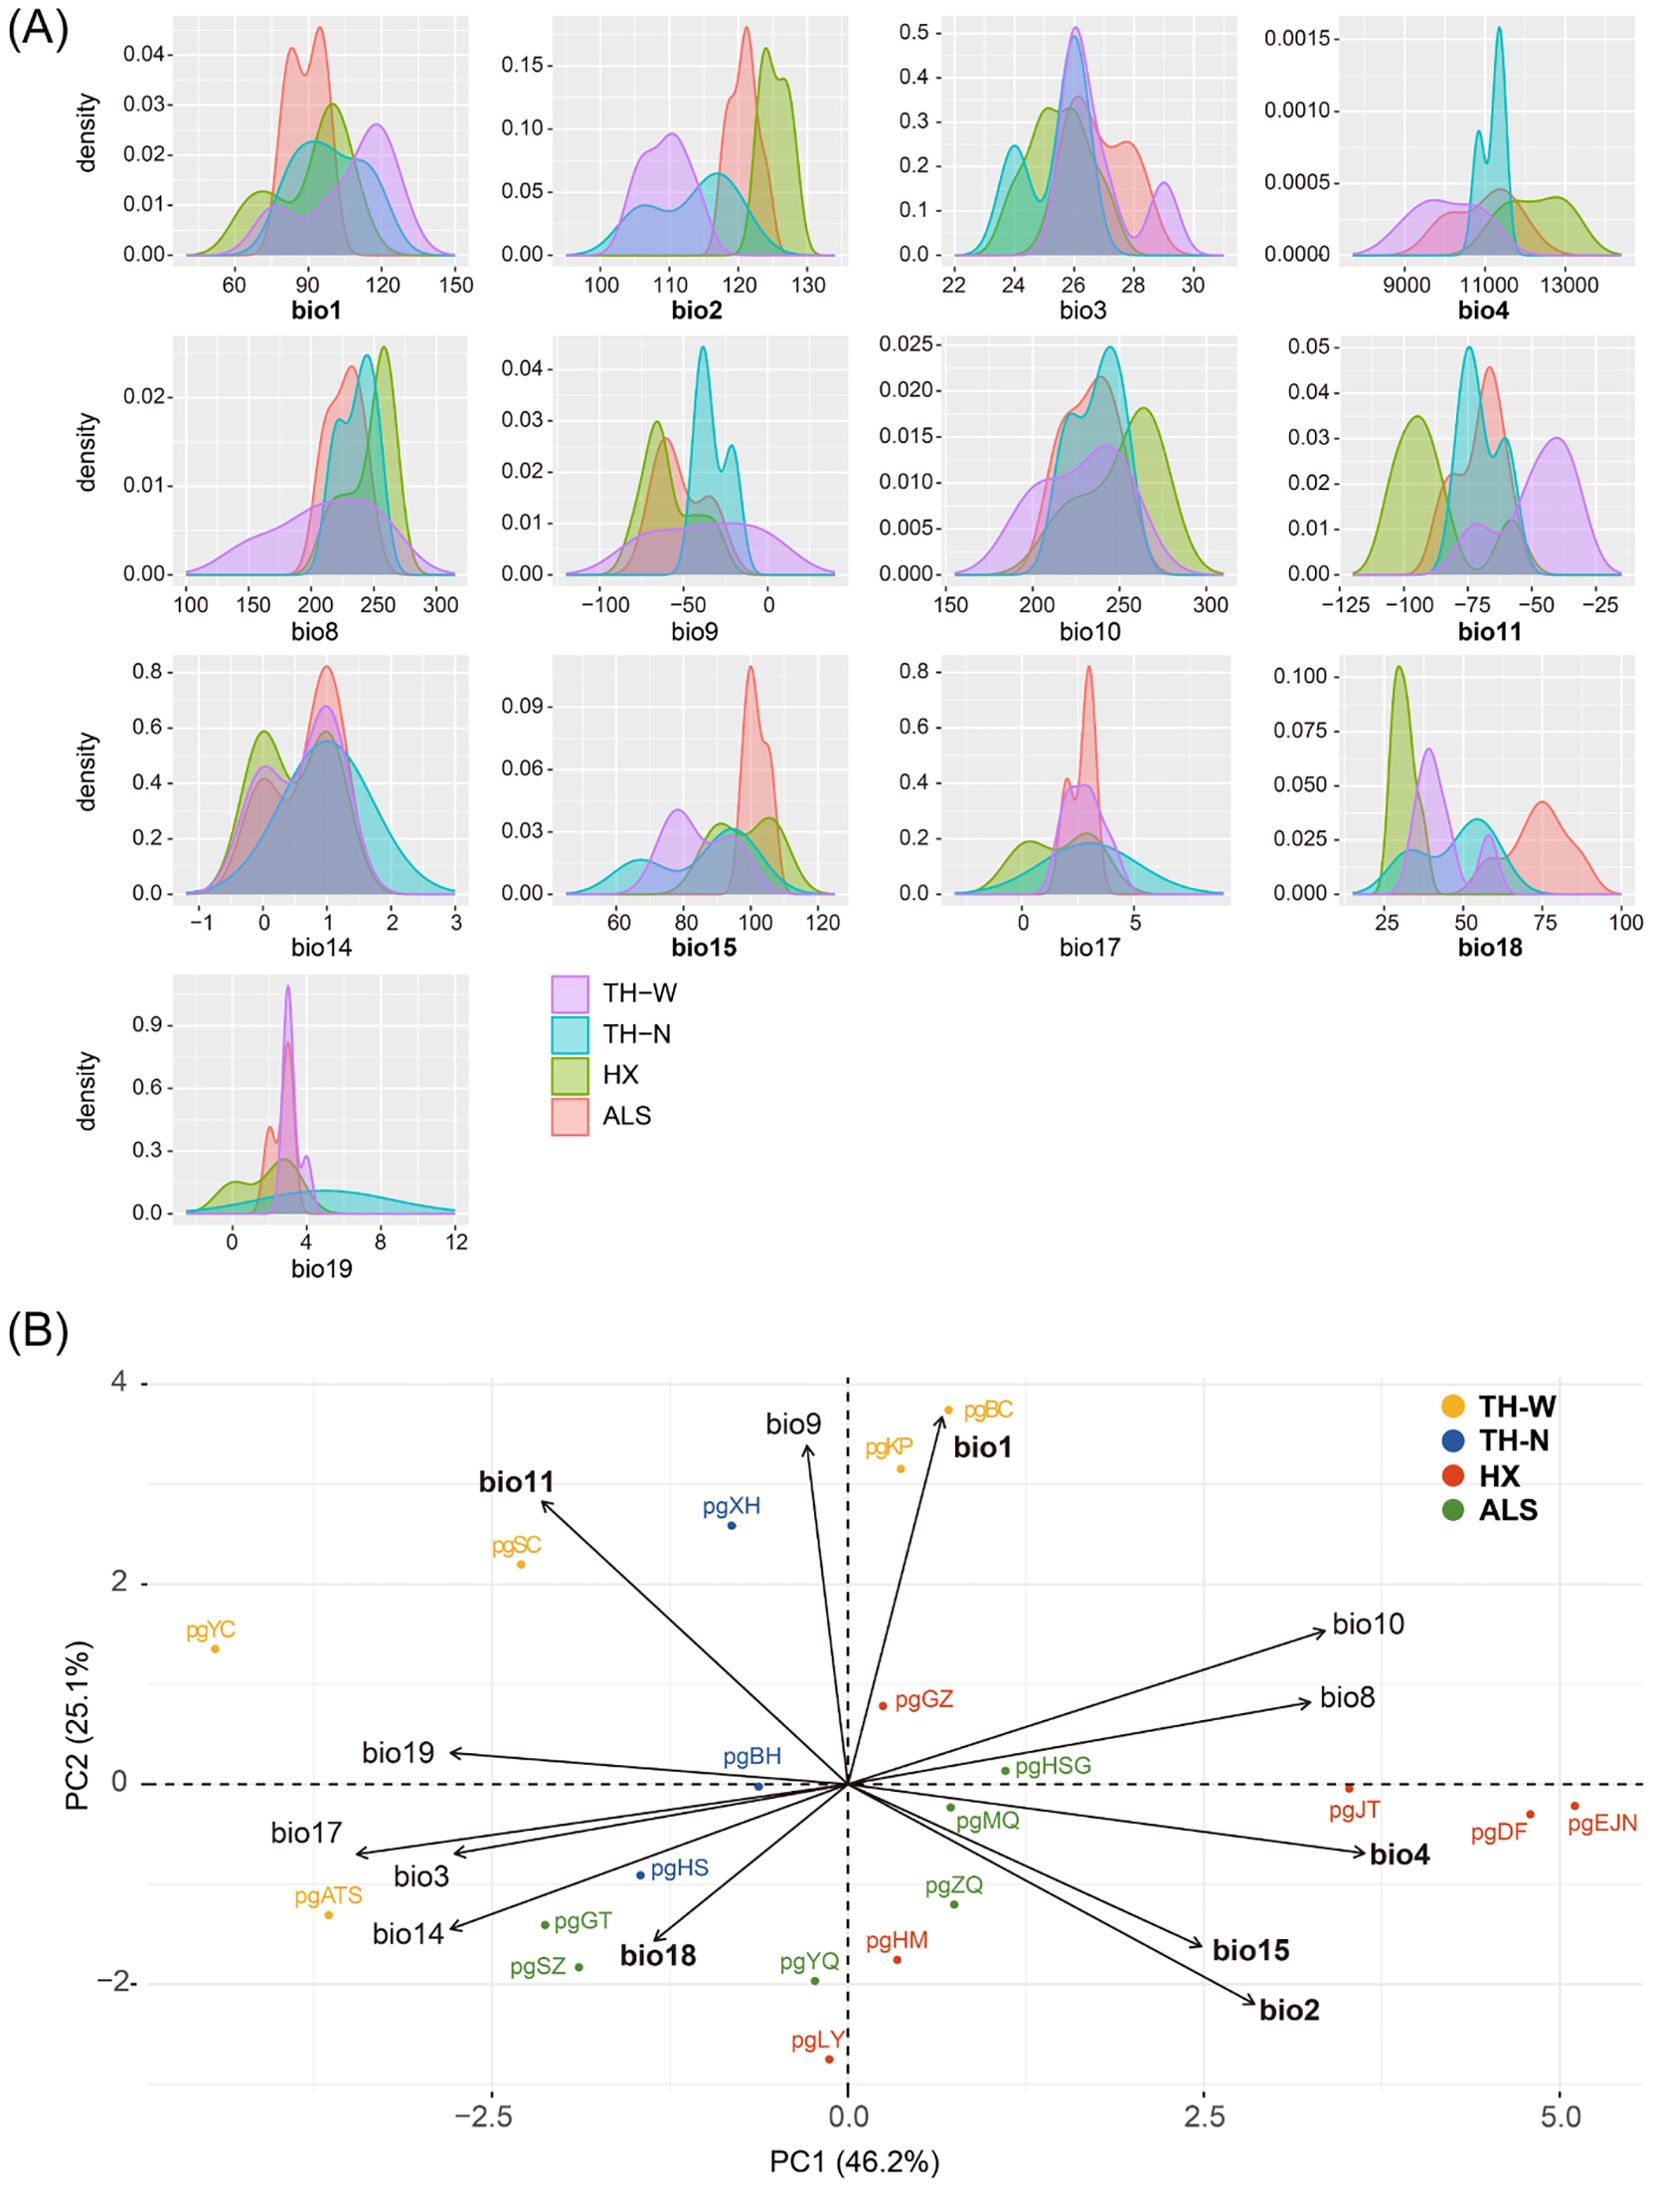
Figure 7. Niche comparison analyses. (A) Kernel density plots for 13 environmental parameters for N. sphaerocarpa showing niche differences among the four lineages. (B) PCA-env analysis. The bold variables indicate the 6 environmental variables selected for RDA analysis.
3.7 Identifying genetic loci associated with local adaptation
94 and 81 SNPs were found to be significantly associated with six environmental variables by LFMM and RDA analysis, respectively, of which 22 common SNPs identified between both methods were assumed as environmental adaptive loci (EAL) (Supplementary Figure S3). Functional annotation was carried out on 22 SNPs, indicating that 3 SNPs (loci LG03_1166504, LG04_5700855, and LG11_4056481) were matched to genes with known functions. Specifically, the locus LG03_1166504 matched to pentatricopeptide repeat-containing protein At5g13270, which is relates to the cold response of the plant (Li et al., 2023a); the locus LG04_5700855 was annotated as encoding protein phosphatase 2C (PP2C), which functions as a key regulator in various hormone signal transduction pathways, particularly those involving abscisic acid (ABA) signaling. PP2C members can respond to various biotic and abiotic stresses, and also regulate organ development and seed germination (Rodriguez, 1998; Chen et al., 2021); and the locus LG11_4056481 was associated with R3H-associated N-terminal domain, which is crucial for immune response, cell death and signal transduction in plants (Table 4).

Table 4. Functional annotation of the three candidate loci under local adaptation.
4 Discussion
4.1 Effect of historical and current environment factors on fragmented distribution pattern of N. sphaerocarpa
The fragmented distributions could explain evolutionary mechanism of genetic divergence for N. sphaerocarpa. At present, N. sphaerocarpa is distributed with a fragmented pattern in arid northwestern China (Figure 2). The fragmentation of N. sphaerocarpa was resulted from the combined effects of historical and current environmental factors. The drying climate during the Quaternary was considered to be a driving factor for significant genetic differentiation among populations in N. sphaerocarpa (Su and Zhang, 2013). During the Quaternary, northwestern China experienced the long-term process of increasing aridification, especially in the Pleistocene (Guo et al., 1999). In this period, periodic cold and aridification were associated with glacial epoch (Xu et al., 2010). In the early Pleistocene, the climate began cold, and several aridification expansion events occurred in northwestern China (Guo et al., 1999). At 0.8-0.6 Mya, northwestern China entered into the largest glacial period, and the climate became colder and drier than ever before (Shi et al., 2005). The desert and gobi continued to expand, and the degree of drought further increased during the middle Pleistocene. In this study, the TH-N and HX lineages diverged from a common ancestor at 0.349 Mya (95% CI; middle Pleistocene) and the TH-W lineage diverged from the TH-N lineage at 0.218 Mya (95% CI; late middle Pleistocene) (Figure 3, Table 3). Thus, we speculate that climate change, especially the extreme cold and dry climate during glacial period, reduces the viability of N. sphaerocarpa and limits its distribution. The distribution range might have been reduced and fragmented, so that the intraspecific populations could be divided into several groups (Su and Zhang, 2013). The gradually reduced and isolated habitats of N. sphaerocarpa leaded to genetic differentiation among isolated regions. According to the population structure of N. sphaerocarpa in the existing distribution area in our study, 20 populations could be reasonably divided into four geographical groups (Figure 2). Because of the commonality of historical experiences in the same region, other desert plants may exhibit similar patterns of population structure fragmentation, such as Nitraria roborowskii Kom (Su et al., 2016), Reaumuria soongarica (Pall.) Maxim. (Li et al., 2012) and Populus euphratica Oliv (Wang et al., 2011).
Here, we found a significant pattern of isolation by distance (IBD) among the 20 populations of N. sphaerocarpa, providing a unique genetic structure for fragmented populations (Figure 4A). Studies have been shown that there was a significant correlation between genetic distance and geographical distance of N. sphaerocarpa (Su and Zhang, 2013). Under the fragmented distribution pattern and long-distance range, the gene flow between populations of N. sphaerocarpa was limited. Also, in views of the topography of northwest China, landscape barriers might be the reason for hindering gene flow. Major landscape barriers in the study region include the arid Tarim Basin and the Alxa Desert, along with surrounding mountain ranges such as the Tianshan and Altai Mountains, which together impose significant physical and ecological constraints on gene flow. In addition, the fragmented desert–steppe ecotone, exemplified by patchy habitats along the Hexi Corridor, further restricts the continuous distribution of populations. In addition, the different degrees of genetic differences might be related to the biological characteristics of the species. The seed set percentage of N. sphaerocarpa was 33.85%, which was lower than that of other species of Nitraria (Wang et al., 2012). Its mature fruits were relatively scarce, and in contrast to the fleshy berries of other Nitraria species, the seeds of this species were less prone to being collected and dispersed by animals (Li et al., 2013a). These factors will increase genetic differentiation between populations by limiting gene flow. Human activities (e.g., overgrazing, agricultural expansion, and infrastructure development) cannot be ignored as they have contributed to population fragmentation, reducing gene flow and increasing the risk of maladjustment of local species in response to environmental changes.
Also, a significant pattern of isolation by environmental (IBE) was shown among these 20 populations besides IBD (Figure 4B). The results of this study showed that the primary environmental adaptation pressures faced by N. sphaerocarpa was from fluctuations in temperature and precipitation conditions. Among the environmental variables, GF analysis identified that mean diurnal temperature range (bio 2) was the most important environmental factor affecting the genetic variation of N. sphaerocarpa populations (Figure 5), highlighting the significant role of temperature fluctuations in shaping the genetic structure. Generally, the area with large diurnal temperature range has sufficient daytime sunshine, high temperature and strong solar radiation, which is very beneficial to the photosynthesis of plants, while low temperature at night causes weak plant respiration, less energy consumption and more organic matter accumulation (Peng et al., 2013). In China, the diurnal temperature range shows a spatial differentiation pattern of more in the northwest and less in the southeast (Kong, 2020). In addition, precipitation was also an important driving factor for genetic variation and local adaptation of N. sphaerocarpa populations, such as precipitation seasonality (bio 15; Figure 5). Water deficit was a critical condition, which imposed a strong selective pressure promoting local adaptation in plants (Biehler and Fock, 1996; Eveno et al., 2008). For Nitraria plants, water conditions (precipitation and groundwater) are the main constraints on their growth (Li et al., 2004a). The arid area of northwest China is far away from the ocean, with dry climate and scarce precipitation. There are spatial and temporal differences in rainfall, mainly concentrated in summer. The average annual precipitation is about 156.36 mm. Among them, the average annual precipitation in the Tarim Basin in southern Xinjiang is only 74.2 mm (Chen et al., 2023). To adapt to the geographical changes of these ecological factors, the population of N. sphaerocarpa has evolved a matching adaptive genetic variation distribution pattern under the action of local adaptation. Finally, the adverse effects of climate change on desert plants will largely depend on the capacity of plants to tolerate temperature and precipitation changes. In sharp contrast, the niche differentiation of the N. sphaerocarpa appears to be more strongly driven by precipitation-related variables rather than temperature (Figure 7). This difference reveals the distinct dimensions of environmental adaptation in N. sphaerocarpa, as reflected in genetic variation and niche differentiation: the former captures historical evolutionary responses at the genomic level, while the latter represents contemporary distribution patterns constrained by climatic suitability. Collectively, these findings underscore the dual role of temperature and precipitation in shaping the adaptive of N. sphaerocarpa.
Taken together, there are two main modes to construct the fragmented distribution pattern of N. sphaerocarpa populations. The first mode involves the formation of fragmented distribution pattern. N. sphaerocarpa is widely distributed in the northwest arid area, with the drying climate during the Quaternary leading to habitat shrinkage or fragmentation. In addition, the remote distance of the distribution area and poor seed dispersal ability limit the gene flow between populations, which further aggravates the genetic differentiation between populations. The second mode focuses on the maintenance of the fragmented distribution pattern. Climate change poses challenges for organism growth, particularly for desert plants. Precipitation and temperature have been identified as being primary drivers of local adaptation and species distribution limitations, similar to findings in Stipa breviflora (Yan et al., 2023). so that N. sphaerocarpa still exhibits a fragmented spatial genetic pattern. Overall, historical climatic changes appear to have played a dominant role in the formation of the fragmented distribution pattern of N. sphaerocarpa, while contemporary climate variability may be more influential in its maintenance. Future research could further clarify the relative contributions of historical and modern climatic factors across different spatial scales by integrating high-resolution geographic, climatic, and paleoenvironmental data, combined with spatial modeling and experimental validation.
4.2 Genetic mechanism of N. sphaerocarpa populations adaptation to environment
Throughout the course of species evolution, plants have developed a set of mechanisms to adapt to heterogeneous environments. Firstly, leaf morphology is particularly responsive to environmental variation and has demonstrated substantial plasticity during the course of plant evolution. Thus, the morphological characteristics of leaves serve as a vital indicator of how plants have adapted to different environmental conditions (Gielwanowska et al., 2005; Kröber et al., 2015). For instance, in arid environments, various plant species exhibit distinct morphological adaptations. N. tangutorum reduced leaf length, leaf and epidermal cell thickness (Zhao et al., 2020), while N. sibirica adjusted by sinking and shrinking stomata and thickening the cuticle of leaves. Second, in terms of physiological adaptation mechanism, N. tangutorum and Caragana microphylla Lam. adapted to arid environment by increasing C and N contents of leaves (Xu et al., 2021; Li et al., 2023b). Nitraria sibirica promoted the accumulation of main osmotic adjustment substances (soluble sugar and proline) for osmotic regulation to adapt to arid saline-alkali environment (Li et al., 2019). Finally, based on transcriptome technology, some studies have shown that NtCBL1 gene (Nicotiana tabacum Calcineurin B-like protein 1) may be involved in the response of N. tangutorum to salt and drought stress, while NtCBL2 gene (Nicotiana tabacum Calcineurin B-like protein 2) plays a role under cold stress (Li et al., 2021). The genome-wide identification and bioinformatics analysis of the glutathione peroxidases (GPX) family of N. sibirica under salt stress showed that the expression of GPX gene was enhanced, the activity of glutathione peroxidase was increased, and the excessive ROS was eliminated, thereby enhancing the salt tolerance of plants (Lian et al., 2023).
There are few studies on the genetic adaptation mechanism of N. sphaerocarpa populations to heterogeneous environment. In this study, LFMM and RDA analysis showed that 3 out of 22 adaptive SNP loci were successfully aligned with functional genes related to plant biological processes and metabolic pathways (Table 2). Among them, protein phosphatase 2C (PP2C) have obvious regulation on abiotic stresses such as drought (Bhaskara et al., 2017), cold stress (Lenka et al., 2018) and salt stress (Manabe et al., 2008). In Arabidopsis, AtPP2CG1 was found to regulate salt stress in an ABA-dependent manner (Liu et al., 2012). In addition, studies have shown that PP2C can respond to drought and salt stress in crops (Li et al., 2013b; He et al., 2019; Yu et al., 2020). Therefore, PP2C members can indirectly regulate the growth and development of plants. Based on the candidate genes identified in this study, preliminary evidence suggests that physiological adaptation may be a main mechanism by which N. sphaerocarpa responds to environmental stress. However, due to the limited functional annotation of the candidate loci, further studies are required to validate the functions of these genes in order to elucidate the primary mechanisms underlying local adaptation in N. sphaerocarpa. This study analyzed the mechanism of N. sphaerocarpa adaptation to environment, aiming to establish a theoretical framework for understanding the molecular genetic processes involved in the plant’s local adaptive evolution driven by environmental factors.
5 Conclusions
In summary, this study focused on population genetic structure and local adaptation of N. sphaerocarpa, a superxerophytic constructive species in arid northwestern China. Using population genomics and landscape genomics analysis methods, the research aimed to elucidate the regulatory mechanism in the adaptive evolution of N. sphaerocarpa populations. The analysis revealed that an increasing genetic diversity of populations was shown from west to east. The 20 populations gathered into four lineages that originated during the Pleistocene period. Both geographical and environmental distances significantly impacted genetic distance, suggesting that long geographical distances played a key role in the genetic differentiation and fragmented distribution of N. sphaerocarpa populations. The primary environmental adaptation pressures faced by N. sphaerocarpa was from fluctuations in temperature and precipitation conditions. Physiological mechanism likely serving as the important mechanism for adapting to environmental stress.
Data availability statement
The datasets presented in this study can be found in online repositories. The names of the repository/repositories and accession number(s) can be found below: https://ngdc.cncb.ac.cn/gsa, CRA017020.
Author contributions
WM: Data curation, Validation, Methodology, Visualization, Writing – original draft, Formal analysis, Investigation, Software. YL: Methodology, Conceptualization, Writing – review & editing, Supervision. HZ: Conceptualization, Investigation, Writing – review & editing, Data curation, Supervision, Project administration, Resources, Funding acquisition, Methodology, Software. HT: Investigation, Writing – review & editing. JZ: Investigation, Writing – review & editing.
Funding
The author(s) declare financial support was received for the research and/or publication of this article. This research was financially supported by the Third Xinjiang Scientific Expedition Program (grant number: 2022xjkk0202 and 2022xjkk1405), the National Natural Science Foundation of China (grant number: 32170391), and “Western Light” program of the Chinese Academy of Sciences (grant number: 2022-XBQNXZ-007).
Acknowledgments
The authors grateful to “Western Light” program of the Chinese Academy of Sciences, the National Natural Science Foundation of China, and the Third Xinjiang Scientific Expedition Program for providing funding. We also appreciate the resources provided by our instructors and the efforts of all the authors. Additionally, we thank the reviewers for their constructive comments and recommendations, which have greatly contributed to improving the quality of our article.
Conflict of interest
The authors declare that the research was conducted in the absence of any commercial or financial relationships that could be construed as a potential conflict of interest.
Generative AI statement
The author(s) declare that no Generative AI was used in the creation of this manuscript.
Any alternative text (alt text) provided alongside figures in this article has been generated by Frontiers with the support of artificial intelligence and reasonable efforts have been made to ensure accuracy, including review by the authors wherever possible. If you identify any issues, please contact us.
Publisher’s note
All claims expressed in this article are solely those of the authors and do not necessarily represent those of their affiliated organizations, or those of the publisher, the editors and the reviewers. Any product that may be evaluated in this article, or claim that may be made by its manufacturer, is not guaranteed or endorsed by the publisher.
Supplementary material
The Supplementary Material for this article can be found online at: https://www.frontiersin.org/articles/10.3389/fpls.2025.1623235/full#supplementary-material
References
Ahrens, C. W., Byrne, M., and Rymer, P. D. (2019). Standing genomic variation within coding and regulatory regions contributes to the adaptive capacity to climate in a foundation tree species. Mol. Ecol. 28, 2502–2516. doi: 10.1111/mec.15092
Alexander, D. H., Novembre, J., and Lange, K. (2009). Fast model-based estimation of ancestry in unrelated individuals. Genome Res. 19, 1655–1664. doi: 10.1101/gr.094052.109
Andrews, K. R., Good, J. M., Miller, M. R., Luikart, G., and Hohenlohe, P. A. (2016). Harnessing the power of RADseq for ecological and evolutionary genomics. Nat. Rev. Genet. 17, 81–92. doi: 10.1038/nrg.2015.28
Araújo, M. B. and Rahbek, C. (2006). How does climate change affect biodiversity? Science 313, 1396–1397. doi: 10.1126/science.1131758
Bai, W. N., Yan, P. C., Zhang, B. W., Woeste, K. E., Lin, K., and Zhang, D. Y. (2018). Demographically idiosyncratic responses to climate change and rapid Pleistocene diversification of the walnut genus Juglans (Juglandaceae) revealed by whole-genome sequences. New Phytol. 217, 1726–1736. doi: 10.1111/nph.14917
Baughman, O. W., Agneray, A. C., Forister, M. L., Kilkenny, F. F., Espeland, E. K., Fiegener, R., et al. (2019). Strong patterns of intraspecific variation and local adaptation in Great Basin plants revealed through a review of 75 years of experiments. Ecol. Evol. 9, 6259–6275. doi: 10.1002/ece3.5200
Bhaskara, G. B., Wen, T. N., Nguyen, T. T., and Verslues, P. E. (2017). Protein phosphatase 2Cs and microtubule-associated stress protein 1 control microtubule stability, plant growth, and drought response. Plant Cell. 29, 169–191. doi: 10.1105/tpc.16.00847
Biehler, K. and Fock, H. (1996). Evidence for the contribution of the mehler-peroxidase reaction in dissipating excess electrons in drought-stressed wheat. Plant Physiol. 112, 265–272. doi: 10.1104/pp.112.1.265
Bougeois, L., Dupont-Nivet, G., de Rafélis, M., Tindall, J. C., Proust, J. N., Reichart, G. J., et al. (2018). Asian monsoons and aridification response to Paleogene sea retreat and Neogene westerly shielding indicated by seasonality in Paratethys oysters. Earth Planet Sc Lett. 485, 99–110. doi: 10.1016/j.epsl.2017.12.036
Brown, J. L., Hill, D. J., Dolan, A. M., Carnaval, A. C., and Haywood, A. M. (2018). PaleoClim, high spatial resolution paleoclimate surfaces for global land areas. Sci. Data. 5, 180254. doi: 10.1038/sdata.2018.254
Catchen, J. M., Amores, A., Hohenlohe, P., Cresko, W., and Postlethwait, J. H. (2011). Stacks: building and genotyping loci de novo from short-read sequences. G3-Genes Genom Genet. 1, 171–182. doi: 10.1534/g3.111.000240
Chen, Y., Li, Z., Xu, J., Shen, Y., Xing, X., Xie, T., et al. (2023). Changes and protection suggestions in water resources and ecological environment in arid region of northwest China. Bull. Chin. Acad. Sci. 38, 385–393. doi: 10.16418/j.issn.1000-3045.20230120005
Chen, Y., Mao, Z., Li, Z., and Fan, K. (2021). Research status and progress in structure and function of protein phosphatase 2C in plants. J. Zhejiang University. Agric. Life Sci. 47, 11–20.
Cheng, L., Que, X.e., Yang, L., Yao, X., and Lu, Q. (2020). China’s desert ecosystem: functions rising and services enhancing. Bull. Chin. Acad. Sci. 35, 690–698. doi: 10.16418/j.issn.1000-3045.20200430001
Cornuet, J. M., Santos, F., Beaumont, M. A., Robert, C. P., Marin, J. M., Balding, D. J., et al. (2008). Inferring population history with DIY ABC: a user-friendly approach to approximate Bayesian computation. Bioinformatics 24, 2713–2719. doi: 10.1093/bioinformatics/btn514
Cushman, S. A., Shirk, A. J., Howe, G. T., Murphy, M. A., Dyer, R. J., and Joost, S. (2018). Editorial: the least cost path from landscape genetics to landscape genomics: challenges and opportunities to explore NGS data in a spatially explicit context. Front. Genet. 9. doi: 10.3389/fgene.2018.00215
Danecek, P., Auton, A., Abecasis, G., Albers, C. A., Banks, E., DePristo, M. A., et al. (2011). The variant call format and VCFtools. Bioinformatics 27, 2156–2158. doi: 10.1093/bioinformatics/btr330
Dang, R., Pan, X., and Gu, X. (2002). Floristic analysis of spermatophyte genera in the arid deserts area in North-West China. Guihaia 22, 121–128.
DePristo, M. A., Banks, E., Poplin, R., Garimella, K. V., Maguire, J. R., Hartl, C., et al. (2011). A framework for variation discovery and genotyping using next-generation DNA sequencing data. Nat. Genet. 43, 491–498. doi: 10.1038/ng.806
Di Pierro, E. A., Mosca, E., González-Martínez, S. C., Binelli, G., Neale, D. B., and La Porta, N. (2017). Adaptive variation in natural Alpine populations of Norway spruce (Picea abies [L.] Karst) at regional scale: Landscape features and altitudinal gradient effects. For. Ecol. Manage. 405, 350–359. doi: 10.1016/j.foreco.2017.09.045
Dixon, P. (2003). VEGAN, a package of R functions for community ecology. J. Veg. Sci. 14, 927–930. doi: 10.1111/j.1654-1103.2003.tb02228.x
Dormann, C. F., Elith, J., Bacher, S., Buchmann, C., Carl, G., Carré, G., et al. (2013). Collinearity: a review of methods to deal with it and a simulation study evaluating their performance. Ecography 36, 27–46. doi: 10.1111/j.1600-0587.2012.07348.x
Ellegren, H. (2014). Genome sequencing and population genomics in non-model organisms. Trends Ecol. Evol. 29, 51–63. doi: 10.1016/j.tree.2013.09.008
Ellis, N., Smith, S. J., and Pitcher, C. R. (2012a). Gradient forests: calculating importance gradients on physical predictors. Ecology 93, 156–168. doi: 10.1890/11-0252.1
Ellis, N., Smith, S. J., and Pitcher, C. R. (2012b). gradientForest: Random Forest functions for the Census of Marine Life synthesis project (Vienna, Austria: R Foundation for Statistical Computing).
Emerson, K. J., Merz, C. R., Catchen, J. M., Hohenlohe, P. A., Cresko, W. A., Bradshaw, W. E., et al. (2010). Resolving postglacial phylogeography using high-throughput sequencing. P Natl. Acad. Sci. U.S.A. 107, 16196–16200. doi: 10.1073/pnas.1006538107
Eveno, E., Collada, C., Guevara, M. A., Léger, V., Soto, A., Díaz, L., et al. (2008). Contrasting patterns of selection at Pinus pinaster Ait. drought stress candidate genes as revealed by genetic differentiation analyses. Mol. Biol. Evol. 25, 417–437. doi: 10.1093/molbev/msm272
Excoffier, L. and Lischer, H. E. L. (2010). Arlequin suite ver 3.5: a new series of programs to perform population genetics analyses under Linux and Windows. Mol. Ecol. Resour. 10, 564–567. doi: 10.1111/j.1755-0998.2010.02847.x
Fournier-Level, A., Korte, A., Cooper, M. D., Nordborg, M., Schmitt, J., and Wilczek, A. M. (2011). A map of local adaptation in Arabidopsis thaliana. Science 334, 86–89. doi: 10.1126/science.1209271
Frichot, E. and François, O. (2015). LEA: An R package for landscape and ecological association studies. Methods Ecol. Evol. 6, 925–929. doi: 10.1111/2041-210x.12382
Frichot, E., Schoville, S. D., Bouchard, G., and François, O. (2013). Testing for associations between loci and environmental gradients using latent factor mixed models. Mol. Biol. Evol. 30, 1687–1699. doi: 10.1093/molbev/mst063
Fu, R., Zhu, Y., Liu, Y., Yang, Z., Lu, R., Qiu, Y., et al. (2023). Global and local adaptation to aridity in a desert plant Gymnocarpos przewalskii. bioRxiv, 553124. doi: 10.1101/2023.08.13.553124
Gielwanowska, I., Szczuka, E., Bednara, J., and Górecki, R. (2005). Anatomical features and ultrastructure of Deschampsia Antarctica (Poaceae) leaves from different growing habitats. Ann. Bot. 96, 1109–1119. doi: 10.1093/aob/mci262
Gugger, P. F., Fitz-Gibbon, S. T., Albarrán-Lara, A., Wright, J. W., and Sork, V. L. (2021). Landscape genomics of Quercus lobata reveals genes involved in local climate adaptation at multiple spatial scales. Mol. Ecol. 30, 406–423. doi: 10.1111/mec.15731
Guo, Z. T., Peng, S. Z., Hao, Q. Z., Chen, X. H., and Liu, T. S. (1999). Late Tertiary development of aridification in northwestern China: link with the arctic ice-sheet formation and Tibetan uplifts. Quaternary Sci. 6), 556–567.
Guu, Y. P., Zhang, R., Chen, C. Y., Zhou, D. W., and Liu, J. Q. (2010). Allopatric divergence and regional range expansion of Juniperus sabina in China. J. Syst. Evol. 48, 153–160. doi: 10.1111/j.1759-6831.2010.00073.x
He, Z. H., Wu, J. F., Sun, X. P., and Dai, M. Q. (2019). The maize clade A PP2C phosphatases play critical roles in multiple abiotic stress responses. Int. J. Mol. Sci. 20, 3573. doi: 10.3390/ijms20143573
Hewitt, G. M. (2004). Genetic consequences of climatic oscillations in the Quaternary. Philos. T R Soc. B. 359, 183–195. doi: 10.1098/rstb.2003.1388
Hijmans, R. J. (2024). geosphere: Spherical Trigonometry (Vienna, Austria: R Foundation for Statistical Computing).
Hijmans, R. J. and Etten, J. V. (2010). Raster: geographic analysis and modeling with raster data (Vienna, Austria: R Foundation for Statistical Computing).
Hoban, S., Kelley, J. L., Lotterhos, K. E., Antolin, M. F., Bradburd, G., Lowry, D. B., et al. (2016). Finding the genomic basis of local adaptation: pitfalls, practical solutions, and future directions. Am. Nat. 188, 379–397. doi: 10.1086/688018
Hu, H. W., Wei, Y. Q., Wang, W. Y., and Wang, C. Y. (2021). The influence of climate change on three dominant alpine species under different scenarios on the Qinghai-Tibetan plateau. Diversity-Basel 13, 682. doi: 10.3390/d13120682
Huerta-Cepas, J., Szklarczyk, D., Heller, D., Hernández-Plaza, A., Forslund, S. K., Cook, H., et al. (2019). eggNOG 5.0: a hierarchical, functionally and phylogenetically annotated orthology resource based on 5090 organisms and 2502 viruses. Nucleic Acids Res. 47, D309–D314. doi: 10.1093/nar/gky1085
Jeffries, D. L., Copp, G. H., Handley, L. L., Olsén, K. H., Sayer, C. D., and Hänfling, B. (2016). Comparing RADseq and microsatellites to infer complex phylogeographic patterns, an empirical perspective in the Crucian carp, Carassius carassius, L. Mol. Ecol. 25, 2997–3018. doi: 10.1111/mec.13613
Jia, H. X., Liu, G. J., Li, J. B., Zhang, J., Sun, P., Zhao, S. T., et al. (2020). Genome resequencing reveals demographic history and genetic architecture of seed salinity tolerance in Populus euphratica. J. Exp. Bot. 71, 4308–4320. doi: 10.1093/jxb/eraa172
Jia, S. W. and Zhang, M. L. (2021). Introgression of phylogeography lineages of Convolvulus gortschakovii (Convolvulaceae) in the northwest China. Plant Syst. Evol. 307, 19. doi: 10.1007/s00606-020-01734-z
Joost, S., Bonin, A., Bruford, M. W., Despres, L., Conord, C., Erhardt, G., et al. (2007). A spatial analysis method (SAM) to detect candidate loci for selection: towards a landscape genomics approach to adaptation. Mol. Ecol. 16, 3955–3969. doi: 10.1111/j.1365-294X.2007.03442.x
Kawecki, T. J. and Ebert, D. (2004). Conceptual issues in local adaptation. Ecol. Lett. 7, 1225–1241. doi: 10.1111/j.1461-0248.2004.00684.x
Kong, F. (2020). Spatial and temporal variation characteristics and regional differences of days of diurnal temperature range in China from 1961 to 2018. J. Zhejiang University. Sci. Edition. 47, 422–434.
Kröber, W., Heklau, H., and Bruelheide, H. (2015). Leaf morphology of 40 evergreen and deciduous broadleaved subtropical tree species and relationships to functional ecophysiological traits. Plant Biol. 17, 373–383. doi: 10.1111/plb.12250
Leimu, R. and Fischer, M. (2008). A meta-analysis of local adaptation in plants. PloS One 3, e4010. doi: 10.1371/journal.pone.0004010
Lenka, S. K., Muthusamy, S. K., Chinnusamy, V., and Bansal, K. C. (2018). Ectopic expression of rice PYL3 enhances cold and drought tolerance in Arabidopsis thaliana. Mol. Biotechnol. 60, 350–361. doi: 10.1007/s12033-018-0076-5
Li, Z. H., Chen, J., Zhao, G. F., Guo, Y. P., Kou, Y. X., Ma, Y. Z., et al. (2012). Response of a desert shrub to past geological and climatic change: A phylogeographic study of Reaumuria soongarica (Tamaricaceae) in western China. J. Syst. Evol. 50, 351–361. doi: 10.1111/j.1759-6831.2012.00201.x
Li, L. F., Cushman, S. A., He, Y. X., and Li, Y. (2020). Genome sequencing and population genomics modeling provide insights into the local adaptation of weeping forsythia. Hortic. Res. 7, 130. doi: 10.1038/s41438-020-00352-7
Li, C., Dong, S., Beckles, D. M., Liu, X., Guan, J., Gu, X., et al. (2023a). GWAS reveals novel loci and identifies a pentatricopeptide repeat-containing protein (CsPPR) that improves low temperature germination in cucumber. Front. Plant Sci. 14. doi: 10.3389/fpls.2023.1116214
Li, H. and Durbin, R. (2009). Fast and accurate short read alignment with Burrows-Wheeler transform. Bioinformatics 25, 1754–1760. doi: 10.1093/bioinformatics/btp324
Li, Q., He, Z., Zhao, W., and Li, Q. (2004a). Spatial pattern of Nitraria sphaerocarpa population and dynamics in different habitats. J. Desert Res. 24, 484–488.
Li, R., Shan, L., Xie, T., Ma, L., Yang, J., and Li, Q. (2023b). Variation in the leaf functional traits of typical desert shrubs under precipitation gradient. Arid Zone Res. 40, 425–435. doi: 10.13866/j.azr.2023.03.09
Li, Y. S., Sun, H., Wang, Z. F., Duan, M., Huang, S. D., Yang, J., et al. (2013b). A novel nuclear protein phosphatase 2C negatively regulated by ABL1 is involved in abiotic stress and panicle development in rice. Mol. Biotechnol. 54, 703–710. doi: 10.1007/s12033-012-9614-8
Li, Q., Xu, J., Gao, T., Yan, X., and Xin, Z. (2013a). Breeding system characteristics, blooming and fruiting habits of Nitraria L. J. North-East Forestry University. 41, 68–71,97. doi: 10.13759/j.cnki.dlxb.2013.09.029
Li, H., Yang, X., Tang, X., and Zhang, H. (2019). Effects of NaCl stress on main osmoregulation substance and hormones contents of Nitraria sibirica pall. Leaves. J. North-East Forestry University. 47, 30–35. doi: 10.13759/j.cnki.dlxb.2019.05.007
Li, Y., Zhang, X. X., Mao, R. L., Yang, J., Miao, C. Y., Li, Z., et al. (2017). Ten years of landscape genomics: challenges and opportunities. Front. Plant Sci. 8. doi: 10.3389/fpls.2017.02136
Li, Q., Zhao, W., Li, Q., and Chang, X. (2004b). Responses of Nitraria sphaerocarpa Maxim. Population to disturbance of blown sand in the edge of Desert Oasis. Acta Ecologica Sinica. 24, 2484–2491.
Li, M., Zhu, L., Huo, J., Zhang, J., Shi, J., and Cheng, T. (2021). Cloning and expression analyses of NtCBL1, NtCBL2 gene of Nitraria tangutorum. J. Nanjing Forestry University. Natural Sci. Edition. 45, 93–99.
Li, J. X., Zhu, X. H., Li, Y., Liu, Y., Qian, Z. H., Zhang, X. X., et al. (2018). Adaptive genetic differentiation in Pterocarya stenoptera (Juglandaceae) driven by multiple environmental variables were revealed by landscape genomics. BMC Plant Biol. 18, 306. doi: 10.1186/s12870-018-1524-x
Lian, Z. M., Zhang, J. B., Hao, Z. D., Zhu, L. M., Liu, Y. X., Fang, H., et al. (2023). The Glutathione Peroxidase Gene Family in Nitraria sibirica: Genome-Wide Identification, Classification, and Gene Expression Analysis under Stress Conditions. Genes-Basel 14, 950. doi: 10.3390/genes14040950
Liu, J. Q., Wang, Y. J., Wang, A. L., Hideaki, O., and Abbott, R. J. (2006). Radiation and diversifcation within the Ligularia-Cremanthodium-Parasenecio complex (Asteraceae) triggered by uplift of the QinghaiTibetan Plateau. Mol. Phylogenet. Evol. 38, 31–49. doi: 10.1016/j.ympev.2005.09.010
Liu, X., Zhu, Y. M., Zhai, H., Cai, H., Ji, W., Luo, X., et al. (2012). AtPP2CG1, a protein phosphatase 2C, positively regulates salt tolerance of Arabidopsis in abscisic acid-dependent manner. Biochem. Bioph Res. Co. 422, 710–715. doi: 10.1016/j.bbrc.2012.05.064
Lozier, J. D. (2014). Revisiting comparisons of genetic diversity in stable and declining species: assessing genome-wide polymorphism in North American bumble bees using RAD sequencing. Mol. Ecol. 23, 788–801. doi: 10.1111/mec.12636
Luqman, H., Wegmann, D., Fior, S., and Widmer, A. (2023). Climate-induced range shifts drive adaptive response via spatio-temporal sieving of alleles. Nat. Commun. 14, 1080. doi: 10.1038/s41467-023-36631-9
Ma, X. H., Ru, D. F., Morales-Briones, D. F., Mei, F. Y., Wu, J. J., Liu, J. Q., et al. (2023). Genome sequence and salinity adaptation of the desert shrub Nitraria sibirica (Nitrariaceae, Sapindales). DNA Res. 30, dsad011. doi: 10.1093/dnares/dsad011
Ma, S. M., Zhang, M. L., and Sanderson, S. C. (2012). Phylogeography of the rare Gymnocarpos przewalskii (Caryophyllaceae): indications of multiple glacial refugia in north-western China. Aust. J. Bot. 60, 20–31. doi: 10.1071/BT11055
Maestre, F. T., Benito, B. M., Berdugo, M., Concostrina-Zubiri, L., Delgado-Baquerizo, M., Eldridge, D. J., et al. (2021). Biogeography of global drylands. New Phytol. 231, 540–558. doi: 10.1111/nph.17395
Manabe, Y., Bressan, R. A., Wang, T., Li, F., Koiwa, H., Sokolchik, I., et al. (2008). The Arabidopsis kinase-associated protein phosphatase regulates adaptation to Na+ stress. Plant Physiol. 146, 612–622. doi: 10.1104/pp.107.109009
Manel, S. and Holderegger, R. (2013). Ten years of landscape genetics. Trends Ecol. Evol. 28, 614–621. doi: 10.1016/j.tree.2013.05.012
McKenna, A., Hanna, M., Banks, E., Sivachenko, A., Cibulskis, K., Kernytsky, A., et al. (2010). The Genome Analysis Toolkit: A MapReduce framework for analyzing next-generation DNA sequencing data. Genome Res. 20, 1297–1303. doi: 10.1101/gr.107524.110
McKinney, G. J., Larson, W. A., Seeb, L. W., and Seeb, J. E. (2017). RADseq provides unprecedented insights into molecular ecology and evolutionary genetics: comment on Breaking RAD by Lowry et al., 2016). Mol. Ecol. Resour. 17, 356–361. doi: 10.1111/1755-0998.12649
Miller, M. R., Dunham, J. P., Amores, A., Cresko, W. A., and Johnson, E. A. (2007). Rapid and cost-effective polymorphism identification and genotyping using restriction site associated DNA (RAD) markers. Genome Res. 17, 240–248. doi: 10.1101/gr.5681207
Nguyen, L. T., Schmidt, H. A., von Haeseler, A., and Minh, B. Q. (2015). IQ-TREE: A fast and effective stochastic algorithm for estimating maximum-likelihood phylogenies. Mol. Biol. Evol. 32, 268–274. doi: 10.1093/molbev/msu300
Peng, S. S., Piao, S. L., Ciais, P., Myneni, R. B., Chen, A. P., Chevallier, F., et al. (2013). Asymmetric effects of daytime and night-time warming on Northern Hemisphere vegetation. Nature 501, 88–92. doi: 10.1038/nature12434
Purcell, S., Neale, B., Todd-Brown, K., Thomas, L., Ferreira, M. A. R., Bender, D., et al. (2007). PLINK: A tool set for whole-genome association and population-based linkage analyses. Am. J. Hum. Genet. 81, 559–575. doi: 10.1086/519795
Rellstab, C., Gugerli, F., Eckert, A. J., Hancock, A. M., and Holderegger, R. (2015). A practical guide to environmental association analysis in landscape genomics. Mol. Ecol. 24, 4348–4370. doi: 10.1111/mec.13322
Reynolds, J. F., Stafford Smith, D. M., Lambin, E. F., Turner, B. L., Mortimore, M., Batterbury, S. P. J., et al. (2007). Global desertification: Building a science for dryland development. Science 316, 847–851. doi: 10.1126/science.1131634
Rodriguez, P. L. (1998). Protein phosphatase 2C (PP2C) function in higher plants. Plant Mol. Biol. 38, 919–927. doi: 10.1023/A:1006054607850
Rousset, F. (1997). Genetic differentiation and estimation of gene flow from F-statistics under isolation by distance. Genetics 145, 1219–1228. doi: 10.1093/genetics/145.4.1219
Sang, Y. P., Long, Z. Q., Dan, X. M., Feng, J. J., Shi, T. T., Jia, C. F., et al. (2022). Genomic insights into local adaptation and future climate-induced vulnerability of a keystone forest tree in East Asia. Nat. Commun. 13, 6541. doi: 10.1038/s41467-022-34206-8
Savolainen, O., Lascoux, M., and Merilä, J. (2013). Ecological genomics of local adaptation. Nat. Rev. Genet. 14, 807–820. doi: 10.1038/nrg3522
Shi, Y. F., Cui, Z. J., and Su, Z. (2005). The Quaternary glaciations and environmental variations in China (Hebei: Hebei Science and Technology Publishing House).
Sork, V. L., Aitken, S. N., Dyer, R. J., Eckert, A. J., Legendre, P., and Neale, D. B. (2013). Putting the landscape into the genomics of trees: approaches for understanding local adaptation and population responses to changing climate. Tree Genet. Genomes. 9, 901–911. doi: 10.1007/s11295-013-0596-x
Su, Z. H., Lu, W., and Zhang, M. L. (2016). Phylogeographical patterns of two closely related desert shrubs, Nitraria roborowskii and N. sphaerocarpa (Nitrariaceae), from arid north-western China. Bot. J. Linn Soc 180, 334–347. doi: 10.1111/boj.12376
Su, Z. H. and Zhang, M. L. (2013). Evolutionary response to Quaternary climate aridification and oscillations in north-western China revealed by chloroplast phylogeography of the desert shrub Nitraria sphaerocarpa (Nitrariaceae). Bot. J. Linn Soc 109, 757–770. doi: 10.1111/bij.12088
Su, Z. H., Zhang, M. L., and Cohen, J. I. (2012). Phylogeographic and demographic effects of Quaternary climate oscillations in Hexinia polydichotoma (Asteraceae) in Tarim Basin and adjacent areas. Plant Syst. Evol. 298, 1767–1776. doi: 10.1007/s00606-012-0677-6
Su, Z. H., Zhang, M. L., and Sanderson, S. C. (2011). Chloroplast phylogeography of Helianthemum songaricum (Cistaceae) from northwestern China: implications for preservation of genetic diversity. Conserv. Genet. 12, 1525–1537. doi: 10.1007/s10592-011-0250-9
Wang, Y., Hu, Y., and Zhang, T. (2014). Current status and perspective of RAD-seq in genomic research. Yichuan 36, 41–49. doi: 10.3724/SP.J.1005.2014.0041
Wang, L. X., Jiao, W. Z., MacBean, N., Rulli, M. C., Manzoni, S., Vico, G., et al. (2022b). Dryland productivity under a changing climate. Nat. Clim. Change 12, 981–994. doi: 10.1038/s41558-022-01499-y
Wang, F., Lai, H. X., Li, Y. B., Feng, K., Zhang, Z. Z., Tian, Q. Q., et al. (2022a). Dynamic variation of meteorological drought and its relationships with agricultural drought across China. Agr Water Manage. 261, 107301. doi: 10.1016/j.agwat.2021.107301
Wang, S., Li, Q., Xu, J., Gao, T., and Xin, Z. (2012). Experimental research on the pollination characteristics of 4 plant species of genus Nitraria L. J. Biol. 29, 49–51,75.
Wang, J., Wu, Y. X., Ren, G. P., Guo, Q. H., Liu, J. Q., and Lascoux, M. (2011). Genetic Differentiation and Delimitation between Ecologically Diverged Populus euphratica and P. pruinosa. PloS One 6, e26530. doi: 10.1371/journal.pone.0026530
Willis, K. and Niklas, K. (2004). The role of Quaternary environmental change in plant macroevolution: the exception or the rule? Philos. T R Soc. B. 359, 159–172. doi: 10.1098/rstb.2003.1387
Xu, X. K., Kleidon, A., Miller, L., Wang, S. Q., Wang, L. Q., and Dong, G. C. (2010). Late Quaternary glaciation in the Tianshan and implications for palaeoclimatic change: a review. Boreas 39, 215–232. doi: 10.1111/j.1502-3885.2009.00118.x
Xu, H., Yu, F., Jia, C., Zhang, G., and Li, H. (2021). Leaf stoichiometric traits of Caragana microphyllain the shrub encroached grassland. Acta Agrestia Sinica. 29, 2191–2199.
Yan, D. Q., Liu, J. M., Fan, Y. Y., Lian, Z., Dang, Z. H., and Niu, J. M. (2023). Genomic insights into genetic diversity and local adaptation of a dominant desert steppe feather grass, Stipa breviflora Griseb. Front. Plant Sci. 14. doi: 10.3389/fpls.2023.1170075
Yan, H., Zhang, Y.-L., Ma, S.-M., Wang, C.-C., and Zhang, D. (2021). Suitable distribution simulation and local environmental adaptability differentiation of Lycium ruthenicum in Xinjiang, China. Chin. J. Plant Ecol. 45, 1221–1230. doi: 10.17521/cjpe.2021.0179
Yang, J. A., Lee, S. H., Goddard, M. E., and Visscher, P. M. (2011a). GCTA: A tool for genome-wide complex trait analysis. Am. J. Hum. Genet. 88, 76–82. doi: 10.1016/j.ajhg.2010.11.011
Yang, X. P., Scuderi, L., Paillou, P., Liu, Z. T., Li, H. W., and Ren, X. Z. (2011b). Quaternary environmental changes in the drylands of China - A critical review. Quaternary Sci. Rev. 30, 3219–3233. doi: 10.1016/j.quascirev.2011.08.009
Yu, X. F., Han, J. P., Li, L., Zhang, Q., Yang, G. X., and He, G. Y. (2020). Wheat PP2C-a10 regulates seed germination and drought tolerance in transgenic Arabidopsis. Plant Cell Rep. 39, 635–651. doi: 10.1007/s00299-020-02520-4
Zhang, H. X., Li, X. S., Wang, J. C., and Zhang, D. Y. (2021). Insights into the aridification history of Central Asian Mountains and international conservation strategy from the endangered wild apple tree. J. Biogeogr. 48, 332–344. doi: 10.1111/jbi.13999
Zhang, H. X., Wang, Q., and Jia, S. W. (2020). Genomic Phylogeography of Gymnocarpos przewalskii (Caryophyllaceae): Insights into Habitat Fragmentation in Arid Northwestern China. Diversity-Basel 12, 335. doi: 10.3390/d12090335
Zhang, H., Wen, Z., and Wang, Q. (2022). Population genetic structure of Malus sieversii and environmental adaptations. Chin. J. Plant Ecol. 46, 1098–1108. doi: 10.17521/cjpe.2022.0024
Zhang, H. and Zheng, T. (2020). Effect of habitat fragmentation on the population genetic structure of Malus sieversii. Arid Zone Res. 37, 715–721. doi: 10.13866/j.azr.2020.03.20
Zhao, Q. and Assoc Comput, M. (2018). “A Study on Optimizing Mark Duplicate in Genome Sequencing Pipeline.” in ICBRA 2018: Proceedings of 2018 5th International Conference on Bioinformatics Research and Applications. 8-15. doi: 10.1145/3309129.3309134
Zhao, X., Li, X., Guo, L., and Gao, Y. (2020). Regional and environmental differentiation of leaf morphology and anatomical structure of Nitraria tangutorum. J. Arid Land Resour. Environment. 34, 143–150. doi: 10.13448/j.cnki.jalre.2020.252
Keywords: N. sphaerocarpa, ddRAD-seq, fragmented distributions, population genetics, environmental association analysis, environmental adaptive loci
Citation: Ma W, Zhang J, Tian H, Li Y and Zhang H (2025) Genetic structure and local adaptation of Nitraria sphaerocarpa populations from arid northwestern China. Front. Plant Sci. 16:1623235. doi: 10.3389/fpls.2025.1623235
Received: 05 May 2025; Accepted: 05 August 2025;
Published: 03 September 2025.
Edited by:
Mi-Jeong Yoo, Clarkson University, United StatesReviewed by:
Feifei Li, China National Botanical Garden (North Garden), ChinaMarilyn Vásquez-Cruz, Instituto Tecnológico Superior de Irapuato, Mexico
Copyright © 2025 Ma, Zhang, Tian, Li and Zhang. This is an open-access article distributed under the terms of the Creative Commons Attribution License (CC BY). The use, distribution or reproduction in other forums is permitted, provided the original author(s) and the copyright owner(s) are credited and that the original publication in this journal is cited, in accordance with accepted academic practice. No use, distribution or reproduction is permitted which does not comply with these terms.
*Correspondence: Yan Li, bGl5YW4xMDA2QHhqdS5lZHUuY24=; Hongxiang Zhang, emhhbmdoeDU2MUBtcy54amIuYWMuY24=