 Rui An
 Yingtong Huang
 Chunxia Lei
 Chunjie Fan
 Jianmei Long
- 1Guangdong Key Laboratory for Innovative Development and Utilization of Forest Plant Germplasm, College of Forestry and Landscape Architectures, South China Agricultural University, Guangzhou, China
- 2State Key Laboratory of Tree Genetics and Breeding, Key Laboratory of State Forestry and Grassland Administration on Tropical Forestry, Research Institute of Tropical Forestry, Chinese Academy of Forestry, Guangzhou, China
Introduction: The cellulose synthase gene superfamily is composed of two major gene families: cellulose synthase (CesA) and cellulose synthase-like (Csl). These genes play a crucial role in the synthesis of cellulose and hemicellulose within the plant cell wall, and are essential for controlling plant growth and development. However, the CesA/Csls gene family has not been previously reported in Eucalyptus grandis.
Methods: In this study, bioinformatics methods were employed to identify the CesA/Csls gene family inE. grandisand to analyze the potential functions of its members in cell wall formation.
Results: The results revealed that there were 62 CesA/Csls family members inE. grandis, which were classified into seven subfamilies (CesA, CslA, CslB, CslC, CslD, CslE, CslG) based on evolutionary tree analysis. Promoter regions of these genes contained various cis-acting elements, with light-responsive elements being the most abundant. Gene expression pattern analysis showed that EgCesA4, EgCesA7, and EgCesA8 were highly expressed in the xylem, suggesting their primary association with cellulose synthesis during secondary wall thickening (lignification).
Discussion: Overall, the analysis of the EgCesA/Csls gene family provides a valuable reference for understanding cellulose synthesis in the cell wall, genetic improvement, and biotechnological applications.
1 Introduction
The cell wall, a key structural component of plant cells, was essential for regulating cell morphology, driving growth and development, and enabling cell expansion (Persson et al., 2007a). Cellulose, hemicellulose and pectin were the principal components of primary cell walls, while cellulose, hemicellulose and lignin were the principal components of secondary cell walls (Burton et al., 2010). It was evident that cellulose performed a pivotal function in processes such as cell growth, differentiation and signaling. In addition, hemicellulose had been observed to interact closely with cellulose microfibrils through hydrogen bonding (Welker et al., 2015).
Glycosyltransferases (GTs) are enzymes that catalyze the transfer of an activated sugar group to an acceptor substrate, which may consist of polysaccharides, peptides, lipids, or small molecules (Zabotina et al., 2021). Cellulose, hemicellulose, pectin, and lignin are the major polysaccharides in plants (Li et al., 2020). The cellulose synthase gene superfamily is a group of type-two glycosyltransferases (GT2), which is the largest family within GTs (Aspeborg et al., 2005). This superfamily could be further divided into two subfamilies: cellulose synthase (CesA) and nine cellulose synthase-like (Csl) subfamilies (CslA/B/C/D/E/F/G/H/J) (Yin et al., 2009, 2014). Cellulose was primarily synthesized by CesA (cellulose synthase), while some hemicelluloses were synthesized with the involvement of Csls (cellulose synthase-like proteins) (Yin et al., 2014). A new CslM subfamily had been identified in other flowering plants (Farrokhi et al., 2006; Little et al., 2018). Available studies had shown that the CslA gene was involved in the biosynthesis of the mannan and glucomannan backbone (Liepman et al., 2005; Goubet et al., 2009). The CslC genes, on the other hand, were responsible for the biosynthesis of the β-1,4-glucan backbone for xyloglucan synthesis (Cocuron et al., 2007). The Cs1D gene might be involved in the synthesis of cellulose or mannan in tip-growing cells (Park et al., 2011; Yin et al., 2011; Yang et al., 2020). In contrast, the CslF, CslH, and CslJ subfamilies catalyzed the biosynthesis of (1,3;1,4)-β-glucan, which were polymers commonly referred to as mixed ligated glucan (MLG) (Doblin et al., 2009; Vega-Sánchez et al., 2012; Little et al., 2019; Lou et al., 2022). However, the specific functions of the other four Csl subfamily members (CslB, CslE, CslG and CslM) remained to be elucidated.
The CesA/Csl gene families play a pivotal role in plant cell wall biosynthesis by mediating the synthesis of both cellulose and hemicellulose polysaccharides (McFarlane et al., 2014). In A. thaliana, AtCesA1, AtCesA3 and CesA6-like genes (AtCesA2/5/6/9) had been reported to be involved in primary wall cellulose synthesis, whereas the AtCesA4, AtCesA7 and AtCesA8 genes were responsible for secondary wall cellulose synthesis (Sod et al., 2023). Multiple CesA proteins assembled into the cellulose synthase complex CesA complexe (CSC), which was responsible for cellulose synthesis (Zhang et al., 2021). Csls, a member of the cellulose synthase superfamily, shared high sequence similarity with the CesA gene family.
CesA/Csl played a crucial role in plant growth and development (Polko and Kieber, 2019). For instance, the impairment of rice OsCSLD4 function resulted in a reduction of grain width and weight, whereas the overexpression of OsCSLD4 led to an increase in both grain width and weight (Zhao et al., 2022). The knockdown of HvCslF3 from barley through RNA interference resulted in a decrease in root growth rate, which was associated with a reduced elongation zone and a marked reduction in the root system (Lou et al., 2022). The PbrMADS52-PbrCSLD5 signaling pathway resulted in an elevated cellulose content within the cell wall of pear pollen tubes, consequently hindering the growth of the pollen tubes in Pyrus bretschneideri (Li et al., 2022). Likewise, the single mutants csld1 and csld4, as well as the double mutant csld1/csld4 in Arabidopsis, exhibited highly irregular pollen tube growth. This abnormality led to a substantial decrease in cellulose accumulation within the pollen tube wall and a pronounced disorganization of the pollen tube wall layers, ultimately impairing the genetic transmission of male gametophytes (Wang et al., 2011). Cellulose constitutes the primary component of secondary cell walls. In addition, CesA/Csls were also involved in stress response in plants. For instance, in rice, high temperature activates the kinase OsCDPK24/28, which phosphorylates OsHSFA4d at S146. This phosphorylation event subsequently leads to the differential regulation of HSP101 and CslF6 gene expression (Fang et al., 2025). Parallel studies examining gene expression changes in orchid stems under abiotic stress revealed distinct roles for Csl subfamilies: CslA appears to be a key subfamily in drought stress response across orchids of different life forms, whereas CslD may be particularly important for epiphytic and saprophytic orchids in adapting to freezing stress (Wang et al., 2022).
E. grandis, as one of the world’s three fast-growing tree species, has important economic, ecological and social values, and is widely used in paper, timber and other industrial fields. With the completion of genome sequencing of E. grandis (Myburg et al., 2014), a solid foundation for molecular biology research and genetic improvement of Eucalyptus has been provided. To date, the CesA/Csl gene family had been comprehensively characterized and studied in numerous plant species, including rice Oryza sativa (Ouyang et al., 2007), Sorghum bicolor (Paterson et al., 2009), Gossypium hirsutum (Li et al., 2017), Linum usitatissimum (Pydiura et al., 2015), Populus trichocarpa (Takata and Taniguchi, 2015) and Arabidopsis thaliana (Persson et al., 2007b). However, the CesA/Csl genes has not been identified in E. grandis. In view of the important roles of CesA and Csls genes in plant growth and development, the present study systematically identified the CesA and Csls family members in E. grandis, and analyzed their characteristics, including phylogenetic relationships, gene and protein structural characteristics, cis-acting elements and gene expression patterns. These results laid a theoretical foundation for in-depth study of the functions of CesA/Csls genes in cell wall synthesis during growth and development process in E. grandis.
2 Materials and methods
2.1 Identification and physicochemical characterization of EgCesA/Csls gene family members
The Arabidopsis AtCesA/Csls protein sequences were initially obtained by downloading from the TAIR database (http://www.arabidopsis.org), and used as query sequences to search the candidate CesA/Csls in E. grandis via the BlastP program, with a threshold set at E value of e-10. The CesA/Csls family feature domain (PE00535 and PF03552) vas used as a query sequence. Meanwhile, bidirectional BLAST alignment using TBtools software (v2.110, (Chen et al., 2020) and screening via the Hidden Markov Model (HMM) were conducted. In these two ways, the candidate EgCesA/Csls proteins were finally obtained. The basic physicochemical properties of EgCesA/Csls proteins, including amino acid length, theoretical isoelectric point, relative molecular mass, grand average of hydropathicity, instability index, and aliphatic index, were analyzed using the ProtParam tool in ExPASy (https://web.expasy.org/protparam/) (Li et al., 2024), and WoLF PSORT (https://wolfpsort.hgc.jp/) was used for subcellular localization prediction. The genome sequence and annotation information of E. grandis was obtained from the National Center for Biotechnology Information (NCBI) database with the accession number ASM1654582v1.
2.2 Phylogenetic tree construction of EgCesA/Csls family genes
To investigate the phylogenetic relationship of the CesA/Csls gene family, the amino acid sequences of CesA/Csls of three species were selected, including Arabidopsis thaliana (A. thaliana), Populus trichocarpa (P. trichocarpa) and Physcomitrella patens (P. patens) (Supplementary Table 1). Sequence alignment and similarity analysis were conducted on these four species using MEGA. Genomic annotation information for P. patens and P. trichocarpa was obtained from NCBI (https://www.ncbi.nlm.nih.gov/) with the accession number GCF_000002425.5 and GCF_000002775.5. The phylogenetic tree was built using the Maximum Likelihood (ML) method, with parameters set to UltraFast BootStrap, a Bootstrap number of 1000 (model: Auto, number of steps: Auto), and other parameters set to their default values. The phylogenetic tree was visualized and optimized using the Evolview website (https://www.evolgenius.info).
2.3 Analysis of EgCesA/Csls gene structure and conserved structural domains
The conserved domains of EgCesA/Csls proteins were predicted using CDD-Search program in NCBI (https://www.ncbi.nlm.nih.gov/cdd). Multiple Expectation Maximization for Motif Elicitation (MEME) (https://meme-suite.org/meme/index.html) was used to identify the conserved motifs of EgCesA/Csls proteins, with the number of maximum motifs set to 10 and p-value less than 1e-5. The exon-intron structures of the EgCesA/Csls genes were generated using TBtools (v2.110) based on their genome DNA sequence and coding sequence (CDS). Additionally, the gene structure conserved motifs and domains of EgCesA/Csls proteins were visualized by TBtools.
2.4 Chromosomal localization and collinearity analysis of the EgCesA/Csls gene family
The GFF file from the E. grandis genome was utilized to obtain chromosomal location information for members of the EgCesA/Csls gene family and to generate a distribution map of these genes on chromosomes by TBtools. The “One Density Profile” program was used, with the parameter “Bin Size” set to 1,000,000. To identify the gene duplication patterns, synteny analyses of the CesA/Csls genes in E. grandis vs. A. thaliana and E. grandis vs. P. trichocarpa were performed using the Dual Systeny Plot program of TBtools. To investigate the internal collinear relationships within the E. grandis genome, a synteny analysis was conducted across the entire genome utilizing the “One Step MCScanX” tool, with results visualized via the “Advanced Circos” module (Chen et al., 2020). For the MCScanX run, the analysis parameters were set as follows: BLASTP alignment was performed using 2 CPU threads, an E-value cutoff was set at 10-10, and the five highest-ranking BLAST matches were retained for subsequent synteny analysis.
2.5 Analysis of cis-acting elements in the EgCesA/Csls family promoter
We extracted 2000 bp upstream of the transcriptional start site (ATG) of EgCesA/Csls gene from E. grandis genome by using ‘GXF’ Sequence Extraction’ tool in TBtools-II software. Subsequently, these sequences were compared and analyzed against the online PlantCare database (https://bioinformatics.psb.ugent.be/webtools/plantcare/html/)to identify the cis-acting elements of this gene family. Finally, the retrieved cis-acting elements were integrated with the phylogenetic tree of E. grandis and visualized using the “Basic BioSequence View” tool in TBtools-II. To predict the transcription factor binding site in the promoter of EgCesA/Csls, the promoter sequences of EgCesA/Csls gene were uploaded to PlantRegMap (http://plantregmap.gao-lab.org/), with the parameter of p-value less than 1e-7.
2.6 Expression patterns of the EgCesA/Csls gene family
To examine the tissue-specific expression patterns of E. grandis CesA/Csls family genes, transcriptome data were used from our previous study (Fan et al., 2024). The raw sequencing reads have been archived in the Genome Sequence Archive (GSA) at the National Genomics Data Center under the accession number PRJCA002468. Plant materials were derived from in vitro-propagated shoots with established root systems, cultivated under controlled conditions at the Research Institution of Tropical Forestry, Chinese Academy of Forestry (Guangzhou, China; coordinates: E 113.385°, N 23.191°). From six-month-old greenhouse-grown shoots at the same institution, multiple tissue types were harvested: roots, mature leaves, young leaves, xylem, and phloem. Additionally, sequential stem internodes (1st, 3rd, 5th, 7th, 9th, and 11th) were collected from these shoots. Tissues including xylem, phloem, and cambium were also sampled from six-year-old trees located at the Zhenshan nursery (Sihui, Zhaoqing, Guangdong, China; coordinates: E 112.673°, N 23.330°).
To induce nutrient deficiency, two-month-old plants were exposed to boron-deficient or phosphorus-deficient regimes using half-strength Hoagland’s nutrient solution. The solution pH was maintained at 5.8 through adjustment with NaOH. Post-treatment, root tissues were gently dried, rapidly frozen in liquid nitrogen, and stored at -80°C. For investigations into hormonal responses and abiotic stress, shoots were propagated in vitro and subsequently grown in potted conditions within the greenhouse for two months. Prior to treatment, fully expanded young leaves (4–8 leaves per plant) situated immediately below the shoot apex were selected from plants reaching 25–35 cm in height. Hormonal elicitation involved foliar application of 100 μM salicylic acid (SA) or methyl jasmonate (MeJA). Leaf samples subjected to hormonal treatments or salinity stress (imposed via irrigation with 200 mM NaCl) were collected at defined intervals post-application: 0, 1, 6, 24, and 168 hours. For each organ type and treatment condition, biological replicates consisted of pooled tissue from a minimum of three individual plants, with the entire experiment performed in triplicate.
Using the TBtools Heatmap function, transcriptome data from 6-month-old branches were logarithmically normalized using the formula “logbase(value+LogWith)” (where base = 2.0 and LogWith = 1.0) to minimize data dispersion. Subsequently, “Cluster Rows” was selected for hierarchical clustering. A heatmap depicting expression patterns was generated after hierarchical clustering. Additionally, using the TBtools Heatmap function, logarithmic scaling was chosen for logarithmic normalization of the transcriptome data. The tile shape was set to “circular,” and “scale size by area” was selected to create an initial expression heatmap. Furthermore, after logarithmic normalization, “row scaling” was applied to normalize the rows, thereby enhancing the clarity of differential expression in the heatmap. The heatmaps were then combined to comprehensively illustrate the expression patterns of the EgCesA/Csls gene family under abiotic stress and phytohormone treatments.
2.7 EgCesA/Csls protein structure prediction
Utilizing the Swiss-Model online tool (https://swissmodel.expasy.org/), the three-dimensional structures of the EgCesA/Csls family proteins were constructed through homology modeling. Additionally, Alphafold (https://alphafoldserver.com) was utilized to predict the structural configurations of the protein complexes formed by EgCesA4, EgCesA7, and EgCesA8, which were potentially implicated in the synthesis of secondary walls.
3 Results and analysis
3.1 Gene family identification and physicochemical analysis results
In this study, 62 CesA/Csls proteins were successfully identified through BLASTp alignment. Based on the nomenclature of this gene family in the model plant A. thaliana, we have assigned corresponding names to the genes in E. grandis. Among them, 21 cellulose synthases sequentially named as EgCesA1a to EgCesA1e, EgCesA3a to EgCesA3c, EgCesA6a to EgCesA6i, EgCesA4, EgCesA7, EgCesA8, EgCesA10; the remaining 41 belonged to four types of cellulose synthase-likes, named EgCslB1 to EgCslB4, EgCslC4a, EgCslC4c, EgCslC6, EgCslC12a, EgCslC12b, EgCslD1, EgCslD2, EgCslD4, EgCslD6a, EgCslD6b, EgCslE1a to EgCslE1k, and EgCslG1 to EgCslG12 (Table 1). An analysis of the physicochemical properties of EgCesA/Csls indicated that the number of amino acids in these proteins ranged from 166 to 1138. Specifically, the protein encoded by the EgCslD2 gene had the highest number of amino acids, reaching 1138, while the EgCslE1j had the lowest with only 166 amino acids. The isoelectric point analysis showed that 21 genes had isoelectric points below 7, while the remaining genes had isoelectric points above 7, indicating that the EgCesA/Csls gene family was predominantly composed of basic amino acids. The aliphatic index ranged from 74.36 (EgCslG8) to 118.16 (EgCesA1c), reflecting significant differences in the thermal stability of proteins within this family. In terms of hydrophilicity analysis, 40 EgCesA/Csls genes exhibited negative values, confirming their hydrophilic nature. Among them, EgCslG8 had the highest overall average hydrophilicity (GRAVY) of -0.423, while EgCesA1c had the lowest GRAVY of 0.599 (Table 1), indicating that the overall hydrophilicity of this family was not prominent.
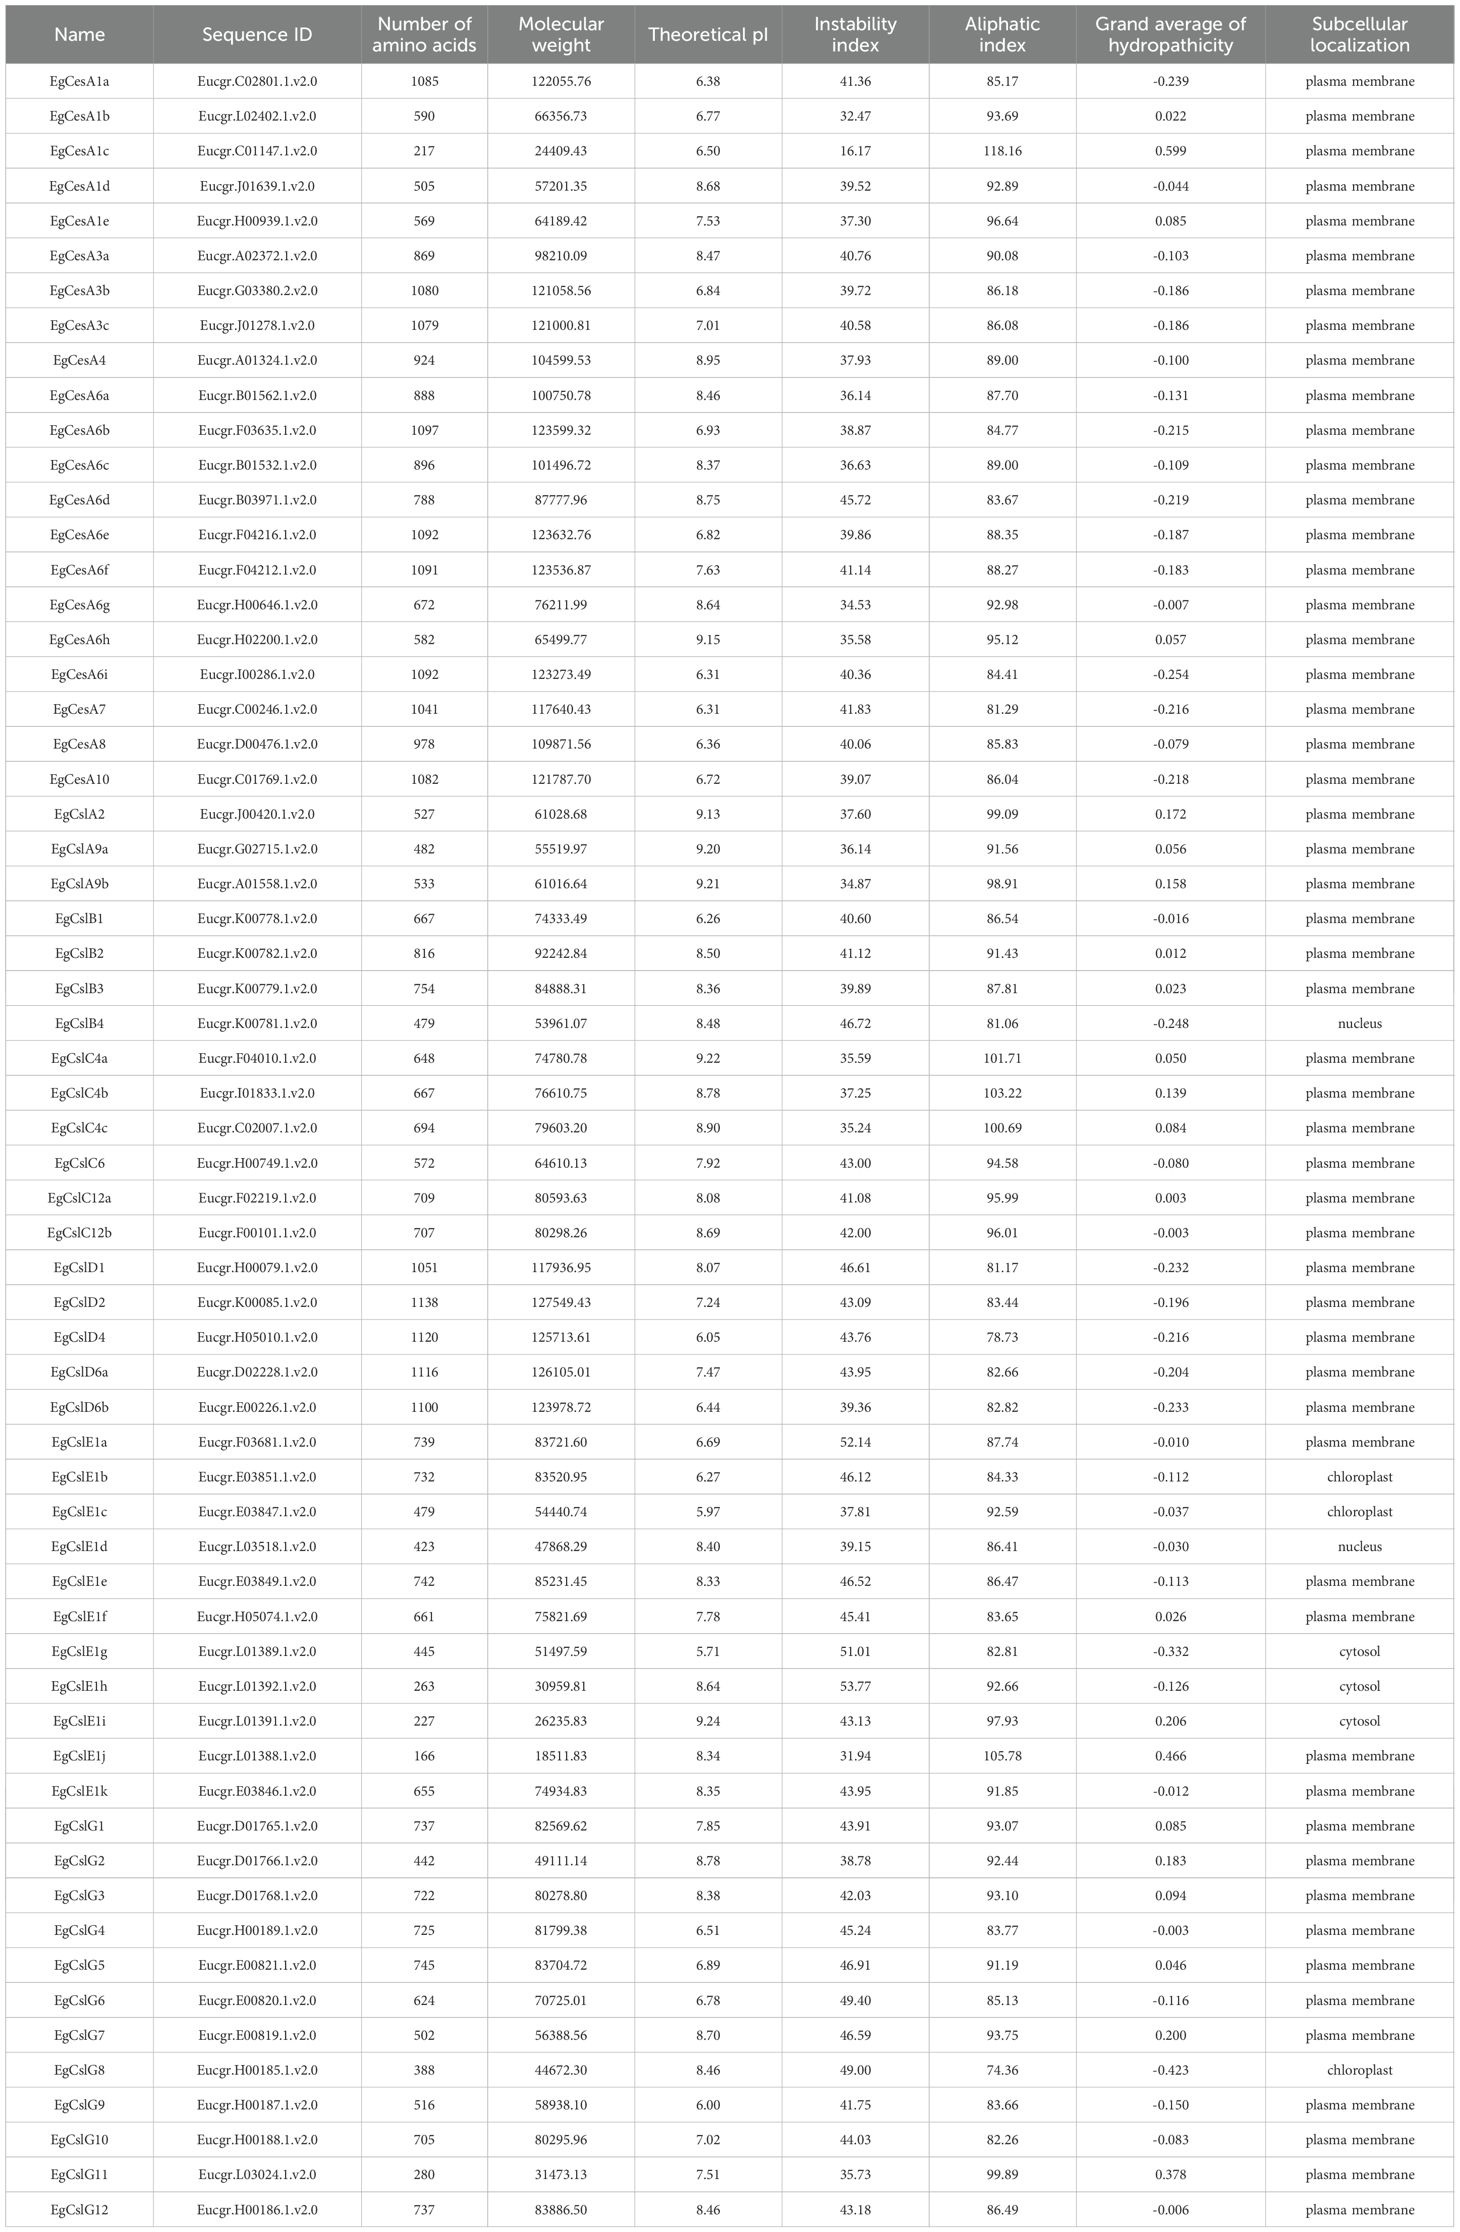
Table 1. The basic information of identified EgCesA/Csls gene family members.
3.2 Phylogenetic tree of the EgCesA/Csls gene family
To investigate the functions of EgCesA/Csls, a phylogenetic tree was constructed based on 210 protein sequences from E. grandis, A. thaliana, P. trichocarpa, and P. patens using TBtools-II software. The result revealed that whole CesA/Csls proteins could be classified into seven subfamilies, namely one CesA subfamily and six Csl subfamilies (CslA, CslB, CslC, CslD, CslE, CslG). The EgCesA subfamily contained 21 members, while the EgCslA subfamily consisted of 3 members; the EgCslB subfamily comprised 4 members, the EgCslC subfamily included 6 members, the EgCslD subfamily had 5 members, the EgCslE subfamily had 11 members, and the EgCslG subfamily contained 12 members. Additionally, the phylogenetic analysis indicated that the EgCesA/Csls genes were more closely related to those of P. trichocarpa compared to A. thaliana and P. patens (Figure 1).
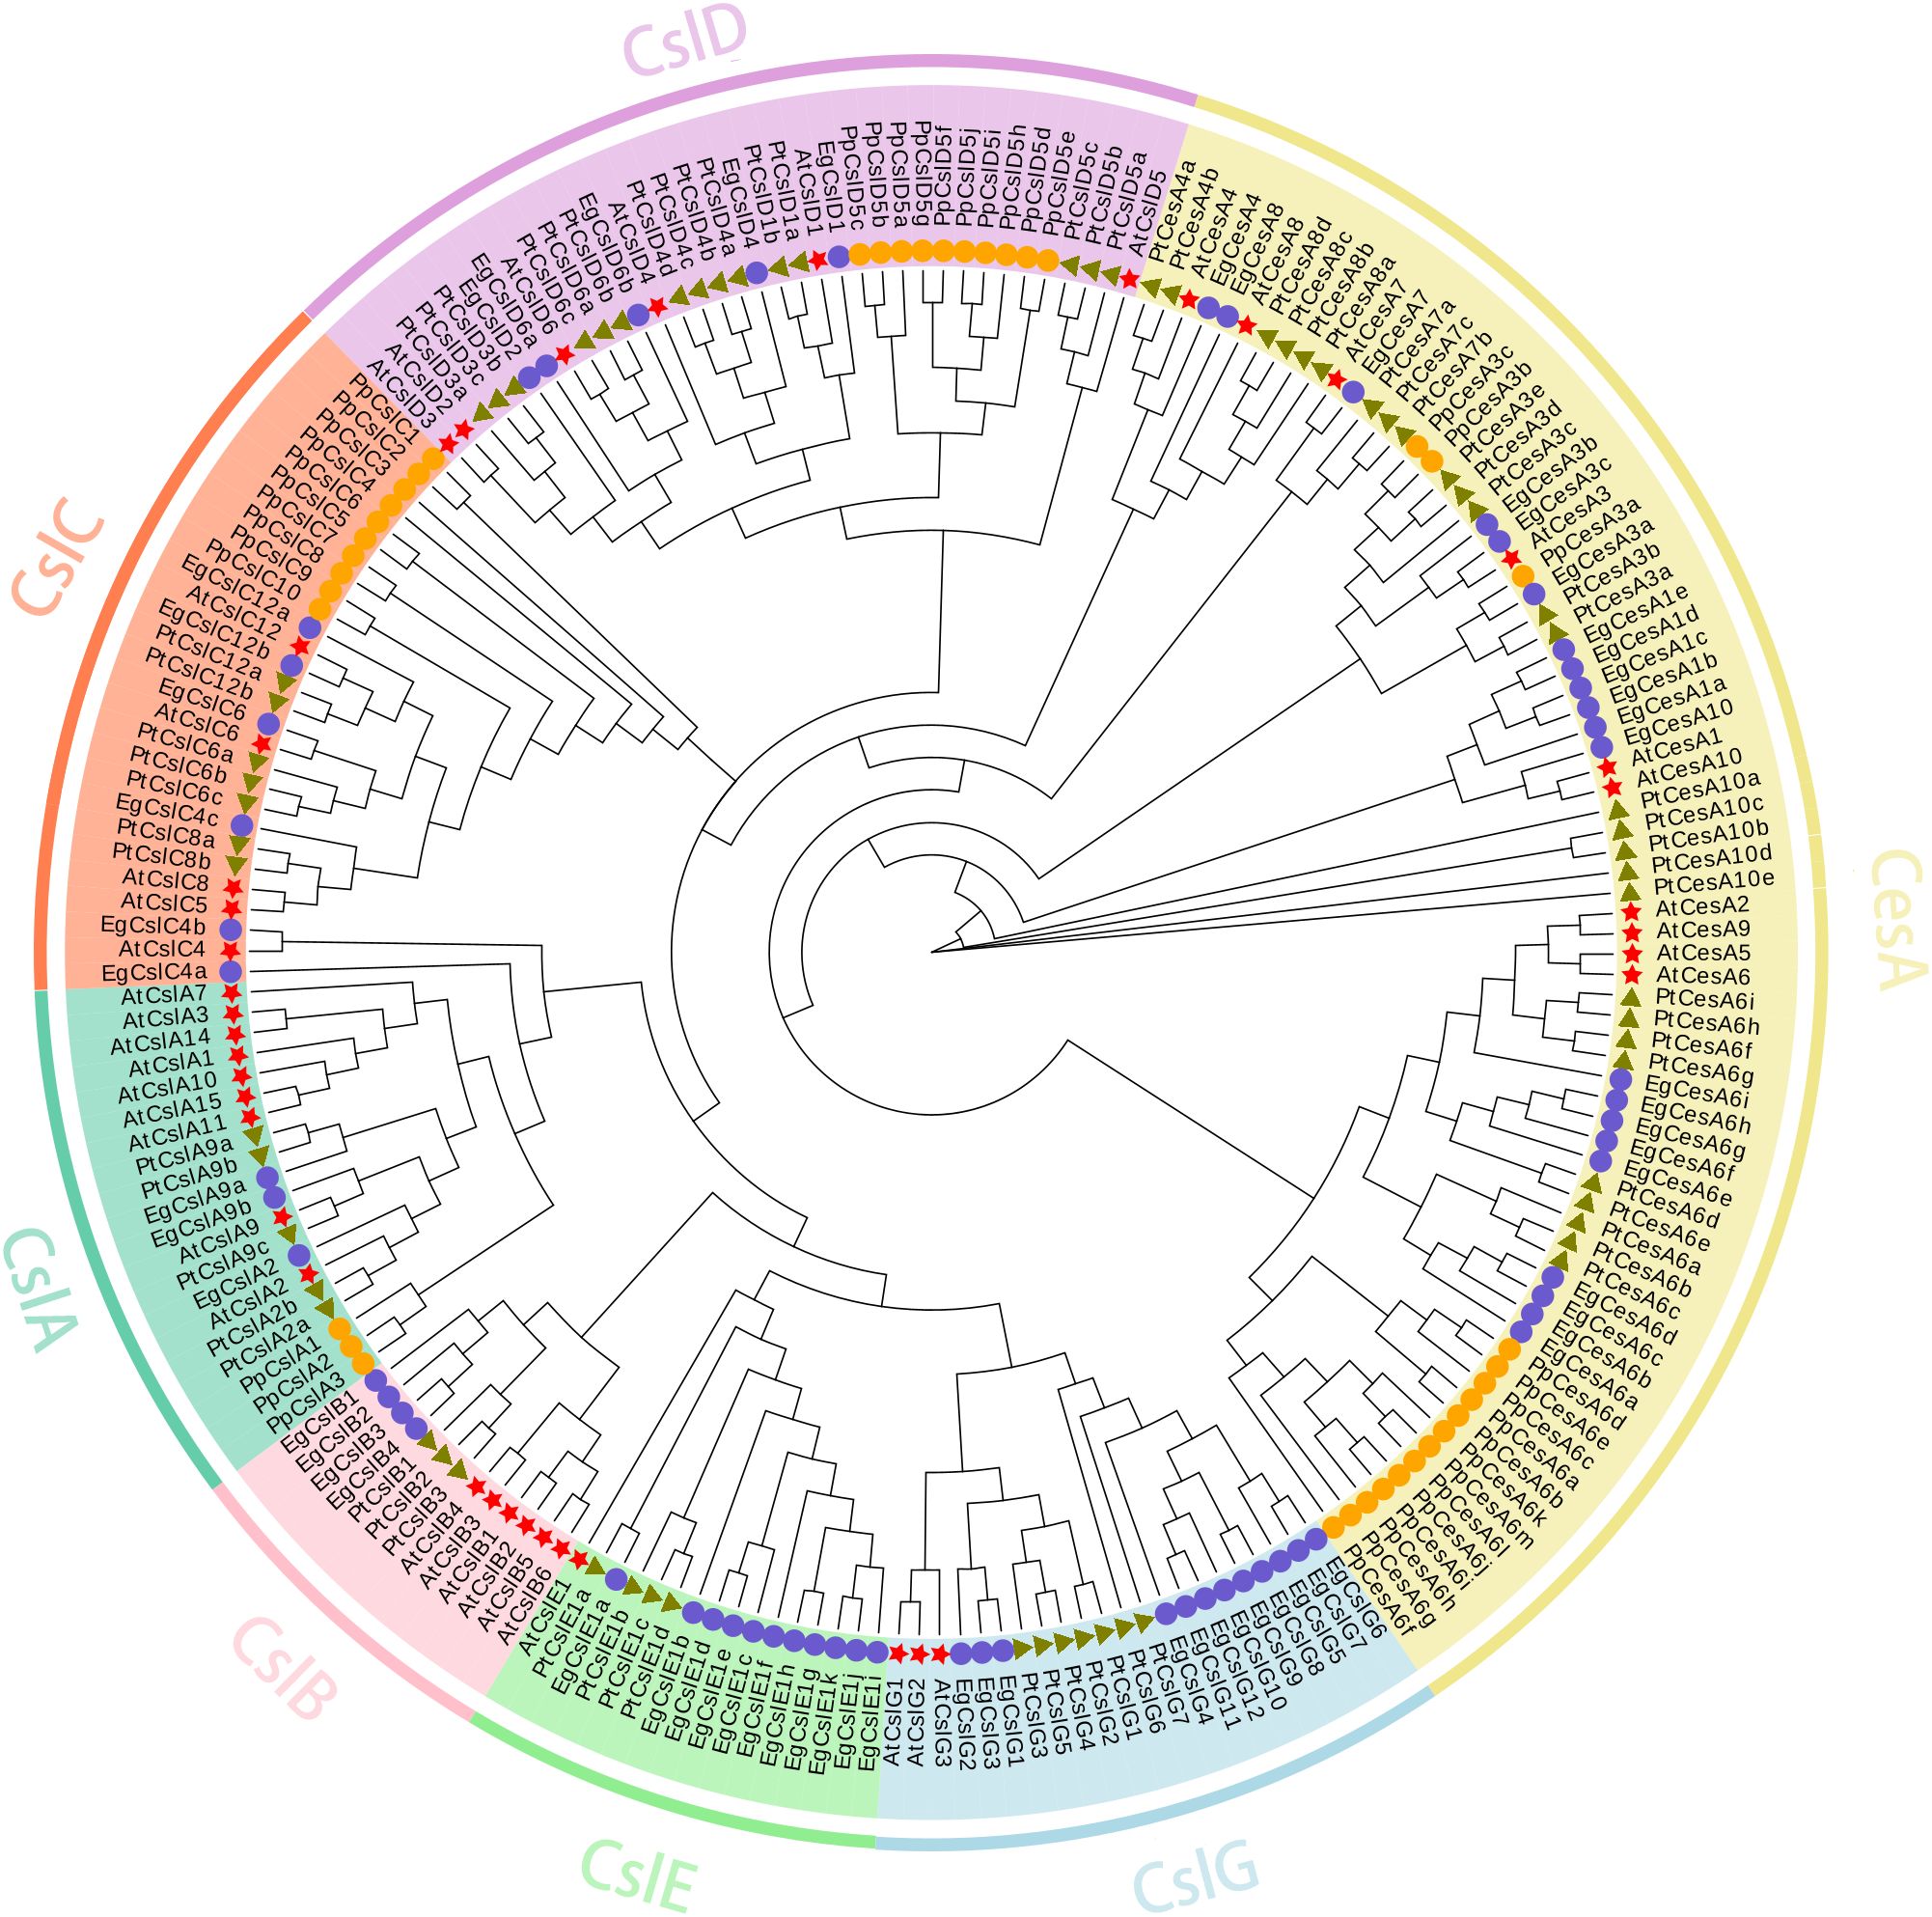
Figure 1. Phylogenetic analysis of CesA/Csls genes in E. grandis, A. thaliana, P. trichocarpa, and P. patens. Signs of different shapes represent CesA/Csls genes from E. grandis (blue round, Eg), A. thaliana (red star, AT), P. trichocarpa (green triangle, Pt), and P. patens (orange round, Pp).
3.3 Analysis of the gene structure and conserved domains of the EgCesA/Csls family
Based on the characteristics of conserved protein motifs, the 62 EgCesA/Csls proteins were classified into five categories in the phylogenetic tree (Figure 2A). The conserved motifs of these 62 EgCesA/Csls proteins were visualized using the MEME online program (Figure 2B). There were relatively conserved domains at the amino terminal of EgCesA/Csls proteins. Conservative motif analysis showed that all EgCesA subfamily members contained Motif 4 and Motif 8, while EgCslD subfamily members contain all these motifs. All EgCslA and EgCslC subfamily members contain Motif1, and all EgCslB subfamily members contained Motif1, 2, 7, 9 and 10, but without Motif5; Motif4 were presented in EgCslE subfamily members except EgCslE1h, EgCslE1g. Additionally, the exon-intron distribution patterns of the EgCesA/Csls genes were investigated. As shown in Figure 2C, we found that number of exons ranged from 3 to 14. Furthermore, there was variability in the number of exons across different subfamily. For example, only 3–6 exons were presented in EgCslD subfamily, whereas more than 10 exons were existed in most of the members in EgCesAs.
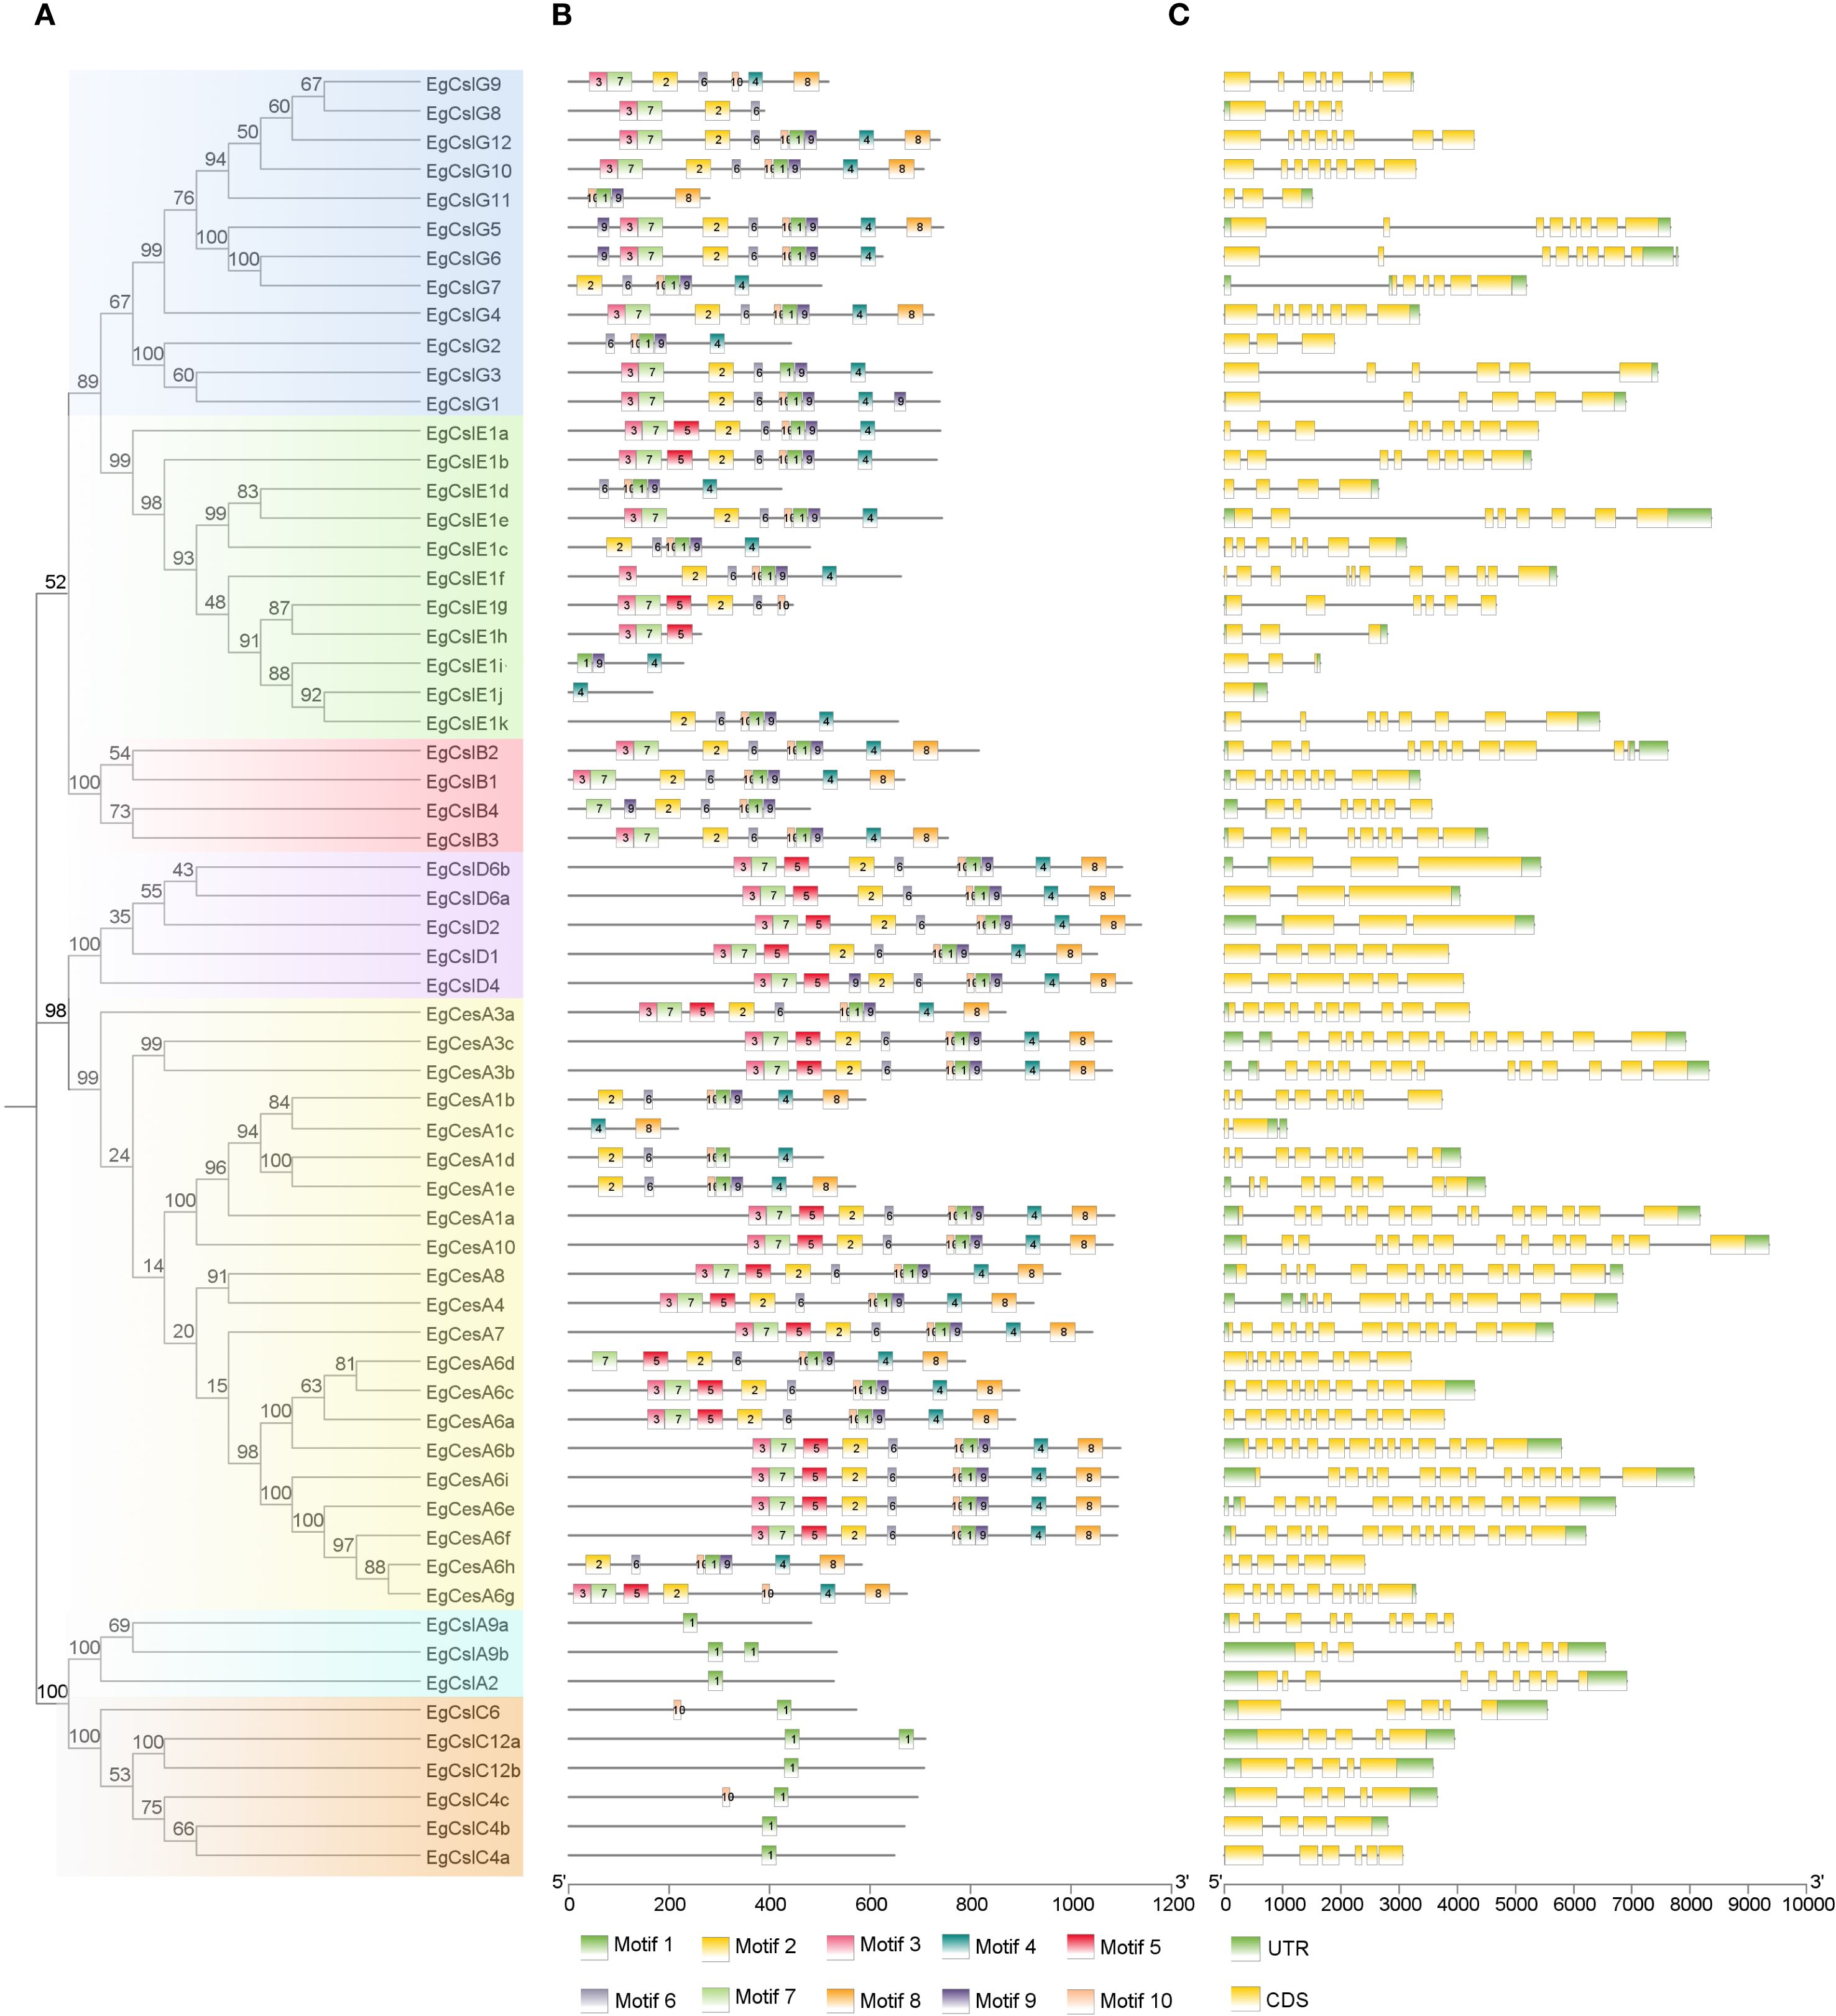
Figure 2. Predicted phylogeny, conserved amino acid motifs, and gene structure of EgCesA/Csls proteins. (A) Rooted maximum likelihood phylogeny of EgCesA/Csls proteins showing subfamily classification, with five different colors representing five subfamilies. (B) In E. grandis, the motif compositions of CesA/Csl proteins are represented by distinct colors, numbered from motif 1 to motif 10. (C) The intron-exon map illustrates the structural composition of the genes, with yellow regions representing the coding sequence (CDS) and green regions representing the untranslated regions (UTR). The relative positions are proportionally depicted at the bottom of the figure based on a kilobase scale.
3.4 Chromosomal localization and collinearity analysis of EgCesA/Csls gene family members
Based on the annotation, 55 genes were distributed across 11 chromosomes, while another 7 genes were located on scaffolds (Figure 3). Chromosomes 5, 6 and 8 contained a higher number of genes, ranging from 8 to 10 genes each. In contrast, chromosomes 1, 7, 9, and 10 harbored relatively few genes, with only 2 to 3 genes each. These 62 genes exhibited a diverse distribution pattern, including clustered and isolated distributions. 7 gene clusters (EgCslG1/EgCslG2/EgCslG3, EgCslG5/EgCslG6/EgCslG7, EgCslE1b/EgCslE1e/EgCslE1c/EgCslE1k, EgCesA6f/EgCesA6e, EgCslG8/EgCslG12/EgCslG9/EgCslG10/EgCslG4, EgCslB1/EgCslB3/EgCslB4/EgCslB2, EgCslE1i/EgCslE1g/EgCslE1j/EgCslE1h) were characterized as tandem repeat gene pairs, located on chromosomes chr04, chr05, chr06, chr08, chr11 and scaffold-193.
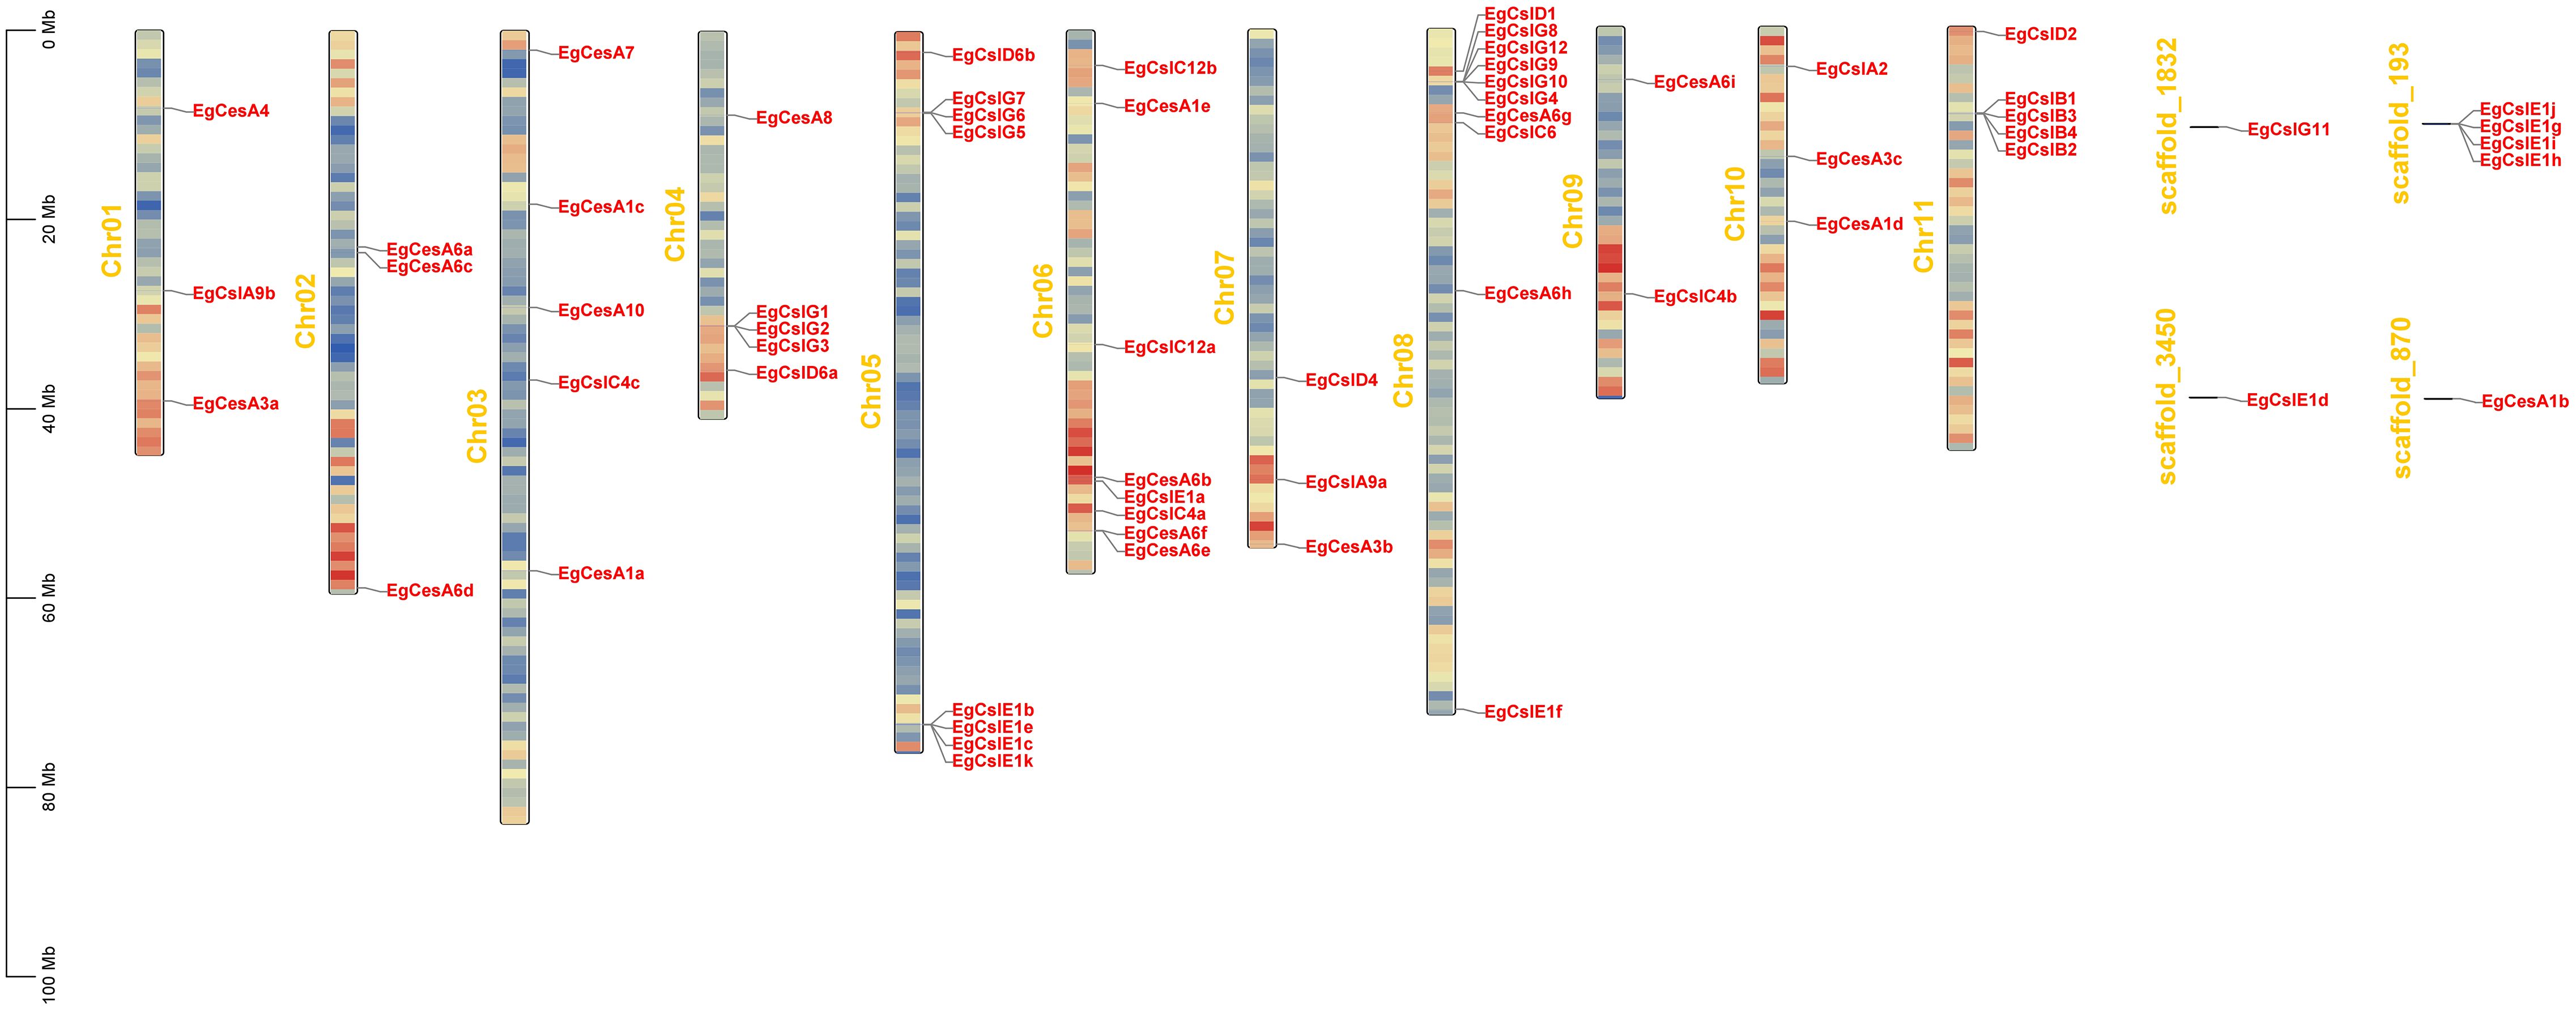
Figure 3. Chromosomal locations of EgCesA/Csls genes. Chromosome numbers are displayed in the middle of each chromosome. The scale bars indicate length in megabases (Mb). The red regions on each chromosome represent high gene density, while the blue regions indicate low gene density.
Intraspecific and interspecific collinearity of EgCesA/Csls family gene events was considered a major driving force in evolution (Panchy et al., 2016). In addition to tandem duplication, fragment duplication events within the EgCesA/Csls gene family were also conducted. The intraspecific collinearity analysis identified 6 collinear pairs among the gene family (Figure 4A), including EgCslA9b and EgCslA2, EgCesA10 and EgCesA1a, EgCesA1c and EgCesA1a, EgCslD6a and EgCslD6b, EgCslC12b and EgCslC12a, EgCslA9a and EgCslA2. Each pair of collinear genes was situated on different chromosomes and was associated with fragment replication events. Taken together, the analysis of gene duplication events suggests that fragment replication serves as the main driving force behind the expansion of the EgCesA/Csls gene family.
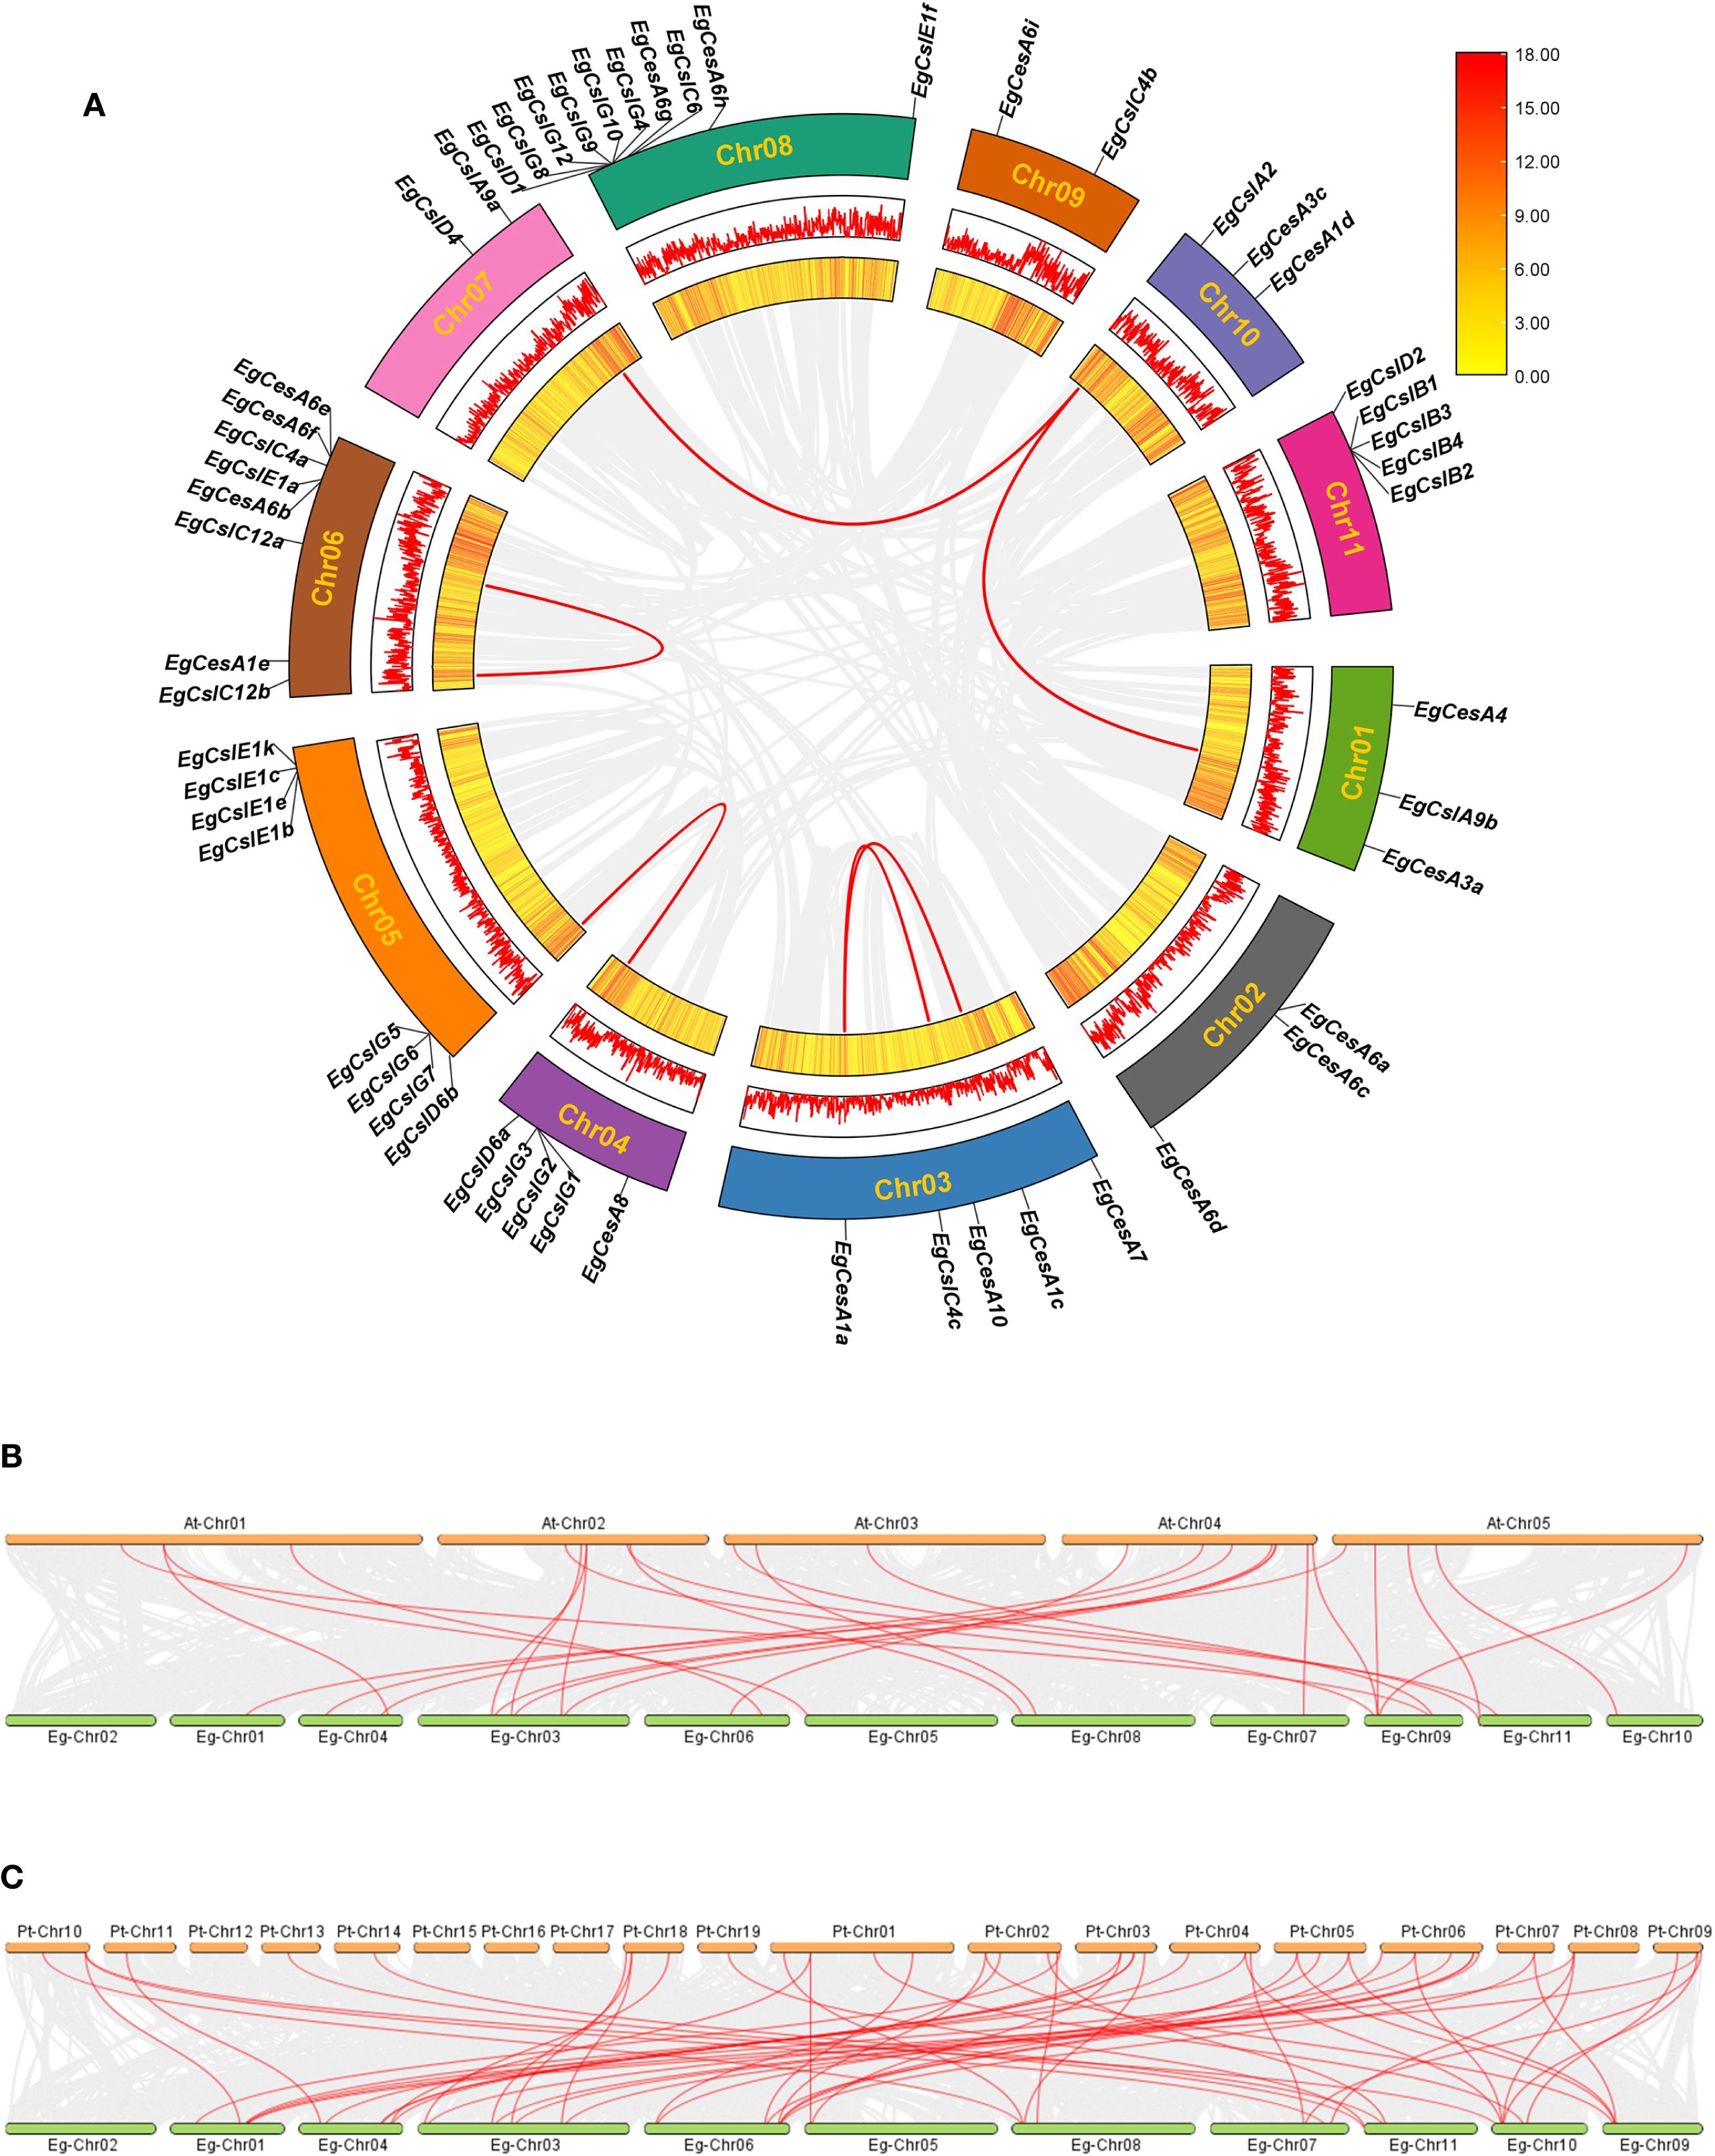
Figure 4. Collinearity relationship of CesA/Csls family members of E. grandis, A. thaliana, and P. trichocarpa. Intraspecific collinearity relationship of CesA/Csls family members of E. grandis (A). The two rings from inside to outside represent gene densities, presented as HeatMap and Line, respectively, and the rectangle in the upper right corner represents the gene density scale. The outermost ring represents the chromosome position. The gray line indicates all collinearity blocks in the E. grandis genome, and the red line indicates the segmental repeats of the EgCesA/Csls genes. Interspecies collinearity relationship among E. grandis and A. thaliana (B) and E. grandis and P. trichocarpa (C) Gray lines in the background indicated all synteny blocks in the genome, while the red lines indicated the duplication of CesA/Csls gene pairs.
To further elucidate the phylogenetic mechanisms of the EgCesA/Csls gene family, comparative syntenic maps were constructed, integrating E. grandis with two representative species of A. thaliana and P. trichocarpa (Figures 4B, C). The results revealed 26 CesA/Csls orthologous gene pairs (9 blocks for EgCesA gene and 17 blocks for EgCsl gene) between E. grandis and A. thaliana. Additionally, 53 collinear gene pairs (19 blocks for EgCesA gene and 34 blocks for EgCsl gene) were identified between E. grandis and P. trichocarpa. This result suggested that the CesA/Csls gene families in these two species had undergone numerous chromosomal segment rearrangements, gene duplications, and loss events during their evolutionary events. Based on these, it was speculated that P. trichocarpa and E. grandis might have a closer phylogenetic relationship.
3.5 Analysis of cis-acting elements in the EgCesA/Csls gene family
Gene expression can be regulated through transcription factors (TFs) binding to cis-elements within their promoter regions (Wang et al., 2014). The cis-acting elements in the 2000 bp upstream promoter regions of EgCesA/Csls were analyzed alongside the phylogenetic tree (Figure 5). Among the 62 EgCesA/Csls genes, 26 response elements were selected and predicted. These elements were categorized into five types: hormone-responsive elements, MYB factor-responsive elements, light-responsive elements, growth and development-responsive elements, and stress-responsive elements (Figure 5). The analysis revealed that the cis-acting elements in the EgCesA/Csls gene family of E. grandis were diverse and abundant, with a single gene potentially involved in multiple physiological response processes. Taking the EgCslG6 gene as an example, it contained various types of cis-acting elements, such as light responsive elements, hormone responsive elements, low-temperature responsive element and MYB factor-responsive elements. It was indicated that this gene played an important role in the stress resistance responses of E. grandis, especially in its response to low temperature stress. In addition, transcription factor binding site was predicted in the promoter of EgCesA/Csls. The result showed that the identification of 13 distinct transcription factor binding sites within the EgCesA/Csls promoter. Among these, the binding site of BBR-BPC (Barley B Recombinant/Basic Pentacysteine)transcription factor was the most abundant, found in the promoter regions of the majority of the CeslA and CeslC genes (Supplementary Figure S1). Besides, the Dof (DNA-binding with one finger) biding site was most prevalent in EgCslE1c promoter (with the number of 18), while the ERF (Ethylene Response Factor) binding sites was most commonly found in the promoter of EgCesA4 (Supplementary Figure S1).
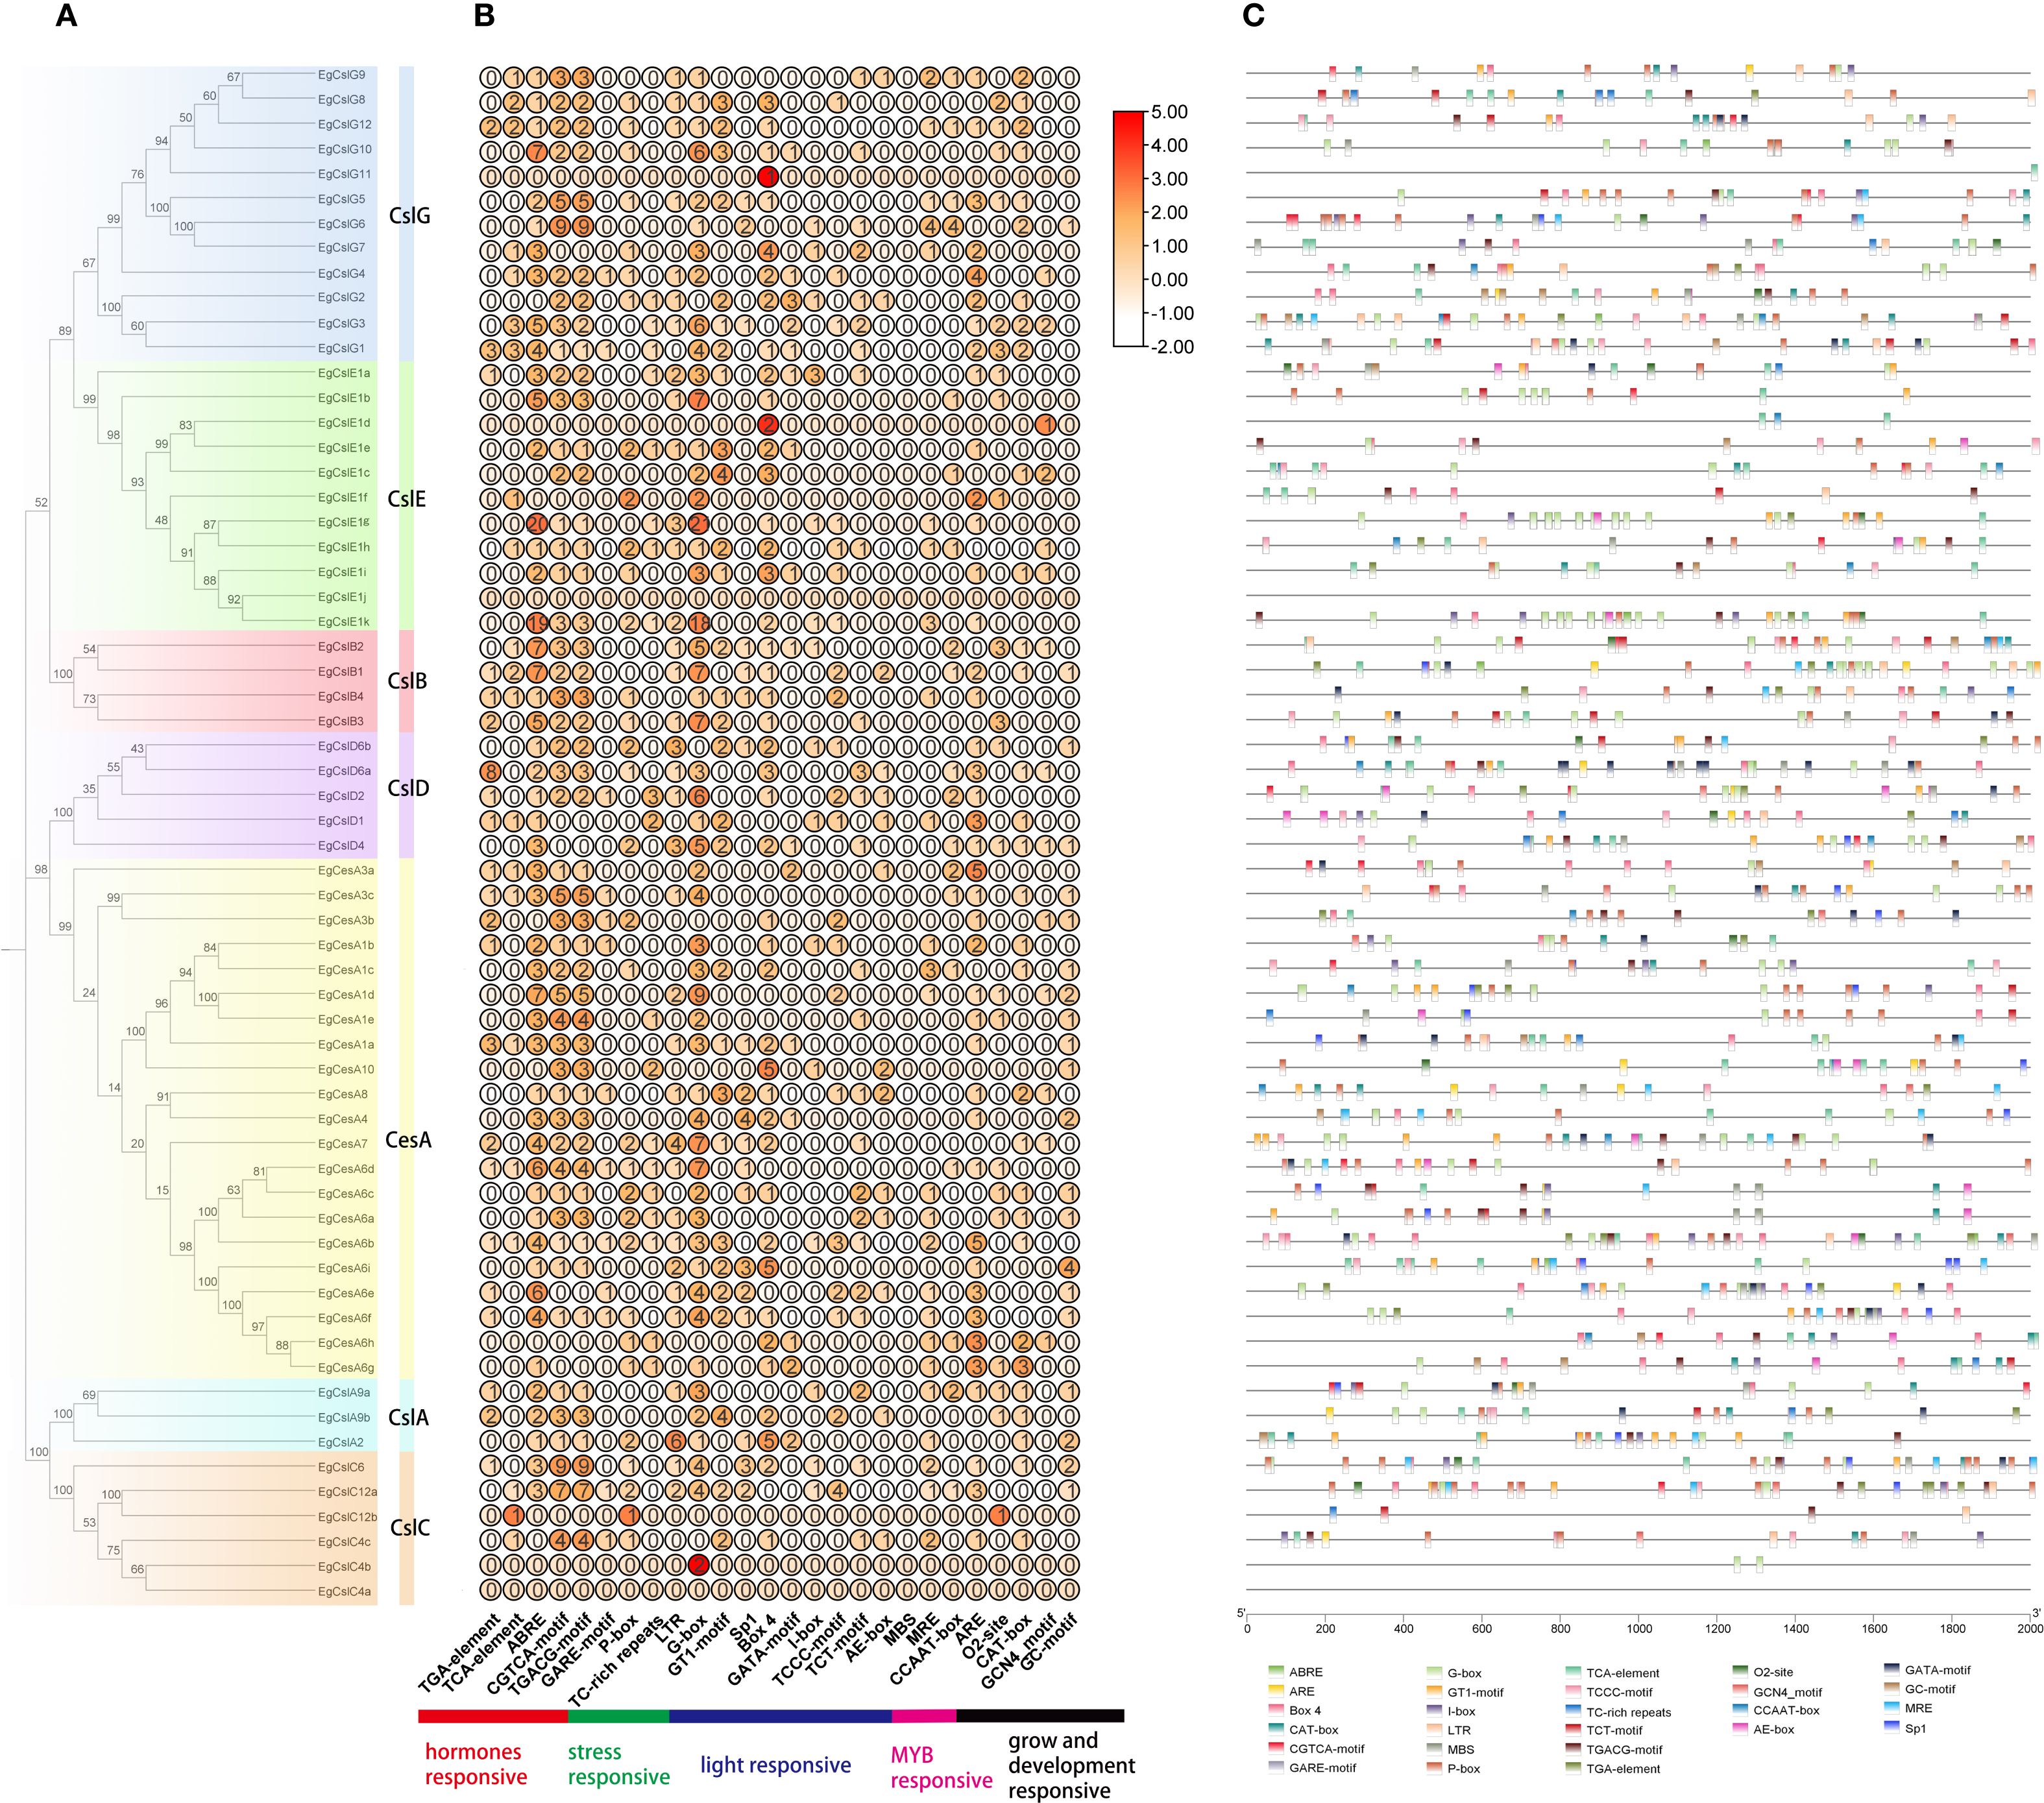
Figure 5. Analysis of cis-acting elements in the promoters of the E. grandis EgCesA/Csls gene family. (A) phylogenetic tree (B) A graph showing the count and expression of cis - acting elements according to response types (C) The 26 boxes on the right represent various cis-acting elements in the promoters of the EgCesA/Csls gene family.
3.6 Expression of EgCesA/Csls in different tissues of E. grandis
The expression of different genes exhibited specificity across various tissue types (Figure 6). The result showed that the genes EgCesA4, EgCesA7 and EgCesA8 had highest expression levels in xylem across three distinct developmental stages: six months, three years, and six years (Figures 6A-C), suggesting that they would be crucial for xylem development. In addition, these genes were highly expressed in different internodes, particularly in the 7th and 9th internodes (Figure 6D), which are under secondary growth. The expression pattern of these three genes were consistent with developmental process of secondary wall formation. Besides, several EgCesA genes also exhibited high expression in phloem, root and stem apex, including EgCesA1a, EgCesA3b, EgCesA3c, EgCesA6b, and EgCesA6i (Figures 6A, B). However, low expression of the EgCesA/Csl genes in other subfamily were detected in xylem. These results indicated that the EgCesA subfamily play significant roles in xylem development.
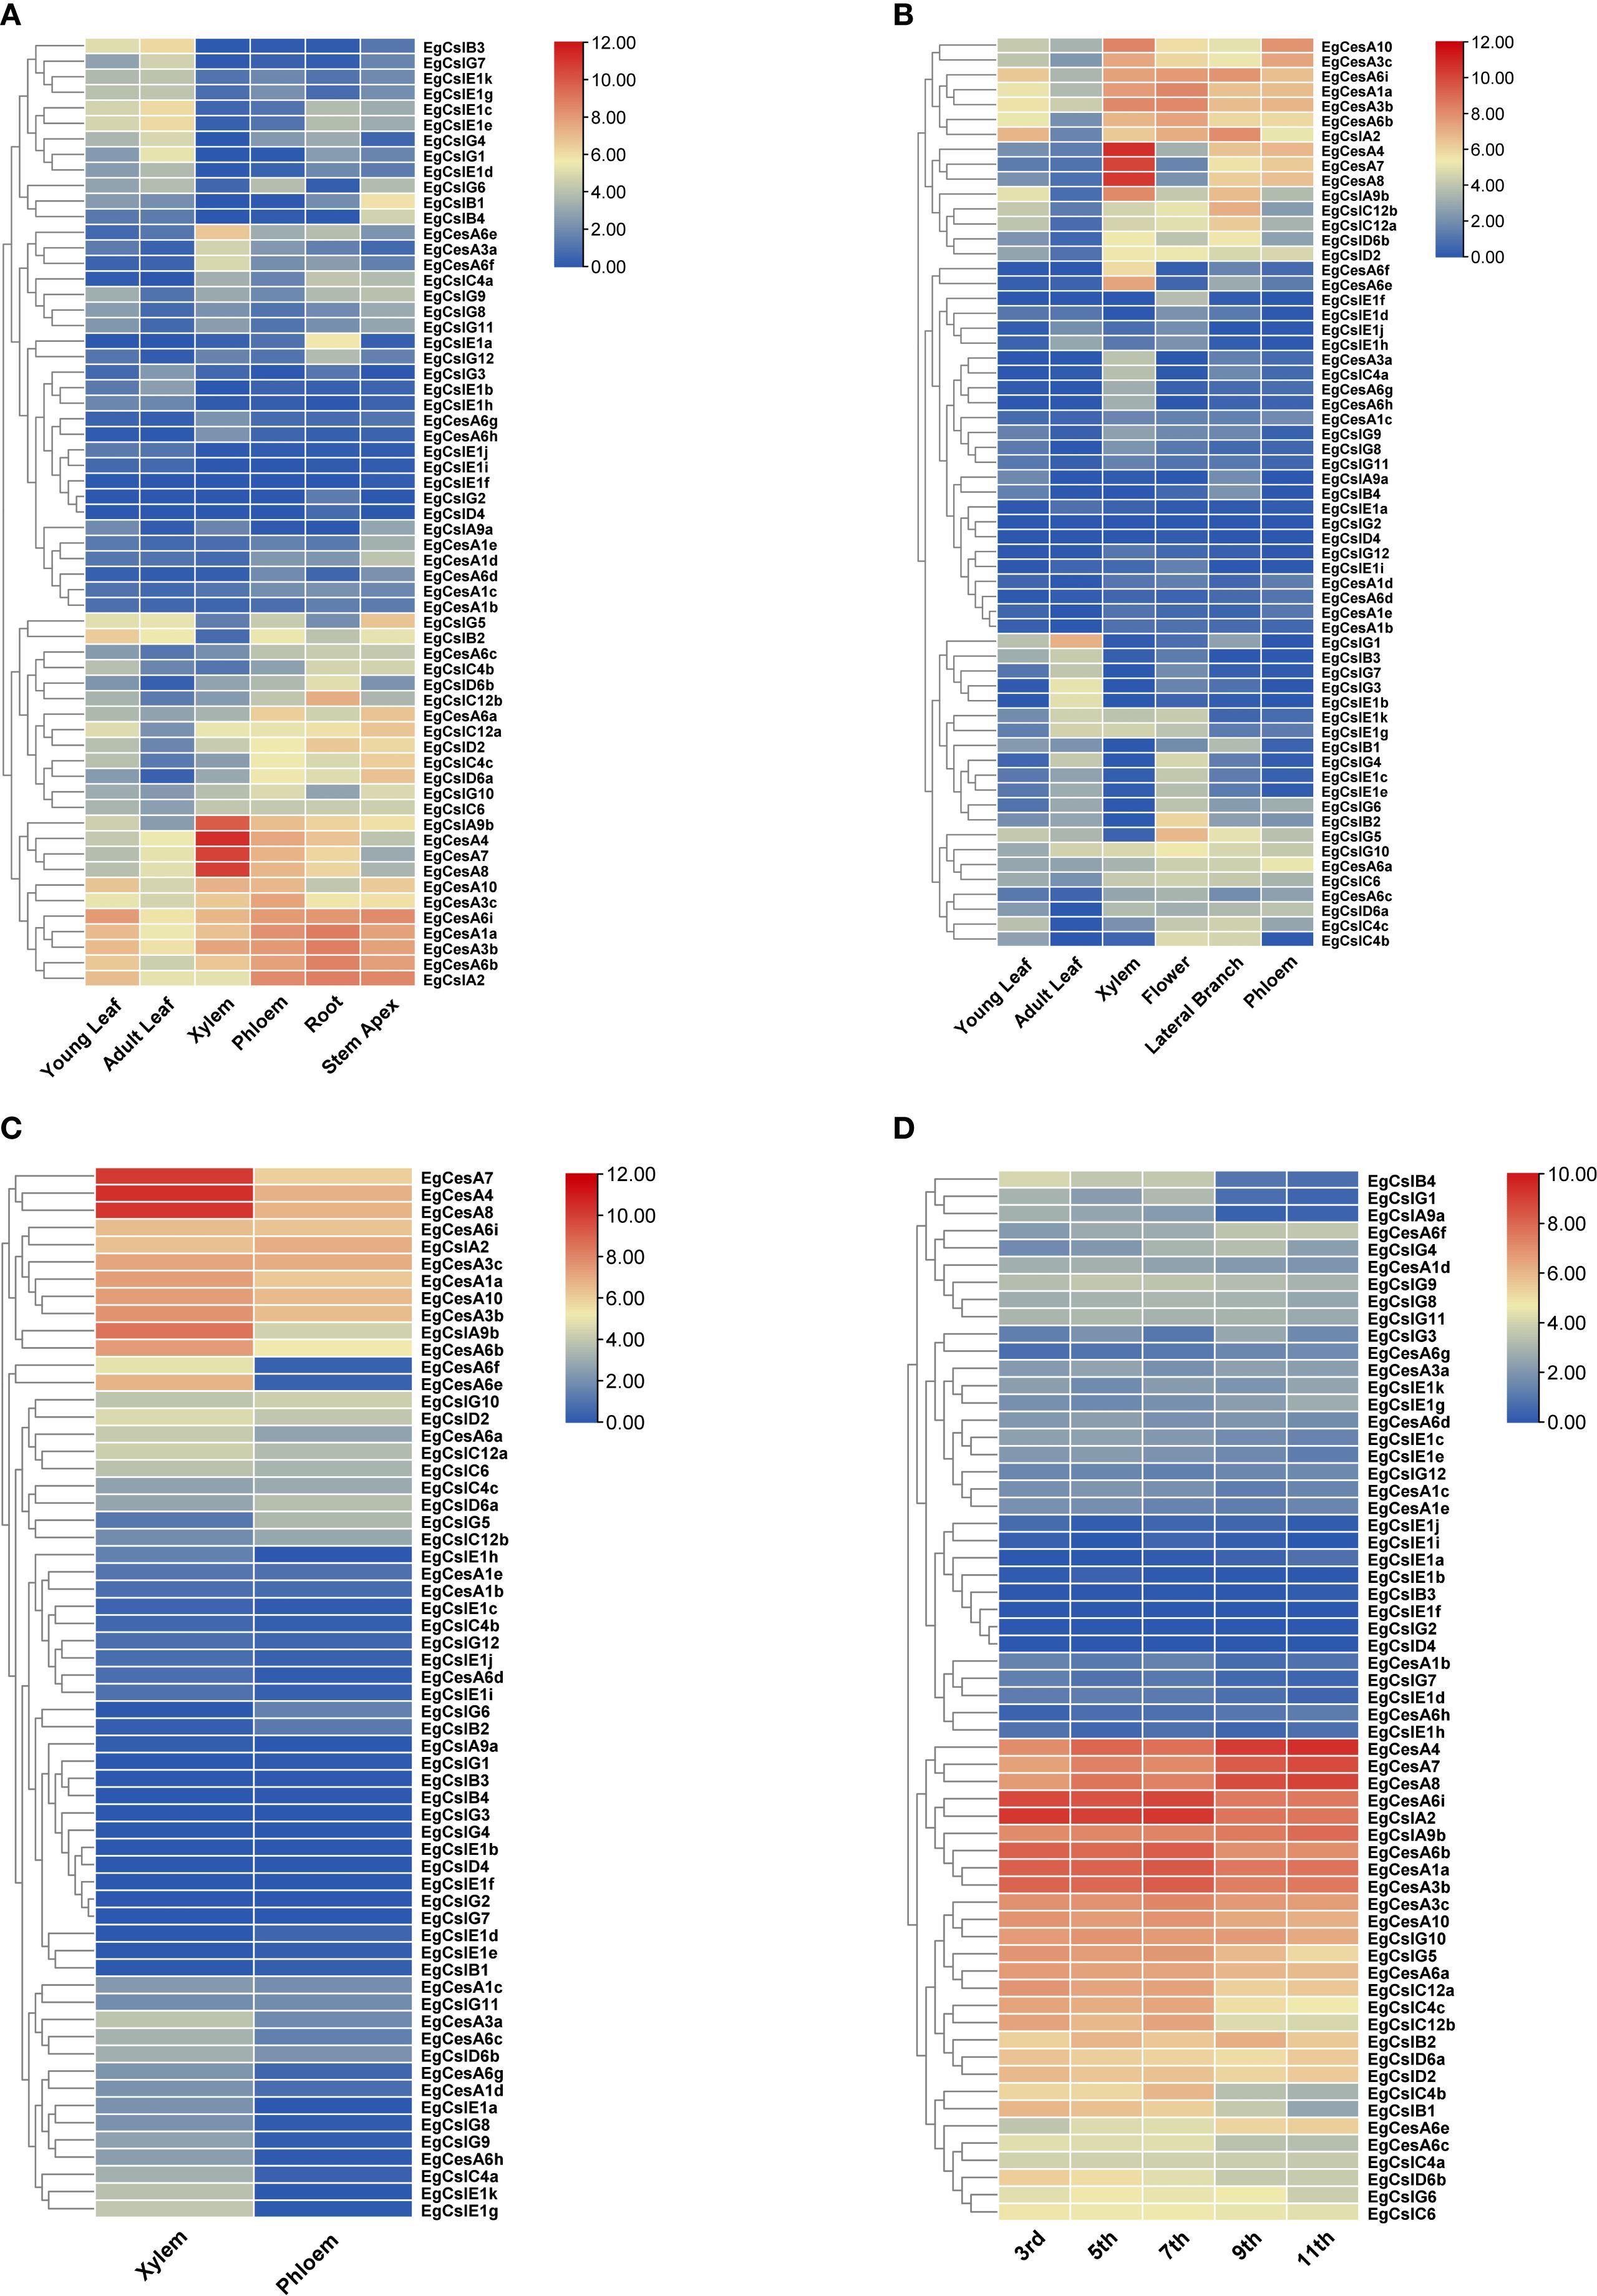
Figure 6. Heatmap of EgCesA/Csls gene expression in different tissues. Expression heatmaps of (A) young leaves, mature leaves, phloem, xylem, roots, and shoot tips of 6-month-old trees, (B) young leaves, mature leaves, xylem, flowers, lateral branches, and phloem of 3-year old trees, and (C) xylem and phloem of 6-year-old eucalyptus trees. (D) internodes 3, 5, 7, 9, and 11 of 6-month-old trees. Based on the RNA-seq data, the expression values are presented in the form of a heat map, with the color from blue to red corresponding to low to high expression.
3.7 Expression of EgCesA/Csls genes under abiotic stress and plant hormone treatments
To explore the expression dynamics of the EgCesA/Csls gene family under various abiotic stress conditions and phytohormone treatments, two-month-old E. grandis seedlings were subjected to a series of treatments. These included boron and phosphorus deficiency applied to both roots and stems, foliar application of salicylic acid (SA) and methyl jasmonate (MeJA), and exposure to salt stress. Gene expression responses were monitored to identify patterns of regulation under these stress conditions (Figure 7). The results revealed that EgCesA1a and EgCslA2 was continued high expression across all treatments, including boron deficiency, phosphorus deficiency, salt stress, SA, and MeJA, suggesting its broad responsiveness to diverse environmental cues. Further analysis using row-normalized rectangle graphs showed clear temporal differences in gene expression patterns. For instance, under extended boron and phosphorus deficiency, EgCslG3, EgCslG4 exhibited gradually increased expression levels over time, indicating a sustained response to nutrient deprivation. In contrast, EgCesA1c, EgCesA4 showed only transient upregulation, peaking early during treatment and then declining, suggesting a short-term stress response. In terms of phytohormone treatments, EgCesA3b, EgCesA6b, EgCesA1a and EgCslG1 genes showed significantly higher expression levels after SA and MeJA treatments, suggesting that they might play a key role in plant response to SA and MeJA. However, EgCslD4 and EgCslG2 genes were not expressed under salt stress, MeJA and SA treatment.
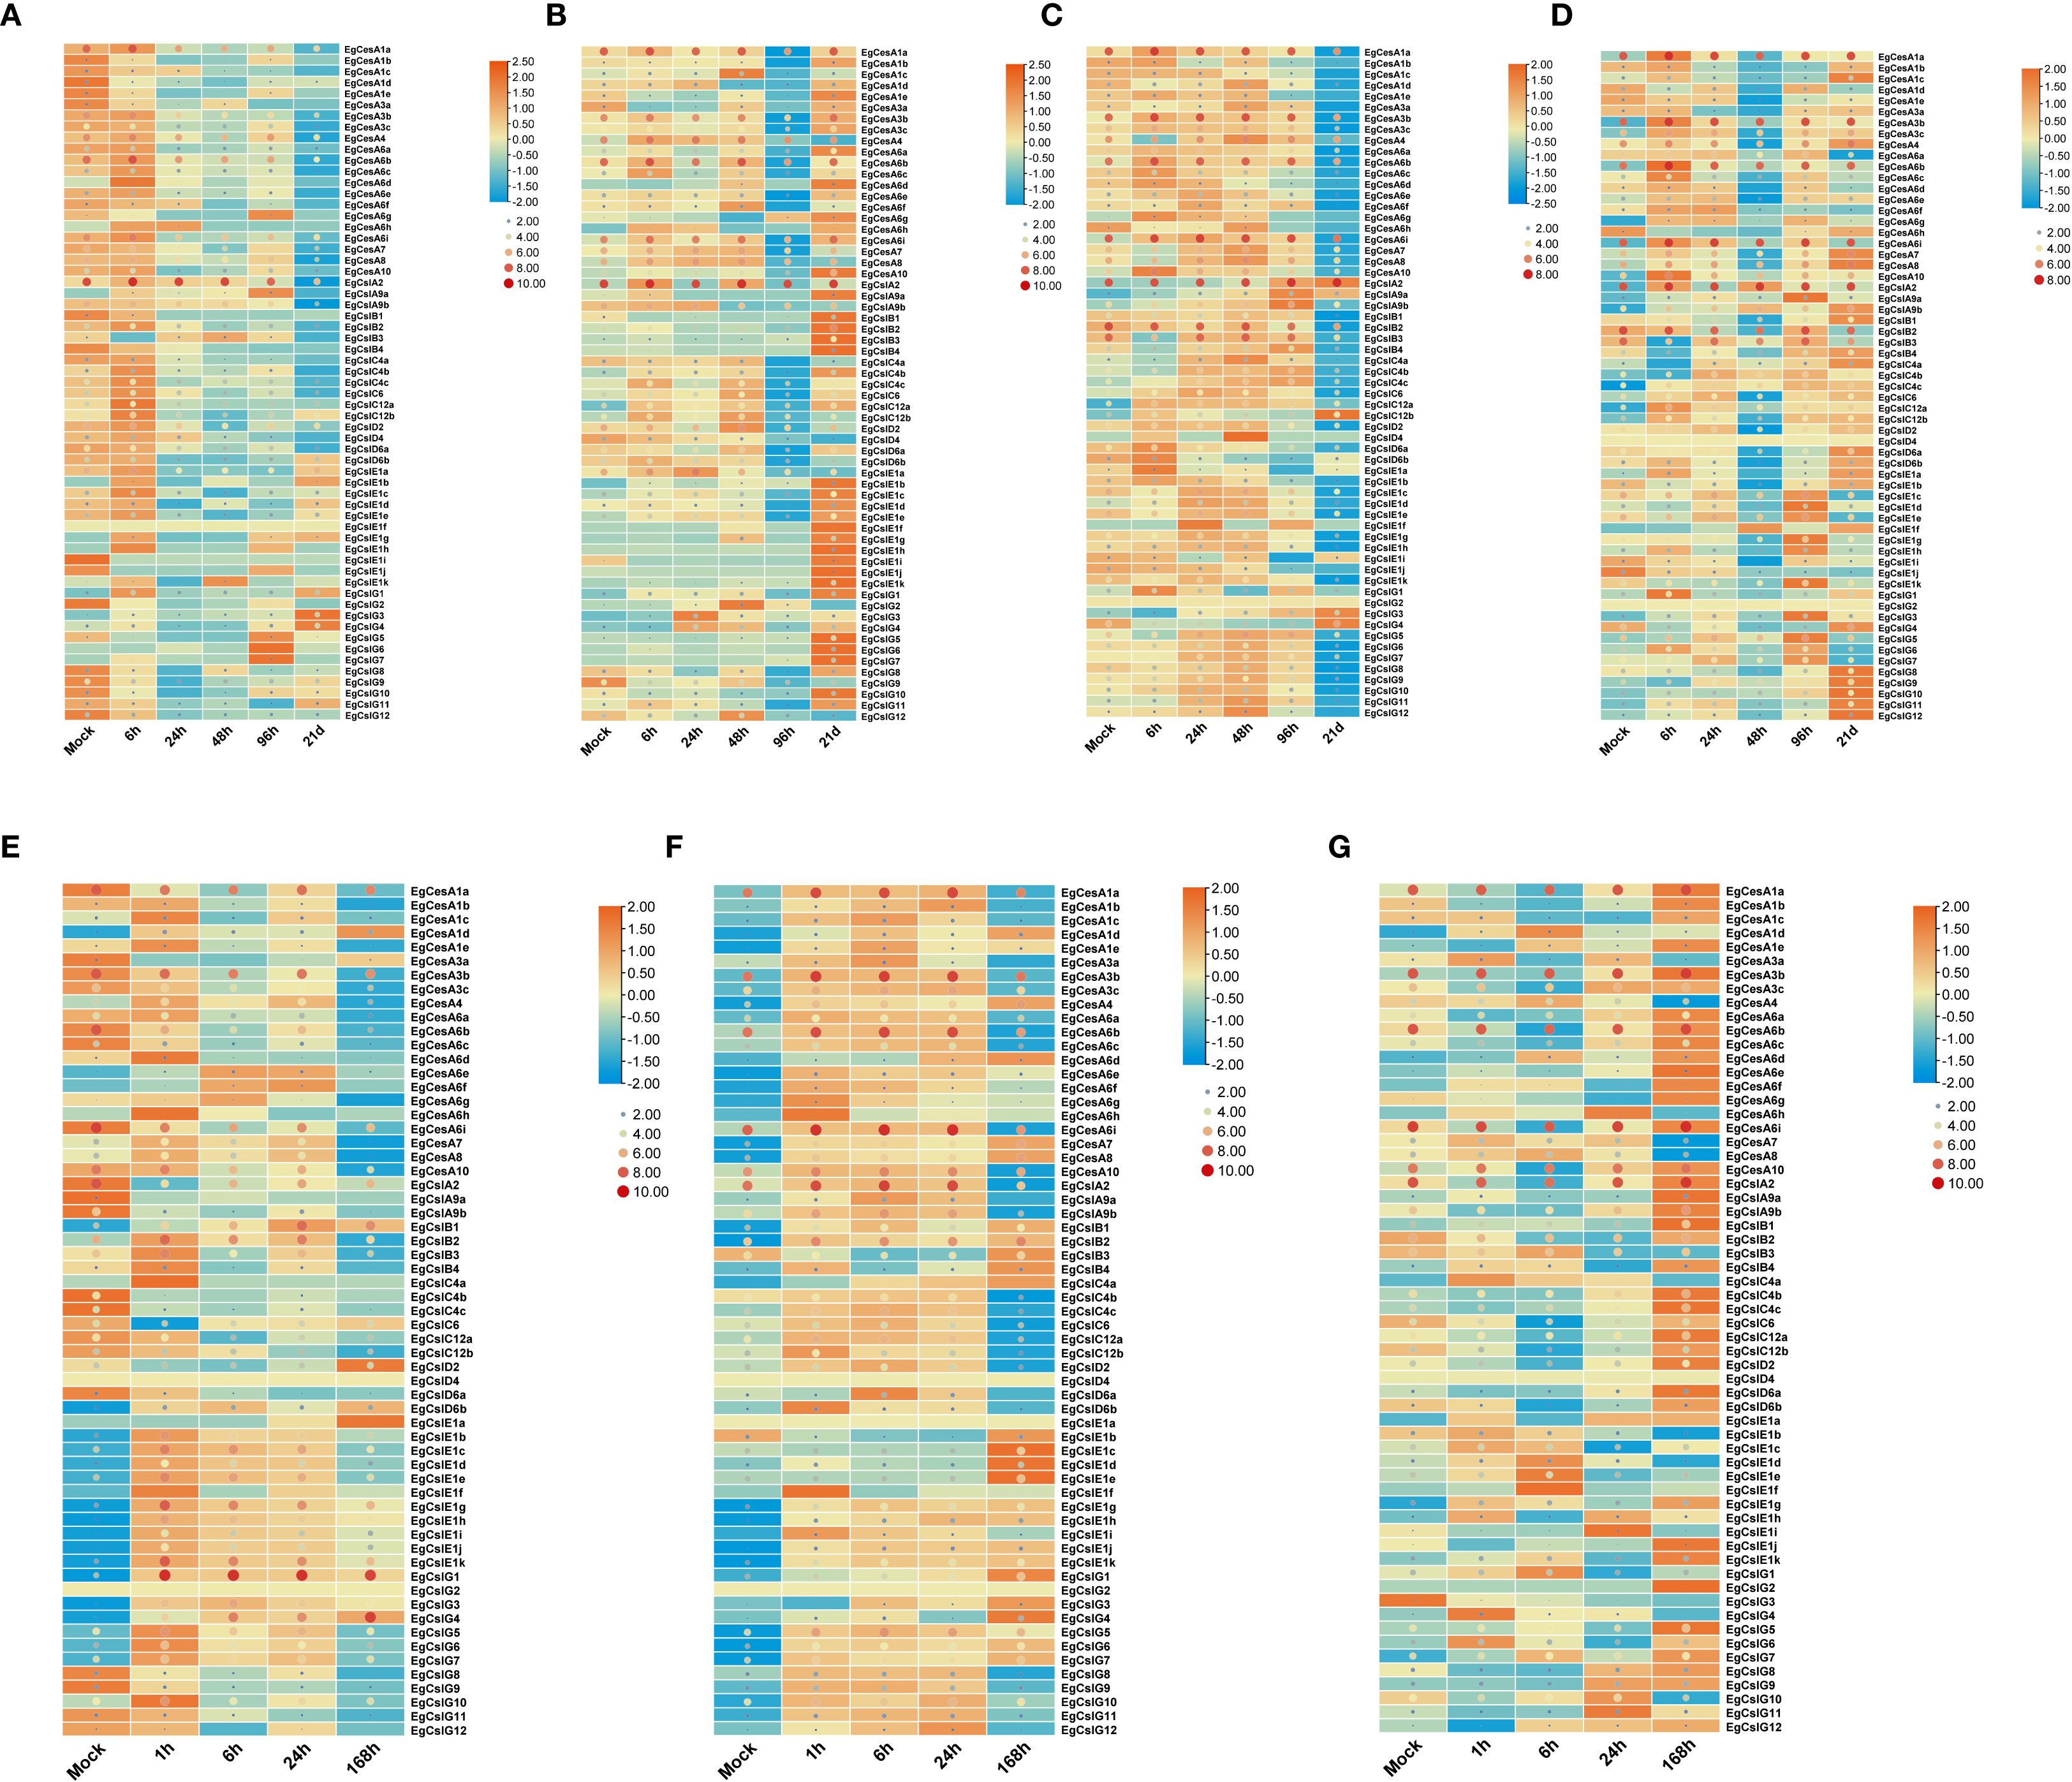
Figure 7. Gene expression of EgCesA/Csls genes under abiotic stress and hormone treatments. (A-D) Expression pattern of EgCesA/Csls genes under boron deficiency (a and c) and phosphorus deficiency treatment (b and d) after 0 h, 6 h, 24 h, 48 h, 96 h, and 21 (D) The root (a and b) and shoot (c and d) were used as samples. (E-G) Expression levels of EgCesA/Csls genes at 0 h, 1 h, 6 h, 24 h, and 168 h under salt stress (E), JA (F) and SA treatment (G). The heatmap was generated using TBtools-II based on the RNA-Seq data, with transformed data of log2(FPKM+1) value. Gene expression levels were represented by the color gradient, with orange indicating high expression and blue indicating low expression.Dot size and color represent EgCesA/Csls expression levels, with larger red dots indicating higher expression and smaller blue dots indicating lower expression. Gene cluster analysis was conducted on the gene expression levels by row.
3.8 3D structure analysis of EgCesA/Csls gene family members
Homology modeling was conducted using Swiss-Model, and the models were evaluated with SAVES, successfully obtaining the three-dimensional structures of multiple representative EgCesA/Csls proteins (Figure 8). Two genes from each subfamily were selected for in-depth analysis of their three-dimensional structures, which revealed high similarity within the same subfamily, with minimal structural differences. Based on the prediction results, AlphaFold was used to resolve the CSC complex structure of EgCesA4, EgCesA7, and EgCesA8, which were involved in secondary cell wall formation. The analysis yielded an ipTM score of 0.61 and a pTM score of 0.66, indicating a high confidence in the interactions among these three genes (Figure 8).
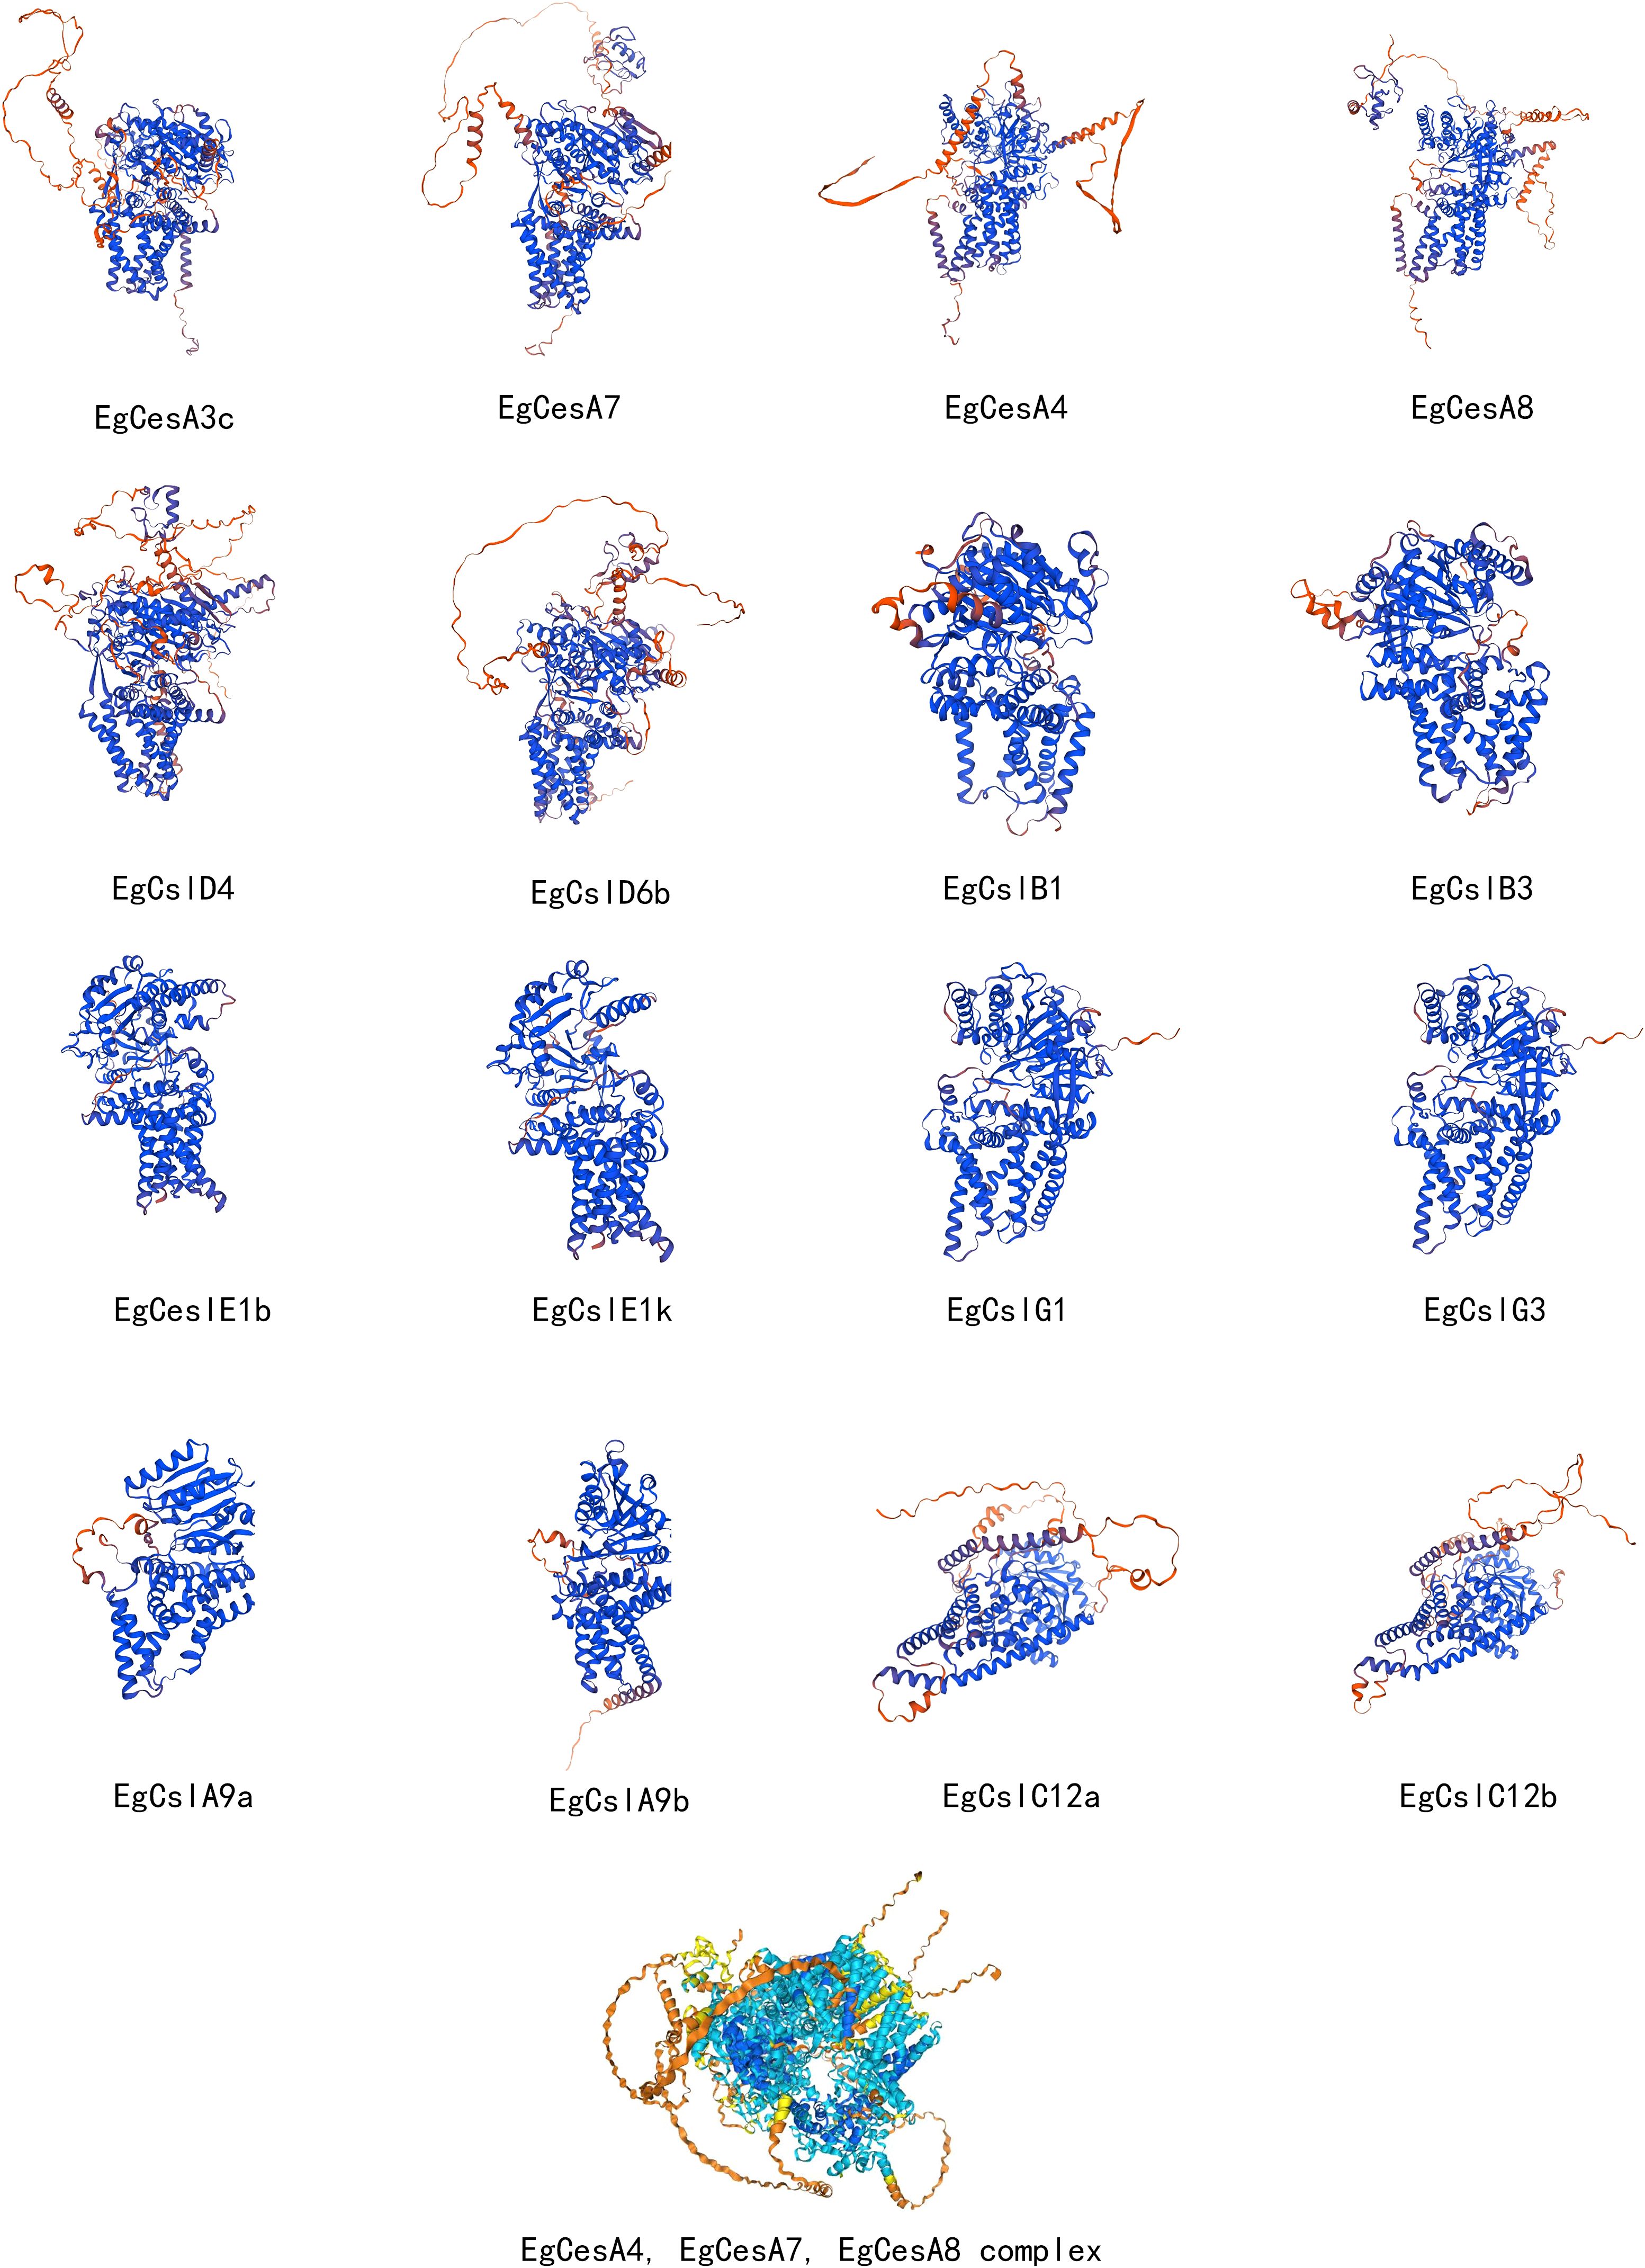
Figure 8. Three-dimensional structure analysis of members of the EgCesA/Csls gene family and EgCesA4, EgCesA7, EgCesA8 complex. In the visualization of the EgCesA4, EgCesA7, and EgCesA8 complexes, different colors indicate different binding strengths: dark blue indicates very high binding strength, light blue indicates confident binding strength, and yellow indicates low binding strength.
4 Discussion
Glycosyltransferases (GTs) were a class of enzymes that catalyze the attachment of sugar molecules to specific receptors via glycosidic bonds, and they were widely present in various organisms including plants, animals, and microorganisms (Lairson et al., 2008). In plants, these enzymes were particularly important as they directly participate in carbon allocation and energy storage by converting monosaccharides (such as glucose) produced through photosynthesis into disaccharides, oligosaccharides, and polysaccharides (Keegstra and Raikhel, 2001). In addition, glycosyltransferases drove the synthesis of plant cell wall polysaccharides (such as cellulose and hemicellulose) and were involved in the glycosylation modification of glycoproteins, glycolipids, and secondary metabolites (such as flavonoids and alkaloids) (Bowles et al., 2006). These functions played a crucial role in maintaining the structural integrity of plant cell walls, signal transduction, and stress resistance (Zhao et al., 2022). According to the classification of the Carbohydrate-Active enZymes Database (CAZy), plant glycosyltransferases had formed highly diversified gene families (such as the GT2 family), with members exhibiting significant differentiation in substrate specificity and function (Lombard et al., 2014).
The CesA gene family was closely related to the biosynthesis of plant cellulose. During cell wall formation, the proteins encoded by CesA genes catalyzed the polymerization of glucose molecules to form cellulose microfibrils, which were crucial for maintaining the strength and structural stability of the cell wall (Zhang et al., 2016). In different plants, there were multiple members of the CesA gene family, and they exhibited functional differences (Kumar and Turner, 2015). For example, in A.thaliana, different CesA genes played specific roles in the synthesis of primary and secondary wall cellulose (Carroll and Specht, 2011). The Csl gene family was involved in the synthesis of various cell wall polysaccharides and was closely linked to the synthesis of substances such as hemicellulose (Richmond and Somerville, 2000; Doblin et al., 2010). The Csl gene family comprised numerous members, each with distinct functions, and exhibited specific expression patterns in different tissues and organs during plant growth and development (Hazen et al., 2002; Yin et al., 2009). In A.thaliana, 10 CesA genes and 31 cellulose synthase-like (Csl) genes had been identified, and based on phylogenetic analysis, they were further classified into one CesA family and six Csl families (CslA/B/C/D/E/G) (Persson et al., 2007b). Based on the phylogenetic analysis, we identified 21 EgCesA genes and 41 Csl genes, which were further classified into one CesA family and six Csl families. The CesA family can be divided into two subclasses, with EgCesA1/3/6 and EgCesA4/7/8 serving as representative members. EgCesA1/3/6 is likely participated in the synthesis of primary wall fibers during cell elongation, with EgCesA1a/3b/6b/6i having higher expression levels in rapidly growing tissues such as the shoot apex, young leaves, and root tips. In contrast, EgCesA4/7/8 plays a role in cellulose synthesis during the thickening of secondary wall at the lignification stage, with increased expression levels observed in mature xylem and fiber cells (Figures 1, 6). These is consistent with that in Arabidopsis and poplar (Taylor et al., 2003; Desprez et al., 2007; Abbas et al., 2020), suggesting their conservation in these plant species. CslD genes (CslD1, CslD6a and CslD3) in A. thaliana were involved in the synthesis of mannose-containing polysaccharides (Liepman et al., 2005; Yin et al., 2011). The CslD genes were localized on the Golgi membrane, where they catalyzed the synthesis of 1,4-β-D-glucomannan by substrate GDP-glucose and GDP-mannose (Huang et al., 2018; Yang et al., 2020). In the CslD subfamily shown in Figure 6, EgCslD2 is highly expressed in roots and also highly expressed in stem apex, suggesting that CslD proteins may be involved in cellulose synthesis during root hair and shoot growth. Eg CslD4 shows low expression levels in all tissues; Eg CslD6a and Eg CslD6b show higher expression levels in roots and stem apex, with lower levels in other regions. The diverse expression patterns of these group members suggest that subfunctionalization of genes may have occurred during their evolutionary process.
A phylogenetic tree analysis was conducted on the CesA/Csls gene families of E. grandis, P. trichocarpa, A. thaliana, and P. patens. P. patens is a bryophyte that serves as an outgroup for calibrating phylogenetic time nodes, facilitating the identification of the evolutionary origin of E. grandis. A. thaliana, a model organism for eudicots, diverged early in evolutionary history, and its annotated genome facilitates the examination of gene family alterations in E. grandis. P. trichocarpa, a woody eudicot that diverged approximately 100 million years ago, serves as a reference for investigating wood formation and metabolic processes in E. grandis. Although both species exhibit rapid growth, they differ in their lignin composition. Analyzing genes such as CesA provides insights into the evolutionary trajectory of lignin biosynthesis. Clustering analysis revealed that EgCesA3c clustered in the same branch with AtCesA3 from A. thaliana, which were involved in primary cell wall cellulose synthesis (Desprez et al., 2007). This suggested that these E. grandis CesA genes may be involved in the synthesis of primary cell wall cellulose. EgCesA4, EgCesA7, and EgCesA8 were phylogenetically closer to AtCesA4, AtCesA7, and AtCesA8 from A.thaliana, respectively, which were involved in secondary cell wall cellulose synthesis (Arioli et al., 1998). There were 10 CesA genes in A. thaliana, whereas 21 CesA genes were identified in E. grandis, and although there was a significant increase in number, it was still three genes that were involved in secondary cell wall synthesis (EgCesA4, EgCesA7, and EgCesA8), and they were significantly expressed in the xylem in the subsequent tissue expression analysis. Therefore, it was inferred that these genes played a core role in secondary cell wall cellulose synthesis. P. patens genes were mainly distributed within the CesA, CslA, CslC and CslD families and exhibited a clustered distribution. In contrast, the tree species E. grandis and P. trichocarpa were more evenly distributed across the phylogenetic tree. This might be attributed to the fact that P. patens was a lower plant with a relatively low level of differentiation and slow species evolution. In contrast, P. trichocarpa and E. grandis have undergone more pronounced differentiation during evolution, better adapting to environmental changes, which reflected the strong stress resistance and stability of these species.
The expression heatmap analysis based on RNA-Seq data revealed that out of the gene set examined, 61 genes exhibited expression activity, with EgCslD1 being silent and showing no detectable expression signal. Among the expressed genes, EgCesA4, EgCesA7, and EgCesA8 demonstrated significant tissue-specific and developmental stage-specific expression patterns. These three genes were highly expressed in the xylem tissue of 6-month-old plants, with higher expression than those in other tissues and developmental stages. Moreover, EgCesA4, EgCesA7, and EgCesA8 also showed high expression levels in the 3rd, 5th, 7th, 9th, and 11th internodes of 6-month-old plants, as well as in the xylem tissue of 6-year-old plants. This expression pattern further confirms that EgCesA4, EgCesA7, and EgCesA8 were involved in the process of secondary wall thickening, specifically the cellulose biosynthetic pathway during the lignification stage, playing a crucial regulatory role in the formation of plant secondary cell walls and the lignification process. Cellulose synthase constitutes a rose knot-like cellulose synthase complex (CSC) at the plasma membrane, and two types of CSCs are involved in coordinated cellulose biosynthesis in the secondary cell wall of Populus, forming a multilayered structure that differentiates the xylem cells of Populus that undergo secondary cell wall thickening (Xi et al., 2017). In the present study, the high expression of EgCesA4, EgCesA7, and EgCesA8 in xylem in E. grandis might also constitute a complex involved in secondary cell wall synthesis and thickening. As is typical of woody plants, CSC and other complexes play important roles in cellulose structural characterization and multilayer wall structure formation during cell wall thickening in P. trichocarpa and E. grandis. Protein interaction network analysis is beneficial for predicting the composition of the cellulose synthase complex and elucidating its biological functions. Therefore, further investigation of the protein interaction network is necessary to characterize cellulose synthase complexes (CSCs) and their roles in cell wall synthesis.
When comparing the three-dimensional (3D) structures of proteins from different subfamilies, significant differences were observed. The results demonstrated high structural conservation within subfamily members, exhibiting only marginal variations (Figure 8). These structural variations were primarily attributed to the varying lengths of α-helices, β-turns, and γ-irregular coils among the proteins. The differences in these secondary structural elements resulted in altered folding angles of the proteins in space, and these changes in spatial conformation were highly likely to constitute the structural basis for the distinct functions of these proteins. Understanding the relationships between structure and function in cellulose synthases (CesAs) has been significantly enhanced by the partial elucidation of the structure of the CesA8 protein derived from poplar (PDB Entry-6WLB) using cryo-electron microscopy (Purushotham et al., 2020). PttCesA8 protein is a ortholog of Arabidopsis AtCesA8 and cotton GhCesA1, all of which belong to the cross-species CesA8 clade that facilitates the synthesis of cellulose in secondary walls (Zou et al., 2018). We compare the structure of EgCESA8 with PttCESA8 and AtCESA8, and found high similarity in these proteins, supporting the accuracy of the analysis (Supplementary Figure S2). The multiple alignment sequence were further conducted, suggesting their high conservation in the plant-conserved region (PCR), the class-specific region (CSR) and the conserved aspartic acids (D) and the QXXRW motif for donor and acceptor binding (Supplementary Figure S1). However, the members of CslA and CslC lack the PCR and CSR regions (Daras et al., 2021), resulting in a low-level similarity with CesA in structure (Figure 8). The rice fc17 mutant of the CesA4 protein, which is the ortholog of Arabidopsis CesA8 participated in secondary cell wall synthesis, contains an amino acid substitution (F426S) in the PCR region. The fc17 mutation influenced plant growth and resulted in increased lodging resistance, and also exhibited increased biomass saccharification efficiency and a decrease in cellulose content, accompanied by a compensatory rise in hemicellulose and lignin levels (Li et al., 2018). FxVTxK motif, which lies near the catalytic domain, exist within a substrate gating loop. Various mutation in this region showed change of the cellulose production (Daras et al., 2021). Therefore, these observations suggest that the PCR and FxVTxK motifs could serve as potential targets for cell wall modification in biotechnological applications. The FxVTxK motif was also investigated in EgCESA8, PttCESA8 and AtCesA8 (Supplementary Figure S1), and showing the conservation in this region. Additional functional studies on the FxVTxK motif in EgCESA8 are essential for understanding its role in cellulose synthesis. Through the analysis of the CSC complex structure formed by the proteins encoded by the three genes EgCesA4, EgCesA7, and EgCesA8, it was found that there was a cavity structure within the complex. It was speculated that this cavity structure could specifically bind to the substrate uridine diphosphate glucose (UDP-glucose). Knockout mutants of secondary cell wall CesA, including irx5-4 (cesa4), irx3-7 (cesa7), and irx1-7 (cesa8) with T-DNA insertions, display a range of phenotypic characteristics such as dark green leaves and inflorescence stems, collapsed xylem vessels, decreased plant height and cellulose content (Kumar et al., 2017). This complex CSC model provided more intuitive and compelling structural biological evidence for the involvement of EgCesA4, EgCesA7 and EgCesA8 in the cellulose biosynthetic pathway during the lignification stage, further elucidating the mechanism of action of these three genes in this biological process at the molecular level.
Cis-regulatory elements analysis provides crucial information for transcriptional regulation of CslC/CslA gene (Supplementary Table S2). The majority of these gene promoters included response elements for hormones and abiotic stress (Figure 5). Specifically, EgCesA1a and EgCslA2 exhibited consistently high expression levels across various treatments (Figure 7), which aligns with the presence of numerous cis-acting elements associated with hormone and stress responses (Figure 5). In addition, the high expression of these genes may also result from the combined effects of cross-talk among multiple signaling pathways (Wang et al., 2020), protein multifunctionality (Liu et al., 2017), and species-specific adaptive evolution (Wei et al., 2025), reflecting a strategy of “module reuse” by which plants cope with complex environmental stresses within a limited genome. Further functional investigation of these EgCesA/Csls by overexpression or knockout of these genes may help to elucidate their function in response to different stress conditions. Among the cis-acting elements identified in EgCesA/Csls genes promoters, MYB transcription factors related elements were widely distributed and presented in over half of the identified EgCesA/Csls (Figure 5). It was well-known the MYB transcription factors were highly expressed and widely involved in various stress responses, including drought and light responses, thereby regulating plant stress resistance, growth and development, and metabolic processes. In addition, MYB transcription factors could bind to the AC-box to regulate lignin biosynthesis genes (Xiao et al., 2021). Then they could directly promote secondary cell wall biosynthesis by regulating lignin, hemicellulose and cellulose pathway genes. Therefore, Data analysis from the heatmap showed that many members of this family were significantly expressed in the xylem, with lower expression in other tissues such as leaves, further highlighting their impact on cell wall formation. It has been found that two BBR-BPC transcription factors BPC1/BPC2 in Arabidopsis positively regulate plant β-1,4-galactan (a major component of pectin) accumulation (Yan et al., 2021). The binding sites of BBR-BPC were the most prevalent in the EgCesA/Csls promoters (Supplementary Figure S2), suggesting their potential roles in cell wall synthesis.
5 Conclusion
In this study, we identified 62 EgCesA/Csls genes containing cellulose synthase domains and classified them into seven subfamilies (CesA, CslA, CslC, CslB, CslD, CslE, and CslG). Furthermore, expression profile analysis showed that CesA/Csls genes exhibited different expression patterns in various tissues of E. grandis. Specifically, EgCesA4, EgCesA7, and EgCesA8 were likely to be primarily involved in cellulose synthesis during the secondary wall thickening (lignification) stage according to their high expression in xylem. This finding lays a robust foundation for further investigation into the CesA/Csls-mediated molecular mechanisms underlying the growth and development process of E. grandis. Additionally, it offers a promising theoretical foundation and genetic resources for the enhancement of wood quality in E. grandis, as well as for improving biomass utilization efficiency through genetic engineering strategies.
Data availability statement
The data presented in the study are deposited in the Genome Sequence Archive (GSA) at the National Genomics Data Center repository, accession number PRJCA002468.
Author contributions
RA: Formal Analysis, Writing – original draft, Data curation, Investigation, Methodology, Conceptualization, Funding acquisition. YH: Writing – original draft, Funding acquisition, Investigation, Formal Analysis, Conceptualization, Methodology, Data curation. CL: Data curation, Formal Analysis, Writing – original draft, Methodology, Funding acquisition, Conceptualization, Investigation. AW: Project administration, Supervision, Methodology, Writing – review & editing, Resources, Visualization, Software, Validation. CF: Data curation, Methodology, Investigation, Writing – review & editing. JL: Project administration, Validation, Resources, Writing – review & editing, Supervision, Methodology, Visualization, Software.
Funding
The author(s) declare financial support was received for the research and/or publication of this article. This work was funded by China Postdoctoral Science Foundation (Certificate Number : 2024M750964) and the Guangdong Basic and Applied Basic Research Foundation (2024A1515011209; 2023A1515030250).
Conflict of interest
The authors declare that the research was conducted in the absence of any commercial or financial relationships that could be construed as a potential conflict of interest.
Generative AI statement
The author(s) declare that no Generative AI was used in the creation of this manuscript.
Any alternative text (alt text) provided alongside figures in this article has been generated by Frontiers with the support of artificial intelligence and reasonable efforts have been made to ensure accuracy, including review by the authors wherever possible. If you identify any issues, please contact us.
Publisher’s note
All claims expressed in this article are solely those of the authors and do not necessarily represent those of their affiliated organizations, or those of the publisher, the editors and the reviewers. Any product that may be evaluated in this article, or claim that may be made by its manufacturer, is not guaranteed or endorsed by the publisher.
Supplementary material
The Supplementary Material for this article can be found online at: https://www.frontiersin.org/articles/10.3389/fpls.2025.1624134/full#supplementary-material
Abbreviations
GT2, The Glycosyltransferase 2; CesA, cellulose synthase; Csl, cellulose synthase-like; CSC, cellulose synthase complex.
References
Abbas, M., Peszlen, I., Shi, R., Kim, H., Katahira, R., Kafle, K., et al. (2020). Involvement of CesA4, CesA7-A/B and CesA8-A/B in secondary wall formation in Populus trichocarpa wood. Tree Physiol. 40, 73–89. doi: 10.1093/treephys/tpz020
Arioli, T., Peng, L., Betzner, A. S., Burn, J., Wittke, W., Herth, W., et al. (1998). Molecular analysis of cellulose biosynthesis in arabidopsis. Science 279, 717–720. doi: 10.1126/science.279.5351.717
Aspeborg, H., Schrader, J., Coutinho, P. M., Stam, M., Kallas, Å., Djerbi, S., et al. (2005). Carbohydrate-active enzymes involved in the secondary cell wall biogenesis in hybrid aspen. Plant Physiol. 137, 983–997. doi: 10.1104/pp.104.055087
Bowles, D., Lim, E.-K., Poppenberger, B., and Vaistij, F. E. (2006). GLYCOSYLTRANSFERASES OF LIPOPHILIC SMALL MOLECULES. Annu. Rev. Plant Biol. 57, 567–597. doi: 10.1146/annurev.arplant.57.032905.105429
Burton, R. A., Gidley, M. J., and Fincher, G. B. (2010). Heterogeneity in the chemistry, structure and function of plant cell walls. Nat. Chem. Biol. 6, 724–732. doi: 10.1038/nchembio.439
Carroll, A. and Specht, C. D. (2011). Understanding plant cellulose synthases through a comprehensive investigation of the cellulose synthase family sequences. Front. Plant Sci. 2. doi: 10.3389/fpls.2011.00005
Chen, C., Chen, H., Zhang, Y., Thomas, H. R., Frank, M. H., He, Y., et al. (2020). TBtools: an integrative toolkit developed for interactive analyses of big biological data. Mol. Plant 13, 1194–1202. doi: 10.1016/j.molp.2020.06.009
Cocuron, J.-C., Lerouxel, O., Drakakaki, G., Alonso, A. P., Liepman, A. H., Keegstra, K., et al. (2007). A gene from the cellulose synthase-like C family encodes a β-1,4 glucan synthase. Proc. Natl. Acad. Sci. 104, 8550–8555. doi: 10.1073/pnas.0703133104
Daras, G., Templalexis, D., Avgeri, F., Tsitsekian, D., Karamanou, K., and Rigas, S. (2021). Updating Insights into the Catalytic Domain Properties of Plant Cellulose synthase (CesA) and Cellulose synthase-like (Csl) Proteins. Molecules 26, 4335. doi: 10.3390/molecules26144335
Desprez, T., Juraniec, M., Crowell, E. F., Jouy, H., Pochylova, Z., Parcy, F., et al. (2007). Organization of cellulose synthase complexes involved in primary cell wall synthesis in Arabidopsis thaliana. Proc. Natl. Acad. Sci. 104, 15572–15577. doi: 10.1073/pnas.0706569104
Doblin, M. S., Pettolino, F., and Bacic, A. (2010). Plant cell walls: the skeleton of the plant world. Funct. Plant Biol. 37, 357. doi: 10.1071/FP09279
Doblin, M. S., Pettolino, F. A., Wilson, S. M., Campbell, R., Burton, R. A., Fincher, G. B., et al. (2009). A barley cellulose synthase-like CSLH gene mediates (1,3;1,4)-β- d -glucan synthesis in transgenic Arabidopsis. Proc. Natl. Acad. Sci. 106, 5996–6001. doi: 10.1073/pnas.0902019106
Fan, C., Lyu, M., Zeng, B., He, Q., Wang, X., Lu, M., et al. (2024). Profiling of the gene expression and alternative splicing landscapes of Eucalyptus grandis. Plant Cell Environ. 47, 1363–1378. doi: 10.1111/pce.14814
Fang, Y., Liao, H., Wei, Y., Yin, J., Cha, J., Liu, X., et al. (2025). OsCDPK24 and OsCDPK28 phosphorylate heat shock factor OsHSFA4d to orchestrate abiotic and biotic stress responses in rice. Nat. Commun. 16 (1), 6485. doi: 10.1038/s41467-025-61827-6
Farrokhi, N., Burton, R. A., Brownfield, L., Hrmova, M., Wilson, S. M., Bacic, A., et al. (2006). Plant cell wall biosynthesis: genetic, biochemical and functional genomics approaches to the identification of key genes. Plant Biotechnol. J. 4, 145–167. doi: 10.1111/j.1467-7652.2005.00169.x
Goubet, F., Barton, C. J., Mortimer, J. C., Yu, X., Zhang, Z., Miles, G. P., et al. (2009). Cell wall glucomannan in Arabidopsis is synthesised by CSLA glycosyltransferases, and influences the progression of embryogenesis. Plant J. 60, 527–538. doi: 10.1111/j.1365-313X.2009.03977.x
Hazen, S. P., Scott-Craig, J. S., and Walton, J. D. (2002). Cellulose synthase-like genes of rice. Plant Physiol. 128, 336–340. doi: 10.1104/pp.010875
Huang, Y.-P., He, T.-B., Cuan, X.-D., Wang, X.-J., Hu, J.-M., and Sheng, J. (2018). 1,4-β-d-Glucomannan from Dendrobium officinale Activates NF-кB via TLR4 to Regulate the Immune Response. Molecules 23, 2658. doi: 10.3390/molecules23102658
Keegstra, K. and Raikhel, N. (2001). Plant glycosyltransferases. Curr. Opin. Plant Biol. 4, 219–224. doi: 10.1016/S1369-5266(00)00164-3
Kumar, M., Atanassov, I., and Turner, S. (2017). Functional analysis of cellulose synthase (CESA) protein class specificity. Plant Physiol. 173, 970–983. doi: 10.1104/pp.16.01642
Kumar, M. and Turner, S. (2015). Plant cellulose synthesis: CESA proteins crossing kingdoms. Phytochemistry 112, 91–99. doi: 10.1016/j.phytochem.2014.07.009
Lairson, L. L., Henrissat, B., Davies, G. J., and Withers, S. G. (2008). Glycosyltransferases: structures, functions, and mechanisms. Annu. Rev. Biochem. 77, 521–555. doi: 10.1146/annurev.biochem.76.061005.092322
Li, G., Liu, X., Liang, Y., Zhang, Y., Cheng, X., and Cai, Y. (2020). Genome-wide characterization of the cellulose synthase gene superfamily in Pyrus bretschneideri and reveal its potential role in stone cell formation. Funct. Integr. Genomics 20, 723–738. doi: 10.1007/s10142-020-00747-8
Li, F., Liu, S., Xu, H., and Xu, Q. (2018). A novel FC17/CESA4 mutation causes increased biomass saccharification and lodging resistance by remodeling cell wall in rice. Biotechnol. Biofuels 11, 298. doi: 10.1186/s13068-018-1298-2
Li, X., Tang, C., Li, X., Zhu, X., Cai, Y., Wang, P., et al. (2022). Cellulose accumulation mediated by PbrCSLD5, a cellulose synthase-like protein, results in cessation of pollen tube growth in Pyrus bretschneideri. Physiol. Plant 174 (3), e13700. doi: 10.1111/ppl.13700
Li, L., Tang, J., Wu, A., Fan, C., and Li, H. (2024). Genome-wide identification and functional analysis of the GUX gene family in eucalyptus grandis. Int. J. Mol. Sci. 25, 8199. doi: 10.3390/ijms25158199
Li, Y., Yang, T., Dai, D., Hu, Y., Guo, X., and Guo, H. (2017). Evolution, gene expression profiling and 3D modeling of CSLD proteins in cotton. BMC Plant Biol. 17, 119. doi: 10.1186/s12870-017-1063-x
Liepman, A. H., Wilkerson, C. G., and Keegstra, K. (2005). Expression of cellulose synthase-like (Csl) genes in insect cells reveals that CslA family members encode mannan synthases. Proc. Natl. Acad. Sci. 102, 2221–2226. doi: 10.1073/pnas.0409179102
Little, A., Lahnstein, J., Jeffery, D. W., Khor, S. F., Schwerdt, J. G., Shirley, N. J., et al. (2019). A novel (1,4)-β-linked glucoxylan is synthesized by members of the cellulose synthase-like F gene family in land plants. ACS Cent. Sci. 5, 73–84. doi: 10.1021/acscentsci.8b00568
Little, A., Schwerdt, J. G., Shirley, N. J., Khor, S. F., Neumann, K., O’Donovan, L. A., et al. (2018). Revised phylogeny of the cellulose synthase gene superfamily: insights into cell wall evolution. Plant Physiol. 177, 1124–1141. doi: 10.1104/pp.17.01718
Liu, Y., Song, Q., Li, D., Yang, X., and Li, D. (2017). Multifunctional roles of plant dehydrins in response to environmental stresses. Front. Plant Sci. 8. doi: 10.3389/fpls.2017.01018
Lombard, V., Golaconda Ramulu, H., Drula, E., Coutinho, P. M., and Henrissat, B. (2014). The carbohydrate-active enzymes database (CAZy) in 2013. Nucleic Acids Res. 42, D490–D495. doi: 10.1093/nar/gkt1178
Lou, H., Tucker, M. R., Shirley, N. J., Lahnstein, J., Yang, X., Ma, C., et al. (2022). The cellulose synthase-like F3 (CslF3) gene mediates cell wall polysaccharide synthesis and affects root growth and differentiation in barley. Plant J. 110, 1681–1699. doi: 10.1111/tpj.15764
McFarlane, H. E., Döring, A., and Persson, S. (2014). The cell biology of cellulose synthesis. Annu. Rev. Plant Biol. 65, 69–94. doi: 10.1146/annurev-arplant-050213-040240
Myburg, A. A., Grattapaglia, D., Tuskan, G. A., Hellsten, U., Hayes, R. D., Grimwood, J., et al. (2014). The genome of Eucalyptus grandis. Nature 510, 356–362. doi: 10.1038/nature13308
Ouyang, S., Zhu, W., Hamilton, J., Lin, H., Campbell, M., Childs, K., et al. (2007). The TIGR Rice Genome Annotation Resource: improvements and new features. Nucleic Acids Res. 35, D883–D887. doi: 10.1093/nar/gkl976
Panchy, N., Lehti-Shiu, M., and Shiu, S.-H. (2016). Evolution of gene duplication in plants. Plant Physiol. 171, 2294–2316. doi: 10.1104/pp.16.00523
Park, S., Szumlanski, A. L., Gu, F., Guo, F., and Nielsen, E. (2011). A role for CSLD3 during cell-wall synthesis in apical plasma membranes of tip-growing root-hair cells. Nat. Cell Biol. 13, 973–980. doi: 10.1038/ncb2294
Paterson, A. H., Bowers, J. E., Bruggmann, R., Dubchak, I., Grimwood, J., Gundlach, H., et al. (2009). The Sorghum bicolor genome and the diversification of grasses. Nature 457, 551–556. doi: 10.1038/nature07723
Persson, S., Caffall, K. H., Freshour, G., Hilley, M. T., Bauer, S., Poindexter, P., et al. (2007a). The Arabidopsis irregular xylem8 Mutant Is Deficient in Glucuronoxylan and Homogalacturonan, Which Are Essential for Secondary Cell Wall Integrity. Plant Cell 19, 237–255. doi: 10.1105/tpc.106.047720
Persson, S., Paredez, A., Carroll, A., Palsdottir, H., Doblin, M., Poindexter, P., et al. (2007b). Genetic evidence for three unique components in primary cell-wall cellulose synthase complexes in Arabidopsis. Proc. Natl. Acad. Sci. 104, 15566–15571. doi: 10.1073/pnas.0706592104
Polko, J. K. and Kieber, J. J. (2019). The regulation of cellulose biosynthesis in plants. Plant Cell 31, 282–296. doi: 10.1105/tpc.18.00760
Purushotham, P., Ho, R., and Zimmer, J. (2020). Architecture of a catalytically active homotrimeric plant cellulose synthase complex. Science 369, 1089–1094. doi: 10.1126/science.abb2978
Pydiura, N. A., Bayer, G. Y., Galinousky, D. V., Yemets, A. I., Pirko, Y. V., Podvitski, T. A., et al. (2015). Bioinformatic search and phylogenetic analysis of the cellulose synthase genes of flax (linum usitatissimum). Tsitol. Genet. 49, 3–12. doi: 10.3103/S0095452715050084
Richmond, T. A. and Somerville, C. R. (2000). The cellulose synthase superfamily. Plant Physiol. 124, 495–498. doi: 10.1104/pp.124.2.495
Sod, B., Xu, L., Liu, Y., He, F., Xu, Y., Li, M., et al. (2023). Genome-wide identification and expression analysis of the cesA/csl gene superfamily in alfalfa (Medicago sativa L.). Agriculture 13, 1658. doi: 10.3390/agriculture13091658
Takata, N. and Taniguchi, T. (2015). Expression divergence of cellulose synthase (CesA) genes after a recent whole genome duplication event in Populus. Planta 241, 29–42. doi: 10.1007/s00425-014-2217-9
Taylor, N. G., Howells, R. M., Huttly, A. K., Vickers, K., and Turner, S. R. (2003). Interactions among three distinct CesA proteins essential for cellulose synthesis. Proc. Natl. Acad. Sci. 100, 1450–1455. doi: 10.1073/pnas.0337628100
Vega-Sánchez, M. E., Verhertbruggen, Y., Christensen, U., Chen, X., Sharma, V., Varanasi, P., et al. (2012). Loss of cellulose synthase - like F6 function affects mixed-linkage glucan deposition, cell wall mechanical properties, and defense responses in vegetative tissues of rice. Plant Physiol. 159, 56–69. doi: 10.1104/pp.112.195495
Wang, J., Li, J., Lin, W., Deng, B., Lin, L., Lv, X., et al. (2022). Genome-wide identification and adaptive evolution of CesA/Csl superfamily among species with different life forms in Orchidaceae. Front. Plant Sci. 13. doi: 10.3389/fpls.2022.994679
Wang, J., Song, L., Gong, X., Xu, J., and Li, M. (2020). Functions of jasmonic acid in plant regulation and response to abiotic stress. Int. J. Mol. Sci. 21, 1446. doi: 10.3390/ijms21041446
Wang, W., Wang, L., Chen, C., Xiong, G., Tan, X.-Y., Yang, K.-Z., et al. (2011). Arabidopsis CSLD1 and CSLD4 are required for cellulose deposition and normal growth of pollen tubes. J. Exp. Bot. 62, 5161–5177. doi: 10.1093/jxb/err221
Wang, W., Wu, Y., and Messing, J. (2014). RNA-Seq transcriptome analysis of Spirodela dormancy without reproduction. BMC Genomics 15, 60. doi: 10.1186/1471-2164-15-60
Wei, J., Han, Y., Xu, H., Deng, L., Li, L., Zhang, S., et al. (2025). AAAP gene family evolution and transcriptional regulation in Eucalyptus grandis under nitrogen, phosphate and boron deficiencies. BMC Plant Biol. 25, 879. doi: 10.1186/s12870-025-06907-x
Welker, C., Balasubramanian, V., Petti, C., Rai, K., DeBolt, S., and Mendu, V. (2015). Engineering plant biomass lignin content and composition for biofuels and bioproducts. Energies 8, 7654–7676. doi: 10.3390/en8087654
Xi, W., Song, D., Sun, J., Shen, J., and Li, L. (2017). Formation of wood secondary cell wall may involve two type cellulose synthase complexes in Populus. Plant Mol. Biol. 93, 419–429. doi: 10.1007/s11103-016-0570-8
Xiao, R., Zhang, C., Guo, X., Li, H., and Lu, H. (2021). MYB transcription factors and its regulation in secondary cell wall formation and lignin biosynthesis during xylem development. Int. J. Mol. Sci. 22, 3560. doi: 10.3390/ijms22073560
Yan, J., Liu, Y., Yang, L., He, H., Huang, Y., Fang, L., et al. (2021). Cell wall β-1,4-galactan regulated by the BPC1/BPC2-GALS1 module aggravates salt sensitivity in Arabidopsis thaliana. Mol. Plant 14, 411–425. doi: 10.1016/j.molp.2020.11.023
Yang, J., Bak, G., Burgin, T., Barnes, W. J., Mayes, H. B., Peña, M. J., et al. (2020). Biochemical and Genetic Analysis Identify CSLD3 as a beta-1,4-Glucan Synthase That Functions during Plant Cell Wall Synthesis. Plant Cell 32, 1749–1767. doi: 10.1105/tpc.19.00637
Yin, Y., Huang, J., and Xu, Y. (2009). The cellulose synthase superfamily in fully sequenced plants and algae. BMC Plant Biol. 9, 99. doi: 10.1186/1471-2229-9-99
Yin, Y., Johns, M. A., Cao, H., and Rupani, M. (2014). A survey of plant and algal genomes and transcriptomes reveals new insights into the evolution and function of the cellulose synthase superfamily. BMC Genomics 15, 260. doi: 10.1186/1471-2164-15-260
Yin, L., Verhertbruggen, Y., Oikawa, A., Manisseri, C., Knierim, B., Prak, L., et al. (2011). The cooperative activities of CSLD2, CSLD3, and CSLD5 are required for normal arabidopsis development. Mol. Plant 4, 1024–1037. doi: 10.1093/mp/ssr026
Zabotina, O. A., Zhang, N., and Weerts, R. (2021). Polysaccharide biosynthesis: glycosyltransferases and their complexes. Front. Plant Sci. 12. doi: 10.3389/fpls.2021.625307
Zhang, B., Gao, Y., Zhang, L., and Zhou, Y. (2021). The plant cell wall: Biosynthesis, construction, and functions. J. Integr. Plant Biol. 63, 251–272. doi: 10.1111/jipb.13055
Zhang, T., Zheng, Y., and Cosgrove, D. J. (2016). Spatial organization of cellulose microfibrils and matrix polysaccharides in primary plant cell walls as imaged by multichannel atomic force microscopy. Plant J. 85, 179–192. doi: 10.1111/tpj.13102
Zhao, H., Li, Z., Wang, Y., Wang, J., Xiao, M., Liu, H., et al. (2022). Cellulose synthase-like protein OsCSLD4 plays an important role in the response of rice to salt stress by mediating abscisic acid biosynthesis to regulate osmotic stress tolerance. Plant Biotechnol. J. 20, 468–484. doi: 10.1111/pbi.13729
Keywords: glycosyltransferase, CesA/Csls gene family, cell wall, Eucalyptus grandis, expression analysis
Citation: An R, Huang Y, Lei C, Wu A-M, Fan C and Long J (2025) Genome-wide identification and expression analysis of the CesA/Csls gene family in Eucalyptus Grandis. Front. Plant Sci. 16:1624134. doi: 10.3389/fpls.2025.1624134
Received: 07 May 2025; Accepted: 26 September 2025;
Published: 13 October 2025.
Edited by:
Baohua Wang, Nantong University, ChinaReviewed by:
Jing Si, Beijing Forestry University, ChinaHongwei Jing, Duke University, United States
Copyright © 2025 An, Huang, Lei, Wu, Fan and Long. This is an open-access article distributed under the terms of the Creative Commons Attribution License (CC BY). The use, distribution or reproduction in other forums is permitted, provided the original author(s) and the copyright owner(s) are credited and that the original publication in this journal is cited, in accordance with accepted academic practice. No use, distribution or reproduction is permitted which does not comply with these terms.
*Correspondence: Jianmei Long, bG9uZ2ppYW5tZWlAc2NhdS5lZHUuY24=
†These authors share first authorship