 Xinwei Xue1,2*
 Zhikun Yu2Ankang Mu2Fan Yang2Dan Liu2Shi Zhang2Jialin Zhang2Yao Cheng2Yushan Zhao2Yongping Zhang1*Xianrui Wang2*
- 1College of Agronomy,Inner Mongolia Agricultural University, Hohhot, Inner Mongolia, China
- 2Chifeng Academy of Agricultural and Animal Husbandry Sciences, Chifeng, Inner Mongolia, China
Foxtail millet (Setaria italica) is a specialty mixed grain crop that originated in China. This study comprehensively assessed the phenotypic variability of 1,558 foxtail millet accessions to explore their genetic diversity and facilitate effective germplasm conservation. A total of 25 traits, including 11 quantitative and 14 qualitative, were investigated based on the quantization of physical and chemical descriptors and digital image analysis. The findings revealed significant variations in the coefficient of variation (CV) among the quantitative traits, which ranged from 3.90–28.38%. That of the qualitative traits ranged from 7.44–66.20%. The Shannon-Wiener Index (H′) of the quantitative traits ranged between 1.86–2.08, and that of the qualitative traits ranged from 0.04–1.40. High genetic diversity was also detected among the 1,558 accessions. Based on hierarchical clustering, 1,558 accessions were separated into five categories. The principal component analysis (PCA) results indicated that 10 principal components were extracted when the cumulative contribution rate of the phenotypic traits reached 64.30%. The comprehensive evaluation F-values calculated based on correlation and PCA analyses of 25 phenotypic traits were applied to all the accessions, and the top 10 varieties were identified. Collectively, this study showed the rich genetic diversity of the 1,558 foxtail millet accessions, which could provide a baseline for breeding new millet varieties.
1 Introduction
Foxtail millet (Setaria italica), an indigenous pseudo-cereal crop originating in China, was domesticated approximately 11,000 years ago from wild green foxtail (Setaria viridis) in northern China. This crop has been instrumental in shaping Chinese agricultural civilization and advancing dryland farming systems (Diao, 2019; Lv, 2018). Foxtail millet is a dual-purpose crop with significant potential for dietary improvement, resource conservation, and environmental sustainability. Nutritionally, it provides a well-balanced composition of essential micronutrients and bioactive compounds. As forage, it exhibits favorable characteristics, including high palatability, superior digestibility, and elevated crude protein content in aerial biomass (He et al., 2023; Jia et al., 2013; Jia and Diao, 2017). Furthermore, its distinctive agronomic traits, including short growth duration, exceptional water-use efficiency, and superior drought resistance, make it a cornerstone crop for sustainable dryland agroecosystems (Diao, 2017; Pardo and VanBuren, 2021). China maintains a foxtail millet cultivation area of 1.3 million hectares annually, producing over 2 million metric tons of foxtail millet, with world-leading productivity. The Inner Mongolia–Hebei–Shanxi production belt, which accounts for 67.1% of the national output through concentrated cultivation in these three provinces, has emerged as a characteristic agroecological zone for premium millet production (Yang et al., 2022, 2024).
Germplasm resources constitute the fundamental basis for genetic improvement and cultivar innovation of foxtail millet plants. China’s National Genebank currently conserves 28,915 accessions, representing 70% of the global foxtail millet germplasm, with remarkable genetic diversity documented through recent genomic surveys (Jia and Diao, 2022; Li et al., 2021). Contemporary breeding practices constrained by climate variability, agricultural intensification, and market-driven selection pressures have led to excessive reliance on narrow founder germplasm. Genetic erosion has resulted in diminished allelic diversity in modern cultivars, posing a significant threat to the species’ genetic reservoir (Jin et al., 2025). The systematic characterization and innovative utilization of foxtail millet germplasm have become critical priorities. Recent advances in high-throughput phenotyping and genomic selection have enabled more efficient germplasm exploitation, as evidenced by recent studies (Chen et al., 2023; Costa et al., 2017; Zhang et al., 2025; Zhou et al., 2015). Phenotypic diversity analysis enables the comprehensive characterization of germplasm attributes and elucidation of inheritance patterns, providing essential insights for deciphering crop domestication processes and informing precision breeding strategies. Huang et al. (2024) characterized 603 Shanxi accessions using 14 phenotypic parameters, revealing significant variation (CV=15.8–42.3%) and high Shannon diversity indices (H’=1.02–2.15), demonstrating the potential of this germplasm for broadening the genetic base of elite cultivars. Meng et al. (2024) identified two distinct ideotypes through multivariate analysis of 12 forage-related traits in 181 accessions: tall-stature types (180–220 cm) demonstrating high biomass yield (18–22 t/ha), and high leaf-stem ratio genotypes (>0.45) suitable for premium forage production. Xiang et al. (2020) conducted an ecogeographic characterization of 435 accessions across six agroecological zones, revealing significant (P<0.01) environment-trait interactions and distinct phenotypic adaptation patterns. Existing diversity studies have been constrained by regional sampling biases (68% from North China), limited germplasm representation (n<500), and incomplete trait coverage (≤20 traits). Nationwide investigations that systematically evaluate diverse germplasm types (landraces, cultivars, and elite lines) using comprehensive phenotyping (>25 traits) remain scarce. This study implemented a multidimensional evaluation framework incorporating 11 quantitative and 14 qualitative descriptors for 1,558 foxtail millet accessions (847 landraces, 432 breeding lines, and 256 cultivars). Advanced analytical approaches, including multivariate statistics, principal component analysis (PCA), and hierarchical clustering, were employed to: (1) establish comprehensive phenotypic profiles, (2) identify novel genetic variations, and (3) facilitate the strategic utilization of elite germplasm. These findings provide critical insights for enhancing genetic diversity in breeding programs and for establishing a foundation for the development of next-generation cultivars.
2 Materials and methods
2.1 Plant materials
A total of 1,558 foxtail millet accessions were obtained (Supplementary Table 1), including 847 local varieties, 432 species strains, 256 selected varieties, 4 genetic materials, and 19 other materials. The local varieties, species strains, genetic materials, and other materials were provided by the Academy of Agricultural and Animal Husbandry Sciences, Chifeng, Inner Mongolia, China. The selected varieties were provided by the National Millet Crops Research and Development System.
2.2 Experimental design
The experiment was carried out from 2023 to 2024 in the experimental demonstration base of the Academy of Agricultural and Animal Husbandry Sciences (41°51′ N; 119°08′ E), Chifeng, Inner Mongolia, China. The region is located in the northern part of the Yanshan Hills, with a temperate continental arid and semi-arid climate, average annual evaporation of 1600–2000 mm, frost-free period of 135–150 d, average annual temperature of 6.4 °C, and average altitude of 540 m above sea level. The previous crop at the experimental site in both years was corn. The experimental site featured sandy loam, the average soil organic matter content over the previous two years was 11.8 g·kg-1, alkaline dissolved nitrogen was 51.3 mg·kg-1, effective phosphorus was 22.8 mg·kg-1, quick-acting potassium was 86 mg·kg-1, and pH was 7.78.
The trial employed a randomized complete block design with triplicate plots. Individual plots, which measured 10 m2 (2 m × 5 m), were established using Beidou satellite navigation-guided shallow-buried drip irrigation systems with alternating narrow-wide rows (60 + 40 cm). They featured 0.5 m average row spacing, 5 m row length, and four rows were cultivated per accessions. Mechanized furrow opening followed by manual seed broadcasting was performed on May 15, 2023, and May 23, 2024. A pre-sowing basal fertilization regime using NPK compound fertilizer (18–18–18) at 600 kg·ha-¹ was administered, with no supplementary fertilization throughout the cropping season. Seedling emergence was achieved through drip irrigation, followed by standardized thinning to maintain consistent plant density per meter. Scheduled irrigations (225 m³·ha-¹ per event) were implemented at five critical growth phases: seedling establishment, jointing, heading, anthesis, and grain filling. Harvesting operations were systematically performed on September 25, 2023, and October 1, 2024, corresponding to the physiological maturity stages of the plants. The agroclimatic parameters characterizing the 2023 and 2024 growing seasons are presented in Figure 1.
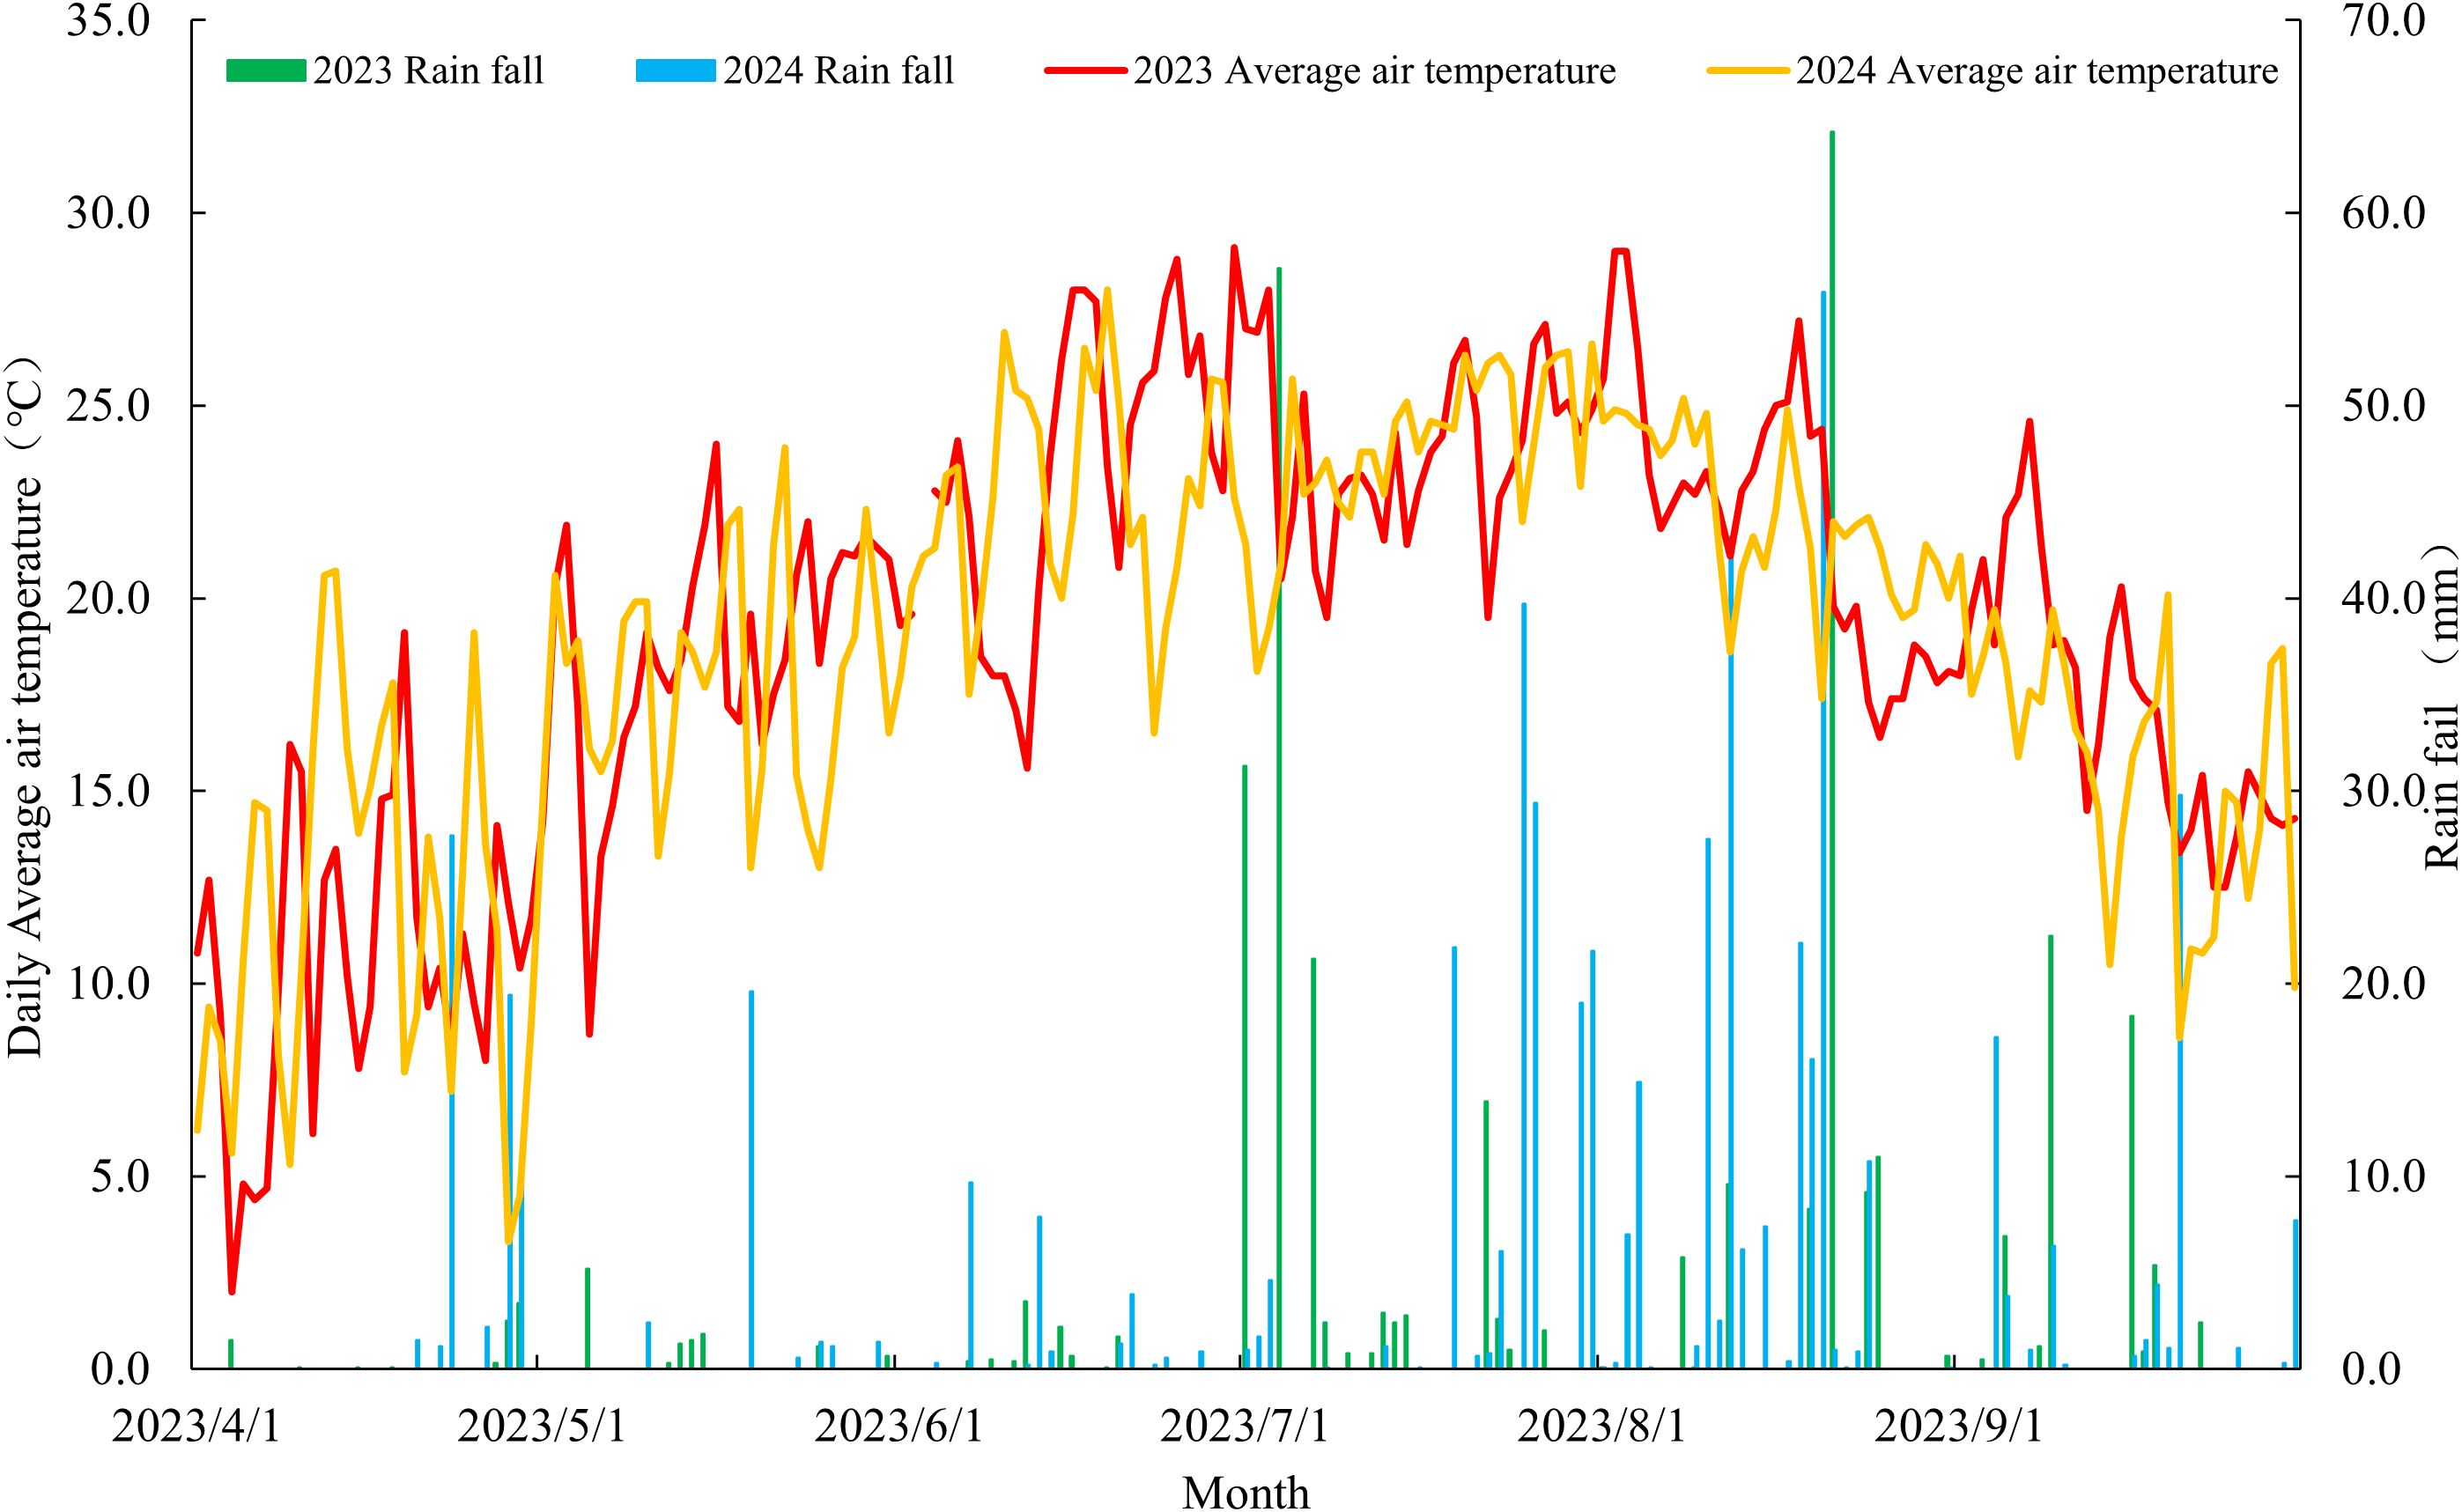
Figure 1. Temperature and precipitation during the growth and development of millet.
2.3 Selection and determination of phenotypic traits
A total of 25 representative phenotypic traits with relative genetic stability were investigated in 1,558 foxtail millet accessions, comprising 11 quantitative and 14 qualitative traits. Specific measurement methods for quantitative traits are provided in Table 1, and the evaluation criteria for qualitative traits are listed in Table 2. The qualitative traits were quantified and calculated according to the regulations (Lu, 2006; accessible via https://www.cgris.net). Both of which follow standardized quantification protocols. Observations were conducted on at least three individual plants per indicator and the average values were determined for quantitative traits. The investigation standards were established according to the “Descriptive Standards for Foxtail Millloet Germplasm Resources” (Lu, 2006; accessible via https://www.cgris.net) maintained by the National Crop Germplasm Resources Platform (National Crop Science Data Center). The final trait values were derived from the two-year average measurements of the obtained data.
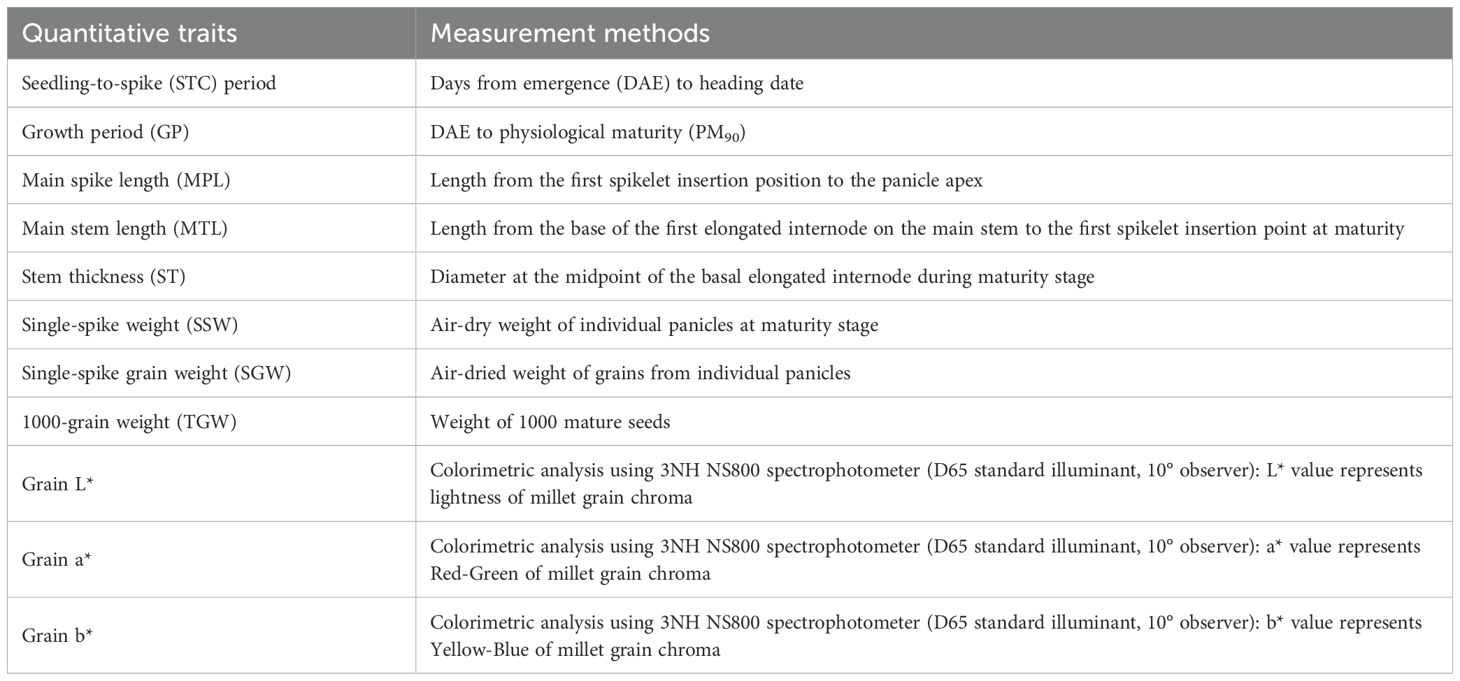
Table 1. Quantitative traits and the associated test methods used in the experiment.
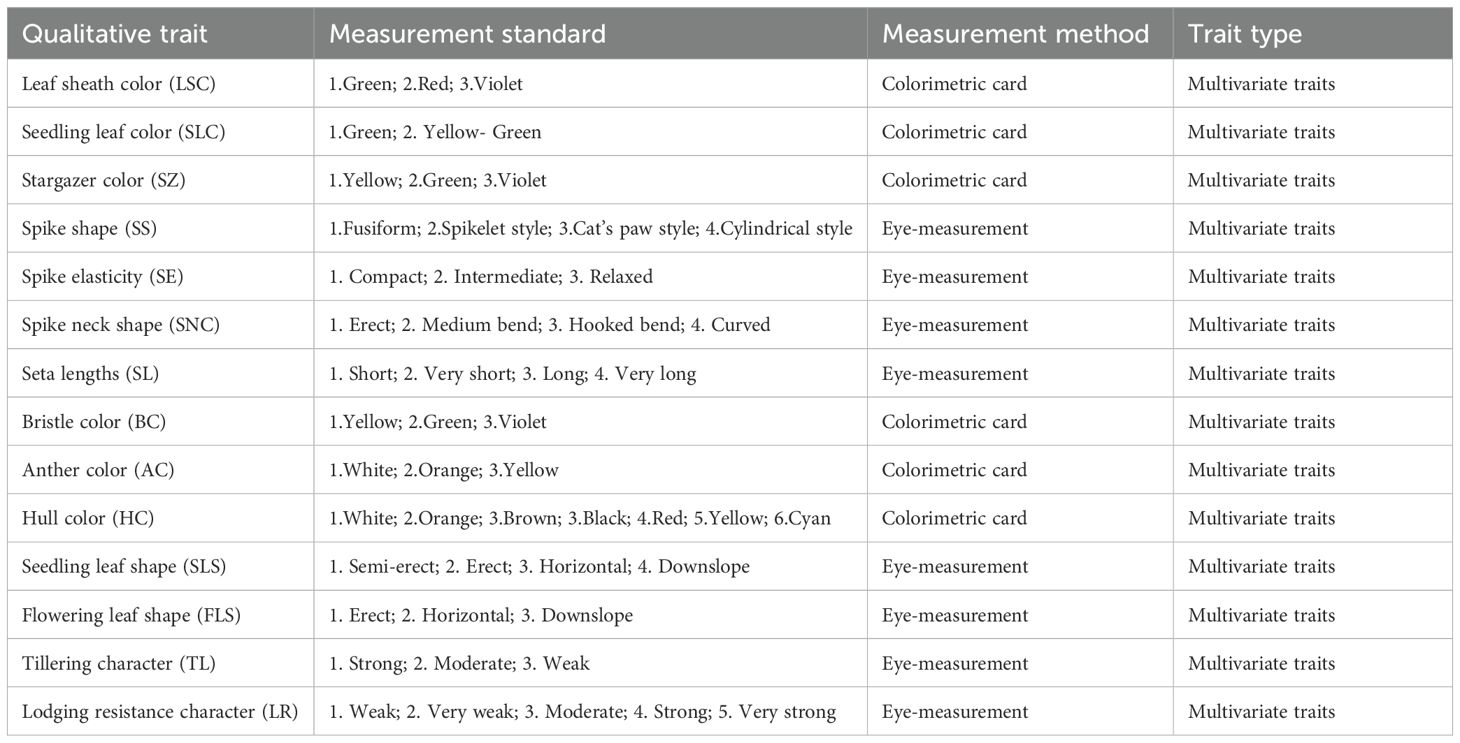
Table 2. Qualitative traits and the associated test methods used in the experiment.
2.4 Calculation formula
The genetic diversity index (Shannon-Wiener index) was calculated by stratifying traits into 10 classes using the mean (X¯) and standard deviation (S). The classification ranged from class 1 (Xi ≤ X¯ - 2S) to class 10 (Xi ≥ X¯ + 2S), with 0.5 S intervals defining each class. Relative frequencies across classes were subsequently employed to derive the index values.
Where Pi denotes the relative frequency corresponding to the ith class of a given trait.
2.5 Statistical analysis
Data processing and analysis were performed using Microsoft Excel 2021, and principal component analysis was implemented using SPSS 26.0. GraphPad Prism was used to create correlation analysis plots and violin diagrams, followed by graphical integration using Adobe Illustrator 2025. Origin 2021 was used to conduct cluster analysis and generate corresponding visualizations.
3 Results
3.1 Genetic diversity analysis of quantitative traits
Table 3 shows that the coefficient of variation (CV) for the 11 quantitative traits, which ranged from 3.90–28.38%. The grain L* exhibited the lowest CV (3.90), contrasting with the highest variability in single-spike grain, confirming substantial genetic diversity and stability within the 1,558 foxtail millet accessions. Shannon-Wiener index diversity indices (H’) spanned 1.86–2.08 across traits, with stem thickness displaying maximum genetic heterogeneity (H’=2.08), while grain b* showed constrained variation (H’=1.86), indicating trait-specific selection pressures.
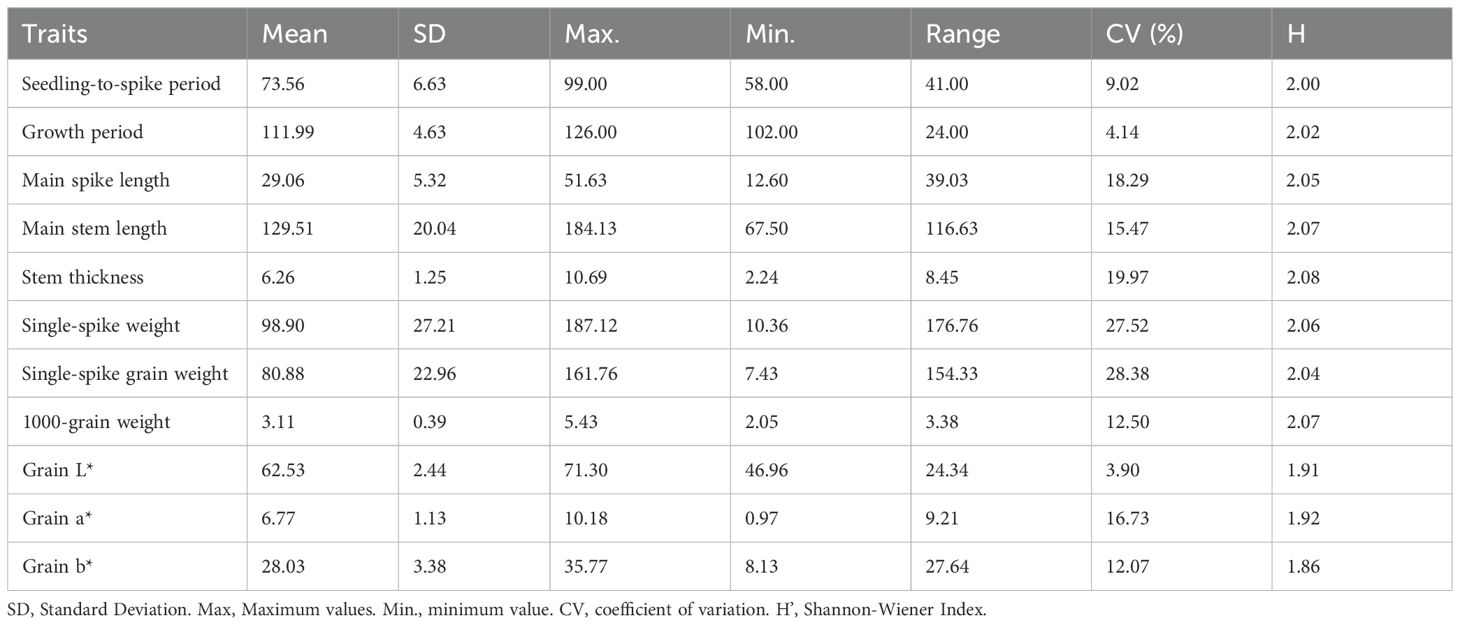
Table 3. Analysis of quantitative traits of millet.
3.2 Genetic diversity analysis of qualitative traits
Table 4 demonstrates that the coefficient of variation (CV) for 14 qualitative traits in the foxtail millet accessions spanned 7.44–66.20%, revealing differential polymorphism across morphological characteristics. The spike neck shape exhibited the smallest CV (7.44%), whereas the spike shape exhibited the largest CV (66.20%). The Shannon-Wiener index (H’) for qualitative traits ranged from 0.04 to 1.40, with spike neck shape displaying the lowest diversity (H’ = 0.04) and lodging resistance traits recording the highest diversity (H’ = 1.40). These findings confirm the substantial inter-accession divergence and heterogeneous genetic architecture across the germplasm collection, indicating rich allelic diversity for trait improvement.
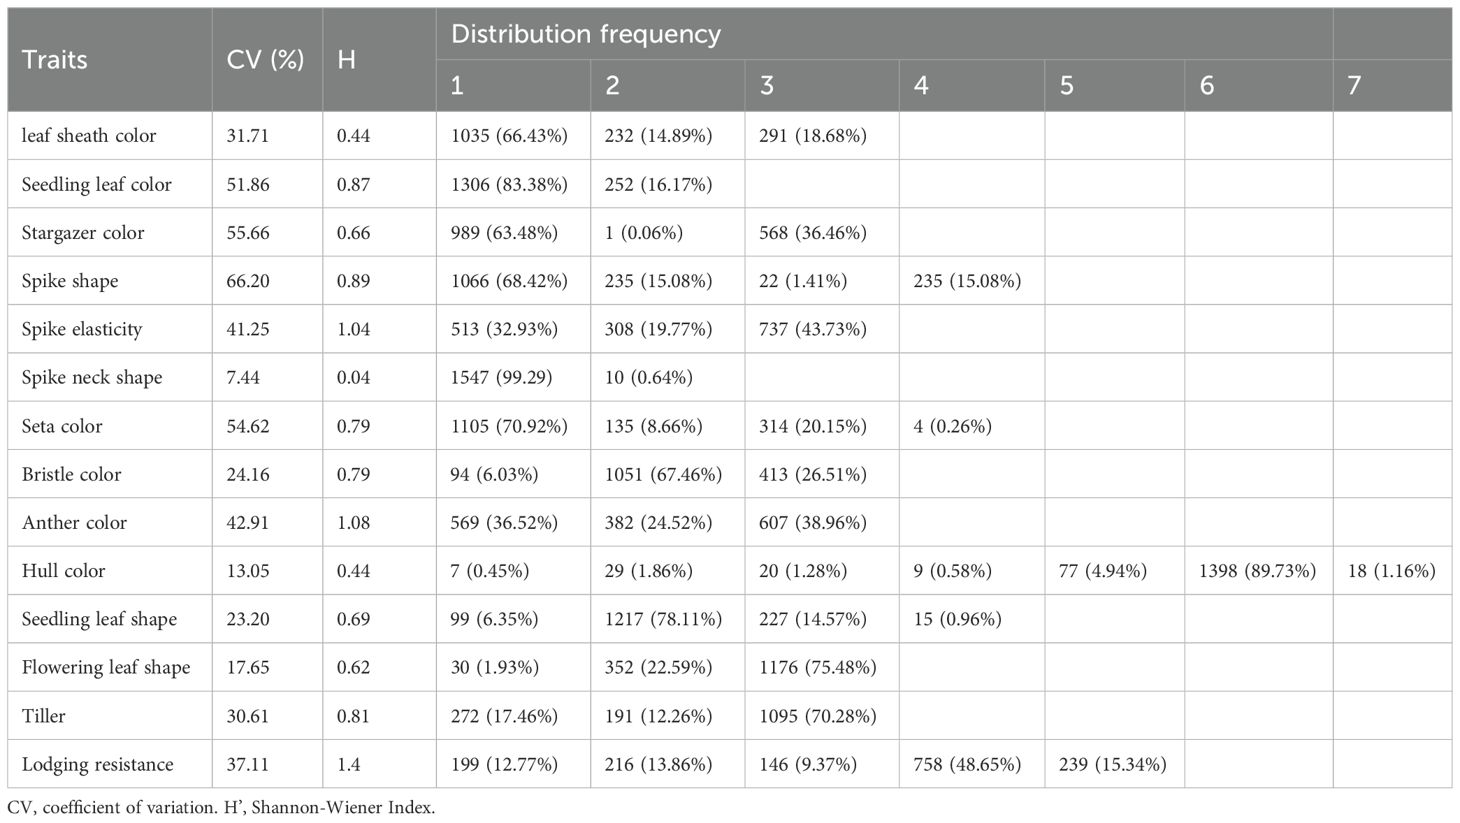
Table 4. Analysis of qualitative traits of millet.
3.3 Multivariate analysis of phenotypic traits: principal components and correlation networks
3.3.1 Principal component analysis
The cumulative contribution rate of the first 10 principal components reached 64.30%, with each exhibiting eigenvalues >0.95. It should be noted that individual trait metrics contain distinctive information, leading to substantial data loss when reduced to a limited number of principal components. The low inter-variable correlations also hinder effective capture by a limited set of principal components. Consequently, the analysis did not reach the conventional empirical threshold of 70%. Nevertheless, eigenvalues >0.95 maintain relevance in follow-up investigations. The top 10 factors were extracted, clustering traits with similar effects into distinct groups. This process transformed the 25 original traits into 10 novel independent composite indices. PC1 was predominantly governed by seedling-to-spike period, stem thickness, single spike weight, single spike grain weight, and stargazer color (contribution to variance: 13.25%). Being yield-associated traits, they warrant priority attention for high-yield foxtail millet cultivar development. PC2 was primarily driven by colorimetric parameters L, a, b*, and seedling leaf color (contribution: 9.08%). As essential quality evaluation indices, they represent pivotal targets for quality improvement breeding. PC3 was chiefly influenced by main spike length, spike morphology, spike elasticity, flowering leaf shape, and stress tolerance (contribution: 7.99%). Being associated with growth resilience, corresponding indicators merit emphasis in breeding stress-tolerant foxtail millet varieties. PC4 was mainly governed by 1000-grain weight, seta color, and tillering capacity (contribution: 7.17%). PC5 and 6 were predominantly influenced by growth duration (contribution: 5.66%) and anther color and seedling leaf color (contribution: 4.62%), respectively. PC7 was largely defined by spike neck morphology and seta color (contribution: 4.42%). PC8, 9, and 10 were primarily associated with main stem length (contribution: 4.27%), leaf sheath coloration (contribution: 4.03%), and hull color (contribution: 3.82%), respectively. Traits underlying PCs 4–10 exhibit limited relevance to core contemporary breeding targets. Nevertheless, PC5 (growth duration) critically determines cultivar adaptability to cooler zones, enabling geographical expansion of millet cultivation. This parameter constitutes an essential consideration in breeding programs.
Component analysis revealed that the first 10 components cumulatively accounted for 64.30% of the total variance (eigenvalue threshold >0.95; Table 5). Dimensionality reduction consolidated the 25 original traits into 10 orthogonal principal components through eigenvalue decomposition. The results indicated that PC1 was primarily determined by seedling-to-spike period, stem thickness, single-spike weight, single-spike grain weight, and stargazer color, contributing 13.25% of the variance. PC2 was mainly composed of L*,a*, b*, and seedling leaf color, accounting for 9.08% of the variance. PC3 was principally defined by main spike length, spike shape, spike elasticity, flowering leaf shape, and anti-forgiveness, with a 7.99% contribution to variance. PC4 was characterized by 1000-grain weight, bristle color, and tiller, accounting for 7.17% of the variance. PC5, 6, and 7 were dominated by the growth period (5.66%), anther color and seedling leaf color (4.62%) and spike-neck shape and seta color (4.42%), respectively. PC8, 9, and 10 were principally associated with main stem length (4.27%), leaf sheath color (4.03%), and hull color (3.82%), respectively.
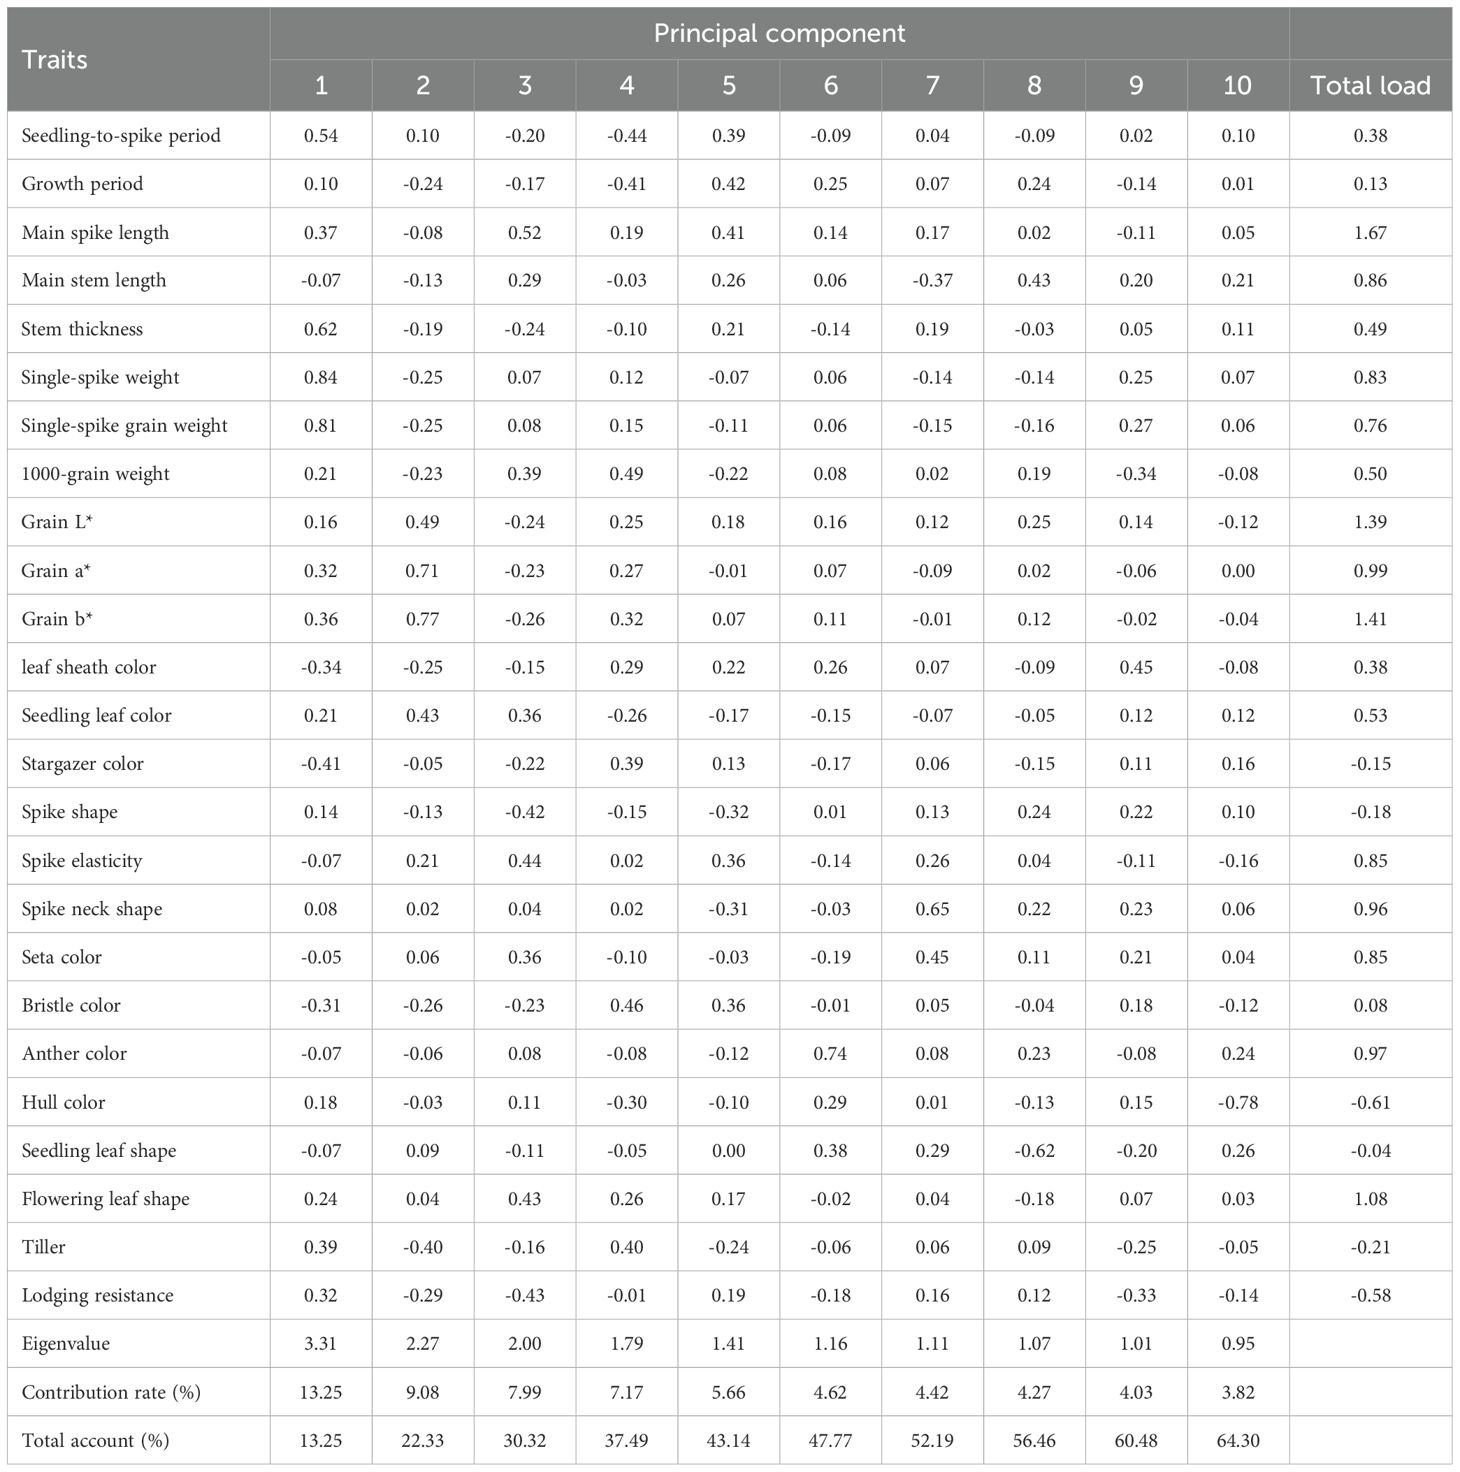
Table 5. Principle component analysis of phenotypic traits of millet accessions.
The relationships between the trait indicators and principal components are shown (Figure 2). Among the quantitative traits, single-spike weight and single-spike grain weight contributed the most significantly to PC1 and served as crucial quantitative trait indicators. The growth period, 1000-grain weight, and main spike length showed similar directional trends as the single-spike weight and single-spike grain weight, constituting secondary quantitative trait indicators, indicating their positive correlation and synergistic effects on PC1. For qualitative traits, lodging resistance and tillers demonstrated positive correlations with PC1 and made the greatest contributions, serving as essential qualitative trait indicators. Spike shape and hull color exhibited directional proximity to lodging resistance and tillers, acting as secondary qualitative trait indicators.
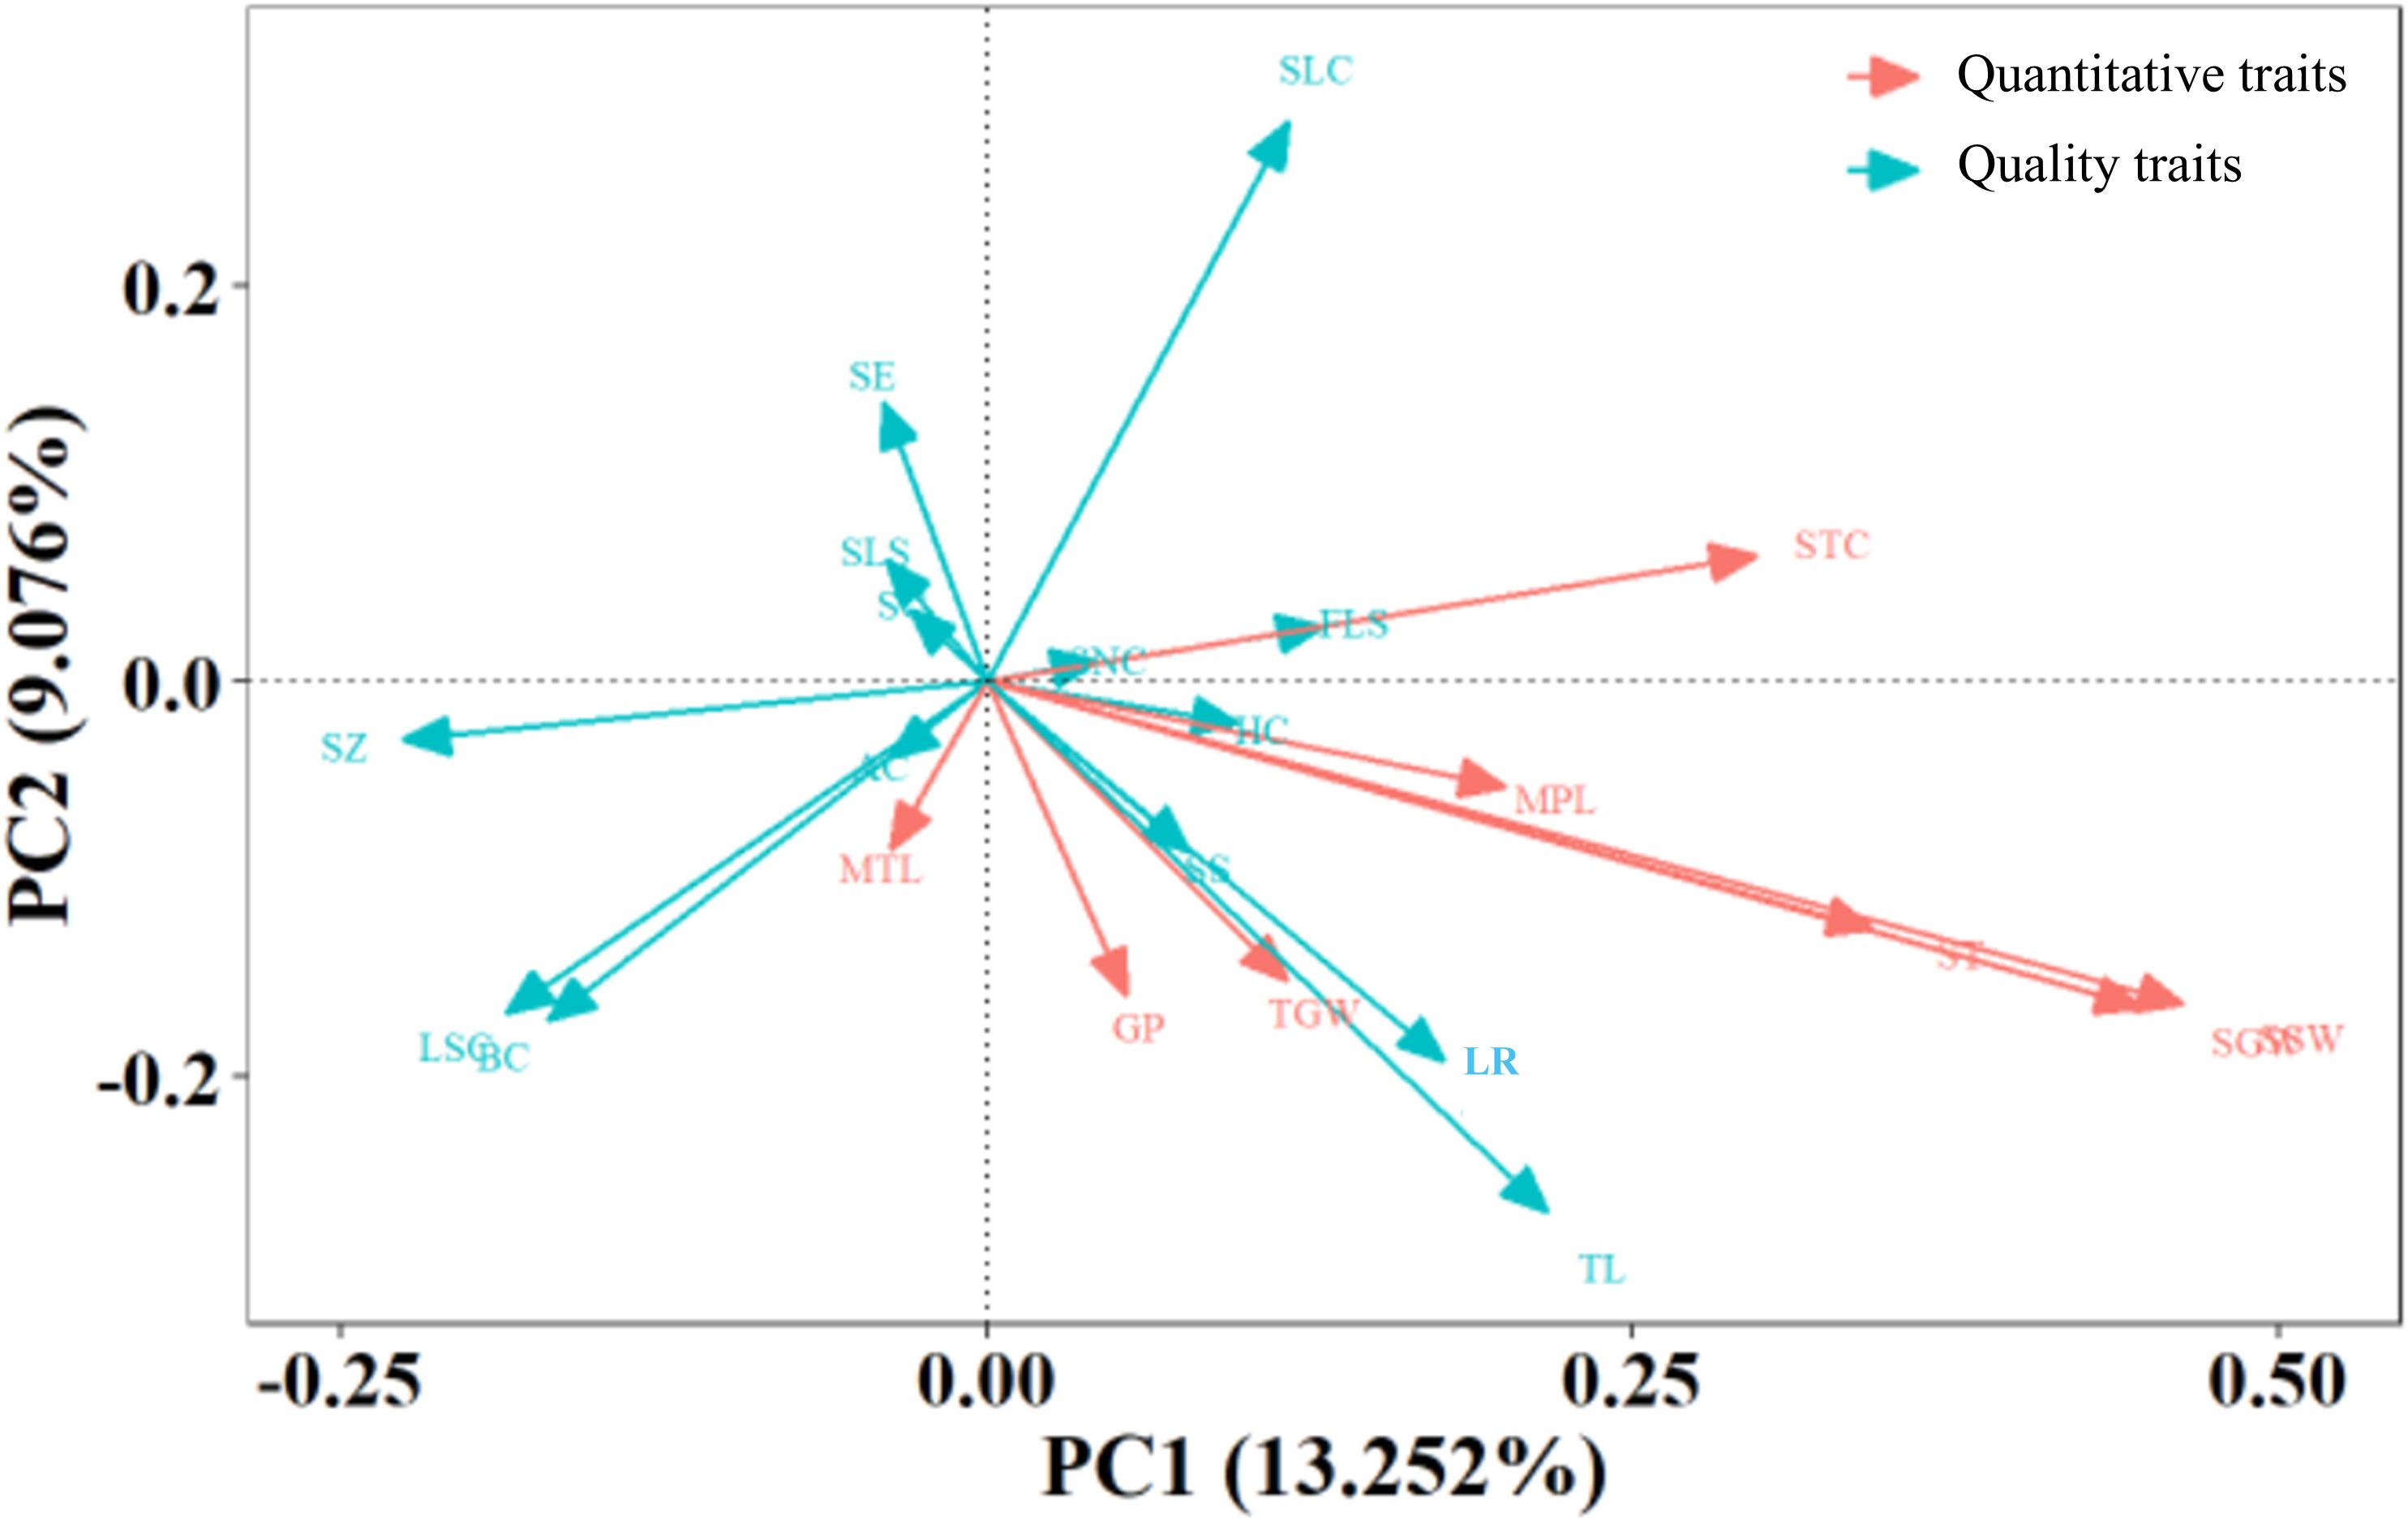
Figure 2. The principal component analysis of the 1,558 foxtail millet accessions.
3.3.2 Correlation analysis
Correlation analysis was conducted on 11 quantitative and 14 qualitative traits across 1,558 foxtail millet accessions (Figure 3). The results demonstrated significant or highly significant correlations among most phenotypic traits; specifically, significant correlations were observed between single-spike weight and single-spike grain weight, as well as between grain a* and grain b. * Significant negative correlations were found between seedling-to-spike period and 1000-grain weight, and between seedling-to-spike period and leaf sheath color; weak correlations of varying degrees existed among other traits, indicating that most phenotypic traits in the foxtail millet accessions exhibited interactive and mutually reinforcing relationships.
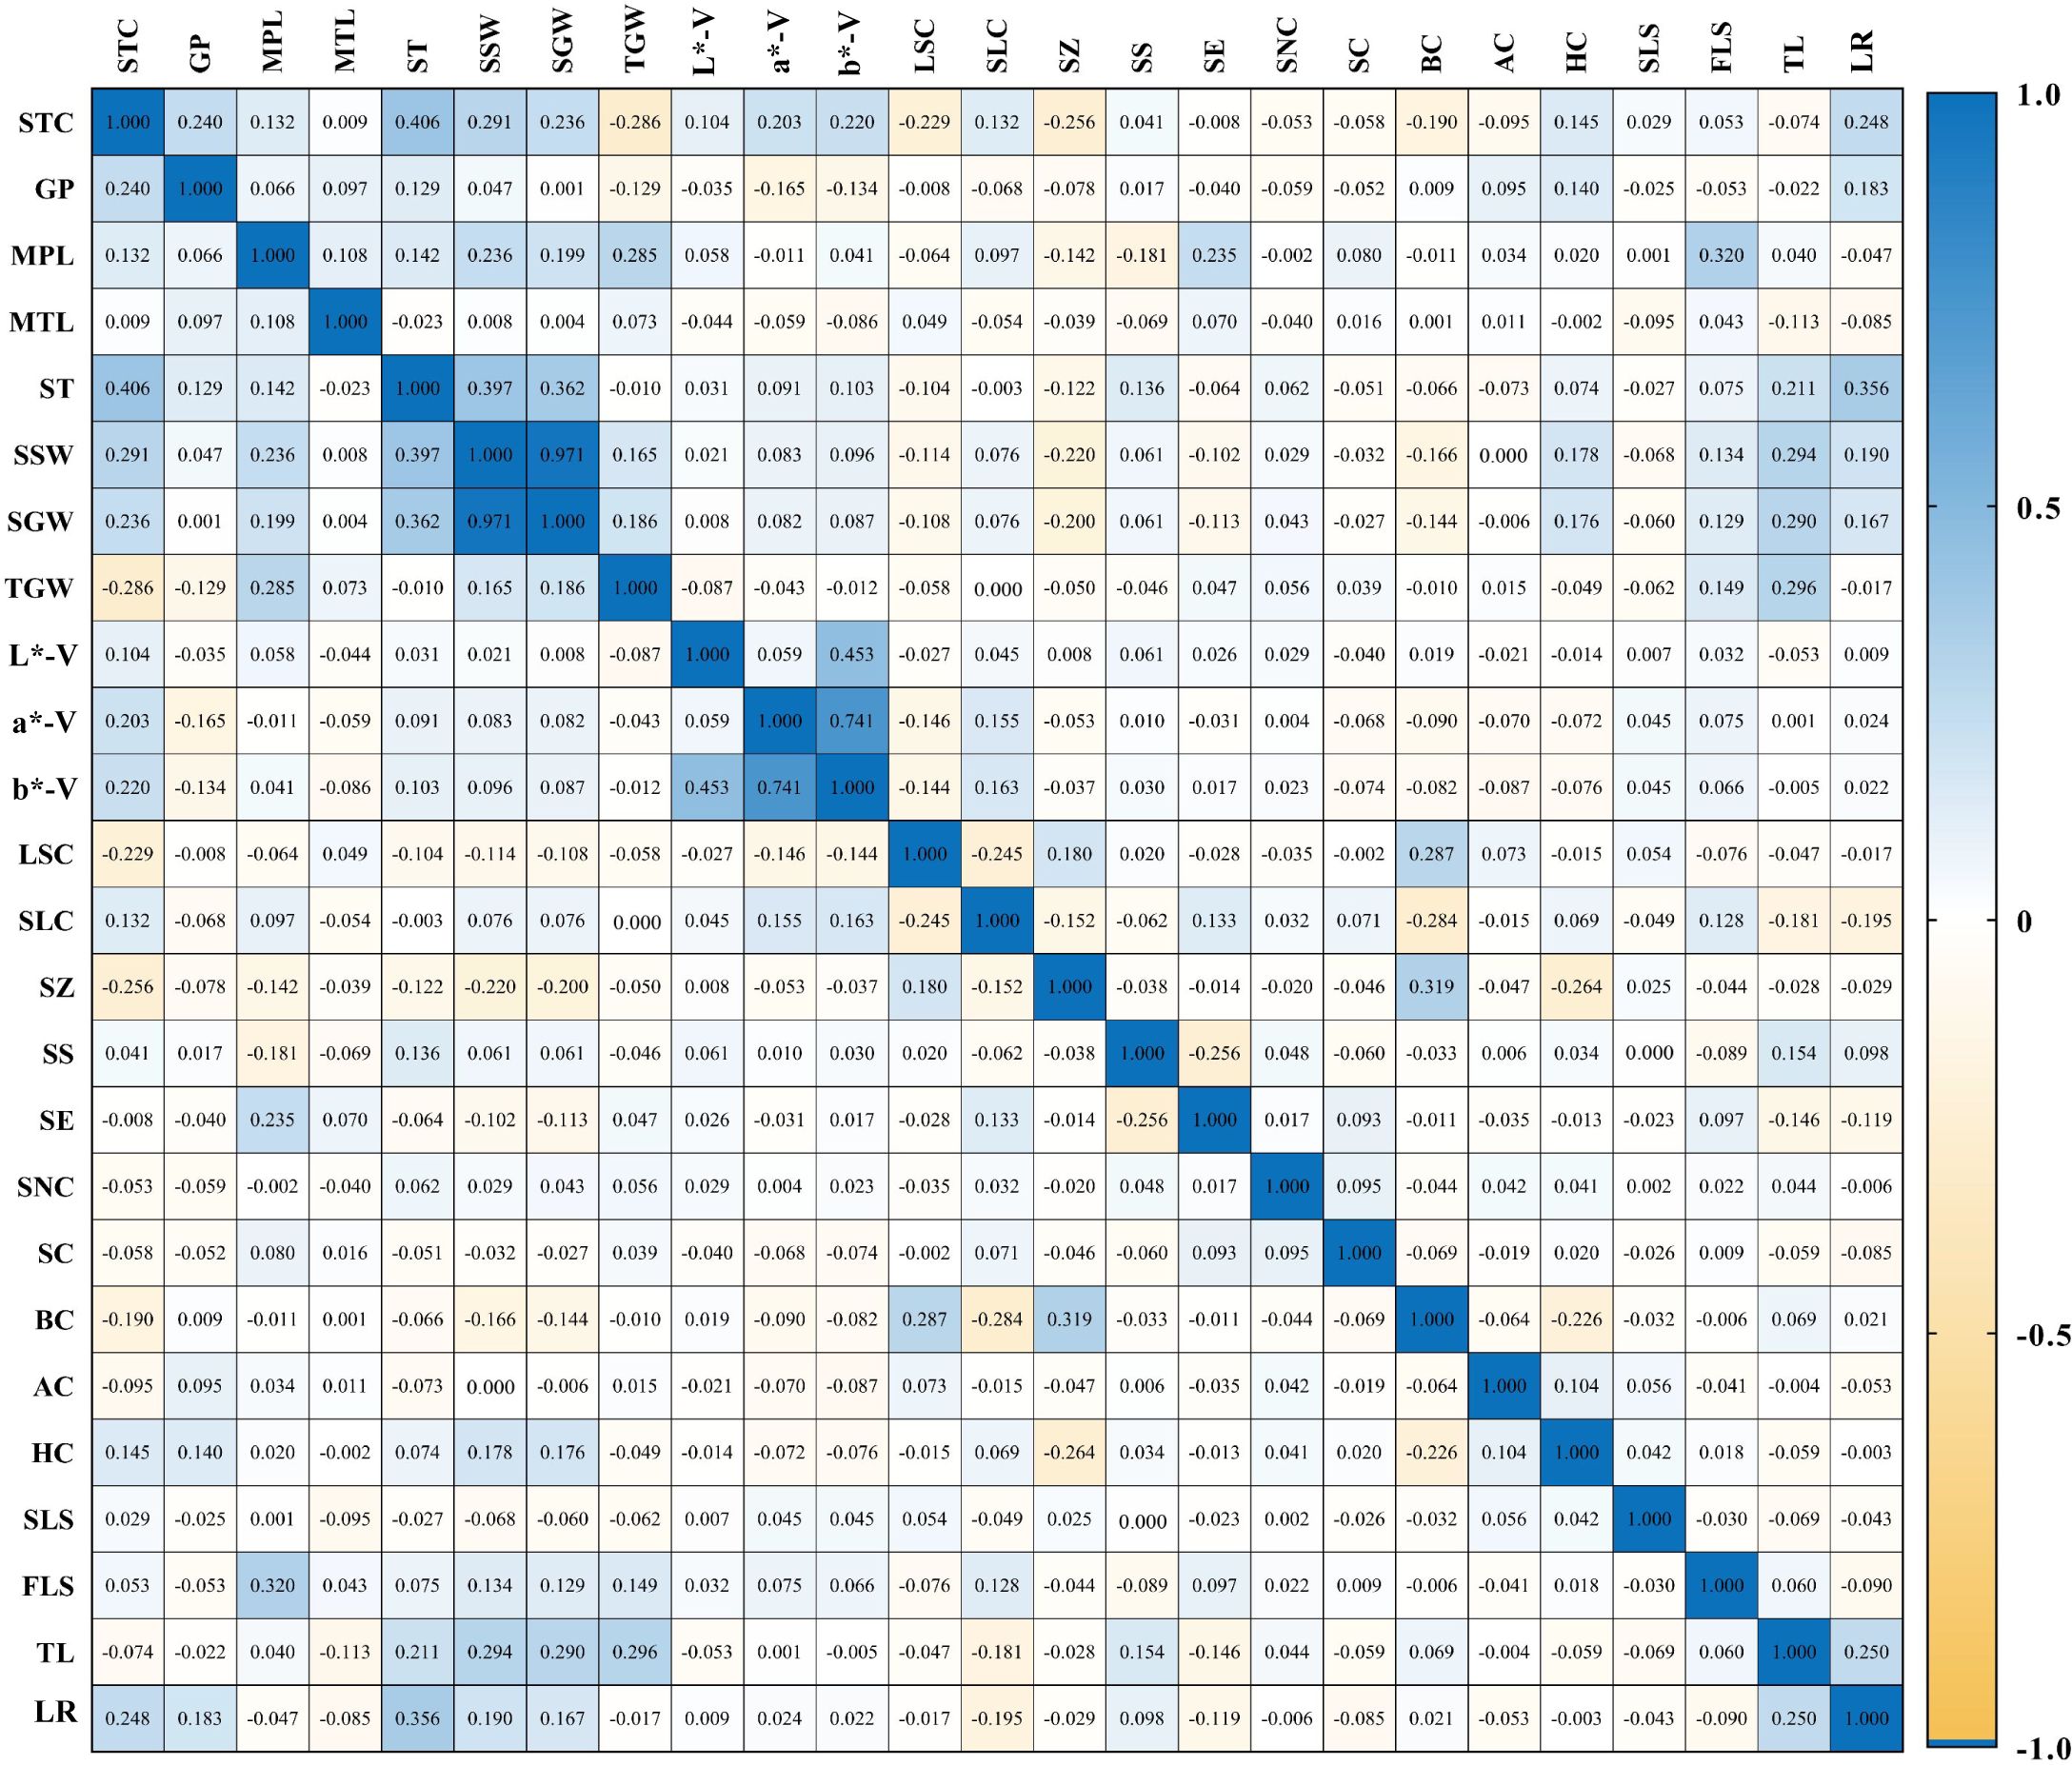
Figure 3. Correlation analysis of phenotypic traits in millet STC, seedling-to-spike period; GP, growth period; MPL, main spike length; MTL, main stem length; ST, stem thickness; SSW, single spike weight; SGW, single spike grain weight; TGW, 1000-grain weight; L-V, L*-V; a-V, a*-V; b-V, b*-V; LSC, leaf sheath color; SLC, seedling leaf color; SZ, stargazer color; SS, spike shape; SE, spike elasticity; SNC, spike neck shape; SC, bristle color; AC, anther color; HC, hull color; SLS, seedling leaf shape; FLS, flowering leaf shape; TL, tiller; LR, lodging resistance.
A comprehensive evaluation system was established by first deriving the score coefficients for the 10 principal components using the eigenvector matrix and normalized data from 25 standardized phenotypic traits. Individual principal component scores were computed through dedicated formulae, exemplified by:
F1 = 0.298×STC+0.054×GP+0.201×MPL-0.037×MTL+0.343×ST+0.463×SSW+0.447×SGW+0.116×TGW+0.088×Grain L*+0.174×Grain a*+0.197× Grain b*-0.186×LSC+0.116×SLC-0.226×SZ+0.077×SS-0.040×SE+0.042×SNC-0.030×SL-0.169×BC-0.037×AC+0.097×HC-0.039×SLS+0.130×FLS+0.217×TL+0.177×LR.
Where STC is the Seedling-to-spike period, GP is the growth period, MPL is the main spike length, MTL is the main stem length, ST is the stem thickness, SSW is the single-spike weight, SGW is the single-spike grain weight, TGW is the 1000-grain weight, LSC is the leaf sheath color, SLC is the seedling leaf color, SZ is the stargazer color, SS is the spike shape, SE is the spike elasticity, SNC is the spike neck shape, SL is the seta length, BC is the bristle color, AC is the anther color, HC is the hull color, SLS is the seedling leaf shape, FLS is the flowering leaf shape, TL is the tillering character, and LR is the lodging resistance character.
The subsequent components were calculated using the coefficients listed in Table 6. The 12 principal component scores were normalized with factor-weighting coefficients calculated according to their contribution rates. This process yielded the final composite evaluation formula:
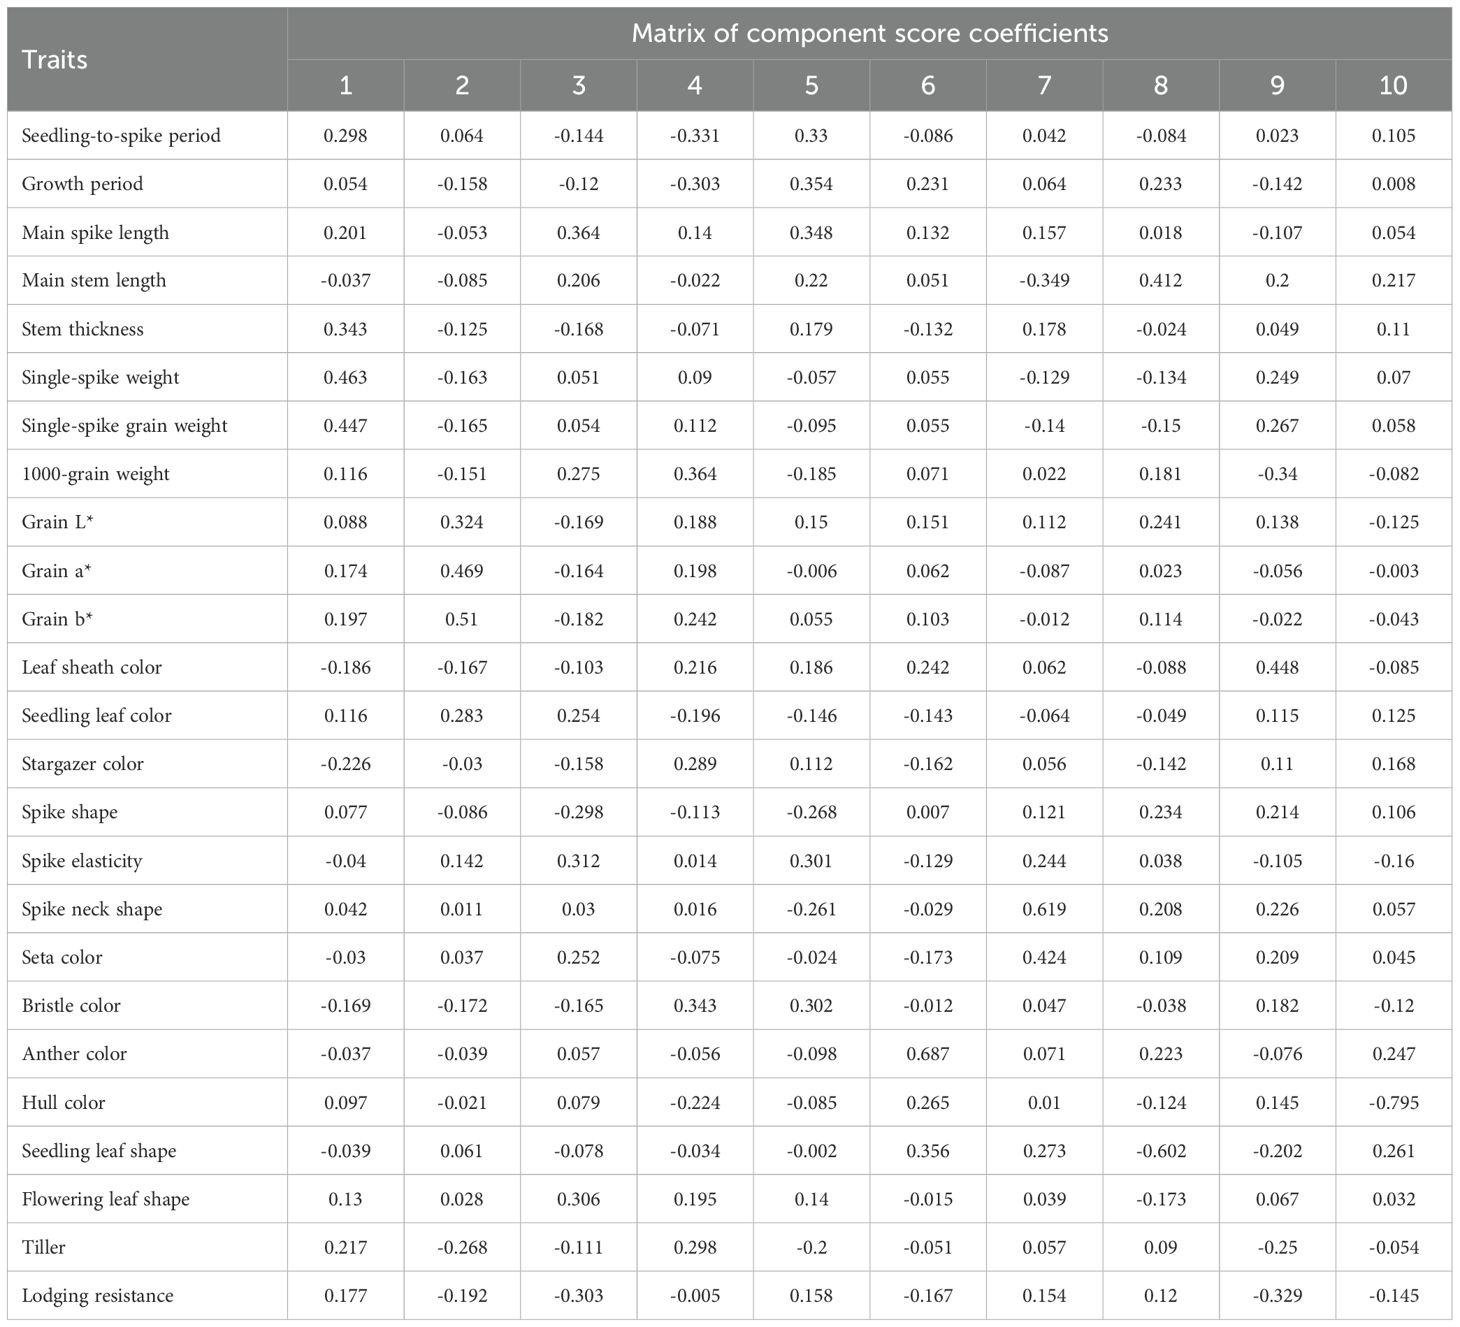
Table 6. Coefficients of 10 principal component scores.
The 1,558 foxtail millet accessions were systematically ranked based on F-values, with the top 10 high-scoring accessions being selected (Table 7, Figure 4); detailed scores of other accessions are provided in the Supplementary Table 1. Elite accessions with superior composite scores exhibited significant advantages across qualitative traits, quantitative traits, and genetic attributes, establishing them as crucial foundational germplasm for future germplasm innovation and new cultivar breeding.
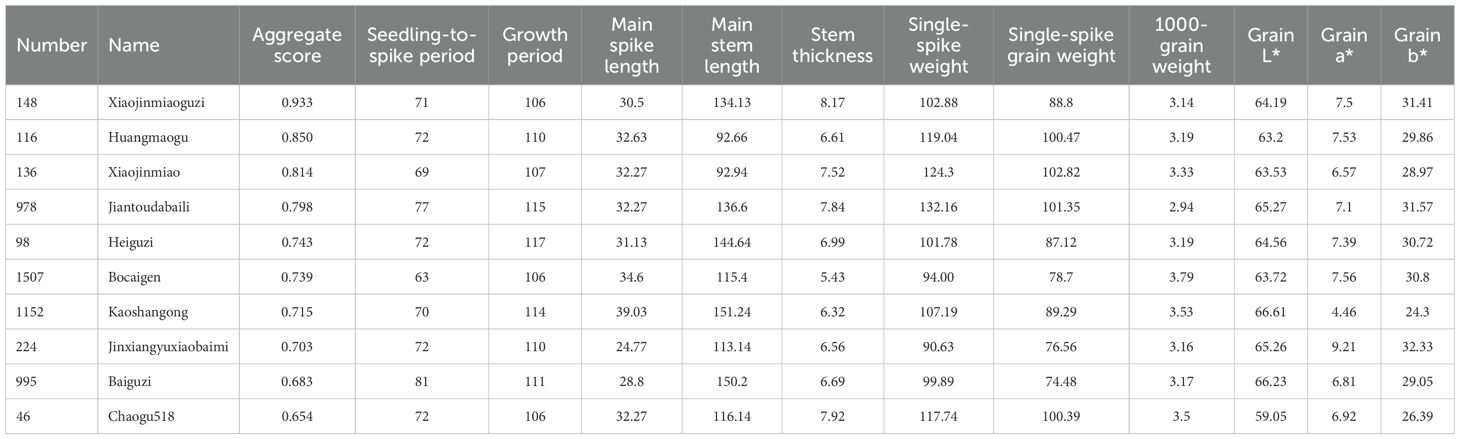
Table 7. Millet accessions with top 10 comprehensive scores.
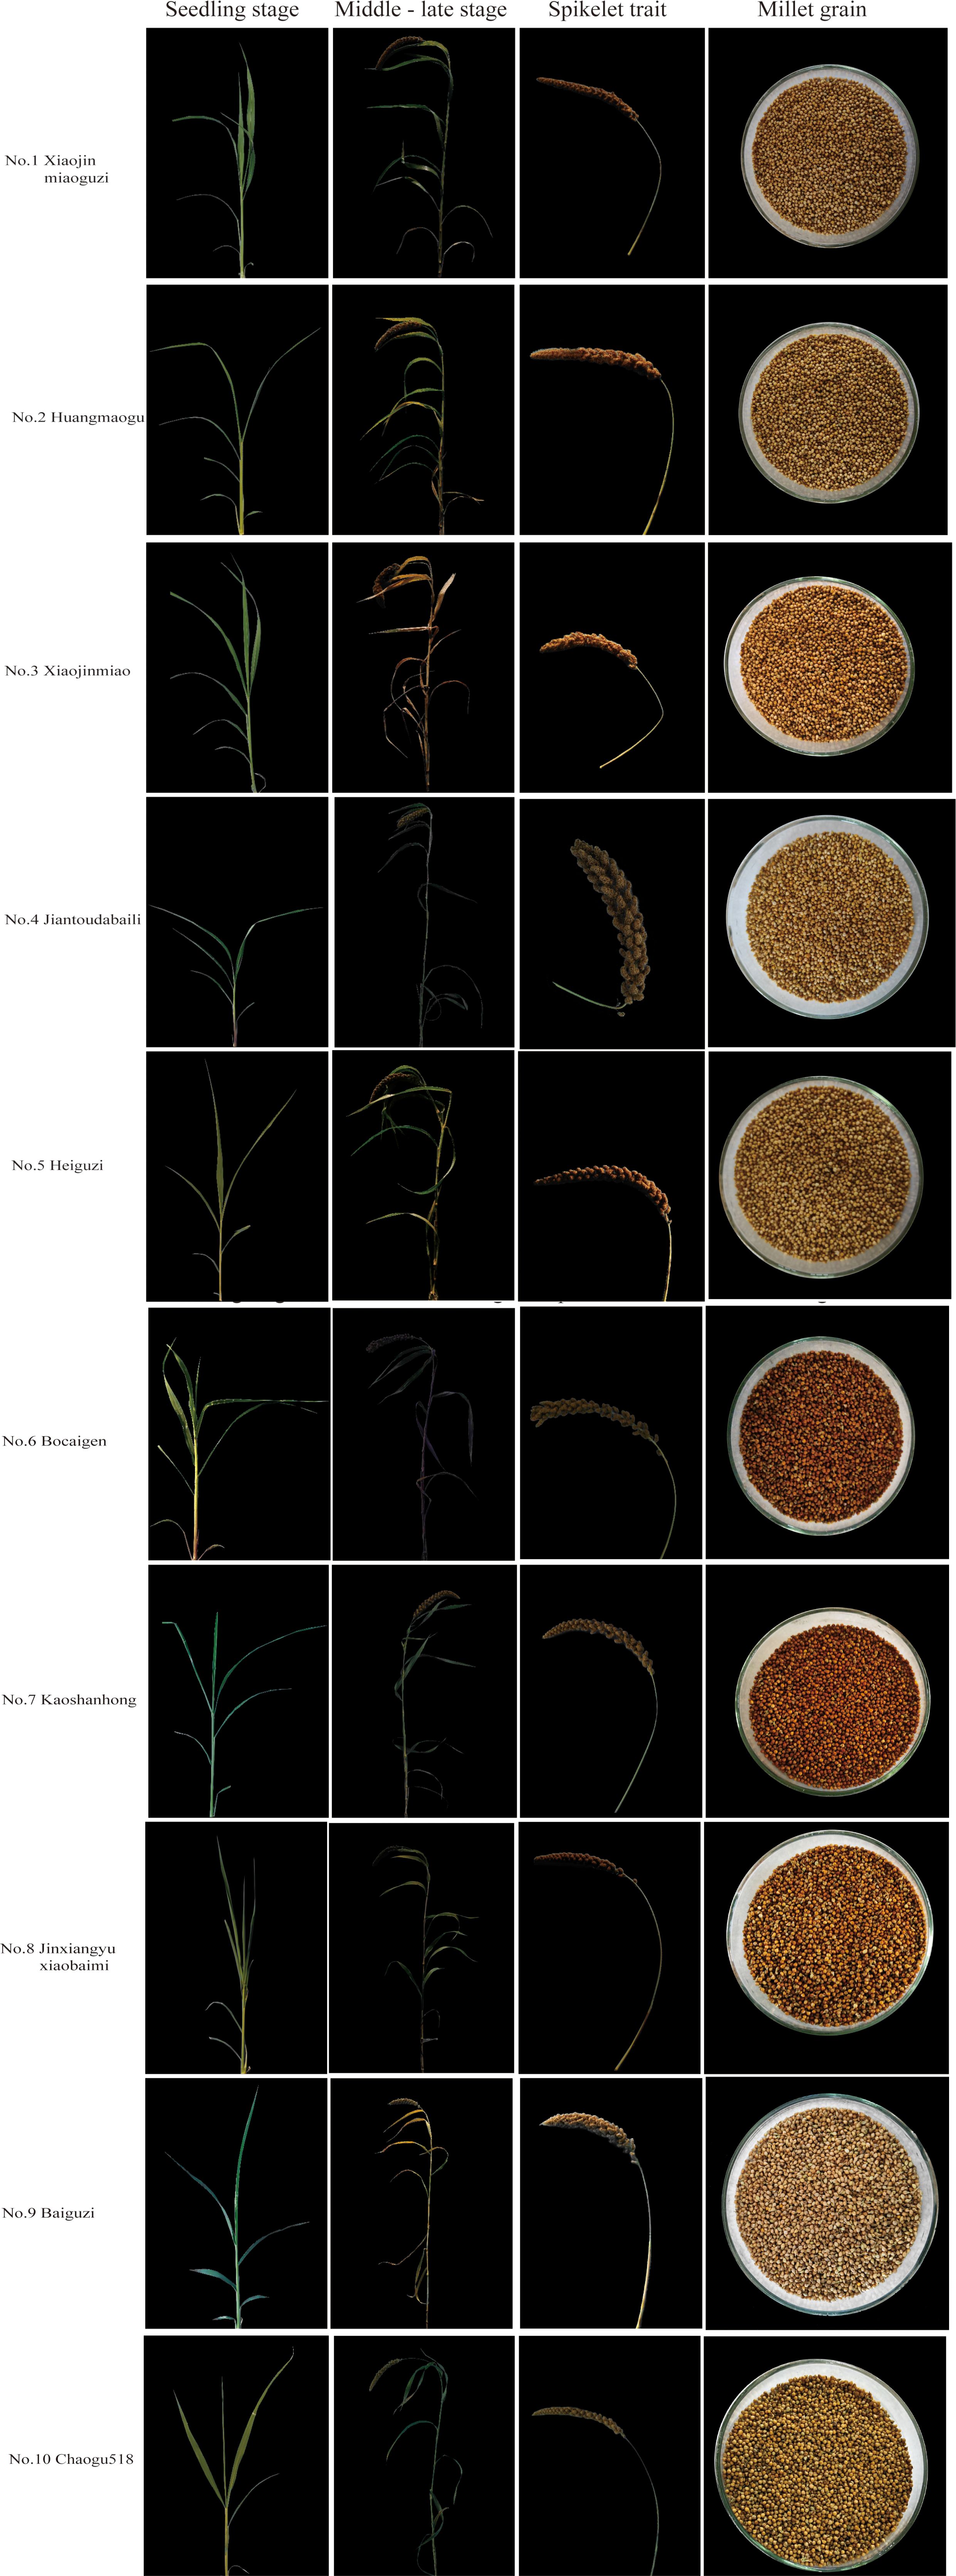
Figure 4. Millet accessions with top 10 comprehensive scores.
3.4 Clustering pattern analysis in foxtail millet accessions
Cluster analysis was performed on 1588 foxtail millet accessions based on 24 phenotypic traits. The clustering divided them into five groups (Figures 5, 6). Cluster I comprised 322 accessions, characterized by shorter main spike length (26.29 cm), shorter main stem length (118.55 cm), thicker stem diameter (6.99 mm), longer seedling-to-spike period (77.20 d), extended growth period (113.43 d), and lighter 1000-grain weight (2.99 g). These associated traits are all related to stress resistance in foxtail millet, providing abundant foundational materials for breeding stress-resistant varieties. Cluster II included 260 accessions, characterized by lower grain L* (61.72), a* (4.94), and b* (22.85). This group exhibits inferior grain quality, but can effectively broaden the genetic basis of quality-related accessions. Cluster III contained 283 accessions, characterized by longer main spike length (32.09 cm), heavier single-spike grain weight (92.56 g), heavier single-spike weight (112.9 g), and heavier 1000-grain weight (3.27 g), These associated traits all relate to yield components of foxtail millet, and can be prioritized as parental materials for high-yield breeding. Cluster IV included 213 accessions, characterized by shorter growth period (111.21 d), higher grain L* (62.83), a* (7.21), and b* (29.57). These indicators combine early maturity and high quality, providing abundant foundational materials for premium early-maturing varieties. Cluster V included 536 accessions, characterized by lighter single-spike grain weight (65.26 g), lighter single-spike weight (79.63 g), thinner stem diameter (5.66 mm), and shorter seedling-to-spike period (70.20 d).
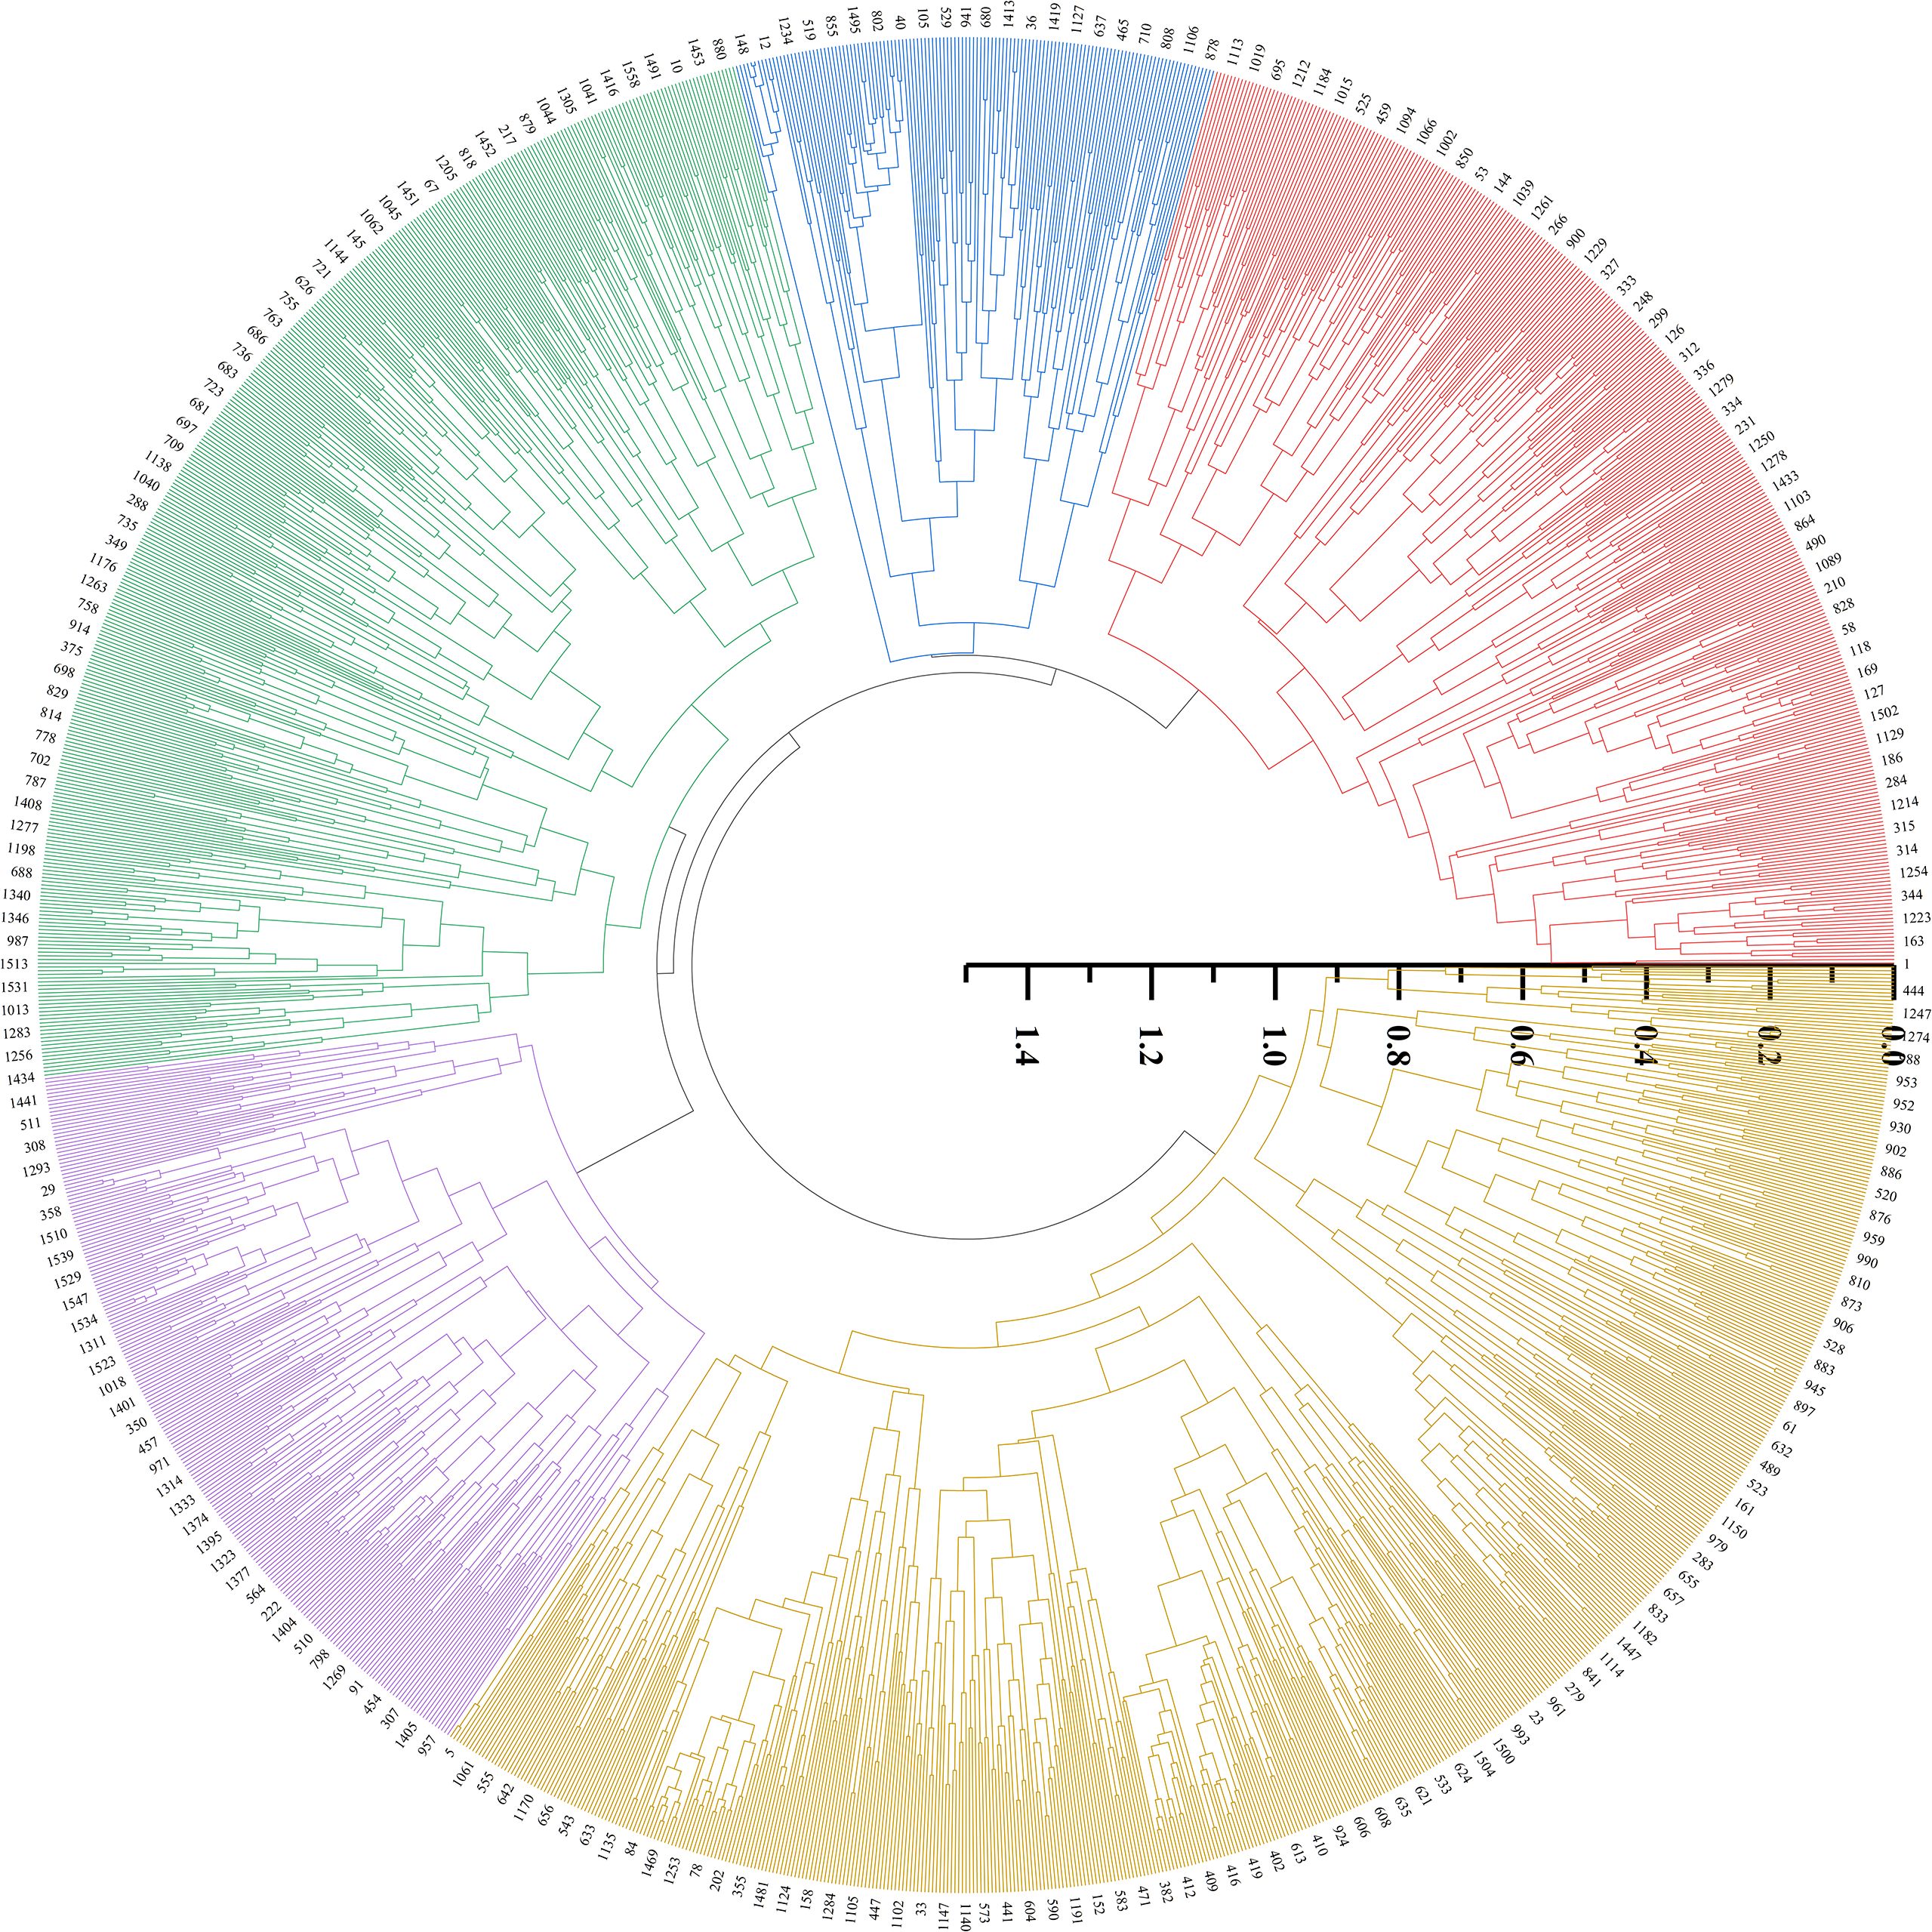
Figure 5. Cluster dendrogram of tested millet in accessions.
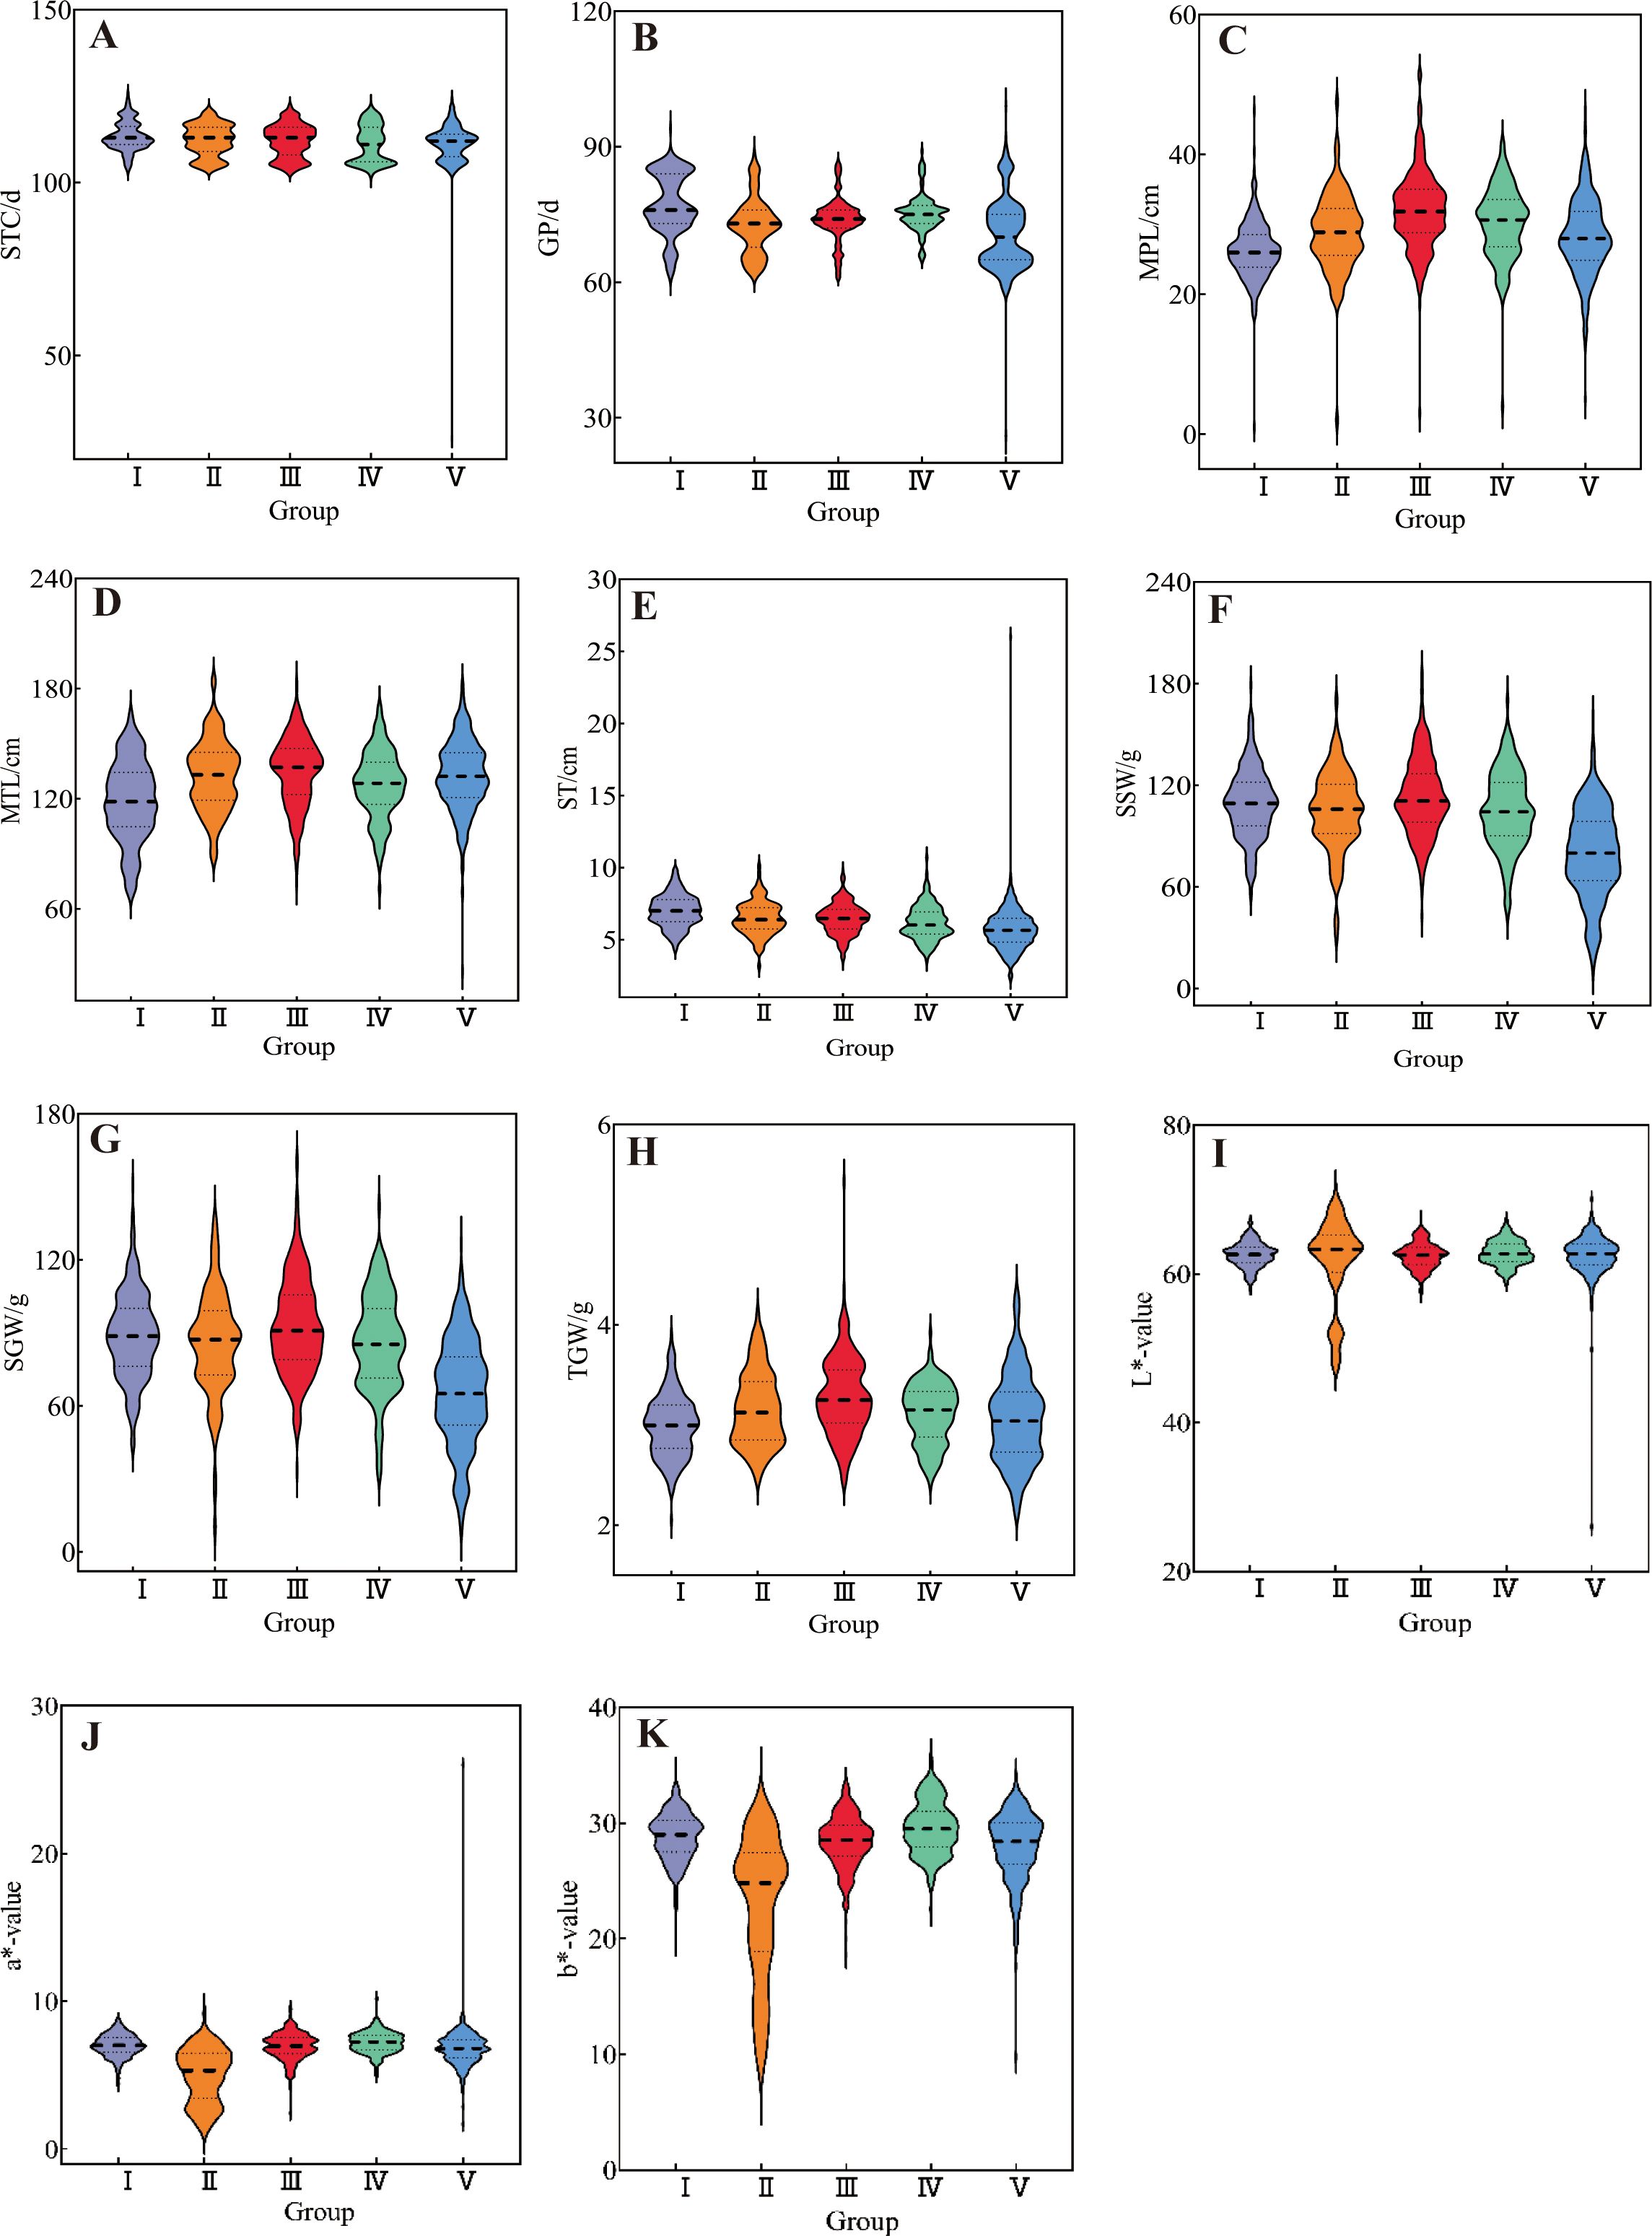
Figure 6. The violin diagram of 11 quantitative traits of millet accessions in five groups: (A) seedling-to-spike period, (B) growth period, (C) main spike length, (D) main stem length, (E) stem thickness, (F) single spike weight, (G) single spike grain weight, (H) 1000-grain weight, (I) L*-value, (J) a*-value, and (K) b*-value.
4 Discussion
Systematic phenotyping remains the cornerstone methodology for germplasm characterization, providing essential biological insights that are unobtainable through molecular approaches alone. Empirical evidence has demonstrated that strategic phenomic data mining coupled with multi-trait evaluation enables the establishment of optimized core collections and improves breeding efficiency through enhanced genetic recombination potential.
4.1 Genetic diversity profiling in foxtail millet accessions
Phenotypic variability and diversity serve as crucial indicators of germplasm genetic diversity, directly manifesting as trait differentiation among accessions and revealing inheritance patterns. Enhanced variability and diversity correspond to increased interspecific divergence and genetic diversity (Hedari et al., 2019; Li et al., 2023a; Mirheidari et al., 2020). The coefficient of variation (CV) quantifying phenotypic dispersion revealed 11 quantitative traits in 1,558 foxtail millet accessions, ranging from 3.90% (grain L*) to 28.38% (single-spike grain weight). Qualitative traits exhibited CVs between 7.44% (spike neck shape) and 66.20% (spike shape), collectively demonstrating substantial phenotypic variability within the germplasm collection. Germplasm genetic diversity underpins crop breeding programs, where elevated diversity indices reflect greater allelic variation and enriched polymorphisms, as established in previous studies (Hou et al., 2024; Li et al., 2023b; Tang et al., 2025). Quantitative traits exhibited Shannon-Wiener index diversity indices ranging from 1.86 (grain b*) to 2.08 (stem thickness), indicating a differential genetic architecture. Qualitative traits showed indices from 0.04 (spike neck shape) to 1.40 (lodging resistance), revealing pronounced inter-accession variation. The broad-spectrum genetic variability across both trait categories suggests extensive allelic diversity within the germplasm panel. Collectively, the reduced variability and diversity indices observed in qualitative versus quantitative traits suggest stronger selection signatures in qualitative characteristics during domestication, corroborating established breeding theories (Guo et al., 2024). The phenotypic richness of 1,558 accessions - encompassing breeding lines, improved cultivars, and genetic stocks mirrored their heterogeneous geographical origins. Strategic exploitation of this diversity pool promises to enhance genetic recombination potential and facilitate targeted breeding programs.
4.2 Integrated analysis of phenotypic traits in foxtail millet accessions: correlation networks and clustering patterns
Inter-trait correlation studies enable the assessment of pleiotropic effects on genetic gain, thereby informing multi-trait selection strategies for breeding programs. In the present study, most phenotypic traits in foxtail millet accessions showed weak correlations to varying degrees, indicating interactive and promotive relationships between traits. A strong positive correlation between single-spike grain weight and single-spike weight underscores their co-regulation as a key yield determinant, necessitating simultaneous selection for yield improvement breeding. Coordinated variation in grain color parameters (grain a* vs. grain b*: r=0.65) reflects biochemical linkages in pigment biosynthesis, making them pivotal selection markers for grain quality enhancement. The negative association (r=-0.53) between the vegetative phase duration (seedling-to-spike period) and 1000-grain weight implies developmental trade-offs, where the extended vegetative phase compromises grain-filling capacity, which is a critical consideration for yield component balancing. Strategic integration of trait correlation networks enables the identification of complementary germplasm combinations, facilitating the development of transgressive segregants in hybrid breeding (Jiao et al., 2021; Zhang et al., 2022; Zhou et al., 2021). Phenotypic clustering serves as an effective proxy for genomic divergence assessment, with dendrogram topology revealing phylogenetic affinities (Dalmaijer et al., 2022; Li et al., 2020; Runjić et al., 2025). This methodology has been extensively validated for major crops, including soybeans (Glycine max; Xu et al., 2022), rice (Oryza sativa; Jin et al., 2025), and wheat (Triticum aestivum; Zhang H. F. et al., 2023). Cluster analysis of 25 phenotypic traits from 1,558 foxtail millet accessions divided them into five clusters. Cluster III exhibited superior performance in terms of main spike length, single-spike weight, single-spike grain weight, main stem length, and 1000-grain weight, all of which are traits associated with yield components, making it a preferential parental material for high-yield breeding. Cluster IV showed a shorter growth period and advantages in grain L*, a*, and b* values. These traits were strongly correlated with grain quality, qualifying it as the preferred parental material for quality breeding. Cluster I performed poorly across all traits, whereas Clusters II and V showed intermediate performances.
4.3 Multivariate characterization of phenotypic traits in foxtail millet accessions: principal component analysis and synthetic evaluation
Principal component analysis (PCA), a dimensionality reduction technique extensively applied in germplasm evaluation, transforms multiple phenotypic traits into orthogonal principal components that effectively capture variance structures (Li et al., 2024; Nardo et al., 2005; Jolliffe and Cadima, 2016). The 25 phenotypic traits were condensed into 10 principal components (PCs) accounting for 64.30% of the cumulative variance. PC1 (13.25% variance) was predominantly loaded with developmental traits (seedling-to-spike period) and yield components (single-spike weight/grain weight). PC2 (9.08%) primarily reflected grain color parameters (L*, a*, and b*) and seedling pigmentation. High-loading traits (>0.75), including single-spike weight and seedling leaf color, emerged as key drivers of phenotypic variation. The integration of PCA with fuzzy membership functions enhances the germplasm assessment precision through multi-criteria optimization (Jang, 2021; Wang et al., 2025; Xue et al., 2024; Zhang Y. Z. et al., 2023). In this study, phenotypic data were first transformed using membership functions and then combined with the PCA results to calculate comprehensive F-scores. Higher F-scores indicated superior overall performance. The top ten accessions identified were Xiaojinmiao Guzi, Huangmaogu, Xiaojinmiao, Jiantou Dalibai, Heiguzi, Bocaign, Kaoshanhong, Jinxiangyu Xiaobaimi, Baiguzi, and Chaogu 518, demonstrating the advantages of qualitative traits, quantitative traits, and genetic characteristics, making them crucial foundation accessions for subsequent breeding. This study assessed the top-ranked 10 accessions exclusively using phenotypic performance data. All trials were performed in a single testing environment, lacking verification of genetic stability via molecular markers or multi-environment trials. Future work must strengthen data reliability through molecular marker analysis and expanded multi-location trials, thereby enhancing the general applicability of findings.
5 Conclusions
This study systematically characterized and evaluated 1,558 foxtail millet accessions based on phenotypic traits, providing critical insights for germplasm conservation and cultivar development. The germplasm collection demonstrated substantial polymorphism across the quantitative and qualitative trait categories. Integrated multivariate approaches (correlation networks, PCA, and hierarchical clustering) effectively characterized the genetic architecture, validating the robustness of the methodological framework. Multivariate evaluation using PCA-weighted F-value computation identified ten elite accessions with balanced trait superiority. Accessions showing transgressive segregation potential are recommended as core parental lines for hybridization breeding.
Nevertheless, the environmental sensitivity of phenotypic traits may compromise characterization reliability. Implementing multi-approach strategies for germplasm assessment could significantly improve the scientific rigor and precision of evaluation outcomes. Future studies will prioritize molecular marker profiling and genome-wide association analyses of these 1,558 foxtail millet accessions to establish comprehensive genetic characterization.
Data availability statement
The datasets presented in this study can be found in online repositories. The names of the repository/repositories and accession number(s) can be found in the article/Supplementary Material.
Author contributions
WX: Data curation, Writing – review & editing, Conceptualization, Software, Writing – original draft, Investigation, Visualization, Formal Analysis. ZY: Investigation, Writing – review & editing, Validation, Data curation. AM: Data curation, Investigation, Writing – review & editing, Resources. FY: Formal Analysis, Writing – review & editing, Investigation, Software. DL: Resources, Investigation, Validation, Writing – review & editing. SZ: Investigation, Writing – review & editing. JZ: Software, Writing – review & editing, Visualization. YC: Writing – review & editing, Investigation. YSZ: Project administration, Funding acquisition, Supervision, Writing – review & editing. YPZ: Validation, Supervision, Writing – review & editing, Conceptualization. XW: Funding acquisition, Resources, Project administration, Writing – review & editing, Supervision, Conceptualization.
Funding
The author(s) declare that financial support was received for the research and/or publication of this article. This study was supported by the China Agriculture Research System of MOF, Inner Mongolia Natural Science Fund (2025QN03146), National Millet Crops Research and Development System (Grant/Award Number: CARS-06-14.5-A6), Minor Grain Crops Research and Development System of Inner Mongolia Province (Grant/Award Number: 2023-2027), and Inner Mongolia Autonomous Region Breeding Joint Research Project (Grant/Award Number: YZ2023007).
Acknowledgments
We are grateful to the experimental platforms of the Inner Mongolia Agricultural University and the Chifeng Academy of Agricultural and Animal Husbandry Sciences for their support. We would like to thank Editage (http://www.editage.cn) for the English language editing of this manuscript.
Conflict of interest
The authors declare that the research was conducted in the absence of any commercial or financial relationships that could be construed as a potential conflict of interest.
Generative AI statement
The author(s) declare that no Generative AI was used in the creation of this manuscript.
Publisher’s note
All claims expressed in this article are solely those of the authors and do not necessarily represent those of their affiliated organizations, or those of the publisher, the editors and the reviewers. Any product that may be evaluated in this article, or claim that may be made by its manufacturer, is not guaranteed or endorsed by the publisher.
Supplementary material
The Supplementary Material for this article can be found online at: https://www.frontiersin.org/articles/10.3389/fpls.2025.1624252/full#supplementary-material
References
Chen, T., Liu, L., Zhou, Y. L., Zheng, Q., Luo, S. Y., Xiang, T. T., et al. (2023). Characterization and comprehensive evaluation of phenotypic characters in wild Camellia oleifera germplasm for conservation and breeding. Front. Plant Sci. 14. doi: 10.3389/fpls.2023.1052890
Costa, J. C., Fracetto, G. G. M., Fracetto, F. J. C., Santos, M. V. F., and Lira Junior, M. A. (2017). Genetic diversity of desmanthussp accessions using ISSR markers and morphological traits. Genet. Mol. Res. 16, gmr16029667. doi: 10.4238/gmr16029667
Dalmaijer, E. S., Nord, C. L., and Astle, D. E. (2022). Statistical power for cluster analysis. BMC Bioinf. 23, 1–28. doi: 10.1186/s12859-022-04675-1
Diao, X. M. (2017). Production and genetic improvement of minor cereals in China. Crop J. 5, 103–104. doi: 10.1016/j.cj.2016.06.004
Diao, X. M. (2019). Progresses in stress tolerance and field cultivation studies of orphan cereals in China. Sci. Agric. Sin. 52, 3943–3949. doi: 10.3864/j.issn.0578–1752.2019.22.001
Guo, W. H., Zhou, H. Y., Zhang, Z., Wang, R. S., Yao, X. T., et al (2024). Phenotypic variation analysis of 963 global Brassica napus germplasm resources. J. Zhejiang Univ., 1–12. doi: 10.3785/j.issn.1008-9209.2024.03.281
He, Q., Tang, S., Zhi, H., Chen, J. F., Zhang, J., Liang, H. K., et al. (2023). A graph-based genome and pan-genome variation of the model plant Setaria. Nat. Genet. 55, 1232–1242. doi: 10.1038/s41588-023-01423-w
Hedari, P., Rezaei, M., Sahebi, M., and Khadivi, A. (2019). Phenotypic variability of Pyrus boissieriana Buhse, implications for conservation and breeding. Scientia Hortic. 247, 1–8. doi: 10.1016/j.scienta.2018.11.075
Hou, X. F., Zhang, Y., Liu, Y. X., Song, X. M., Jia, D. H., Gu, Y. G., et al. (2024). Genetic diversity analysis of 686 safflower (Carthamus tinctorius L.) germplasm accessions based on agronomic traits. J. Plant Genet. Resour. 25, 1468–1479. doi: 10.13430/j.cnki.jpgr.20231215001
Huang, R., Yang, S. J., Wang, Y., Feng, L., Pan, Y. M., and Wang, H. G. (2024). Identification and comprehensive evaluation of phenotypic traits of Shanxi foxtail millet germplasm resources. J. Nucl. Agric. Sci. 38, 1887–1902. doi: 1000-8551(2024)10-1887-10
Jang, J. H. (2021). Principal component analysis of hybrid functional and vector data. Stat. Med. 40, 5152–5173. doi: 10.1002/sim.9117
Jia, G. Q. and Diao, X. M. (2017). Current status and perspectives of researches on foxtail millet (Setaria italica(L.) P. Beauv.): a potential model of plant functional genomics studies. Chin. Bull. Life Sci. 29, 292–301. doi: 10.13376/j.cbls/2017039
Jia, G. Q. and Diao, X. M. (2022). Current status and perspectives of innovation studies related to foxtail millet seed industry in China. Sci. Agric. Sin. 55, 653–665. doi: 10.3864/j.issn.0578–1752.2022.04.003
Jia, G. Q., Huang, X. H., Zhi., H., Zhao, Y., Zhao, Q., Li, W. J., et al. (2013). A haplotype map of genomic variations and genome-wide association studies of agronomic traits in foxtail millet (Setaria italica). Nat. Genet. 45, 957–961. doi: 10.1038/ng.2673
Jiao, Y., Zhang, K., Cai, G., Yu, K., and Zhou, Y. (2021). Fine mapping and candidate gene analysis of a major locus controlling ovule abortion and seed number per silique in Brassica napus L. Theor. Appl. Genet. 134, 1–14. doi: 10.1007/S00122-021-03839-6
Jin, J. H., Li, S. F., Zhao, Y. D., Wang, D., Zhang, Y., Jin, G. G., et al. (2025). Study on important agronomic characters and genetic diversity of 1775 rice germplasm resources. J. Plant Genet. Resour. 26, 481–495. doi: 10.13430/j.cnki.jpgr.20240602002
Jolliffe, I. T. and Cadima, J. (2016). Principal component analysis: a review and recent developments. Phil. Trans. R. Soc. A. 374, 20150202. doi: 10.1098/rsta.2015.0202
Li, S. G., Li, F., Liu, M., Cheng, R., Xia, E. J., and Diao, X. M. (2021). Current status and future prospective of foxtail millet production and seed industry in China. Sci. Agric. Sin. 54, 459–470. doi: 10.3864/j.issn.0578-1752.2021.03.001
Li, Y., Liu, H. C., Shi, X. X., Shi, L., Han, X., Liu., J., et al. (2023a). Phenotypic diversity analysis of 398 naked barley germplasm resources. J. Plant Genet. Resour. 24, 1311–1320. doi: 10.13430/j.cnki.jpgr.20230301002
Li, Y., Liu, H. C., Shi, L., Shi, X. X., Han, X., Liu, J., et al. (2023b). Genetic diversity and population structure analysis of naked barley germplasm resources in Jiangsu province. Acta Agronomica Sinica. 49, 2687–2705. doi: 10.3724/SP.J.1006.2023.31006
Li, Y. S., Xiao, Q., Ma, Y., Tian, C., Zhao, L. J., Wang, K., et al. (2024). Identification and evaluation of phenotypic characters and genetic diversity analysis of 169 tomato germplasm resources. Sci. Agric. Sin. 57, 3671–3687. doi: 10.3864/j.issn.0578-1752.2024.18.012
Li, Y., Zhang, S. H., Guo, Y., Zhang, X. F., and Wang, G. P. (2020). Catkin phenotypic diversity and cluster analysis of 211 Chinese chestnut germplasms. Sci. Agric. Sin. 53, 4667–4682. doi: 10.3864/j.issn.0578-1752.2020.22.013
Lu, P. (2006). Descriptors and Data Standard for Foxtail Millet [Setaria itakica (L.) Beauv.] 2-9 (Beijing: China Agriculture Press), 10–13. Available online at: https://www.cgris.net (Accessed March 25, 2025).
Lv, H. Y. (2018). New methods and progress in research on the origins and evolution of prehistoric agriculture in China. Sci. Sin. Terrae. 48, 181–199. doi: 10.1360/N072017-00297
Meng, S., Fan, G. Y., Zhao, Z. H., Duan, H. F., Liu, G. H., and Liu, D. X. (2024). Agronomic trait analysis of 181 foxtail millet resources. Acta Agrestia Sinica. 32, 2943–2951. doi: 10.11733/j.issn.1007-0435.2024.09.028
Mirheidari, F., Khadivi, A., Moradi, Y., and Paryan, S. (2020). Phenotypic characterization of Prunus haussknechtii bornm., P. elaeagnifolia spach and P.orientalis mill. Scientia Horticulturae. 265, 109273. doi: 10.1016/j.scienta.2020.109273
Nardo, M., Saisana, M., Saltelli, A., and Tarantola, S. (2005). Tools for composite indicators building. Eur. Comission Ispra. 15, 19–20.
Pardo, J. and VanBuren, R. (2021). Evolutionary innovations driving abiotic stress tolerance in C4 grasses and cereals. Plant Cell. 33, 3391–3401. doi: 10.1093/plcell/koab205
Runjić, N. T., Pljevljakušić, D., Runjić, M., Grdiša, M., and Šatović, Z. (2025). Phenotypic plasticity vs. local genetic adaptation: essential oil diversity of natural immortelle (Helichrysum italicum (Roth.) G.Don) populations along eastern Adriatic coast. Front. Plant Sci. 16, 1467421. doi: 10.3389/FPLS.2025.1467421
Tang, G. M., Li, W. D., Zhou, Y. X., Kong, Y. H., Xiao, D. L., Peng, Y. S., et al. (2025). Genetic diversity analysis of cymbidium faberi germplasm resources based on phenotypic traits. Sci. Agric. Sin. 58, 339–354. doi: 10.3864/j.issn.0578-1752.2025.02.010
Wang, M., Zhuo, G., Zha, S., Xi, N. Q. Z., Da, W. D. Z., Guo, G. G., et al. (2025). Genetic diversity analysis and comprehensive evaluation of Qingke germplasm based on six phenotypic traits. Acta Agronomica Sin., 1–14.
Xiang, J. S., Zhang, H. R., Liu, H., Suo, L. X., Jia, S. M., Zhang, Y., et al. (2020). Comparison of phenotypic traits of foxtail millet germplasm resources in different ecological regions. J. Agric. Sci. Technology. 22, 31–41. doi: 10.13304/j.nykjdb.2020.0175
Xu, Z. J., Qi, Y. J., Xing, X. H., Tong, F., and Wang (2022). Analysis and evaluation of agronomic and quality traits in soybean germplasms from Huang-Huai-Hai region. J. Plant Genet. Resour. 3, 468–480. doi: 10.13430/j.cnki.jpgr.20210915001
Xue, Y. P., Xin, X. X., Wang, R. N., Yu, X. H., Liu, S. X., Wang, R. Y., et al. (2024). Analysis of agronomic, quality traits and genetic diversity of domestic and foreign foxtail millet resources. Acta Agronomica Sinica. 50, 2468–2482. doi: 10.3724/SP.J.1006.2024.44041
Yang, Y. T., Li, K. W., Zhang, J. Q., Wei, S. C., Liu, C., and Wang, C. Y. (2022). Climatic suitability analysis of millet growing season in Northern China region in the context of climate warming. Chin. J. Agrometeorology. 43, 215–228. doi: 10.3969/j.issn.1000-6362.2022.03.005
Yang, Q., Zhao, K., Chu, Y., Wang, J., Han, F., Wang, Z., et al. (2024). The adaptation of dryland crops to the climate in southern China. J. Archaeological Science., 70106057–106057. doi: 10.1016/j.jas.2024.106057
Zhang, L., Dong, K. J., He, J. H., Ren, R. Y., Liu, T. P., Li, Y. W., et al. (2025). Construction of a backbone germplasm bank based on phenotypic traits of surimi germplasm resources. J. Plant Genet. Resour, 1–16. doi: 10.13430/j.cnki.jpgr.20241108001
Zhang, H. F., Qi, H. Z., Sun, Y., Feng, X., Yang, C. P., Zhou, W. F., et al. (2023). Character diversity analysis of new wheat varieties from different origins in Huang-Huai winter wheat region. J. Plant Genet. Resour. 24, 719–731. doi: 10.13430/j.cnki.jpgr.20220703001
Zhang, Z., Yao, Z. Y., Ma, Q. Q., Liu, J. M., Liu, Y. X., Liang, W. H., et al. (2022). A study on the phenotypic diversity of Sinopodophyllum hexandrum (Royle) ying. Pak. J. Bot. 54, 2291–2302. doi: 10.30848/PJB2022-6(28
Zhang, Y. Z., Zhang, X. J., Liang, D., Guo, Q., Fan, X. Q., Nie, M. E., et al. (2023). Genetic diversity analysis and comprehensive evaluation of sorghum breeding materials based on phenotypic traits. Sci. Agric. Sin. 56, 2837–2857. doi: 10.3864/j.issn.0578-1752.2023.15.001
Zhou, Y., Li, Z. B., Huang, J., Wu, S., Zhang, Y. Q., Zhang, Z. L., et al. (2021). Genetic diversity of sorghum germplasms based on phenotypic traits. J. Plant Genet. Resour 22, 654–664. doi: 10.13430/j.cnki.jpgr.20200922001
Keywords: foxtail millet, germplasm resources, agronomic traits, comprehensive evaluation, genetic diversity analysis
Citation: Xue X, Yu Z, Mu A, Yang F, Liu D, Zhang S, Zhang J, Cheng Y, Zhao Y, Zhang Y and Wang X (2025) Identification and evaluation of phenotypic characters and genetic diversity analysis of 1,558 foxtail millet germplasm resources for conservation and breeding. Front. Plant Sci. 16:1624252. doi: 10.3389/fpls.2025.1624252
Received: 07 May 2025; Accepted: 24 June 2025;
Published: 16 July 2025.
Edited by:
Mahesh Rao, Indian Council of Agricultural Research, IndiaReviewed by:
Chengfu Su, Qingdao Agricultural University, ChinaRituraj Khound, University of Nebraska-Lincoln, United States
Copyright © 2025 Xue, Yu, Mu, Yang, Liu, Zhang, Zhang, Cheng, Zhao, Zhang and Wang. This is an open-access article distributed under the terms of the Creative Commons Attribution License (CC BY). The use, distribution or reproduction in other forums is permitted, provided the original author(s) and the copyright owner(s) are credited and that the original publication in this journal is cited, in accordance with accepted academic practice. No use, distribution or reproduction is permitted which does not comply with these terms.
*Correspondence: Xinwei Xue, eHVleGlud2VpQDE2My5jb20=; Yongping Zhang, aW1hdXp5cEAxNjMuY29t; Xianrui Wang, d2FuZ3hpYW5ydWkzMjFAMTYzLmNvbQ==