 Xiangkun Qi
 Weidong Huang†
 Jian Fu
- College of Agronomy, Heilongjiang Bayi Agricultural University, Key Laboratory of Modern Agricultural Cultivation and Crop Germplasm Improvement of Heilongjiang Province, Daqing, China
Northeast China’s black soil region faces soil fertility decline, inadequate straw usage, and low maize yields. To address these issues, we conducted a two-year field experiment. The seven treatments comprised rotary ridge tillage (Con), no-tillage (T1), straw return + no-tillage (T2), deep-plowing straw return + ridge tillage (T3), deep-plowing straw return + flat tillage (T4), straw crushing and return + ridge tillage (T5), and straw crushing and return + flat tillage (T6). We examined the impact of various tillage methods on the structure of soil water-stable aggregates, soil nutrients, enzyme activity, and maize yield. The findings indicated that from 2021 to 2022, the soil macroaggregate content in the T4 considerably increased by 23.52% compared to the Con. Compared to Con, T4 significantly increased the mean weight diameter (MWD) and geometric mean diameter (GMD), enhancing soil fertility. Additionally, T4 reduced bald tip length while boosting the 100-Kernels weight by 24.01%, ultimately increasing maize yield by 13.62%. Consequently, deep-plowing straw return + flat tillage significantly enhanced soil structure, augmented soil fertility, and elevated maize production, rendering it the most appropriate tillage strategy for this region.
1 Introduction
Maize is among the most essential food crops globally. As the world’s second largest producer of maize. China constitutes 22.4% of global maize production while employing under 20% of the total worldwide maize growing area (FAOSTAT, 2021). The semi-arid area in western Heilongjiang Province is a principal maize production zone in China, where ridge tillage is the primary spring cultivation method. Prolonged agricultural automation and constant tillage have resulted in soil structure deterioration and a loss in fertility (Afshar et al., 2022). The region faces arid springs and wet summers, leading to severe soil moisture depletion under conventional ridge tillage in spring and waterlogging risks in summer. These conditions significantly reduce maize production in the area. Consequently, examining suitable agricultural practices in this region is essential for guaranteeing food security and safeguarding the agro-ecological ecosystem. Different tillage systems can significantly alter soil properties, including physical, chemical, and biological characteristics. Conventional tillage methods often caused substantial soil erosion and water depletion, ultimately resulting in decreased soil fertility and degradation of the agro-ecological environment (Huang et al., 2018). In contrast to conventional tillage methods, no-tillage increased soil bulk density, which could inhibit crop root growth and development (Ji et al., 2013). Flat tillage methods could markedly decrease soil water evapotranspiration and improve soil moisture retention capability (Liang et al., 2021). Straw incorporation was widely acknowledged as an essential agricultural method for improving soil fertility (Zhao et al., 2019). Straw mulching has been shown to increase soil organic matter content (Akhtar et al., 2018), significantly reduce soil moisture evaporation, mitigate soil compaction, and diminish soil nutrient loss (Lv et al., 2023). Deep plowing straw returning could significantly mitigate soil compaction and adhesion, reduce insect and disease prevalence, facilitate straw decomposition, and improve soil fertility (Al-Kaisi et al., 2014; Liu et al., 2022). Therefore, when analyzing the impact of tillage systems on soil physicochemical characteristics, it is essential to consider the incorporation of diverse straw return schemes with tillage practices.
China’s semi-arid western regions face three critical challenges: deteriorating soil fertility, underutilized straw resources, and suboptimal maize productivity. Implementing conservation tillage with straw return methods presents an effective solution to these problems (Chen et al., 2022; Zhao et al., 2023). The efficacy of conservation tillage and straw return strategies for soil enhancement varies considerably across diverse regions and environmental situations. We conducted a two-year field experiment to evaluate different tillage and straw returning methods on soil aggregate stability, nutrient dynamics, enzyme activity, and maize yield. We hypothesized that deep-plowing straw return + flat tillage improved soil aggregate stability, enhanced fertility, and increased yield, making it the optimal tillage method for this region. This research establishes a theoretical basis for optimizing tillage methods, improving straw resource management, and attaining elevated maize yields in the semi-arid areas of western Heilongjiang Province.
2 Materials and methods
2.1 Experimental site
The research location is situated in Zhao Zhou County, Heilongjiang Province (N 46°00′28″, E 125°3 2′81″). The area is level, characterized by an average frost-free duration of 130–135 days. Supplementary Figure S1 illustrates the air temperature and precipitation distributions for the maize growing seasons of 2021 and 2022. The soil is classified as chernozem. The fundamental fertility parameters of the topsoil at a depth of 0–20 cm are as follows: organic carbon, 14.83 g kg-1; pH, 7.9; total nitrogen, 1.19 g kg-1; available phosphorus, 17.2 mg kg-1; and available potassium, 240.4 mg kg-1.
2.2 Experimental design
This experiment included a positioning assessment, with data collected annually from 2021 to 2022. In this paper, positioning research denotes the process of ongoing investigation, observation, and analysis conducted at a designated site, maintaining both the testing location and agricultural practices throughout the study. Seven treatments were employed for comparison in the experiment: rotary ridge tillage (Con), no-tillage (T1), straw return + no-tillage (T2), deep-plowing straw return + ridge tillage (T3), deep-plowing straw return + flat tillage (T4), straw crushing and return + ridge tillage (T5), and straw crushing and return + flat tillage (T6) (Table 1). Rotary ridge tillage was used as a Con. The tested variety is ‘Dongxu 20’. Each treatment was repeated three times with a random block arrangement, and the experimental plot was designed to be 0.33 hm2 (100 m×32.5 m). The planting density of the maize was 75000 plants hm-2, and the compound fertilizer was applied at 650 kg hm-2 (N:P2O5:K2O = 27:10:12). All the farming practices including herbicide and insecticides were performed in each plot and consistent with local agronomic practices during the entire experimental seasons. Maize was planted on 2 May 2021 and 28 April 2022 and harvested on 1 October 2021 and 2 October 2022.
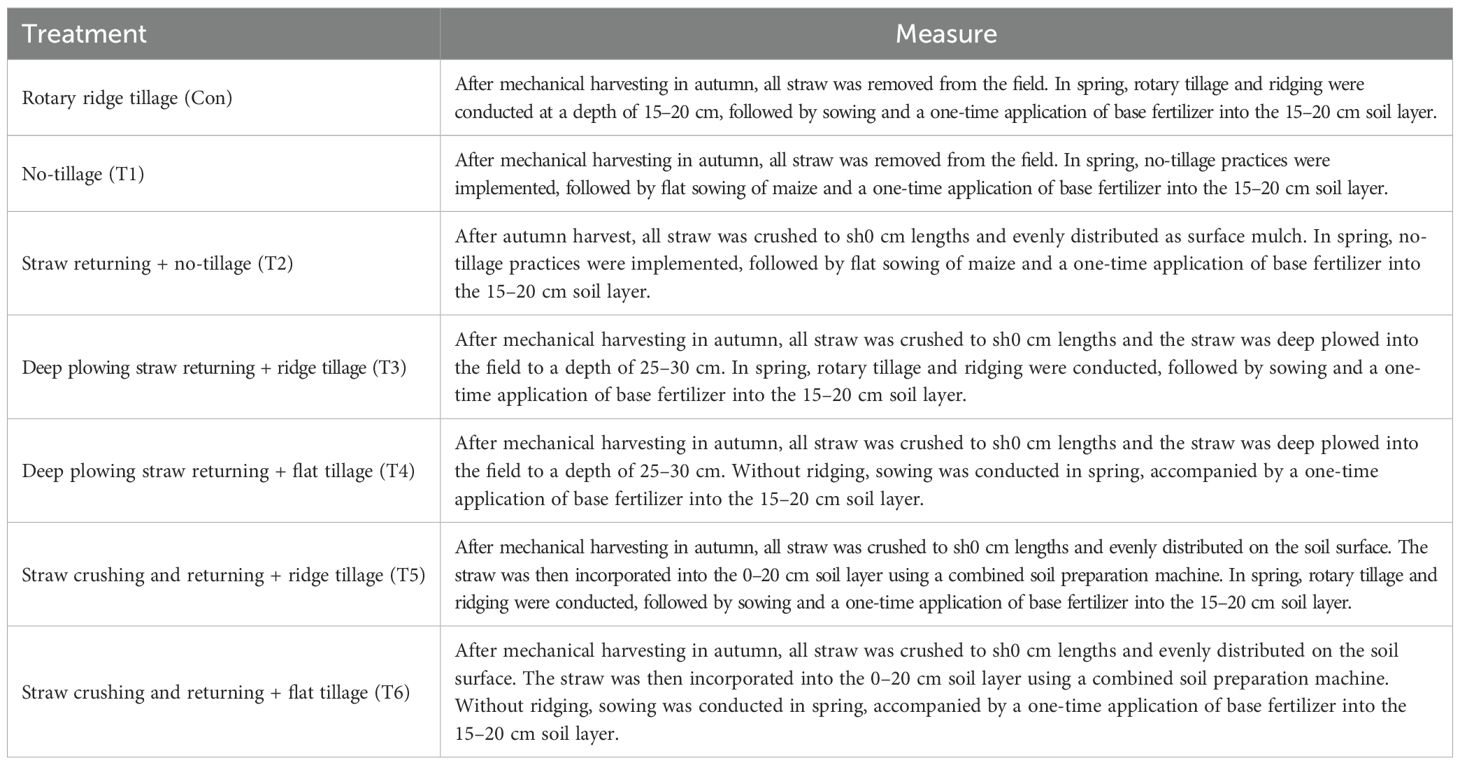
Table 1. Experimental design.
2.3 Sample collection
Soil samples were taken at depths of 0–10 cm, 10–20 cm, and 20–30 cm using a soil auger during the maize jointing, tasseling, and maturity phases throughout the 2021–2022 growth seasons for each treatment. Residual roots, straw pieces, and other contaminants were manually extracted from the soil samples, which were subsequently brought to the laboratory in sealed containers for drying, grinding, and sifting prior to analysis. Soil water-stable aggregates were categorized by the wet sieving technique (Elliott, 1986), yielding six specific size classifications: >5 mm, 2–5 mm, 1–2 mm, 0.5–1 mm, 0.25 - 0.5 mm, and<0.25 mm.
2.4 Measurement and methods
2.4.1 Measurement of the soil nutrient content
The soil organic matter content was determined via the potassium dichromate volumetric method (Nelson, 1982). The soil total nitrogen content was determined via digestion with H2SO4 and an automatic Kjeldahl apparatus (Nelson and Sommers, 1980). The soil-available nitrogen was determined via the sodium hydroxide-boric acid-available nitrogen diffusion method (Mulvaney and Khan, 2001). Soil-available phosphorus was extracted via the 0.5 mol L-1 NaHCO3 colorimetric method (Truog, 1930). Soil-available potassium was measured via atomic absorption spectrophotometry with 0.5 mol L-1 NH4OAc (Mehlich, 2008).
2.4.2 Measurement of soil enzyme activity
1. The catalase activity was determined based on the method described by (Ren et al., 2016). Two grams of each air-dried soil sample was weighed and placed in a 100 ml conical bottle, 5 mL of 3% H2O2 solution and 40 mL of deionized water were added, and the mixture was shaken for 20 min and then filtered. Five milliliters of H2SO4 solution containing 1.5 mol L-1 H2SO4was added to the clear liquid, and then 25 ml of H2SO4 solution was removed after filtration. The volume of KMnO4 solution consumed was recorded by titrating with 0.02 mol L-1 KMnO4 solution until the liquid was slightly red and did not change color for 30 s.
2. The urease activity was determined based on the method described by Ren et al. (2016). Fresh soil samples (5 g) were transferred to a 100-ml conical flask and were incubated by adding citrate solution (20 ml, pH 6.7) and urea solution (10 ml, 10%, w/v) for 24 h at 37°C. The mixed solution was shaken at 180 rpm for 20 min and then filtered. Then, the filtrate (1 ml), sodium hypochlorite solution (3 ml), and sodium phenol solution (4 ml) were mixed in a 50-ml volumetric flask. Deionized water was added to the volumetric flask to a constant volume of 50 ml. The absorbance of the solution was measured at 578 nm using a spectrophotometer (UV2550, Shimadzu, Japan).
3. The alkaline phosphatase activity was determined based on the method described by Ren et al. (2016). Five grams of air-dried soil was placed in a 200-triangle bottle with 2.5 ml of toluene. After 15 min, 20 ml of 0.5% sodium phenyldisodium phosphate was added, the reaction mixture was incubated at 37°C, the mixture was cultured for 24 h, 100 ml of 0.3% aluminum sulfate solution was added to the culture medium, and the mixture was filtered with dense filter paper. Three milliliters of filtrate was placed into a 50 ml volumetric bottle, 5 ml of buffer and 4 drops of chloroform-p-benzoquinone imide reagent were added to each bottle, the mixture was diluted to scale after color development, and the color at a wavelength of 660 nm was compared via a spectrophotometer.
2.4.3 Evaluation of soil aggregate stability indices
(1) The mass percentage of aggregates at a given particle size level was calculated according to the method described by (Choudhury et al., 2014)
where Mi is the mass of the i-level soil water-stable aggregate after sieving (g), and M was applied to determine the total mass of the aggregates (g).
(2) Soil aggregate stability was determined using the MWD and GMD. The calculation formulas of MWD and GMD (Haynes and Swift, 1990) are as follows:
where Wi is the weight percentage of each aggregate (%), and Xi is the average diameter (mm) of each particle size.
(3) The fractal dimension of the soil water-stable aggregates was calculated following (Rasiah et al., 1993)
where M (r< Xi) is the aggregate weight (g) with a particle size smaller than Xi, MT is the total weight of the aggregates, Xi is the average diameter of a certain level of the aggregate, and X max is the maximum particle size of the aggregates.
2.4.4 Measurement of maize yield
At the maize maturity stage, four rows (5 m long with 0.65 m row spacing) were selected from the central area of each plot. All maize ears were harvested, and the grain moisture content was measured using a PM8818 moisture analyzer. The final yield was adjusted to a standard moisture content of 14%.
2.5 Statistical analysis
Excel 2010 was used to organize the data. Different treatments were compared via Duncan’s test at the 0.05 probability level (P ≤ 0.05). Analysis of variance was performed for grain yield, soil aggregates, organic carbon, soil nitrogen, and soil enzyme activity via SPSS22.0 (SPSS Inc., Chicago, USA). Origin 2021 software (Origin Lab, USA) was used for figure preparation.
3 Results
3.1 Soil water - stable aggregates
Y and T had significant effects on soil aggregate content(P<0.01; Figure 1). In 2021 and 2022, the content of soil water-stable aggregates gradually increased as the aggregate particle size decreased. Compared to the Con treatment, all other treatments increased the content of large aggregates. In the 0–10 cm soil layer, all other treatments significantly increased the content of large aggregates compared to the Con treatment. In the 10–20 cm soil layer, the T4 treatment showed the highest contents of water-stable aggregates in the size fractions of > 5 mm, 2–5 mm, 1–2 mm, and 0.5–1 mm, with increases of 54.88%, 45.04%, 42.16%, and 27.01%, respectively, compared to the Con treatment. In the 20–30 cm soil layer, the T4 treatment exhibited the highest content of R > 0.25mm.
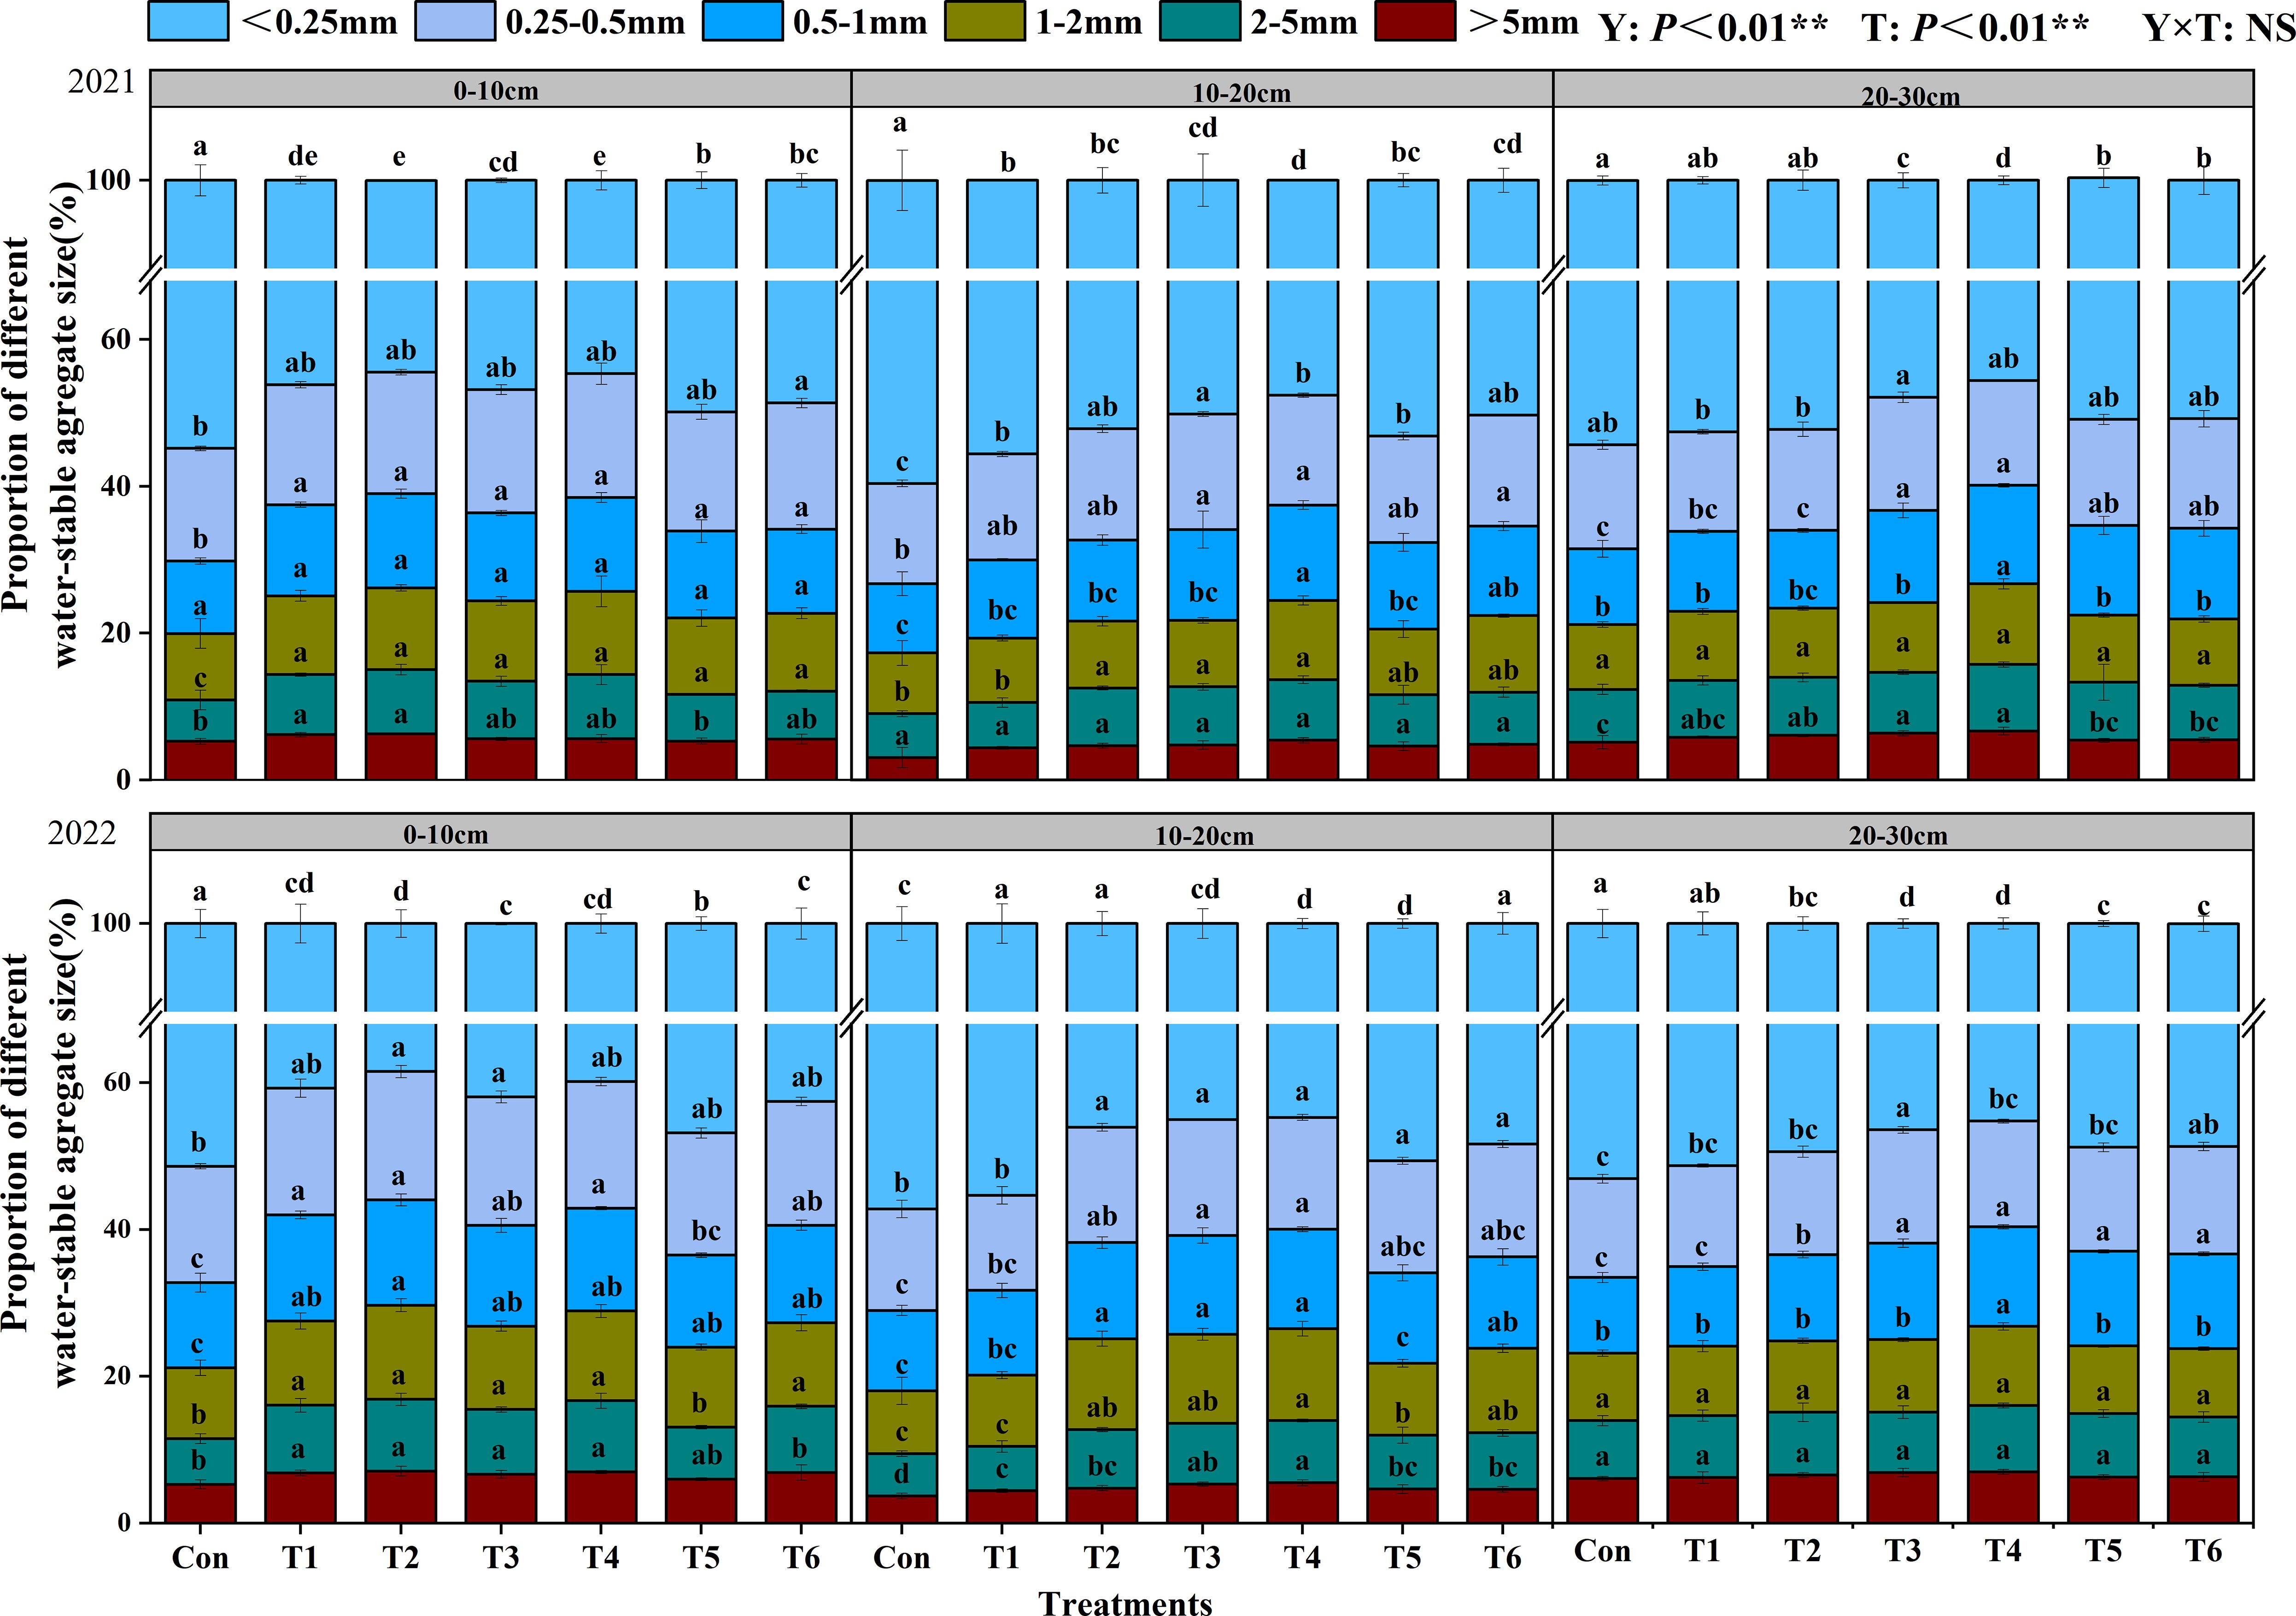
Figure 1. Effects of tillage methods on the particle size composition of soil water-stable aggregates. Con (rotary ridge tillage), T1 (no-tillage), T2 (raw return + no-tillage), T3 (deep plow straw return + ridge tillage), T4 (deep plow straw return + flat tillage), T5 (raw crushing and return + ridge tillage), and T6 (raw crushing and return + flat tillage). Different alphabets indicate the significance within the same year at 5% level by Duncan' tests. In ANOVA, Y, T represent the variable year, treatment. NS, not significant, (p > 0.05). **, Significant at p < 0.01.
3.2 Soil water - stable aggregate stability
Y and T significantly influenced MWD (P< 0.01), while T significantly affected GMD (P< 0.01), and T also had a notable impact on GMD (P< 0.05; Figures 2a, b). In the 0–10 cm soil layer, the T2 treatment showed the highest MWD and GMD, with significant increases of 25.42% and 23.91%, respectively, compared to the Con treatment. In the 10–20 cm soil layer, all treatments except T1 significantly increased the MWD and GMD of aggregates compared to the Con treatment. In the 20–30 cm soil layer, the T4 treatment exhibited the highest MWD and GMD values, with significant increases of 15.72% and 15.89%, respectively, compared to the Con treatment.
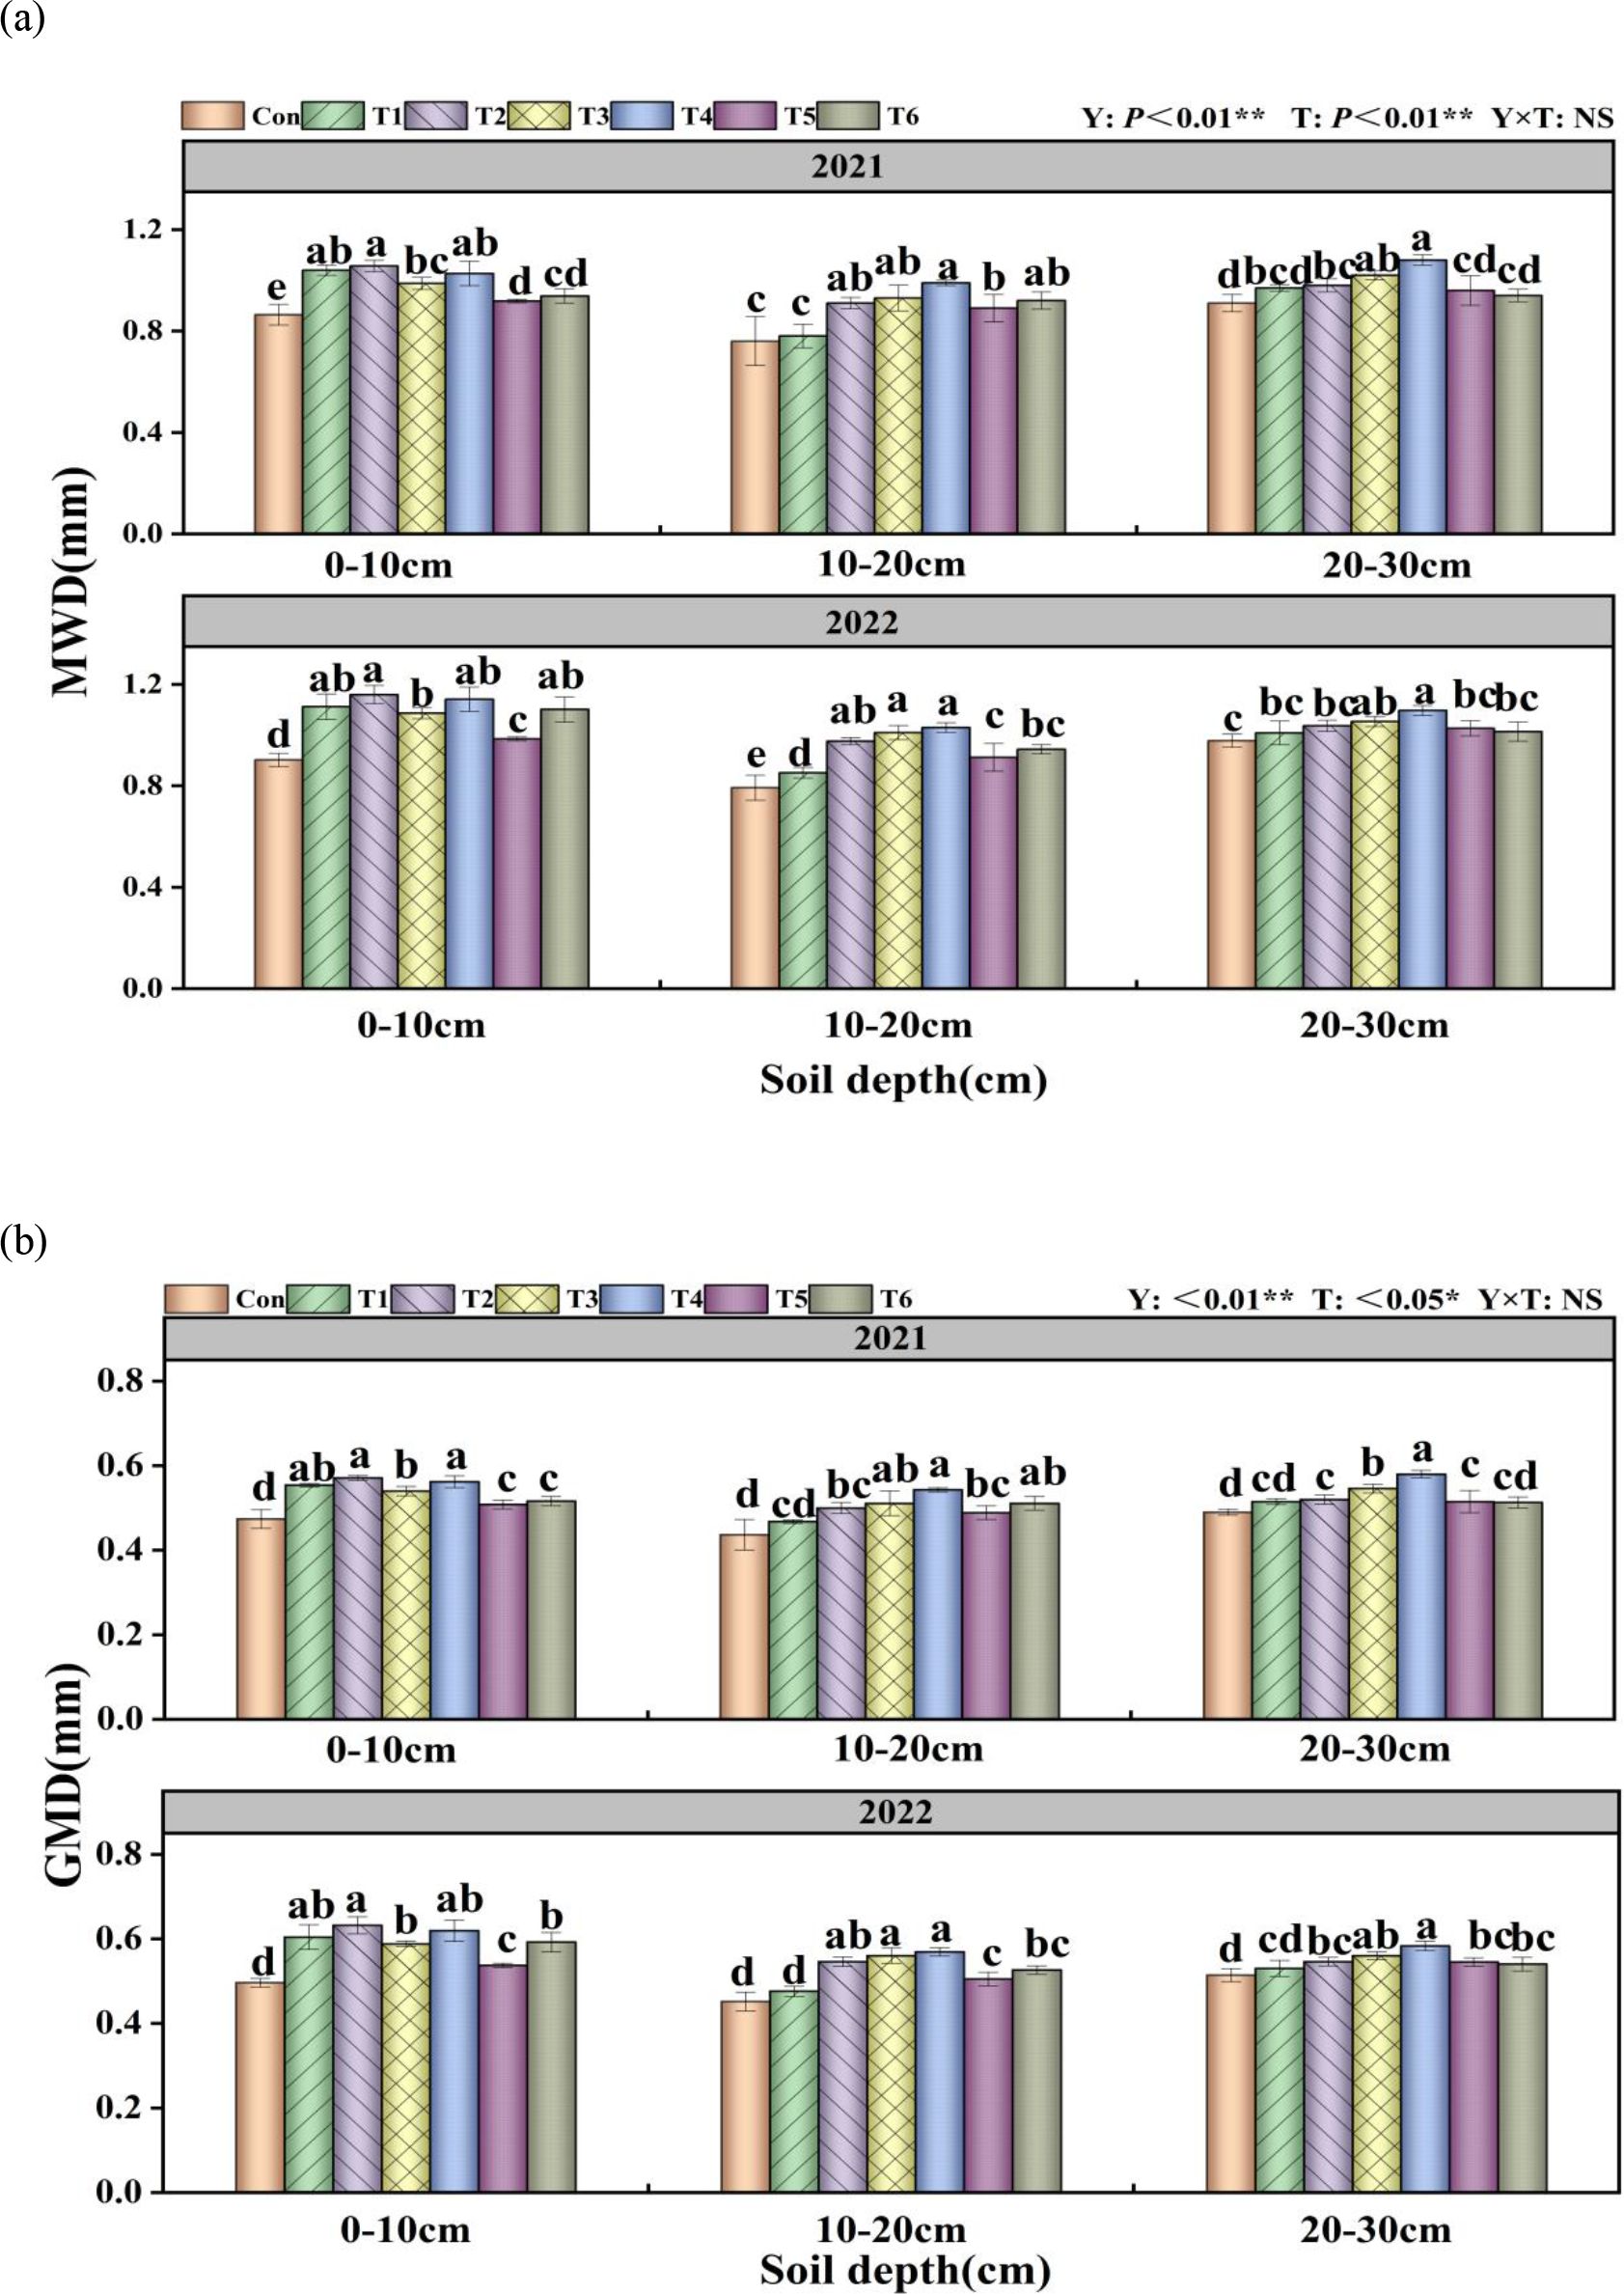
Figure 2. Effects of tillage methods on soil water-stable aggregate stability. Mean weight diameter (MWD) (a) and geometric mean diameter (GMD) (b). Con (rotary ridge tillage), T1 (no-tillage), T2 (raw return + no-tillage), T3 (deep plow straw return + ridge tillage), T4 (deep plow straw return + flat tillage), T5 (raw crushing and return + ridge tillage), and T6 (raw crushing and return + flat tillage). MWD, mean weight diameter; GMD, geometric mean diameter. Different alphabets indicate the significance within the same year at 5% level by Duncan' tests. In ANOVA, Y, T represent the variable year, treatment. NS, not significant, (p > 0.05). *, Significant at p < 0.05. **, Significant at p < 0.01.
3.3 Organic carbon in soil water - stable aggregate
T significantly influences the organic carbon content of aggregates (P< 0.01; Figure 3). In the 0–10 cm soil layer, all treatments significantly increased the water-stable organic carbon content in soil aggregates compared to the Con treatment. In the 10–20 cm soil layer, the organic carbon content of aggregates larger than 5 mm, between 2–5 mm, and between 1–2 mm in the T4 treatment was considerably elevated compared to the Con treatment, with increases of 12.96%, 10.43%, and 12.83%, respectively. Within the 20–30 cm soil layer, the T4 treatment had the greatest organic carbon concentration across all aggregate size fractions.
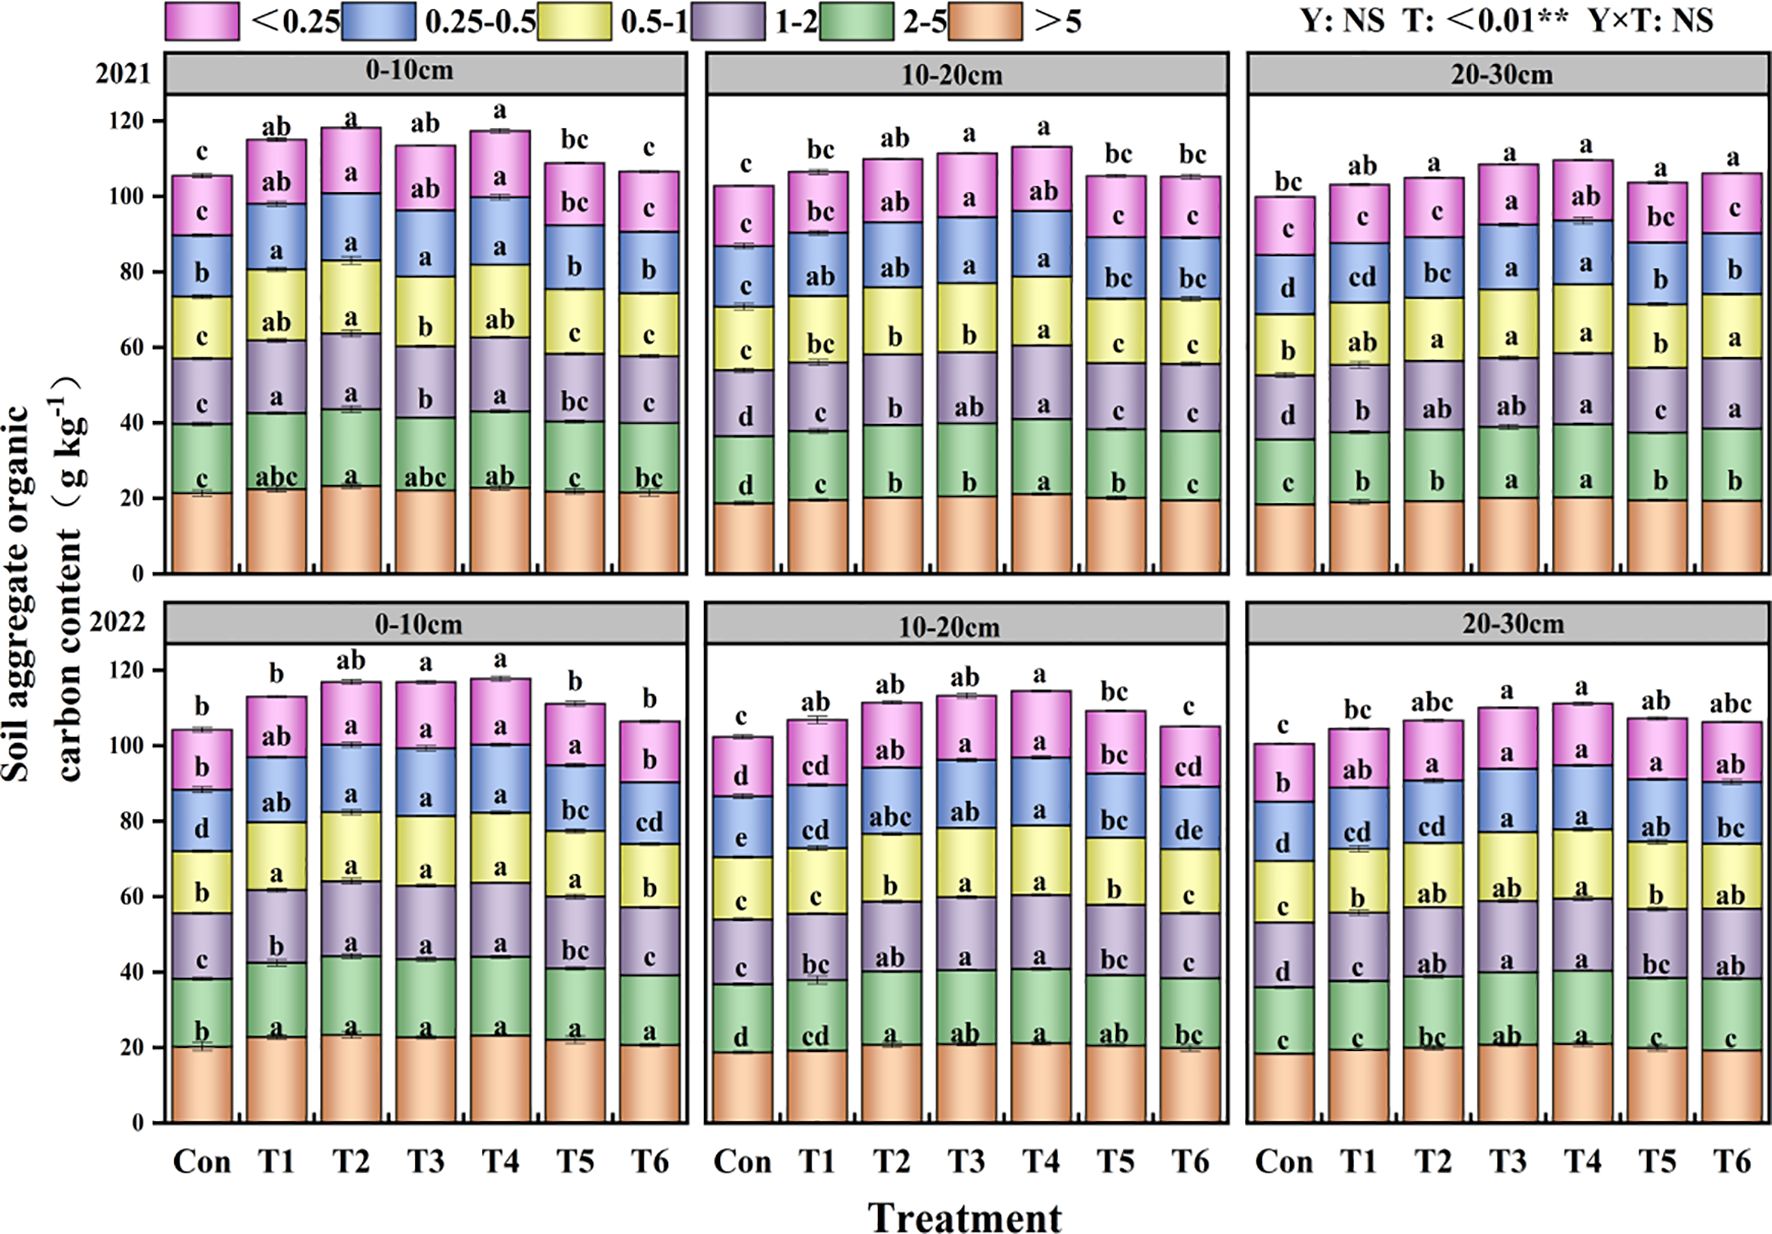
Figure 3. Effects of tillage methods on the soil soil water-stable aggregate organic carbon content. Con (rotary ridge tillage), T1 (no-tillage), T2 (raw return + no-tillage), T3 (deep plow straw return + ridge tillage), T4 (deep plow straw return + flat tillage), T5 (raw crushing and return + ridge tillage), and T6 (raw crushing and return + flat tillage). Different alphabets indicate the significance within the same year at 5% level by Duncan' tests. In ANOVA, Y, T represent the variable year, treatment. NS, not significant, (p > 0.05). **, Significant at p < 0.01.
3.4 Soil organic carbon content
The influence of Y and T on the soil organic carbon content was highly significant (P<0.01; Figure 4). In 2021 and 2022, the SOC content across all treatments shown a progressive decline with increasing soil depth. In the 0–10 cm soil layer, T2 treatment demonstrated a substantial increase of 16.77% relative to the Con treatment. In the 10–20 cm soil layer, the SOC content of the treatments ranked as follows: T4 > T3 > T2 > T5 > T6 > T1 > Con. The T4 treatment exhibited a notable increase of 18.45% in the 20–30 cm soil layer compared to the Con treatment.
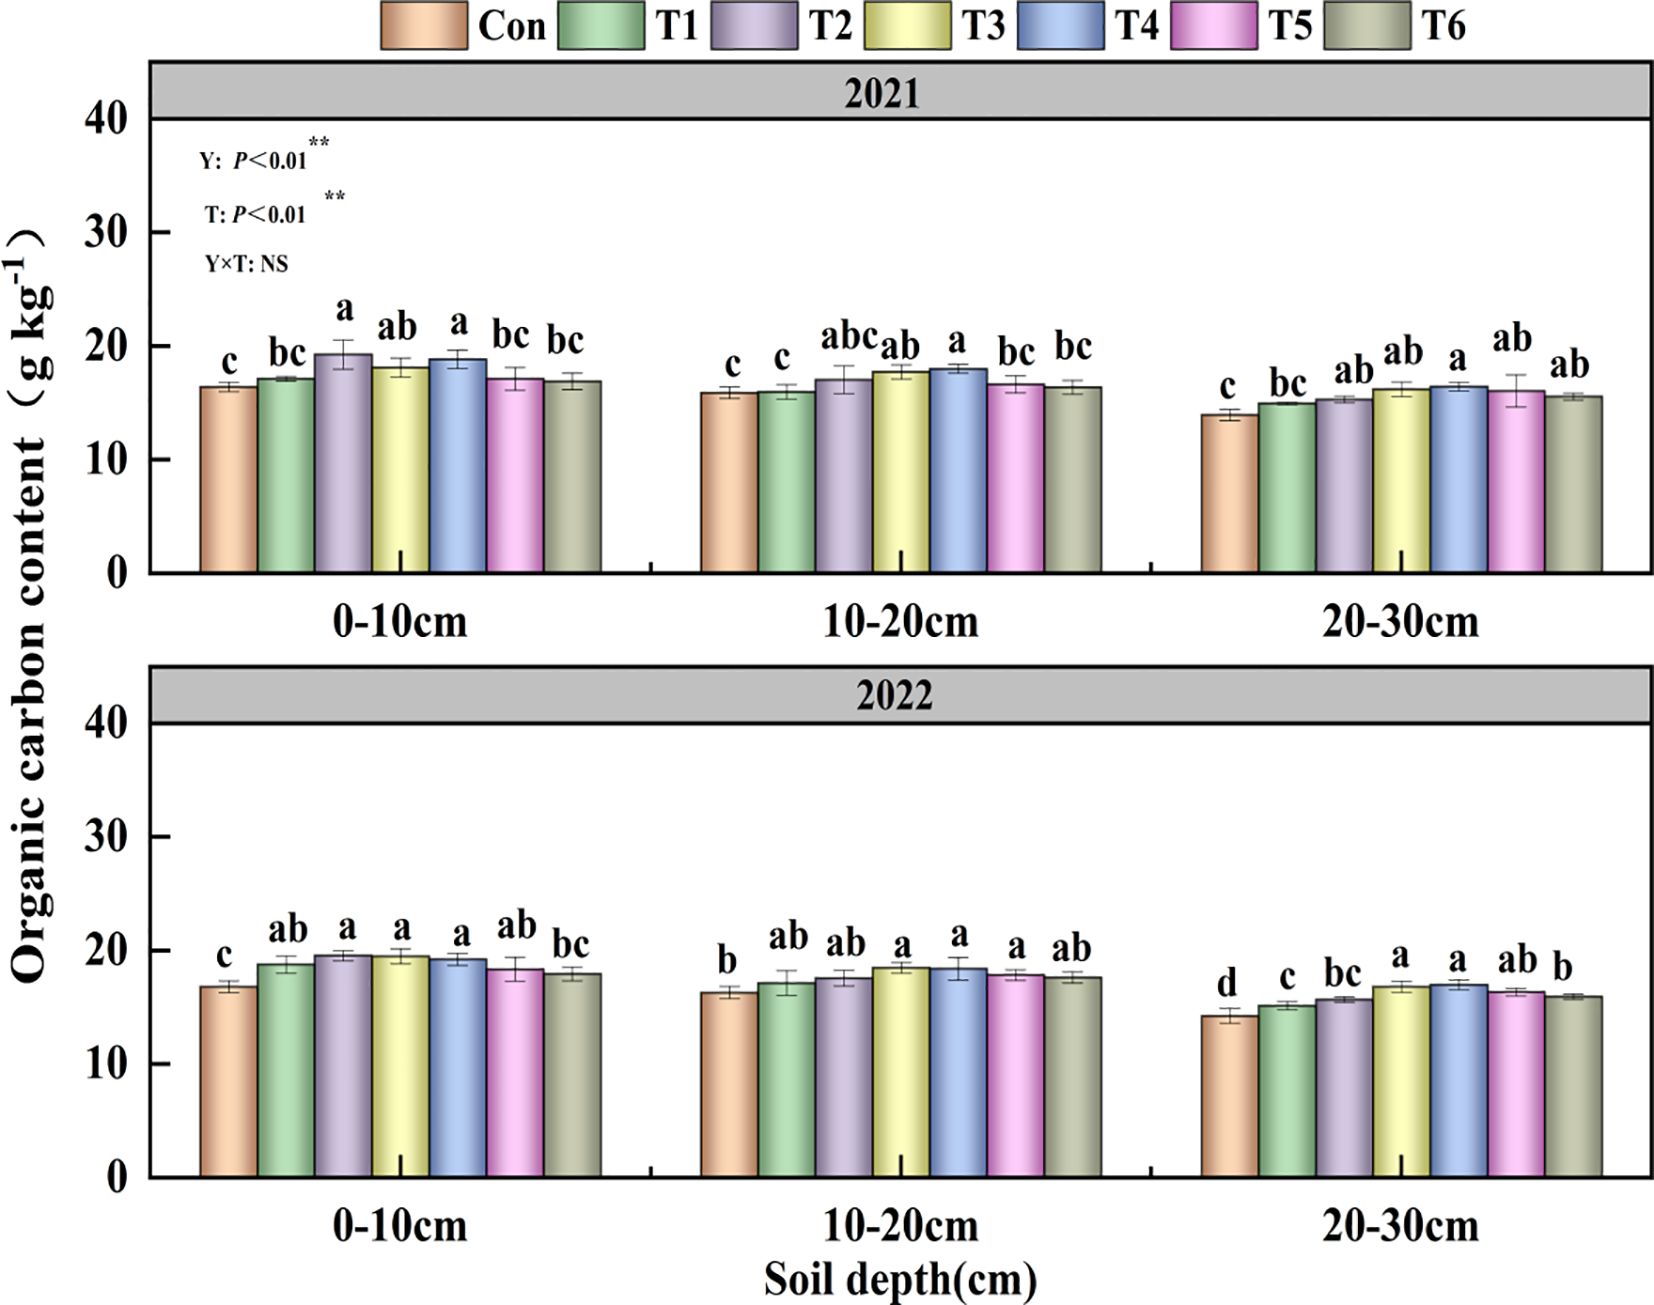
Figure 4. Effects of tillage methods on the soil total organic carbon content. Con (rotary ridge tillage), T1 (no-tillage), T2 (raw return + no-tillage), T3 (deep plow straw return + ridge tillage), T4 (deep plow straw return + flat tillage), T5 (raw crushing and return + ridge tillage), and T6 (raw crushing and return + flat tillage). SOC, soil organic carbon. Different alphabets indicate the significance within the same year at 5% level by Duncan' tests. In ANOVA, Y, T represent the variable year, treatment. NS, not significant, (p > 0.05). **, Significant at p < 0.01.
3.5 Soil nitrogen content
In the 0–10 cm soil layer, the T2 treatment exhibited the greatest TN content during the growth phases from jointing to tasseling (Table 2). In the 10–20 cm soil layer, the T4 treatment demonstrated the most significant improvement in TN content, with increases of 15.58%, 16.36%, and 15.26%, respectively, compared to the Con treatment. In the 20–30 cm soil layer, the T3 and T4 treatments shown elevated TN content relative to the Con treatment.
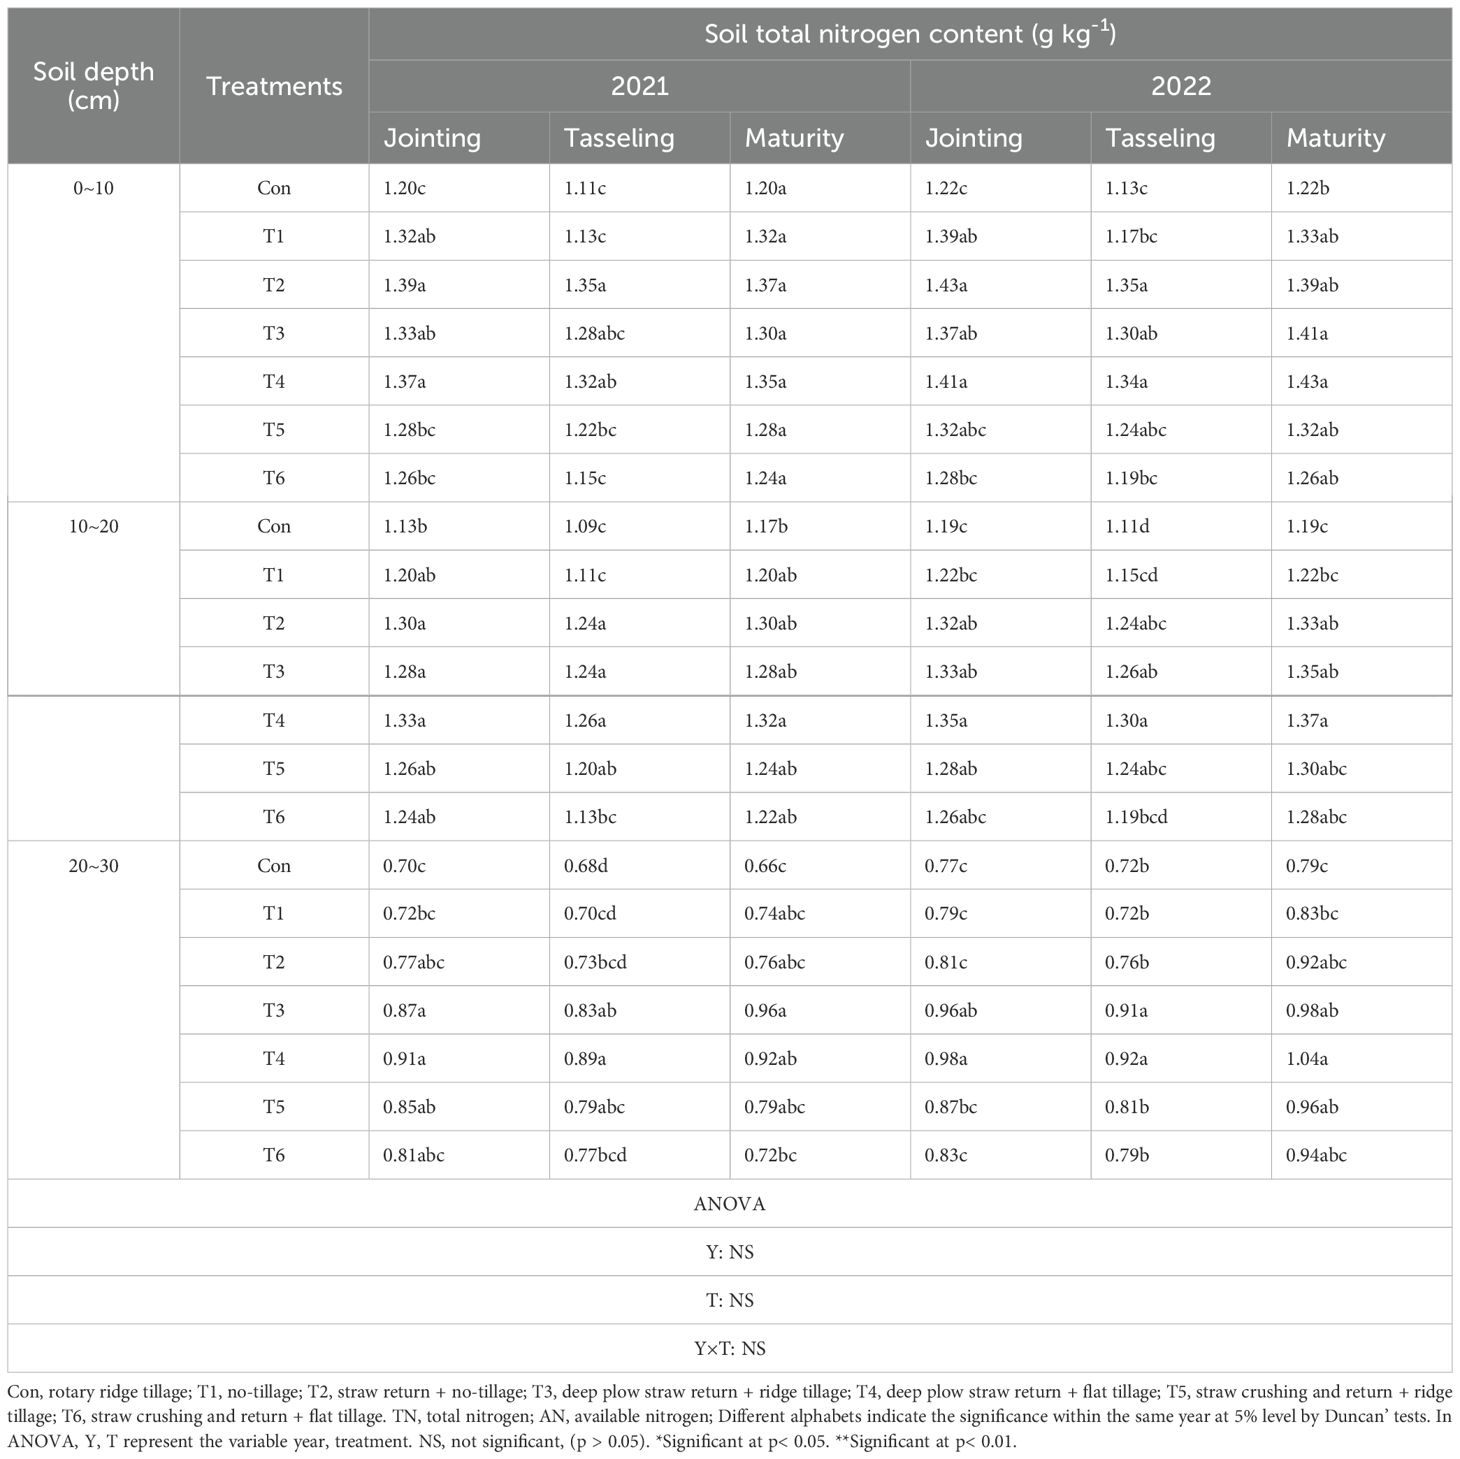
Table 2. Effects of tillage methods on the soil total nitrogen content.
3.6 Soil available phosphorus content
T and Y exerted substantial impacts on AP (P<0.01; Table 3). The AP content of the T2 treatment in the 0–10 cm soil layer was superior to that of the T1 treatment. In the 10–20 cm soil layer, the T4 treatment had a markedly higher AP content than the T6 treatment, with increases of 10.81%, 13.92%, and 27.27% from the jointing stage to the maturity stage. In the 20–30 cm soil layer, the T4 treatment exhibited a notable increase in AP content relative to the Con treatment during all growth stages, with increments of 23.54%, 29.88%, and 36.24%, respectively.
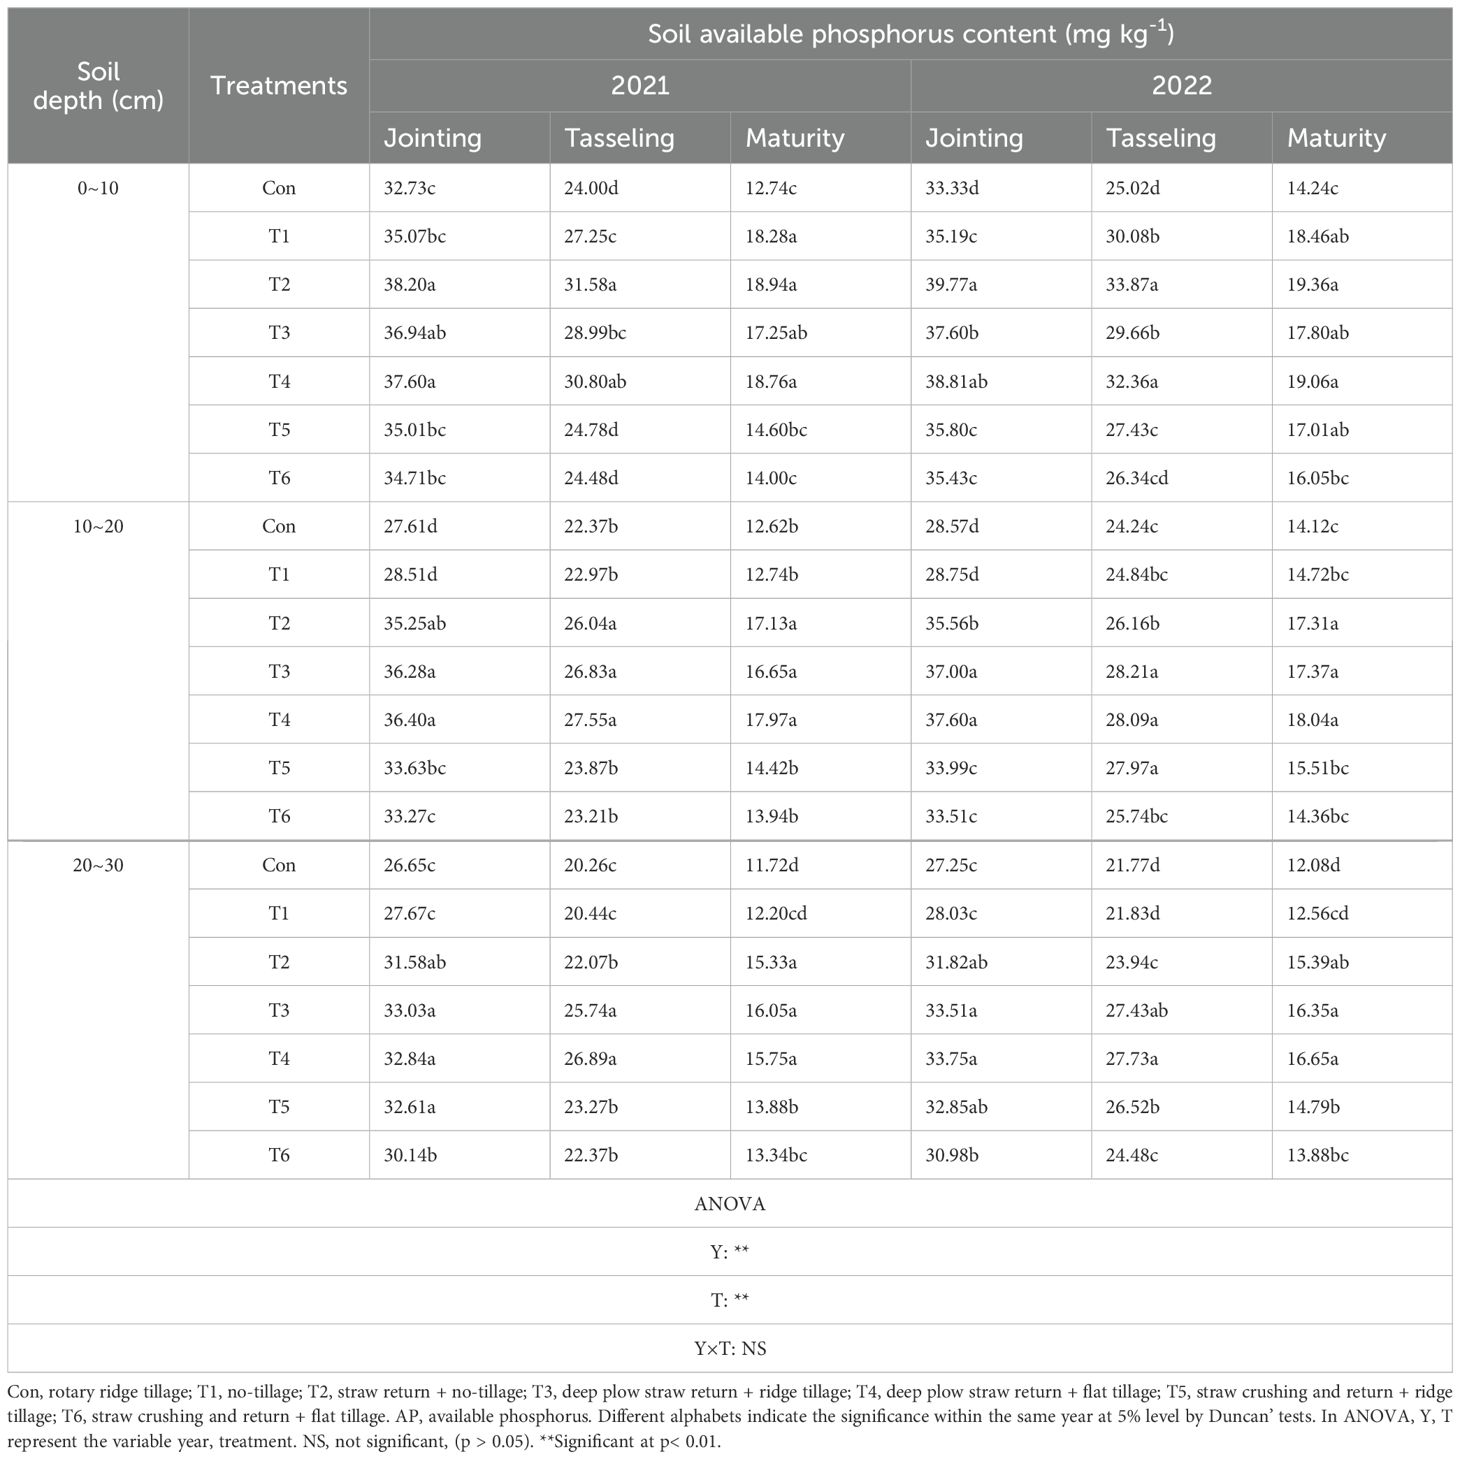
Table 3. Effects of tillage methods on the soil available phosphorus content.
3.7 Soil available potassium content
T and Y exerted substantial impacts on AK (P<0.01; Table 4). In the 0–10 cm soil layer, T2 treatments enhanced the AK content at every growth stage, achieving a statistically significant difference at maturity, with a 14.76% increase relative to the Con treatment. The T4 treatment demonstrated significantly elevated AK content in the 10–20 cm soil layer across all growth stages, with increases of 11.21%, 15.83%, and 12.09%, respectively, compared to the Con treatment. In the 20–30 cm soil layer, the average AK content across treatments exhibited the following descending order: T4 > T3 > T5 > T6 > T2 > T1 > Con.
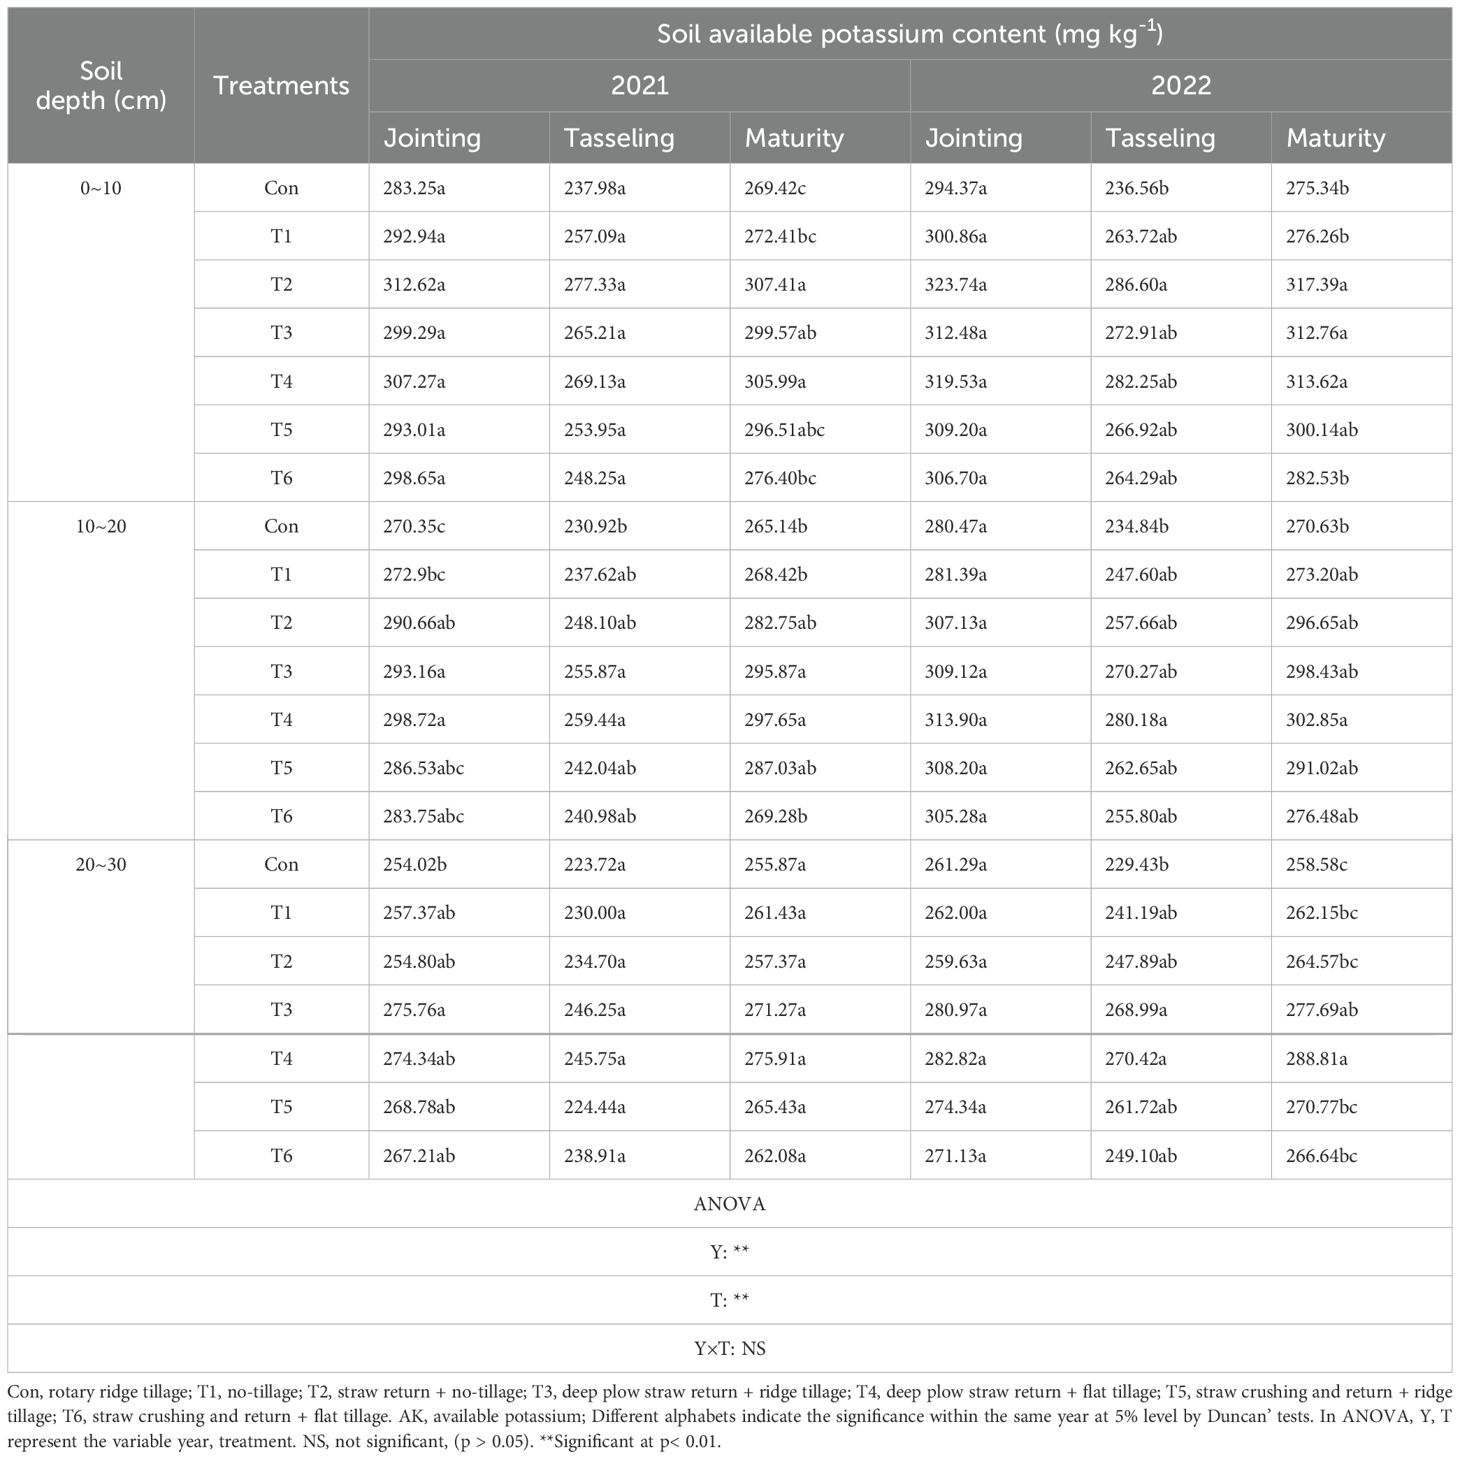
Table 4. Effects of tillage methods on the soil available potassium content.
3.8 Soil alkaline phosphatase activity
T had a significant impact on soil alkaline phosphatase activity (P<0.01; Figure 5). In both 2021 and 2022, the enzyme activity in the 0–30 cm soil layer for all treatments initially diminished and subsequently grew progressively during the growth period. The alkaline phosphatase activity in the 0–10 cm soil layer was lowest in the Con treatment at every growth stage. In the 10–20 cm soil layer, the T4 treatment exhibited the highest soil alkaline phosphatase activity at each development stage.
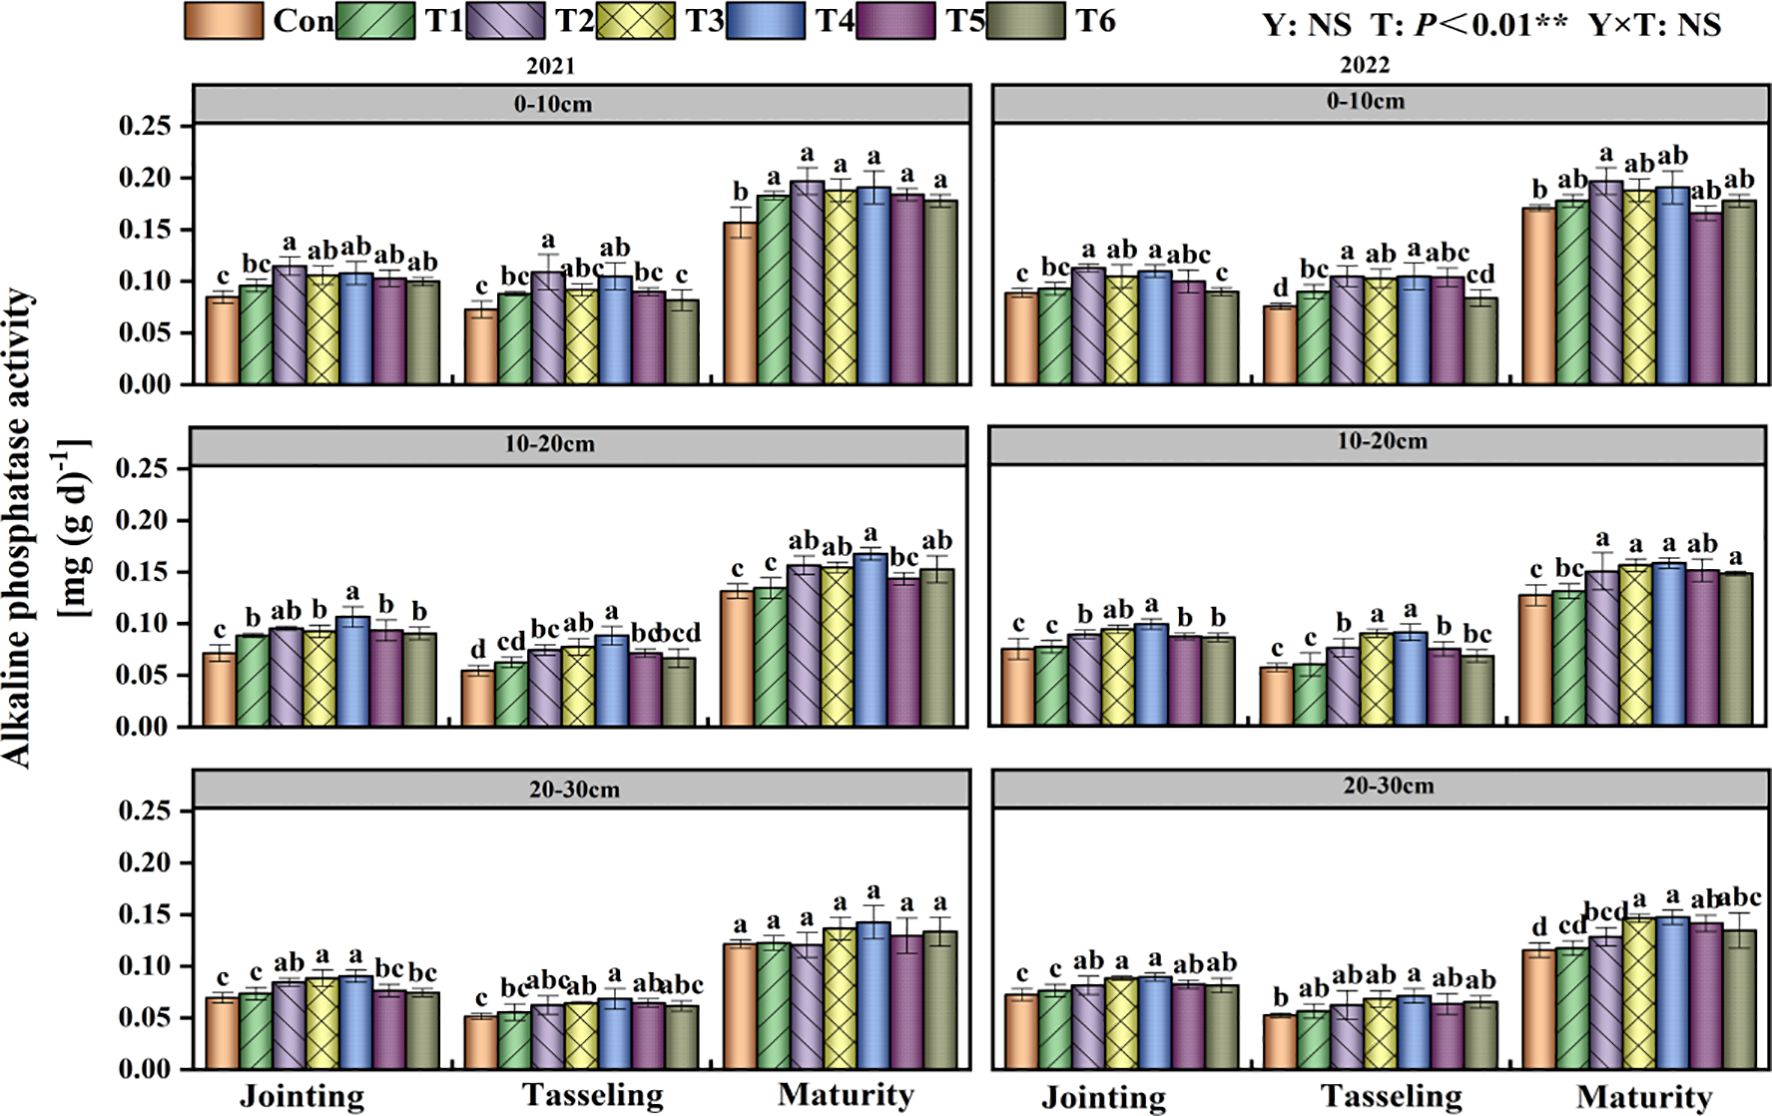
Figure 5. Effects of tillage methods on soil alkaline phosphatase activity. Con (rotary ridge tillage), T1 (no-tillage), T2 (raw return + no-tillage), T3 (deep plow straw return + ridge tillage), T4 (deep plow straw return + flat tillage), T5 (raw crushing and return + ridge tillage), and T6 (raw crushing and return + flat tillage). Different alphabets indicate the significance within the same year at 5% level by Duncan' tests. In ANOVA, Y, T represent the variable year, treatment. NS, not significant, (p > 0.05). **, Significant at p < 0.01.
3.9 Soil urease activity
T had a considerable impact on soil urease activity (P<0.01; Figure 6). Compared to the T1 treatment, the T2 treatment markedly enhanced soil urease activity in the 0–10 cm soil layer during several growth stages of maize, with increases of 36.29%, 28.40%, and 26.68%, respectively. In the 10–20 cm soil layer, all treatments enhanced soil urease activity relative to the control treatment. In the 20–30 cm soil layer, the soil urease activity in the T3 and T4 treatments was significantly elevated compared to the Con treatment at each maize development stage.
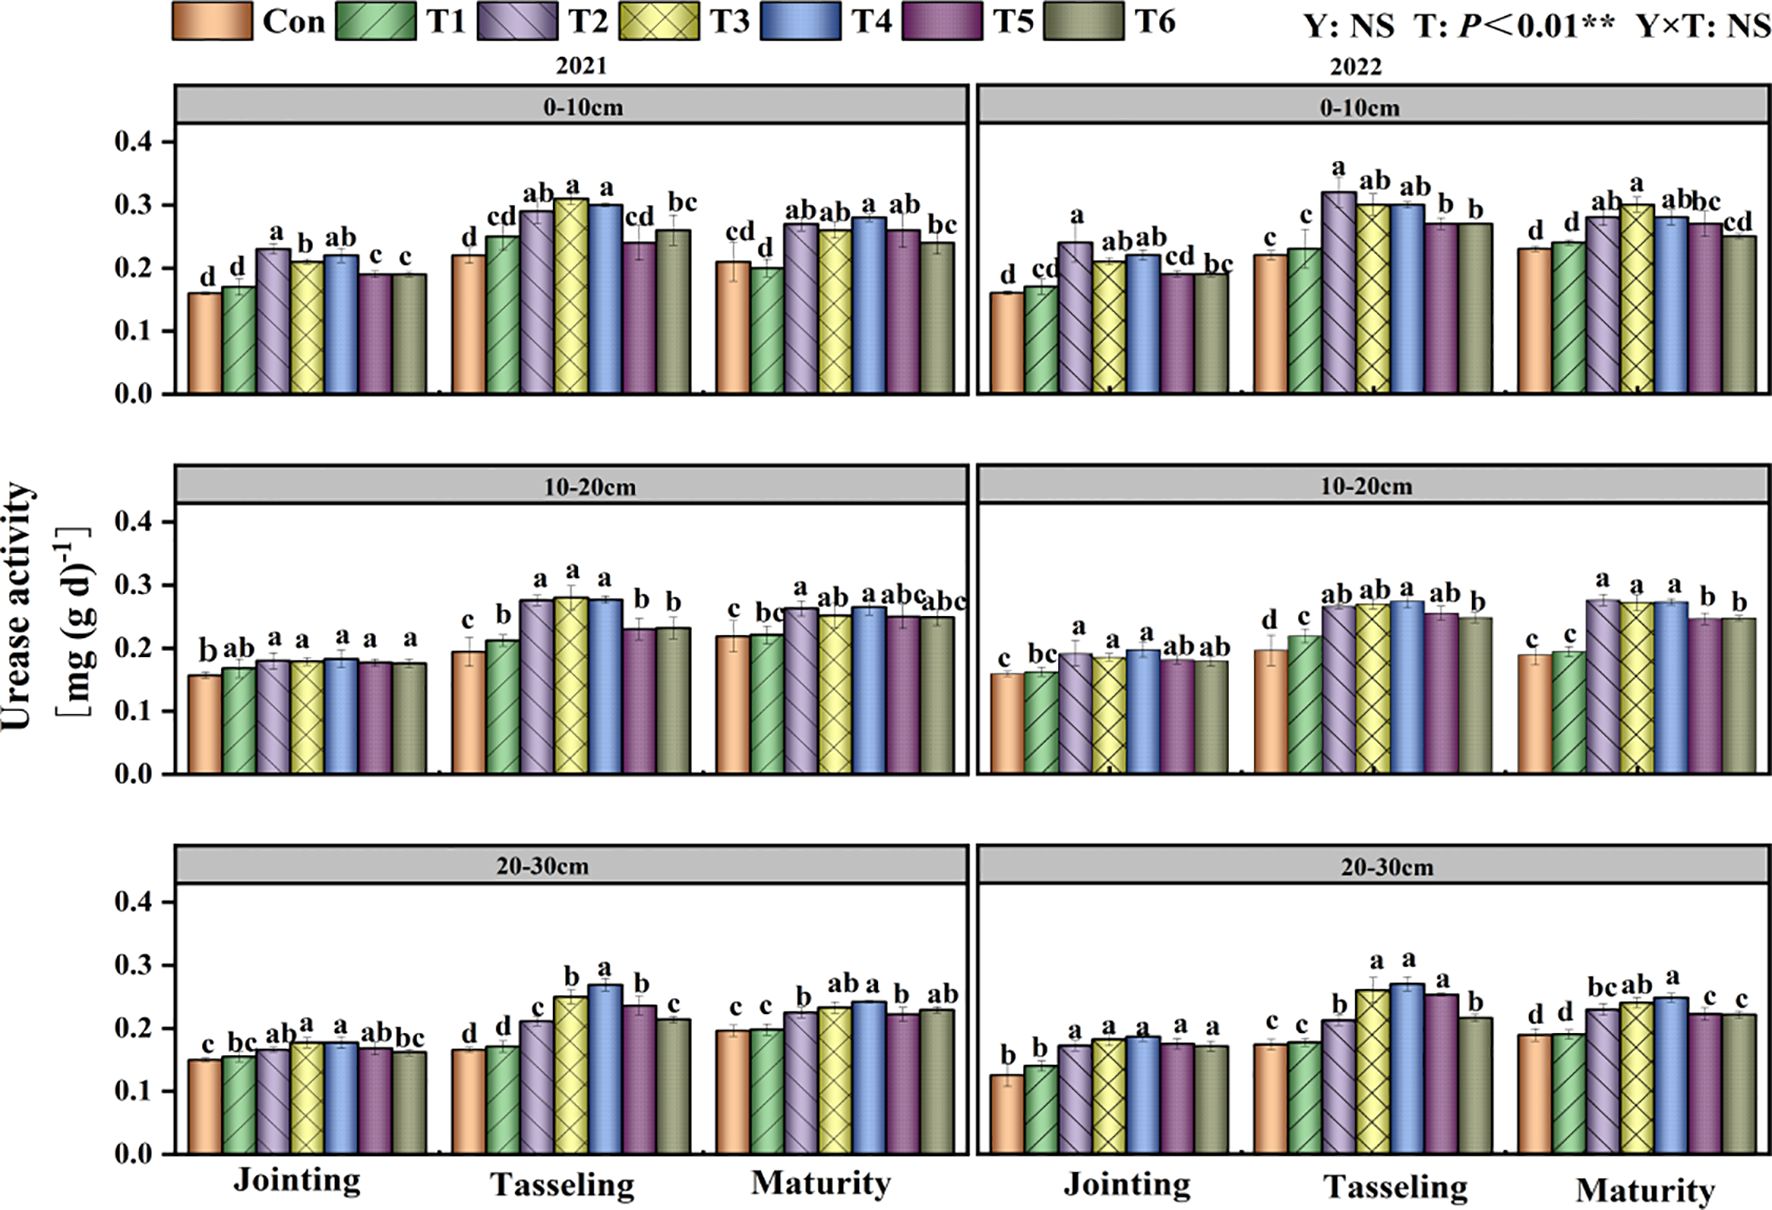
Figure 6. Effects of tillage methods on soil urease activity. Con (rotary ridge tillage), T1 (no-tillage), T2 (raw return + no-tillage), T3 (deep plow straw return + ridge tillage), T4 (deep plow straw return + flat tillage), T5 (raw crushing and return + ridge tillage), and T6 (raw crushing and return + flat tillage).Different alphabets indicate the significance within the same year at 5% level by Duncan' tests. In ANOVA, Y, T represent the variable year, treatment. NS, not significant, (p > 0.05). **, Significant at p < 0.01.
3.10 Soil catalase activity
T had a significant impact on soil catalase activity (P<0.01; Figure 7). In the 0–10 cm soil layer, the T2 treatment exhibited significantly higher catalase activity than the Con treatment from jointing to maturity stages, showing increases of 17.76%, 29.13%, and 26.47%, respectively (Figure 7). In the 10–20 cm soil layer, the catalase activity in the T4 treatment was the greatest at each development stage. In the 20–30 cm soil layer, the T4 treatment significantly enhanced soil catalase activity throughout the maize growth period compared to the Con treatment.
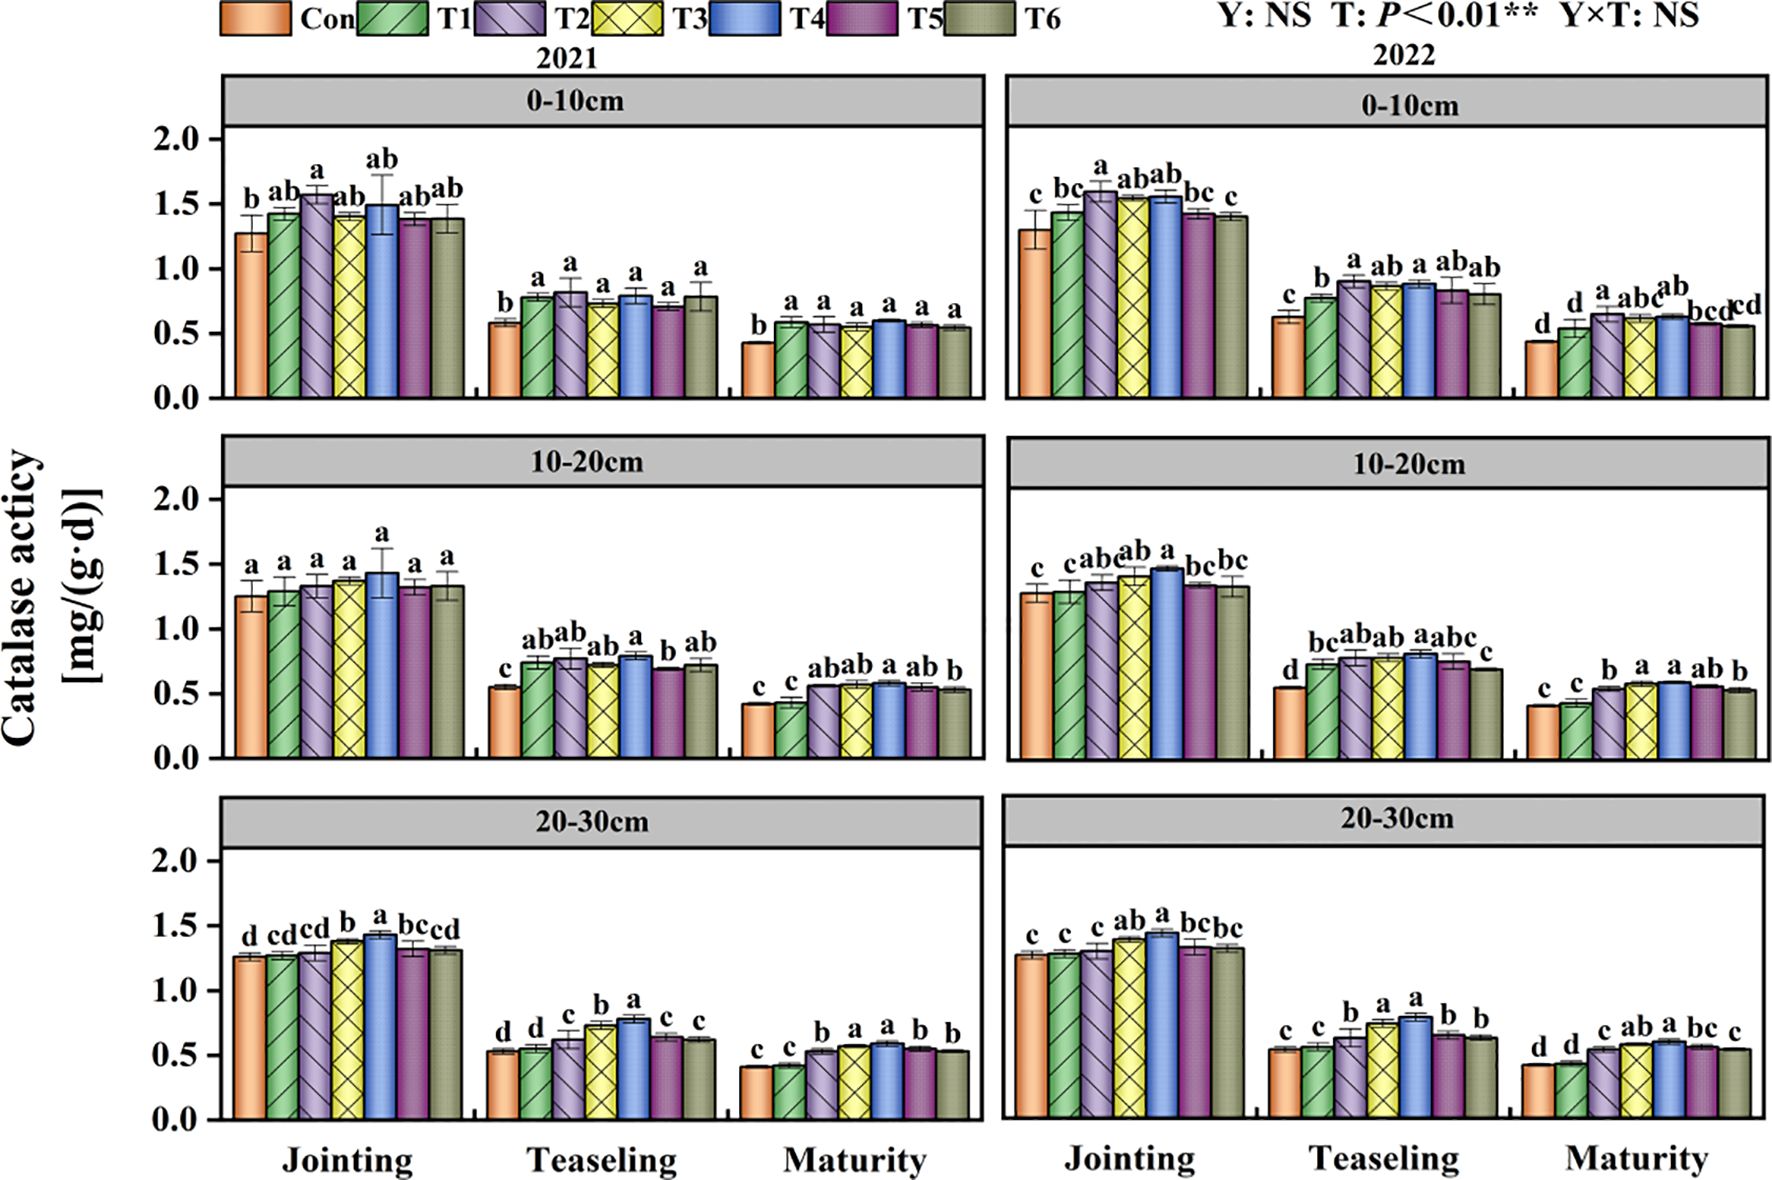
Figure 7. Effects of tillage methods on soil catalase activity. Con (rotary ridge tillage), T1 (no-tillage), T2 (raw return + no-tillage), T3 (deep plow straw return + ridge tillage), T4 (deep plow straw return + flat tillage), T5 (raw crushing and return + ridge tillage), and T6 (raw crushing and return + flat tillage). Different alphabets indicate the significance within the same year at 5% level by Duncan' tests. In ANOVA, Y, T represent the variable year, treatment. NS, not significant, (p > 0.05). **, Significant at p < 0.01.
3.11 Maize yield
The impact of various Y and T on 100-Kernels weight and maize yield was highly significant (P< 0.01), and their interaction significantly influenced maize yield (P<0.05) (Table 5). In 2021, relative to the Con treatment, the T3 and T4 treatments markedly augmented maize ear length by 10.58% and 9.88%, respectively, diminished bald tip length, and greatly improved 100-Kernels weight by 20.96% and 24.51%, respectively. Furthermore, they markedly enhanced the final yield by 6.00% and 10.44%, respectively. In 2022, the T4 treatment attained the greatest yield of 11130.33 kg·ha-1, reflecting substantial increases of 16.81% and 15.69% relative to the Con and T6 treatments, respectively. The enhancement in yield was ascribed to substantial improvements in maize ear length and 100-Kernels weight.
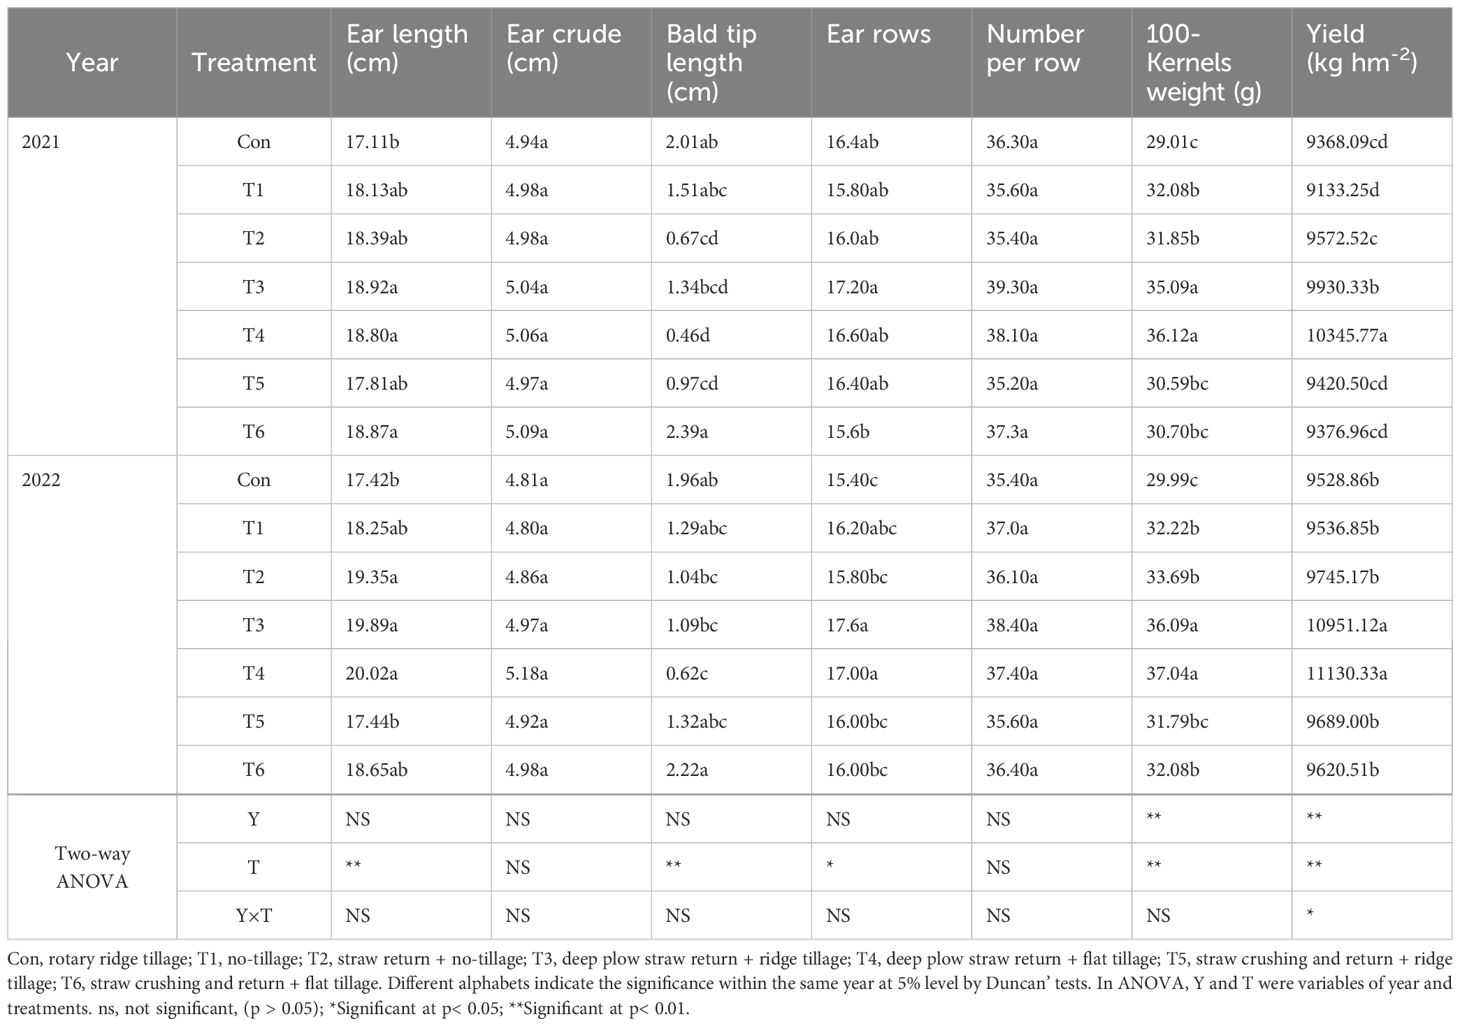
Table 5. Effects of tillage methods on yield components of maize.
3.12 Relationships between the soil indices and maize yield
The correlation analysis revealed that maize yield was significantly positively correlated with soil SOC, N, P, and K (P<0.05) (Figure 8A). Maize yield was significantly positively correlated with 100-Kernels weight and panicle length (P<0.01). The MWD, GMD, and R>0.25 mm were significantly positively correlated with the soil nutrient content, 100-grain weight, and ear length (P<0.01). These findings indicate that improved soil structural stability could increase the soil nutrient content, thus promoting the transport of nutrients from underground to aboveground parts.
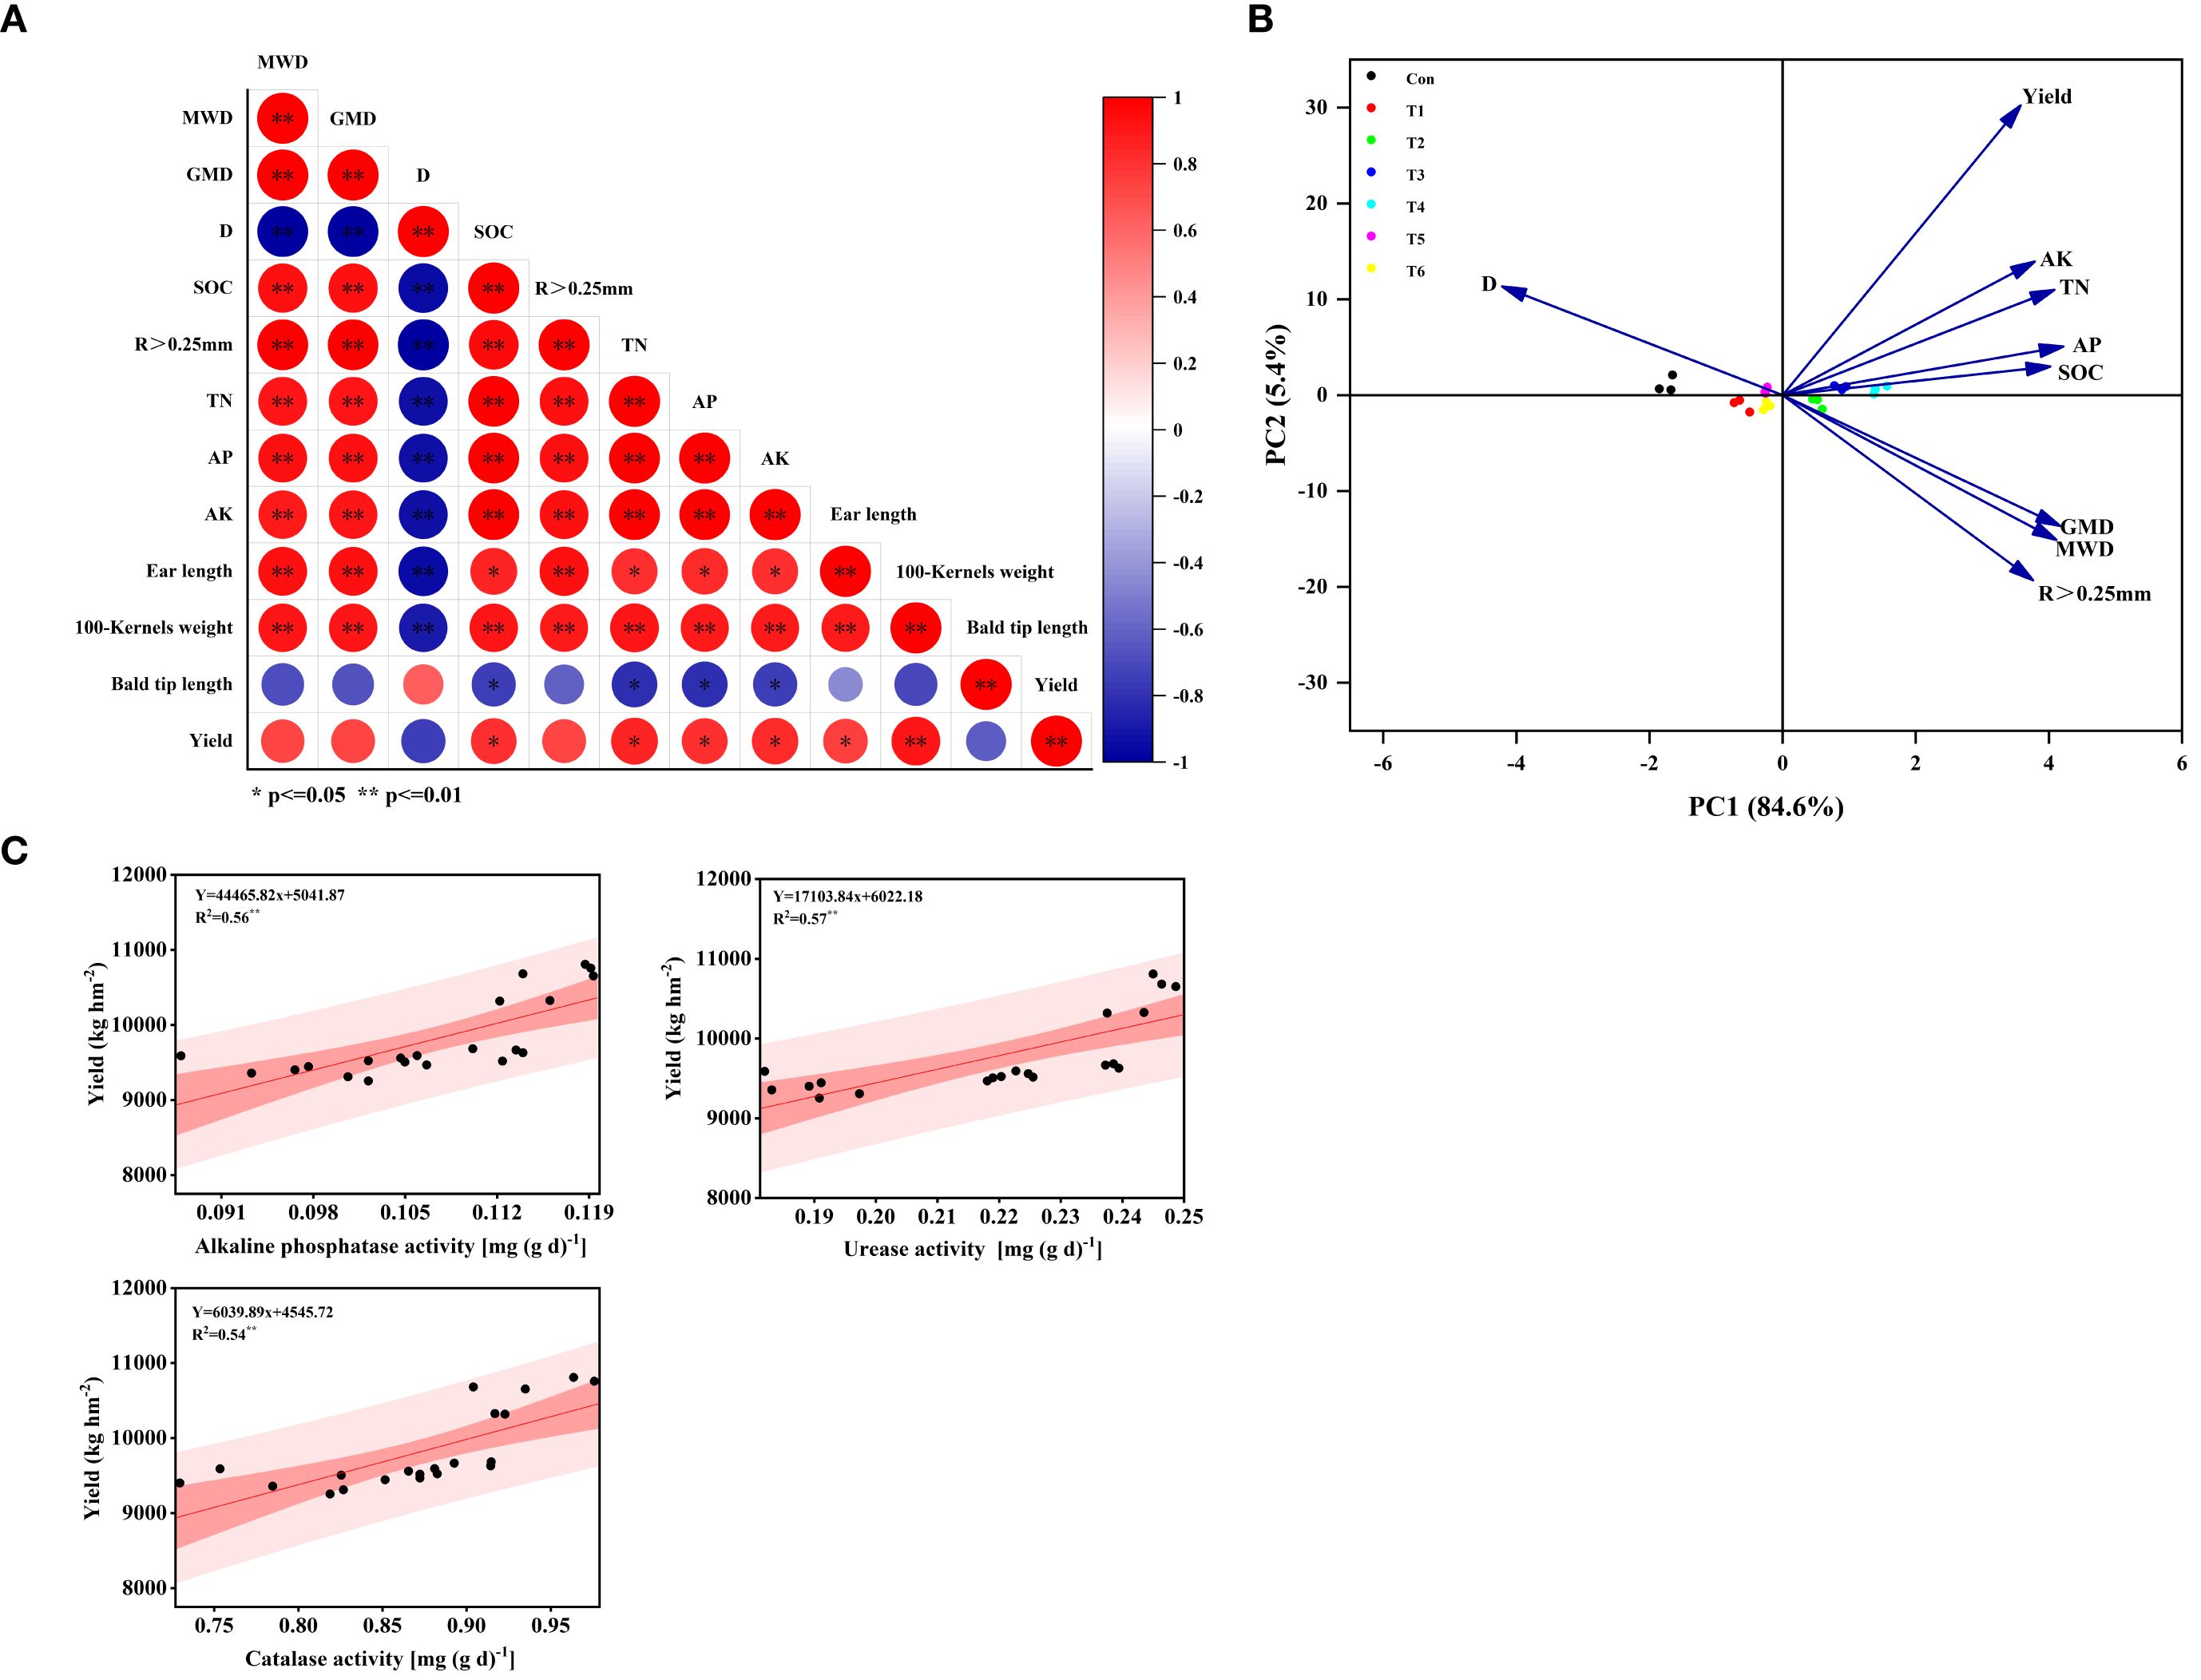
Figure 8. Correlation heatmap (A), principal component analysis (B), and regression analysis (C). Con (rotary ridge tillage), T1 (no-tillage), T2 (raw return + no-tillage), T3 (deep plow straw return + ridge tillage), T4 (deep plow straw return + flat tillage), T5 (raw crushing and return + ridge tillage), and T6 (raw crushing and return + flat tillage). MWD, mean weight diameter; GMD, geometric mean diameter; D, fractal dimension; R>0.25mm, macroaggregate content; TN, total nitrogen; AN, available nitrogen; AP, available phosphorus; AK, available potassium; SOC, soil organic carbon.
The contribution rates of the first principal component PC1 and the second principal component PC2 were 84.6% and 5.4%, respectively (Figure 8B). PC1 was negatively correlated with D and positively correlated with the other indicators. There were significant differences in the T2, T3, T4, and Con treatments along PC1.
There was a significant linear correlation between maize yield and soil alkaline phosphatase activity, urease activity and catalase activity under the different tillage methods (Figure 8C) (R2 = 0.56, P< 0.05). R2 = 0.57, P< 0.05; R2 = 0.54, P< 0.05).
4 Discussion
4.1 Effects of tillage methods on soil water-stable aggregates
The distribution and content of soil aggregates not only influence crop growth and development but also serve as key indicators of soil’s sustainable utilization and erosion resistance capacity (Madari et al., 2004). The conversion between macroaggregates and microaggregates is profoundly affected by tillage methods (Puget et al., 2010). The results demonstrated that all experimental treatments significantly increased the content of water-stable macroaggregates in the 0–10 cm soil layer compared to the Con (Figure 1). In the 20–30 cm soil layer, the T4 treatment exhibited the most pronounced increase in macroaggregate content compared to the Con, with significant enhancements in the mean weight diameter MWD and GMD of aggregates by 12.17%-19.27% and 13.40%-18.37%, respectively (Figure 2). The study results indicated that straw returning greatly increased the content of water-stable macroaggregates and boosted soil structural characteristics (Li and Zhang, 2019). Furthermore, the two-year results demonstrated that the T4 treatment significantly enhanced the content of water-stable aggregates in both 10–20 cm and 20–30 cm soil layers compared to T2 and T6 treatments. This improvement was accompanied by increased MWD and GMD, reduced fractal dimension (Supplementary Figure S2), and elevated organic carbon content in water-stable aggregates (Figure 2). This may be attributed to flat planting, which minimizes soil disturbance, hence mitigating structural damage and enhancing soil permeability (West and Post, 2002). After deep plowing with straw returned to the field, the decomposition of crop stubble in deep soil layers increased SOC content and provided essential cementing materials for deep soil particle accumulation (Eynard et al., 2006). This process promotes the formation of large aggregates (Song et al., 2019) and supplies essential energy for crop growth (Yu et al., 2020). The integration of crop residue with conservation tillage has been shown to regulate soil structure, augment soil carbon and nitrogen sequestration, and improve production and soil nutrient levels (Yang et al., 2019; Yuan et al., 2021).
4.2 Effects of tillage methods on soil nutrients and enzyme activity
Our study confirmed that straw returning increases soil nutrient content and enzyme activity, consistent with findings reported in previous studies (Liu et al., 2025; Peng et al., 2016; Su et al., 2020). The two-year results demonstrated that compared with Con, the T4 treatment increased SOC content by an average of 15.21% (Figure 4), TN content by 26.22% (Table 2), AN content by 16.43% (Table 3), AP by 26.92% (Table 4), and AK by 13.14% (Table 5). The 15.21% increase in SOC content under the T4 treatment was statistically significant and ecologically vital. This increment enhanced the soil’s capacity to sequester carbon, thereby mitigating climate change effects through atmospheric CO2 reduction (Rattan, 2004; West and Post, 2002). Additionally, higher SOC improved soil structure (Bronick and Lal, 2005), increasing water-holding capacity (Hudson, 1994) - critical for sustaining crop growth during dry periods (Lal, 2020) - and reducing erosion risks. As shown in the correlation analysis, soil aggregate content, MWD, and GMD were significantly positively correlated with soil nutrient content (Figures 8A, B). This is attributed to the deep tillage with straw returning to the field improving soil structure. The greater incorporation depth increases the contact area between straw and deep soil, enhancing microbial decomposition. During decomposition, straw significantly increases microbial populations and soil enzyme activity (Figures 5-7), while activating AP, and AK, thereby improving soil fertility (Piazza et al., 2020). Previous studies have indicated that straw returning can improve soil structure and enhance organic matter input in deeper soil layers (Liu et al., 2021; Zhang et al., 2014). The enhanced soil structure, along with ample organic matter, establishes advantageous nutritional conditions for microbial activity, hence facilitating elevated soil enzyme activity (Ji et al., 2014; Jin et al., 2009).
4.3 Correlation analysis of maize yield with soil nutrient levels and enzyme activities
Our findings indicated that between 2021 and 2022, the T4 treatment yielded the maximum maize production (Table 5), exhibiting a substantial increase of 10.44% - 16.81% relative to Con. This superior yield performance was primarily attributed to significant increases in both ear length (9.88% - 14.93%) and 100-Kernels weight (23.51% - 24.51%). Correlation and principal component analyses demonstrated strong positive associations between maize yield and both soil aggregate structure and nutrient content (Figures 8A, B). Regression analysis revealed a substantial linear correlation between maize yield and soil enzyme activity (Figure 8C). Consequently, we ascertain that the integration of tillage systems with straw incorporation enhances the structure of soil water-stable aggregates (Kabiri et al., 2015). Enhanced soil structural stability increases the accumulation of nitrogen, phosphate, and potassium nutrients (Guo et al., 2022), enhances microbial activity (Zheng et al., 2022), and rises enzyme activity (Costa et al., 2024). These enhancements promote nutrient transfer from leaves to grains (Tang et al., 2018), augmenting both grain nutrient content and 100-Kernels weight, celevating maize output. These results demonstrated that deep plowing straw returning + flat tillage enhanced soil health and increased maize yield, supporting sustainable agriculture in the black soil region. This approach provided a viable strategy to balance productivity with long-term soil fertility - a key principle for preserving this vulnerable ecosystem. For farmers, deep plowing straw returning+ flat tillage boosted yields and income while maintaining soil quality. For policymakers, promoting this practice through technical training and incentives facilitated sustainable black soil management, safeguarding future agricultural productivity.
4.4 Limitations and future research
This study was conducted over a two-year period. To further validate these findings, the research team plans to continue long-term monitoring in the region. The present investigation was confined to a singular agroecological zone. Our team did not investigate ecological areas with differing climatic conditions. To thoroughly assess the impact of farming practices in various environments on maize production, soil structure, and fertility. Our team plans to examine the response effects of diverse tillage techniques across various ecological zones in the future, thereby offering significant theoretical insights for the progression of sustainable agriculture and field management in this area.
5 Conclusion
This two-year study illustrates that deep plowing straw returning + flat tillage markedly enhances soil structure in the semi-arid districts of western Heilongjiang Province, thereby establishing it as an efficacious tillage management strategy. The results indicated that, in comparison to conventional tillage, this tillage method enhanced soil aggregate structure, elevated soil organic carbon, total nitrogen, available nutrients, and enzyme activities, increased the 100-Kernels weight of maize, and ultimately augmented maize yield by 10.44% to 16.81%. These findings provide valuable practical guidance for local policymakers and farmers in the study region.
Data availability statement
The original contributions presented in the study are included in the article/Supplementary Material. Further inquiries can be directed to the corresponding authors.
Author contributions
XQ: Writing – original draft, Conceptualization, Data curation. WH: Writing – original draft. YL: Formal Analysis, Writing – review & editing. JX: Formal Analysis, Writing – review & editing. FH: Methodology, Writing – review & editing. YW: Writing – review & editing. JF: Funding acquisition, Investigation, Writing – review & editing. KY: Funding acquisition, Resources, Supervision, Writing – review & editing.
Funding
The author(s) declare financial support was received for the research and/or publication of this article. This research was financially supported by grants from by a project funded by Nature Scientific Foundation of Heilongjiang Province (YQ2024C043) and the Strategic Priority Research Program of the Chinese Academy of Science (XDA28130103).
Conflict of interest
The authors declare that the research was conducted in the absence of any commercial or financial relationships that could be construed as a potential conflict of interest.
Generative AI statement
The author(s) declare that no Generative AI was used in the creation of this manuscript.
Publisher’s note
All claims expressed in this article are solely those of the authors and do not necessarily represent those of their affiliated organizations, or those of the publisher, the editors and the reviewers. Any product that may be evaluated in this article, or claim that may be made by its manufacturer, is not guaranteed or endorsed by the publisher.
Supplementary material
The Supplementary Material for this article can be found online at: https://www.frontiersin.org/articles/10.3389/fpls.2025.1626882/full#supplementary-material
References
Afshar, R., Cabot, P., Ippolito, J. A., Dekamin, M., Reed, B., Doyle, H., et al. (2022). Corn productivity and soil characteristic alterations following transition from conventional to conservation tillage. Soil Tillage Res. 220, 105351. doi: 10.1016/j.still.2022.105351
Akhtar, K., Wang, W., Khan, A., Ren, G., Zaheer, S., Sial, T., et al. (2018). Straw mulching with fertilizer nitrogen: An approach for improving crop yield, soil nutrients and enzyme activities. Soil Use Manag. 35, 526–535. doi: 10.1111/sum.12478
Al-Kaisi, M., Douelle, A., and Kwaw-Mensah, D. (2014). Soil microaggregate and macroaggregate decay over time and soil carbon change as influenced by different tillage systems. J. Soil Water Conserv. 69, 574–580. doi: 10.2489/jswc.69.6.574
Bronick, C. J. and Lal, R. (2005). Soil structure and management: a review. Geoderma 124, 3–22. doi: 10.1016/j.geoderma.2004.03.005
Chen, W., Yuan, W., Wang, J., Wang, Z., Zhou, Z., and Liu, S. (2022). No-tillage combined with appropriate amount of straw returning increased soil biochemical properties. Sustainability 14, 4875. doi: 10.3390/su14094875
Choudhury, S., Srivastava, S., Singh, R., Chaudhari, S., and Sarkar, D. (2014). Tillage and residue management effects on soil aggregation, organic carbon dynamics and yield attribute in rice–wheat cropping system under reclaimed sodic soil. Soil Tillage Res. 136, 76–83. doi: 10.1016/j.still.2013.10.001
Costa, R., Araujo, E., Silva, D., Rocha, S., Bonifacio, A., Sousa, R., et al. (2024). Seasonal responses of soil microbial biomass C and enzymatic activity comparing no-tillage and integrated crop-livestock systems. Eur. J. Soil Biol. 121, 103628. doi: 10.1016/j.ejsobi.2024.103628
Elliott, E. T. (1986). Aggregate structure and carbon, nitrogen, and phosphorus in native and cultivated soils1. Soil Sci. Soc. America J. 50, 627. doi: 10.2136/sssaj1986.03615995005000030017x
Eynard, A., Schumacher, T. E., Lindstrom, M. J., Malo, D. D., and Kohl, R. A. (2006). Effects of aggregate structure and organic C on wettability of Ustolls. Soil Tillage Res. 88, 205–216. doi: 10.1016/j.still.2005.06.002
Guo, X., Wang, H., Yu, Q., Ahmad, N., Li, J., Wang, R., et al. (2022). Subsoiling and plowing rotation increase soil C and N storage and crop yield on a semiarid Loess Plateau. Soil Tillage Res. 221, 105413. doi: 10.1016/j.still.2022.105413
Haynes, R. and Swift, R. (1990). Stability of soil aggregates in relation to organic constituents and soil water content. J. Soil Sci. 41, 73–83. doi: 10.1111/j.1365-2389.1990.tb00046.x
Huang, Y., Ren, W., Wang, L., Hui, D., Grove, J. H., Yang, X., et al. (2018). Greenhouse gas emissions and crop yield in no-tillage systems: A meta-analysis. Agric. Ecosyst. Environ. 268, 144–153. doi: 10.1016/j.agee.2018.09.002
Hudson, B. D. (1994). Soil organic matter and available water capacity. J. Soil Water Conserv. 49, 189–194. doi: 10.1080/00224561.1994.12456850
Ji, B., Hu, H., Zhao, Y., Mu, X., Liu, K., and Li, C. (2014). Effects of deep tillage and straw returning on soil microorganism and enzyme activities. Thescientific World J. 2014, 451493. doi: 10.1155/2014/451493
Ji, B., Zhao, Y., Mu, X., Liu, K., and Li, C. (2013). Effects of tillage on soil physical properties and root growth of maize in loam and clay in central China. Plant Soil Environ. 59, 295–302. doi: 10.17221/57/2013-PSE
Jin, K., Sleutel, S., Buchan, D., Neve, S. D., Cai, D. X., Gabriels, D., et al. (2009). Changes of soil enzyme activities under different tillage practices in the Chinese Loess Plateau. Soil Tillage Res. 104, 115–120. doi: 10.1016/j.still.2009.02.004
Kabiri, V., Raiesi, F., and Ghazavi, M. (2015). Six years of different tillage systems affected aggregate-associated SOM in a semi-arid loam soil from Central Iran. Soil Tillage Res. 154, 114–125. doi: 10.1016/j.still.2015.06.019
Lal, R. (2020). Soil organic matter and water retention. Agron. J. 112, 3265–3277. doi: 10.1002/agj2.20282
Li, S. H. and Zhang, Q. P. (2019). Residue retention and minimum tillage improve physical environment of the soil in croplands: A global meta-analysis. Soil Tillage Res. 194, 104292. doi: 10.1016/j.still.2019.06.009
Liang, W., Blennow, A., Herburger, K., Zhong, Y., and Liao, Y. (2021). Effects of supplemental irrigation on winter wheat starch structure and properties under ridge-furrow tillage and flat tillage. Carbohydr. Polymers 270, 118310. doi: 10.1016/j.carbpol.2021.118310
Liu, N., Li, Y. Y., Cong, P., Wang, J., Guo, W., Pang, H. C., et al. (2021). Depth of straw incorporation significantly alters crop yield, soil organic carbon and total nitrogen in the North China Plain. Soil Tillage Res. 205, 104772. doi: 10.1016/j.still.2020.104772
Liu, X., Peng, C., Zhang, W., Li, S., An, T., Xu, Y., et al. (2022). Subsoiling tillage with straw incorporation improves soil microbial community characteristics in the whole cultivated layers: A one-year study. Soil Tillage Res. 215, 105188. doi: 10.1016/j.still.2021.105188
Liu, C., Si, B., Zhao, Y., Wu, Z., Lu, X., Chen, X., et al. (2025). Drivers of soil quality and maize yield under long-term tillage and straw incorporation in Mollisols. Soil Tillage Res. 246, 106360. doi: 10.1016/j.still.2024.106360
Lv, L., Gao, Z., Liao, K., Zhu, Q., and Zhu, J. (2023). Impact of conservation tillage on the distribution of soil nutrients with depth. Soil Tillage Res. 225, 105527. doi: 10.1016/j.still.2022.105527
Madari, B., MaChado, P. L. O. A., Torres, E., Andrade, A. G., and Valencia, L. I. O. (2004). No tillage and crop rotation effects on soil aggregation and organic carbon in a Rhodic Ferralsol from southern Brazil. Soil Tillage Res. 80, 185–200. doi: 10.1016/j.still.2004.03.006
Mehlich, A. (2008). Mehlich 3 soil test extractant: A modification of Mehlich 2 extractant. Commun. Soil Sci. Plant Anal. 15, 1409–1416. doi: 10.1080/00103628409367568
Mulvaney, R. L. and Khan, S. A. (2001). Diffusion methods to determine different forms of nitrogen in soil hydrolysates. Soil Sci. Soc. America J. 65, 1284–1292. doi: 10.2136/sssaj2001.6541284x
Nelson, D. W. and Sommers, L. E. (1980). Total nitrogen analysis of soil and plant tissues. J. Assoc. Off. Anal. Chem. (USA) 63, 770–778. doi: 10.1093/jaoac/63.4.770
Peng, Z., Chen, X., Ting, W., Yang, Z., Jia, Z., Yang, B., et al. (2016). Effects of straw incorporation on the soil nutrient contents, enzyme activities, and crop yield in a semiarid region of China. SSoil Tillage Res. 160, 65–72. doi: 10.1016/j.still.2016.02.006
Piazza, G., Pellegrino, E., Moscatelli, M., and Ercoli, L. (2020). Long-term conservation tillage and nitrogen fertilization effects on soil aggregate distribution, nutrient stocks and enzymatic activities in bulk soil and occluded microaggregates. Soil Tillage Res. 196, 104482. doi: 10.1016/j.still.2019.104482
Puget, P., Chenu, C., and Balesdent, J. (2010). Dynamics of soil organic matter associated with particle-size fractions of water-stable aggregates. Eur. J. Soil Sci. 51, 595–605. doi: 10.1046j.1365-2389.2000.00353.x
Rasiah, V., Kay, B., and Perfect, E. (1993). New mass-based model for estimating fractal dimensions of soil aggregates. Soil Sci. Soc. America J. 57, 891–895. doi: 10.2136/sssaj1993.03615995005700040002x
Rattan, L. (2004). Soil carbon sequestration impacts on global climate change and food security. Science 304, 1623–1627. doi: 10.1126/science.1097396
Ren, C., Di, K., Wu, J., Zhao, F., Yang, G., Han, X., et al. (2016). Temporal variation in soil enzyme activities after afforestation in the Loess Plateau, China. Geoderma 282, 103–111. doi: 10.1016/j.geoderma.2016.07.018
Song, K., Zheng, X., Lv, W., Qin, Q., Sun, L., Zhang, H., et al. (2019). Effects of tillage and straw return on water-stable aggregates, carbon stabilization and crop yield in an estuarine alluvial soil. Sci. Rep. 9, 1–11. doi: 10.1038/s41598-019-40908-9
Su, Y., Yu, M., Xi, H., Lv, J., and Shen, A. (2020). Soil microbial community shifts with long-term of different straw return in wheat-corn rotation system. Sci. Rep. 10, 6360. doi: 10.1038/s41598-020-63409-6
Tang, H., Xiao, X., Tang, W., Li, C., Wang, K., and Cheng, K. (2018). Effects of covering paddy field by crop straw in winter on nutrition accumulation and translocation of rice plant. J. Agric. Sci. Technol. 20, 63–73. doi: 10.13304/j.nykjdb.2017.0566
Truog, E. (1930). The determination of the readily available phosphorus of soils. Agron. J. 22, 874–882. doi: 10.2134/agronj1930.00021962002200100008x
West, T. O. and Post, W. M. (2002). Soil organic carbon sequestration rates by tillage and crop rotation. Soil Sci. Soc. America J. 66, 1930–1946. doi: 10.2136/sssaj2002.1930
Yang, F., He, B., Zhang, L., Zhang, G., and Gao, Y. (2019). An approach to improve soil quality: a case study of straw incorporation with a decomposer under full film-mulched ridge-furrow tillage on the semiarid Loess Plateau, China. J. Soil Sci. Plant Nutr. 20, 125–138. doi: 10.1007/s42729-019-00106-y
Yu, Q., Wang, H., Wen, P., Wang, S., and Wang, X. (2020). A suitable rotational conservation tillage system ameliorates soil physical properties and wheat yield: An 11-year in-situ study in a semi-arid agroecosystem. Soil Tillage Res. 199, 104600. doi: 10.1016/j.still.2020.104600
Yuan, G., Huan, W., Song, H., Lu, D., and Zhou, J. (2021). Effects of straw incorporation and potassium fertilizer on crop yields, soil organic carbon, and active carbon in the rice–wheat system. Soil Tillage Res. 209, 104958. doi: 10.1016/j.still.2021.104958
Zhang, P., Wei, T., Jia, Z. K., Han, Q. F., Ren, X. L., and Li, Y. P. (2014). Effects of straw incorporation on soil organic matter and soil water-stable aggregates content in semiarid regions of northwest China. PloS One 9, e92839. doi: 10.1371/journal.pone.0092839
Zhao, Z. H., Geng, P., Wang, X., Li, X., Cai, P., Zhan, X., et al. (2023). Improvement of active organic carbon distribution and soil quality with the combination of deep tillage and no-tillage straw returning mode. Agronomy 13, 2398. doi: 10.3390/agronomy13092398
Zhao, X., Yuan, G., Wang, H., Lu, D., and Chen, X. (2019). Effects of full straw incorporation on soil fertility and crop yield in rice-wheat rotation for silty clay loamy cropland. Agronomy 9, 133. doi: 10.3390/agronomy9030133
Keywords: maize, tillage methods, soil nutrients, aggregate, production
Citation: Qi X, Huang W, Li Y, Xie J, Huang F, Wang Y, Fu J and Yang K (2025) Optimize the farming system to improve the physical and chemical properties of soil in Northeast China, thereby increasing maize yield. Front. Plant Sci. 16:1626882. doi: 10.3389/fpls.2025.1626882
Received: 12 May 2025; Accepted: 17 July 2025;
Published: 11 August 2025.
Edited by:
Kailou Liu, Jiangxi Institute of Red Soil, ChinaCopyright © 2025 Qi, Huang, Li, Xie, Huang, Wang, Fu and Yang. This is an open-access article distributed under the terms of the Creative Commons Attribution License (CC BY). The use, distribution or reproduction in other forums is permitted, provided the original author(s) and the copyright owner(s) are credited and that the original publication in this journal is cited, in accordance with accepted academic practice. No use, distribution or reproduction is permitted which does not comply with these terms.
*Correspondence: Kejun Yang, YnluZHlrakAxNjMuY29t; Jian Fu, ZnVqaWFuX2hsQDE2My5jb20=
†These authors have contributed equally to this work and share first authorship