 Wanwen Yu
 Minyue Cai
 Chenxi You1
 Huimin Liu
- 1National Key Laboratory for Development and Utilization of Forest Food Resources, Co-Innovation Center for Sustainable Forestry in Southern China, Nanjing Forestry University, Nanjing, China
- 2State Key Laboratory of Tree Genetics and Breeding, Research Institute of Non-Timber Forestry, Chinese Academy of Forestry, Zhengzhou, China
Introduction: Shikimic acid, as a critical precursor for oseltamivir synthesis in antiviral pharmaceuticals, faces escalating global demand. Although Ginkgo biloba leaves have emerged as a promising natural source of shikimic acid owing to their exceptional content of this valuable compound and substantial biomass production capacity, the molecular mechanisms underlying its biosynthesis and downstream metabolic regulation in G. biloba leaves remain largely unknown.
Methods: Here, the concentration of shikimic acid in 33 clones were assessed, and 1# (referred as HS) had the highest level. The shikimic acid content in HS was 119% higher than that in 24# (referred as LS), which possessed the lowest shikimic acid level. Concurrently, we analyzed downstream metabolites including flavonoids, phenylalanine, tryptophan and tyrosine, along with transcriptomic and metabolomic profiles in HS and LS.
Results: The concentrations of flavonoids, phenylalanine, tryptophan and tyrosine in HS were markedly lower than those in LS. Principal component analysis (PCA) and partial least squares discriminant analysis (PLS-DA) analyses revealed clear differences in metabolites between HS and LS. Numerous metabolites and genes related to biosynthesis and downstream metabolic partitioning of shikimic acid were significantly differentially regulated. For instance, the transcript levels of malate dehydrogenase (MDH) and ribose-5-phosphate isomerase (RPI), that are involved in shikimic acid biosynthesis, were more upregulated in HS compared to LS. The abundances of tyrosine, tryptophan, luteolin and dihydromyricetin and the mRNA levels of chorismate synthase (CS), chalcone synthase (CHS), chalcone isomerase (CHI) and flavanone-3b-hydroxylase (F3H), that are implicated in downstream metabolism of shikimic acid were downregulated in HS compared to LS. Additionally, the abundances of abscisic acid and auxin in HS were lower than those in LS. Through association analysis, 27 metabolites, 33 structural genes and 28 transcription factors, such as ERFs, C2H2s and MYBs that play roles in shikimic acid accumulation were identified.
Conclusion: These results suggest that metabolites and structural genes participating in biosynthesis and downstream metabolism of shikimic acids, and phytohormones and transcript factors play essential roles in shikimic acid accumulation in G. biloba leaves.
1 Introduction
Shikimic acid (3, 4, 5-trihydroxy cyclohexene carboxylic acid), as a natural occurring hydroaromatic compound with chiral characteristics (Quan et al., 2012), has antioxidant, anti-inflammatory and antiviral activities (Marchiosi et al., 2019; Gandhi et al., 2023). Shikimic acid is generally utilized as an essential precursor for synthesizing Oseltamivir, which is a frontline antiviral medicine critical for prophylaxis and treatment of influenza A/B viruses (Kancharla et al., 2009; Tripathi et al., 2014). Beyond pharmaceutical applications, shikimic acid and its derivatives have substantial agricultural utility, functioning as plant growth enhancers (Al-Amri, 2013), eco-friendly herbicides and antimicrobial agents (Díaz-Quiroz et al., 2018). Despite recent advances in the processes of chemical and microbial synthesis as viable alternatives (Rawat et al., 2013; Bilal et al., 2018; Candeias et al., 2018), plant-derived shikimic acid continues to dominate industrial-scale antiviral production due to its inherent non-toxic profile (Marchiosi et al., 2019).
Shikimic acid serves as a central metabolic node within the shikimate pathway, which is a universal biosynthetic route responsible for the synthesis of flavonoids and amino acids (Kougan et al., 2013). The study about accumulation of shikimic acid has been mainly performed in bacteria, involving multiple enzymatic reactions (Wu et al., 2022; Shende et al., 2024). Briefly, the initial reaction of the shikimate synthetic pathway occurs by the formation of 3-deoxy-D-arabinoheptose-7-phosphate (DAHP) via condensation of phosphoenolpyruvate (PEP) and erythrose-4-phosphate (E4P) (Herrmann and Weaver, 1999). Subsequently, 3-dehydroquinate (DHQ) synthase catalyzes the conversion of DAHP into DHQ, which is further dehydrated by DHQ dehydrase into 3-dehydroshikimate (DHS) (Maeda and Dudareva, 2012). NADPH-dependent shikimate dehydrogenase then catalyzes the reduction of DHS to yield shikimic acid. Thereafter, shikimate kinase (SK) catalyzes the production of shikimate-3-phosphate (S3P) (Tzin et al., 2012). S3P is subsequently converted to 5-enolpyruvylshikimate-3-phosphate (EPSP) under the catalyzes of EPSP synthase (Wang et al., 2017; Gandhi et al., 2023). Chorismate synthase (CS) ultimately transforms EPSP into chorismate, which is a pivotal branch-point metabolite that feeds into the biosynthesis of aromatic amino acids (phenylalanine, tryptophan and tyrosine) and other secondary metabolites (Gu et al., 2017). Despite its pharmacological significance, critical knowledge gaps persist regarding the regulatory mechanisms governing shikimic acid accumulation in plants.
The current industrial production of shikimic acid relies on extraction from mature fruits of Chinese star anise (Illicium verum). Thus, the fruiting season and production of mature fruits limits the output of shikimic acid. Recent phytochemical analysis by Kulić et al. (2022) found that the concentration of shikimic acid in Ginkgo biloba leaves is about 20 mg g-1, which is lower than the 66 mg g-1 reported in mature fruits of Chinese star anise (Ramazani et al., 2021). However, the annual biomass yield of G. biloba leaves is much higher than mature fruits of Chinese star anise. Moreover, given their renewable nature and rapid harvest cycles, G. biloba leaves present a promising alternative source for this pharmacologically significant precursor compound. Other plant species, such as sweetgum (Liquidambar styraciflua) and Pinus elliottii, have also been reported to produce shikimic acid (Martin et al., 2010; Xie et al., 2012). However, sweetgum-derived shikimic acid is extracted from non-renewable bark and wood tissues, while P. elliottii needles contain lower concentrations compared to G. biloba leaves (Xie et al., 2012). Although microbial synthesis using genetically engineered Escherichia coli has become an important alternative approach (Bilal et al., 2018), this method often relies on costly substrates. In contrast, G. biloba is widely cultivated and generates substantial leaf biomass annually, making it an ecologically sustainable and economically feasible plant-based source.
As a gymnosperm species belonging to Ginkgopsida, G. biloba L. is extensively cultivated in China, Korea, and Japan (Zhao et al., 2010; Crane, 2018). Its leaves extracts have various health benefits, such as anti-inflammatory, neuroprotective and anti-aging properties (Yu et al., 2022). Additionally, in order to preserve old books, G. biloba leaves are used to be inserted among the pages, demonstrating G. biloba leaves play an important role in traditional Chinese culture. Nevertheless, despite generating substantial biomass in Chinese plantations, current utilization remains insufficient, and only 1.5–2.9% of the leaf biomass ends up with a valuable product (Kulić et al., 2023). The extraction of shikimic acid from G. biloba leaves not only holds significant economic value but also promotes sustainable resource management. Noticeably, our preliminary experiments have shown that the content of shikimic acid varies greatly among different G. biloba clones. Similarly, different ginkgo clones also exhibit contrasting flavonoid concentration in the leaves. For instance, Yao et al. (2012) found that the flavonol glycoside content in Anjie (a ginkgo clone) was 19.19 times higher than that in TaiXing (a ginkgo clone), which possessed the lowest level. It is of great significance to screen G. biloba clones with great shikimic acid concentration, and further analyze the molecular mechanism underlying shikimic acid accumulation in G. biloba leaves.
Here, the leaves from 33 G. biloba clones were collected, respectively, and the content of shikimic acid was quantified. Metabolome and transcriptome were employed to detect the abundances of metabolites and expression levels of genes in the leaves of G. biloba. The aims of this study were to (i) identify G. biloba clones with high shikimic acid content, (ii) identify metabolites, structural genes and transcript factors related to shikimic acid accumulation in G. biloba leaves.
2 Materials and methods
2.1 Plant materials and harvest
From the G. biloba nursery in Nanjing Forestry University (32° 04’N, 118° 48’E, Nanjing, China), 33 clones (namely 1#-33#, 18-year-old) with leaf utilization potential were selected. These clones were originated from Pizhou, Jiangsu Province, and were selected in 2005 based on seedling height and ground diameter. Afterward, these clones were transplanted into a common garden in Nanjing forestry university with uniform spacing (4m × 4m) to minimize environmental variation. In mid-April, the healthy functional leaves were harvested from every clone and immediately wrapped in tinfoil and frozen in liquid nitrogen. Leaf samples were ground into fine powder with a mortar and a pestle in liquid nitrogen. The fine-powdered samples were then stored at an ultralow temperature refrigerator for further analyses. For each clone, six branches that exhibited similar growth status and exposed to sunlight were selected. For physiological and metabolomic analyses, leaves from each branch were collected separately to form an individual sample, resulting in six biological replicates for each clone. For the transcriptomic analysis, equal amounts of leaf samples from every two branches were pooled together to form a mixed sample. Consequently, three mixed samples were obtained for each clone.
2.2 Determination of shikimic acid
The concentration of shikimic acid was measured as described by Zelaya et al. (2011) and Joubert et al. (2023) with minor modifications. Briefly, ca. 50 mg oven-dried fine powders were mixed with 0.25 mol L-1 hydrochloric acid for 30 min. After centrifuged (6000 g) for 10 min, the supernatant was collected and diluted three times. The reaction was initiated by adding 1% (w/v) periodate solution. Three hours later, the reaction was stopped by adding a solution containing 1 mol L-1 NaOH and 1mol L-1 glycinate. Shikimic acid concentration was measured spectrophotometrically at 380 nm.
2.3 Determination of phenylalanine, tryptophan and tyrosine
Phenylalanine concentration was assayed using a phenylalanine content kit (Nanjing Jiancheng Bioengineering Research Institute Co., Nanjing, China) following the kit’s instructions.
Tryptophan and tyrosine were assayed as described previously (Park et al., 2012; Botella et al., 2023) with minor modifications. Briefly, frozen powder was homogenized in 100 µL extraction solution containing 50% ethanol and 0.1 mol L-1 HCl. The mixture was centrifuged (13800 g, 4°C, 20 min), and the supernatant was filtered through an organic membrane (0.22 μm). The filtered supernatant was used to determine tryptophan and tyrosine with liquid chromatography-mass spectrometry (LC/MS, LTQ-XL, Thermo Scientific, Waltham, MA, USA).
2.4 Determination of flavonoid
The concentration of flavonoid in the leaves were analyzed as described previously (An et al., 2024; Cui et al., 2025). Briefly, oven-dried fine powder (ca. 200 mg) was packed with filter paper and washed with 100 mL petroleum ether in Soxhlet extraction to remove impurities for 8 h. Afterward, the purified packed fine powder was extracted in 10 mL methanol at 60 °C for 30 min, and this procedure was repeated twice. The extraction was transferred into a new volumetric flask, ensuring the final volume to 20 mL. The extraction was homogenized with 5% sodium nitrite, 10% aluminum nitrate, and 1 mol L-1 NaOH for 5, 6 and 10 min, respectively. The absorbance of the mixture was determined spectrophotometrically at 510 nm.
2.5 Metabolite profiling analysis
Since shikimic acid content in 1# (referred as HS) was the highest while that in 24# (referred as LS) was the lowest (Figure 1a), 1# and 24# were selected to explore metabolomic analysis of shikimic acid synthesis and downstream metabolism. The clones of No.1 (HS) and No.24 (LS) originate from distinct individual trees and are not derived from mutated shoots of any single tree. Nontargeted metabolites in the leaves were analyzed based on the method described previously (Yu et al., 2022; Hong et al., 2023). Briefly, fresh fine powders (ca. 100 mg) were extracted with 500 μL of 80% methanol and were incubated on ice for 5 min. The mixture was centrifuged (15000 g, 4°C) for 20 min. The collected supernatant was diluted with mass spectrometry water until methanol content was 53%. Then, the samples were transferred to fresh tubes and centrifuged (15000 g, 4°C) for 20 min. Finally, the supernatant was collected and injected into a Vanquish UHPLC system (Thermo Fisher Scientific, Waltham, MA, USA) coupled with an Orbitrap Q ExactiveTM HF-X mass spectrometer (Thermo Fisher Scientific) for liquid chromatography tandem mass spectrometry (LC-MS/MS) analysis.
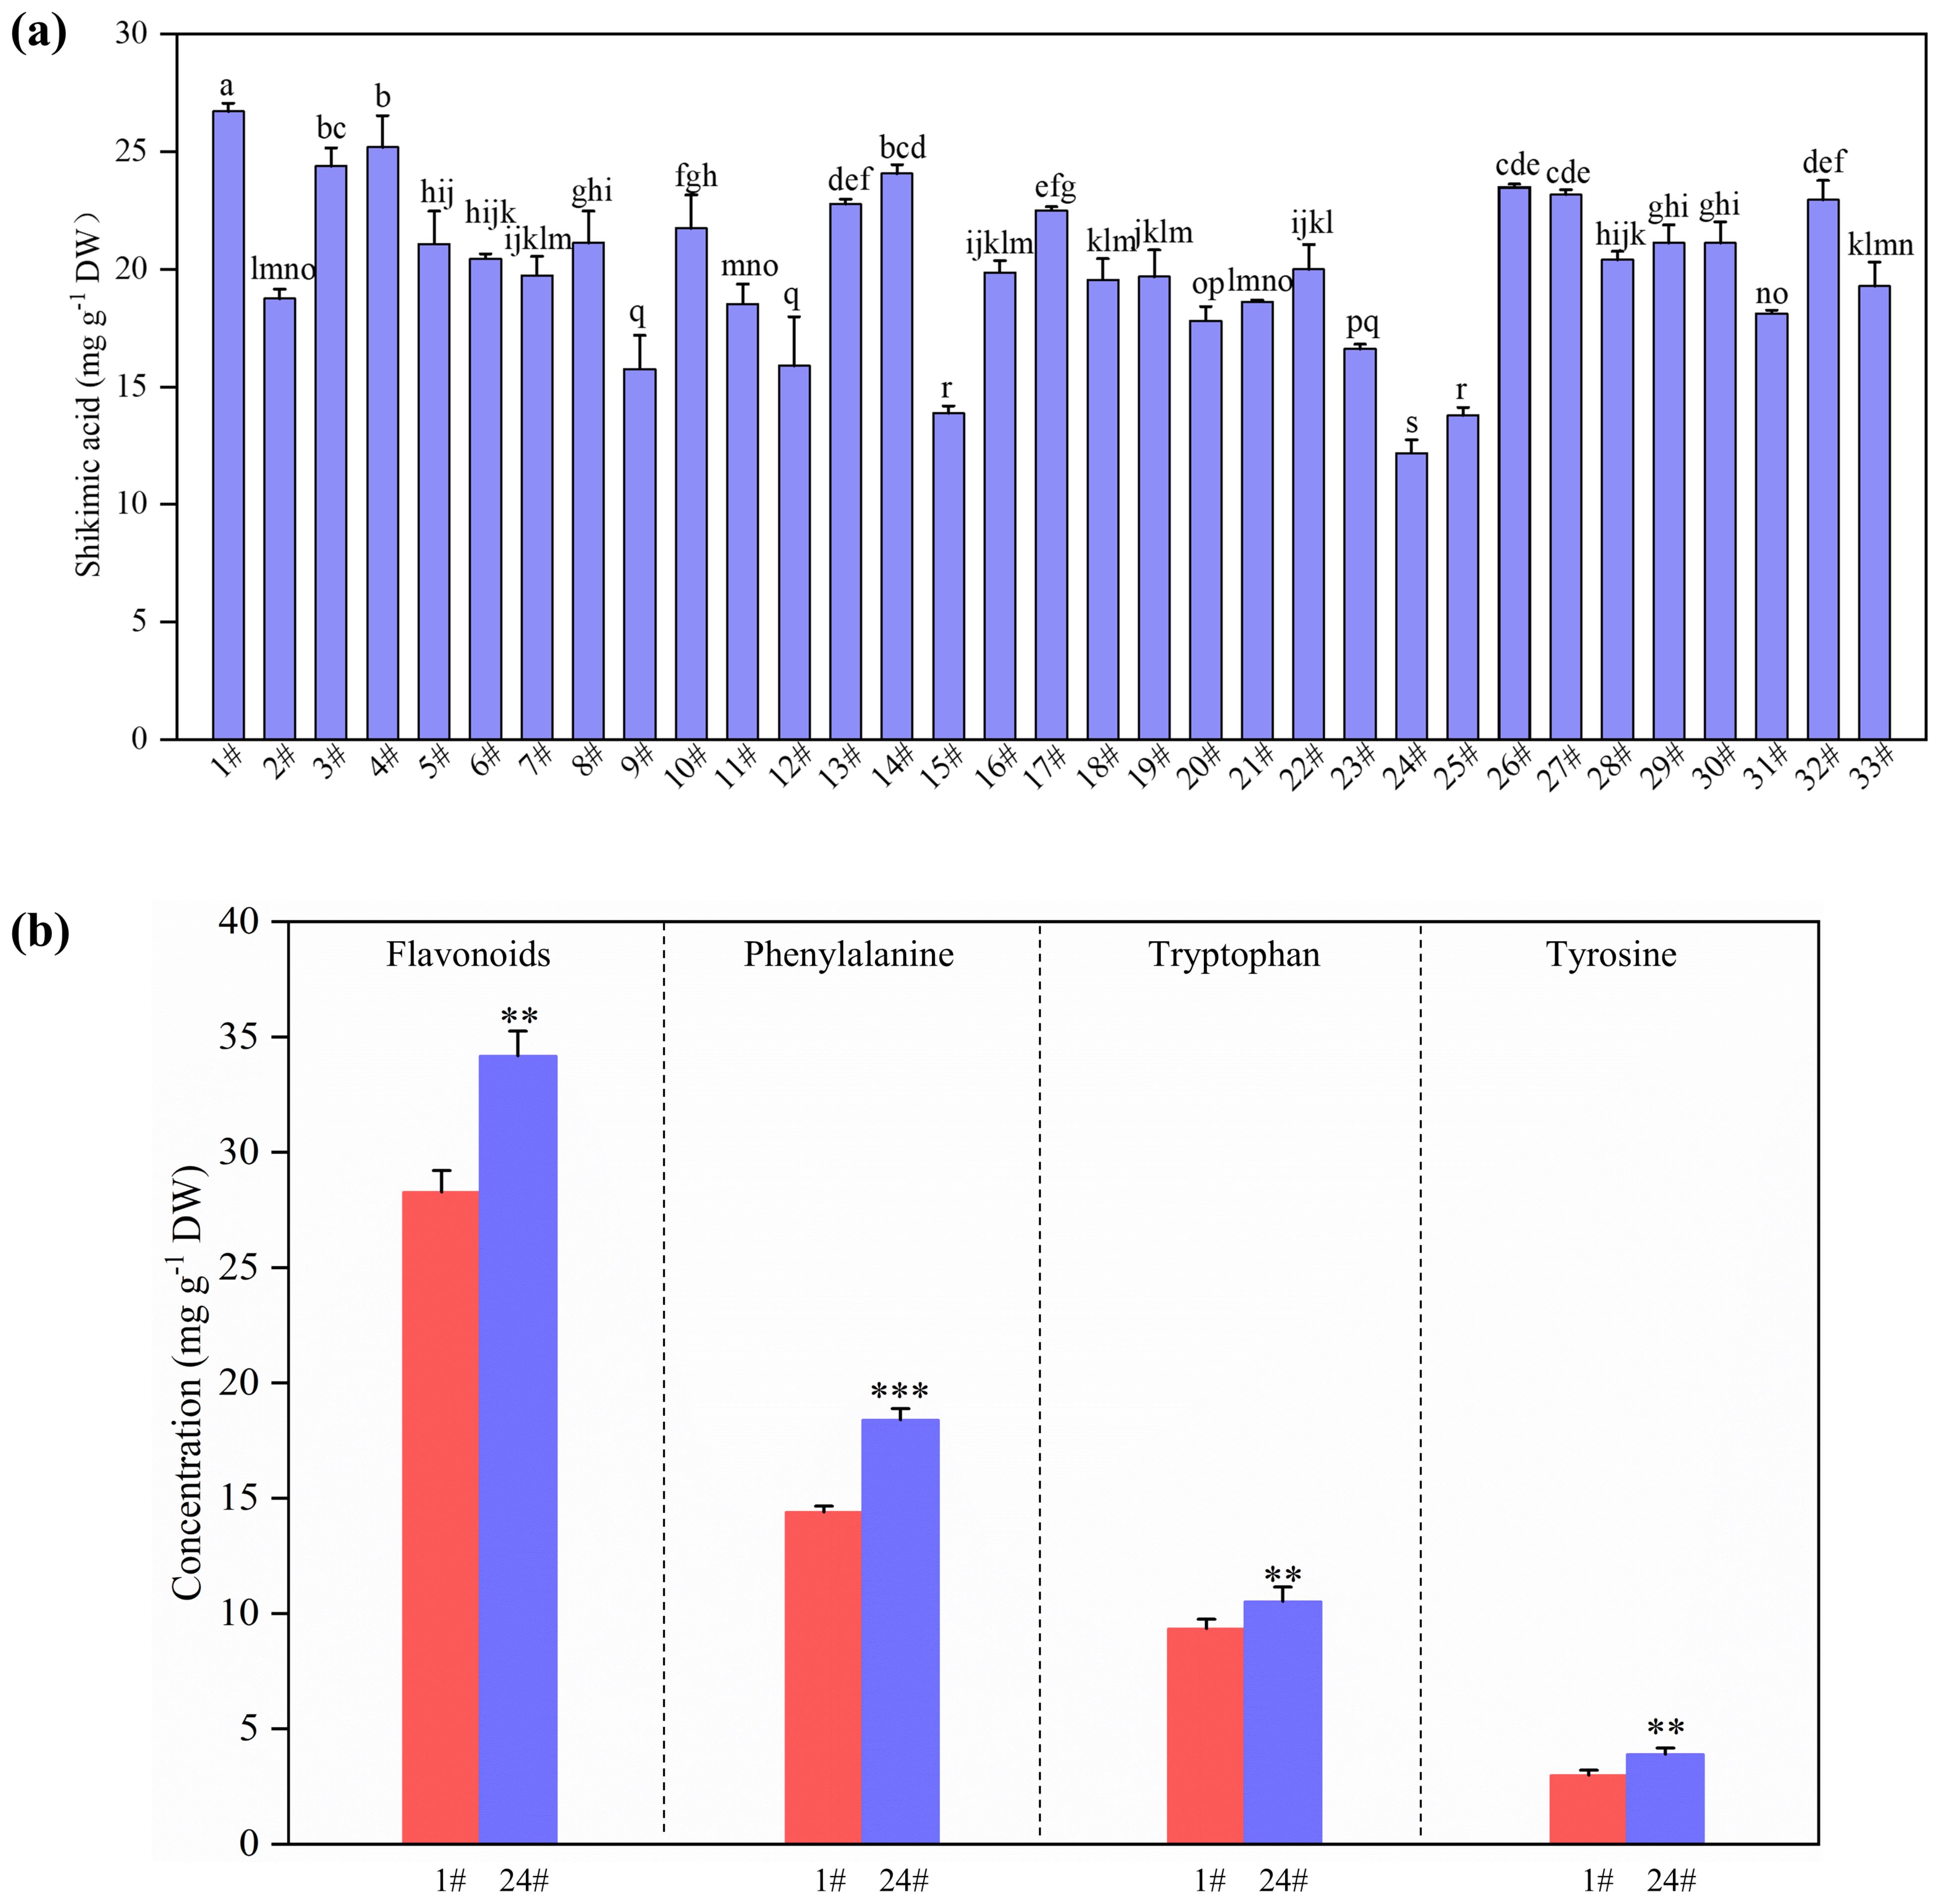
Figure 1. Concentration of shikimic acid in the leaves of 33 Ginkgo biloba clones (a), and concentrations of flavonoids, phenylalanine, tryptophan and tyrosine in the leaves of 1# and 24# (b). P-values obtained from one-way ANOVA test are indicated: *P < 0.05; **P < 0.01; ***P < 0.001.
LC–MS/MS raw data were processed using the Compound Discoverer 3.1 (CD3.1, Thermo Fisher Scientific) to perform peak alignment, picking and area quantification. Subsequently, the precise qualitative and relative quantitative results were obtained by matching the peaks with mzCloud, mzVault and MassList databases. The metabolites were annotated using the KEGG database, HMDB database and LIPIDMaps database (Marco-Ramell et al., 2018). The metabolites with VIP > 1, P-value < 0.05 and log2 (Fold change) ≥ 1 (or ≤ -1) were considered to be differentially regulated. Notably, electrospray ionization (ESI) was employed as the ion source, and was conducted in both positive and negative ion modes.
2.6 RNA sequencing and bioinformatic analysis
Total RNA from the leaves of HS and LS was isolated using a polysaccharide polyphenol plant total RNA kit (DP441, TianGen, Beijing, China), respectively. RNA integrity was evaluated using Agilent 2100 bioanalyzer. Subsequently, cDNA libraries were constructed and sequenced on illumina NovaSeq 6000 (Illumina, San Diego, CA, USA). The analysis of RNA sequencing data was performed as described earlier (Lu et al., 2022; Du et al., 2024). Briefly, the original sequencing data were filtered to obtain clean data. The clean reads were then aligned to the G. biloba genome (Guan et al., 2016) (Genome ID: 100613, available at http://gigadb.org/dataset/100613) using HISAT2 (v.2.0.5). StringTie software was used to assemble the new transcripts, and featureCounts (v.1.5.0-p3) was used to calculate the Fragments Per Kilobase Million (FPKM) of each gene. Significantly differentially expressed genes (DEGs) were identified on the basis of |log2 (Fold change)| ≥ 1 and a false discovery rate (FDR) < 0.05. The clusterProfiler software (v.3.8.1) was used for gene ontology (GO) and Kyoto Encyclopedia of Genes and Genomes (KEGG) analyses (Li et al., 2024b). GO terms and KEGG pathways with P-values < 0.05 were considered to be significantly enriched (Xiang et al., 2024). Three cDNA libraries were generated and sequenced for HS and LS, respectively. The sequencing data were deposited to the Genome Sequence Archive (GSA, https://ngdc.cncb.ac.cn/gsa/) under Project ID CRA025492.
DEGs were annotated and functional categorized as described by Yu et al. (2021); (Lu et al., 2024) with minor modifications. Briefly, the coding sequences of DEGs were retrieved from the G. biloba’s genomic database. The closest homologue of a G. biloba gene in Arabidopsis thaliana was identified by searching its coding sequence against the protein sequence database of Arabidopsis using translated nucleotide BLAST (BLASTX). Identifiers of Arabidopsis genes closest to these DEGs were then submitted to MapMan (http://mapman.gabipd.org/) for functional analysis.
2.7 Association analysis of transcription factors and DEGs involved in shikimic acid biosynthesis and downstream metabolism
Considering the critical roles of transcription factors (TFs) in shikimic acid biosynthesis and downstream metabolism, the Pearson correlation coefficient (R) between differentially expressed TFs and shikimic acid content was calculated. Candidate TFs were defined to have an absolute R-value greater than 0.92 and a P-value less than 0.05. To further identify key TFs regulating the accumulation of shikimic acid, R were calculated between these candidate TFs and DEGs involved in the shikimic acid biosynthesis and downstream metabolism. Significant correlations were defined as |R| > 0.95 with P-value < 0.05. Correlations between key TFs and DEGs were displayed using Cytoscape (v.3.10.1).
2.8 Integrative analysis of metabolome and transcriptome
The differentially accumulated metabolites (DAMs) and DEGs involved in shikimic acid biosynthesis and downstream metabolism were used for the integrative analysis, and the Pearson’s correlation coefficients between them were calculated (Yu et al., 2022). A correlation was considered statistically significant if the absolute value of the |R| exceeded 0.8 with a P-value less than 0.05. Heatmaps were used to reveal the correlation between these DAMs and DEGs.
2.9 Fluorescence quantitative PCR experiment
Total RNA was extracted as mentioned above. Quantitative RT-PCR (RT-qPCR) was conducted as described previously (Zhang et al., 2023). Specific primers were designed for each DEG, and Glyceraldehyde 3- phosphate dehydrogenase (GAPDH) was selected as an internal standard (Supplementary Table S1).
2.10 Statistical analysis
Statgraphics (STN, St Louis, MO, USA) was employed to do statistical tests as described previously (Lu et al., 2019, 2023). The data was tested to explore the normality prior to the analysis. One-way analysis of variance (ANOVA) was employed, and the means were regarded to be significantly different if the P-value was less than 0.05 on the basis of ANOVA F-test.
3 Results
3.1 Shikimic acid, flavonoids, phenylalanine, tryptophan and tyrosine
The concentration of shikimic acid in the leaves varied greatly among the 33 G. biloba clones (Figure 1a). Notably, 1# had the highest shikimic acid level and 24# possessed the lowest content (Figure 1a). The shikimic acid content in HS was 119% higher than that in LS (Figure 1a). HS and LS were selected to further study the metabolomic and transcriptomic mechanism of shikimic acid accumulation in G. biloba leaves. The concentrations of flavonoids, phenylalanine, tryptophan and tyrosine, which are downstream metabolites of shikimic acid, in HS were 17%, 22%, 11% and 23% lower than those in LS, respectively (Figure 1b).
3.2 Metabolomic response
A total of 862 metabolites were identified in positive (451) and negative (411) ion modes, respectively (Supplementary Table S2). Principal component analysis (PCA) demonstrated that the first two principal components explained 60.48% and 57.61% of the total variance in negative and positive ion modes, respectively, with PC1 serving as the dominant contributor in both analyses (Figures 2a, b). Partial least squares discriminant analysis (PLS-DA) showed clear metabolic differences between HS and LS (Figures 2c, d). In the PLS-DA model, PC1 accounted for 34.79% (negative mode) and 33.44% (positive mode), while PC2 explained 20.94% (negative mode) and 15.43% (positive mode) of variances, respectively (Figures 2c, d). For metabolites detected in negative ion mode, compared with LS, the abundances of 67 metabolites were higher, whereas those of 71 metabolites were lower in HS, respectively (Supplementary Figure S1a; Supplementary Table S3). 61 upregulated and 91 downregulated metabolites (in positive ion mode) were identified in HS vs. LS, respectively (Supplementary Figure S1b; Supplementary Table S3). According to KEGG pathway annotation, these DAMs were mainly involved in metabolic pathways, tryptophan metabolism, galactose metabolism, aminoacyl−tRNA biosynthesis, and arginine and proline metabolism (Supplementary Figures S1c, d).
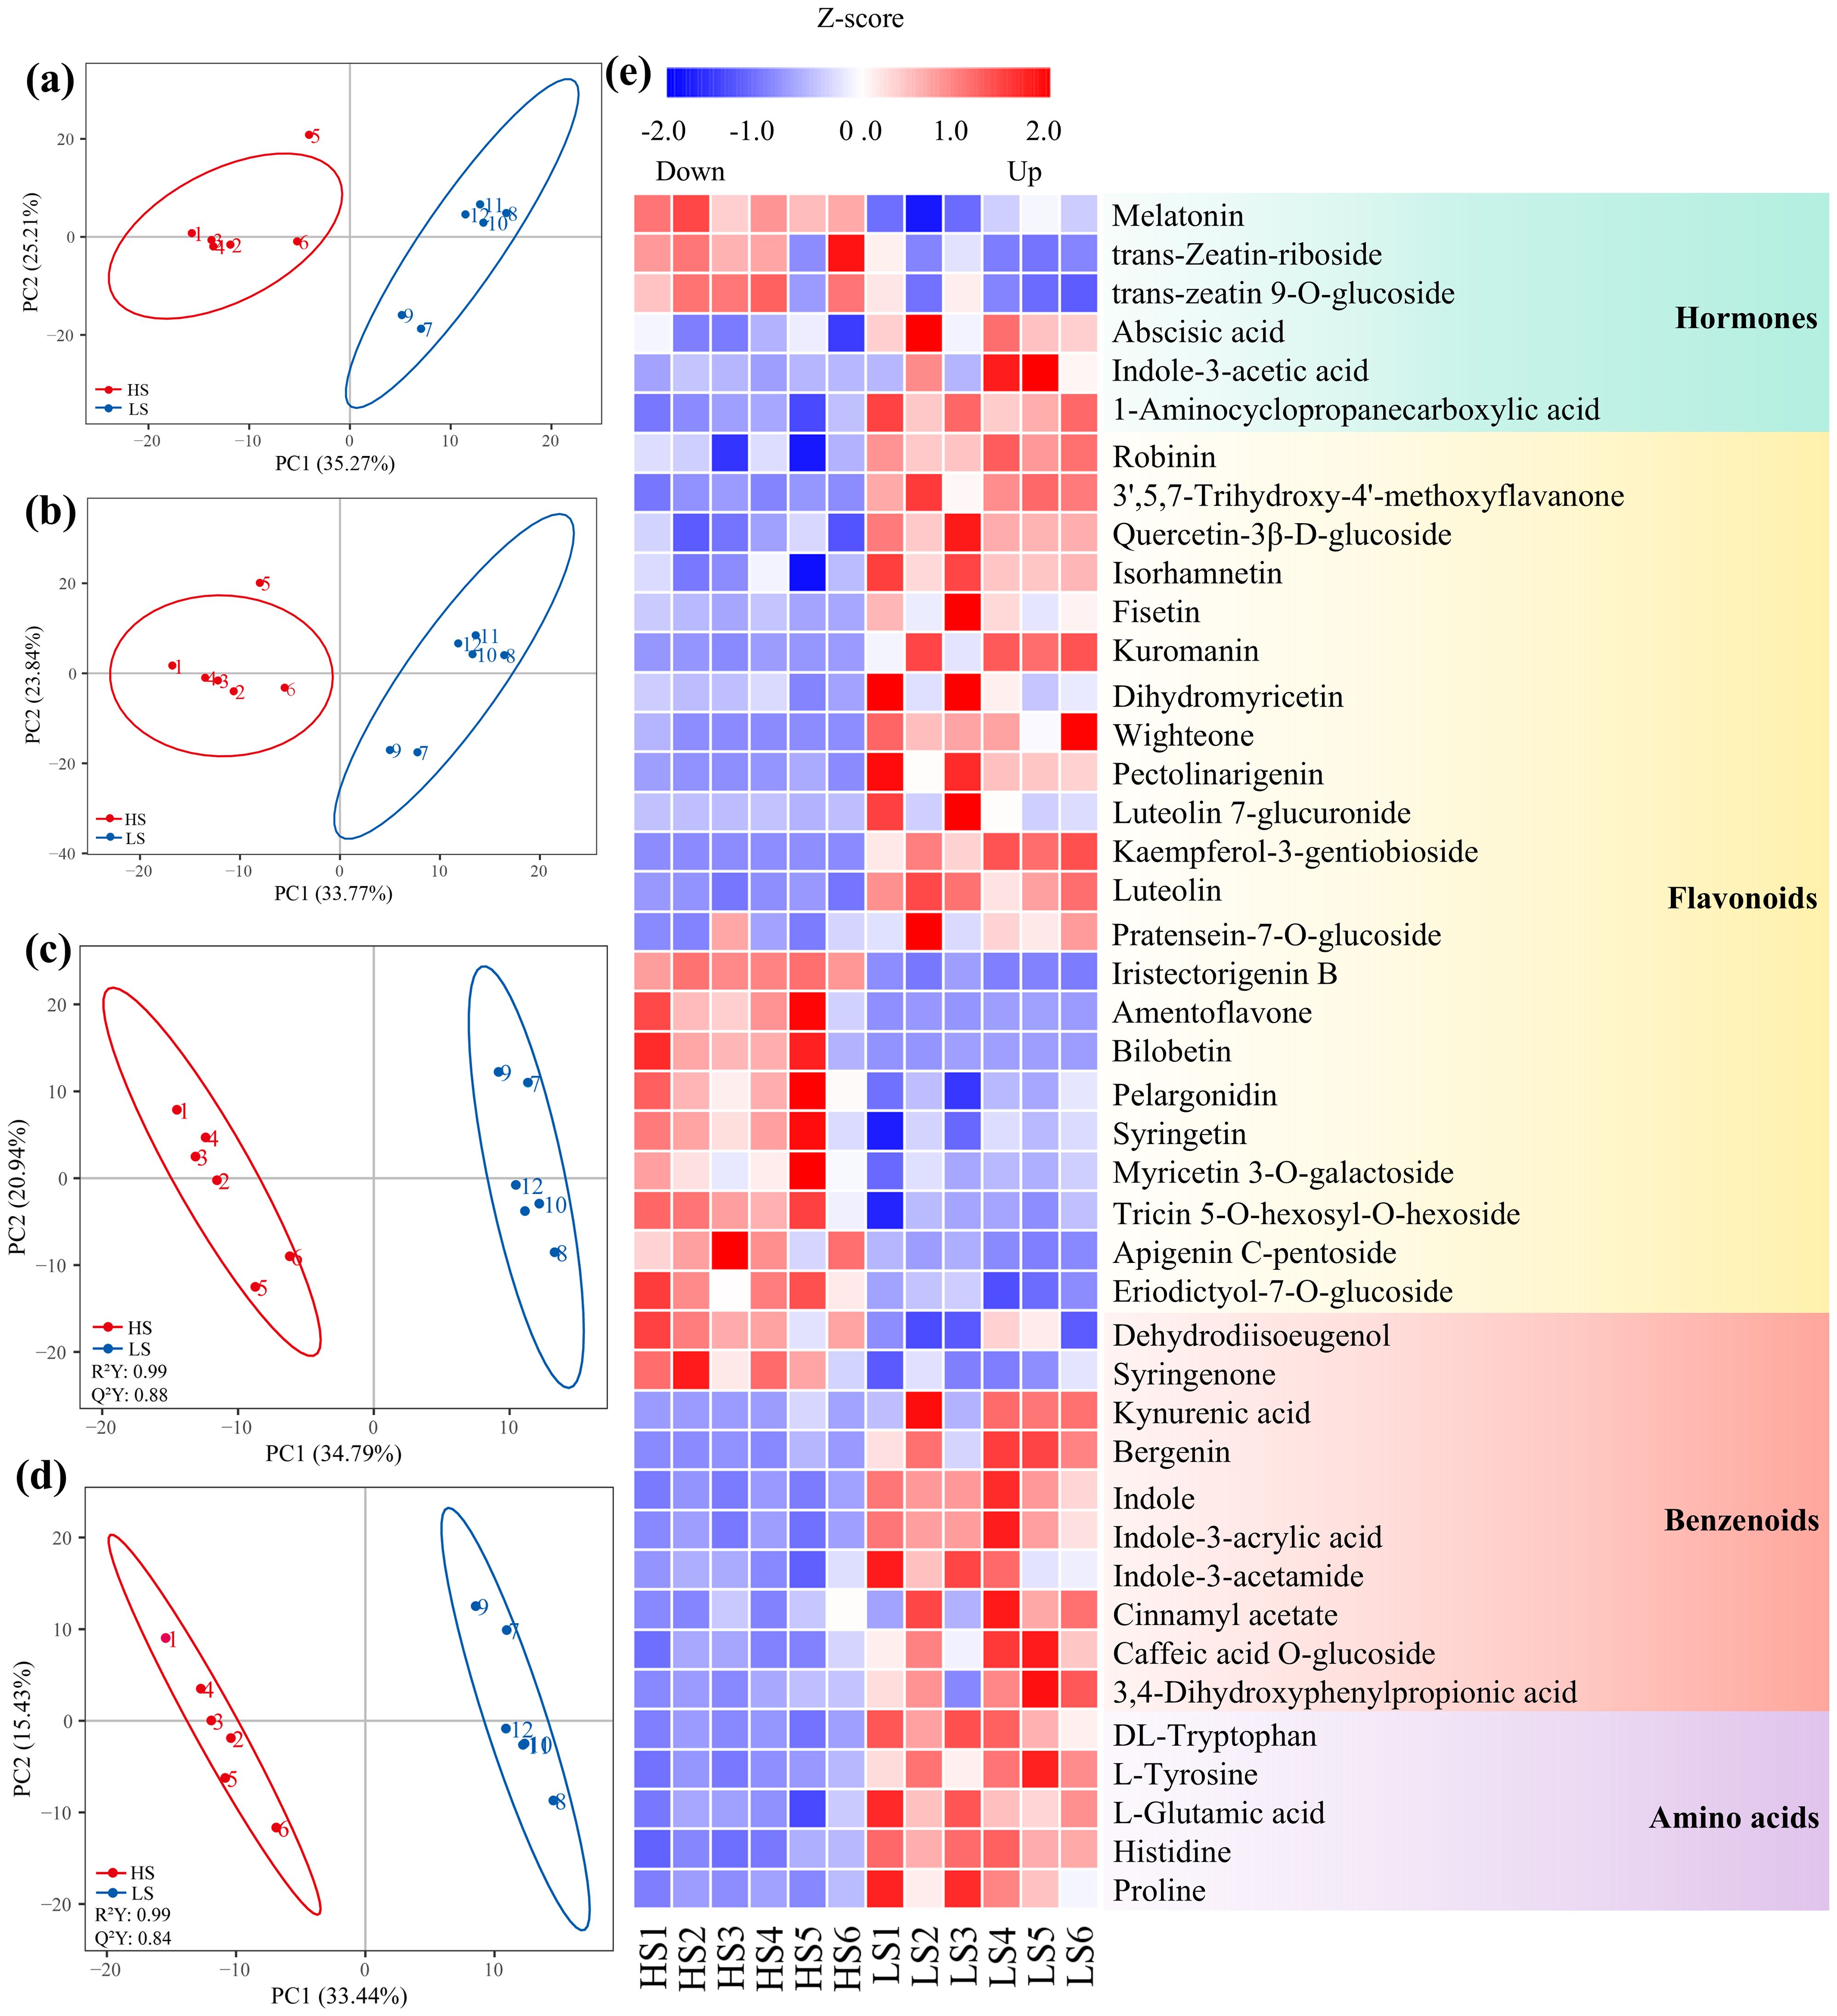
Figure 2. Principal component analysis (PCA) plots (a, b) and partial least squares discriminant analysis (PLS-DA) plots (c, d) of the metabolites identified in negative mode (a, c) and positive mode (b, d), enforced with electrospray ionization (ESI) in LC-MS/MS, and hierarchical clustering of the differentially abundant metabolites between HS (1#, highest shikimic acid content) and LS (24#, lowest shikimic acid content) (e). R²Y, Cumulative explained variance of the response variable in PLS-DA. Q²Y, Cross-validated predictive variance of the response variable.
The DAMs were divided into 10 categories, mainly including benzenoids, flavonoids, amino acids and hormones (Figure 2e; Supplementary Table S3). The abundances of most benzenoids, amino acids and hormones, were significantly lower in HS compared to those in LS (Figure 2e; Supplementary Table S3). For example, abscisic acid, indole-3-acetic acid, tyrosine, tryptophan, kynurenic acid, bergenin and 3-dehydroshikimic acid were downregulated in HS compared to LS (Figure 2e; Supplementary Table S3). The abundances of 12 flavonoid metabolites, such as luteolin, kaempferol-3-gentiobioside and wight one in HS were significantly lower when compared with those in LS (Figure 2e; Supplementary Table S3).
3.3 Transcriptomic response
Based on the above physiological and metabolomic data, it was speculated that there are differences in gene expression patterns involved in shikimic acid synthesis and downstream metabolism between HS and LS. To test this hypothesis, the transcriptomes of leaves from HS and LS were sequenced. A total of six cDNA libraries from HS and LS were constructed, and 45.1-46.3 million clean reads were obtained from each library (Supplementary Table S4). 91.10-91.94% of clean reads can be mapped to the G. biloba genome database (Supplementary Table S4). Compared with LS, 671 upregulated and 873 downregulated genes were detected in HS (Figure 3a). Genes were randomly selected to validate the transcriptomic data using RT-qPCR (Supplementary Figure S2).
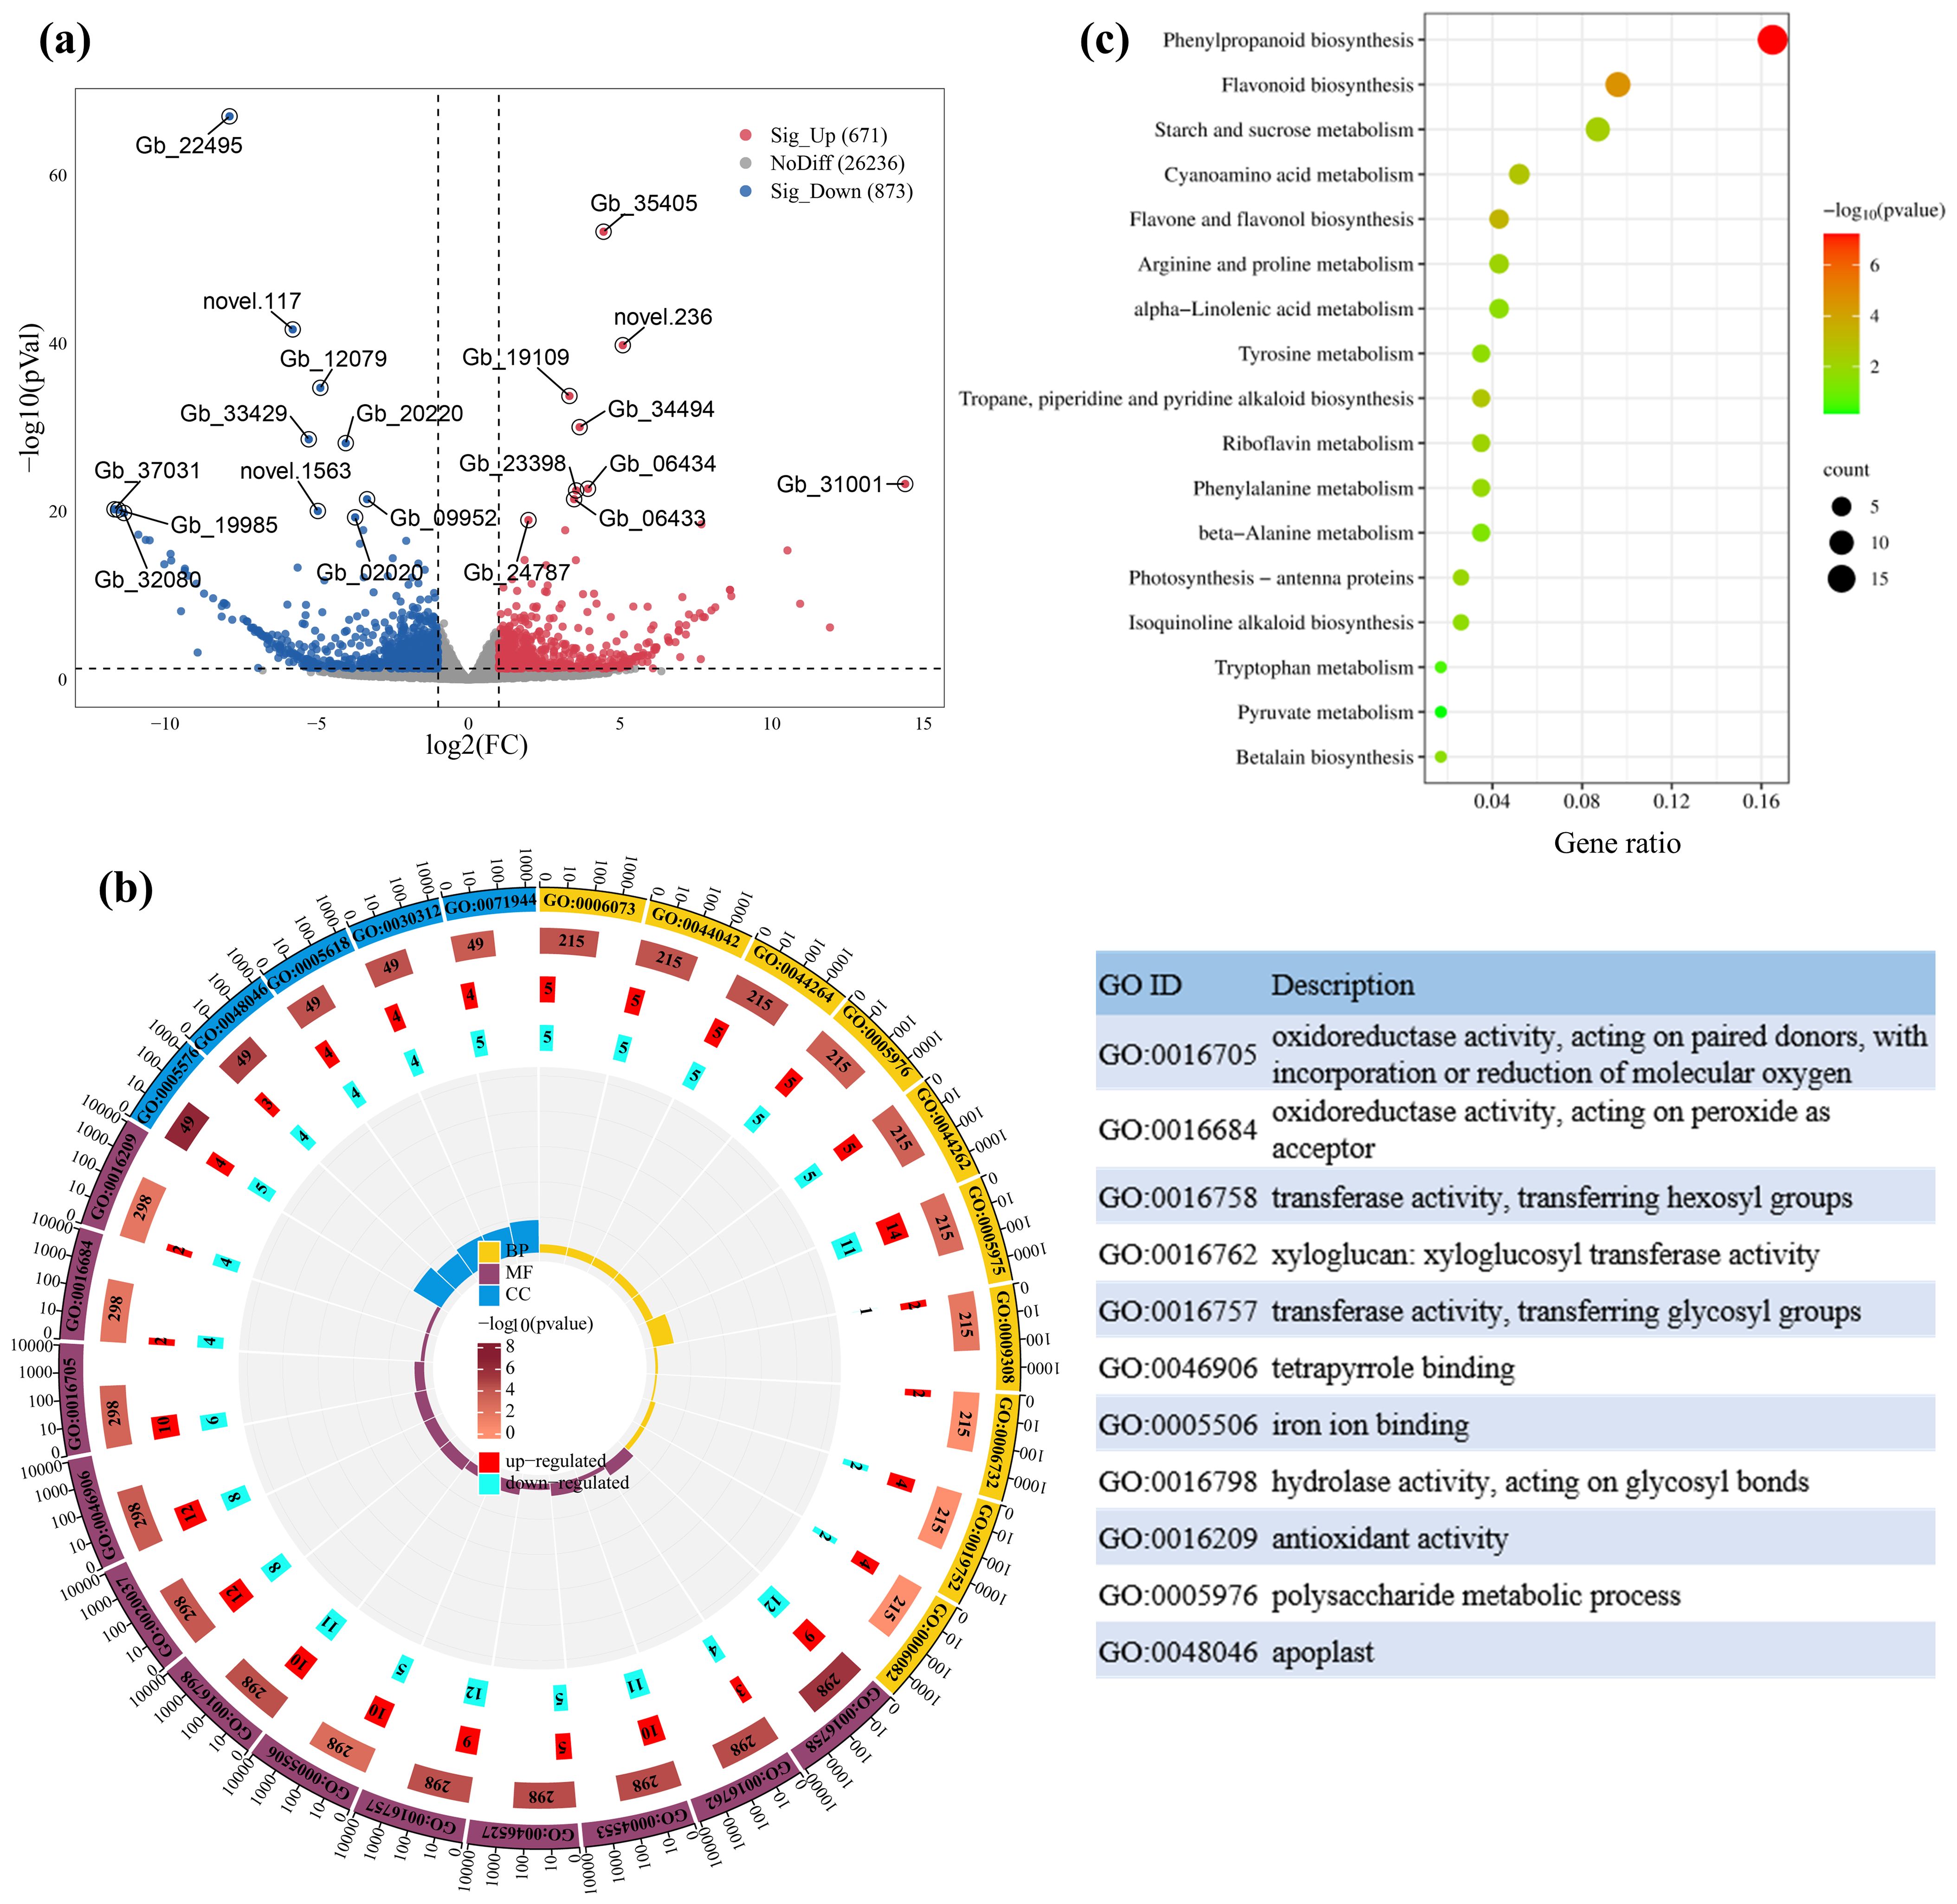
Figure 3. Volcano plot of significantly differentially expressed genes (DEGs) between HS and LS (a), as well as gene ontology (GO) enrichment analysis (b), and dot plot showing kyoto encylopaedia of genes and genomes (KEGG) enrichment analysis of DEGs (c). In panel (b), CC, MF, and BP represent cellular component, molecular function, and biological process, respectively. In panel (c), the size of the dots represents the number of enriched genes, and the color indicates the P-value. Gene IDs correspond to gene models from the draft genome of G. biloba published by Guan et al. (2016) (assembly accession 100613). Detailed information about these genes is presented in Supplementary Table S5.
GO enrichment analysis showed that the differentially expressed genes (DEGs) were significantly enriched in oxidoreductase activity, acting on paired donors, with incorporation or reduction of molecular oxygen (GO:0016705), transferase activity, transferring hexosyl groups (GO:0016758), xyloglucan: xyloglucosyl transferase activity (GO:0016762), hydrolase activity, acting on glycosyl bonds (GO:0016798) and polysaccharide metabolic process (GO:0005976) (Figure 3b). KEGG pathway enrichment analysis showed that DEGs were involved in phenylpropanoid biosynthesis, flavonoid biosynthesis, starch and sucrose metabolism, flavone and flavonol biosynthesis, and cyanoamino acid metabolism (Figure 3c). These results suggest that DEGs are involved in the biosynthesis and downstream metabolism of shikimic acid. MapMan was used to further classify these DEGs into functional categories, including photosynthesis, flavonoid metabolism, hormone metabolism, amino acid metabolism and transcriptional regulation (Supplementary Table S5), which are closely correlated with synthesis and downstream metabolism of shikimic acid.
In the shikimic acid synthesis pathway (Supplementary Figure S4), malate dehydrogenase (MDH) encoding a pivotal enzyme responsible for the conversion of l-malate into oxaloacetate (Rozova et al., 2015) and Ribose-5-phosphate isomerase (RPI) coding for a cytosolic ribose-5-phosphate isomerase that catalyzes the conversion of D-ribulose 5-phosphate to d-ribose 5-phosphate (Faria et al., 2016), were more upregulated in HS compared to LS (Figure 4a; Supplementary Table S5).
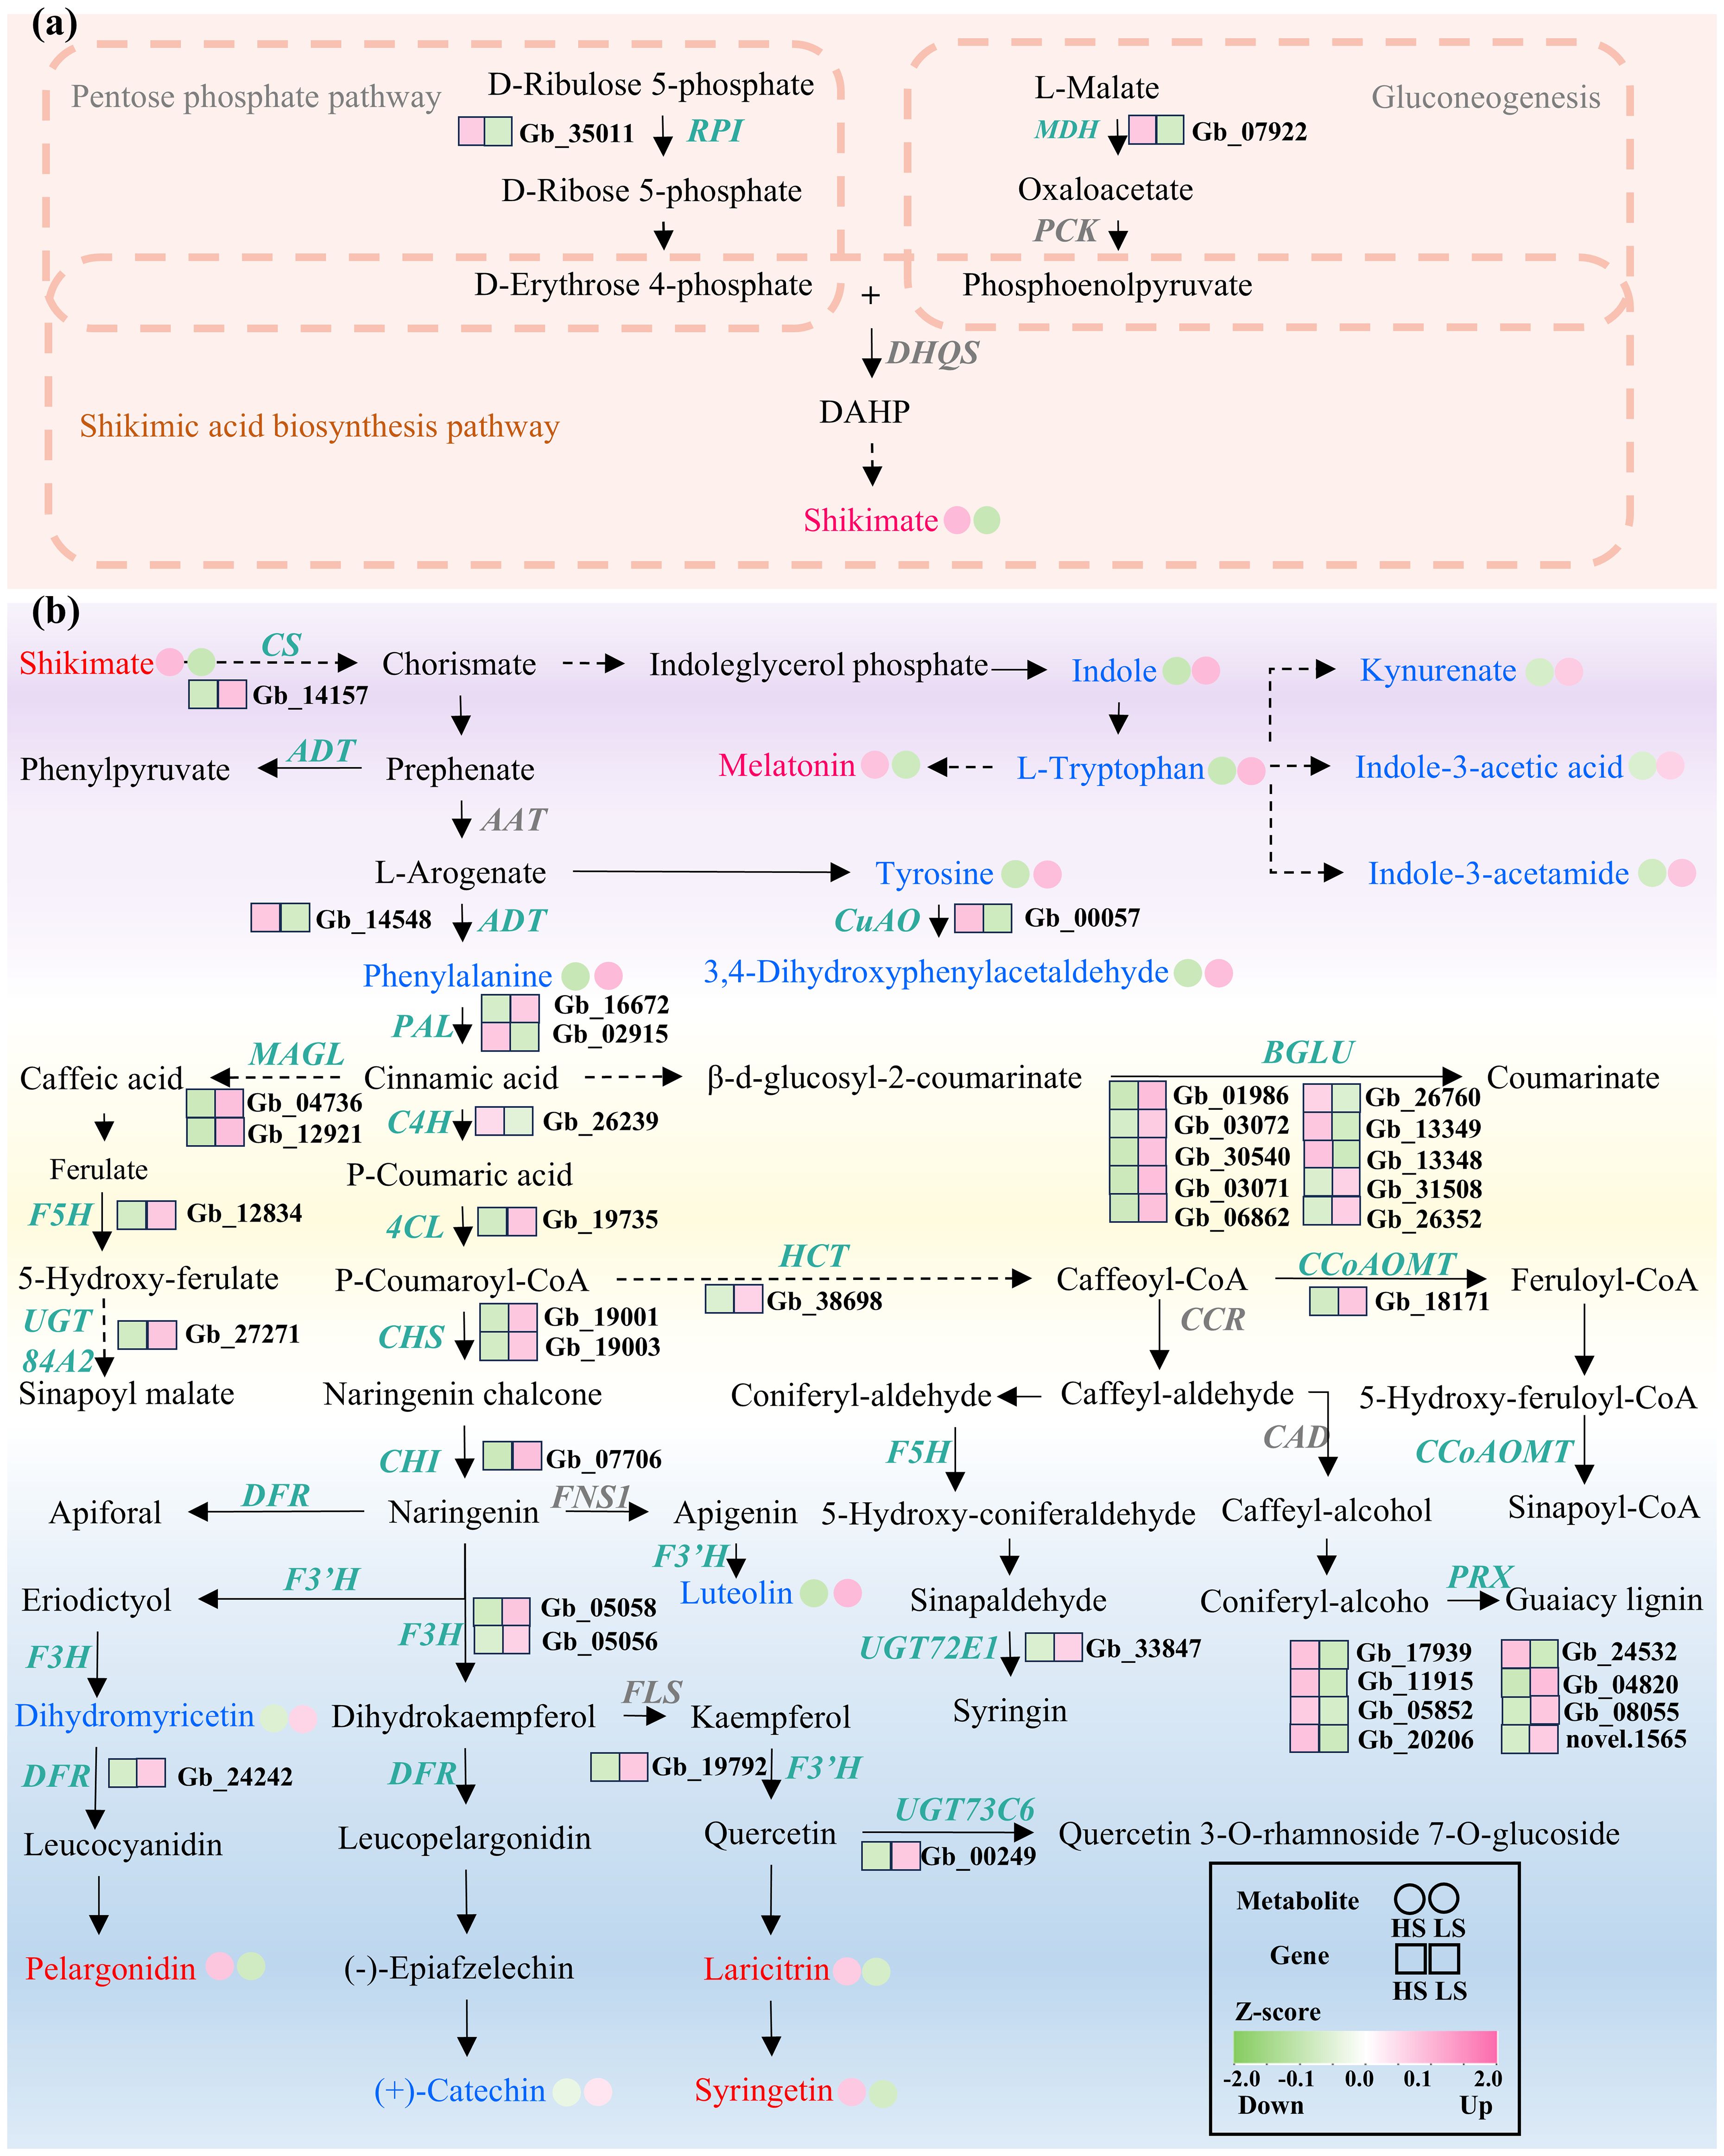
Figure 4. Changes in abundances of metabolites and expression levels of genes involved in shikimic acid biosynthesis (a) and downstream metabolism (b) in HS compared to LS. Metabolites marked with red/blue fonts indicate upregulated/downregulated metabolites in HS compared to LS. Genes marked with green italic fonts are significantly differentially expressed. Detailed information about these metabolites and genes is presented in Supplementary Tables S4, S5, respectively. Solid arrows represent single-step enzymatic reactions, while dashed arrows indicate multi-step or simplified pathways between metabolites.
In the downstream metabolism of shikimic acid (Supplementary Figure S4), a number of genes that are implicated in biosynthesis of aromatic amino acids and flavonoids were downregulated in HS compared to LS (Figure 4b). For instance, the transcript levels of chorismate synthase (CS) encoding an enzyme that catalyzes the conversion of 5-enolpyruvylshikimate-3-phosphate (EPSP) to chorismate was downregulated in HS compared to LS (Figure 4b; Supplementary Table S5). Similarly, the mRNA levels of 4-coumarate:CoA ligase (4CL) encoding an enzyme that catalyzes the ATP-dependent conversion of p-coumaric acid to p-coumaroyl-CoA, chalcone synthase (CHS) encoding a key enzyme that condenses p-coumaroyl-CoA with three molecules of malonyl-CoA to form naringenin chalcone, flavanone-3b-hydroxylase (F3H) encoding an enzyme that mediates the stereospecific 3β-hydroxylation of naringenin to dihydrokaempferol, and dihydroflavonol 4-reductase (DFR) encoding an enzyme that catalyzes the NADPH-dependent reduction of dihydromyricetin to leucocyanidin, were downregulated in HS compared to LS (Figure 4b; Supplementary Table S5).
In the category of hormone metabolism, the transcript levels of abscisic acid-responsive element-binding factor (ABF) and gem-relate 5 (GER5) involved in ABA signaling (Liu et al., 2019) were downregulated in HS compared to LS (Supplementary Figure S3; Supplementary Table S5). The mRNA levels of BIG and cullin-associated and neddylation dissociated (CAND1) involved in auxin regulation (Gil et al., 2001; Chuang et al., 2004), and like aux1 3 (LAX3) and GH3.1 implicated in auxin transport (Kasahara et al., 2020), were downregulated in HS compared to LS (Supplementary Figure S3).
3.4 Differentially expressed transcription factors
A total of 126 differentially expressed TFs were identified in this study (Supplementary Table S5). The highest abundance of TF family was MYB (18, 14.29%), followed by PTRs (12, 9.52%), C2H2 (12, 9.52%), HB (7, 5.56%) and AP2-EREBP (7, 5.56%) (Figure 5a). Notably, only four MYBs were upregulated, while the other 14 MYBs were significantly downregulated in HS compared to LS (Figure 5b). In addition, most C2H2, bHLH and ARF family genes were downregulated, while WRKYs and bZIPs were more upregulated in HS compared to LS (Figure 5b).

Figure 5. Classification and proportion of differentially expressed transcription factors (TFs) (a), expression profiles of selected TFs (b), and correlation analysis of candidate TFs and differentially expressed genes involved in shikimic acid biosynthesis and downstream metabolism (c) in the leaves of G. biloba. Detailed information about these genes is presented in Supplementary Table S5.
Pearson correlation analysis between the transcript levels of differentially expressed TFs and shikimic acid concentration identified 28 TFs with closely correlations (R ≥ 0.92 or ≤ -0.92) (Supplementary Table S6). Among these, nine TFs, such as enhanced downy mildew 2 (EDM2) and set domain group 26 (SDG26), showed a positive correlation with shikimic acid content (Supplementary Table S6). The remaining 19 TFs, such as constans-like 9 (COL9) and myb domain protein 50 (ATMYB50), displayed a negative correlation with shikimic acid content (Supplementary Table S6).
Correlation analysis was performed to further calculate the correlation coefficients between these 28 TFs and DEGs participating in shikimic acid biosynthesis and downstream metabolism (Figure 5c). Each TF was closely correlated with 1–6 DEGs involved in shikimic acid biosynthesis and downstream metabolism (Figure 5c; Supplementary Table S7). Notably, related to AP2 11 (RAP2.11) and reproductive meristem 16 (REM16) had the most numbers of closely correlated DEGs (Figure 5c; Supplementary Table S7). RAP2.11 and REM16 were considered to be key TFs in regulating shikimic acid biosynthesis and downstream metabolism.
3.5 Association analysis of metabolome and transcriptome
The correlation between DAMs and DEGs that are involved in shikimate biosynthetic and downstream metabolic pathways were analyzed (Figure 6). Apigenin c-pentoside, kaempferol-3-gentiobioside and luteolin were three metabolites having the highest numbers of correlated DEGs (Figure 6). Specifically, kaempferol-3-gentiobioside, apigenin c-pentoside and luteolin were positively correlated with 19, 8 and 19 DEGs, and were negatively correlated with 10, 20 and 8 DEGs, respectively (Figure 6). In addition, beta glucosidase 7 (BGLU7), Arabidopsis thaliana peroxidase 34 (AtPERX34), peroxidase (PRX) and copper amine oxidase (CuAO) were found to have the largest numbers (21-22) of correlated DAMs (Figure 6). Therefore, the three DAMs and four DEGs may play key roles in the shikimic acid biosynthesis and downstream metabolism in the leaves of G. biloba.
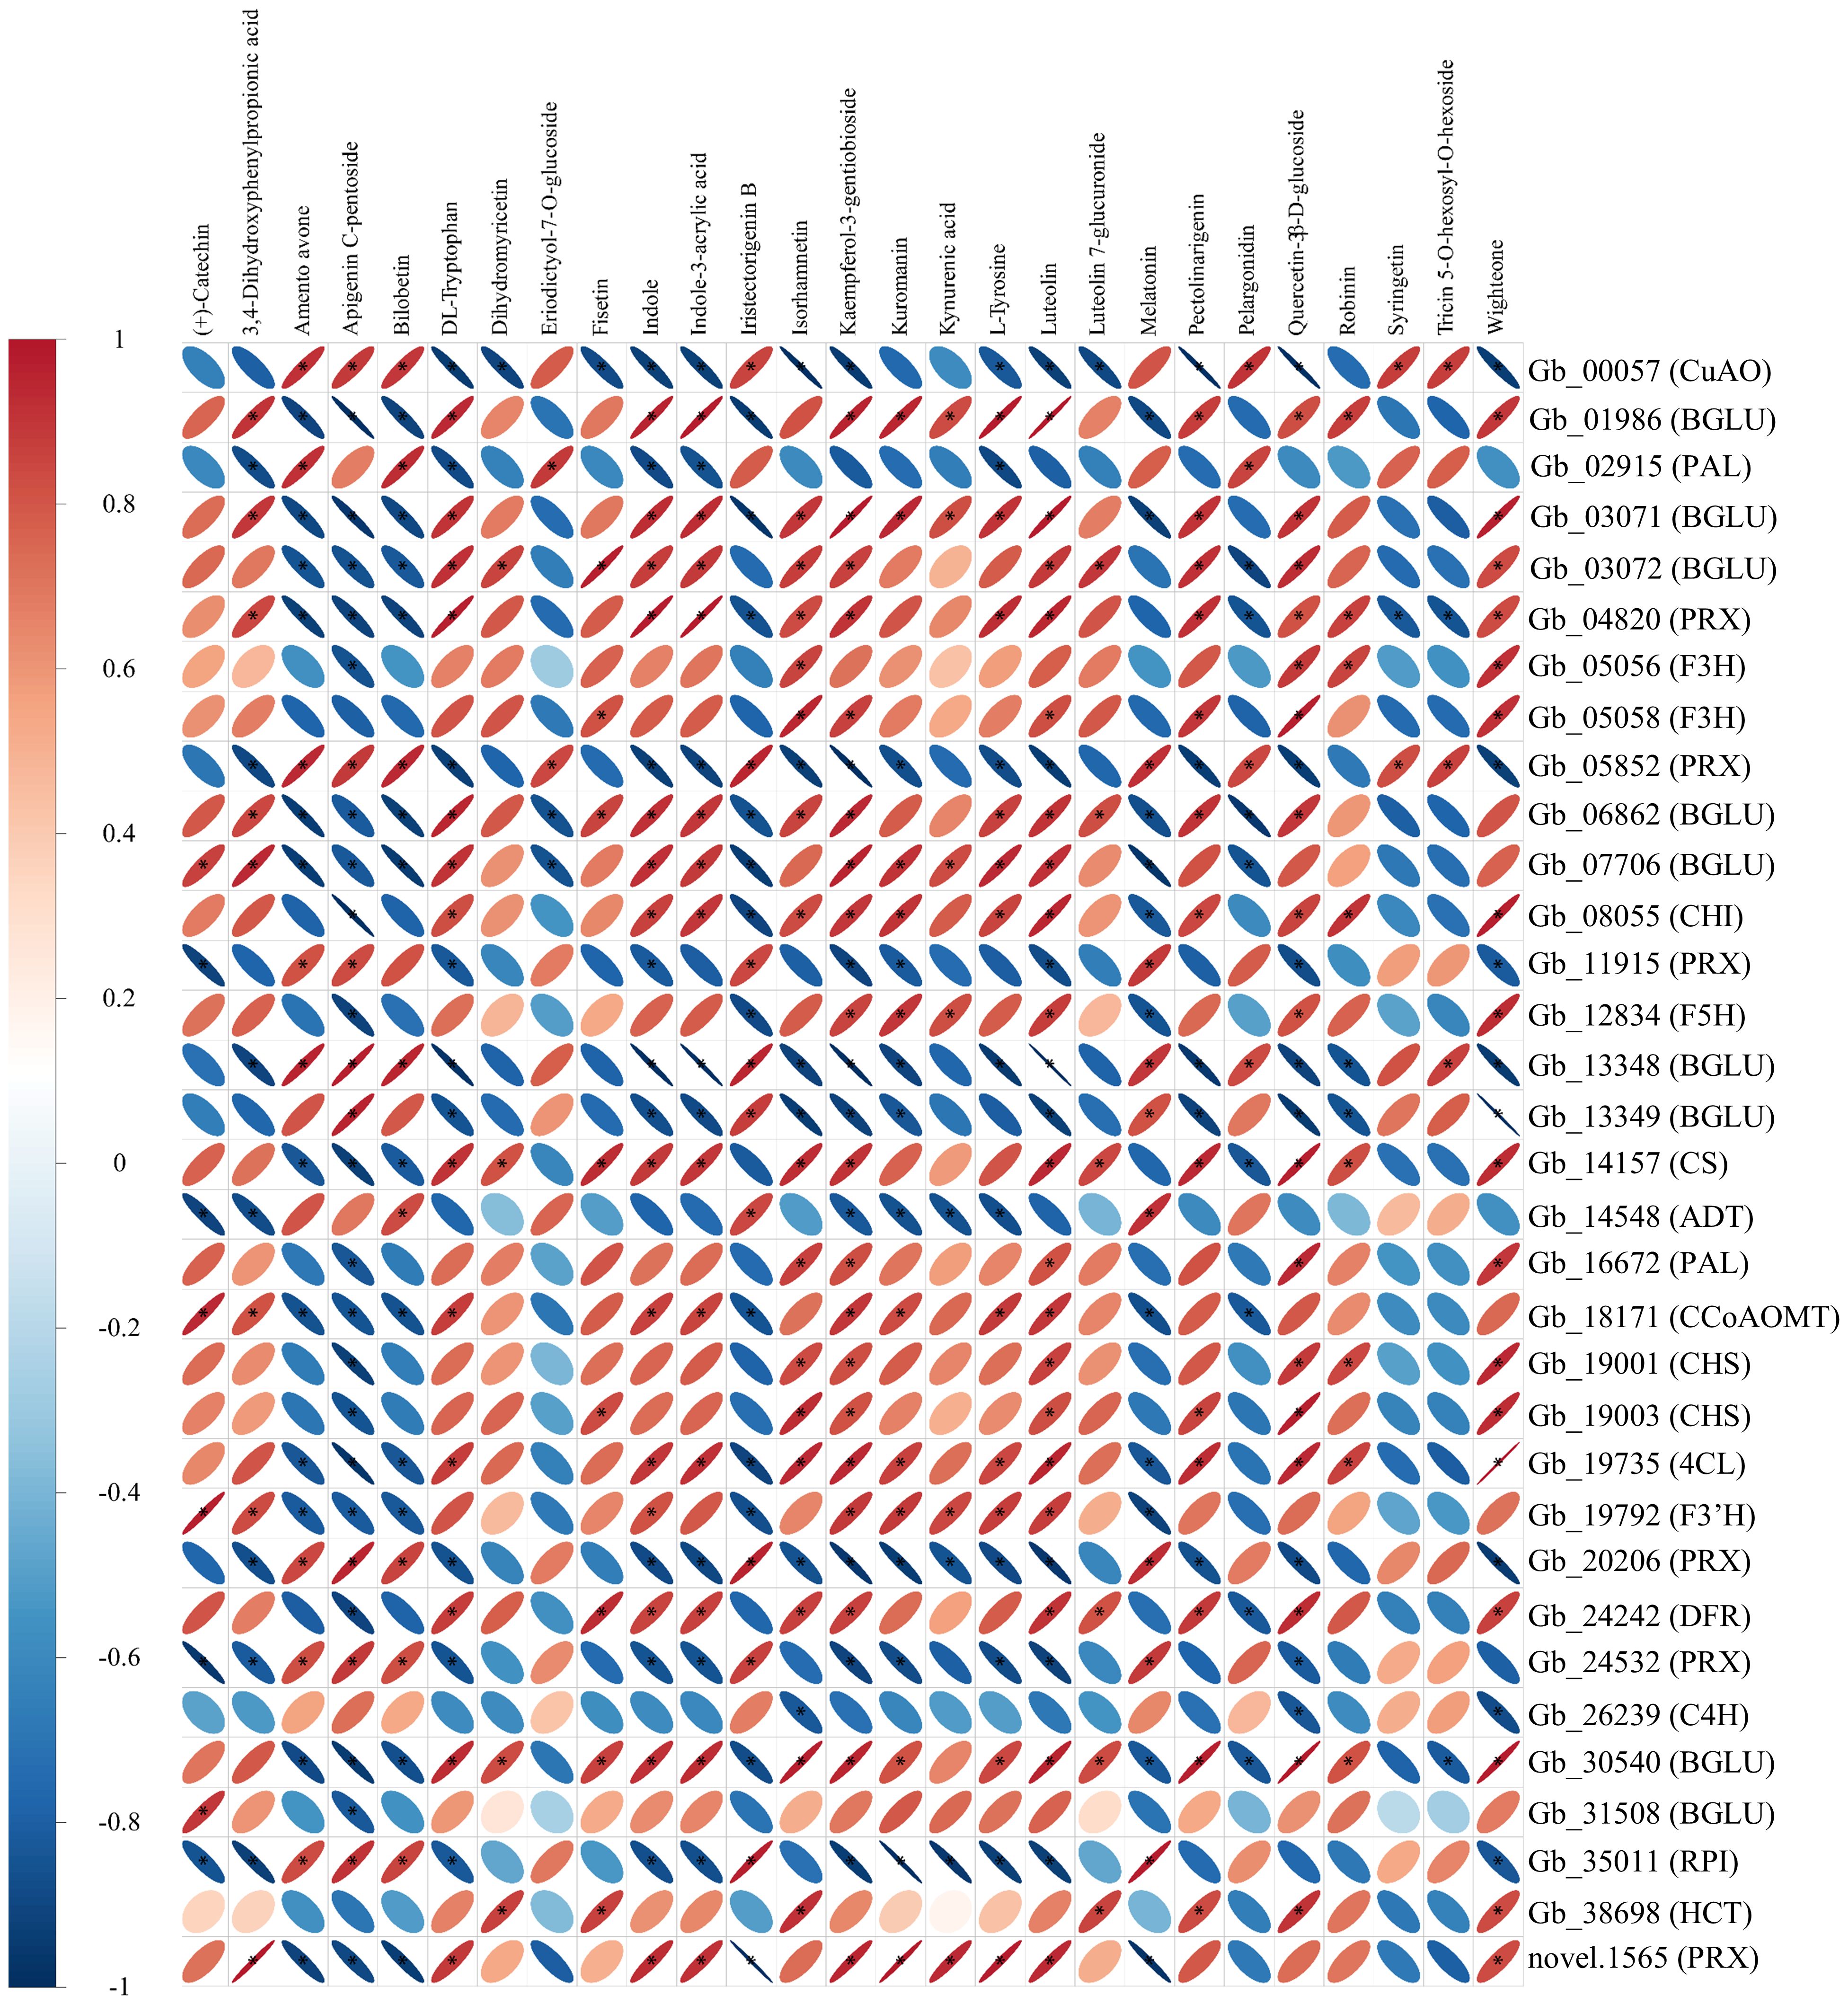
Figure 6. Correlation heatmap of differentially abundant metabolites and differentially expressed genes involved in shikimate biosynthesis and downstream metabolism. ‘*’ indicates a significant correlation (|R| ≥ 0.8, P-value < 0.05.) between the metabolites and genes. Detailed information about these genes is provided in Supplementary Table S5.
4 Discussion
4.1 The greater synthesis and lower downstream metabolism of shikimic acid are essential for higher shikimic acid concentration in the leaves of G. biloba
The biosynthesis and downstream metabolism of shikimic acid determine the final shikimic acid concentration in G. biloba leaves. Notably, in the upstream synthesis of shikimic acid, both MDH and RPI were significantly upregulated in HS compared to LS. Functionally, MDH catalyzes the formation of OAA (as a precursor of PEP), and RPI generates Ru5P, which can be transformed into E4P (Stover et al., 2000). E4P and PEP constitute the essential substrate pairs for shikimic acid biosynthesis (Kruger and von Schaewen, 2003). These findings suggest that the upregulation of MDH and RPI play key roles in higher shikimic acid concentration in HS vs. LS.
Previous studies have demonstrated that the attenuated downstream metabolic flux exhibit significant accumulation of shikimic acid in plants (Bochkov et al., 2011; Eloy et al., 2017). The biosynthesis of aromatic amino acids and flavonoids are two vital metabolic pathways of downstream shikimic acid metabolism. Correspondingly, the abundances of several aromatic amino acids and flavonoid-related metabolites, such as phenylalanine, tryptophan, tyrosine, dihydromyricetin, (+)-catechin and luteolin, were significantly lower in HS vs. LS. Based on the association analysis, luteolin was identified as a key metabolite. In this study, the expression levels of multiple genes, such as CS, CHS, DFR, PRX, ATPERX34, BGLU7 and CuAO, which are involved in biosynthesis of aromatic amino acids and flavonoids were markedly downregulated in HS compared to LS. Additionally, Integrated analysis of metabolomic and transcriptomic data revealed that PRX, ATPERX34, BGLU7, and CuAO may play pivotal roles in shikimate biosynthesis and downstream metabolism. In maize (Zea mays), suppression of CHS results in lower flavonoid production and higher accumulation of shikimic acid derivatives (Eloy et al., 2017). Similarly, inhibition of the CS in Petunia hybrida leads to reduced flavonoid accumulation (Zhong et al., 2020). These results suggest that the downregulation of metabolites and genes participating in downstream metabolism of shikimic acid contribute to higher concentration of shikimic acid in HS than that in LS.
4.2 Changes in expression levels of genes involved in phytohormone metabolism might contribute to higher shikimic acid accumulation
Previous studies have shown that ABA and IAA could affect the metabolism of flavonoid (Jeong et al., 2004; Dong and Lin, 2021), probably regulating the shikimic acid accumulation in G. biloba leaves. For instance, exogenous application of ABA increases the levels of flavonoid-related metabolites, such as isorhamnetin-3-O-gallate and dihydromyricetin, in Rhododendron chrysanthum after UV-B radiation (Yu et al., 2024). ABA positively regulates flavonoid accumulation by upregulating F3’H under drought stress in G. biloba (Yu et al., 2022). Auxin is also reported to be positively correlated with flavonoid accumulation by upregulating CHS in Arabidopsis root galls (PÄSold et al., 2010). In this study, the abundances of ABA and IAA, and the mRNA levels of ABF, GER, BIG, CAND1, LAX3 and GH3.1, which are involved in ABA and IAA signaling and metabolism, were significantly downregulated in HS compared to LS. These results indicate that the downregulation of ABA and IAA, along with the lower expression of genes participating in ABA and IAA signaling and metabolism, play vital roles in limiting flavonoid biosynthesis, thus contributing to higher shikimic acid accumulation in HS than that in LS.
4.3 Transcription factors play an important role in regulating shikimic acid accumulation
In this study, the most abundant TFs belonged to the MYB family members (Figure 5a). Furthermore, in the co-expression network (Figure 5c), four TFs—MYB6, ZP1, RAP2.11, and MTERF34—exhibited the most connections with key structural genes, suggesting their potential regulatory roles in regulating shikimic acid biosynthesis and downstream metabolism. Previous studies have revealed that MYBs, C2H2s and ERFs play key roles in regulating flavonoid biosynthesis (Li et al., 2024a), probably affecting the shikimic acid concentration in G. biloba leaves. For instance, overexpression of MYB6 brings about upregulation of DFR2, resulting in larger concentrations of anthocyanin and proanthocyanidins in poplar (Wang et al., 2019). As a C2H2 family member, ZAT could regulate flavonoid biosynthesis by interacting with the promoter regions of genes involved in flavonoid biosynthesis, such as CHS in Macadamia integrifolia under high temperature stress (Yang et al., 2023). AP2/ERF transcription factors can directly target the key genes in the flavonoid biosynthesis pathway, thereby regulating the synthesis of flavonoid in Solanum lycopersicum and Citrus (Zhao et al., 2020; Cao et al., 2024). These results suggest that TFs play key roles in regulating shikimic acid downstream metabolism, thus bringing about higher shikimic acid accumulation in HS than that in LS.
5 Conclusion
Taken together, compared to LS, HS exhibited significantly higher concentration of shikimic acid but lower levels of downstream aromatic amino acids and flavonoids. Correspondingly, a number of metabolites and genes that are related to biosynthesis and downstream metabolic partitioning of shikimic acid were significantly differentially regulated. For instance, the mRNA levels of MDH and RPI, that are involved in shikimic acid biosynthesis, were higher in HS vs. LS. The abundances of luteolin and dihydromyricetin and the mRNA levels of CHS and F3H, that are implicated in downstream metabolism of shikimic acid, were lower in HS vs. LS. The abundances of ABA and IAA in HS were lower than those in LS. Moreover, 28 transcription factors, such as ERFs, C2H2s and MYBs that play roles in accumulation of shikimic acid were identified. These results suggest that metabolites and structural genes involved in biosynthesis and downstream metabolism of shikimic acids, and ABA, IAA and transcript factors play key roles in shikimic acid accumulation in G. biloba leaves.
Data availability statement
The datasets presented in this study can be found in online repositories. The names of the repository/repositories and accession number(s) can be found in the article/Supplementary Material. The sequencing data have been deposited in GSA and are publicly available under accession number CRA025492.
Author contributions
WY: Writing – original draft, Data curation, Investigation, Methodology, Software, Resources, Supervision. MC: Data curation, Investigation, Methodology, Software, Visualization, Writing – original draft. CY: Data curation, Investigation, Methodology, Writing – original draft. WW: Data curation, Investigation, Methodology, Writing – original draft. HL: Conceptualization, Supervision, Writing – review & editing.
Funding
The authors declare financial support was received for the research and/or publication of this article. This work was financially supported by the central non-profit research institution of the Chinese Academy of Forestry (grant number CAFYBB2021MA008), the National Key Research and Development Program of China (No.2024YFD2200305) and the China Scholarship Council (202308320181).
Acknowledgments
We sincerely thank Ms. Shuqing Zhang from Nanjing Forestry University for her valuable suggestions about analyzing omics-data.
Conflict of interest
The authors declare that the research was conducted in the absence of any commercial or financial relationships that could be construed as a potential conflict of interest.
Generative AI statement
The author(s) declare that no Generative AI was used in the creation of this manuscript.
Publisher’s note
All claims expressed in this article are solely those of the authors and do not necessarily represent those of their affiliated organizations, or those of the publisher, the editors and the reviewers. Any product that may be evaluated in this article, or claim that may be made by its manufacturer, is not guaranteed or endorsed by the publisher.
Supplementary material
The Supplementary Material for this article can be found online at: https://www.frontiersin.org/articles/10.3389/fpls.2025.1631197/full#supplementary-material
Supplementary Table 1 | Primers used for RT-qPCR.
Supplementary Table 2 | Identified metabolites in G. biloba leaves.
Supplementary Table 3 | The significantly differentially abundant metabolites (DAMs).
Supplementary Table 4 | Summary of RNA-sequencing reads.
Supplementary Table 5 | The significantly differentially expressed genes (DEGs).
Supplementary Table 6 | Candidate TFs involved in shikimic acid biosynthesis and metabolism.
Supplementary Table 7 | Correlation analysis between TFs and structural genes.
Supplementary Figure 1 | Volcano plots and KEGG enrichment analysis of DAMs.
Supplementary Figure 2 | The validation of DEGs by RT-qPCR.
Supplementary Figure 3 | DEGs involved in abscisic acid and auxin metabolism.
Supplementary Figure 4 | Simplified shikimic acid biosynthetic and downstream metabolic pathways.
References
Al-Amri, S. M. (2013). Improved growth, productivity and quality of tomato (Solanum lycopersicum L.) plants through application of shikimic acid. Saudi J. Biol. Sci. 20, 339–345. doi: 10.1016/j.sjbs.2013.03.002
An, Z., Yang, Z., Zhou, Y., Huo, S., Zhang, S., Wu, D., et al. (2024). OsJRL negatively regulates rice cold tolerance via interfering phenylalanine metabolism and flavonoid biosynthesis. Plant Cell Environ. 47, 4071–4085. doi: 10.1111/pce.15005
Bilal, M., Wang, S., Iqbal, H. M. N., Zhao, Y., Hu, H., Wang, W., et al. (2018). Metabolic engineering strategies for enhanced shikimate biosynthesis: current scenario and future developments. Appl. Microbiol. Biotechnol. 102, 7759–7773. doi: 10.1007/s00253-018-9222-z
Bochkov, D. V., Sysolyatin, S. V., Kalashnikov, A. I., and Surmacheva, I. A. (2011). Shikimic acid: review of its analytical, isolation, and purification techniques from plant and microbial sources. J. Chem. Biol. 5, 5–17. doi: 10.1007/s12154-011-0064-8
Botella, M. B., González, R. E., Minguillón, C., Della Gaspera, P. G., Wuilloud, R. G., and Quintas, P. Y. (2023). Direct determination of tyrosine and tryptophane enantiomers in pumpkin (Cucurbita moschata) by HPLC-UV/Vis: Effect of cooking treatment on enantiomers profile. J. Food Composition Anal. 122, 105469. doi: 10.1016/j.jfca.2023.105469
Candeias, N. R., Assoah, B., and Simeonov, S. P. (2018). Production and synthetic modifications of shikimic acid. Chem. Rev. 118, 10458–10550. doi: 10.1021/acs.chemrev.8b00350
Cao, Y., Mei, Y., Zhang, R., Zhong, Z., Yang, X., Xu, C., et al. (2024). Transcriptional regulation of flavonol biosynthesis in plants. Hortic. Res. 11, uhae043. doi: 10.1093/hr/uhae043
Chuang, H.-w., Zhang, W., and Gray, W. M. (2004). Arabidopsis ETA2, an apparent ortholog of the human cullin-interacting protein CAND1, is required for auxin responses mediated by the SCFTIR1 ubiquitin ligase. Plant Cell 16, 1883–1897. doi: 10.1105/tpc.021923
Crane, P. R. (2018). An evolutionary and cultural biography of ginkgo. Plants People Planet 1, 32–37. doi: 10.1002/ppp3.7
Cui, J., Li, X., Gan, Q., Lu, Z., Du, Y., Noor, I., et al. (2025). Flavonoids mitigate nanoplastic stress in ginkgo biloba. Plant Cell Environ. 48, 1790–1811. doi: 10.1111/pce.15247
Díaz-Quiroz, D. C., Cardona-Félix, C. S., Viveros-Ceballos, J. L., Reyes-González, M. A., Bolívar, F., Ordoñez, M., et al. (2018). Synthesis, biological activity and molecular modelling studies of shikimic acid derivatives as inhibitors of the shikimate dehydrogenase enzyme of Escherichia coli. J. Enzyme Inhibition Medicinal Chem. 33, 397–404. doi: 10.1080/14756366.2017.1422125
Dong, N. Q. and Lin, H. X. (2021). Contribution of phenylpropanoid metabolism to plant development and plant–environment interactions. J. Integr. Plant Biol. 63, 180–209. doi: 10.1111/jipb.13054
Du, W., Yang, J., Li, Q., Jiang, W., and Pang, Y. (2024). Medicago truncatula β-glucosidase 17 contributes to drought and salt tolerance through antioxidant flavonoid accumulation. Plant Cell Environ. 47, 3076–3089. doi: 10.1111/pce.14928
Eloy, N. B., Voorend, W., Lan, W., Saleme, M. L., Cesarino, I., Vanholme, R., et al. (2017). Silencing CHALCONE SYNTHASE in maize impedes the incorporation of tricin into lignin and increases lignin content. Plant Physiol. 173, 998–1016. doi: 10.1104/pp.16.01108
Faria, J., Loureiro, I., Santarém, N., Cecílio, P., Macedo-Ribeiro, S., Tavares, J., et al. (2016). Disclosing the essentiality of ribose-5-phosphate isomerase B in Trypanosomatids. Sci. Rep. 6, 26937. doi: 10.1038/srep26937
Gandhi, G. R., Vasconcelos, A. B. S., Antony, P. J., Montalvão, M. M., de Franca, M. N. F., Hillary, V. E., et al. (2023). Natural sources, biosynthesis, biological functions, and molecular mechanisms of shikimic acid and its derivatives. Asian Pacific J. Trop. Biomedicine 13, 139–147. doi: 10.4103/2221-1691.374230
Gil, P., Dewey, E., Friml, J., Zhao, Y., Snowden, K. C., Putterill, J., et al. (2001). BIG: a calossin-like protein required for polar auxin transport in Arabidopsis. Genes Dev. 15, 1985–1997. doi: 10.1101/gad.905201
Gu, P., Fan, X., Liang, Q., Qi, Q., and Li, Q. (2017). Novel technologies combined with traditional metabolic engineering strategies facilitate the construction of shikimate-producing Escherichia coli. Microbial Cell Factories 16, 167–175. doi: 10.1186/s12934-017-0773-y
Guan, R., Zhao, Y., Zhang, H., Fan, G., Liu, X., Zhou, W., et al. (2016). Draft genome of the living fossil Ginkgo biloba. Gigascience 5, 49–62. doi: 10.1186/s13742-016-0154-1
Herrmann, K. M. and Weaver, L. M. (1999). THE SHIKIMATE PATHWAY. Annu. Rev. Plant Biol. 50, 473–503. doi: 10.1146/annurev.arplant.50.1.473
Hong, G., Zhang, X., li, L., He, Y., Zhao, Y., Tao, H., et al. (2023). The CsHSFA-CsJAZ6 module mediated high temperature regulates flavonoid metabolism in Camellia sinensis. Plant Cell Environ. 46, 2401–2418. doi: 10.22541/au.167300475.57854356/v1
Jeong, S. T., Goto-Yamamoto, N., Kobayashi, S., and Esaka, M. (2004). Effects of plant hormones and shading on the accumulation of anthocyanins and the expression of anthocyanin biosynthetic genes in grape berry skins. Plant Sci. 167, 247–252. doi: 10.1016/j.plantsci.2004.03.021
Joubert, J., Sivparsad, B., Schröder, M., Germishuizen, I., Chen, J., Hurley, B., et al. (2023). Susceptibility of Eucalyptus trees to defoliation by the Eucalyptus snout beetle, Gonipterus sp. n. 2, is enhanced by high foliar contents of 1,8-cineole, oxalic acid and sucrose and low contents of palmitic and shikimic acid. Plant Cell Environ. 46, 3481–3500. doi: 10.1111/pce.14696
Kancharla, P. K., Doddi, V. R., Kokatla, H., and Vankar, Y. D. (2009). A concise route to (–)-shikimic acid and (–)-5-epi-shikimic acid, and their enantiomers via Barbier reaction and ring-closing metathesis. Tetrahedron Lett. 50, 6951–6954. doi: 10.1016/j.tetlet.2009.09.111
Kasahara, H., Hayashi, K.-I., Cook, S. D., Tanaka, K., and Aoi, Y. (2020). GH3 auxin-amido synthetases alter the ratio of indole-3-acetic acid and phenylacetic acid in arabidopsis. Plant Cell Physiol. 61, 596–605. doi: 10.1093/pcp/pcz223
Kougan, G. B., Tabopda, T., Kuete, V., and Verpoorte, R. (2013). “Simple Phenols, Phenolic Acids, and Related Esters from the Medicinal Plants of Africa,” in Medicinal Plant Research in Africa, (Amsterdam, Netherlands: Elsevier) 225–249.
Kruger, N. J. and von Schaewen, A. (2003). The oxidative pentose phosphate pathway: structure and organisation. Curr. Opin. Plant Biol. 6, 236–246. doi: 10.1016/S1369-5266(03)00039-6
Kulić, Ž., Lehner, M. D., and Dietz, G. P. H. (2022). Ginkgo biloba leaf extract EGb 761® as a paragon of the product by process concept. Front. Pharmacol. 13. doi: 10.3389/fphar.2022.1007746
Kulić, Ž., Wolff, J., Wilhelm, E., Schüler, V., Röck, B., and Butterer, A. (2023). Sourcing shikimic acid from waste streams of ginkgo biloba leaf extract production. ACS Sustain. Chem. Eng. 11, 4943–4947. doi: 10.1021/acssuschemeng.3c00585
Li, Z., Guan, L., Zhang, C., Zhang, S., Liu, Y., Lu, Y., et al. (2024b). Nitrogen assimilation genes in poplar: Potential targets for improving tree nitrogen use efficiency. Ind. Crops Products 216, 118705. doi: 10.1016/j.indcrop.2024.118705
Li, J., Li, Y., Du, M., Zang, D., Men, Q., Su, P., et al. (2024a). Exogenous melatonin improves drought stress tolerance via regulating tryptophan metabolism and flavonoid biosynthesis pathways in wheat. Physiologia Plantarum 176, e70006. doi: 10.1111/ppl.70006
Liu, T., Zhou, T., Lian, M., Liu, T., Hou, J., Ijaz, R., et al. (2019). Genome-wide identification and characterization of the AREB/ABF/ABI5 subfamily members from solanum tuberosum. Int. J. Mol. Sci. 20. doi: 10.3390/ijms20020311
Lu, Y., Deng, S., Li, Z., Wu, J., Liu, Q., Liu, W., et al. (2019). Competing endogenous RNA networks underlying anatomical and physiological characteristics of poplar wood in acclimation to low nitrogen availability. Plant Cell Physiol. 60, 2478–2495. doi: 10.1093/pcp/pcz146
Lu, Y., Deng, S., Li, Z., Wu, J., Zhu, D., Shi, W., et al. (2022). Physiological characteristics and transcriptomic dissection in two root segments with contrasting net fluxes of ammonium and nitrate of poplar under low nitrogen availability. Plant Cell Physiol. 63, 30–44. doi: 10.1093/pcp/pcab137
Lu, Y., Xiang, P., Zhang, S., Lu, Z., Zhou, Z., Yin, Y., et al. (2023). Physiological and transcriptional regulation in Taxodium hybrid ‘Zhongshanshan’ leaves in acclimation to prolonged partial submergence. Planta 258, 66–83. doi: 10.1007/s00425-023-04225-w
Lu, Y., Zhang, S., Xiang, P., Yin, Y., Yu, C., Hua, J., et al. (2024). Integrated small RNA, transcriptome and physiological approaches provide insight into Taxodium hybrid ‘Zhongshanshan’ roots in acclimation to prolonged flooding. Tree Physiol. 44, 1–20. doi: 10.1093/treephys/tpae031
Maeda, H. and Dudareva, N. (2012). The shikimate pathway and aromatic amino acid biosynthesis in plants. Annu. Rev. Plant Biol. 63, 73–105. doi: 10.1146/annurev-arplant-042811-105439
Marchiosi, R., Ferro, A. P., Ramos, A. V. G., Baldoqui, D. C., Constantin, R. P., Constantin, R. P., et al. (2019). Calophyllum brasiliense Cambess: An alternative and promising source of shikimic acid. Sustain. Chem. Pharm. 14, 100188. doi: 10.1016/j.scp.2019.100188
Marco-Ramell, A., Palau-Rodriguez, M., Alay, A., Tulipani, S., Urpi-Sarda, M., Sanchez-Pla, A., et al. (2018). Evaluation and comparison of bioinformatic tools for the enrichment analysis of metabolomics data. BMC Bioinf. 19 , 1–11. doi: 10.1186/s12859-017-2006-0
Martin, E., Duke, J., Pelkki, M., Clausen, E. C., and Carrier, D. J. (2010). Sweetgum (Liquidambar styraciflua L.): extraction of shikimic acid coupled to dilute acid pretreatment. Appl. Biochem. Biotechnol. 162, 1660–1668. doi: 10.1007/s12010-010-8947-7
Park, S., Lee, K., Kim, Y. S., Chi, Y. T., Shin, J. S., and Back, K. (2012). Induced tyramine overproduction in transgenic rice plants expressing a rice tyrosine decarboxylase under the control of methanol-inducible rice tryptophan decarboxylase promoter. Bioprocess Biosyst. Eng. 35, 205–210. doi: 10.1007/s00449-011-0615-y
PÄSold, S., Siegel, I. N. A., Seidel, C., and Ludwig-MÜLler, J. (2010). Flavonoid accumulation in Arabidopsis thaliana root galls caused by the obligate biotrophic pathogen Plasmodiophora brassicae. Mol. Plant Pathol. 11, 545–562. doi: 10.1111/j.1364-3703.2010.00628.x
Quan, N., Nie, L., Shi, X., Zhu, R., and Lü, X. (2012). Novel and efficient syntheses of four useful shikimate-derived epoxy chiral building blocks via cyclic sulfite intermediates. Chin. J. Chem. 30, 2759–2766. doi: 10.1002/cjoc.201201000
Ramazani, A., Shahkarami, F., Zarei, A., Rezayati, S., Rezaei, A., Bodaghi, A., et al. (2021). Shikimic acid from staranise (Illicium verum Hook): Extraction, purification and determination. Eurasian Chem. Commun. 3, 452–460. doi: 10.22034/ecc.2021.285563.1176
Rawat, G., Tripathi, P., and Saxena, R. K. (2013). Expanding horizons of shikimic acid. Appl. Microbiol. Biotechnol. 97, 4277–4287. doi: 10.1007/s00253-013-4840-y
Rozova, O., Khmelenina, V., Bocharova, K., Mustakhimov, I., and Trotsenko, Y. (2015). Role of NAD+-Dependent Malate Dehydrogenase in the Metabolism of Methylomicrobium alcaliphilum 20Z and Methylosinus trichosporium OB3b. Microorganisms 3, 47–59. doi: 10.3390/microorganisms3010047
Shende, V. V., Bauman, K. D., and Moore, B. S. (2024). The shikimate pathway: gateway to metabolic diversity. Natural Product Rep. 41, 604–648. doi: 10.1039/d3np00037k
Stover, C. K., Pham, X. Q. T., Erwin, A. L., Mizoguchi, S. D., and Olson, M. V. (2000). Complete genome sequence of Pseudomonas aeruginosa PAO1, an opportunisticpathogen. Nature 406, 959–964. doi: 10.1038/35023079
Tripathi, P., Rawat, G., Yadav, S., and Saxena, R. K. (2014). Shikimic acid, a base compound for the formulation of swine/avian flu drug: statistical optimization, fed-batch and scale up studies along with its application as an antibacterial agent. Antonie van Leeuwenhoek 107, 419–431. doi: 10.1007/s10482-014-0340-z
Tzin, V., Malitsky, S., Zvi, M. M. B., Bedair, M., Sumner, L., Aharoni, A., et al. (2012). Expression of a bacterial feedback-insensitive 3-deoxy-d-arabino-heptulosonate 7-phosphate synthase of the shikimate pathway in Arabidopsis elucidates potential metabolic bottlenecks between primary and secondary metabolism. New Phytol. 194, 430–439. doi: 10.1111/j.1469-8137.2012.04052.x
Wang, L., Lu, W., Ran, L., Dou, L., Yao, S., Hu, J., et al. (2019). R2R3-MYB transcription factor MYB6 promotes anthocyanin and proanthocyanidin biosynthesis but inhibits secondary cell wall formation in Populus tomentosa. Plant J. 99, 733–751. doi: 10.1111/tpj.14364
Wang, J., Shen, X., Rey, J., Yuan, Q., and Yan, Y. (2017). Recent advances in microbial production of aromatic natural products and their derivatives. Appl. Microbiol. Biotechnol. 102, 47–61. doi: 10.1007/s00253-017-8599-4
Wu, S., Chen, W., Lu, S., Zhang, H., and Yin, L. (2022). Metabolic engineering of shikimic acid biosynthesis pathway for the production of shikimic acid and its branched products in microorganisms: advances and prospects. Molecules 27, 47799. doi: 10.3390/molecules27154779
Xiang, P., Yu, W., Li, L., Zhang, S., Yu, C., Yin, Y., et al. (2024). Dissecting lncRNA-mRNA networks underlying physiological alterations in Taxodium hybrid ‘Zhongshanshan’ leaves in acclimation to prolonged partial submergence. Ind. Crops Products 218, 119008. doi: 10.1016/j.indcrop.2024.119008
Xie, J. Y., Lan, J. F., Yu, L., and Wu, C. M. (2012). Study on extraction of shikimic acid from pine needles of pinus elliottii engelm by means of microwave pretreatment. Advanced Materials Res. 455-456, 752–759. doi: 10.4028/www.scientific.net/AMR.455-456.752
Yang, W., Xu, H., Xiao, Q., Li, X., and Shao, Q. (2023). Combined analysis of metabolome and transcriptome provides insights into metabolisms of chlorophylls, carotenoids, and flavonoids in the yellowing leaves of ‘HAES344’ macadamia. Scientia Hortic. 308, 111600. doi: 10.1016/j.scienta.2022.111600
Yao, X., Shang, E., Zhou, G., Tang, Y., Guo, S., Su, S., et al. (2012). Comparative characterization of total flavonol glycosides and terpene lactones at different ages, from different cultivation sources and genders of Ginkgo biloba leaves. International J. Mol. Sci. 13, 10305–10315. doi: 10.3390/ijms130810305
Yu, W., Cai, J., Liu, H., Lu, Z., Hu, J., and Lu, Y. (2021). Transcriptomic analysis reveals regulatory networks for osmotic water stress and rewatering response in the leaves of ginkgo biloba. Forests 12, 1705–1723. doi: 10.3390/f12121705
Yu, W., Gong, F., Xu, H., and Zhou, X. (2024). Molecular mechanism of exogenous ABA to enhance UV-B resistance in rhododendron chrysanthum pall. by modulating flavonoid accumulation. Int. J. Mol. Sci. 25, 5248–5273. doi: 10.3390/ijms25105248
Yu, W., Liu, H., Luo, J., Zhang, S., Xiang, P., Wang, W., et al. (2022). Partial root-zone simulated drought induces greater flavonoid accumulation than full root-zone simulated water deficiency in the leaves of Ginkgo biloba. Environ. Exp. Bot. 201, 104998. doi: 10.1016/j.envexpbot.2022.104998
Zelaya, I. A., Anderson, J. A. H., Owen, M. D. K., and Landes, R. D. (2011). Evaluation of spectrophotometric and HPLC methods for shikimic acid determination in plants: models in glyphosate-resistant and -susceptible crops. J. Agric. Food Chem. 59, 2202–2212. doi: 10.1021/jf1043426
Zhang, S., Yu, W., Lu, Z., Xiang, P., Wang, Z., Hua, J., et al. (2023). Hibiscus hamabo Rootstock-Grafting Improves Photosynthetic Capacity of Hibiscus Syriacus under Salt Stress. Forests 14, 1226–1241. doi: 10.3390/f14061226
Zhao, C., Liu, X., Gong, Q., Cao, J., Shen, W., Yin, X., et al. (2020). Three AP2/ERF family members modulate flavonoid synthesis by regulating type IV chalcone isomerase in citrus. Plant Biotechnol. J. 19, 671–88. doi: 10.1111/pbi.13494
Zhao, Y., Paule, J., Fu, C., and Koch, M. A. (2010). Out of China: Distribution history of Ginkgo biloba L. Taxon 59, 495–504. doi: 10.1002/tax.592014
Keywords: shikimic acid, ginkgo, flavonoid, metabolome, transcriptome, transcription factor
Citation: Yu W, Cai M, You C, Wei W and Liu H (2025) Metabolomic and transcriptomic analyses unveil the accumulation of shikimic acid in the leaves of Ginkgo biloba. Front. Plant Sci. 16:1631197. doi: 10.3389/fpls.2025.1631197
Received: 19 May 2025; Accepted: 24 July 2025;
Published: 22 August 2025.
Edited by:
Hidenobu Uchida, Nagoya Bunri University, JapanReviewed by:
Yuko Hanba, Kyoto Institute of Technology, JapanMasaya Satoh, Tokushima University, Japan
Copyright © 2025 Yu, Cai, You, Wei and Liu. This is an open-access article distributed under the terms of the Creative Commons Attribution License (CC BY). The use, distribution or reproduction in other forums is permitted, provided the original author(s) and the copyright owner(s) are credited and that the original publication in this journal is cited, in accordance with accepted academic practice. No use, distribution or reproduction is permitted which does not comply with these terms.
*Correspondence: Huimin Liu, bHVja3lsaXVobUAxNjMuY29t
†These authors have contributed equally to this work