 Yu Zheng†
 Huifang Yao
- Forestry College, Inner Mongolia Agricultural University, Hohhot, China
Grazing is the primary use of grassland in Xinjiang and plays a key role in the grassland ecosystem. Grazing intensity has a profound impact on the healthy development of grassland. To date, we lack a comprehensive understanding of the overall response of the main types of grassland in Xinjiang to different intensities of grazing. Based on 73 peer-reviewed studies, we conducted a meta-analysis of the response of soil properties and community vegetation characteristics to grazing intensity in five main types of grassland in Xinjiang. The results showed the following: (1) Grazing reduced the soil total carbon (TC) and total potassium (TK) of grassland soil in Xinjiang and increased the content of available phosphorus (AP) in soil. Moderate grazing reduced the soil TC and increased the total nitrogen (TN). Heavy grazing significantly reduced soil organic carbon (SOC) and density (P < 0.05). (2) The SOC of temperate meadow steppe decreased significantly under moderate and heavy grazing, and the three grazing intensities significantly reduced the biomass carbon storage of living plants and litter carbon storage (P < 0.05). (3) Soil pH and AP in temperate steppe increased significantly under light grazing, and soil bulk density (BD) and total phosphorus (TP) increased significantly under heavy grazing (P < 0.05). (4) The soil water content (SWC) and pH of temperate desert steppe decreased significantly under moderate grazing. Heavy grazing increased soil BD. Light grazing increased pH and available nitrogen (AN), and decreased soil TN, TP, and TK (P < 0.05). (5) The soil organic matter of mountain meadow increased significantly under light and moderate grazing. Light grazing reduced aboveground and underground standing crop and root-shoot ratio, and increased carbon storage (P < 0.05). (6) Under heavy grazing, SWC and total biomass in alpine meadow decreased significantly, whereas pH, AN, and AP increased significantly. Soil BD decreased significantly under light and moderate grazing (P < 0.05). The structural equation model showed that the increase in grazing intensity would reduce the vegetation coverage of the community and thus would reduce species diversity. The increase in grazing intensity also had a significant negative effect on aboveground biomass and soil quality.
1 Introduction
As an important part of the terrestrial biosphere, grassland accounts for 40% of its area (Scurlock and Hall, 1998). It not only provides a habitat for the diversity of animals and plants (Conant et al., 2001) but also contributes to the livelihood of more than 1 billion people around the world (Boval and Dixon, 2012). A stable grassland ecosystem provides an important material basis for the development of animal husbandry and the maintenance of terrestrial ecosystem balance (Buisson et al., 2022). The stability of the grassland ecosystem is affected by many factors, including vegetation, soil properties, climatic conditions, and human activities (Liu et al., 2019). Research has shown that overgrazing causes grassland ecosystem imbalance. Because of the bottleneck associated with the imbalance of grassland ecosystems in different regions and different types of grassland, the formulation of grazing measures according to local conditions can provide a scientific basis for the sustainable and stable development of grassland ecosystems (Conant et al., 2017). The grassland area in Xinjiang ranks third in China. This area is an important part of China’s grassland ecosystem and plays a key role in biodiversity conservation and the animal husbandry economy. Influenced by its distinct natural environment and landform, Xinjiang grassland has formed a variety of complex grassland types (Zhao and Jing, 2022). Because of global warming, rapid population growth, and a substantial increase in the number of livestock, Xinjiang grassland has experienced varying degrees of degradation and faces enormous challenges (Xu et al., 2022). In recent years, many studies have examined grassland degradation in Xinjiang, including grassland degradation and soil carbon composition and stability (Xu et al., 2022), characteristics and storage capacity of degraded grassland (Liu et al., 2013), sustainable development direction of degraded grassland (Kemp et al., 2020) and improvement measures (Liu et al., 2025).
Grazing is the primary way grassland is utilized, and its impact on grassland ecological diversity has always been the focus of ecological research (Herrero and Thornton, 2013). Litter in grasslands is closely related to vegetation and soil. Livestock feeding and other behaviors affect litter decomposition, change the soil’s physical and chemical properties and nutrient content, and then affect vegetation characteristics and community composition structure (Liu et al., 2008). Different grazing intensities have different effects on the physical and chemical properties of soil. The trampling of sheep and goats in the Sahara region has led to the fragmentation of soil crusts, and the area of soil crusts has been reduced. Heavy grazing reduces the soil permeability index, and moderate grazing intensity increases soil permeability (Hiernaux et al., 1999). Kobayashi et al. (1997) found that grazing reduced soil moisture on the sunny slope but did not have a significant effect on soil moisture on the shady slope. The grazing intensity of alpine grassland in the northern foot of the Tianshan Mountains in China increased by 1, and the soil compaction increased by 1.13 times (Li et al., 1993). Because of increased grazing intensity, the excretion of livestock also increased, which created more nitrogen sources for grassland. The total nitrogen content of soil was much lower than that of heavy grazing in moderate and light grazing (Yan et al., 2014). After long-term continuous grazing, the total phosphorus in the soil increased, and the content of available phosphorus also increased (Xi et al., 2009). In the natural grassland of the agropastoral ecotone in the Songnen Plain, Wang and Sheng, (2012) found that the number of soil bacteria and fungi showed a single peak curve as grazing intensity increased, and the number of soil microorganisms was highest in moderate grazing. A study by Tan et al. (2015) in temperate meadow steppe showed that as grazing intensity increased, the soil microbial biomass and the number of bacteria decreased first and then increased. Zhang et al. (2000) showed that as grazing intensity increased, the height of the plant community decreased, the surface coverage decreased, the aboveground biomass decreased greatly, and the biomass of high-quality forage decreased rapidly. Fuhlendorf and Smeins (1999) pointed out significant differences in grassland biomass under different grazing treatments. Overgrazing not only affected the growth and biomass of various organs of the aboveground part of the herbage, but also inhibited the growth and biomass formation of the underground part of the root system, resulting in grassland degradation. The research to date on grazing intensity on grassland in Xinjiang has been concentrated primarily in Yili (Wu et al., 2024a) and the northern slope of the Tianshan Mountains (Zhang et al., 2023; Li et al., 2022). The research has focused mostly soil on properties (Wu et al., 2024a), vegetation (Sun et al., 2014), and community characteristics (Dong et al., 2016). No independent research has examined the effects of grazing intensity on soil properties and vegetation characteristics of different types of grassland in Xinjiang, thus arriving at a systematic conclusion.
Therefore, in this study, we focused on five primary grassland types in Xinjiang—temperate meadow steppe, temperate steppe, temperate desert steppe, mountain meadow, and alpine meadow—to investigate grazing impacts through meta-analysis. We synthesized peer-reviewed studies (published since 2000) examining the effects of grazing intensity on soil physicochemical properties, vegetation characteristics, and plant community structure. Our objectives were as follows: (1) to compare grazing impacts on soil and vegetation dynamics across these grassland types; (2) to assess whether increasing grazing pressure induced homogenization of soil properties and community characteristics (e.g., species richness, abundance) among types; and (3) to quantify the effects of defined grazing intensities—light grazing (three or less sheep units/ha), moderate grazing (four to six sheep units/ha), and heavy grazing (seven or more sheep units/ha)—on soil and community attributes within each type of grassland. The results of this research provide a theoretical foundation for sustainable grassland utilization and optimized conservation strategies in Xinjiang.
2 Materials and methods
2.1 Experimental area
The study area is located in the Xinjiang Autonomous Region in northwest China (34°25’–48°10’N, 73°40’–96°18’E), which is deep inland and far from the ocean. It has a temperate continental climate with a large temperature difference, sufficient sunshine (annual sunshine time is 2500–3500 h), reduced precipitation, and an annual average precipitation of about 150 mm. The precipitation varies significantly from place to place. The temperature in southern Xinjiang is higher than that in northern Xinjiang, and the precipitation in northern Xinjiang is higher than that in southern Xinjiang. The average temperature in January in Junggar Basin is –20°C; the average temperature in July in Turpan is 33°C.
2.2 Data collection
To construct a comprehensive database of grazing intensity effects on Xinjiang grasslands, we collected peer-reviewed publications from January 2000 to December 2024 using the Web of Science (http://apps.webofknowledge.com) and the China Knowledge Resource Integrated Database (http://www.cnki.net). The search term combinations were: “grazing or herbivory or fencing”, “Xinjiang grassland or Xinjiang grassland degradation”, and “grassland type”. Next, we screened the publications to identify appropriate studies based on the following criteria: (1) The selected article had to study the impact of grazing on grassland in Xinjiang. The study also had to provide the effects of grazing intensity, grazing mode, grassland degradation, and related variables on vegetation productivity, vegetation characteristics, plant productivity, diversity index, soil quality, carbon storage, and plant production. (2) The article had to provide information such as latitude and longitude coordinates, altitude, precipitation, test duration, and the degree of grassland degradation in the study area. (3) The article had to contain a control group (no grazing) and an experimental group (grazing), and data for the control group and the experimental group had to include sample size, mean, and standard deviation (SD) or standard error (SE). Some of the data could be directly extracted from the content and tables in the article, and some of the data in the figure needed to be extracted by using WebPlotDigitizer software. For data that provided only SE and sample size (n), we calculated the SD according to the following formula:
We identified 73 journal papers that met the noted criteria (Figure 1). For the grassland type division and distribution map, see reference Zhang et al. (2020a). The distribution of the 73 sample plots collected was as follows: 14 temperate meadow steppes, 7 temperate steppes, 16 temperate desert steppes, 22 mountain meadows, and 14 alpine meadows. After extracting the data and removing duplicates or statistically insignificant data from each study, we created a database containing 1876 groups was created. The main indicators were as follows: bulk density (BD), soil water content (SWC), total carbon (TC), soil organic carbon (SOC), organic carbon density (OCD), soil organic matter (SOM), total organic matter (TOM), pH, total nitrogen (TN), total phosphorus (TP), total potassium (TK), available nitrogen (AN), available phosphorus (AP), available potassium (AK), carbon-to-nitrogen ratio (C:N), carbon-to-phosphorus ratio (C:P), nitrogen-to-phosphorus ratio (N:P), community vegetation height (CVH), community vegetation cover (CVC), community vegetation density (CVD), root-to-stem ratio (R:S), total biomass (TB), aboveground biomass (AGB), belowground biomass (BGB), aboveground standing crop (ASC), belowground standing crop (BSC), Shannon–Wiener index (SWI), Simpson index (SI), Pielous index (PI), species richness (SR), Patrick index (PAI), Margalef index (MI), Chao index (CI), carbon storage in live grassland biomass (CSLGB), litter carbon storage (LCS), root carbon storage (RCS), total carbon storage (TCS), and dry matter (DM). We divided grazing intensity grading standards into three levels according to Reynaud and Lanzanova (2017), as shown in Table 1: light grazing, moderate grazing, and heavy grazing.
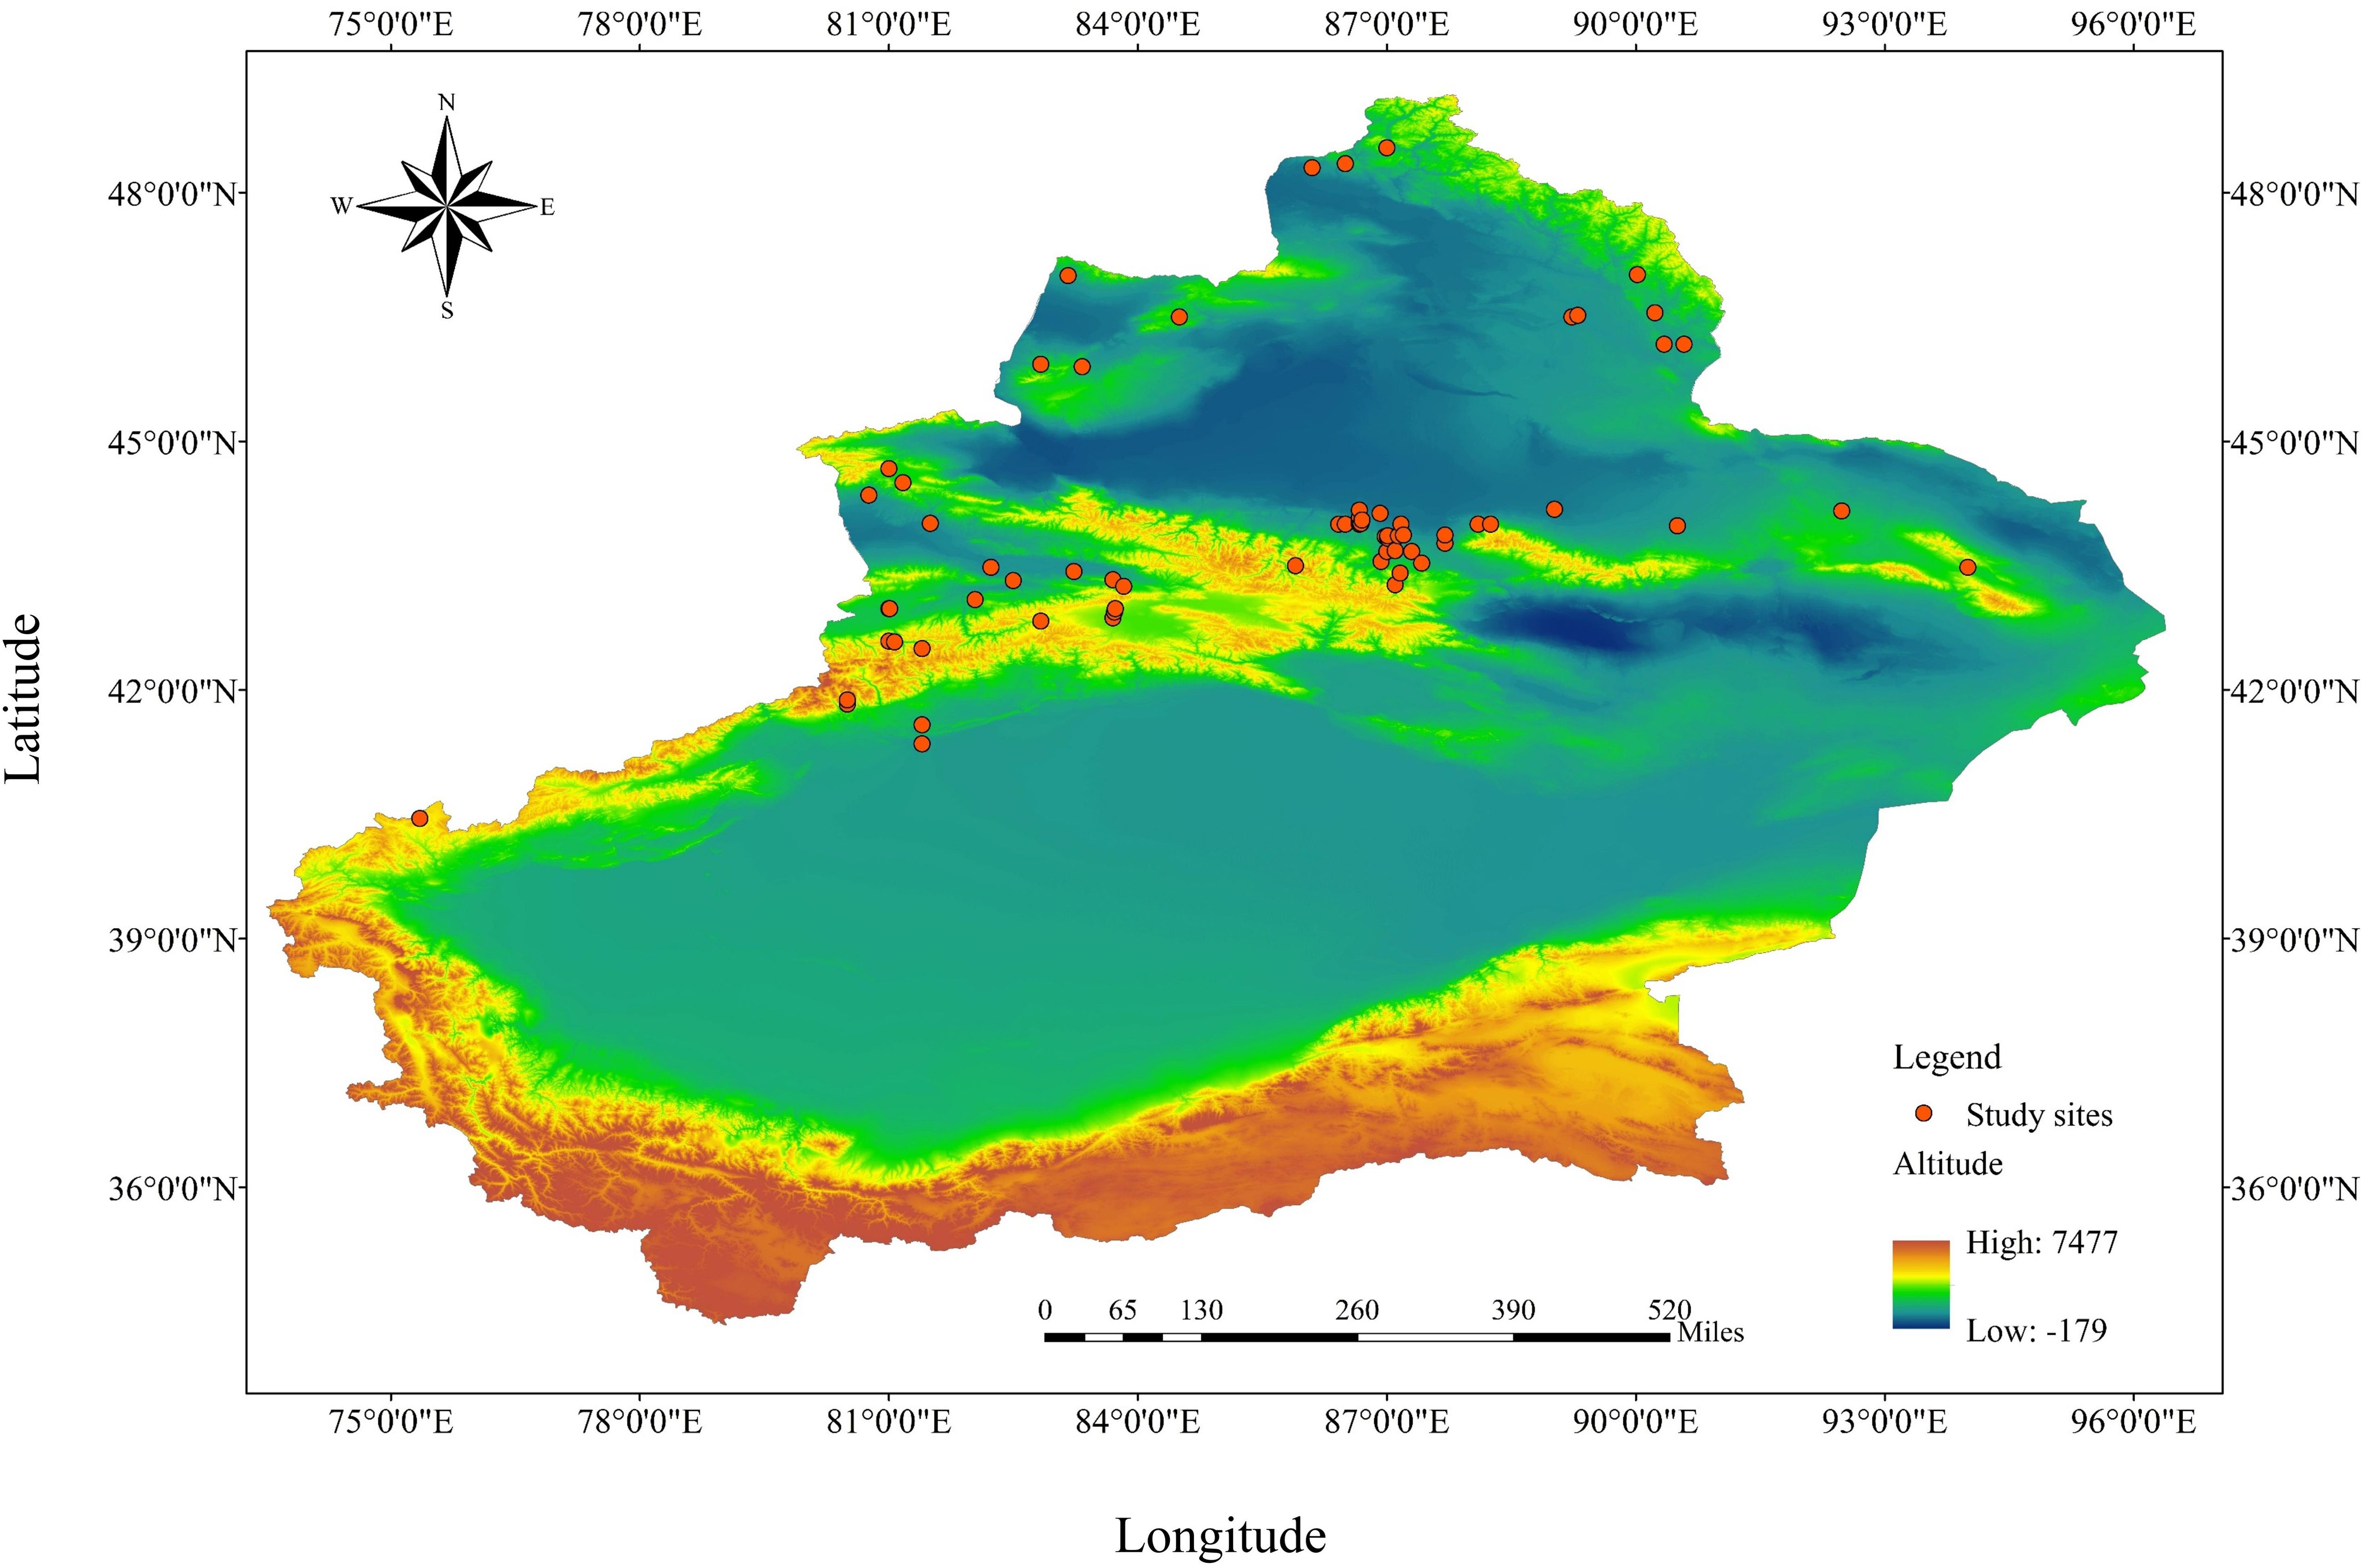
Figure 1. Location of study sites in the literature. The base map is made from the standard map of the Ministry of Natural Resources. The review number is GS (2023) 2767, and the map boundary is not modified.
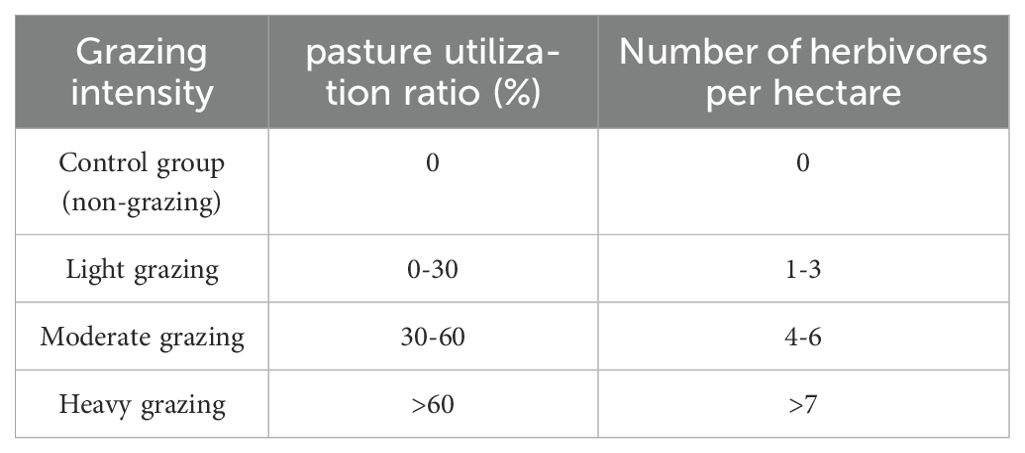
Table 1. Grazing intensity division standard.
2.3 Data analyses
In this paper, we used the response ratio (RR) of the natural logarithm proposed by Hedges et al. (1999) to evaluate the effects of grazing intensity on soil physical and chemical properties and vegetation community characteristics of various grassland types in Xinjiang. We defined RR as the natural logarithm of the ratio of the mean value of the index in the test group (Xe) to the mean value of the index in the control group (Xc). The calculation formula is as follows:
The variance (v) of the RR is calculated as follows:
In the formula, Ne and Nc are the sample sizes of the experimental group and the control group, respectively, and SDe and SDc are the standard deviations of the indicators in the experimental group and the control group, respectively. The weighting coefficient (w) of each response ratio is the reciprocal of the variance (v). The calculation formula is as follows:
To improve the accuracy of the study, we also calculated the average weighted response ratio (RR++) of each experimental group and the control group. The higher the accuracy of the study, the greater the weight assigned. The calculation formula is as follows:
In the formula, wij is the weighting coefficient of jth variable in i group, m is the number of groups, and k is the number of pairs of indicators in the i group (one value of the indicator in the experimental group is paired with one value of the target variable in the control group). The calculation formula of the weighted standard deviation is as follows:
We used the 95% confidence interval (CI) to test whether the weighted response ratio of the indicators to the treatment in the experimental group was significant. If the 95% CI overlapped with 0, the response ratio of the index was not significant; conversely, the response ratio of the indicator was significant (Xu et al., 2023). When the maximum value of the 95% CI was less than 0, this indicated that grazing had a significant negative effect on the effect value of typical grassland types in Xinjiang. If the minimum value of the 95% CI was greater than 0, this indicated that grazing had a significant positive effect on the effect value of typical grassland types in Xinjiang. The calculation formula is as follows:
We used the “Metafor” package in R 4.4.3 software to calculate the response ratio and 95% CI, and we used the “ggplot2” and “Forestplot” packages to draw the forest map. We selected some indices for a correlation analysis “Pearson” package. We established structural equation modeling (SEM) using the “lavaan” and “piecewiseSEM” packages to study the effects of grazing intensity on community species diversity (SWI, SI, PI and SR) and soil quality (SOC, TN, TP, TK, AN, AP, and AK.).
3 Results
3.1 Effects of grazing intensity on soil and community characteristics of grassland in Xinjiang
Grazing had significant negative effects on soil total carbon (TC) (−15.93% , the percentage of the response ratio, the same below), organic carbon density (OCD) (−14.4% ), soil total potassium (TK) (-7.06% ), community vegetation height (CVH) (−64.98% ), community vegetation coverage (CVC) (−32.5% ), community vegetation density (CVD) (−26.52% ), aboveground biomass (AGB) (−57.32% ), total biomass (TB) (−69.42% ), belowground biomass (BGB) (−16.91% ), aboveground standing crop (ASC) (−69.11% ), belowground standing crop (BSC) (85.66% ), carbon storage in live grassland biomass (CSLGB) (−56.68% ), litter carbon storage (LCS) (−46.29% ), Shannon-Wiener index (SWI) (−10.21% ), Simpson index (SI) (−8.36% ) and species richness (SR) (−16.82% ). We identified a significant positive effect on soil available phosphorus (AP) (11.85% ) and dry matter (DM) (0.61% ) (Figure 2).
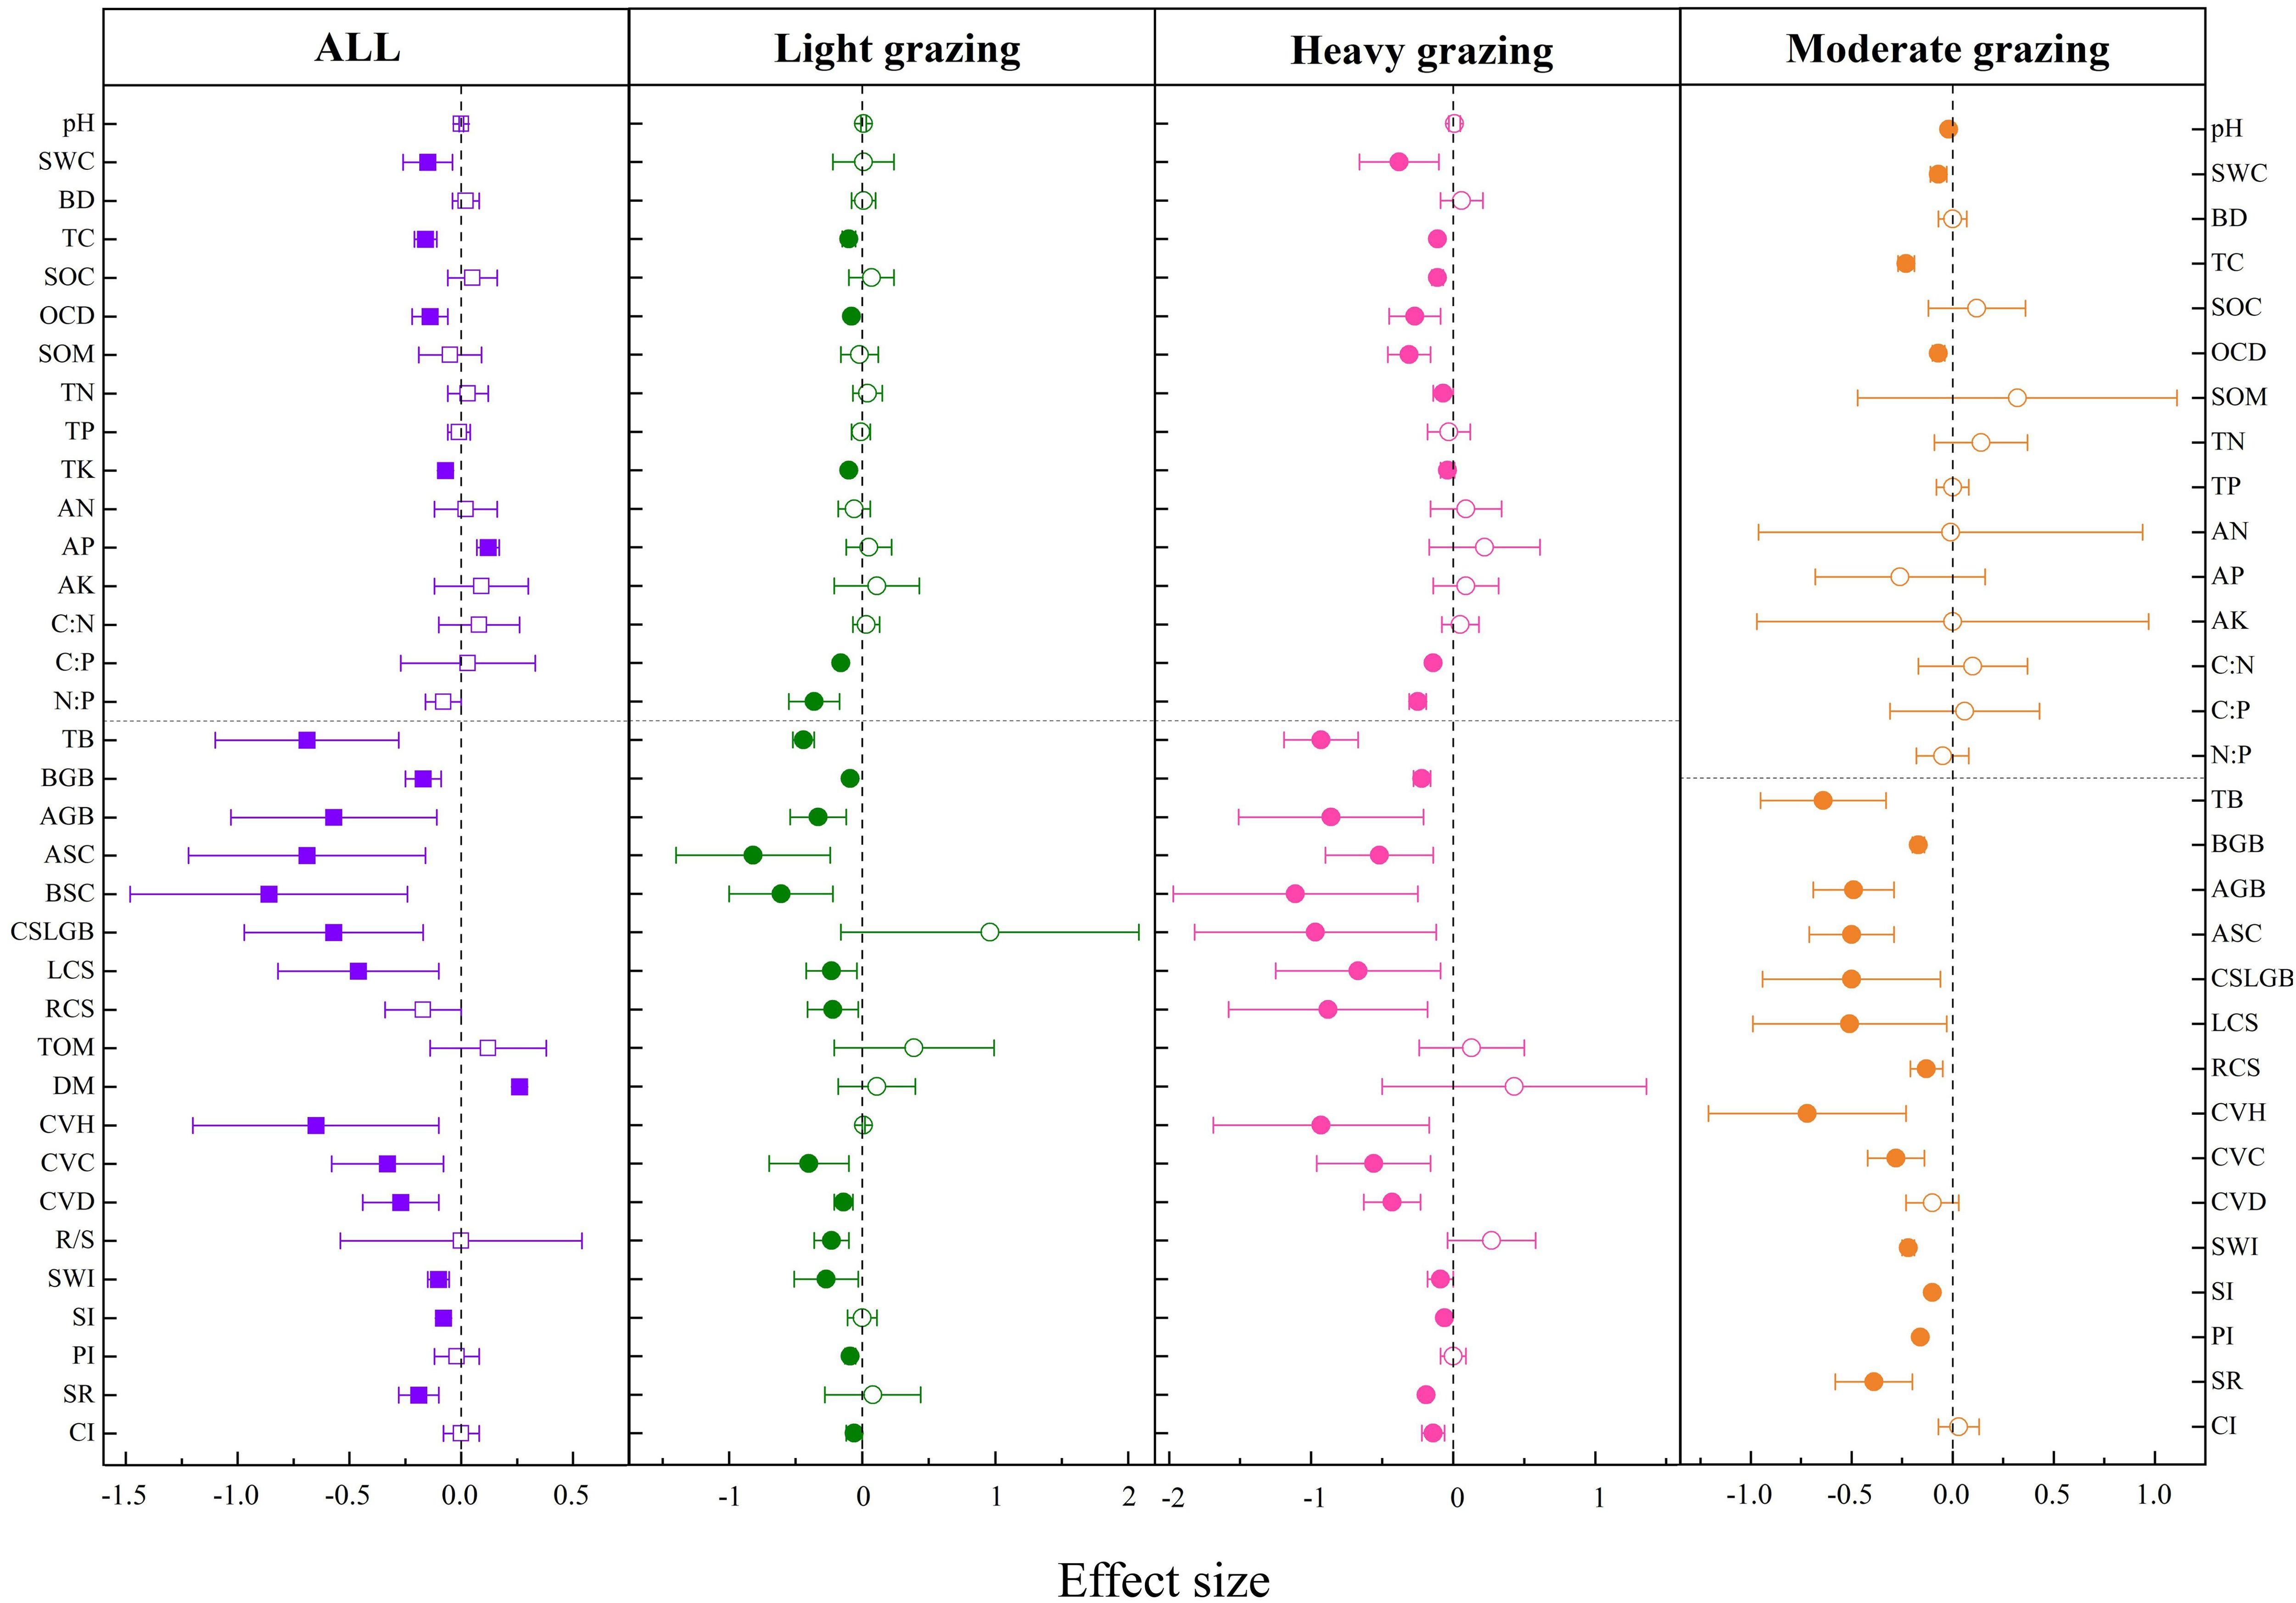
Figure 2. Effects of grazing and different intensities on soil and community indexes of grassland. pH, soil pH; SWC, soil water content; BD, bulk density; TC, total carbon; SOC, soil organic carbon; OCD, organic carbon density; SOM, soil organic matter; TN, total nitrogen; TP, total phosphorus; TK, total potassium; AN, available nitrogen; AP, available phosphorus; AK, available potassium; C:N, carbon-to-nitrogen ratio; C:P, carbon-to-phosphorus ratio; N:P, nitrogen-to-phosphorus ratio; TB, total biomass; BGB, belowground biomass; AGB, aboveground biomass; ASC, aboveground standing crop; BSC, belowground standing crop; TCS, total carbon storage; CSLGB, carbon storage in live grassland biomass; LCS, litter carbon storage; RCS, root carbon storage; TOM, total organic matter; DM, dry matter; CVH, community vegetation height; CVC, community vegetation coverage; CVD, community vegetation density; R/S, root-to-stem ratio; SWI, Shannon-Wiener index; SI, Simpson index; PI, Pielous index; SR, species richness; CI, Chao index. The solid representation has a significant effect, and the hollow representation has no significant effect. ”*“, “**”, and “***” are the significant codes of P (significance) < 0.05, P (significance) < 0.01, and P (significance) < 0.001 for the mean effect size, respectively.
As shown in Figure 2, compared with the control group (no grazing), soil TC decreased significantly by 10.21% and 23.25% in light and moderate grazing, respectively; SOC decreased significantly by 11.42% in heavy grazing; OCD decreased by 6.52% and 27.2% in moderate and heavy grazing, respectively; soil TN increased significantly by 14.24% in moderate grazing; soil TK decreased significantly by 10.01% in moderate grazing; and soil AP increased significantly by 21.97% in heavy grazing. C:P decreased significantly by 16.3% and 14.24% in light and heavy grazing, respectively, and N:P decreased significantly by 36.18% and 25.26% in light and heavy grazing, respectively. CVH decreased significantly by 39.87% , 72.06% , and 92.8% in the three grazing intensities. CVC decreased significantly by 13.51% , 27.82% , and 56.13% in the three grazing intensities. CVD was significantly reduced by 23.01% and 42.96% in light and heavy grazing, respectively. AGB decreased significantly by 32.92% , 49.25% , and 85.84% in the three grazing intensities. BGB was significantly reduced by 9.39% , 17.08% , and 22.4% in the three grazing intensities. TB was significantly reduced by 64.43% and 92.94% in moderate and heavy grazing, respectively. CSLGB was significantly reduced by 23.07% , 49.73% , and 97.45% in the three grazing intensities. LCS significantly decreased by 21.55% , 50.55% , and 66.95% in the three grazing intensities. RCS significantly increased by 39.23% in light grazing and significantly decreased by 87.74% in heavy grazing. SWI significantly decreased by 21.67% in moderate grazing, and SI significantly decreased by 9.67% in moderate grazing. PI decreased significantly by 16.09% in moderate grazing, and SR decreased significantly by 38.51% and 19% in moderate and heavy grazing, respectively, and CI decreased significantly by 13.68% in heavy grazing.
3.2 Effects of grazing intensity on soil and community characteristics of five primary grassland types in Xinjiang
3.2.1 Soil and community characteristics of temperate meadow steppe
Grazing had significant negative effects on SOC (−15.29% ), OCD (−14.4% ), CVH (−41.19% ± 0.0458), CVC (−16.87% ± 0.045), CVD (−11.6% ± 0.0367), AGB (−45.35% ± 0.0597), CSLGB (−56.68% ± 0.0849), LCS (−46.29% ± 0.0524), and RCS (−17.38% ± 0.1776) in temperate meadow steppe (Figure 3).
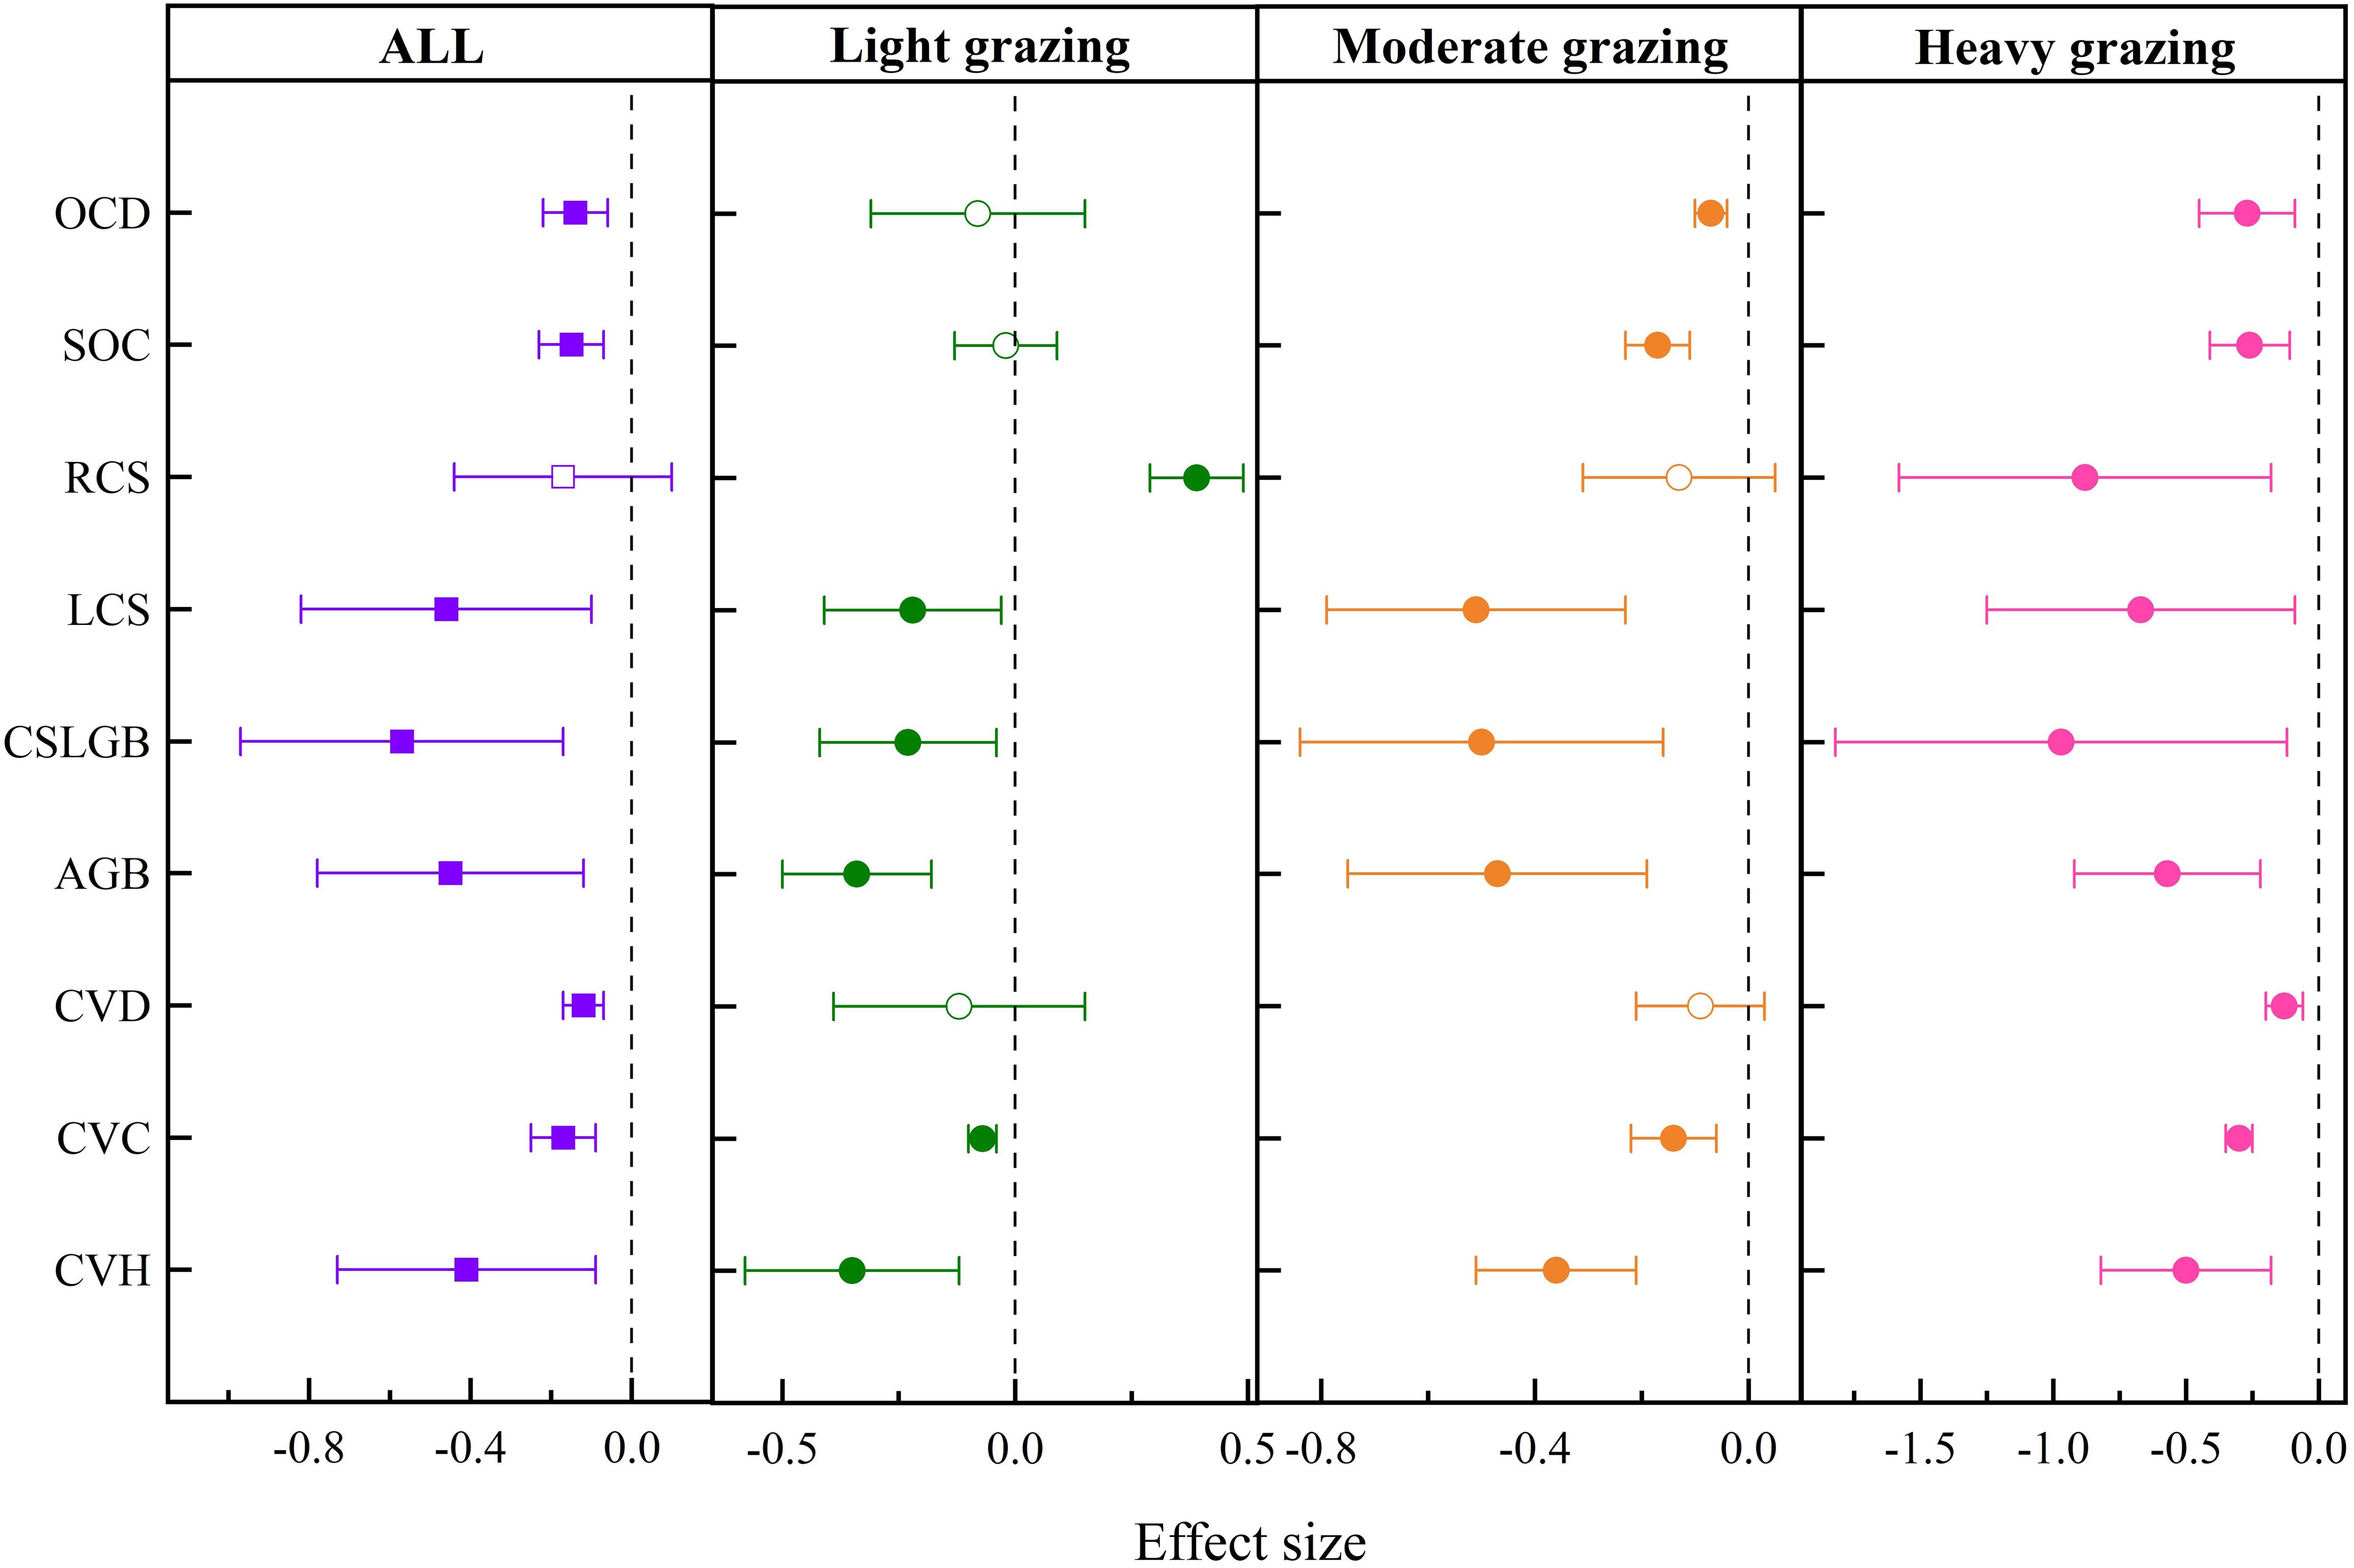
Figure 3. Response of soil and community characteristics to grazing intensity in temperate meadow steppe. OCD, organic carbon density; SOC, soil organic carbon; RCS, root carbon storage; LCS, litter carbon storage; CSLGB, carbon storage in live grassland biomass; AGB, aboveground biomass; CVD, community vegetation density; CVC, community vegetation coverage; CVH, community vegetation height. The solid representation has a significant effect, and the hollow representation has no significant effect.
As shown in Figure 3, compared with no grazing, SOC decreased by 17.32% and 25.76% , and OCD decreased by 6.52% and 27.2% in moderate and heavy grazing, respectively. CVH decreased significantly by 35.29% , 36.17% , and 50.14% in the three grazing intensities. CVC decreased significantly by 6.94% , 14.4% , and 29.95% in three grazing intensities. CVD decreased significantly by 12.54% in heavy grazing, and AGB decreased significantly by 34.09% , 46.64% , and 57.17% in the three grazing intensities. CSLGB decreased significantly by 23.07% , 49.73% , and 97.45% in the three grazing intensities. LCS decreased significantly by 21.55% , 50.55% , and 66.95% in the three grazing intensities. RCS increased significantly by 39.23% in light grazing and decreased significantly by 87.74% in heavy grazing.
3.2.2 Soil and community characteristics of temperate steppe
Grazing had significant negative effects on SOC (−40.22% ), CVH (−1.05% ), CVC (−29.48% ), CVD (−33.92% ), AGB (−47.61% ), BGB (−50.81% ), and CI (−9.73% ). There were significant positive effects on soil bulk density (BD) (9.65% ), pH (4.02% ), SWI (5.8% ), SI (4.95% ), and SR (9.36% ) (Figure 4).
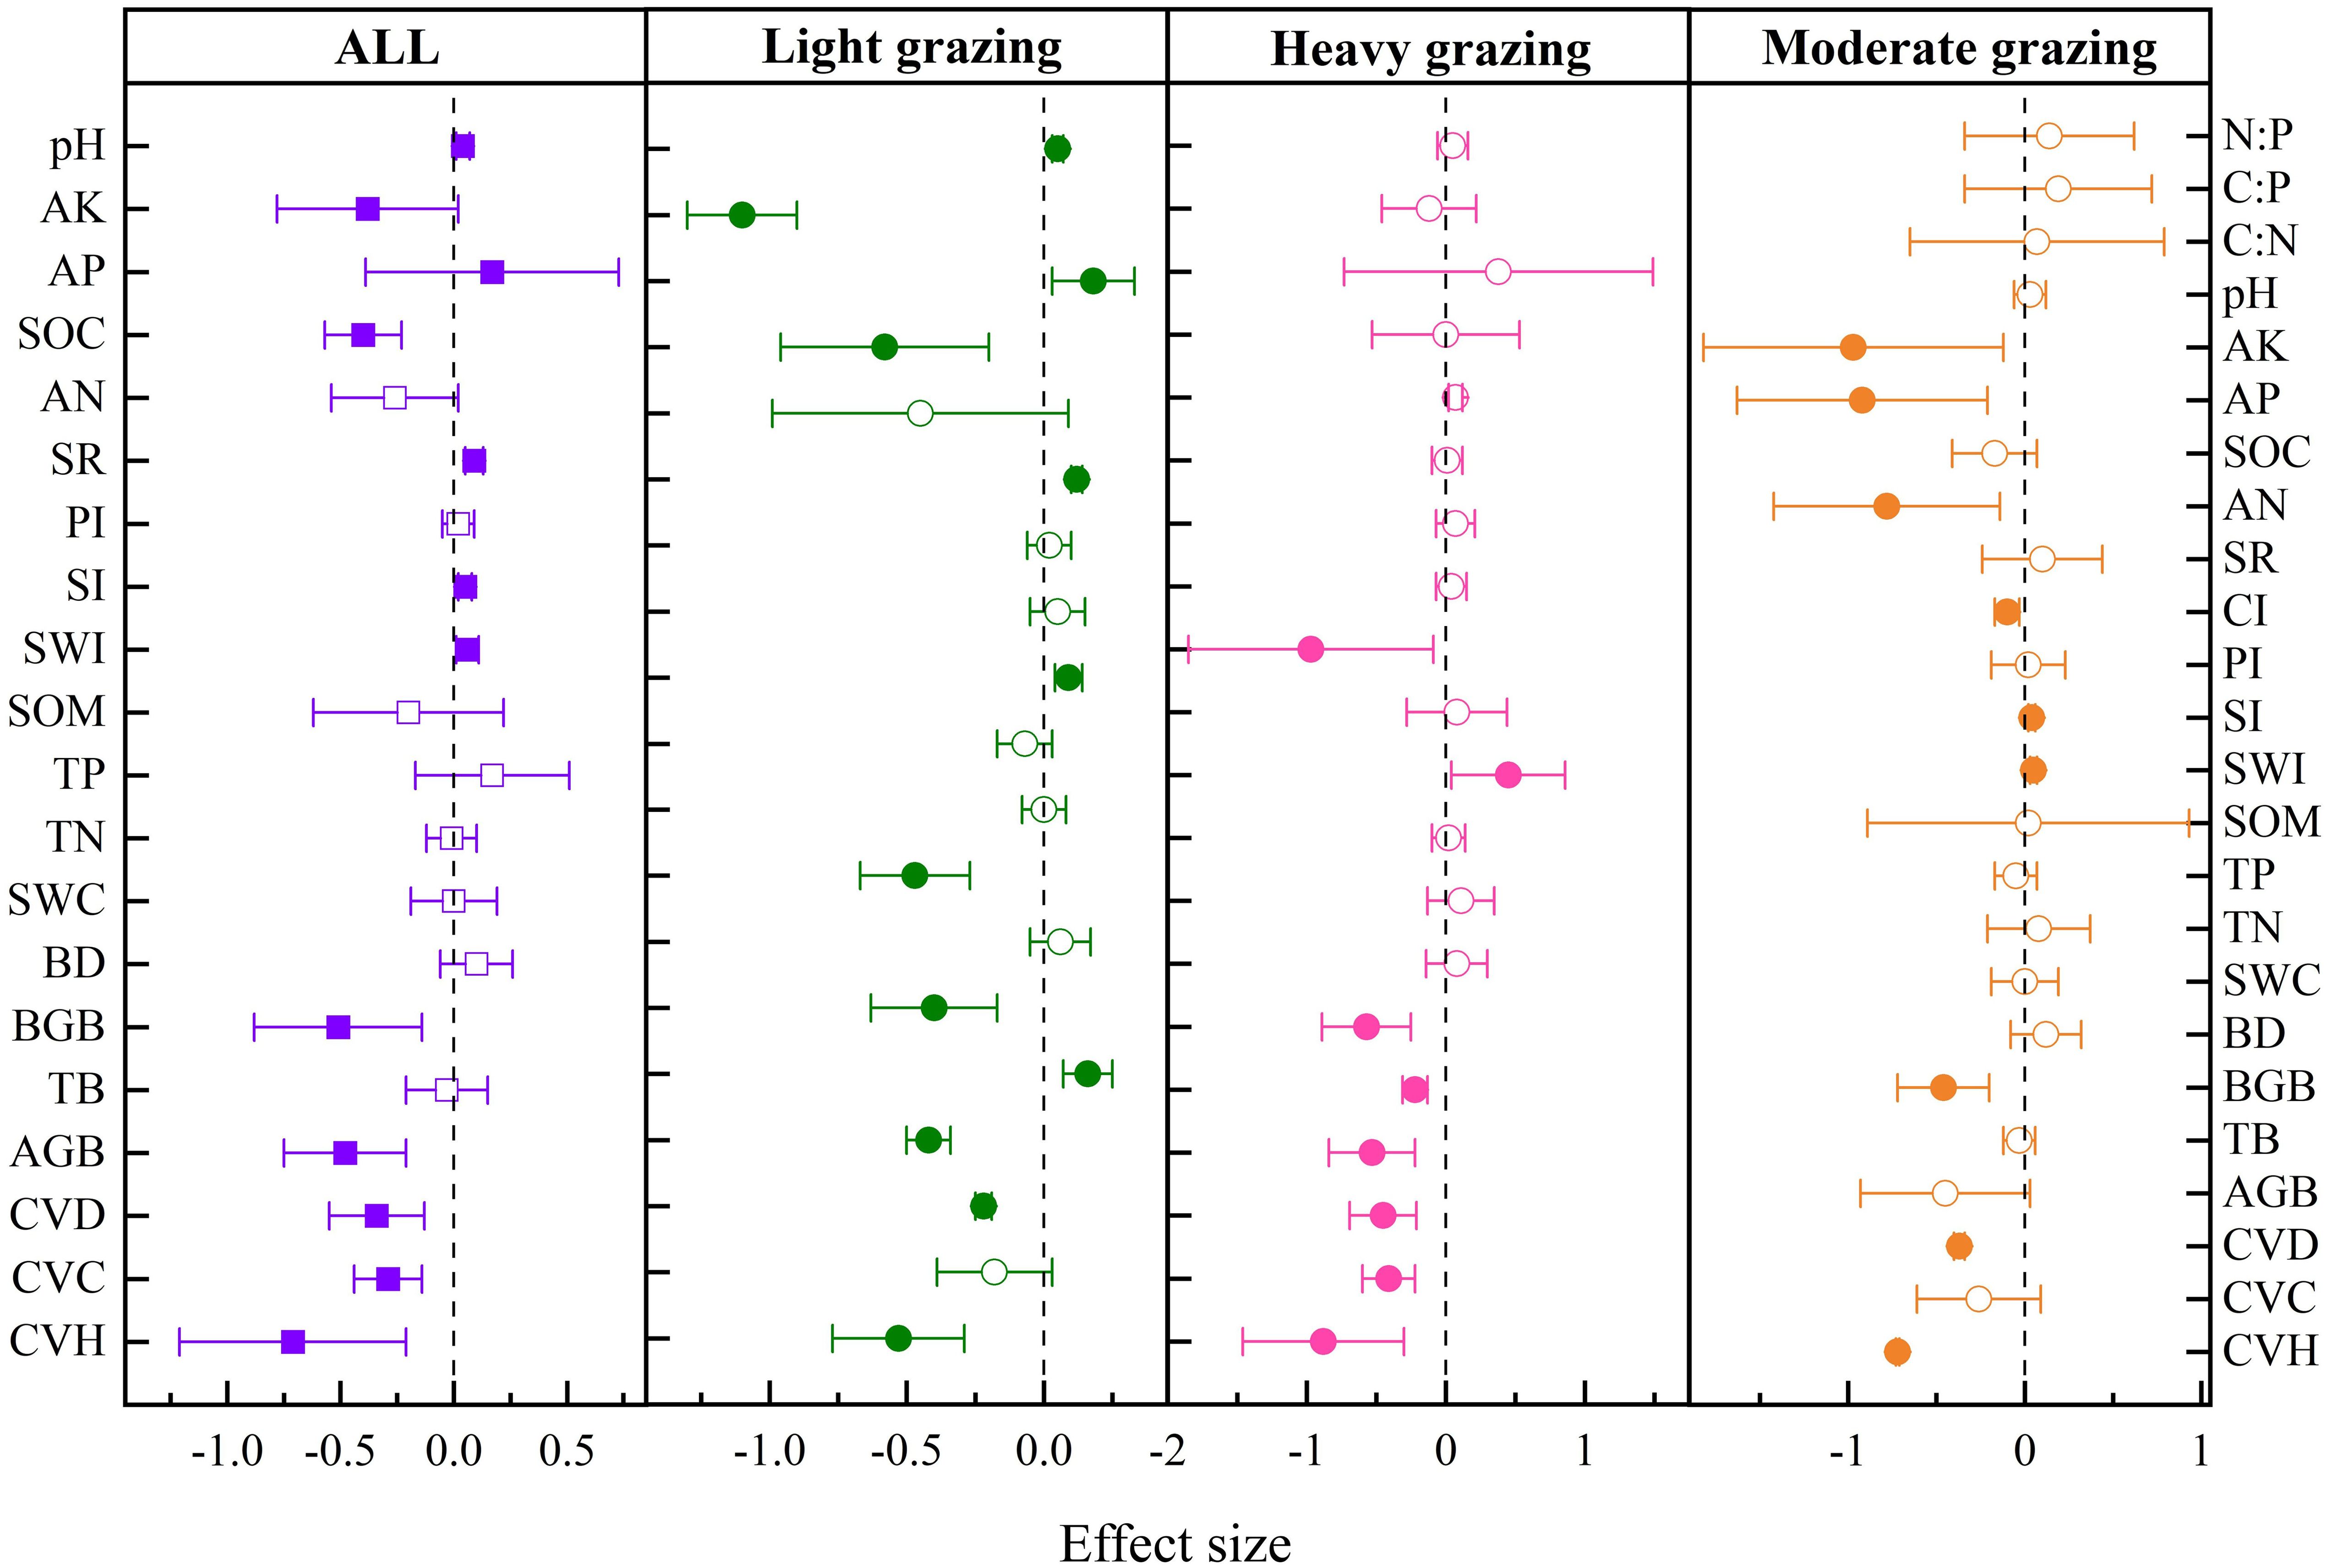
Figure 4. Effects of grazing intensity on soil and community indices in temperate steppe. N:P, nitrogen-to-phosphorus ratio; C:P, carbon-to-phosphorus ratio; C:N, carbon-to-nitrogen ratio; pH, soil pH; AK, available potassium; AP, available phosphorus; SOC, soil organic carbon; AN, available nitrogen; SR, species richness; CI, Chao index; PI, Pielous index; SI, Simpson index; SWI, Shannon-Wiener index; SOM, soil organic matter; TP, total phosphorus; TN, total nitrogen; SWC, soil water content; BD, bulk density; BGB, belowground biomass; TB, total biomass; AGB, aboveground biomass; CVD, community vegetation density; CVC, community vegetation coverage; CVH, community vegetation height. The solid representation has a significant effect, and the hollow representation has no significant effect.
As shown in Figure 4, compared with no grazing, soil TN decreased significantly by 47.19% in light grazing, soil TP increased significantly by 44.95% in heavy grazing, SOC decreased significantly by 57.73% in light grazing, SOM decreased significantly by 96.66% in heavy grazing, and soil BD increased significantly by 12.25% in heavy grazing. AN decreased significantly by 78.29% in moderate grazing. AP increased significantly by 17.99% in light grazing and decreased significantly by 92.15% in moderate grazing. AK decreased significantly by 109.52% and 96.94% in light and moderate grazing, respectively. Soil pH significantly increased by 4.8% in light grazing, and CI was significantly decreased by 9.73% in moderate grazing. CVH decreased significantly by 52.72% , 71.82% , and 88.09% in the three grazing intensities. CVC decreased significantly by 40.86% in heavy grazing. CVD decreased significantly by 22.01% , 37.22% , and 45.48% in the three grazing intensities. AGB decreased significantly by 42.36% and 52.94% in light and heavy grazing, respectively. BGB decreased significantly by 39.87% , 46.29% , and 56.91% in the three grazing intensities. TB increased significantly by 16.32% in light grazing and significantly decreased by 21.6% in heavy grazing. SWI increased significantly by 8.68% and 4.66% in light and moderate grazing, respectively. SI increased significantly by 3.55% in moderate grazing, and SR increased significantly by 12.44% and 7.11% in light and heavy grazing, respectively.
3.2.3 Soil and community characteristics of the temperate desert steppe
Grazing had a significant negative effect on SWC (−5.38% ), SOM (−14.88% ), soil TP (−24.66% ), soil TK (−11.13% ), AK (−22.88% ), CVH (−101.81% ), CVC (−71.01% ), AGB (−85.21% ), TB (−136.06% ), BGB (−104.04% ), R:S (−72.45% ), SWI (−47.78% ), SI (−25.11% ), PI (−28.45% ), SR (−59.07% ), CI (−8.97% ), PAI (−46.4% ), and MI (−59.72% ). It had a significant positive effect on soil BD (5.01% ), SOC (26.97% ), and AP (25.37% ) (Figure 5).

Figure 5. Response of soil and community indices to grazing intensity in temperate desert steppe. N:P, nitrogen-to-phosphorus ratio; C:P, carbon-to-phosphorus ratio; C:N, carbon-to-nitrogen ratio; R/S, root-to-stem ratio; TC, total carbon; pH, soil pH; AK, available potassium; AP, available phosphorus; SOC, soil organic carbon; AN, available nitrogen; SR, species richness; MI, Margalef index; CI, Chao index; PAI, Patrick index; PI, Pielous index; SI, Simpson index; SWI, Shannon-Wiener index; SOM, soil organic matter; TK, total potassium; TP, total phosphorus; TN, total nitrogen; SWC, soil water content; BD, bulk density; BGB, belowground biomass; TB, total biomass; AGB, aboveground biomass; CVD, community vegetation density; CVC, community vegetation coverage; CVH, community vegetation height. The solid representation has a significant effect, and the hollow representation has no significant effect.
As shown in Figure 5, compared with no grazing, soil BD increased significantly by 4.85% in heavy grazing, and SWC decreased significantly by 5.38% in moderate grazing. Soil pH increased significantly by 8.99% in light grazing and decreased significantly by 0.97% in moderate grazing. Soil TC increased significantly by 10.82% in light grazing and 14.71% in heavy grazing. SOC increased significantly by 32.98% in moderate grazing, and SOM decreased significantly by 21.11% in heavy grazing. Soil TN decreased significantly by 13.11% and 12.16% in light and heavy grazing, respectively, and increased significantly by 21.38% in moderate grazing. Soil TP decreased significantly by 24.56% and 41.5% in light and heavy grazing, respectively. Soil TK decreased significantly by 10.16% and 11.57% in light and heavy grazing, respectively. AN increased significantly by 5.27% in light grazing. AP increased significantly by 14% and 79.29% in light and heavy grazing, respectively. AK decreased significantly by 23.05% in light grazing. C:N decreased significantly by 21.18% and 11.91% in light and heavy grazing, respectively. C:P increased significantly by 16.3% and 14.24% in light and heavy grazing, respectively. N:P increased significantly by 36.18% and 25.26% in light and heavy grazing, respectively. CVH decreased significantly by 61.69% , 119.13% , and 130.99% in the three grazing intensities. CVC decreased significantly by 39.2% ,54.38% , and 105.34% in three grazing intensities. AGB decreased significantly by 121.33% in heavy grazing. TB decreased significantly by 138.52% , 78.95% , and 305.1% in the three grazing intensities. BGB decreased significantly by 101.57% and 109.91% in moderate and heavy grazing, respectively. R:S was significantly decreased by 72.45% in moderate grazing. SWI significantly decreased by 68.85% in moderate grazing. SI significantly decreased by 40% and 45.76% in light and heavy grazing, respectively. PI significantly decreased by 50.25% in moderate grazing. SR decreased significantly by 55.51% in moderate grazing. PAI decreased significantly by 47.34% , 44.06% , and 47.34% in the three grazing intensities. CI decreased significantly by 6.54% and 13.68% in moderate and heavy grazing, respectively. MI decreased significantly by 61.9% and 57.9% in light and heavy grazing, respectively.
3.2.4 Soil and community characteristics of mountain meadow
Grazing had significant negative effects on SWC (−12.77% ), pH (−2.64% ), CVH (−53.08% ), CVC (−27.02% ), CVD (−25.51% ), AGB (−42.19% ), TB (−42.06% ), BGB (−8.18% ), ASC (−69.11% ), BSC (85.66% ), SWI (−8.32% ), SI (−12.25% ), and SR (−23.04% ). We identified a significant positive effect on SOM (30.88% ), AK (17.29% ), C:N (10.56% ), DM (0.61% ), and TCS (95.76% ) (Figure 6).
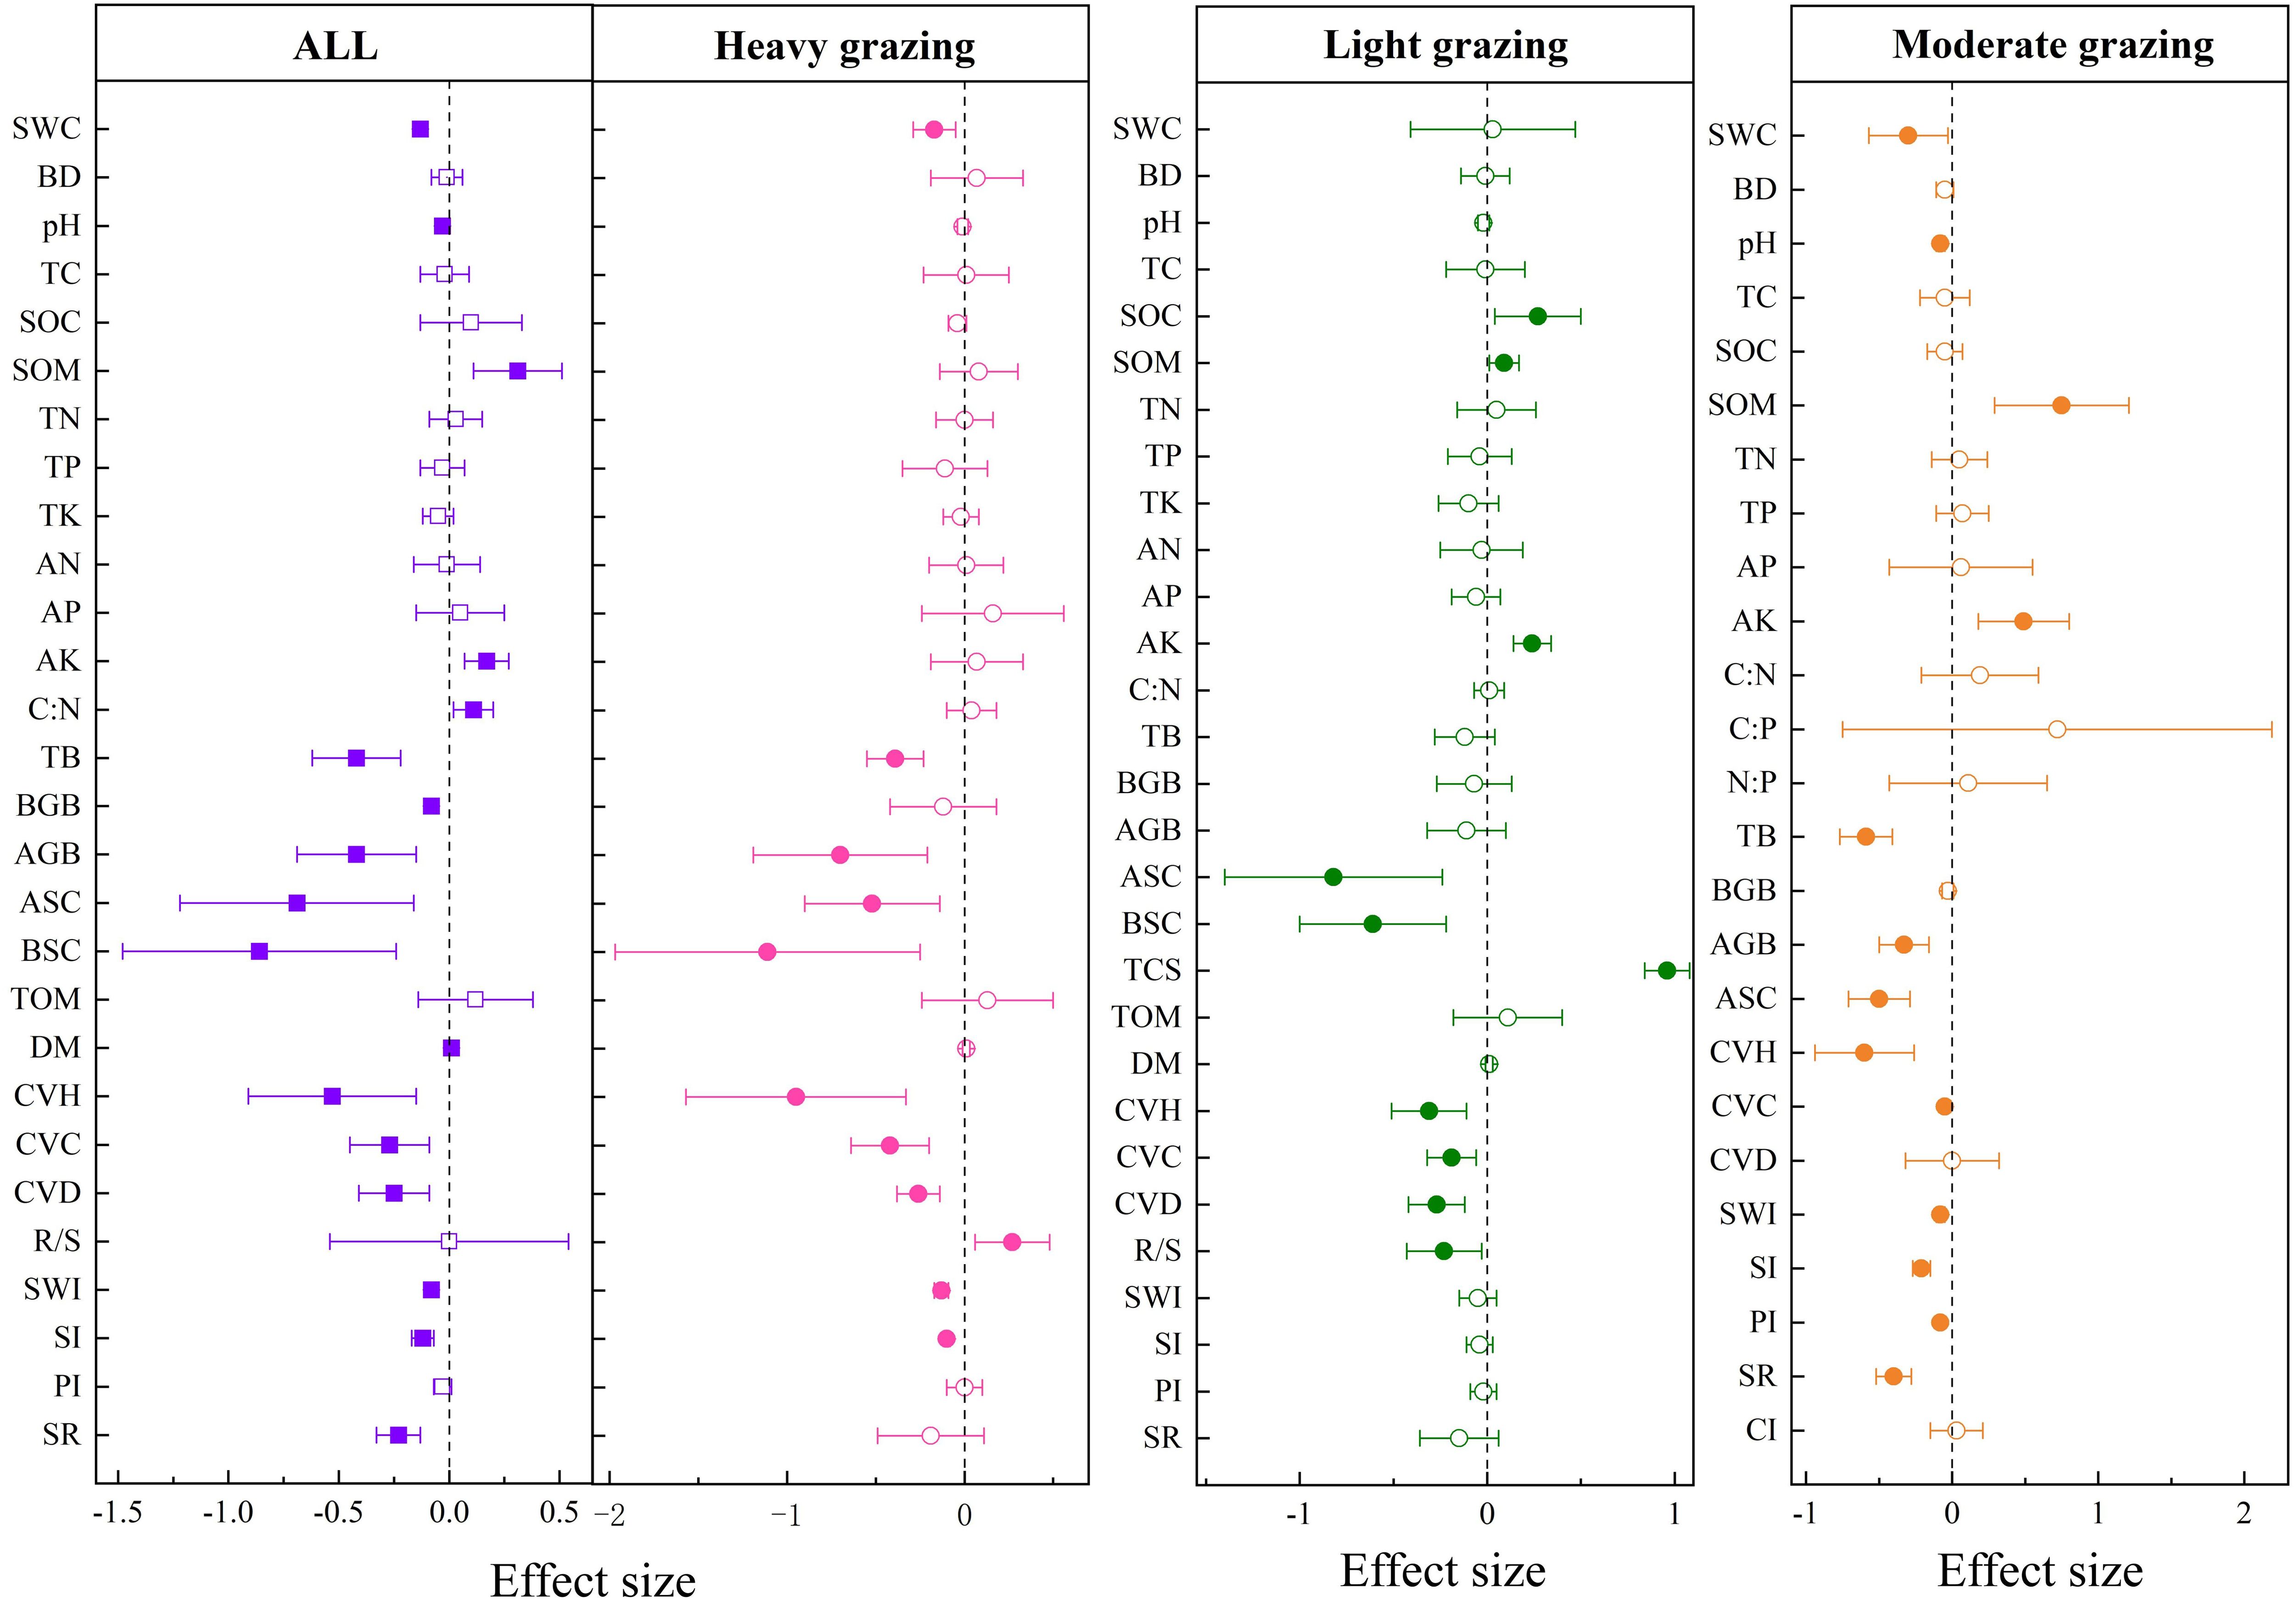
Figure 6. Effects of grazing intensity on soil and community properties in mountain meadow. SWC, soil water content; BD, bulk density; pH, soil pH; TC, total carbon; SOC, soil organic carbon; SOM, soil organic matter; TN, total nitrogen; TP, total phosphorus; TK, total potassium; AN, available nitrogen; AP, available phosphorus; AK, available potassium; C:N, carbon-to-citrogen ratio; C:P, carbon-to-phosphorus ratio; N:P, nitrogen-to-phosphorus ratio; TB, total biomass; BGB, belowground biomass; AGB, aboveground biomass; ASC, aboveground standing crop; BSC, belowground standing crop; TCS, total carbon storage; TOM, total organic matter; DM, dry matter; CVH, community vegetation height; CVC, community vegetation coverage; CVD, community vegetation density; R:S, root-to-stem ratio; SWI, Shannon-Wiener index; SI, Simpson index; PI, Pielous index; SR, species richness; CI, Chao index. The solid representation has a significant effect, and the hollow representation has no significant effect.
As shown in Figure 6, compared with no grazing, SWC decreased significantly by 30.23% and 17.13% in moderate and heavy grazing, respectively. Soil pH decreased significantly by 7.5% in moderate grazing, and SOC increased significantly by 27.48% in light grazing. SOM increased significantly by 9.44% and 75.18% in light and moderate grazing, respectively. AK increased significantly by 24.27% and 48.76% in light and moderate grazing, respectively. CVH decreased significantly by 30.62% , 59.67% , and 94.56% in the three grazing intensities. CVC decreased significantly by 18.56% , 5.22% , and 41.56% in the three grazing intensities. CVD decreased significantly by 27.46% and 25.57% in light and heavy grazing, respectively. AGB decreased significantly by 32.66% and 70.01% in moderate and heavy grazing, respectively. TB decreased significantly by 59.17% and 39.19% in moderate and heavy grazing, respectively. ASC was significantly reduced by 82.04% , 50.48% , and 52.2% in the three grazing intensities. BSC was significantly decreased by 60.61% and 110.55% in light and heavy grazing, respectively. R:S was significantly decreased by 27.84% in light grazing and increased by 27.3% in heavy grazing. DM significantly increased by 0.75% in heavy grazing. TCS significantly increased by 95.76% in light grazing. SWI was significantly decreased by 7.72% and 13.15% in moderate and heavy grazing, respectively. SI significantly decreased by 20.61% and 9.56% in moderate and heavy grazing, respectively. PI decreased by 8.46% in moderate grazing, and SR decreased by 40.18% in moderate grazing.
3.2.5 Soil and community characteristics of alpine meadow
Grazing had significant negative effects on soil BD (−12.33% ), TK (−9.58% ), CVH(−80.93% ), CVC (−61.39% ), CVD (−62.31% ), AGB (−71.21% ), TB (−79.08% ), and DM (−107.52% ). Grazing had significant positive effects on soil pH (1.12% ), TP (6.02% ), AN(26.68% ), AP (18.49% ), and AK (19.72% ) (Figure 7).
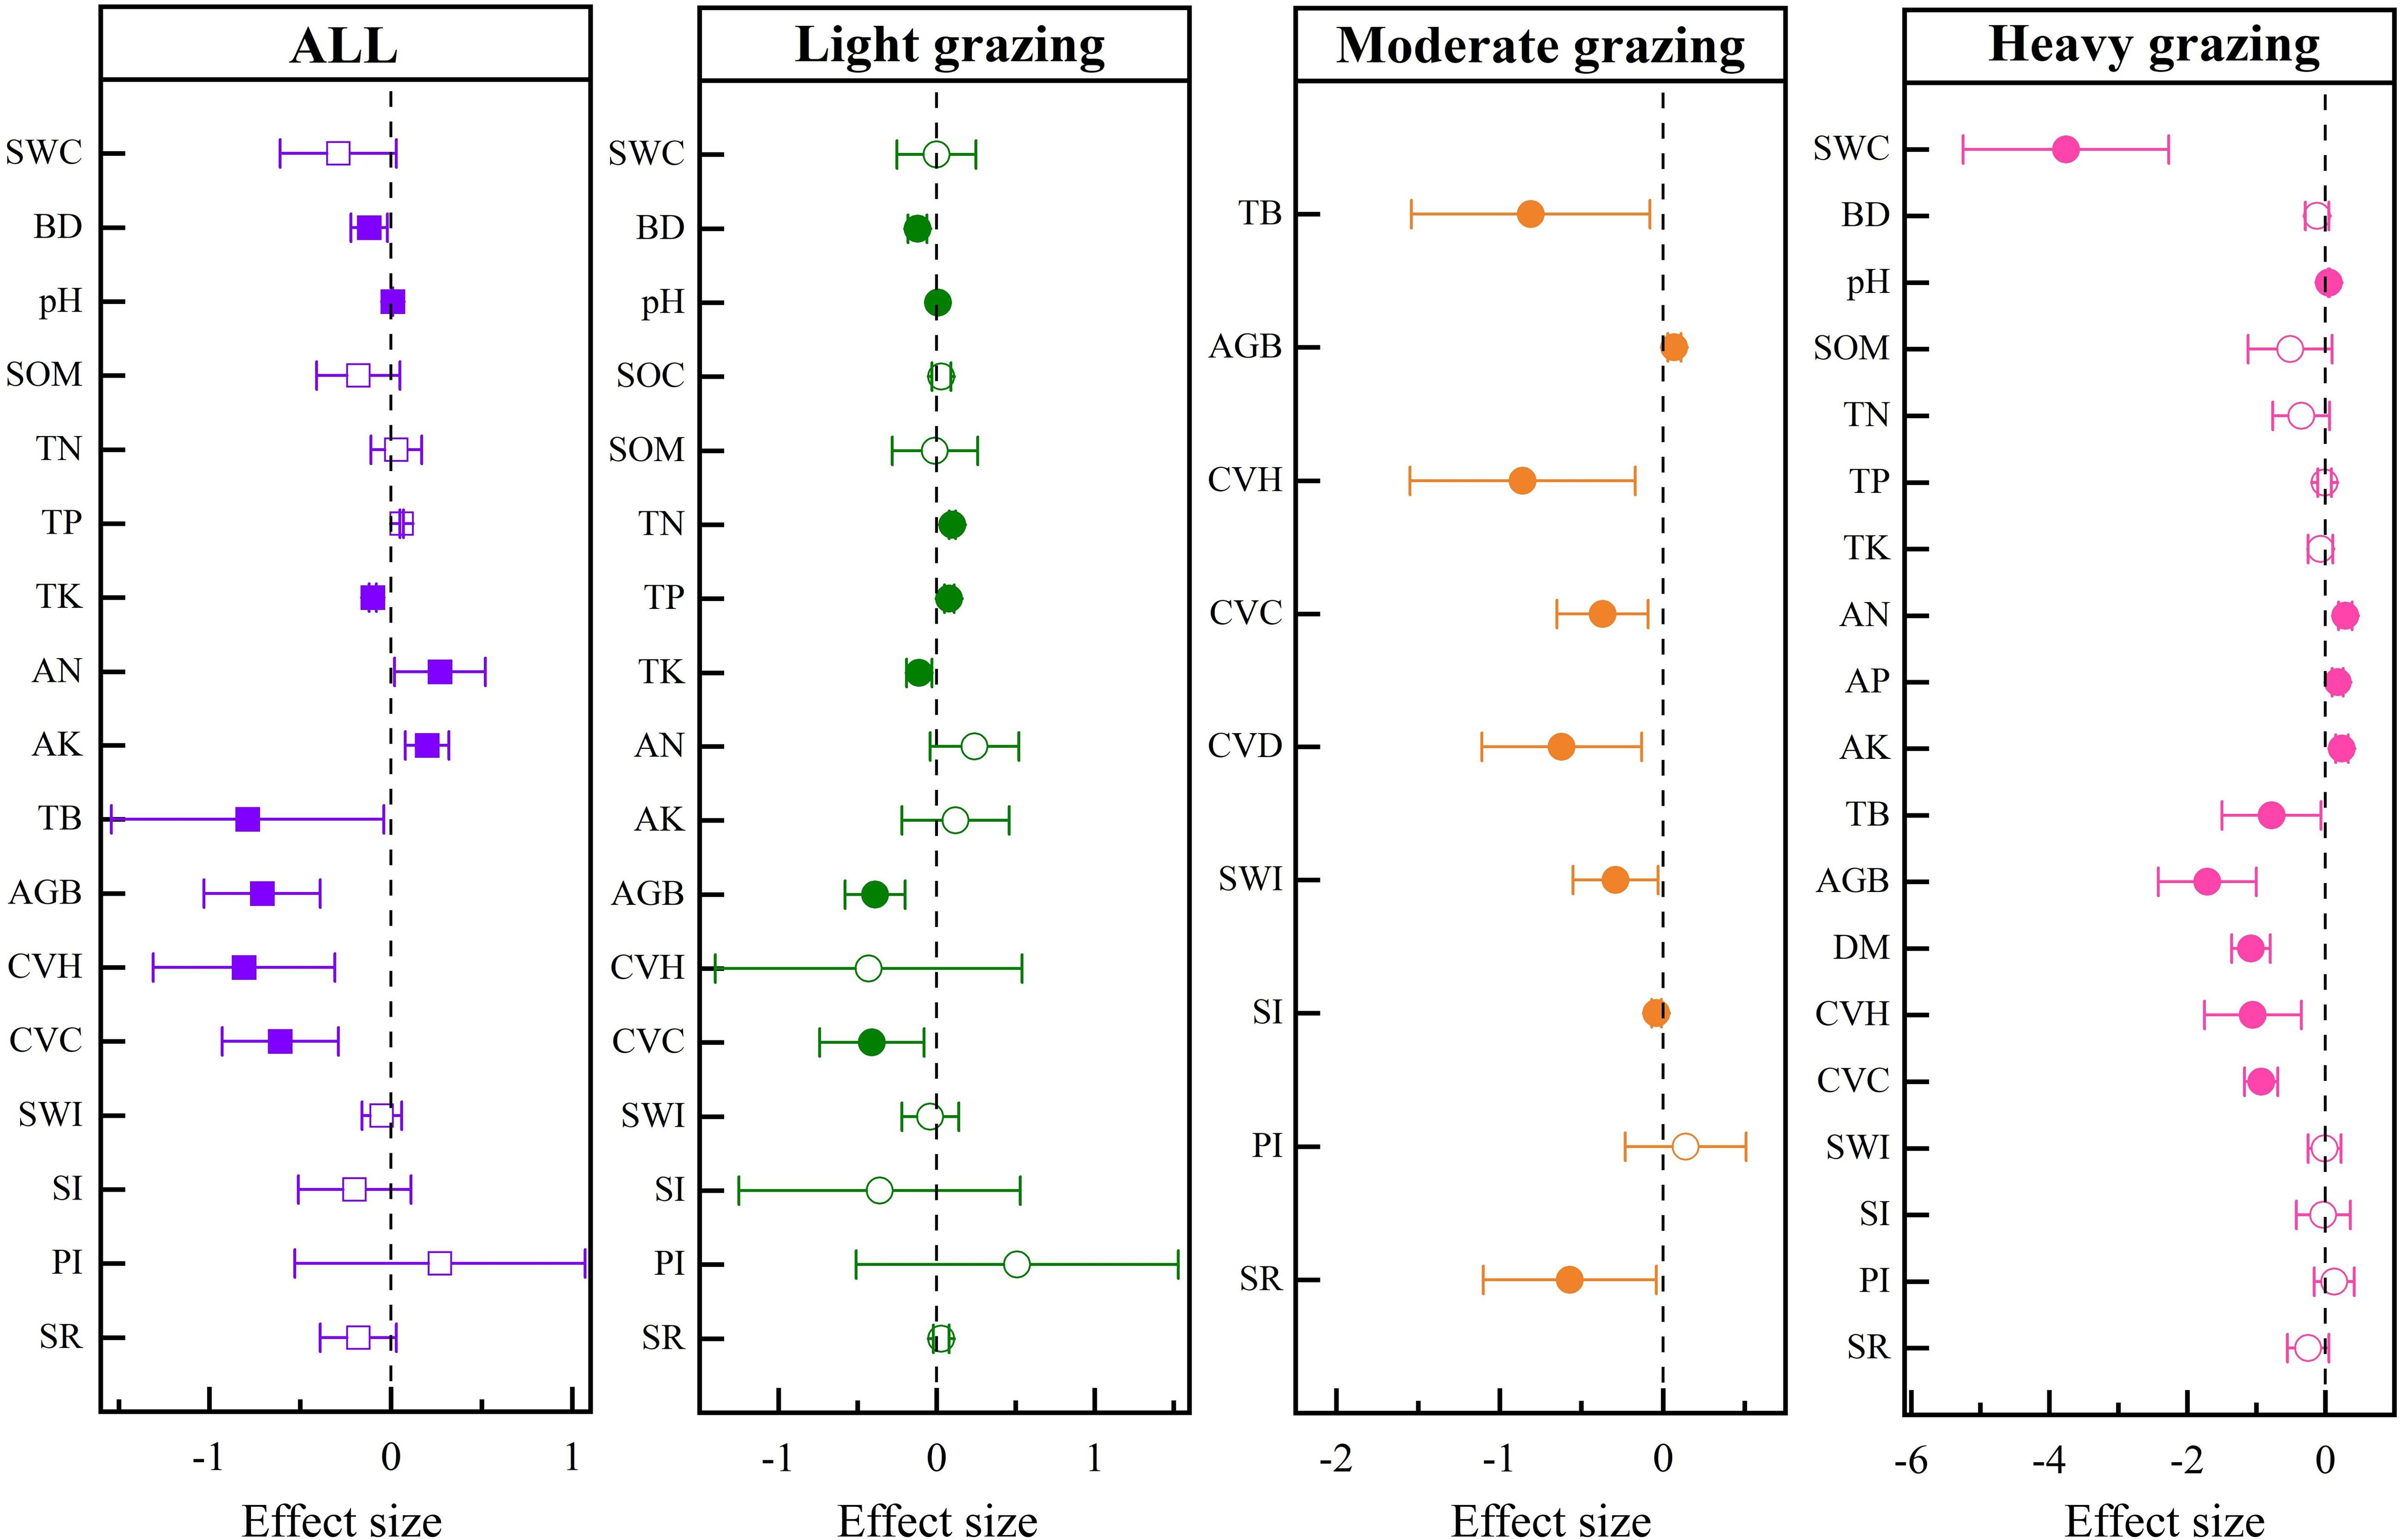
Figure 7. Response of soil and community characteristics to grazing intensity in alpine meadow. SWC, soil water content; BD, bulk density; pH, soil pH; SOC, soil organic carbon; SOM, soil organic matter; TN, total nitrogen; TP, total phosphorus; TK, total potassium; AN, available nitrogen; AP, available phosphorus; AK, available potassium; TB, total biomass; AGB, aboveground biomass; DM, dry matter; CVH, community vegetation height; CVC, community vegetation coverage; CVD, community vegetation density; SWI, Shannon-Wiener index; SI, Simpson index; PI, Pielous index; SR, species richness. The solid representation has a significant effect, and the hollow representation has no significant effect.
As shown in Figure 7, compared with no grazing, SWC decreased significantly by 375.61% in heavy grazing, and soil BD decreased significantly by 12.07% in light grazing. Soil TN increased significantly by 9.47% in light grazing, TP increased significantly by 8.38% in light grazing, TK decreased significantly by 10.64% in light grazing, and pH increased significantly by 0.96% and 5.12% in light and heavy grazing. AN increased significantly by 28.56% in heavy grazing, AP increased significantly by 18.49% in heavy grazing, and AK increased significantly by 23.67% in heavy grazing. CVH decreased significantly by 86.12% and 105.13% in moderate and heavy grazing, respectively. CVC decreased significantly by 41.3% , 36.89% , and 92.94% in the three grazing intensities. CVD decreased significantly by 62.31% in moderate grazing. AGB decreased significantly by 39.28% and 171.03% in light and heavy grazing, respectively, and increased significantly by 7.42% in moderate grazing. TB decreased significantly by 81.16% and 78% in moderate and heavy grazing, respectively. SWI decreased significantly by 29.33% in moderate grazing, SI decreased significantly by 4.17% in moderate grazing, and SR decreased significantly by 56.6% in moderate grazing. DM decreased significantly by 107.52% in heavy grazing.
3.3 Effects of grazing intensity on different grassland types
By integrating the similarities and differences of the effects of different grazing intensities on various grassland types (Table 2), grazing reduced the vegetation community height of various grassland types as a whole. In addition, and heavy grazing reduced the vegetation community height, coverage, and aboveground and underground biomass of various grassland types. Light grazing decreased the SOC of temperate steppe and increased the SOC of temperate desert steppe. Moderate grazing reduced the AGB of mountain meadow and increased the AGB of alpine meadow. Moderate grazing decreased SOC in temperate meadow steppe and increased SOC in temperate desert steppe.
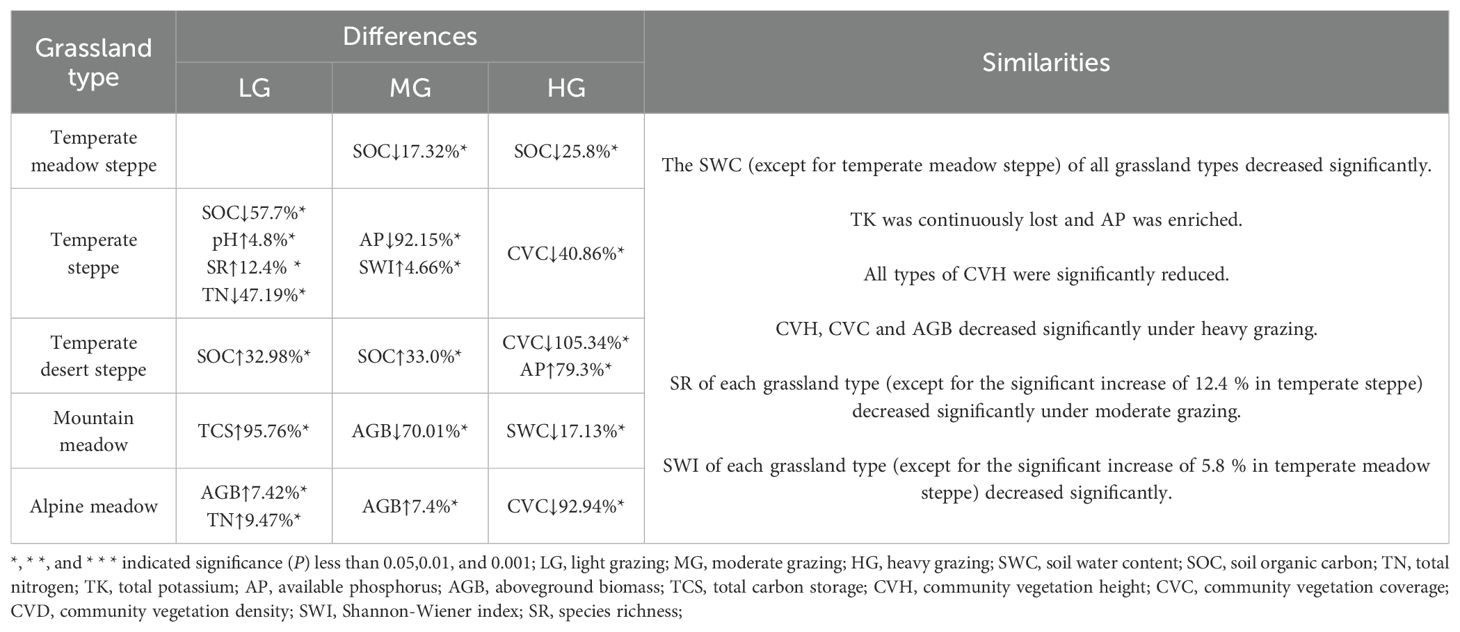
Table 2. Similarities and differences of different grassland types in response to grazing.
The interaction effects of grassland type and grazing intensity on all key indicators were significant (P < 0.05; Table 3), confirming that the impact of grazing had a strong ecosystem dependence. The temperate meadow steppe was highly sensitive to the loss of soil organic carbon (SOC: β = −0.42, P = 0.01) and aboveground biomass (AGB: β = −1.2, P < 0.001). The temperate steppe showed significant changes in soil physical properties, including increased pH under light grazing (β = 0.3, P = 0.03) and increased bulk density under heavy grazing (β = 0.15, P = 0.04). The temperate desert steppe was the only ecosystem with a significant increase in SOC under moderate grazing (β = 0.28, P = 0.02), but its biodiversity (SI: β = −0.8, P = 0.001) was severely damaged. AK in mountain meadows was significantly accumulated under light and moderate grazing (β = 0.35, P = 0.01), while heavy grazing induced the allocation of resources to the underground (R/S: β = 0.25, P = 0.03). The alpine meadow showed a contradictory response: although moderate grazing increased aboveground biomass (AGB: β = 0.4, P = 0.04), it decreased total biomass (TB: β = −0.6, P = 0.02), which suggested a transformation of community structure.
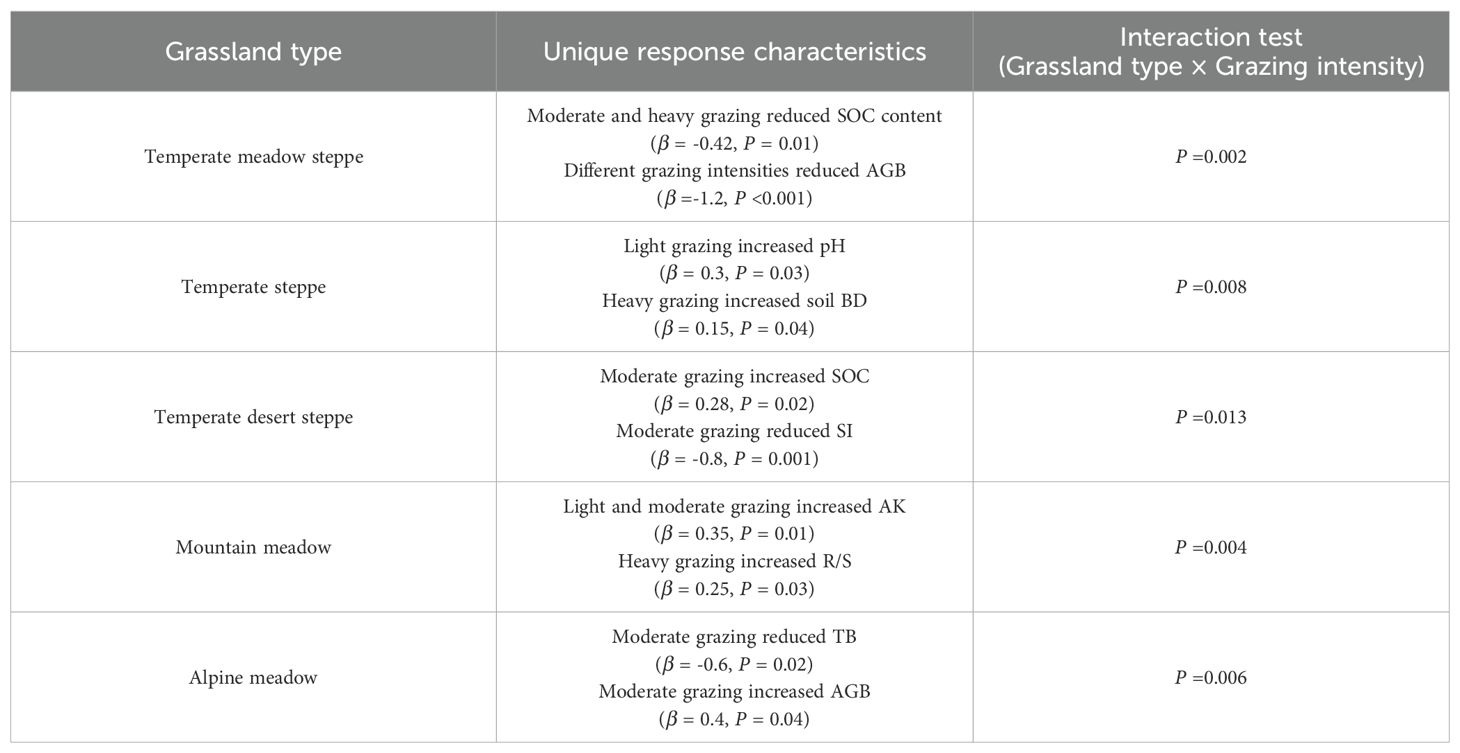
Table 3. Different responses of different grassland types to grazing.
3.4 The relationship between community vegetation characteristics and the diversity index of grassland
According to the correlation analysis of vegetation characteristics and diversity index, a significant positive correlation existed between CVH and CVC (P < 0.001), and there was a significant positive correlation existed between CVC and AGB (P < 0.01). BGB was significantly positively correlated with SI (P < 0.001) and SR (P < 0.05). SWI was significantly positively correlated with PI (P < 0.001) and SR (P < 0.01). SI was positively correlated with SR (P < 0.001) (Figure 8). These results demonstrated that an increase in grassland vegetation height promoted the expansion of coverage and then an increase in AGB. The increase in BGB promoted the increase in SR and diversity index.
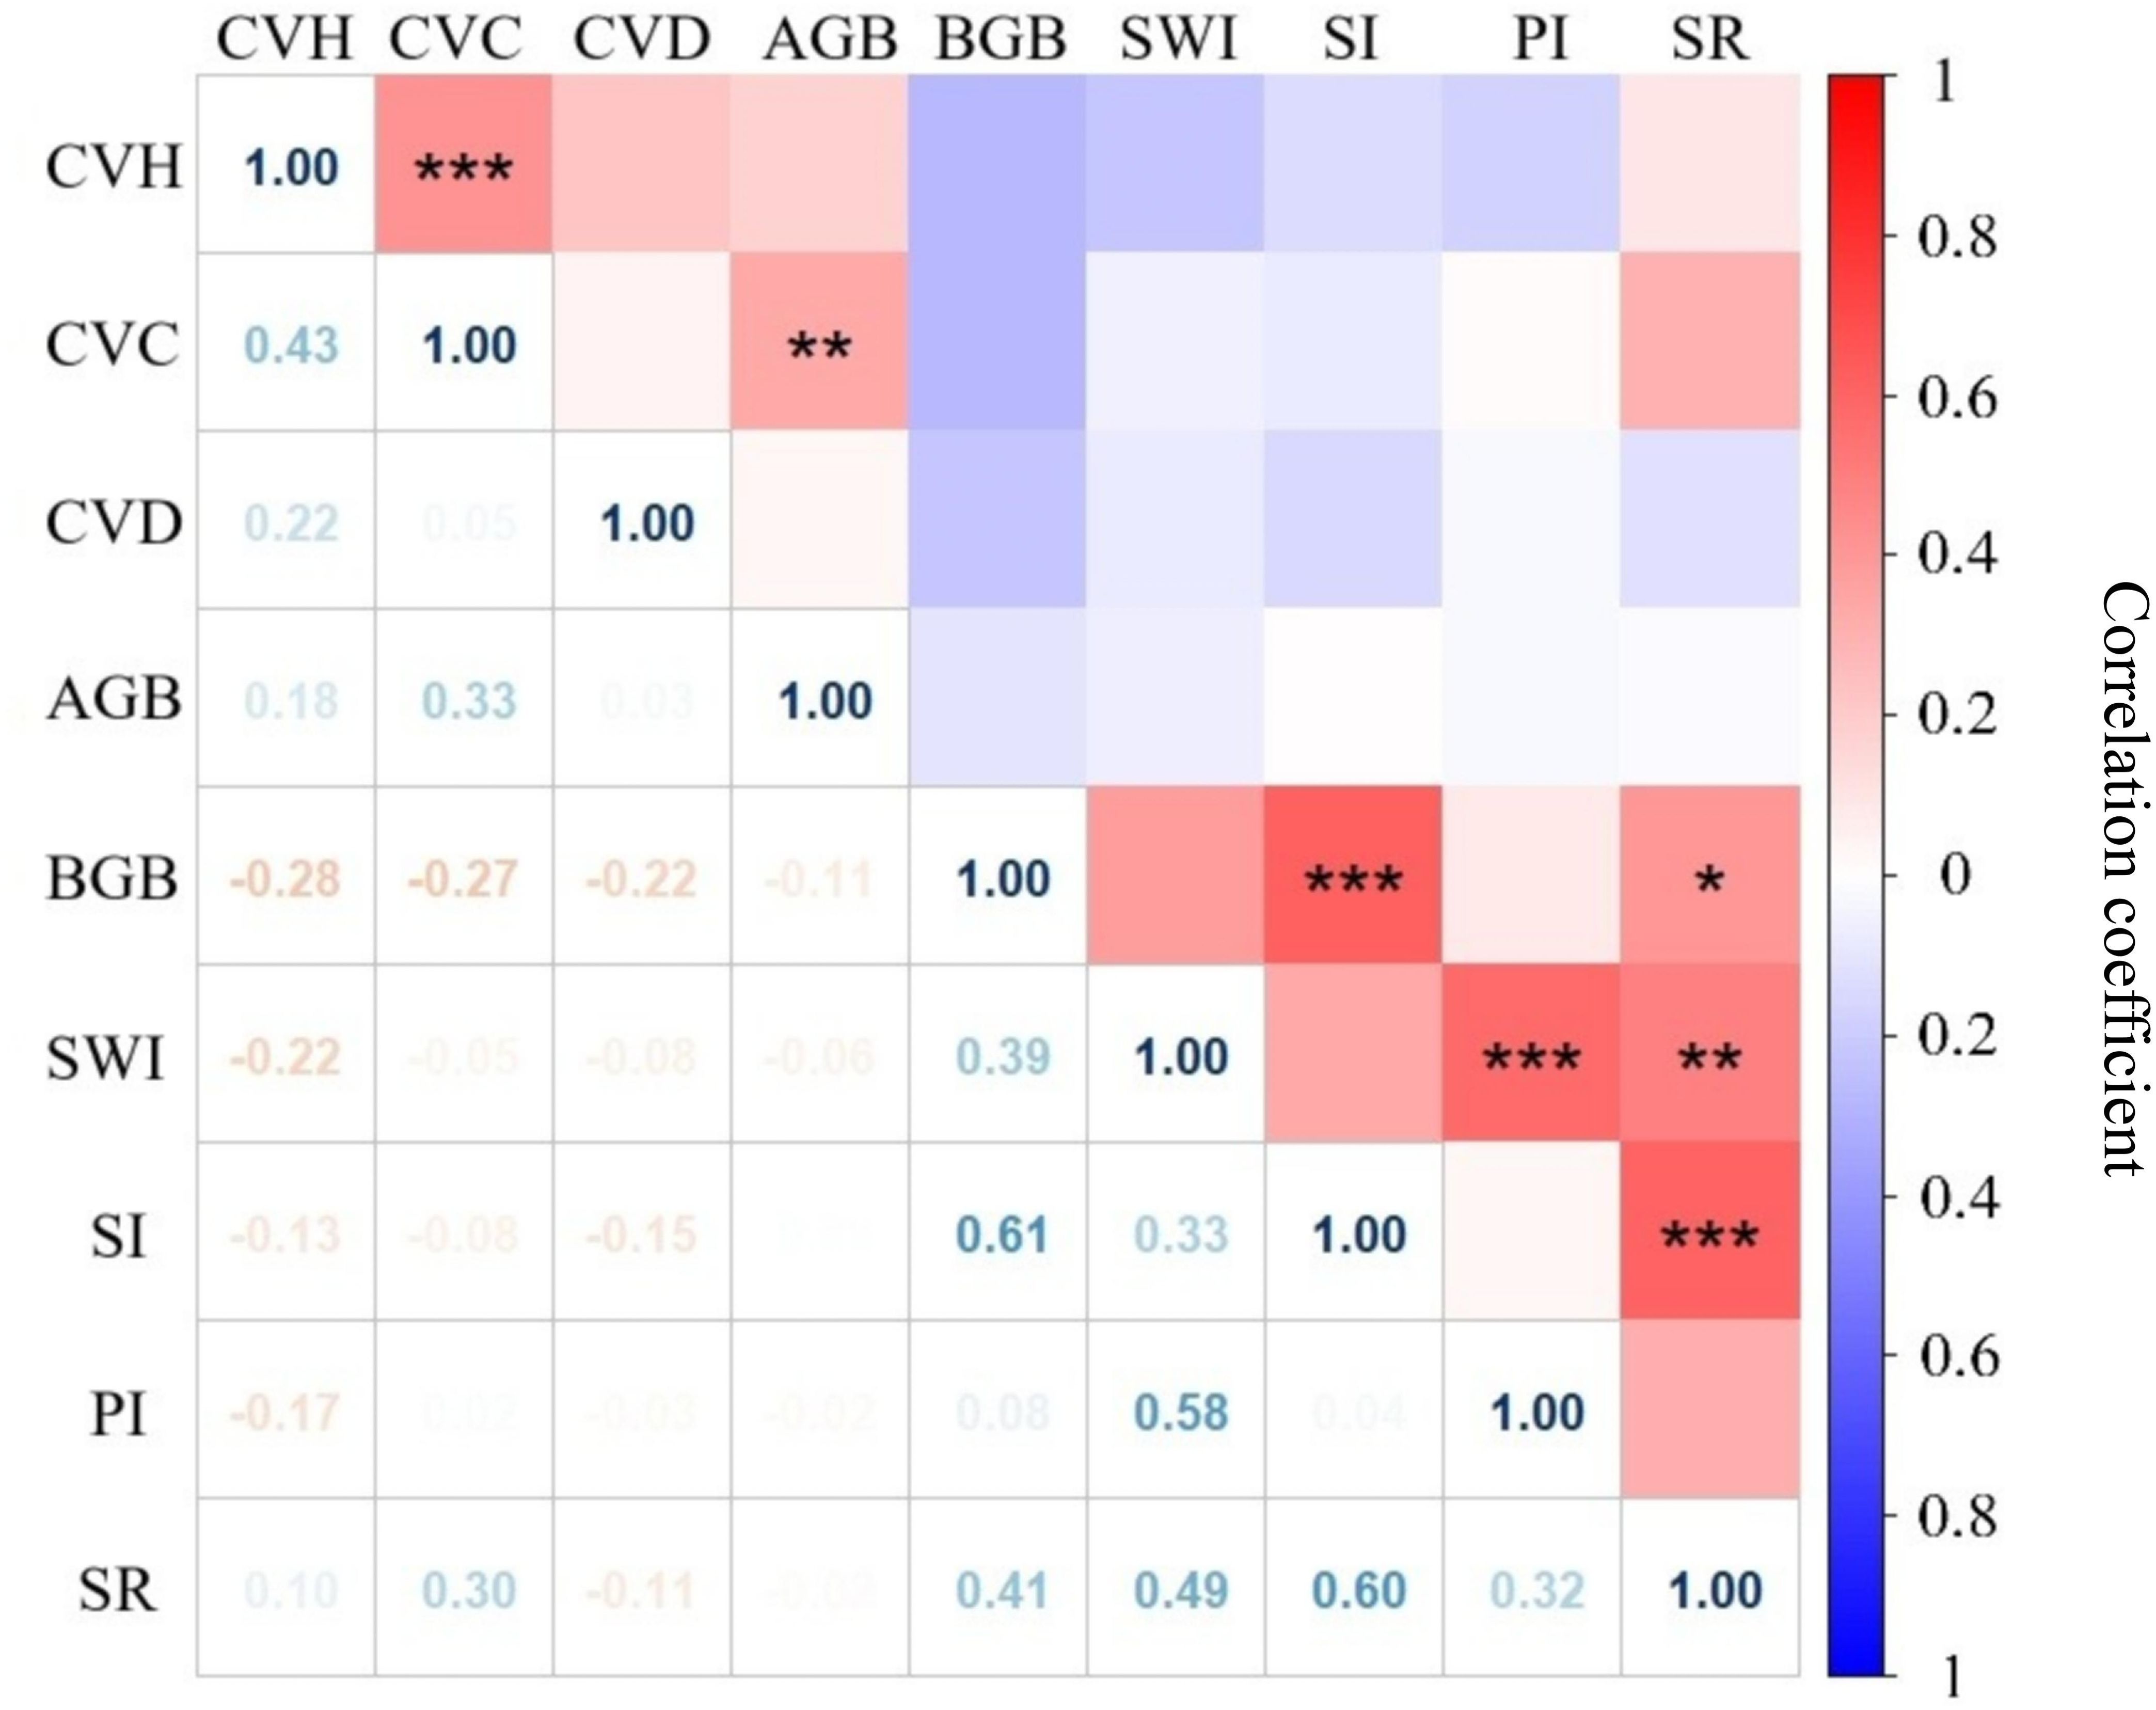
Figure 8. Correlation of each index of grassland community vegetation characteristics in Xinjiang. *, * *, and * * * indicated significance (P) less than 0.05,0.01, and 0.001, respectively. CVH, community vegetation height; CVC, community vegetation coverage; CVD, community vegetation density; AGB, aboveground biomass; BGB, belowground biomass; SWI, Shannon-Wiener index; SI, Simpson index; PI, Pielous index; SR, species richness.
3.5 The influence path of grazing intensity on grassland species diversity and soil quality in Xinjiang
The influence path of different grazing intensities on soil quality and species diversity in Xinjiang grassland is shown in Figure 9. Grazing intensity is significantly negatively correlated with CVC (P < 0.05), and CVC is significantly positively correlated with species diversity (P < 0.001). Therefore, grazing intensity affected species diversity by affecting vegetation coverage. The greater the grazing intensity, the smaller the vegetation coverage, which resulted in a decrease in species diversity. In addition, grazing intensity was significantly negatively correlated with AGB (P < 0.05) and soil quality (P < 0.001). Increasing grazing intensity led to a decrease in AGB and a decrease in soil quality.
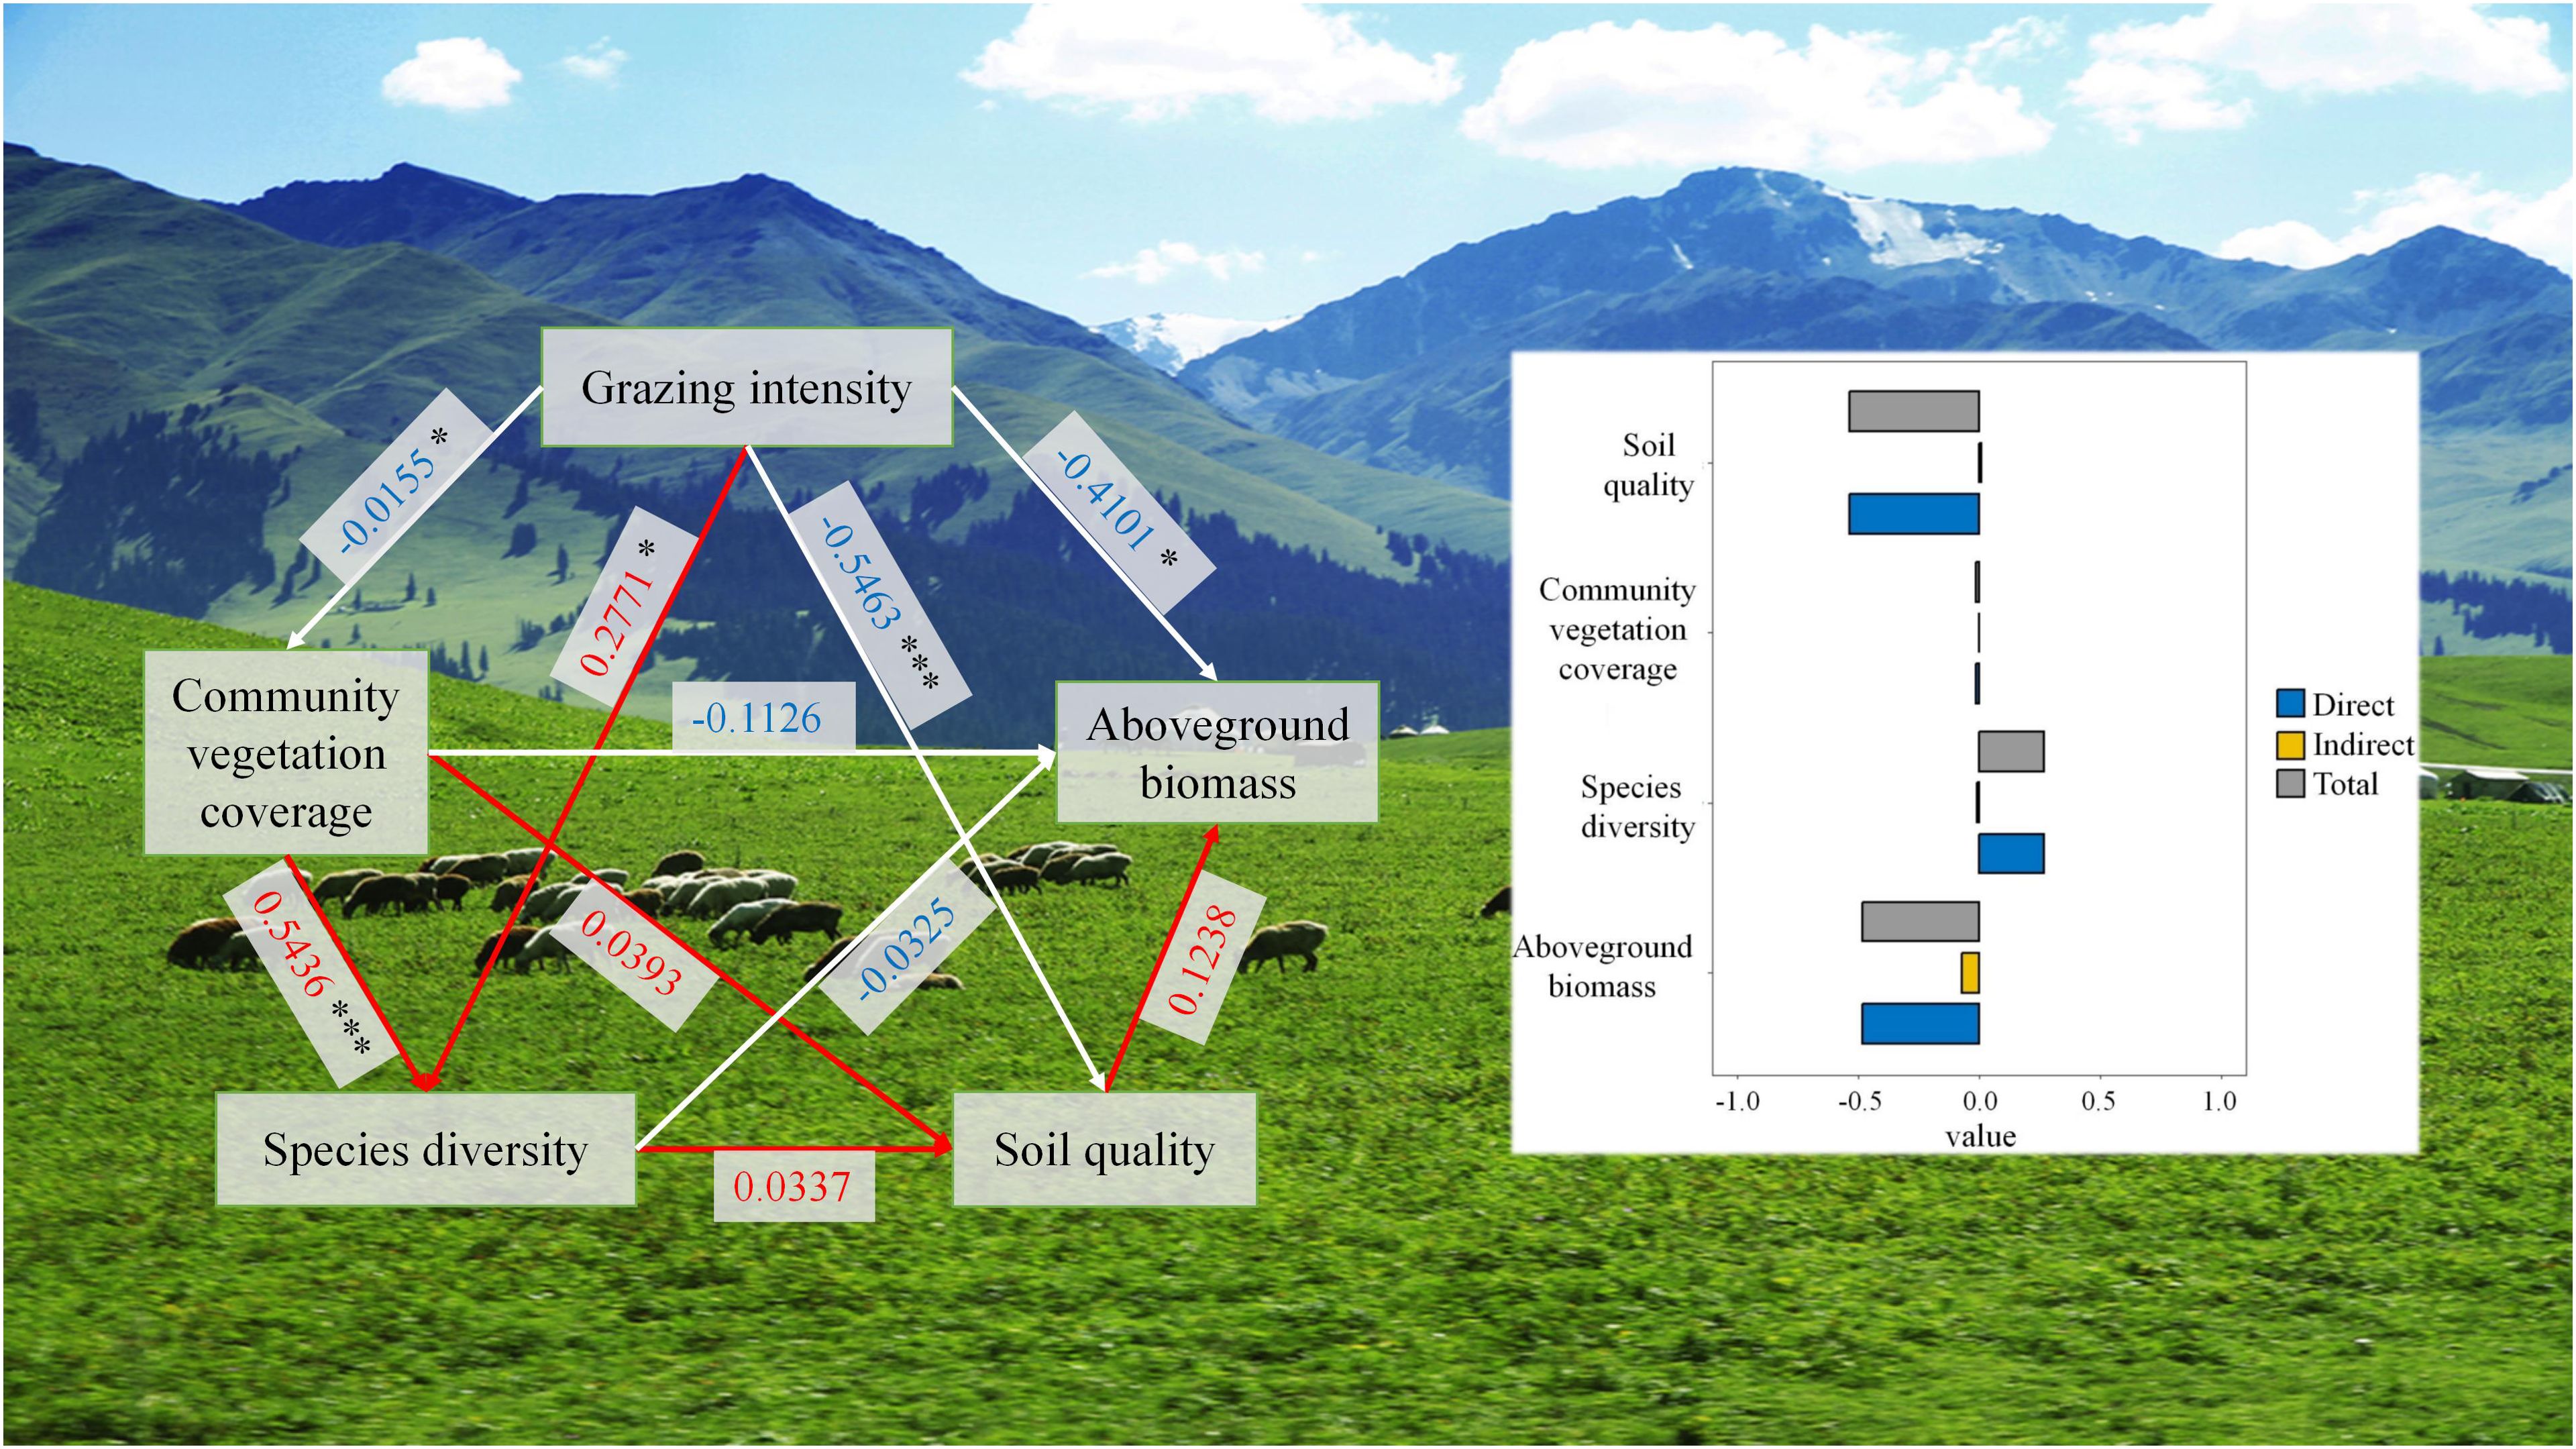
Figure 9. Effects of grazing intensity on grassland species diversity and soil quality in Xinjiang. “*” and “***” are the significant codes of P (significance) < 0.05 and P (significance) < 0.001 for the mean effect size, respectively.
4 Discussion
4.1 Effects of different grazing intensities on soil physical and chemical properties of grassland
Grazing intensity significantly affected the physical and chemical properties of the soil. With the increase in grazing intensity, the BD of the soil surface (0–10cm) usually increased, and the soil became compact. The results of this study showed that light and moderate grazing reduced soil BD in Xinjiang grassland, whereas heavy grazing increased soil BD, which was similar to the results of Zhang et al. (2002). SWC decreased significantly under moderate and heavy grazing conditions. It is possible that livestock frequently trampled the grassland, compacted the soil, reduced the porosity, reduced the storage space of air and water in the soil, and hindered the infiltration and retention of water, thus leading to a decrease in SWC.
The soil pH of the temperate desert steppe in Xinjiang increased and decreased significantly under light and moderate grazing, respectively. The reason may be that light grazing reduced CVC and accelerated soil moisture evaporation. The soluble salts in the soil may have gradually accumulated on the surface, thus increasing soil pH. Moderate grazing accelerated the decomposition of SOM and released more organic acids. These organic acids would neutralize the alkaline substances in the soil, thereby reducing the soil pH (An and Xu, 2013). SOC, TC, and TN decreased significantly under heavy grazing. SOC decreased under light and moderate grazing conditions in two types of grassland in Xinjiang temperate meadow steppe and temperate steppe, but the SOC content in temperate desert steppe and mountain meadow increased significantly under light and moderate grazing. This may have been the result of a decrease in CVC under light and moderate grazing conditions in temperate meadow steppe and temperate steppe, which resulted in a decrease in plant residue input, a corresponding decrease in SOC accumulation, a destruction of soil structure, and a decrease in porosity. This, in turn, may have affected the soil microbial activity and organic carbon fixation (Ding et al., 2014). The vegetation types of temperate desert steppe and mountain meadow usually have strong adaptability and can better cope with grazing pressure. Li et al. (2008) have shown that plants such as Stipa breviflora in desert steppe can maintain a good growth state under light and moderate grazing, and their root exudates and litter input contributed to the accumulation of SOC. TP in alpine meadow soil increased significantly under light grazing, which was similar to the results of Wu et al. (2024b). It is possible that grazing changed the growth strategy of plants, further increasing plant root exudates. These exudates promoted the dissolution and release of phosphorus in the soil, which increased the TP content in the soil.
4.2 Effects of different grazing intensities on grassland community structure characteristics
Studies have shown that grazing is an important factor in the dominant community structure when the climatic conditions are basically the same (He et al., 2021). The results of this study showed that the CVH, CVC, and CVD in various grassland types in Xinjiang decreased significantly under different grazing intensities, which was consistent with the research results of Zhang et al. (2021) on mountain meadow in Xinjiang that is, CVD, CVH, and CVC under grazing conditions were lower than those in enclosed areas. The study of S. purpurea grassland in northern Tibet by Duan et al. (2010) also found that high-intensity grazing behavior significantly reduced CVC, which indicated that the trampling and grazing of livestock under grazing conditions affected the growth of CVD, CVH, and CVC. The results of this study also showed that grazing reduced the AGB, BGB, and TB of different grassland types in Xinjiang, which was consistent with the results of previous studies (Wang et al., 2009; Yu et al., 2015). We determined that grazing reduced the number of plants and the total photosynthetic area of plants, thus resulting in a decrease in the efficiency of organic matter accumulation. Compared with no grazing, the R:S of heavy grazing was greater, which indicated indicating that grazing gradually reduced the that TB of the community and the TB of the community gradually trended downward (Zhang et al., 2020b). Litter biomass also decreased with the increase in grazing intensity, because grazing accelerated the decomposition and removal of litter (Zhang et al., 2020b).
Light grazing had higher community species diversity than heavy grazing. The results of this study showed that light and moderate grazing increased SR and SWI in temperate steppe of Xinjiang, whereas moderate grazing in mountain meadow and alpine meadow decreased SR, SWI, and SI. It is possible that moderate grazing disturbance broke the single advantage of vegetation and provided growth space for grazing-tolerant or less palatable plants, thereby increasing species diversity. This occurred because intermediate disturbance not only inhibited the competitive exclusion by dominant species but also provided survival opportunities for some rare species (Xiang, 2017). Mountain and alpine meadow ecosystems are more sensitive to grazing disturbance. Moderate grazing was sufficient to have had a greater impact on vegetation community structure, which resulted in a decrease in species diversity. Mountain and alpine meadows usually have lower vegetation productivity and slower recovery ability. Therefore, even moderate grazing may have had a negative impact on species diversity (Cai et al., 2024). In the study of alpine meadow in eastern Qilian Mountains, Wang et al. (2019) found that the SR and SWI were significantly higher in light grazing than those under other grazing intensities, while moderate and heavy grazing reduced these diversity indexes.
5 Conclusion
In this study, we explored the comprehensive effects of light, moderate, and heavy grazing on soil and community structure characteristics of grassland in Xinjiang. We retrieved relevant literature and used the meta-analysis method to identify the effects of different grazing intensity on soil physical and chemical properties, community vegetation characteristics and species diversity of five primary grassland types in Xinjiang. The conclusions showed the following: (1) In terms of soil properties, grazing reduced soil TK and increased AP content as a whole, and heavy grazing reduced SOC and OCD. Under different types, light grazing increased soil pH and AP in the temperate meadow steppe. Heavy grazing increased soil TP and BD in temperate grassland. Moderate grazing reduced the SWC and pH of temperate desert steppe and mountain meadow. light and moderate grazing increased SOM and AK in mountain meadows. Light grazing increased soil pH, TN and TP contents, and decreased soil BD and TK in alpine meadow. (2) In terms of vegetation characteristics, CVC, CVD, and CVH decreased under different grazing intensities. AGB, BGB, and TB followed a downward trend under moderate and heavy grazing. Heavy grazing increased the R:S and DM content of mountain meadow vegetation. (3) In terms of species diversity, moderate grazing reduced SR, SWI, SI, and PI. Moderate grazing increased SWI and SI in temperate grassland of Xinjiang. Overall, results of this study show that the increase in grazing intensity reduced vegetation CVC, thus reducing species diversity.
Data availability statement
The original contributions presented in the study are included in the article/Supplementary Material. Further inquiries can be directed to the corresponding author.
Author contributions
YZ: Conceptualization, Data curation, Formal analysis, Investigation, Methodology, Writing – original draft, Writing – review & editing, Software. HY: Conceptualization, Data curation, Formal analysis, Investigation, Methodology, Writing – original draft, Writing – review & editing. KC: Conceptualization, Data curation, Investigation, Methodology, Writing – review & editing. XM: Conceptualization, Funding acquisition, Methodology, Project administration, Resources, Supervision, Writing – review & editing. YM: Conceptualization, Data curation, Investigation, Methodology, Writing – review & editing.
Funding
The author(s) declare financial support was received for the research and/or publication of this article. This research was funded by the Third Xinjiang Scientific Expedition Program (2022xjkk0403).
Acknowledgments
We thank LetPub (www.letpub.com.cn) for its linguistic assistance during the preparation of this manuscript.
Conflict of interest
The authors declare that the research was conducted in the absence of any commercial or financial relationships that could be construed as a potential conflict of interest.
Generative AI statement
The author(s) declare that no Generative AI was used in the creation of this manuscript.
Any alternative text (alt text) provided alongside figures in this article has been generated by Frontiers with the support of artificial intelligence and reasonable efforts have been made to ensure accuracy, including review by the authors wherever possible. If you identify any issues, please contact us.
Publisher’s note
All claims expressed in this article are solely those of the authors and do not necessarily represent those of their affiliated organizations, or those of the publisher, the editors and the reviewers. Any product that may be evaluated in this article, or claim that may be made by its manufacturer, is not guaranteed or endorsed by the publisher.
References
An, H. and Xu, K. (2013). The effect of grazing disturbance on soil properties in desert steppe. Acta Prataculturae Sinica. 22, 35–42. doi: 10.11686/cyxb20130404
Boval, M. and Dixon, R. M. (2012). The importance of grasslands for animal production and other functions: a review on management and methodological progress in the tropics. Animal 6, 748–762. doi: 10.1017/s1751731112000304
Buisson, E., Archibald, S., Fidelis, A., and Suding, K. N. (2022). Ancient grasslands guide ambitious goals in grassland restoration. Science 377, 594–598. doi: 10.1126/science.abo4605
Cai, X. C., Tang, Z. S., Dong, R., Dong, K. C., and Hua, L. M. (2024). Effects of grazing on species diversity in Chinese grasslands: a Meta-analysis. Grassland Turf. 44, 122–130. doi: 10.13817/j.cnki.cyycp
Conant, R. T., Cerri, C. E., Osborne, B. B., and Paustian, K. (2017). Grassland management impacts on soil carbon stocks: a new synthesis. Ecol. Appl. 27, 662–668. doi: 10.1002/eap.1473
Conant, R. T., Paustian, K., and Elliott, E. T. (2001). Grassland management and conversion into grassland: effects on soil carbon. Ecol. Appl. 11, 343–355. doi: 10.1890/1051-0761(2001)011[0343:GMACIG]2.0.CO;2
Ding, W., Sun, X., Jia, H. T., Qin, P., Jia, Y. Y., and Jin, J. X. (2014). Effeet of grazing intensity on soil organie carbon in north slope of Tianshan Mountain meadow grassland. Southwest China J. Agric. Sci. 27, 1596–1600. doi: 10.16213/j.cnki.scjas
Dong, Y. Q., Sun, Z. J., An, S. Z., and Xun, Q. L. (2016). Effeet of grazing intensity on population characteristies and community diversity of Seriphidium transiliense. Acta Agrestia Sinica. 24, 22–27+46. doi: 10.11733/j.issn,1007-0435.2016.01.003
Duan, M. J., Gao, Q. Z., Wan, Y. F., Li, Y. E., Guo, Y. Q., Danjiu, L. B., et al. (2010). Effects of grazing on community characteristics and species diversity of Stipa purpurea alpine grassland in northern Tibet. Acta Ecol. Sinica. 30, 3892–3900. doi: 10.20103/j.stxb.2010.14.027
Fuhlendorf, S. D. and Smeins, F. E. (1999). Scaling effects of grazing in a semi-arid grassland. J. Veget. Sci. 10, 731–738. doi: 10.2307/3237088
He, F., Tong, Z., Hannaway, D. B., and Li, X. (2021). Erratic precipitation and clipping frequency reshape the community structure and species stability of leymus chinensis steppe. Ecol. Indic. 133, 108432. doi: 10.1016/j.ecolind.2021.108432
Hedges, L. V., Gurevitch, J., and Curtis, P. S. (1999). The meta-analysis of response ratios in experimental ecology. Ecology 80, 1150–1156. doi: 10.1890/0012-9658(1999)080[1150:TMAORR]2.0.CO;2
Herrero, M. and Thornton, P. K. (2013). Livestock and global change: Emerging issues for sustainable food systems. Proc. Nat. Acad. Sci. 110, 20878–20881. doi: 10.1073/pnas.1321844111
Hiernaux, P., Bielders, C. L., Valentin, C., Bationo, A., and Fernandez-Rivera, S. (1999). Effects of livestock grazing on physical and chemical properties of sandy soils in Sahelian rangelands. J. Arid Environ. 41, 231–245. doi: 10.1006/jare.1998.0475
Kemp, D. R., Behrendt, K., Badgery, W. B., Han, G. D., Li, P., Zhang, Y. J., et al. (2020). Chinese degraded grasslands – pathways for sustainability. Rangeland J. 42, 339–346. doi: 10.1071/RJ20033
Kobayashi, T., Hori, Y., and Nomoto, N. (1997). Effects of trampling and vegetation removal on species diversity and microenvironment under different shade conditions. J. Veget. Sci. 8, 873–880. doi: 10.2307/3237032
Li, J. L., Xu, P., Meng, L., and Wang, J. H. (1993). The Comprehensive effects of different rotational grazing intensities (DRGI) on the soil, grassland and sheep production in a spring-autumn pasture of Sagebruch desert in the Northern slope of Tianshan Mountain. Acta Prataculturae Sinica. 2, 60–65.
Li, C. L., Zhao, M. L., Han, G. D., and Hong, M. (2008). The characteristics of soil organic carbon and the relationships between soil organic carbon and vegetations in desert steppe under different grazing gradients. J. Arid Land Resour. Environ. 5, 134–138. doi: 10.13448/j.cnki.jalre.2008.05.021
Li, J. Y., Miao, C. B., Yu, M., Lu, G., Guan, T. Z., and Yang, J. J. (2022). Effects of different grazing systems on anti-scourability of grassland on the northern slope of Tianshan Mountains. Soil Water Conserv. China 5, 52–56+7. doi: 10.14123/j.cnki.swcc.2022.0115
Liu, B. G., Tong, C., and Luo, R. T. (2008). Litter decomposition of three main plants in winter and spring in the marsh of Minjiang River Estuary. J. Fujian Normal Univ. (Natural Sci. Edition) 2, 80–85.
Liu, Y., Wang, Q., Zhang, Z., Tong, L., Wang, Z., and Li, J. (2019). Grassland dynamics in responses to climate variation and human activities in China from 2000 to 2013. Sci. Total Environ. 690, 27–39. doi: 10.1016/j.scitotenv.2019.06.503
Liu, H. L., Yang, X. D., Zhang, J. Y., Jin, G. L., Chen, C., and Song, G. X. (2013). Charaeteristies and herbivore carrying capacities of different degradation grasslands in Seriphidium transiliense desert. Acta Agrestia Sinica. 21, 50–55.
Liu, W., Zhao, Y., Yang, L., Meng, X., Yan, A., Xie, K. Y., et al. (2025). Effects of reseeding fine forage on production performance and forage quality of degraded grassland in Zhaosu, Xinjiang. Acta Agrestia Sinica. 33, 231–240. doi: 10.11733/j.issn.1007-0435.2025.01.026
Reynaud, A. and Lanzanova, D. (2017). A global meta-analysis of the value of ecosystem services provided by lakes. Ecol. Econ. 137, 184–194. doi: 10.1016/j.ecolecon.2017.03.001
Scurlock, J. M. O. and Hall, D. O. (1998). The global carbon sink: a grassland perspective. Global Change Biol. 4, 229–233. doi: 10.1046/j.1365-2486.1998.00151.x
Sun, Z. J., Zhu, J. Z., and Zhang, X. H. (2014). Influence of short-period grazing intensity on vegetation characteristics and diversity of meadow steppe in Zhaosu. J. Xinjiang Agric. University 37, 35–39.
Tan, H. Y., Yan, R. R., Yan, Y. H., Chen, B. R., and Xin, X. P. (2015). Phospholipid fatty acid analysis of soil microbial communities under different grazing intensities in meadow steppe. Acta Prataculturae Sinica. 24, 115–121. doi: 10.11686/cyxb20150312
Wang, C. J., Tas, B. M., Glindemann, T., Rave, G., Schmidt, L., Weißbach, F., et al. (2009). Fecal crude protein content as an estimate for the digestibility of forage in grazing sheep. Anim. Feed Sci. Technol. 149, 199–208. doi: 10.1016/j.anifeedsci.2008.06.005
Wang, X. and Sheng, L. (2012). Effect of grazing intensity on microorganisms quantity and microbial biomass of soil in grassland under protection forest of Songnen plain. J Anim Vet Adv. 11, 4549–4552.
Wang, Z. P., Zhang, Z. J., and Hua, L. M. (2019). Effects of different grazing intensities on the diversity of poisonous plants in alpine meadow. Grassland Turf. 39, 75–81. doi: 10.13817/j.cnki.cyycp.2019.05.010
Wu, Y. X., Liang, F., Cui, D., Liu, W. X., Liu, S. Q., Lv, L. Q., et al. (2024a). Effects of grazing intensity on soil physical and chemical properties of Yili Tuohulasu grassland in Xinjiang. J. Domest. Anim. Ecol. 45, 41–49. doi: 10.3969/j.issn.1673-1182.2024.07.007
Wu, Y. P., Ding, M. J., Zhang, H., Zhang, Y. J., Xu, H., and Huang, P. (2024b). Characteristics and drivers of soil carbon, nitrogen, and phosphorus ecological stoichiometry at the heavy degradation stage of the alpine meadow. Environ. Sci. 45, 6050–6060. doi: 10.13227/j.hjkx.202310130
Xi, L. T. Y., Xu, Z., and Zheng, Y. (2009). Effects of grazing intensity on soil physical and chemical properties of Inner Mongolia grassland. J. Grassland Forage Sci. 6, 17–21+32.
Xiang, Z. L. (2017). Test of the intermediate disturbance hypothesis in the Huntai River Basin water ecosystem. [dissertation/master’s thesis]. Dalian Ocean University, Dalian.
Xu, Q., Wei, Y., Zhao, X., and Xu, H. (2022). Dynamics of soil carbon fractions and carbon stability in relation to grassland degradation in Xinjiang, Northwest China. Sustainability 14, 5860. doi: 10.3390/su14105860
Xu, Q., Xu, H., Wei, Y., and Aili, A. (2023). Restoration effects of supplementary planting measures on the abandoned mining areas in the Altay Mountain, Northwest China. Sustainability 15, 14974. doi: 10.3390/su152014974
Yan, Z. Q., Qi, Y. C., Dong, Y. S., Peng, Q., Sun, L. J., Jia, Z. Q., et al. (2014). Nitrogen cyeling in grassland ecosystems in response to climate change and human activities. Acta Prataculturae Sinica. 23, 279–292. doi: 10.11686/cyxb20140634
Yu, X. J., Jing, Y. Y., Duan, C. H., Xu, C. L., Yang, H. L., Luo, J. L., et al. (2015). Influence of enclosure and grazing intensity on alpine meadow vegetation and soil characteristics in the Eastern Qilian Mountains. Agric. Res. Arid Areas 33, 252–277. doi: 10.16302/j.cnki.1000-7601.2015.01.041
Zhang, Y., Asiya, M., Zhang, Y. J., Xin, X. P., Zhang, H. H., Yan, R. R., et al. (2021). Response of community characteristies and nutrient content of edible forage to no -grazing and grazing in Xinjiang Mountain meadows. Xinjiang Agric. Sci. 58, 756–765. doi: 10.6048/j.issn.1001-4330.2021.04.018
Zhang, W. H., Cuan, S. Y., and Wu, Y. Z. (2000). Effect of grazing capacity on water content nutrient and biomass of steppe soil. J. Arid Land Resour. Environ. 14, 61–64. doi: 10.13448/j.cnki.jalre.2000.04.011
Zhang, R. P., Guo, J., and Zhang, Y. L. (2020a). Spatial distribution pattern of NPP of Xinjiang grassland and its response to climatic changes. Acta Ecol. Sinica. 40, 5318–5326. doi: 10.5846/stxb201901270204
Zhang, Y. W., Han, J. G., and Li, Z. Q. (2002). A study of the effects of different grazing intensities on soil physical properties. Acta Agrestia Sinica. 1, 74–78.
Zhang, Y., Hou, L. L., Yan, R. R., and Xin, X. P. (2020b). Effects of grazing intensity on plant community characteristics and nutrient quality of Herbage in a meadow steppe. Scientia Agric. Sinica. 53, 2550–2561. doi: 10.3864/j.issn.0578-1752.2020.13.004
Zhang, J., Sun, Q., Jiashaer, Zheng, W., Zhao, Y., Sakedate, K., et al. (2023). Response of plant functional groups to different grazing management systems in summer grasslands on the northern slope of Tianshan Mountains. Pratacultural Sci. 40, 1186–1200. doi: 10.11829/j.issn.1001-0629.2022-0705
Keywords: Xinjiang grassland, grazing intensity, soil properties, community characteristics, meta-analysis
Citation: Zheng Y, Yao H, Chao K, Ma X and Ma Y (2025) Comprehensive analysis of grazing intensity impacts on different types of grassland in Xinjiang, China: a meta-analysis. Front. Plant Sci. 16:1633065. doi: 10.3389/fpls.2025.1633065
Received: 28 May 2025; Accepted: 15 August 2025;
Published: 29 August 2025.
Edited by:
Junfeng Wang, Northeast Normal University, ChinaReviewed by:
Gerardo Reyes, Lakehead University, CanadaXinghai Hao, China Agricultural University, China
Copyright © 2025 Zheng, Yao, Chao, Ma and Ma. This is an open-access article distributed under the terms of the Creative Commons Attribution License (CC BY). The use, distribution or reproduction in other forums is permitted, provided the original author(s) and the copyright owner(s) are credited and that the original publication in this journal is cited, in accordance with accepted academic practice. No use, distribution or reproduction is permitted which does not comply with these terms.
*Correspondence: Xiuzhi Ma, bHVja214eUBpbWF1LmVkdS5jbg==
†These authors have contributed equally to this work and share first authorship