 Ying Huang1,2
 Xueyan Zhang
 Xin Ma
- 1Key Laboratory of Land Surface Pattern and Simulation, Institute of Geographic Sciences and Natural Resources Research, Chinese Academy of Sciences, Beijing, China
- 2University of Chinese Academy of Science, Beijing, China
- 3Institute of Environment and Sustainable Development in Agriculture, Chinese Academy of Agricultural Sciences, Beijing, China
Introduction: With the widespread implementation of carbon capture and storage (CCS) projects, assessing the associated environmental risks has become increasingly important, particularly concerning crop responses to soil carbon dioxide (CO2) leakage. While previous studies have examined plant responses to soil CO2 stress, the implications for crop nutritional quality remain poorly characterized.
Methods: A pot experiment was conducted in Shunyi, Beijing, during autumn 2023 to quantify the effects of CO2 leakage from CCS on the nutritional indicators of leafy vegetables. The experiment included four replicates per treatment, consisting of a control group (CK) and a CO2 leakage treatment group (1500 g·m-2·d-1, G1500). Spinach yield and quality were assessed under elevated soil CO2 conditions, with emphasis on vitamin C, vitamin E, cellulose, and oxalate content.
Results: Prolonged exposure to high soil CO2 concentrations severely inhibited spinach growth, reducing leaf area, aboveground fresh weight, and root weight by 92.76%, 93.46%, and 95.83%, respectively. Chlorophyll b decreased by 35.48%, indicating impaired photosynthesis. Conversely, concentrations of vitamin C, vitamin E, and cellulose increased by 185.47%, 131.45%, and 315.03%, respectively, while oxalate content decreased by 43.08%. However, the severe biomass reduction led to an overall decline in total nutrient yield per plant.
Discussion: These findings demonstrate that soil CO2 leakage markedly inhibits growth and reduces total nutrient yield in leafy crops, despite the relative enrichment of certain nutritional components. The results highlight critical challenges to agricultural productivity and food quality in regions affected by CO2 leakage from CCS.
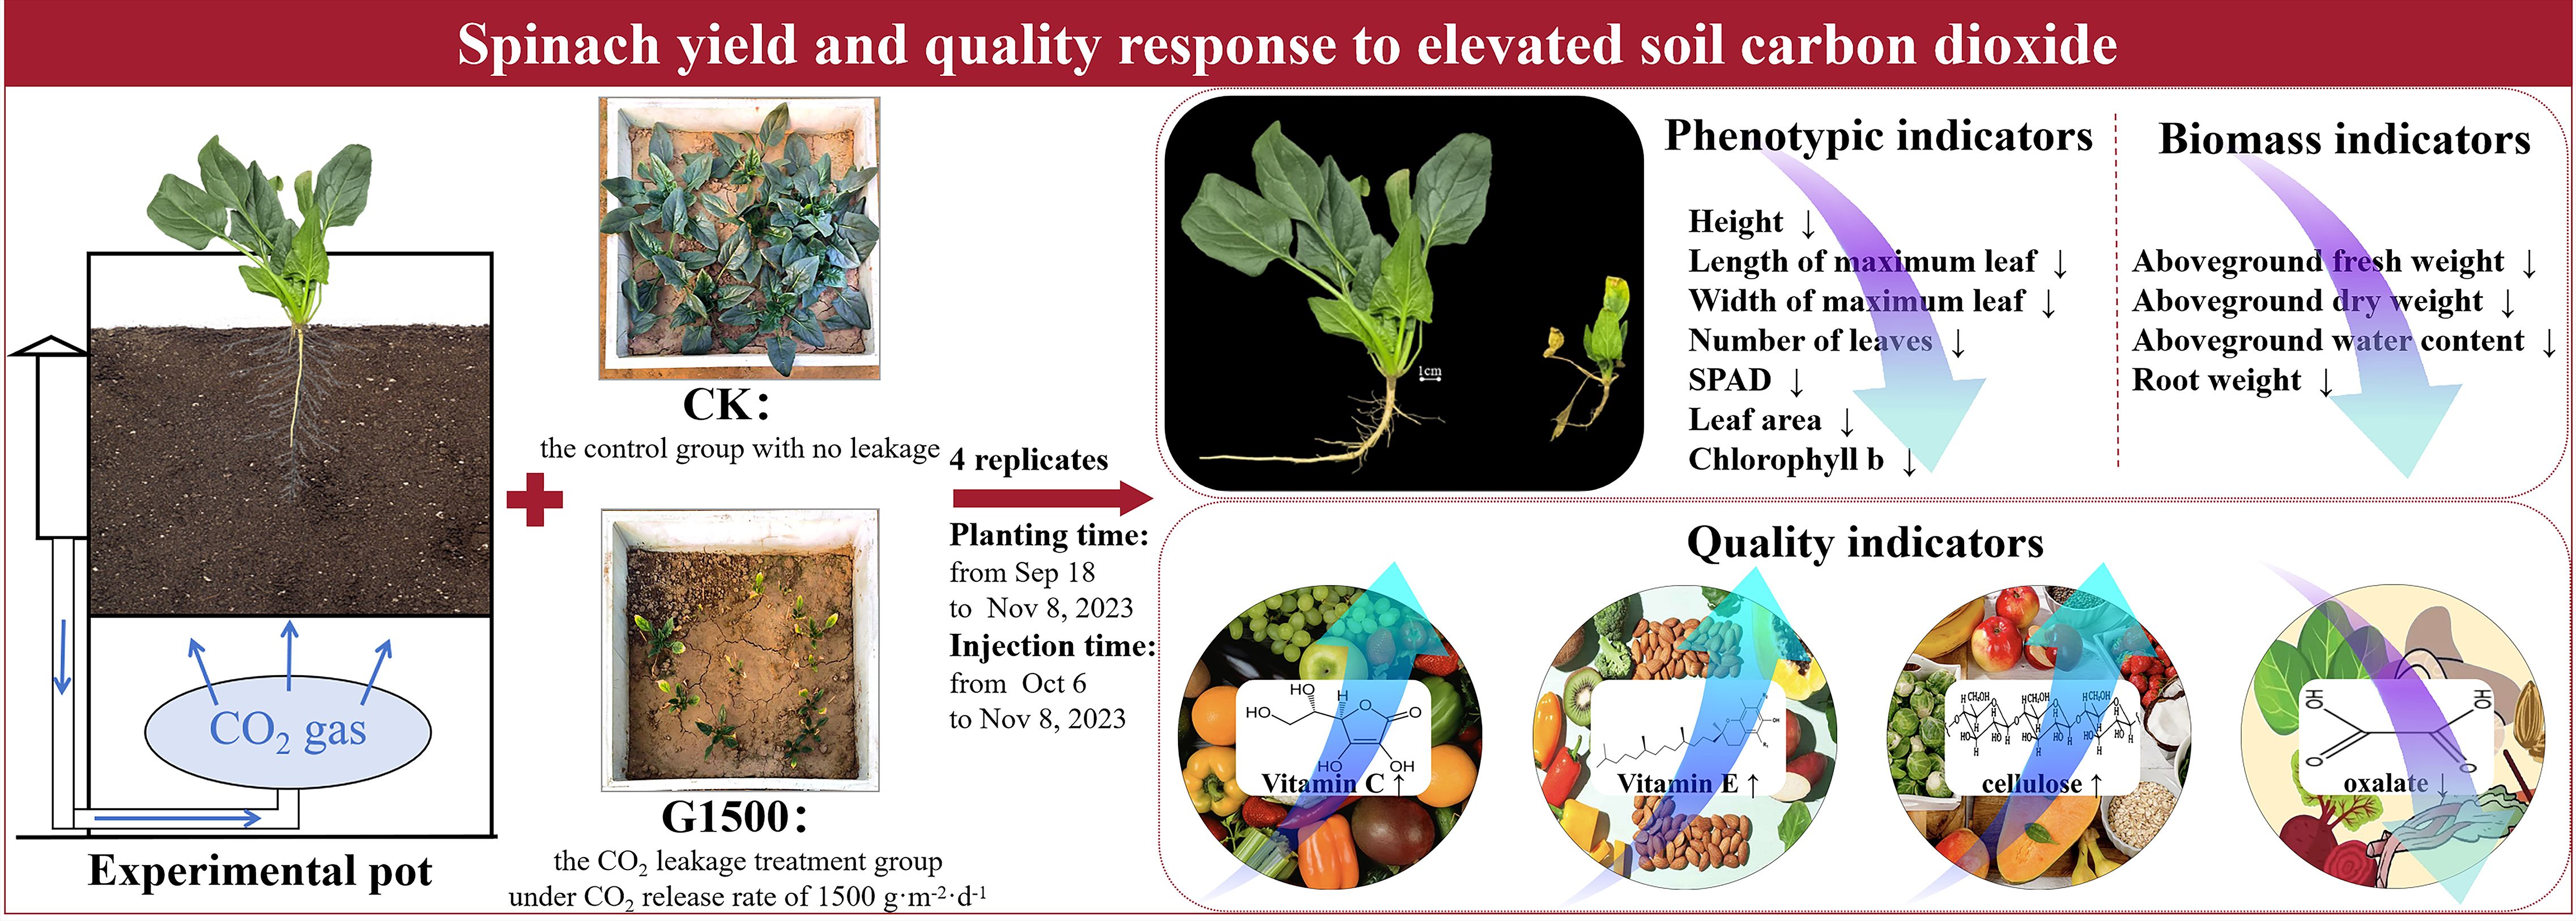
Graphical Abstract.
1 Introduction
Carbon capture and storage (CCS) technology effectively reduces carbon dioxide (CO2) emissions from primary pollution sources and is one of the key technologies to achieve global net-zero emission goals (IPCC, 2023; Chen et al., 2024). CCS involves capturing, transporting, and storing CO2 in geological formations (Bukar and Asif, 2024). However, CO2 may leak through wells or faults, as stable mineralization rarely occurs (Wu et al., 2024; Xiao et al., 2024), resulting in a persistent risk of leakage (Liu et al., 2022). Thus, assessing leakage risks is essential before large-scale CCS deployment (Zhang et al., 2022). This study focused on the impact of high soil CO2 concentrations from CCS leakage on plant growth. CO2 leakage can displace soil oxygen, inhibiting root respiration and reducing biomass (Maček et al., 2005). Natural leaks at Mammoth Mountain caused tree mortality (Farrar et al., 1995), and Mediterranean pastures near vents showed no plant growth within 6 meters, although recovery occurred farther away (Beaubien et al., 2008). As sedimentary basins suitable for CCS frequently overlap farmland, the potential impact of elevated soil CO2 concentrations on farmland has garnered considerable attention. Projects such as ASGARD (Artificial Soil Gassing and Response Detection), Ginninderra, and ZERT (Zero Emission Research and Technology) simulated leaks to study the responses of crops. ASGARD found that CO2 injection at a depth of 60 cm inhibited field bean growth and increased mortality due to hypoxia (Al-Traboulsi et al., 2012). Similarly, Zhang et al. (2024) observed reduced chlorophyll levels in wheat under CO2 leakage conditions, which correlated with the leakage rate. Lake and Lomax (2018) reported that impurities like SO2 and H2S in leaks had no significant additional impact compared to pure CO2. Crops such as maize, clover, and alfalfa show reduced biomass beyond certain CO2 thresholds (Zhang et al., 2018). However, effects on quality vary: alfalfa showed declines in crude protein and amino acids (Zhang et al., 2022), whereas sunflowers increased in crude protein and linoleic acid under leakage (Yu et al., 2020). Further research is required to assess the effects of CCS CO2 leakage on crop quality and explore the underlying mechanisms. Plants respond to external stresses through intricate physiological, molecular, and biochemical mechanisms (Bashir et al., 2021), mitigating adverse effects on growth, development, and reproduction (Hasanuzzaman et al., 2013; Ma et al., 2020a). These stress conditions often lead to the accumulation of free radicals and reactive oxygen species (ROS) in plant cells (You and Chan, 2015). To counteract this, synthesizing antioxidants such as vitamins C and E plays a crucial role in scavenging excess ROS, thereby protecting cells from oxidative damage (MacGregor, 2024). Moreover, flavonoids, a class of secondary metabolites, exhibit significant antioxidant properties, further aiding plants in counteracting ROS-induced damage (Macedo et al., 2024). In addition to these biochemical defenses, the cell wall serves a critical function under stress by enhancing its mechanical strength to maintain cellular rigidity and stability (Swaminathan et al., 2022; Zhao et al., 2024). Furthermore, environmental stress can alter the oxalate levels in plants, which may, in turn, be linked to changes in carbon metabolism (Zhou et al., 2019) and antioxidant mechanisms (Shi et al., 2024). Therefore, investigating the effects of soil CO2 stress on the contents of vitamins, flavonoids, cell walls, and oxalate provides valuable insights into the mechanisms underlying plant responses to CO2 leakage from CCS.
Spinach (Spinacia oleracea L.), known for its high sensitivity to environmental stress, is an ideal vegetable for studying stress tolerance and adaptation mechanisms (Badar et al., 2024). Rich in vitamins, carotenoids, folic acid, and minerals, spinach is an important leafy vegetable with high nutritional value (Watanabe and Ayugase, 2015) and is widely consumed globally (Xu et al., 2017). However, spinach is prone to accumulating nitrates and oxalates during growth, and excessive consumption of spinach containing these substances may pose potential health risks (Ghanati et al., 2024; Khaksar et al., 2024). The effects of elevated atmospheric CO2 on plant growth have been extensively studied (Genthon et al., 1987; Liu et al., 2018). In studies on spinach under high CO2 conditions, researchers have primarily focused on FACE (Free-Air CO2 Enrichment) experiments, investigating the impact of elevated atmospheric CO2 (eCO2) on spinach morphology, biomass, and quality. Ahmad et al. (2024) found that under eCO2 conditions, spinach root length and stem length increased significantly by 36.76% and 20.42%, respectively, and the fresh weight, dry weight, leaf number, and leaf area all showed growth. Increased atmospheric CO2 promoted photosynthetic activity, enhancing crop productivity (Ma et al., 2021). In a meta-analysis of leafy vegetables, Dong et al. (2020) also found that spinach yield increased by 35% under eCO2 conditions. Giri et al. (2016) evaluated the effects of eCO2 concentrations on spinach growth and nutritional quality, revealing a significant decrease in leaf stomatal conductance and a reduction in the concentrations of key nutrients such as protein, potassium, and phosphorus, while total phenols and antioxidant capacity remained unchanged, indicating a negative impact of eCO2 on spinach’s nutritional quality. However, no experimental studies have yet assessed the effects of CCS leakage on spinach’s physiological morphology, biomass, and nutritional quality. However, a study on lettuce, which belongs to the same leafy vegetable category as spinach, showed that under elevated soil CO2 conditions, both morphological indicators and yield decreased significantly; although unit nutrient content increased, the total nutrient content still declined due to reduced biomass, indicating potential adverse effects of CCS leakage on leafy vegetable crops (Huang et al., 2025).
Plant adaptation mechanisms to environmental stress include avoidance and tolerance, which may lead to changes in metabolites and nutritional quality under stress conditions (Badar et al., 2024). The response of spinach to soil CO2 leakage stress and its effects on nutritional quality still require further experimental validation. This study hypothesizes that CO2 leakage will significantly affect spinach leaf morphology, biomass, and nutritional quality during the CCS process, influencing agricultural production. The main objective of this research is to understand spinach’s response to CCS leakage in terms of (1) morphology and yield and (2) nutritional quality, mainly changes in vitamin C, vitamin E, cellulose, and oxalate content. Although the pot-based approach limits extrapolation to field conditions, this well-controlled study provides the first documented evidence of CO2 leakage effects on spinach biomass and key nutritional components.
2 Materials and methods
2.1 Experiment location and setup
The experiment was conducted at the Shunyi Agricultural Comprehensive Experimental Station, located in Beijing, China (40°5′41.87″N, 116°55′26.76″E). The region has a temperate semi-humid monsoon climate, with an average annual temperature of 11.5°C, an annual sunlight duration of 2750 hours, and an average annual precipitation of 625 mm. The frost-free period lasts approximately 195 days.
The experimental setup consisted of CO2 gas bottles, pots, a CO2 flow control system, and gas ducts (Figures 1A, B). The dimensions of the pots were 50 cm (length) × 50 cm (width) × 80 cm (height). The internal structure of the pot was divided into three layers from bottom to top: the CO2 chamber, the permeable separator, and the soil chamber. The depth of the CO2 chamber was 30 cm, while the depth of the soil chamber was 50 cm. CO2 from the gas bottles entered the bottom CO2 chamber via ducts, and the CO2 was then diffused into the soil chamber through the permeable separator. The soil used in the experiment was collected from the surface layer of the nearby farmland and is classified as tidal cinnamon soil with a pH of 7.32. The soil was filled to a depth of 40 cm in the pots. Drainage valves were installed at the bottom of each pot to remove excess irrigation water, ensuring accurate water management during the experiment.
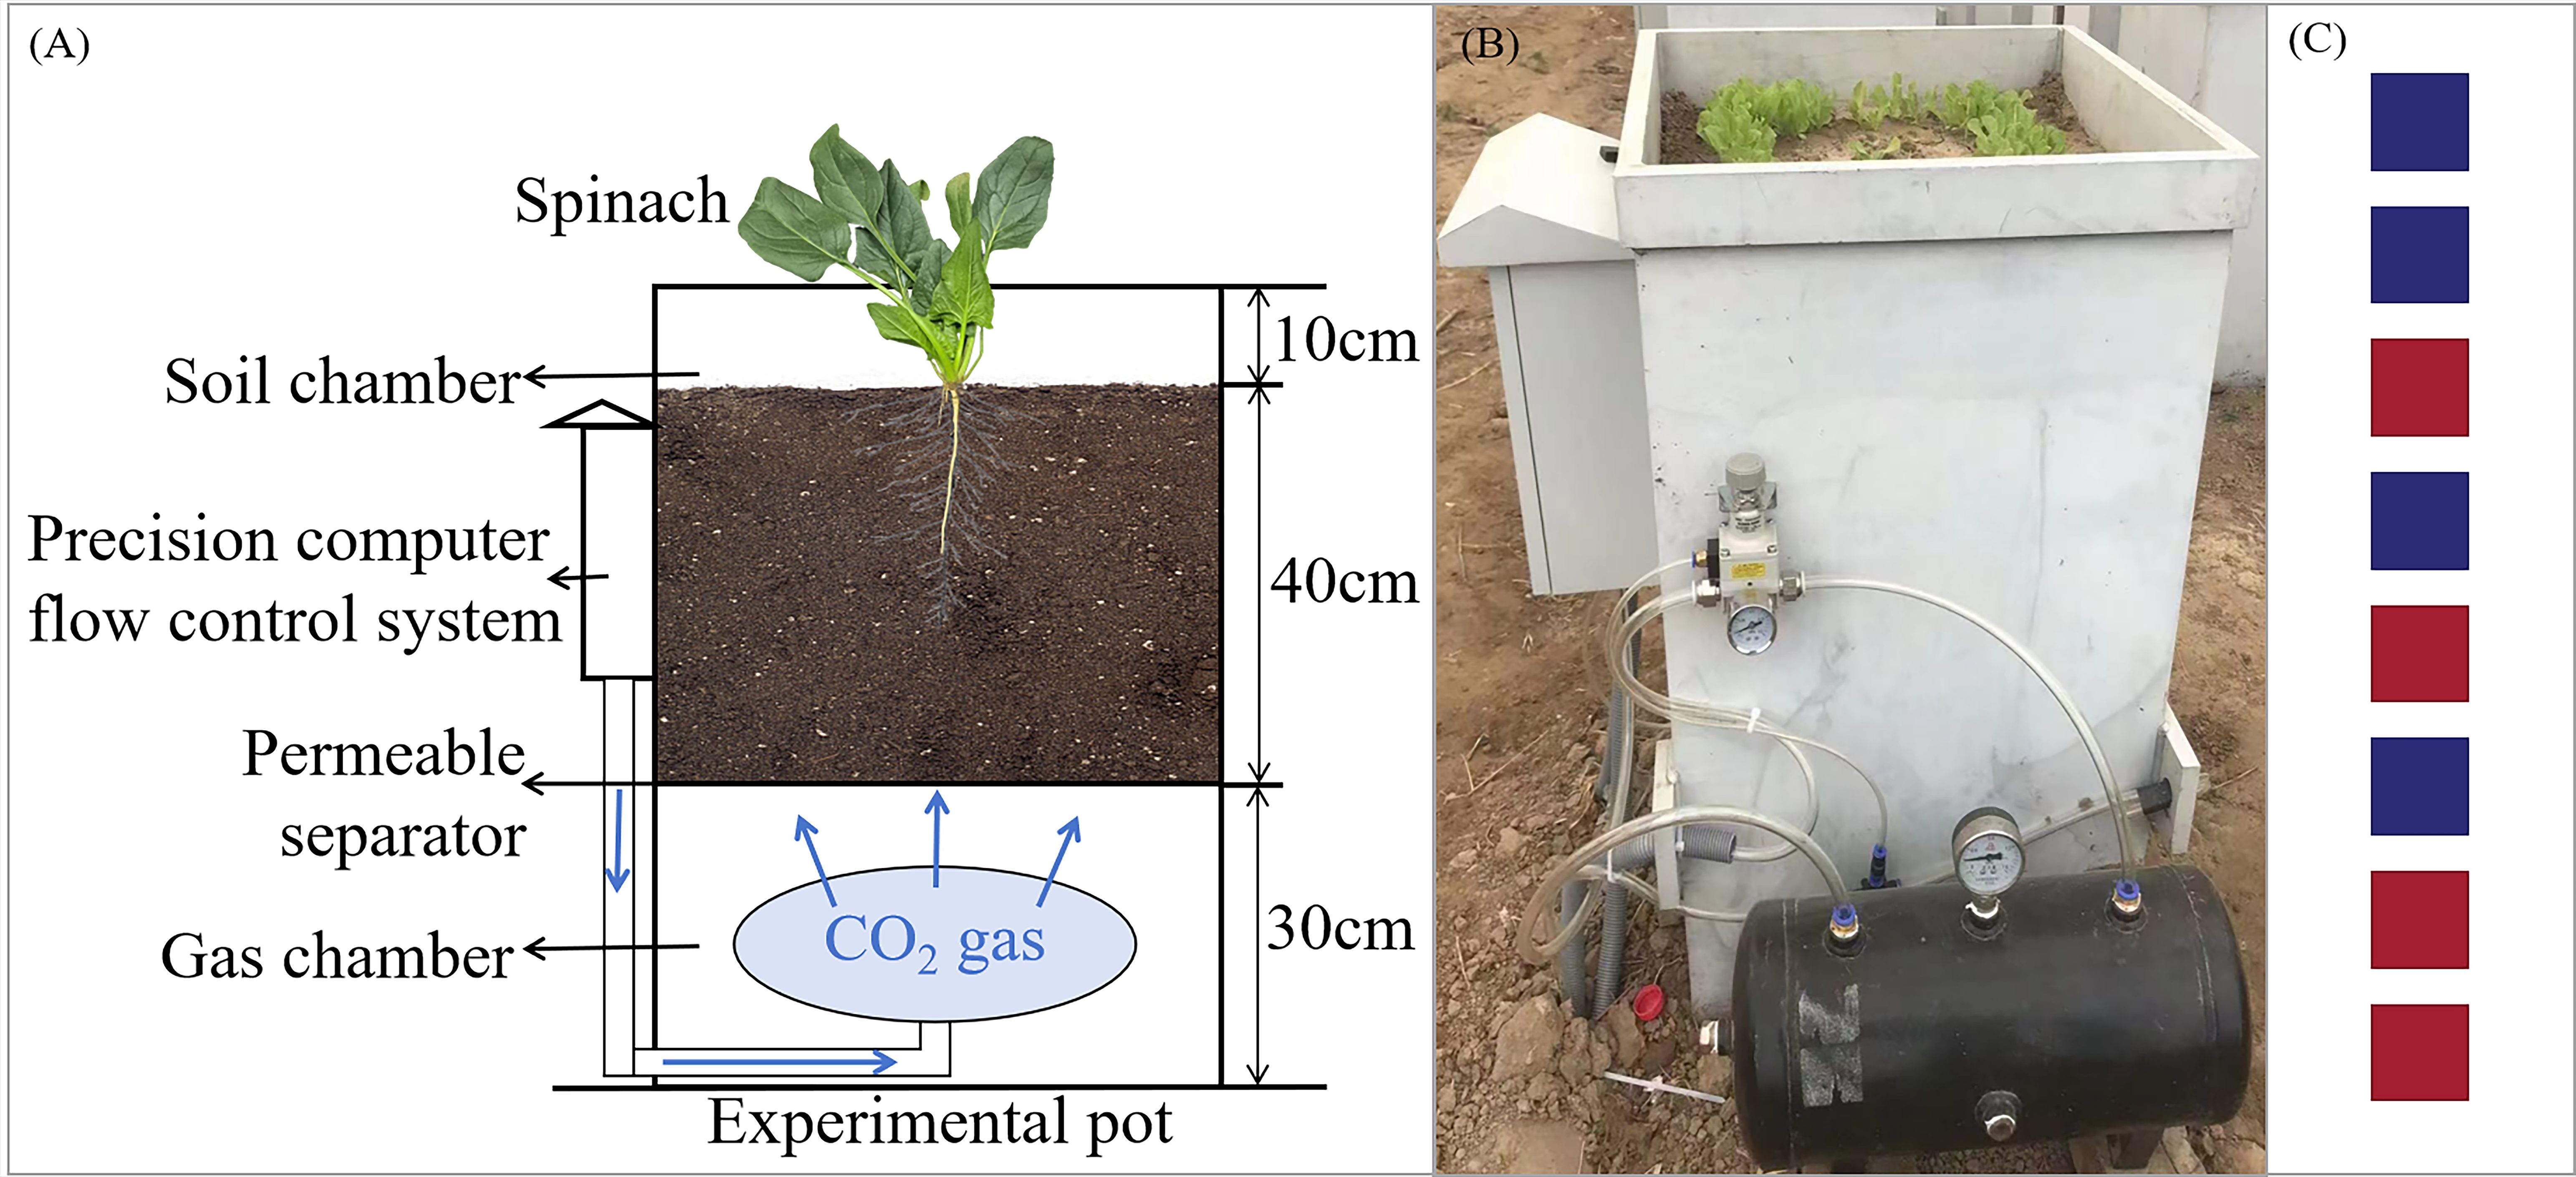
Figure 1. Schematic diagram of the experimental setup and CO2 release device. (A) Schematic diagram of experimental design, (B) the in-site photo of the lettuce leakage experiment, (C) pot placement, where red represents G1500, and blue represents CK.
2.2 CO2 leakage treatment setting and plant management
The experiment, conducted from September 18 to November 8, 2023, included the CO2 leakage treatment group (G1500) and the control group (CK). The leakage group had a CO2 release rate of 1500 g·m-2·d-1, while the control group did not receive CO2. Each treatment consisted of 4 replicates, totaling 8 pots, arranged in a row from east to west and placed inside an open-top greenhouse covered with a film to prevent external precipitation interference. The distance between the pots was 0.8 m to prevent mutual interference. The layout of the pots for both G1500 and CK was randomized, as shown in Figure 1C. Leakage began on October 6, 2023, and lasted until the spinach harvest on November 8, 2023. The CO2 injection flux was controlled by a ball valve next to the gas duct and the pot’s precision computer flow control system. The relationship between the flux and rate is as follows:
Where F represents the CO2 injection flux (g·m-2·d-1), v is the CO2 injection rate (mL/min), ρ is the CO2 density at atmospheric pressure (approximately 1.977 g/L), and s is the cross-sectional area of the pot (0.25 m2). When the F was 1500 g·m-2·d-1, the corresponding injection rate (v) was 131.70 mL/min (Equation 1), with unit conversion applied between days and minutes to ensure consistency of time dimensions. According to our previous study, higher CO2 injection fluxes resulted in lower O2 concentrations at 40 cm soil depth. Under a CO2 release rate of 1500 g·m-2·d-1, the soil O2 concentration was 6.52 vol%, whereas CK exhibited an O2 concentration of 17.95 vol% (Zhang et al., 2016).
The spinach variety used was Shubo No. 15, provided by China Vegetable Seed Technology Co., Ltd. (Beijing). Before sowing, all pots were fertilized with nitrogen-phosphorus organic fertilizer as base fertilizer. Spinach seeds were sown on September 18, 2023, and harvested on November 8, 2023. The same management practices were applied to all pots during growth to ensure comparable treatments. Table 1 summarizes the management practices applied during the experiment.
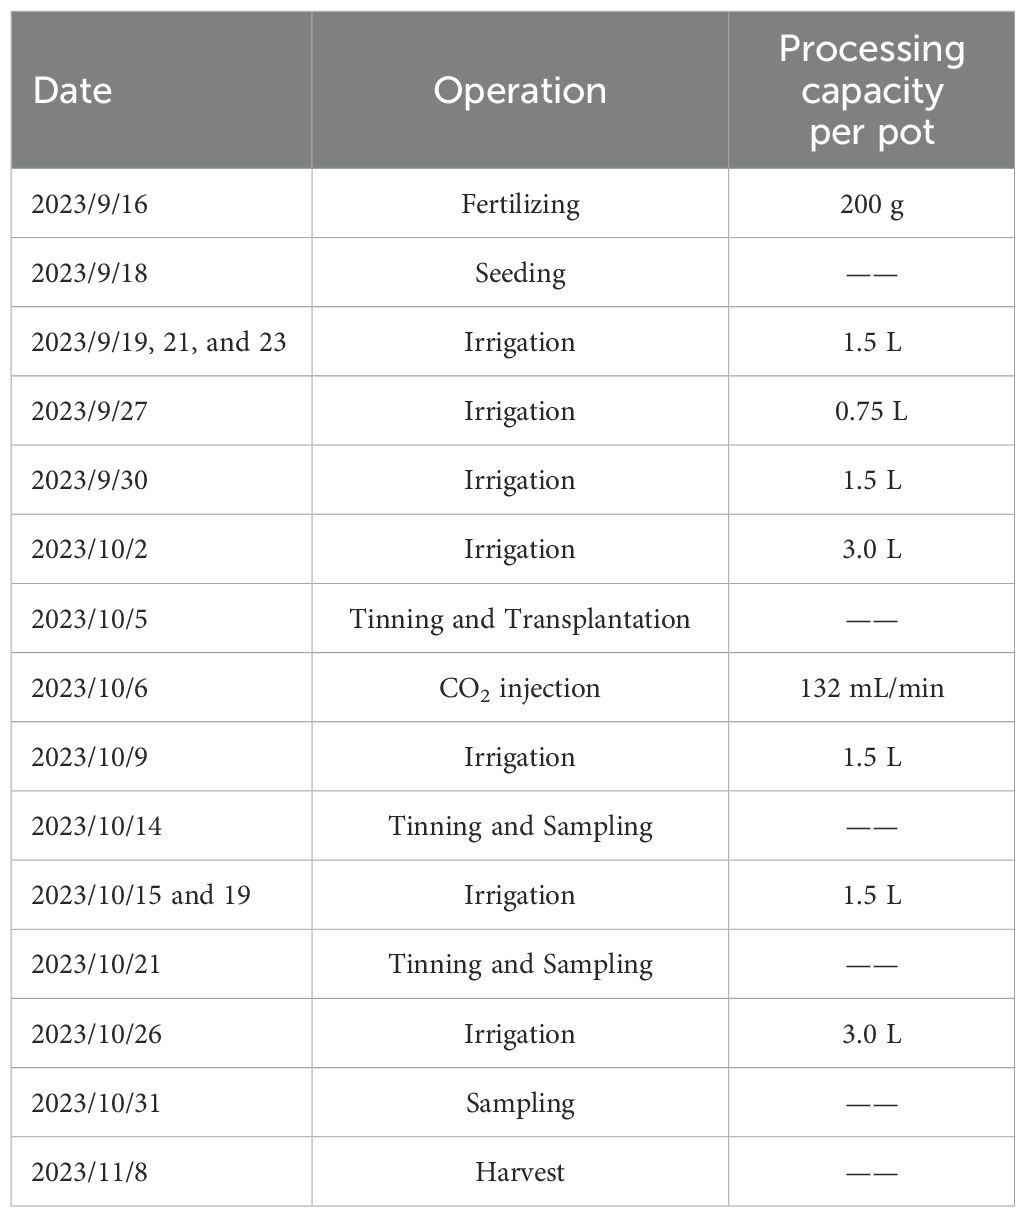
Table 1. Management of the experimental process for potted crops.
2.3 Measuring the variables
2.3.1 Phenotypic indicators
The phenotypic indicators of spinach included plant height, number of leaves, maximum leaf length, maximum leaf width, and relative chlorophyll value (SPAD). Plant height serves as an indicator of overall developmental status and biomass allocation; the number of leaves correlates directly with photosynthetic capability and yield potential; maximum leaf length and width facilitate the assessment of leaf expansion and allow inference of available photosynthetic surface area; in addition SPAD values offer a rapid, non-invasive proxy for chlorophyll concentration, which further reflects the plant’s nitrogen availability and photosynthetic competence. Integrated monitoring of these parameters enables in situ acquisition of multidimensional data on plant physiological status, thereby establishing a robust foundation for evaluating developmental trajectories.
At the start of the CO2 leakage treatment, nine spinach plants with similar growth conditions were randomly selected and tagged from each pot to ensure consistent measurements for the same group of plants. Plant height, number of leaves, maximum leaf length, and maximum leaf width were measured twice a week with a ruler, beginning at the onset of CO2 leakage. SPAD of the leaves was also measured twice a week starting from October 14, 2023, using the SPAD-502PLUS chlorophyll instrument (Konica Minolta, Tokyo, Japan). For SPAD measurements, one reading was taken from the tip, middle, and base of each selected leaf, and the mean of the three readings was used for analysis. Nine tagged plants were sampled per pot.
2.3.2 Biomass indicators
Three sampling events were conducted throughout the spinach growth period. For each sampling, three spinach plants with similar growth conditions were randomly selected from each pot to measure the leaf area, aboveground biomass, and aboveground water content. The average value of the three plants was used for analysis. At harvest, the same indicators, including belowground biomass, were also measured for the previously tagged plants. The leaf area was measured using the weight method (Shi et al., 2018). Assuming a proportional relationship between leaf weight and leaf area, the total leaf area of each plant was calculated by measuring the weight of leaves with a known area. Aboveground biomass was divided into fresh weight and dry weight. Fresh weight was measured immediately after harvest using a calibrated balance, and dry weight was measured after drying the samples in an oven at 80°C to constant weight (Wu et al., 2022). Aboveground water content was calculated as the difference between fresh and dry weights, expressed as a percentage of fresh weight. Belowground biomass was measured by carefully excavating the spinach roots, cleaning them, and drying the surface moisture with absorbent paper before weighing.
2.3.3 Quality indicators
The quality indicators for spinach included nitrate nitrogen, vitamin C, vitamin E, flavonoids, cellulose, and oxalate content. The concentrations of all quality indicators were measured from fresh samples. After harvest, four samples were taken from each pot, and all indicators except oxalate content were analyzed using the microplate method with a microplate reader (Li, 2000). The nitrate nitrogen content in spinach was measured using a plant nitrate nitrogen reagent kit. In acidic sulfuric conditions, nitrate (NO3-) reacts with salicylic acid to form nitrosalicylic acid, which appears yellow under alkaline conditions with a peak absorption at 410 nm, and the nitrate nitrogen content was determined by colorimetry (Zhao and Wang, 2017). The vitamin C and vitamin E content were measured using reduction-based assays, where ascorbic acid (AsA) and vitamin E were used to reduce Fe3+ to Fe2+, forming red complexes with bathophenanthroline (He et al., 2012). Flavonoids were determined using the NaN2-Al(NO3)3-NaOH colorimetric method, where flavonoids form red complexes with aluminum ions in alkaline nitrite solutions, measured at 510 nm (Sultana et al., 2009). Cellulose content was determined using the anthrone reagent method. In this method, glucose derived from fiber undergoes dehydration under concentrated sulfuric acid, forming furfural-like compounds. These compounds react with anthrone reagent to form a blue-green substance, which is analyzed at 620 nm (Updegraff, 1969). The oxalate content was analyzed by chromatographic separation using the Waters ACQUITY UPLC I-CLASS Ultra-performance liquid chromatography and mass spectrometric analysis using the Waters XEVO TQ-S Micro tandem quadrupole mass spectrometer (Gupta et al., 2023).
2.4 Data analysis
The primary purpose of data analysis was to explore whether there were significant differences between G1500 and CK in the measured indicators. Data analysis adopted different analytical methods based on the characteristics of the measured indicators.
For phenotypic indicators repeatedly measured during spinach growth, two-way analysis of variance (ANOVA) was used in Python 3.13 to evaluate the effects of Group (G1500 vs CK), Time (measurement dates), and their interaction (Group × Time). When ANOVA indicated significant effects, Welch t-test was conducted for pairwise comparisons between G1500 and CK at each time point, and Bonferroni correction was applied to control for multiple testing.
For the other dataset, the Shapiro–Wilk test of normality was performed in Python 3.13. When both CK and G1500 satisfied the normality assumption, Levene’s test was used to assess homogeneity of variances, and based on the result, either an independent sample t-test (equal variances assumed) or a Welch t-test (equal variances not assumed) was conducted in IBM SPSS Statistics 26. For datasets violating the normality assumption, a permutation test was performed in Python 3.13, as it makes no distributional assumptions and provides robust inference with small or unequal samples.
P denotes the significance level, and P< 0.05 was considered the threshold for statistical significance between CK and G1500. Result figures were drawn using Origin 9.8 software (OriginLab, Northampton, MA, USA).
Additionally, the ANOVA results are summarized in Appendix Table 1. The pairwise comparison results of Bonferroni corrections for G1500 and CK across time points are shown in Appendix Table 2. While the results of the Shapiro–Wilk test for normality and Levene’s test for homogeneity of variances are presented in Appendix Table 3.
3 Results
3.1 Changes in spinach morphology under leakage
After 34 days of CO2 leakage, spinach was harvested, and significant differences in growth were observed between G1500 and CK. Figures 2A–C compare the harvest conditions of the spinach in both groups. In G1500, spinach growth was significantly reduced compared with CK.
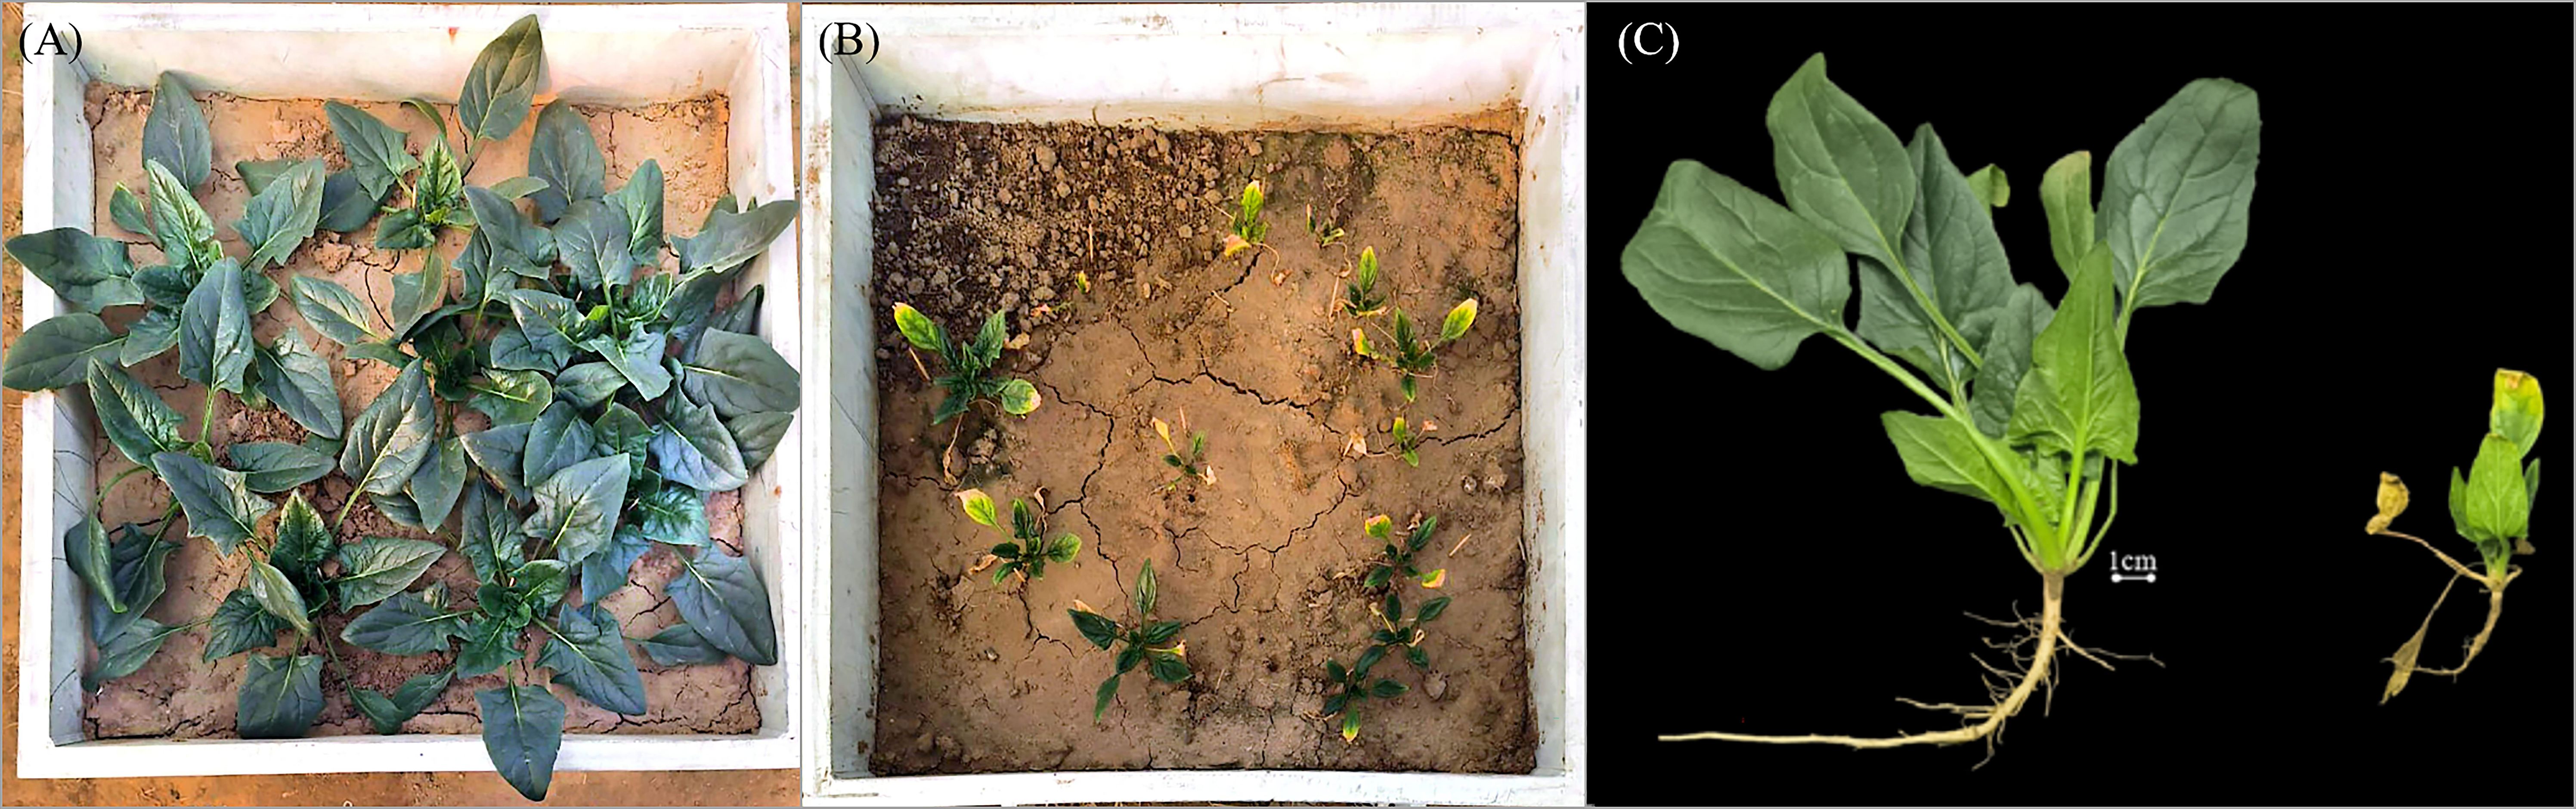
Figure 2. Comparison of the growth of spinach between CK and G1500 during harvest. (A) Spinach growth of CK, (B) G1500, and (C) individual spinach plants, left CK and right G1500.
Under the 1500 g·m-2·d-1 CO2 leakage condition, the height of the spinach plants gradually deviated from CK (Figure 3A). The spinach of G1500 showed rapid initial growth followed by a fluctuating decline, whereas CK exhibited a continuous and steady increase in height. The height difference between the two groups was substantial, indicating that CO2 significantly affected spinach growth. By the end of the experiment, the height of G1500 had decreased by 54.21% compared with CK (N = 36, P< 0.01, Table 2). Further analysis using an independent sample t-test on the height data indicated a rapid response to CO2 leakage. Significant differences were observed as early as the ninth day after the leakage began, indicating that spinach is highly sensitive to elevated soil CO2 concentrations, with noticeable changes in plant height.
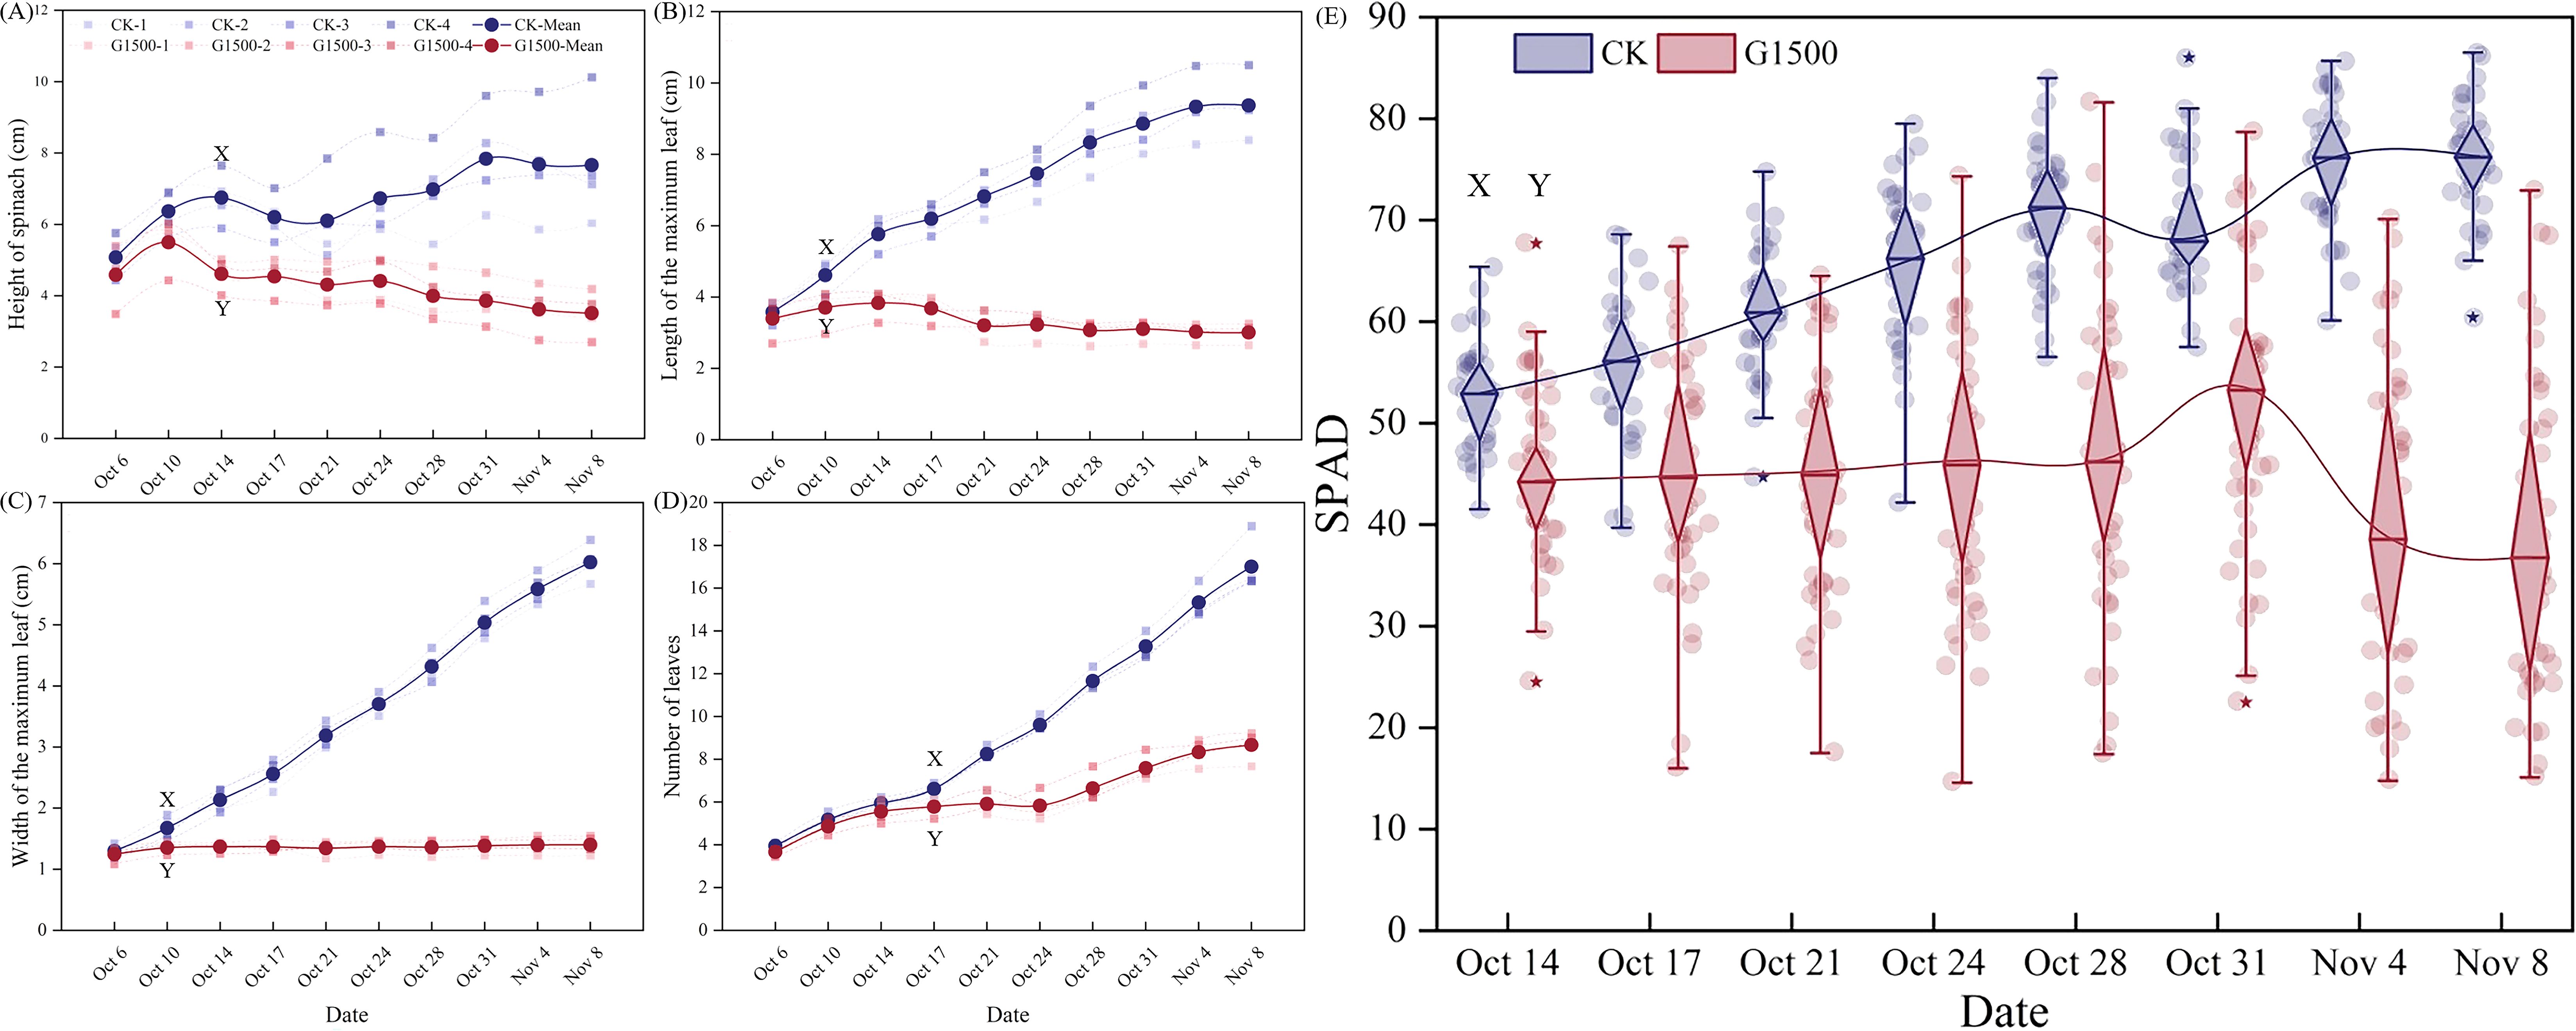
Figure 3. Changes in spinach leaves and SPAD under CO2 leakage conditions. (A) Plant height, (B) maximum leaf length, (C) maximum leaf width, (D) number of leaves response curve, and (E) SPAD box plot. The XY label indicates a significant difference between G1500 and CK from that date, as determined by the independent sample t-test. In (A–D), the real point represents the mean of the morphological indicator, and the colored area represents the standard deviation. In (E), “*” represents the deviation value, and the background circle represents the specific numerical value. Blue represents CK, and red represents G1500.
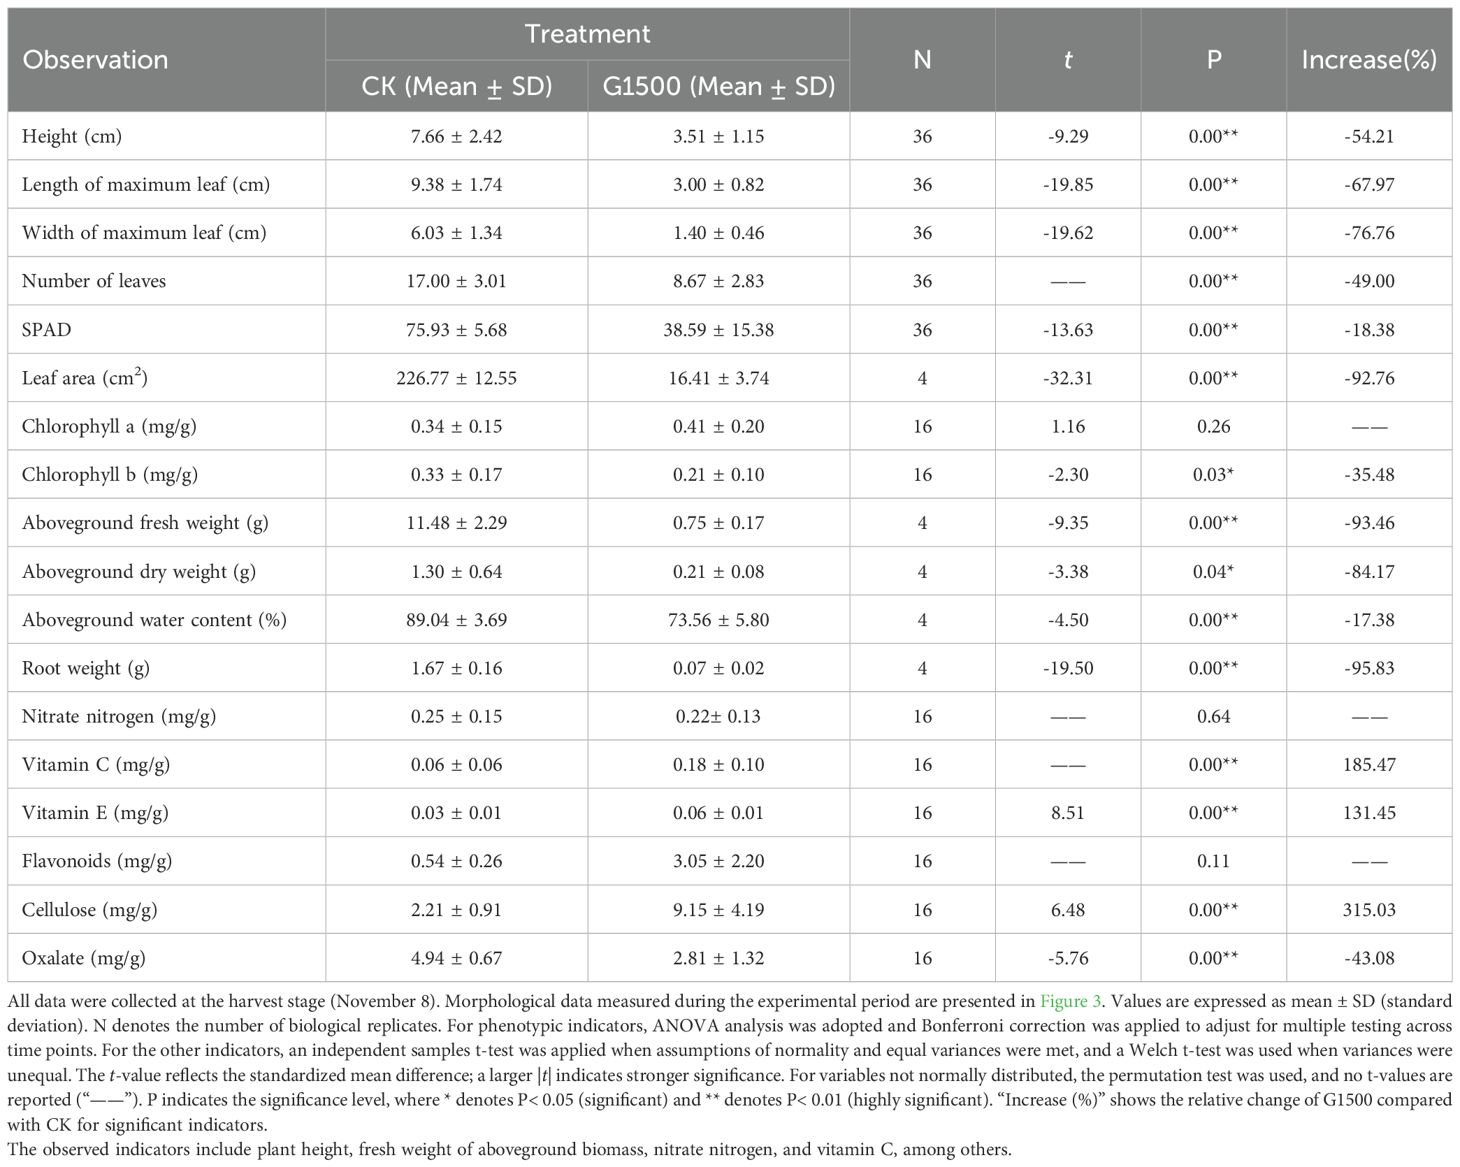
Table 2. Significance analysis of spinach response to CO2 leakage at harvest (November 8th).
Moreover, CO2 leakage inhibited the spinach plants’ maximum leaf length and width. As shown in Figure 3B, the maximum leaf length of G1500 grew slowly during the early leakage period and began to fluctuate and decrease from day 12. By harvest time, the maximum leaf length of G1500 had decreased by 67.97% compared with CK (N = 36, P< 0.01, Table 2). The decline in leaf length was associated with yellowing and curling of the leaves. Figure 3C shows that the maximum leaf width of G1500 displayed a slightly increasing trend, indicating that the high concentration of CO2 in the soil had a strong inhibitory effect on leaf expansion. At harvest, the maximum leaf width was significantly reduced by 76.76% compared with CK (N = 36, P< 0.01, Table 2). Further analysis showed that significant differences in maximum leaf length and width between G1500 and CK were first observed on the fifth day of leakage. Even more significant differences were noted at harvest, confirming that elevated soil CO2 concentrations severely inhibited spinach leaf growth.
Figure 3D shows that while the number of leaves in both groups increased overall, G1500 had a 49.00% reduction in leaf number compared with CK (N = 36, P< 0.01, Table 2). This suggested that CO2 leakage suppressed the leaf formation of spinach. Notably, on day 19, G1500 exhibited a slight reduction in leaf number. As illustrated in Figure 2C, several leaves under stress displayed chlorosis and wilting, indicative of senescence.
Figure 3e shows the response of spinach SPAD under CO2 leakage conditions. During the early stages of leakage, the SPAD of G1500 was lower than CK but did not show significant differences. However, from day 12, after CO2 leakage began, significant differences in SPAD were observed, with CK exhibiting a fluctuating decline. At harvest, the SPAD of G1500 was 18.38% lower than that of CK (N = 36, P< 0.01, Table 2). Mainly, spinach SPAD under leakage showed a gradual increase followed by a sharp decline, indicating that prolonged exposure to elevated soil CO2 concentrations suppressed chlorophyll levels in spinach, leading to leaf yellowing. Further analysis of chlorophyll content at harvest revealed a significant reduction in chlorophyll b content of G1500 (decreased by 35.48%, N = 16, P< 0.05, Table 2), suggesting that high CO2 concentrations primarily inhibited the synthesis of chlorophyll b in spinach (Figure 4B).
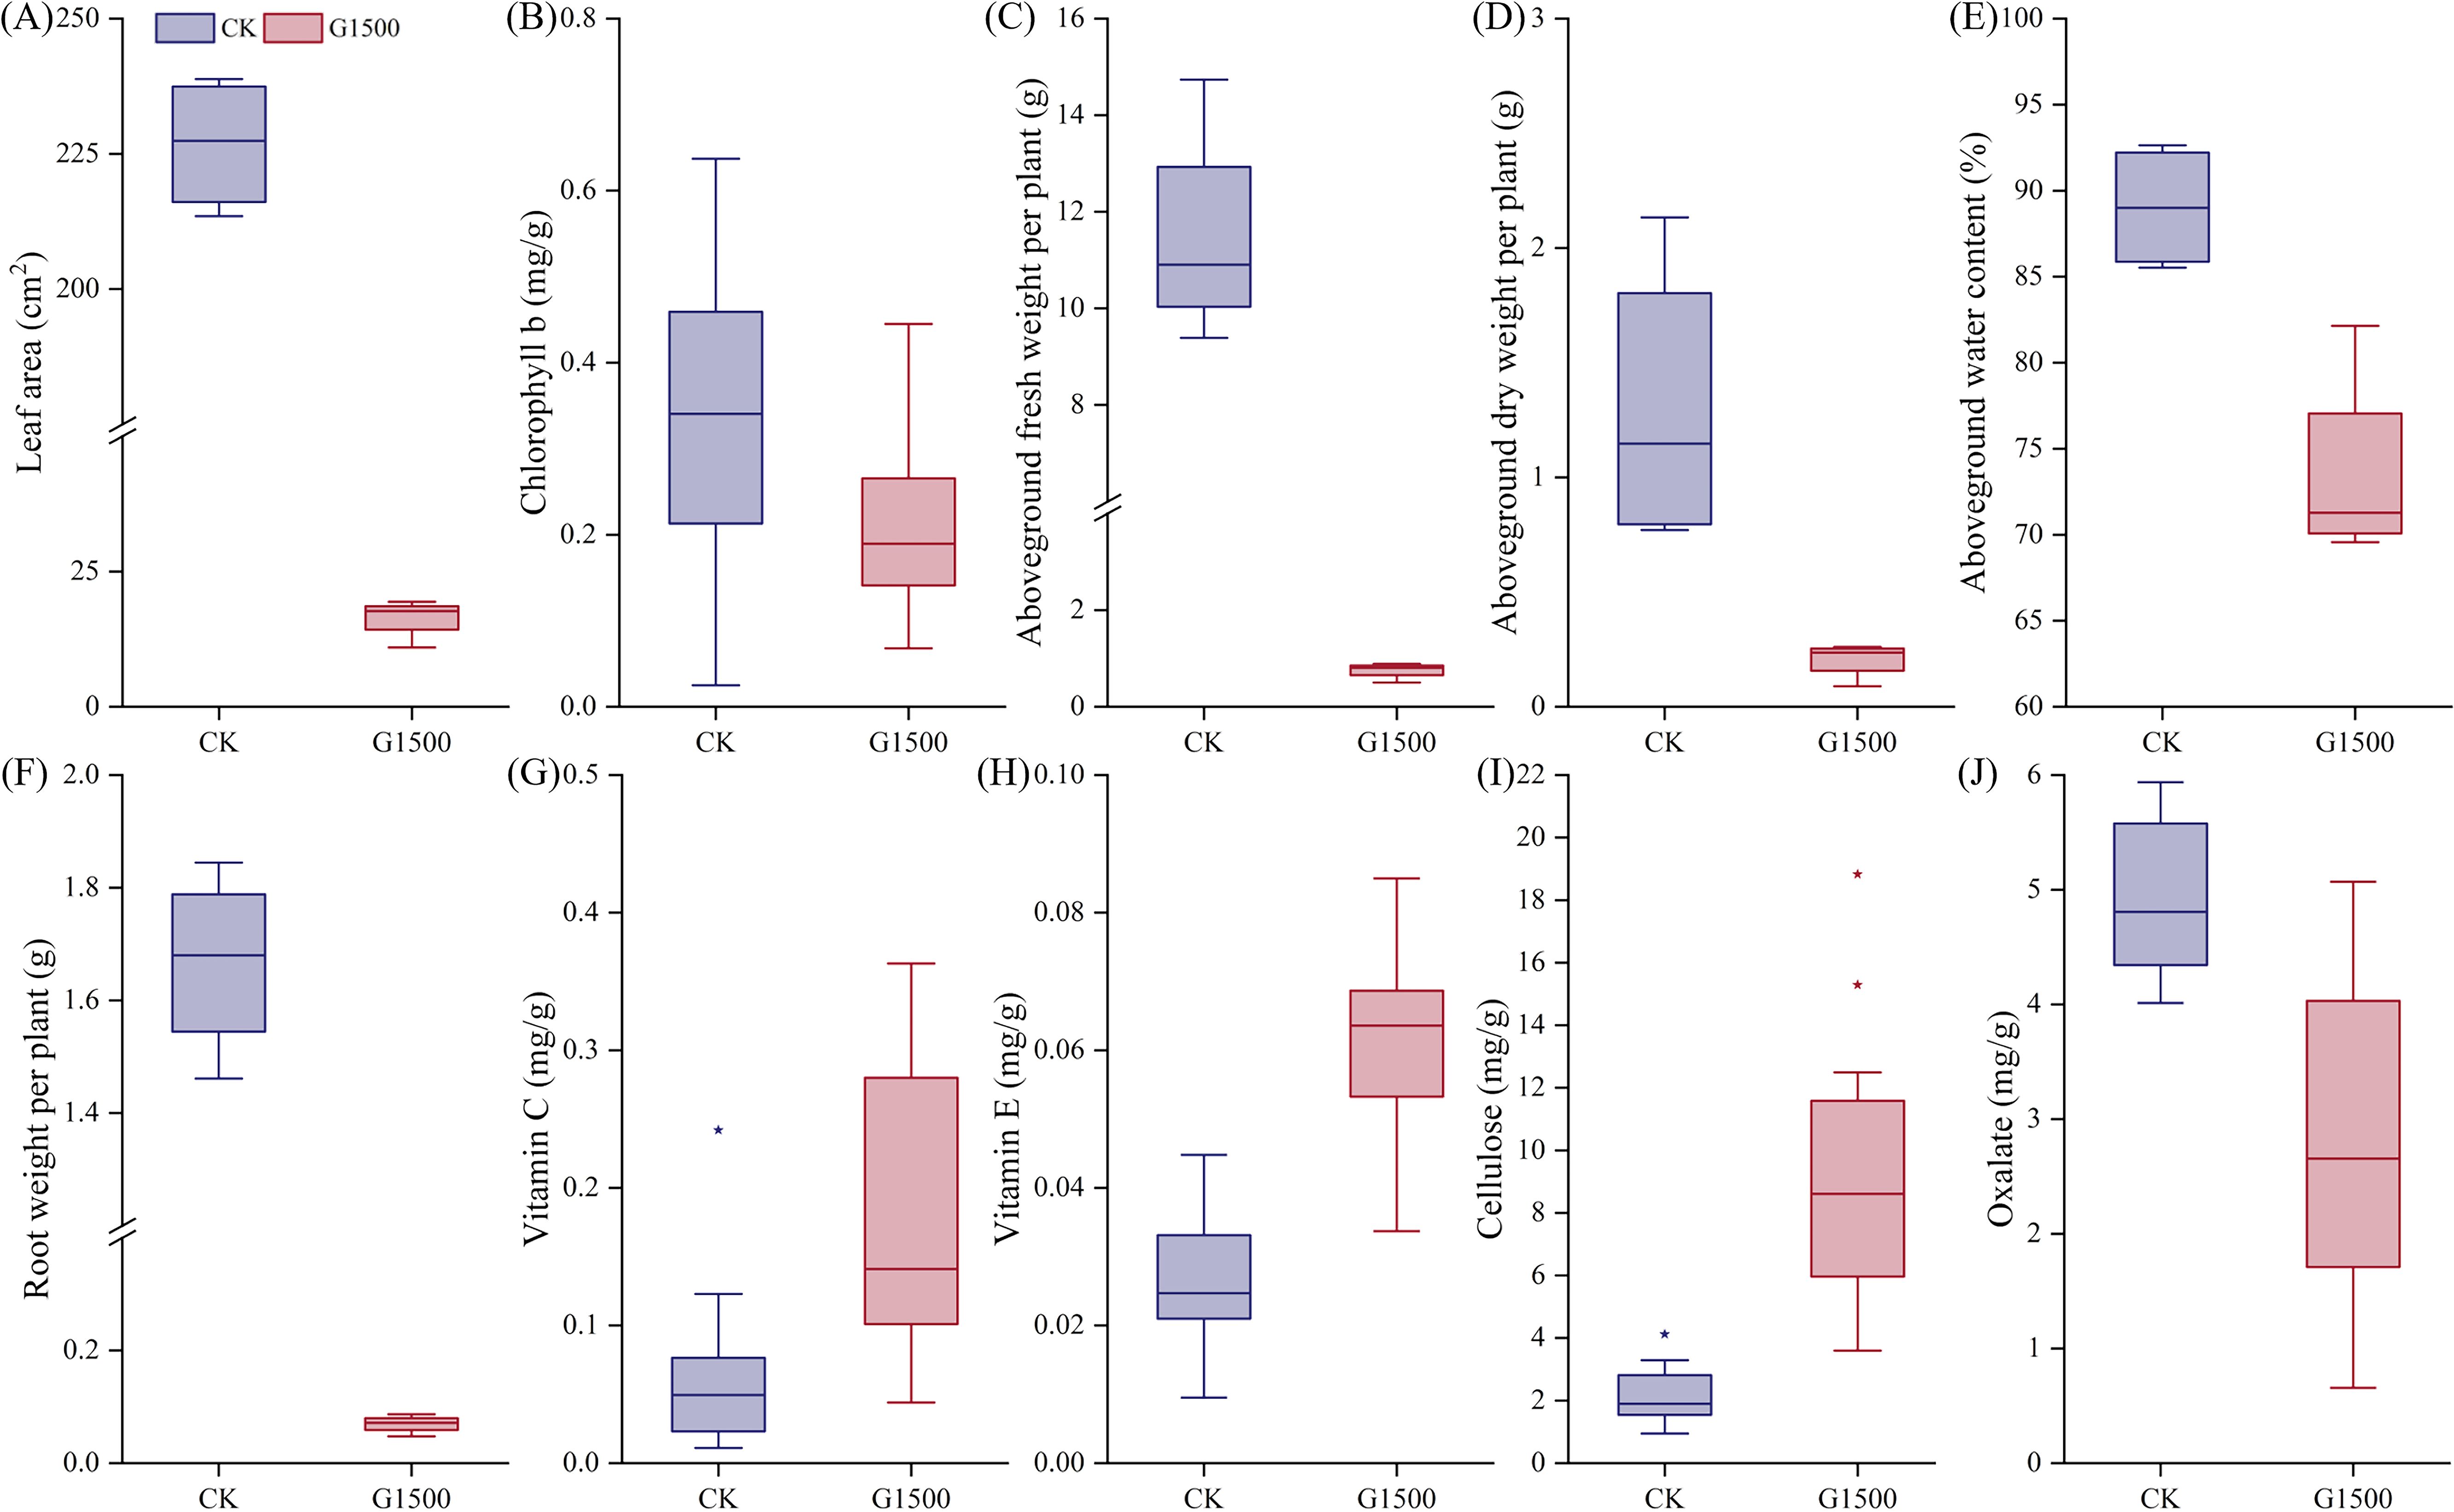
Figure 4. Changes in morphology, biomass, and quality of spinach under leakage treatment during harvest on November 8th. (A) Leaf area, (B) chlorophyll b, (C) aboveground fresh weight per plant, (D) aboveground dry weight per plant, (E) aboveground water content (%), (F) aboveground fresh weight (root weight) per plant, (G) vitamin C, (H) vitamin E, (I) Cellulose, and (J) Oxalate box plot. “*” represents the deviation value, and the background circle represents the specific numerical value. Blue represents CK, and red represents G1500.
3.2 Changes in spinach biomass under leakage
At harvest, significant changes in both aboveground and belowground biomass were observed. Figure 4A presents the leaf area per plant at harvest. The leaf area of G1500 decreased by 92.76% compared with CK, indicating a highly significant difference and suggesting that CO2 leakage severely impaired spinach leaf growth. Figures 4C, D show that the aboveground fresh weight of G1500 (0.75 ± 0.17 g) was significantly lower than that of CK (11.48 ± 2.29 g), representing a 93.46% decrease (N = 12, P< 0.01, Table 2). The aboveground dry weight of G1500 (0.21 ± 0.08 g) was also significantly reduced by 84.46% compared with CK (1.30 ± 0.64 g) (N = 4, P< 0.05, Table 2). Further analysis of the aboveground water content (Figure 4E) revealed that CO2 leakage significantly affected the water content, which decreased by 17.38% (N = 4, P< 0.01, Table 2).
Under CO2 leakage conditions, Figure 4F shows that the belowground fresh weight (0.07 ± 0.02 g) was much lower than that of CK (1.67 ± 0.16 g), a decrease of 95.83% (N = 4, P< 0.01, Table 2). As shown in Figure 2C, spinach roots in the high CO2 environment underwent morphological changes, with the main root appearing shorter and thinner, and a reduction in the number and length of fine roots. This indicates that CO2 leakage restricted the roots’ ability to absorb water and nutrients from the soil.
3.3 Changes in spinach quality under leakage
Vegetables contain essential dietary vitamins (Chaudhari et al., 2024), including antioxidants such as vitamins C and E (Stahl and Sies, 1997). In this experiment, CO2 leakage significantly increased spinach’s vitamin C and E content (Figures 4G, H). Vitamin C increased from 0.06 ± 0.06 mg/g to 0.18 ± 0.10 mg/g, representing a 185.47% increase, and vitamin E increased from 0.03 ± 0.01 mg/g to 0.06 ± 0.01 mg/g, a 131.45% increase (N = 16, P< 0.01, Table 2). Vitamin C and E are important components in plant-induced resistance mechanisms, which possess antioxidant properties (Boubakri et al., 2016). The higher increase in vitamin C compared to vitamin E suggested that CO2 leakage may more readily induce the production of disease-resistant compounds associated with vitamin C in spinach.
Cellulose, an important component of plant cell walls (Maleki et al., 2016), affects the strength and rigidity of the walls (Taylor, 2008). Figure 4I shows a significant increase in cellulose content of G1500, from 2.21 ± 0.95 mg/g to 9.15 ± 4.19 mg/g, a 315.03% increase compared with CK (N = 16, P< 0.01, Table 2). This suggested that CO2 leakage may stimulate cellulose synthesis, which could help spinach plants cope with the stress induced by high soil CO2 concentrations.
Moreover, the oxalate content in spinach decreased significantly under high CO2 conditions (Figure 4J), from 4.94± 0.670 mg/g to 2.81 ± 1.32 mg/g (N = 16, P< 0.01, Table 2), a reduction of 43.08%. Oxalate can accumulate in spinach and interfere with the absorption of calcium and zinc, potentially leading to kidney stone formation (Bsc, 1999). The reduction of oxalate content in spinach under CO2 leakage conditions may represent a potential pathway for reducing oxalate levels in vegetables.
According to the results in Table 3, a sharp decline in the total content of all measured substances was observed in the G1500 group compared with CK, primarily due to a severe reduction in biomass. The aboveground fresh weight, which serves as the basis for the total content calculation, drastically decreased from 11.48 g in CK to only 0.75 g in G1500. Consequently, although the average concentrations of several key quality indicators (such as vitamin C, vitamin E, flavonoids, and cellulose) increased in G1500, the drastic loss of biomass ultimately led to a substantial reduction in their total accumulation. The total content of nitrate nitrogen plummeted from 2.83 mg to 0.17 mg, vitamin C declined from 0.69 mg to 0.14 mg, and vitamin E content declined from 0.30 mg to 0.05 mg. The total content of oxalate plummeted by over 96.28%, while flavonoids and cellulose were reduced by approximately 63.06% and 72.96%, respectively.
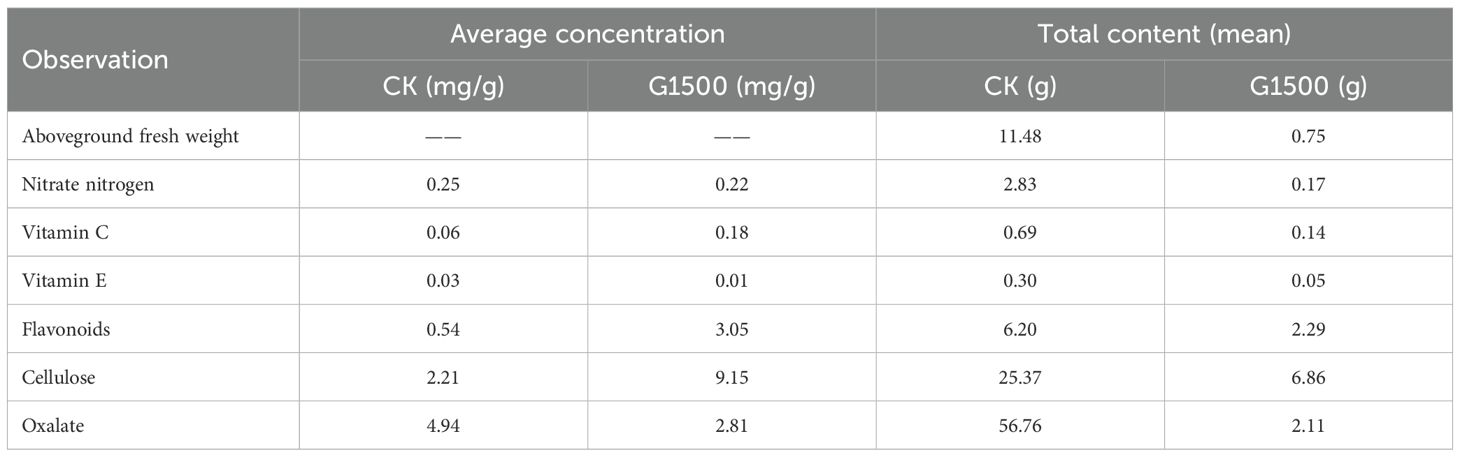
Table 3. Comparison of quality indicators between average concentration and total content of spinach affected by CO2 leakage.
4 Discussion
Our study investigated the effects of elevated soil CO2 concentration on spinach’s growth and nutritional quality. The results indicated that soil CO2 leakage significantly inhibited spinach growth, particularly in plant height, leaf morphology, and aboveground and belowground biomass. However, it also promoted the accumulation of specific nutrients, such as a significant increase in the content of vitamins C and E, and cellulose. These findings revealed that the effects of elevated soil CO2 on spinach were complex, involving both suppressive impacts and potential activation of plant stress-defense mechanisms.
Nutrient analysis revealed that soil CO2 leakage significantly increased the contents of vitamin C and E in spinach by 185.47% and 131.45%, respectively (Table 2). This suggests that spinach may activate its stress-defense mechanisms by enhancing the synthesis of antioxidant vitamins under high CO2 stress. Both vitamin C and vitamin E play important roles in plant disease resistance, with vitamin C serving as a key inducer of disease resistance. The increase in vitamin C content under CO2 leakage conditions aligns with previous studies on plant resistance mechanisms (Boubakri et al., 2016), further confirming the critical role of vitamins in plant responses to stress. Notably, our findings on vitamin C content differ from those of FACE experiments, in which the vitamin C content of vegetables such as carrots decreased under elevated atmospheric CO2 (Azam et al., 2013). This discrepancy suggests that soil and atmospheric CO2 affected vitamin C synthesis through different mechanisms, potentially due to variations in biomass growth and nutrient absorption patterns.
Additionally, the cellulose content in spinach increased significantly by 315.03% (Table 2). Cellulose is a major structural component of the cell wall, and changes in its content often reflect compensatory or integrity responses that impact vegetable quality and stress resistance (Li et al., 2017). The increase in cellulose under CO2 leakage likely helped reinforce the cell wall, enhancing the plant’s ability to resist stress. This supported the idea that spinach underwent metabolic adjustments to enhance its tolerance to stress under CO2 stress conditions. As Taiz and Zeiger (2015) suggested, plants often adapt to adverse environments by adjusting their cell wall composition, which aligns with the increase in cellulose content observed in this study.
On the other hand, the oxalate content in spinach decreased significantly by 43.08% (Table 2). As an antinutrient, oxalate accumulates in spinach and can interfere with human calcium and zinc absorption (Petropoulos et al., 2016). Environmental stressors influence the accumulation of oxalate in plants (Ding et al., 2007; Jiang et al., 2008). Yu et al. (2012) demonstrated that elevated atmospheric CO2 levels under heat stress resulted in a 68% reduction in oxalate abundance in cool-season grasses. Similarly, Zhuang et al. (2019) reported that salt stress combined with increased CO2 altered metabolite accumulation patterns in the leaves and roots of Kentucky bluegrass, leading to a decrease in oxalate content.
Spinach leaf morphology showed a high sensitivity to elevated soil CO2 levels (Figures 2A, B), significantly reducing plant height, leaf size, number, and leaf area compared with CK. Notably, plant height rapidly responded, with a significant change observed by the fifth day after CO2 leakage. Moreover, the maximum leaf length and width decreased by 67.97% and 76.76%, respectively, while the leaf area decreased by 92.76% (Table 2). These results were opposite to those of eCO2 experiments, where spinach exposed to high atmospheric CO2 for 80 days showed a substantial increase in leaf area (Jain et al., 2007). However, the findings aligned with CCS-simulated soil CO2 leakage studies, demonstrating a significant inhibitory effect on plant morphology and biomass (Lakkaraju et al., 2010; Ma et al., 2020b). Our results suggested that elevated soil CO2 concentrations had a potent suppressive effect on spinach growth and caused a continuous deterioration in leaf number and health. These morphological changes may be attributed to reduced oxygen availability in high CO2 soil environments (Zhang et al., 2016), which affects root respiration and the uptake of water and nutrients.
SPAD showed a significant decline in spinach under CO2 leakage conditions (Figure 3E). While no noticeable changes were observed early on, SPAD significantly decreased by 18.38% at harvest compared with CK (Table 2). This suggested that the inhibitory effect of high CO2 on chlorophyll content in spinach intensifies over time, especially under prolonged exposure. This fluctuating decline may be due to disruptions in the chlorophyll synthesis process or accelerated chlorophyll degradation under high CO2 conditions (Kumari et al., 2013; Muthusamy et al., 2019). Although the reduced SPAD and chlorosis phenomena suggest a possible decline in photosynthetic performance, no direct measurements of gas exchange, chlorophyll fluorescence, or root respiration were conducted to confirm physiological impairment (Zhang et al., 2020). Therefore, this interpretation remains tentative and should be verified by future studies combining physiological and biochemical assays. Further analysis of chlorophyll a and b content revealed a more significant decline in chlorophyll b (35.48%, Table 2), which may lead to a weakened efficiency of the auxiliary light-capturing function of chlorophyll b (Guo et al., 2006). Previous studies on the impact of CCS on leaf photosynthetic capacity support this hypothesis, with findings indicating that high soil CO2 concentrations suppress photosynthesis in pasture grass, alfalfa, and soybean (Xue et al., 2021), as evidenced by reductions in photosynthetic parameters such as Pn, Tr, and Gs (Zhang et al., 2015). We expected elevated soil CO2 concentrations to weaken spinach photosynthesis, which hindered biomass accumulation.
The results also indicated that soil CO2 leakage had a significant negative impact on the aboveground and belowground biomass of spinach (Figures 4C, D). Under CO2 leakage conditions, the fresh and dry weights of aboveground biomass decreased by 93.46% and 84.46%, respectively (Table 2), indicating severe growth inhibition. Furthermore, the aboveground water content decreased by 17.38% (Table 2). The high CO2 concentration in the soil impaired the growth vigor of the aboveground portion, resulting in a significant decrease in biomass and compromised water regulation of spinach. Below the ground, the root biomass also decreased significantly, with the fresh root weight of G1500 reduced by 95.83% compared with CK (Table 2). This result was consistent with findings in alfalfa, where soil CO2 leakage at a rate of 1500 g·m-2·d-1 led to reductions of 43.55% and 66.06% in aboveground and belowground fresh weight, respectively, and a decline in the root-shoot ratio from 1.04 to 0.63 (Zhang et al., 2022). In our study, the reduction in aboveground fresh weight was less than that of the belowground biomass, indicating that CO2 leakage had a more pronounced inhibitory effect on the root system.
The experiment also observed significant degradation of spinach root morphology, with the primary roots becoming shorter and thinner and the number, length, and thickness of fine roots decreasing dramatically (Figure 2C). The root weight of G1500 decreased significantly by 95.83% compared with CK (Table 2). High CO2 concentrations severely inhibited root development, restricting the roots’ ability to absorb water and nutrients. This finding is consistent with previous studies, such as Han et al. (2020), who reported reductions of 44.73%, 34.14%, and 19.16% in root length, surface area, and volume of maize, respectively, under CO2 leakage conditions of 2000 g·m-2·d-1. These findings indicate that elevated soil CO2 concentrations cause severe physiological damage to spinach roots, hindering their ability to obtain water and nutrients.
Despite the improvements in spinach’s nutritional quality, the significant reduction in aboveground fresh weight (93.46%, Table 2) indicated a substantial decline in overall total nutritional content per plant. The reduction in edible yield adversely affected the nutritional and economic value of spinach. The total content of vitamin C and vitamin E decreased drastically by 79.71% and 84.88%, respectively; similarly, a pronounced reduction was observed for cellulose (72.96%) (Table 3). These findings highlighted the dual impact of CO2 leakage: while it enriched certain nutrients, it significantly impaired spinach growth and marketability. This suggests two non-mutually exclusive mechanistic explanations: a concentration effect due to biomass suppression, and/or active metabolic upregulation under stress conditions. Under atmospheric CO2, plants may experience a “dilution effect” (Taub and Wang, 2008), whereby nutrient content per unit biomass decreases as plant size increases (Li et al., 2023; Ahmad et al., 2024). In contrast, soil CO2 may inhibit spinach growth, thereby passively increasing nutrient concentrations through a “concentration effect”. However, the potential for stress-induced metabolic activation cannot be ruled out. Previous studies have demonstrated that elevated CO2 can active antioxidant and signaling pathways (Yao et al., 2015), upregulate defense-related genes (Loewus, 1999; Wang et al., 2010), and alter carbon allocation and enzyme regulation (Demmig-Adams and Adams, 1996). Moreover, enhanced activity of NADPH- and glutathione-related pathways under CO2 stress has been observed in other C3 species (Flexas and Medrano, 2002), further supporting possible biochemical adjustments in spinach.
However, this study lacks an in-depth investigation of the dominant mechanisms underlying nutritional changes in spinach under elevated soil CO2. While alterations in vitamin C, vitamin E, oxalate, and cellulose contents were observed, the precise metabolic pathways involved remain unverified. Critical evidence regarding key enzymatic activities, intermediate metabolites, and potential pathway regulations is still lacking. Without further analysis of biosynthetic pathways (such as the L-galactose pathway for vitamin C and photorespiratory pathway for oxalate), we cannot determine whether the observed changes result from active metabolic regulation or from the passive concentration effect. In addition, similar experiments should be systematically conducted on other crop species to compare metabolic responses and assess whether the patterns observed in spinach are species-specific or represent a broader physiological response.
5 Conclusions
This study examined the growth and quality variations of spinach under high soil CO2 concentrations resulting from carbon capture and storage (CCS) leakage. Regarding nutritional quality, soil CO2 leakage promoted an increase in vitamins C and E as well as cellulose content in spinach leaves, altering the plant’s metabolic pathways. However, the reduction in biomass resulted in a corresponding decrease in the total amount of key nutrients per plant. Additionally, the significant reduction in oxalate content presents a potential avenue for research aimed at mitigating oxalate accumulation in spinach. Elevated soil CO2 significantly reduced spinach leaf area, relative chlorophyll content (SPAD), and aboveground fresh weight, severely impairing plant growth and photosynthetic efficiency, thereby affecting overall physiological functions. The reduction in fresh weight of the belowground biomass was more pronounced than that of the aboveground biomass, indicating that the root system was susceptible to high CO2 stress.
Our study quantified spinach’s response to soil CO2 leakage, showing that while CO2 leakage may enhance specific nutritional components, the damage to biomass reduced overall yield and the total amount of key quality components. These findings highlighted the potential threat posed by changes in soil CO2 levels to spinach growth and nutritional quality. Our study offers novel insights into how spinach responds to CO2 leakage, which can assist CCS project stakeholders in more effectively evaluating the safety of CCS technologies and developing appropriate risk management strategies. Future research could further explore the effects of soil CO2 leakage on the growth and quality of other crops to enhance understanding of its broader implications.
Data availability statement
The original contributions presented in the study are included in the article/supplementary material. Further inquiries can be directed to the corresponding author.
Author contributions
YH: Visualization, Validation, Investigation, Project administration, Writing – original draft, Data curation. XZ: Project administration, Funding acquisition, Resources, Supervision, Conceptualization, Writing – review & editing, Methodology. XM: Supervision, Funding acquisition, Conceptualization, Writing – review & editing, Methodology.
Funding
The author(s) declare financial support was received for the research and/or publication of this article. This work was jointly supported by National Natural Science Foundation of China (No 32271638 and 32171561); Central Public-interest Scientific Institution Basal Research Fund (No. BSRF202502), and the Low Carbon Science Center of the Agricultural Science and Technology Innovation Program (ASTIP—CAAS).
Conflict of interest
The authors declare that the research was conducted in the absence of any commercial or financial relationships that could be construed as a potential conflict of interest.
Generative AI statement
The author(s) declare that no Generative AI was used in the creation of this manuscript.
Any alternative text (alt text) provided alongside figures in this article has been generated by Frontiers with the support of artificial intelligence and reasonable efforts have been made to ensure accuracy, including review by the authors wherever possible. If you identify any issues, please contact us.
Publisher’s note
All claims expressed in this article are solely those of the authors and do not necessarily represent those of their affiliated organizations, or those of the publisher, the editors and the reviewers. Any product that may be evaluated in this article, or claim that may be made by its manufacturer, is not guaranteed or endorsed by the publisher.
References
Ahmad, S., Sehrish, A. K., Umair, M., Mirino, M. W., Ali, S., and Guo, H. (2024). Effect of biochar amendment on bacterial community and their role in nutrient acquisition in spinach (Spinacia oleracea L.) grown under elevated CO2. Chemosphere 364, 143098. doi: 10.1016/j.chemosphere.2024.143098
Al-Traboulsi, M., Sjögersten, S., Colls, J., Steven, M., Craigon, J., and Black, C. (2012). Potential impact of CO2 leakage from carbon capture and storage (CCS) systems on growth and yield in spring field bean. Environ. Exp. Bot. 80, 43–53. doi: 10.1016/j.envexpbot.2012.02.007
Azam, A., Khan, I., Mahmood, A., and Hameed, A. (2013). Yield, chemical composition and nutritional quality responses of carrot, radish and turnip to elevated atmospheric carbon dioxide. J. Sci. Food Agric. 93, 3237–3244. doi: 10.1002/jsfa.6165
Badar, Z., El-keblawy, A., Mosa, K. A., Mutery, A. A., and Elnaggar, A. (2024). Ecotoxicological effects of paracetamol on the biochemical and molecular responses of spinach (Spinacia oleracea L.). J. Hazardous Materials 480, 136063. doi: 10.1016/j.jhazmat.2024.136063
Bashir, S. S., Hussain, A., Hussain, S. J., Wani, O. A., Nabi, S. Z., Dar, N. A., et al. (2021). Plant drought stress tolerance: understanding its physiological, biochemical and molecular mechanisms. Biotechnol. Biotechnol. Equip. 35, 1912–1925. doi: 10.1080/13102818.2021.2020161
Beaubien, S., Ciotoli, G., Coombs, P., Dictor, M., Kruger, M., Lombardi, S., et al. (2008). The impact of a naturally occurring CO2 gas vent on the shallow ecosystem and soil chemistry of a Mediterranean pasture (Latera, Italy). Int. J. Greenhouse Gas Control 2, 373–387. doi: 10.1016/j.ijggc.2008.03.005
Boubakri, H., Gargouri, M., Mliki, A., Brini, F., Chong, J., and Jbara, M. (2016). Vitamins for enhancing plant resistance. Planta 244, 529–543. doi: 10.1007/s00425-016-2552-0
Bsc, S. N. (1999). Oxalate content of foods and its effect on humans. Asia Pacific J. Clin. Nutr. 8, 64–74. doi: 10.1046/j.1440-6047.1999.00038.x
Bukar, A. M. and Asif, M. (2024). Technology readiness level assessment of carbon capture and storage technologies. Renewable Sustain. Energy Rev. 200, 114578. doi: 10.1016/j.rser.2024.114578
Chaudhari, V., Singh, O., Gouthami, N., Thakur, N., Singh, R., Singh, S., et al. (2024). Unlocking the nutritional power of vegetables: A guide to vibrant health. Eur. J. Nutr. Food Saf. 16, 247–261. doi: 10.9734/ejnfs/2024/v16i81512
Chen, Y., Paulus, N., Wan, X., and Zou, B. (2024). Optimal timing of carbon capture and storage policies — A social planner’s view. Energy Econ 136, 107656. doi: 10.1016/j.eneco.2024.107656
Demmig-Adams, B. and Adams, W. W. (1996). The role of xanthophyll cycle carotenoids in the protection of photosynthesis. Trends Plant Sci. 1, 21–26. doi: 10.1016/S1360-1385(96)80019-7
Ding, Z., Tian, S., Zheng, X., Zhou, Z., and Xu, Y. (2007). Responses of reactive oxygen metabolism and quality in mango fruit to exogenous oxalic acid or salicylic acid under chilling temperature stress. Plant Physiol. 130, 112–121. doi: 10.1111/j.1399-3054.2007.00893.x
Dong, J., Gruda, N., Li, X., Tang, Y., Zhang, P., and Duan, Z. (2020). Sustainable vegetable production under changing climate: The impact of elevated CO2 on yield of vegetables and the interactions with environments-A review. J. Cleaner Production 253, 119920. doi: 10.1016/j.jclepro.2019.119920
Farrar, C. D., Sorey, M. L., Evans, W. C., Howle, J. F., Kerr, B. D., Kennedy, B. M., et al. (1995). Forest-killing diffuse CO2 emission at Mammoth Mountain as a sign of magmatic unrest. Nature 376, 675–678. doi: 10.1038/376675a0
Flexas, J. and Medrano, H. (2002). Drought-inhibition of photosynthesis in C3 plants: stomatal and non-stomatal limitations revisited. Ann. Bot. 89, 183–189. doi: 10.1093/aob/mcf027
Genthon, C., Barnolat, J. M., Raynaudt, D., Loriust, C., Jouzel, J., Barkov, N. I., et al. (1987). Vostok ice core: climatic response to CO2 and orbital forcing changes over the last climatic cycle. Nature 329, 414–418. doi: 10.1038/329414a0
Ghanati, K., Oskoei, V., Rezvani-Ghalhari, M., Shavali-Gilani, P., Mirzaei, G., and Sadighara, P. (2024). Oxalate in plants, amount and methods to reduce exposure; a systematic review. Toxin Rev. 43, 411–422. doi: 10.1080/15569543.2024.2344493
Giri, A., Armstrong, B., and Rajashekar, C. B. (2016). Elevated carbon dioxide level suppresses nutritional quality of lettuce and spinach. Am. J. Plant Sci. 07, 246–258. doi: 10.4236/ajps.2016.71024
Guo, C., Liu, F., and Xu, X. (2006). Chlorophyll-b deficient and photosynthesis in plants. Plant Physiol. Commun. 42, 967–973. doi: 10.13592/j.cnki.ppj.2006.05.055
Gupta, B. D., Kar, A., Narayan, S., Thakur, C. P., Mukherjee, P. K., and Haldar, P. K. (2023). Ultra-performance liquid chromatography-Quadrupole Time-of-Flight tandem mass spectrometry based Metabolite profiling, Quality evaluation and marker analysis of Trachyspermum ammi (L.) Sprague by High performance thin layer chromatography. J. separation Sci. 46, e2200872. doi: 10.1002/jssc.202200872
Han, Y., Zhang, X., and Ma, X. (2020). Fine root length of maize decreases in response to elevated CO2 levels in soil. Appl. Sci. 10, 968–978. doi: 10.3390/app10030968
Hasanuzzaman, M., Nahar, K., Alam, M. M., Roychowdhury, R., and Fujita, M. (2013). Physiological, biochemical, and molecular mechanisms of heat stress tolerance in plants. Int. J. Mol. Sci. 14, 9643–9684. doi: 10.3390/ijms14059643
He, B., Zuo, C., Wang, D., and Wang, J. (2012). Research on determination of vitamin C by ultraviolet spectrophotometry. J. Henan Univ. Technol. (Natural Sci. Edition) 33, 25–28. doi: 10.16433/j.cnki.issn1673-2383.2012.04.005
Huang, Y., Zhang, X., and Ma, X. (2025). Effects of CO2 leakage from carbon capture and storage on lettuce morphology and nutritional content. J. Soil Sci. Plant Nutr. 25, 3029–3039. doi: 10.1007/s42729-025-02318-x
IPCC (2023). Climate Change 2022 – Impacts, Adaptation and Vulnerability: Working Group II Contribution to the Sixth Assessment Report of the Intergovernmental Panel on Climate Change (Cambridge, UK and New York, USA: Cambridge University Press).
Jain, V., Pal, M., Raj, A., and Khetarpal, S. (2007). Photosynthesis and nutrient composition of spinach and fenugreek grown under elevated carbon dioxide concentration. Biol. plantarum 51, 559–562. doi: 10.1007/s10535-007-0122-9
Jiang, Y., Wang, C., and Li, D. (2008). Effect of oxalic acid on chlorophyll content and antioxidant system of alfalfa under high temperature stress. Pratacultural Sci. 25, 55–59.
Khaksar, M., Alipour, V., Rahmanian, O., and Soltani, N. (2024). The risk of gastrointestinal cancer and nitrate intake due to vegetable consumption: A case-control study in Minab, Iran. Environ. Health Eng. Manage. 11, 167–175. doi: 10.34172/EHEM.2024.17
Kumari, S., Agrawal, M., and Tiwari, S. (2013). Impact of elevated CO2 and elevated O3 on Beta vulgaris L.: Pigments, metabolites, antioxidants, growth and yield. Environ. pollut. 174, 279–288. doi: 10.1016/j.envpol.2012.11.021
Lake, J. A. and Lomax, B. H. (2018). Plant responses to simulated carbon capture and transport leakage: The effect of impurities in the CO2 gas stream. Int. J. Greenhouse Gas Control 72, 208–213. doi: 10.1016/j.ijggc.2018.01.013
Lakkaraju, V. R., Zhou, X., Apple, M. E., Cunningham, A., Dobeck, L. M., Gullickson, K., et al. (2010). Studying the vegetation response to simulated leakage of sequestered CO2 using spectral vegetation indices. Ecol. Inf. 5, 379–389. doi: 10.1016/j.ecoinf.2010.05.002
Li, H. (2000). Experimental Principle and Technique for Plant Physiology and Biochemistry (Beijing: Higher Education Press).
Li, H., Wang, Z., Li, S., Wang, Y., Liu, S., Song, F., et al. (2023). Multigenerational elevated atmospheric CO2 concentration induced changes of wheat grain quality via altering nitrogen reallocation and starch catabolism. Environ. Exp. Bot. 205, 105127. doi: 10.1016/j.envexpbot.2022.105127
Li, S., Zhang, L., Wang, Y., Lin, P., Ren, S., Ma, R., et al. (2017). Knockdown of a cellulose synthase gene BoiCesA affects the leaf anatomy, cellulose content and salt tolerance in broccoli. Sci. Rep. 7, 41397. doi: 10.1038/srep41397
Liu, L., Hao, L., Zhang, Y., Ma, B., Cheng, Y., Tian, Y., et al. (2022). The CO2 fertilization effect on leaf photosynthesis of maize (Zea mays L.) depends on growth temperatures with changes in leaf anatomy and soluble sugars. Front. Plant Sci. 13. doi: 10.3389/fpls.2022.890928
Liu, S., Li, L., Gao, W., Liu, Y., Wang, S., and Lu, J. (2018). Diagnosis of nitrogen status in winter oilseed rape (Brassica napus L.) using in-situ hyperspectral data and unmanned aerial vehicle (UAV) multispectral images. Comput. Electron. Agric. 151, 185–195. doi: 10.1016/j.compag.2018.05.026
Loewus, F. (1999). Biosynthesis and metabolism of ascorbic acid in plants and of analogs of ascorbic acid in fungi. Phytochemistry 52, 193–210. doi: 10.1016/S0031-9422(99)00145-4
Ma, X., Su, Z., and Ma, H. (2020a). Molecular genetic analyses of abiotic stress responses during plant reproductive development. J. Exp. Bot. 71, 2870–2885. doi: 10.1093/jxb/eraa089
Ma, X., Zhang, X., and Tian, D. (2020b). Farmland degradation caused by radial diffusion of CO2 leakage from carbon capture and storage. J. Cleaner Production 255, 120059. doi: 10.1016/j.jclepro.2020.120059
Ma, Y., Xie, Y., Ha, R., Cao, B., and Song, L. (2021). Effects of elevated CO2 on photosynthetic accumulation, sucrose metabolism-related enzymes, and genes identification in Goji Berry (Lycium barbarum L.). Front. Plant Sci. 12. doi: 10.3389/fpls.2021.643555
Macedo, D. C. S., Vasconcellos, M. C., Fernandes, B., Gubert, P., and Bezerra, I. C. (2024). Caenorhabditis elegans as an outstanding model to explore flavonoids under stress conditions. Natural Products J. 14, 72–85. doi: 10.2174/0122103155288344240104071427
Maček, I., Pfanz, H., Francetič, V., Batič, F., and Vodnik, D. (2005). Root respiration response to high CO2 concentrations in plants from natural CO2 springs. Environ. Exp. Bot. 54, 90–99. doi: 10.1016/j.envexpbot.2004.06.003
MacGregor, E. J. (2024). The regulatory effects of vitamin C, vitamin E, and natural antioxidants on oxidative stress and muscle inflammation induced by high-intensity exercise. Stud. Sports Sci. Phys. Educ. 2, 1–5. doi: 10.56397/SSSPE.2024.12.01
Maleki, S. S., Mohammadi, K., and Ji, K. (2016). Characterization of cellulose synthesis in plant cells. Sci. World J. 2016, 1–8. doi: 10.1155/2016/8641373
Muthusamy, M., Hwang, J. E., Kim, S. H., Kim, J. A., Jeong, M., Park, H. C., et al. (2019). Elevated carbon dioxide significantly improves ascorbic acid content, antioxidative properties and restricted biomass production in cruciferous vegetable seedlings. Plant Biotechnol. Rep. 13, 293–304. doi: 10.1007/s11816-019-00542-3
Petropoulos, S., Karkanis, A., Martins, N., and Ferreira, I. C. (2016). Phytochemical composition and bioactive compounds of common purslane (Portulaca oleracea L.) as affected by crop management practices. Trends in Food Science & Technology. 55, 1–10. doi: 10.1016/j.tifs.2016.06.010
Shi, C., Lv, J., Pei, Z., Wang, H., Chang, N., Fang, X., et al. (2024). Study on the enhancement effect of EDTA and oxalic acid on phytoremediation of Cr (VI) from soil using Datura stramonium L. Ecotoxicology Environ. Saf. 287, 117272. doi: 10.1016/j.ecoenv.2024.117272
Shi, P., Ratkowsky, D. A., Li, Y., Zhang, L., Lin, S., and Gielis, J. (2018). A general leaf area geometric formula exists for plants—evidence from the simplified gielis equation. Forests 9, 714. doi: 10.3390/f9110714
Stahl, W. and Sies, H. (1997). Antioxidant defense: Vitamins E and C and carotenoids. Diabetes 62, 1315S–1321S. doi: 10.1093/ajcn/62.6.1315S
Sultana, B., Anwar, F., and Ashraf, M. (2009). Effect of extraction solvent/technique on the antioxidant activity of selected medicinal plant extracts. Molecules 14, 2167–2180. doi: 10.3390/molecules14062167
Swaminathan, S., Lionetti, V., and Zabotina, O. A. (2022). Plant cell wall integrity perturbations and priming for defense. Plants 11, 3539. doi: 10.3390/plants11243539
Taiz, L. and Zeiger, E. (2015). Plant Physiology and Development. Sixth Edition (the United States of America: Sinauer Associates, inc).
Taub, D. R. and Wang, X. (2008). Why are nitrogen concentrations in plant tissues lower under elevated CO2? A critical examination of the hypotheses. J. Integr. Plant Biol. 50, 1365–1374. doi: 10.1111/j.1744-7909.2008.00754.x
Taylor, N. G. (2008). Cellulose biosynthesis and deposition in higher plants. New Phytol. 178, 239–252. doi: 10.1111/j.1469-8137.2008.02385.x
Updegraff, D. M. (1969). Semimicro determination of cellulose inbiological materials. Analytical Biochem. 32, 420–424. doi: 10.1016/s0003-2697(69)80009-6
Wang, Z., Xiao, Y., Chen, W., Tang, K., and Zhang, L. (2010). Increased vitamin C content accompanied by an enhanced recycling pathway confers oxidative stress tolerance in arabidopsis. J. Integr. Plant Biol. 52, 400–409. doi: 10.1111/j.1744-7909.2010.00921.x
Watanabe, M. and Ayugase, J. (2015). Effect of low temperature on flavonoids, oxygen radical absorbance capacity values and major components of winter sweet spinach (Spinacia oleracea L.). J. Sci. Food Agric. 95, 2095–2104. doi: 10.1002/jsfa.6925
Wu, P., Liu, F., Wang, J., Liu, Y., Gao, Y., Zhang, X., et al. (2022). Suitable fertilization depth can improve the water productivity and maize yield by regulating development of the root system. Agric. Water Manage. 271, 107784. doi: 10.1016/j.agwat.2022.107784
Wu, X., Qu, A., Gao, P., Pang, W., Li, Q., Zhao, J., et al. (2024). The future of CO2 geological sequestration: an overview of mineralization in aqueous and supercritical states. Energy Fuels 38, 9320–9338. doi: 10.1021/acs.energyfuels.4c01139
Xiao, T., Chen, T., Ma, Z., Tian, H., Meguerdijian, S., Chen, B., et al. (2024). A review of risk and uncertainty assessment for geologic carbon storage. Renewable Sustain. Energy Rev. 189, 113945. doi: 10.1016/j.rser.2023.113945
Xu, C., Jiao, C., Sun, H., Cai, X., Wang, X., Ge, C., et al. (2017). Draft genome of spinach and transcriptome diversity of 120 Spinacia accessions. Nat. Commun. 8, 15275. doi: 10.1038/ncomms15275
Xue, L., Ma, J., Hu, Q., Cheng, M., Wen, X., Wu, N., et al. (2021). Identification of CO2 leakage from geological storage based on maize spectral characteristic indexes. Int. J. Greenhouse Gas Control 112, 103342. doi: 10.1016/j.ijggc.2021.103342
Yao, Y., You, J., Ou, Y., Ma, J., Wu, X., and Xu, G. (2015). Ultraviolet-B protection of ascorbate and tocopherol in plants related with their function on the stability on carotenoid and phenylpropanoid compounds. Plant Physiol. Biochem. 90, 23–31. doi: 10.1016/j.plaphy.2015.02.021
You, J. and Chan, Z. (2015). ROS regulation during abiotic stress responses in crop plants. Front. Plant Sci. 6. doi: 10.3389/fpls.2015.01092
Yu, J., Du, H., Xu, M., and Huang, B. (2012). Metabolic responses to heat stress under elevated atmospheric CO2 concentration in a cool-season grass species. J. Am. Soc. Hortic. Sci. 137, 221–228. doi: 10.21273/JASHS.137.4.221
Yu, M., Zhang, X., and Ma, X. (2020). Yield and quality responses of sunflowers to soil CO2 leakage from CCS projects. Int. J. Environ. Sci. Technol. 19, 6721–6728. doi: 10.1007/s13762-021-03538-1
Zhang, X., Ma, X., and Song, H. (2022). Quality degradation of alfalfa caused by CO2 leakage from carbon capture and storage. Ecotoxicology Environ. Saf. 246, 114147. doi: 10.1016/j.ecoenv.2022.114147
Zhang, X., Ma, X., Wu, Y., Gao, Q., and Li, Y. (2018). A plant tolerance index to select soil leaking CO2 bio-indicators for carbon capture and storage. J. Cleaner Production 170, 735–741. doi: 10.1016/j.jclepro.2017.09.180
Zhang, X., Ma, X., Wu, Y., and Li, Y. (2015). Enhancement of farmland greenhouse gas emissions from leakage of stored CO2: Simulation of leaked CO2 from CCS. Sci. Total Environ. 518-519, 78–85. doi: 10.1016/j.scitotenv.2015.02.055
Zhang, X., Ma, X., Zhao, Z., Wu, Y., and Li, Y. (2016). CO2 leakage-induced vegetation decline is primarily driven by decreased soil O2. J. Environ. Manage. 171, 225–230. doi: 10.1016/j.jenvman.2016.02.018
Zhang, H., Wang, Y., Li, X., He, G., Che, Y., Teng, Z., et al. (2020). Chlorophyll synthesis and the photoprotective mechanism in leaves of mulberry (Morus alba L.) seedlings under NaCl and NaHCO3 stress revealed by TMT-based proteomics analyses. Ecotoxicology Environ. Saf. 190, 110164. doi: 10.1016/j.ecoenv.2020.110164
Zhang, L., Yuan, D., Fan, Y., Yang, R., Zhao, M., Jiang, J., et al. (2024). Hyperspectral estimation of chlorophyll content in wheat under CO2 stress based on fractional order differentiation and continuous wavelet transforms. Remote Sens. 16, 3341. doi: 10.3390/rs16173341
Zhao, L. and Wang, Y. (2017). Nitrate assay for plant tissues. Bio-protocol 7, e2029. doi: 10.21769/BioProtoc.2029
Zhao, N., Zhou, Z., Cui, S., Zhang, X., Zenda, T., Zhu, S., et al. (2024). Selected cell wall remodeling mechanisms orchestrating plant drought tolerance. Plant Stress, 100698. doi: 10.1016/j.stress.2024.100698
Zhou, Y., Leeuwen, S., Pieterse, C., Bakker, P., and Wees, S. (2019). Effect of atmospheric CO2 on plant defense against leaf and root pathogens of Arabidopsis. Eur. J. Plant Pathol. 154, 31–42. doi: 10.1007/s10658-019-01706-1
Zhuang, L., Yang, Z., Fan, N., Yu, J., and Huang, B. (2019). Metabolomic changes associated with elevated CO2-regulation of salt tolerance in Kentucky bluegrass. Environ. Exp. Bot. 165, 129–138. doi: 10.1016/j.envexpbot.2019.05.023
Appendix
Appendix Table 1 presents the results of two-way analysis of variance (ANOVA) assessing the main effects of Group (G1500 vs CK), Time (measurement dates), and their interaction (Group × Time) on spinach growth parameters, including plant height, maximum leaf length, maximum leaf width, leaf number, and SPAD.
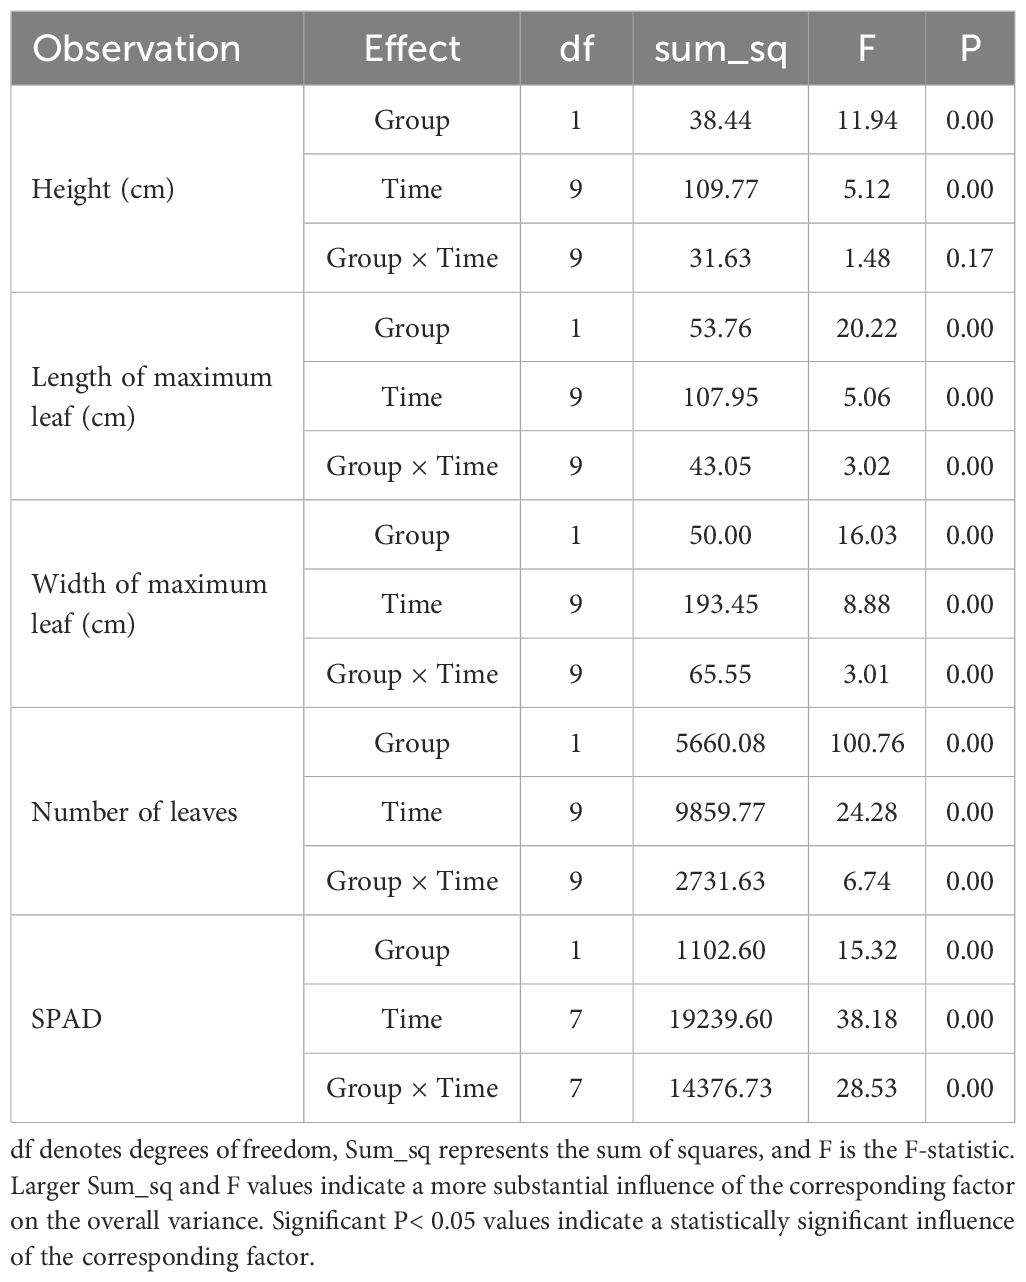
Appendix Table 1. ANOVA results for phenotypic indicators during spinach growth.
To control multiple comparison errors, the Welch t-test was used to compare means without assuming equal variances, and the Bonferroni correction was applied. The corrected results are presented in Appendix Table 2.
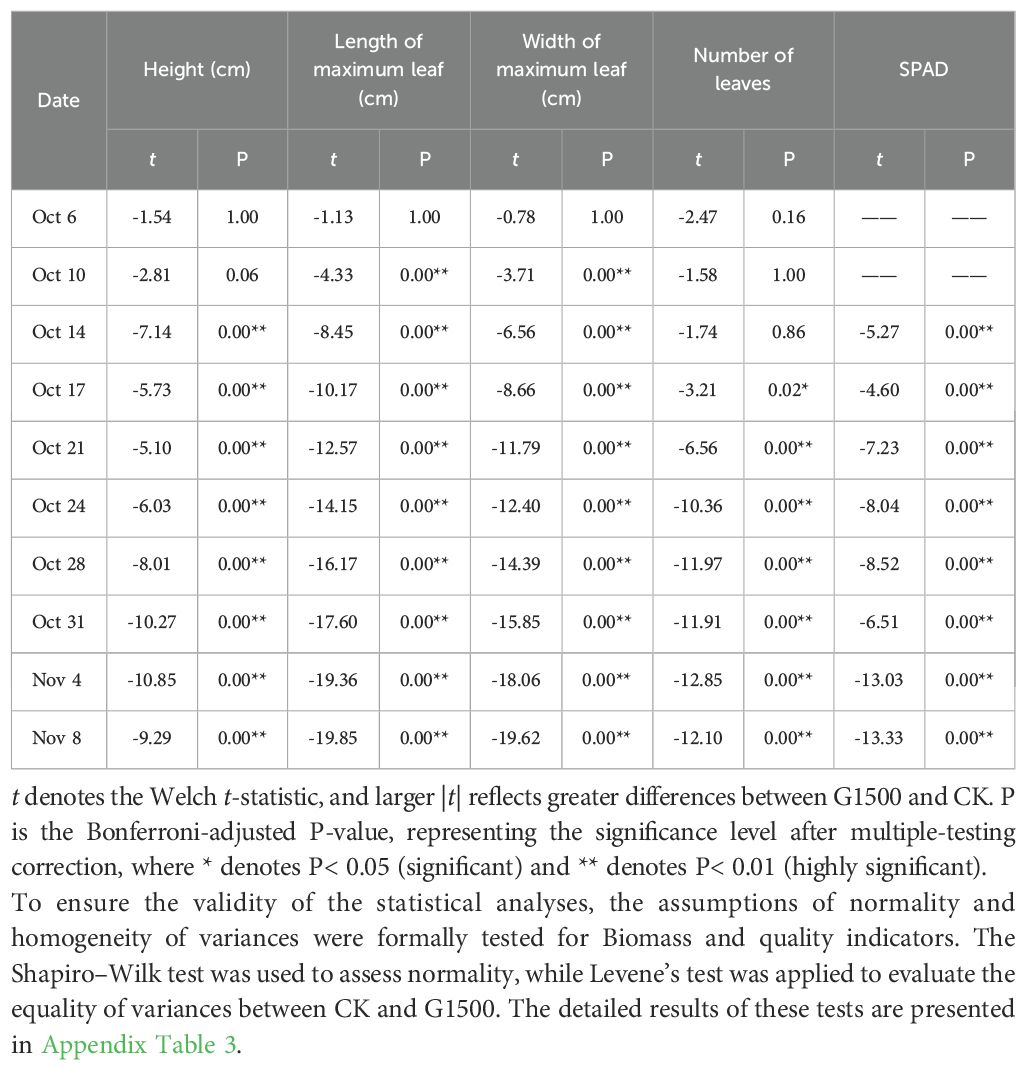
Appendix Table 2. Bonferroni-adjusted pairwise comparisons (Welch t-test) between G1500 and CK across time points.
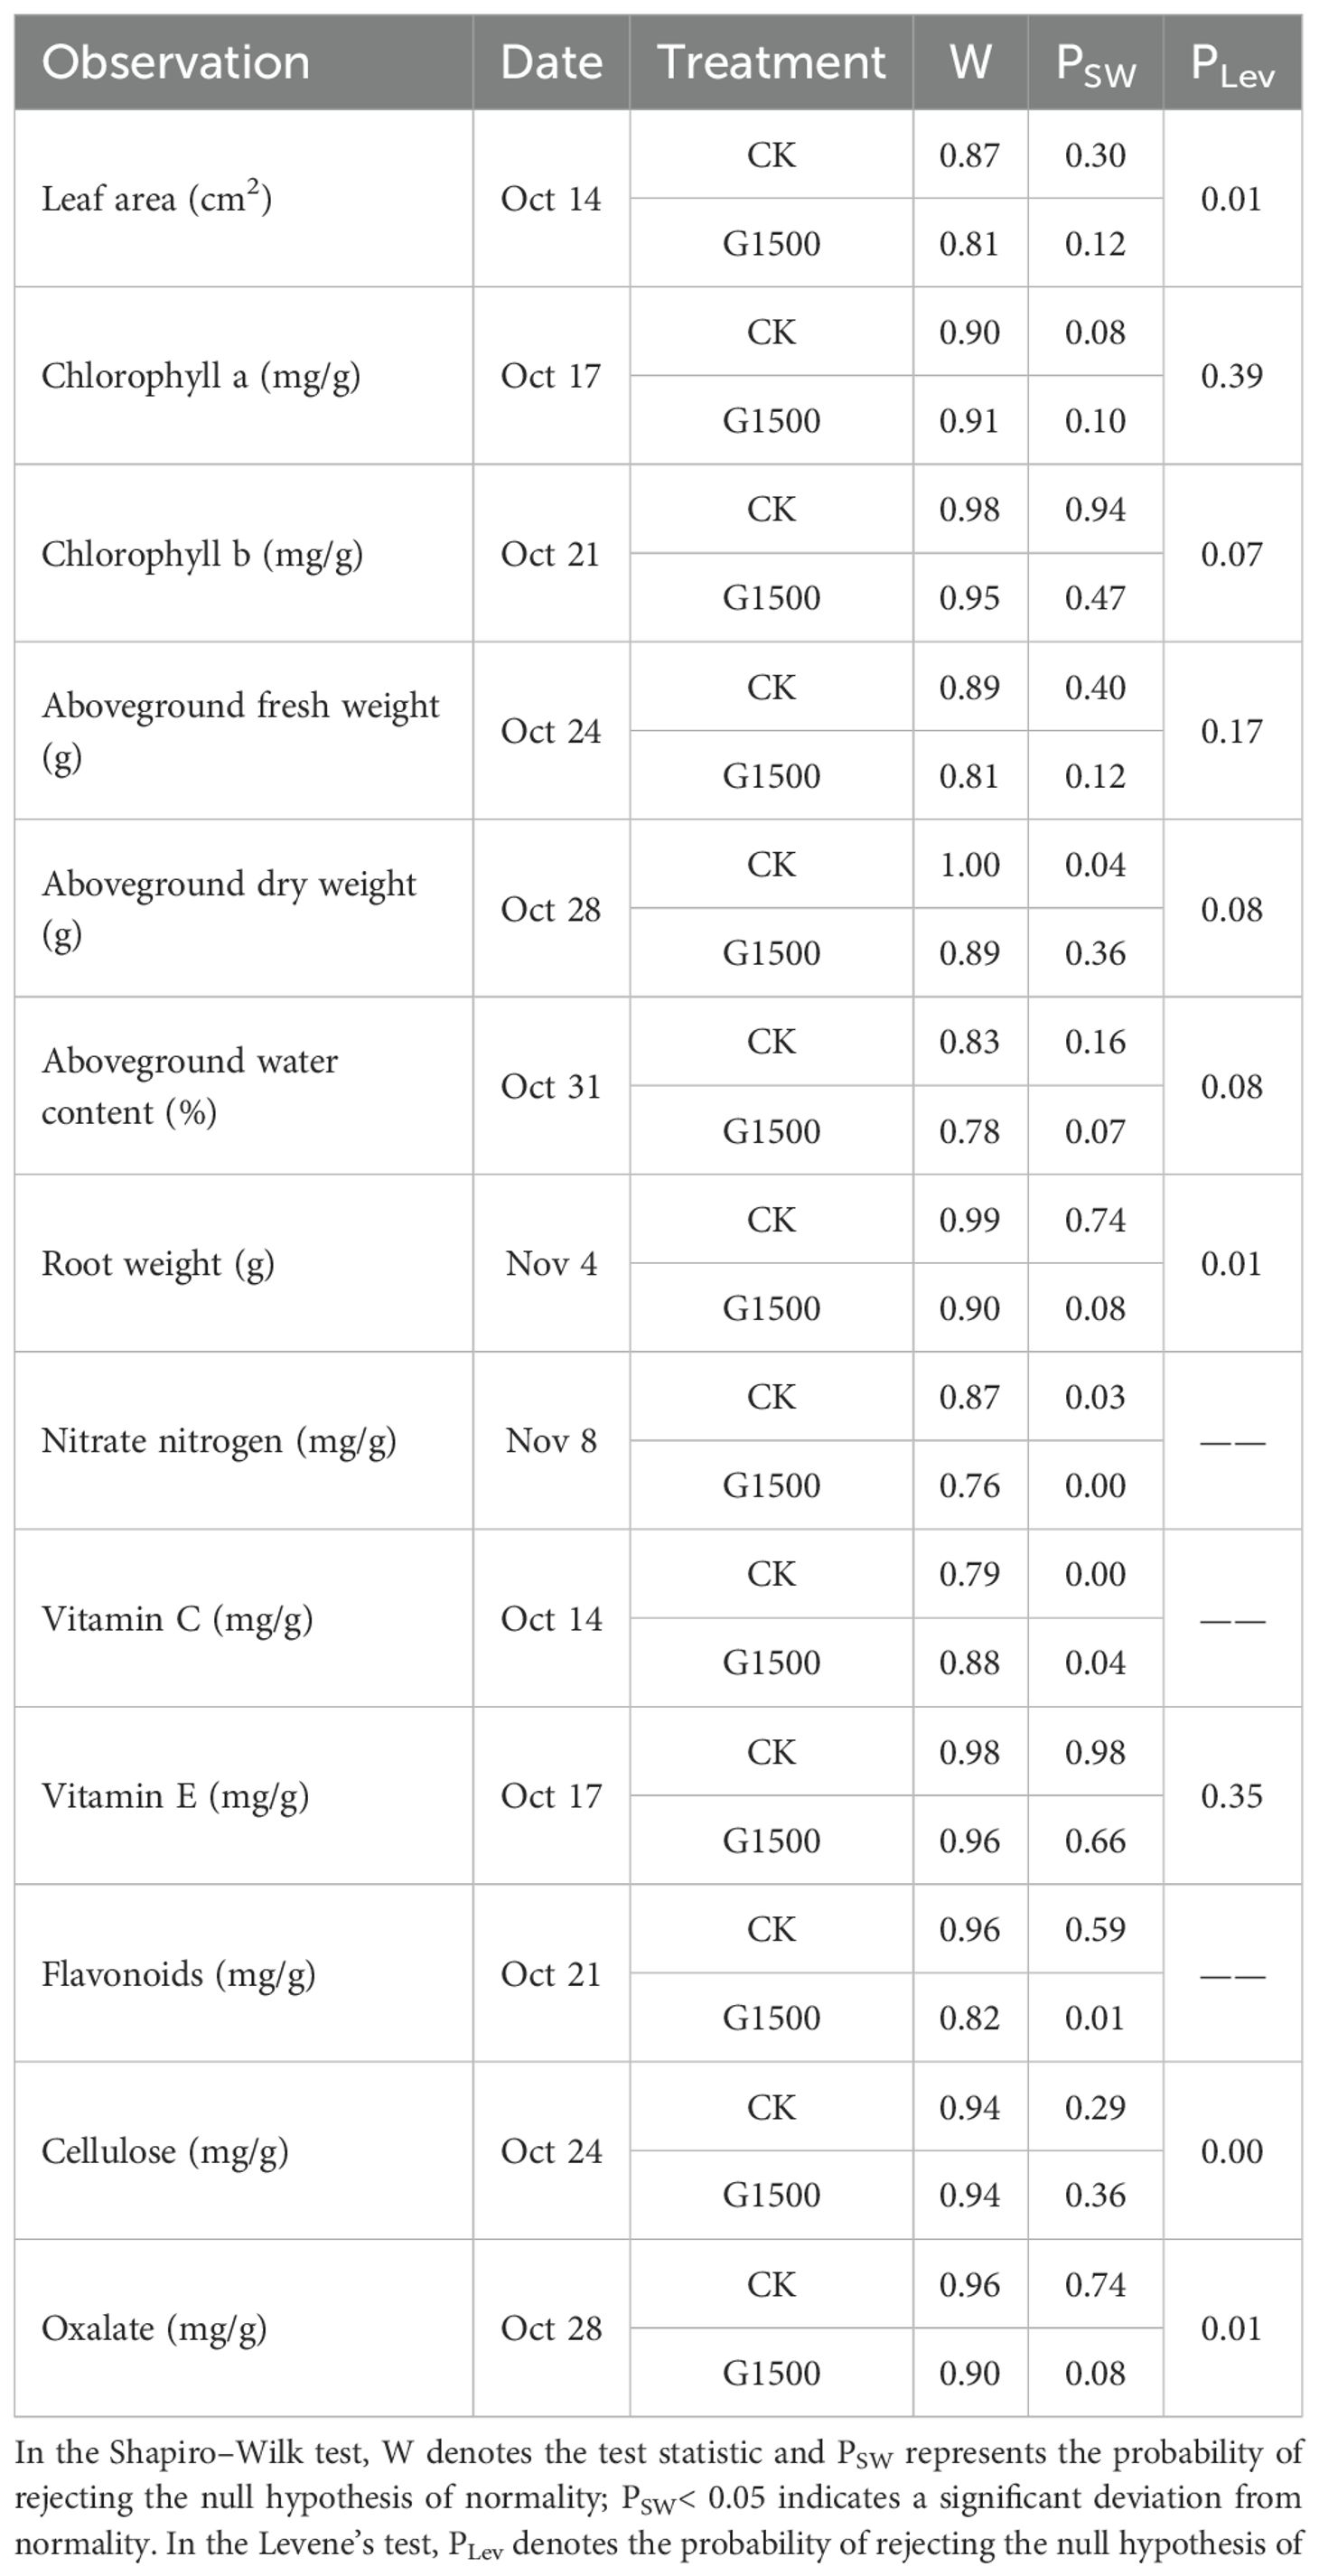
Appendix Table 3. Results of the Shapiro–Wilk test for normality and Levene’s test for homogeneity of variances.
Keywords: spinach, simulated experiment, quality change, CO2 leakage, carbon capture and storage
Citation: Huang Y, Zhang X and Ma X (2025) Spinach yield and quality response to elevated soil carbon dioxide. Front. Plant Sci. 16:1636651. doi: 10.3389/fpls.2025.1636651
Received: 28 May 2025; Accepted: 27 October 2025;
Published: 06 November 2025.
Edited by:
Silvia Portarena, National Research Council (CNR), ItalyReviewed by:
Jiban Shrestha, Nepal Agricultural Research Council, NepalIndra Purnama, Lancang Kuning University, Indonesia
Copyright © 2025 Huang, Zhang and Ma. This is an open-access article distributed under the terms of the Creative Commons Attribution License (CC BY). The use, distribution or reproduction in other forums is permitted, provided the original author(s) and the copyright owner(s) are credited and that the original publication in this journal is cited, in accordance with accepted academic practice. No use, distribution or reproduction is permitted which does not comply with these terms.
*Correspondence: Xueyan Zhang, eHl6aGFuZ0BpZ3NucnIuYWMuY24=