 Yifan Xing1,2
 Huiming Xu2Deming Yang1
 Lichuan Deng1Guolong Li1,2Zhixin Zhao1,3Zhaohua Lu1
 Liuyin Ma2*
 Guangyou Li1*
- 1Research Institute of Tropical Forestry, Chinese Academy of Forestry, Guangzhou, China
- 2Center for Genomics, Haixia Institute of Science and Technology, College of Forestry, Fujian Provincial Key Laboratory of Haixia Applied Plant Systems Biology, Fujian Agriculture and Forestry University, Fuzhou, China
- 3College of Biopharmaceutical and Food Engineering, Shangluo University, Shangluo, China
Malate dehydrogenases are pivotal in plant metabolism and stress responses, yet their evolutionary dynamics and functional diversification in woody angiosperms remain underexplored. This study comprehensively characterized the Eucalyptus grandis MDH (EgMDH) gene family to elucidate its roles in development and environmental adaptation. We identified 14 EgMDH genes and conducted phylogenetic, structural, and syntenic analyses to trace their evolutionary origins. Transcriptional networks were deciphered using cis-regulatory element analysis and protein interaction predictions. Spatiotemporal expression under hormone treatments (JA, SA), abiotic stresses (salt, cold), and nutrient deficiencies (phosphate, nitrogen, and boron) was profiled via transcriptome data or RT-qPCR experiments. Phylogenetics revealed three MDH clades: green algal-derived Groups I/II and red algal-derived Group III. Phylogenetics analysis with model plants revealed that Eucalyptus lacked Group III MDHs, while Poplar lacked Group II members, indicating lineage-specific gene loss in woody angiosperms. Four segmental duplicated paralog pairs (EgMDH1/3, 6/9, 10/11, 12/14) exhibited conserved motifs, exon distributions, and synteny with woody dicots, underscoring structural conservation across angiosperms. Sixty transcription factors (TFs) coordinated EgMDH expression, linking them to energy/stress adaptation and secondary metabolism. Subtype-specific regulators (e.g., GT-2, AIL6, NLP6) exclusively targeted Group II EgMDHs, indicating clade-divergent regulatory networks. EgMDHs showed tissue- and stage-dependent expression, particularly during late adventitious root development. EgMDH genes also exhibited temporally distinct expression patterns under JA treatment, SA treatment, salt stress and cold stress conditions. Notably, eleven EgMDH proteins interacted with PPC1/ASP3, coupling malate metabolism to nitrogen/phosphate homeostasis and C/N balance. Taken together, EgMDH genes displayed phased temporal and tissue-specific expression under Pi/N/B deficiencies. These results revealed that coordinated transcriptional reprogramming and protein interactions of EgMDHs were critical for nutrient stress adaptation. Overall, this study suggested that EgMDH genes underwent lineage-specific diversification and played important roles in development and stress resilience.
1 Introduction
Malate dehydrogenase (MDH) is a highly conserved oxidoreductase that catalyzes the reversible conversion between L-malate and oxaloacetate with the cofactor of NAD+ (EC 1.1.1.37), serving as a central regulator in cellular energy metabolism, carbon balance, and stress adaptation (Fernie et al., 2004). MDH ubiquitously presented in microorganism, animal and plant (Yudina, 2012). However, MDHs exhibit functional diversity through subcellular compartmentalization, as distinct isoforms localize to specific organelles to perform specialized metabolic functions (Imran et al., 2016; Liszka et al., 2020). The most well-studied MDH isoforms are mitochondria MDHs (mMDH), which are part of the tricarboxylic acid (TCA) cycle, dynamically regulating NADH production to support respiratory chain activity and energy supply (Yudina, 2012; Zhang and Fernie, 2023). Another well-studied MDHs are soluble cytoplasmic MDH (cyMDH), which participate in multiple metabolic processess, including acid metabolism in plant tissues and autotrophic carbon dioxide fixation in higher plants (Yudina, 2012). The chloroplasts MDH (cpMDH) drives the carbon dioxide concentration mechanism and optimizes photosynthetic efficiency (Chen et al., 2022). The peroxisomal MDHs (pMDH) are involved in photorespiration, and MDH is also present in glyoxaloids and microsomesin some plants (Yang and Scandalios, 1974; Yudina and Levites, 2008; Yudina, 2012). Therefore, understanding the function of MDH is critical for unveiling the regulatory mechanisms of cell energy metabolism.
The functional versatility of MDHs extends to stress adaptation. Notably, MDHs exhibit cross-talk with phytohormone signaling pathways; their promoters harbor cis-elements responsive to ABA and jasmonate (JA), as demonstrated in Ipomoea batatas (Li et al., 2023). JA influences MDH expression through transcription factors (TFs) such as MdbHLH74. In apple (Malus domestica), a promoter insertion in MdMa7 (a cytosolic MDH) altered its binding affinity to MdbHLH74, which is JA-responsive transcription factor (Gao et al., 2024). This genetic variation modulated malate accumulation and vacuolar acidification, demonstrating JA-MDH crosstalk in fruit quality regulation (Gao et al., 2024). Similarly, MdPH5 (a proton-pumping ATPase) and MdMYB73 (a JA-related TF) co-regulate malate transport into vacuoles, linking JA signaling to MDH-dependent pH homeostasis (Huang et al., 2023). The cytoplasmic MDH isoform MeMDH1 in cassava (Manihot esculenta) is directly linked to SA accumulation and disease resistance (Zhou et al., 2023). Overexpression of MeMDH1 enhances SA biosynthesis and upregulates pathogenesis-related gene PR1, which is pivotal for immune responses against cassava bacterial blight (Zhou et al., 2023). Previous studies have demonstrated that MDH genes in multiple plant species, including Malus domestica and Manihot esculenta, are transcriptionally responsive to JA and SA treatments (Zhou et al., 2023; Gao et al., 2024). However, whether Eucalyptus grandis MDHs (EgMDHs) exhibit similar transcriptional responses to these phytohormones remains unexplored. The plastidial NAD-dependent OsMDH1 in rice (Oryza sativa) is transcriptionally induced by salt stress but negatively regulates salt tolerance (Nan et al., 2020). Overexpression of OsMDH1 reduces vitamin B6 (pyridoxine) content, leading to salt sensitivity (Nan et al., 2020). Conversely, a loss-of-function osmdh1 mutant exhibits enhanced salt tolerance due to elevated pyridoxine levels (Nan et al., 2020). In addition, the study showed that salt stress was associated with natural variation of some MDH genes, and OsMDH8.1 and OsMDH12.1 genes had a large number of natural variation loci significantly associated with salt stress (Zhang et al., 2022). Tomato MDHs contribute to salt tolerance through substrate-specific enzymatic activity and genetic co-localization with salt stress-related quantitative trait loci (QTL) (Imran et al., 2022). Malate dehydrogenase (MDH) protein was down-regulated under cold stress in Iranian spring wheat (cv. Kohdasht) (Rinalducci et al., 2011). In woody plants, the cytosolic MDH (MdcyMDH) enhances cold and salt stress tolerance in apple plants by boosting redox homeostasis through elevated ascorbate, glutathione, and salicylic acid levels, while optimizing mitochondrial-chloroplast metabolism to reduce oxidative damage (Yao et al., 2011; Wang et al., 2016). However, the relationship between MDH and abiotic stress such as salt and cold stress remains elusive in many plants. In Tibetan hulless barley (Hordeum vulgare), MDH genes are transcriptionally modulated under nitrogen (N) deficiency (Wei et al., 2016). Phosphate (P) deficiency induces upregulation of specific MDH isoforms. For example, GmMDH12 in soybean (Glycine max) nodules is transcriptionally activated under Pi starvation, enhancing malate synthesis (Zhu et al., 2021). Notably, direct studies on malate dehydrogenase (MDH) under boron (B) deficiency are not explicitly documented. Overall, the relationship between the MDH and nutrient deficiency stresses such as N, P and boron deficiency remains largely unexplored in many plants.
The MDH gene family exists widely in a variety of organisms and presents diverse characteristics in different species. In the model plant Arabidopsis Thaliana, there are three cytoplasmic MDH isoforms, namely cyMDH1, cyMDH2 and cyMDH3, and six isoproteins (Liszka et al., 2020). In crops, MDH gene family members have been characterized across multiple species: sweet potato (10 genes), Oryza sativa (12 genes), Solanum lycopersicum (12 genes), Gossypium raimondii (13 genes), Arachis hypogaea (15 genes), and Gossypium hirsutum (25 genes) (Ma et al., 2018; Imran et al., 2022; Zhang et al., 2022; Lin et al., 2023). In contrast, MDH genes have been identified only in two woody plants, with 12 genes reported in the gymnosperm Chinese fir (Cunninghamia lanceolata) and 20 genes in the fruit tree cultivar “Golden Crown” apple (Malus domestica) (Lin et al., 2023). Therefore, the role of MDH in response to abiotic and nutrient deficiency stresses remain largely unexplored in woody plants.
Eucalyptus spp., encompassing the genera Eucalyptus, Angophora, and Corymbia within the Myrtaceae family, are perennial dicotyledonous trees or shrubs. Eucalyptus spp. is a major cultivated fast-growing tree globally, with maximum annual growth up to 10 meter. It dominates forestry plantations across 100 countries and regions due to superior timber quality and broad environmental adaptability (Xu et al., 2025). Eucalyptus plantations account for over 20% of global forest plantation area, with major distributions in Australia, Brazil, China, and South Africa (Xu et al., 2025). In China alone, these plantations contribute more than one-third of the nation’s commercial timber production (Xu et al., 2025). Notably, Eucalyptus species exhibit specialized phosphorus acquisition strategies in phosphate-deficient acidic soils, where phosphorus availability is constrained by iron and aluminum fixation (Fang et al., 2024). For instance, phosphorus-deficient Eucalyptus grandis roots enhance organic acid exudation, including malate secretion, to mobilize soil-bound phosphorus (Chen et al., 2020; da Silva et al., 2024; Fang et al., 2024). Despite these observations, the molecular mechanisms driving phosphorus adaptation in Eucalyptus—particularly those involving malate dehydrogenase (MDH)-mediated metabolic pathways—remain largely uncharacterized. In addition, how the MDHs respond to the abiotic stresses were also unexplored in Eucalyptus.
In this study, we systematically identified 14 members of the Eucalyptus grandis MDH gene family through genome-wide characterization and traced their evolutionary trajectory across plant lineages. By conducting multi-conditional expression profiling of EgMDHs across tissues, developmental stages, and abiotic stresses (including nitrogen, phosphorus, and boron deficiencies, as well as low-temperature challenges), we identified candidate genes mediating nutrient-use efficiency and environmental adaptability. These findings provide foundational insights into the functional characterization of EgMDHs while establishing critical links between molecular evolution and ecological adaptation in woody plants.
2 Materials and menthods
2.1 Identification and characterization of EgMDHs in Eucalyptus grandis
The Eucalyptus grandis genome dataset analyzed in this study was obtained from the National Center for Biotechnology Information (NCBI) BioProject database with accession number: PRJNA509734 (Ferguson et al., 2024). The genome assembly ASM1654582v1 was retrieved from this project for downstream analyses. To systematically identify malate dehydrogenase (MDH) family proteins in Eucalyptus grandis, two Hidden Markov Model (HMM) profiles, Ldh_1_C (PF02866) and Ldh_1_N (PF00056), were acquired from the Pfam Database(http://pfam-legacy.xfam.org/; accessed on 19 October 2024).These profiles were employed for genome-wide screening of potential EgMDH candidates using HMMER software (v3.0), followed by sequence alignment and domain validation (Xu et al., 2025). Putative EgMDH proteins were further validated for conserved domains using three independent databases: NCBI Batch CD-Search (https://www.ncbi.nlm.nih.gov/Structure/bwrpsb/bwrpsb.cgi; accessed on 19 October 2024), Pfam (http://pfam-legacy.xfam.org/; accessed on 19 October 2024), and SMART (https://smart.embl.de/; accessed on 19 October 2024) (Wang et al., 2020; Xu et al., 2025). Proteins harboring both Ldh_1_C (PF02866) and Ldh_1_N (PF00056) domains were classified as EgMDHs. Subsequent comprehensive physicochemical characterization was performed using ExPASy (https://web.expasy.org/protparam/; accessed on 19 October 2024) to determine key biochemical properties, including amino acid composition, molecular weight (kDa), theoretical isoelectric point (pI), grand average of hydropathicity (GRAVY), and instability index (Wang et al., 2020; Xu et al., 2025). Subcellular localization predictions were generated using Plant-mPLoc (http://www.csbio.sjtu.edu.cn/bioinf/plant-multi/#; accessed on 19 October 2024) (Xu et al., 2025).
2.2 Phylogenetic analysis among multiple species
The amino acid sequences of Arabidopsis thaliana MDH proteins were retrieved from The Arabidopsis Information Resource (TAIR; https://www.arabidopsis.org/, accessed on 20 October 2024), while those of Populus trichocarpa and Oryza sativa were acquired from the Phytozome database (https://phytozome-next.jgi.doe.gov/, accessed on 20 October 2024). MDHs from these three species were validated using the same methodology applied to Eucalyptus grandis (EgMDH) in Section 2.1. Pairwise sequence alignments between MDH proteins of Arabidopsis thaliana, Populus trichocarpa, Oryza sativa, and Eucalyptus grandis were performed with MEGA12 (Wang et al., 2020). The aligned sequences were trimmed using the Quick Run TrimAL tool in TBtools to optimize the dataset for phylogenetic analysis (Chen et al., 2023). Evolutionary relationships were inferred in MEGA12 using the Neighbor-Joining method with 1,000 bootstrap replicates (Wang et al., 2020). The resulting phylogenetic tree was visualized and annotated using the Interactive Tree of Life (iTOL) platform (https://itol.embl.de/; accessed on 21 October 2024).
For broader phylogenetic resolution, MDH protein sequences from 22 additional species (Porphyra umbilicalis, Chlamydomonas reinhardtii, Volvox carteri, Marchantia polymorpha, Physcomitrium patens, Sphagnum fallax, Ceratopteris richardii, Thuja plicata, Abies alba, Ginkgo biloba, Gnetum montanum, Picea abies, Pinus tabuliformis, Amborella trichopoda, Magnolia biondii, Cinnamomum camphora, Camellia sinensis, Malus domestica, Vitis vinifera, Phyllostachys edulis, Psidium guajava, and Syzygium samarangense) were retrieved from databases (e.g., Phytozome, PlantTFDB) (Supplementary Table S2). These sequences, along with EgMDH and MDHs from Arabidopsis thaliana, Populus trichocarpa, and Oryza sativa, were processed identically to Section 2.1 and trimmed using the Quick Run TrimAL tool of TBtools (Xu et al., 2025). A maximum likelihood phylogenetic tree was constructed from the aligned sequences of all 26 species using MEGA7 with 1,000 bootstrap replicates, followed by visualization and annotation on the iTOL platform (https://itol.embl.de/, accessed on 23 October 2024) (Xu et al., 2025).
2.3 Conserved domains, motifs and gene structure analysis
Multiple sequence alignment of the EgMDH protein was conducted using DNAMAN software (Xu et al., 2025). The EgMDH protein sequence was subsequently submitted to the MEME Suite (https://meme-suite.org/meme/; accessed on October 22, 2024) to identify conserved motifs, with the number of motifs to be identified set to 10. The MAST XML output format was selected for further analysis. The distribution of the top 10 enriched motifs in EgMDHs was visualized using the Simple MEME Wrapper module in TBtools software (Chen et al., 2023). Gene structures were then annotated and visualized using the Visualize Gene Structure (Basic) function in TBtools (Chen et al., 2023).
2.4 EgMDHs gene family replication events and cross-species covariance analysis
To investigate intra-species duplication events within the EgMDH gene family, intra-species collinearity analysis was conducted. Chromosomal length data were first compiled using the Fasta Stats module (a built-in TBtools tool) to generate the ChrLen.txt reference file (Chen et al., 2023). Gene-gene relationships were identified using the One-Step MCScanX-Super Fast module in TBtools. The Text Block Extract and Filter function in TBtools was subsequently applied to isolate EgMDH-related gene pairs from tandem duplication datasets. Gene identifiers were retrieved using the Table Row Extract or Filter module in TBtools. Intra-species syntenic relationships were visualized using the Advanced Circos package in TBtools (Chen et al., 2023). For comparative evolutionary analysis, inter-species synteny was examined between Eucalyptus grandis and three reference species: Arabidopsis thaliana, Oryza sativa, and Populus trichocarpa. The One-Step MCScanX-Super Fast module in TBtools was employed for cross-species collinearity analysis. After standardizing chromosome nomenclature across all four species in the output CTL file, results were visualized using the Dual Synteny Plot for MCscanX module in TBtools (Chen et al., 2023).
2.5 Regulatory network analysis of transcription factors for EgMDHs
To identify upstream regulatory transcription factors of EgMDH genes, the 2-kb promoter sequences upstream of EgMDH transcription start site were extracted using the gff3 Sequence Extract and Fasta Extract modules in TBtools (Chen et al., 2023). All sequences were submitted to the PlantRegMap database (https://plantregmap.gao-lab.org/regulation_prediction.php; accessed on 24 October 2024) for regulatory transcription factor prediction (Tian et al., 2020). Categorical statistical analyses and visualization workflows were implemented using Origin 2024 to generate stacked bar charts, categorical heatmaps, and chord diagrams (Xu et al., 2025). Heatmap classifications were further refined using the HeatMap tool in TBtools (Xu et al., 2025). Word clouds and composite bar plots were generated using the ggplot2 package (v3.4.4) in R (version 4.3.2) (Xu et al., 2025).
2.6 Protein-protein interaction networks
The MDH protein sequences of Eucalyptus grandis were submitted to the STRING database (https://string-db.org/; accessed on 26 October 2024) for interaction prediction. To construct a cross-species protein interaction network, three model plants—Eucalyptus grandis, Populus trichocarpa, and Arabidopsis thaliana—were systematically selected as reference species. Analysis parameters included full STRING networks, edge evidence annotation, medium confidence for interaction scores (threshold: 0.400), and a maximum of 20 interactors displayed. The TSV output, containing unidirectional interactions, was imported into Cytoscape (v3.7.1) for network visualization (Xu et al., 2025). Node size and color were mapped to degree, while edge size and color were scaled to the combined_score to quantify interaction intensity across multiple dimensions (Xu et al., 2025). Enrichment terms derived from the STRING Analysis module were visualized as bubble plots using the ggplot2 package (v3.5.1) in R (v4.3.2). Sankey diagrams were generated using Origin 2024 (Xu et al., 2025).
2.7 RNA-seq data analysis
The RNA-seq transcriptome data of Eucalyptus grandis analyzed in this study were retrieved from the National Genomics Data Center (NGDC; https://bigd.big.ac.cn/gsa; accessed on October 28, 2024) under accession number PRJCA002468 (Fan et al., 2024). This study utilized transcriptome data from Eucalyptus grandis clone GL1, encompassing the following experiments: (1) In vitro tissue sampling: roots, stems, and leaves collected from 1-month-old seedlings; stem internodes (shoot apex to 11th internode) from 6-month-old shoots; and lateral branches, flowers, and seeds from 3- and 6-year-old trees. (2) Adventitious rooting dynamics: basal stem segments harvested at 0, 1, 6, 24, 48, 72, and 96 hours post-transfer to root induction medium, with roots sampled at 168 hours and 20 days. (3) Stress/hormone responses: For 2-month-old tissue-cultured shoots, 4–8 fully expanded young leaves below the apex were treated. Samples were collected at 0, 1, 6, 24, and 168 hours post-treatment (Fan et al., 2024). Raw sequence data underwent quality assessment using FastQC v0.11.9 (Xu et al., 2025). Preprocessing was performed with Trim Galore v0.6.10 and Cutadapt v4.0, followed by alignment to the reference genome using STAR v2.7.10a with a pre-generated genome index (Xu et al., 2025). SAM files were converted to BAM format using samtools v1.16.1, and gene expression quantification was conducted via featureCounts v1.6.4 (Xu et al., 2025). Differential expression analysis and sample normalization were performed using DESeq2 v1.42.1 in R v4.3.2 (Xu et al., 2025). Final visualization of results included heatmaps generated with the R packages pheatmap v1.0.12 and ggplot2 v3.5.1 (Xu et al., 2025).
2.8 Plant treatment and RT-qPCR experiment
The methods for Eucalyptus grandis seed harvesting, storage, germination, and growth conditions were consistent with our previous study (Xu et al., 2025). Briefly, 1.5-month-old uniformly grown seedlings were cultivated in a 1/2 Hoagland hydroponic system for three weeks (Xu et al., 2025). Seedlings were subsequently divided into three treatment groups: Control (CK): 10 mM KNO3, 0.5 mM KH2PO4; Nitrogen starvation (-N): 0 mM KNO3; Low phosphorus (LP): 0.005 mM KH2PO4. Root tissues were harvested at 2 h and 24 h for the -N treatment, and at 6 h, 12 h, 24 h, and 72 h for the LP treatment. For cold stress analysis, seedlings were transferred to 4°C under controlled light and humidity conditions, with leaf samples collected after 24 h (25°C served as the control condition). Total RNA was extracted using the RNAprep Pure Plant Plus Kit (TIANGEN, China) and reverse-transcribed with the Evo M-MLV Reverse Transcription Premixed Kit (Accurate Biotechnology, China) (Xu et al., 2025). RT-qPCR assays were performed on a QuantStudio 1 Plus system (Thermo Fisher Scientific) using the SYBR Green Pro Taq HS Premixed qPCR Kit (Accurate Biotechnology) (Xu et al., 2025). The amplification efficiency of primers specific to 14 EgMDH genes was validated using EgACTIN7 (LOC104418150) as the internal reference gene, which has exhibited continuously stable high expression across various transcriptomic datasets (Wei et al., 2025). Three biological replicates (each with three technical replicates) were analyzed per condition. Relative gene expression was calculated using the 2−ΔΔCt method (Lin et al., 2021; Wang et al., 2023; Xu et al., 2025).
3 Results
3.1 Genome-wide characterization of EgMDHs in Eucalyptus grandis
A total of 14 malate dehydrogenases (MDHs) were identified in Eucalyptus grandis, designated as EgMDH1 to EgMDH14. The coding sequences (CDS) and corresponding amino acid sequences of these EgMDHs are provided in Supplementary Table S1. To assess the functional potential of EgMDH proteins, we analyzed their basic biochemical and physicochemical properties (Table 1). Most EgMDHs (excluding EgMDH2) were relatively small plant proteins, with lengths shorter than the average plant protein size (424.34 amino acids (aa)) (Mohanta et al., 2019). All EgMDHs except EgMDH10 exhibited isoelectric points (pI) above the average pI of plant proteins (5.62) (Mohanta et al., 2019). Stability predictions indicated that the majority of EgMDHs (except EgMDH1, EgMDH3, and EgMDH9) were stable, with instability indices below 40 (Guruprasad et al., 1990). Hydrophobicity analysis revealed that most EgMDHs (excluding EgMDH2, EgMDH8, and EgMDH13) had positive grand average of hydropathicity (GRAVY) values, suggesting inherent hydrophobicity. Subcellular localization predictions further indicated that EgMDHs are distributed across multiple compartments, including mitochondria, cytoplasm, chloroplasts, and peroxisomes (Table 1).
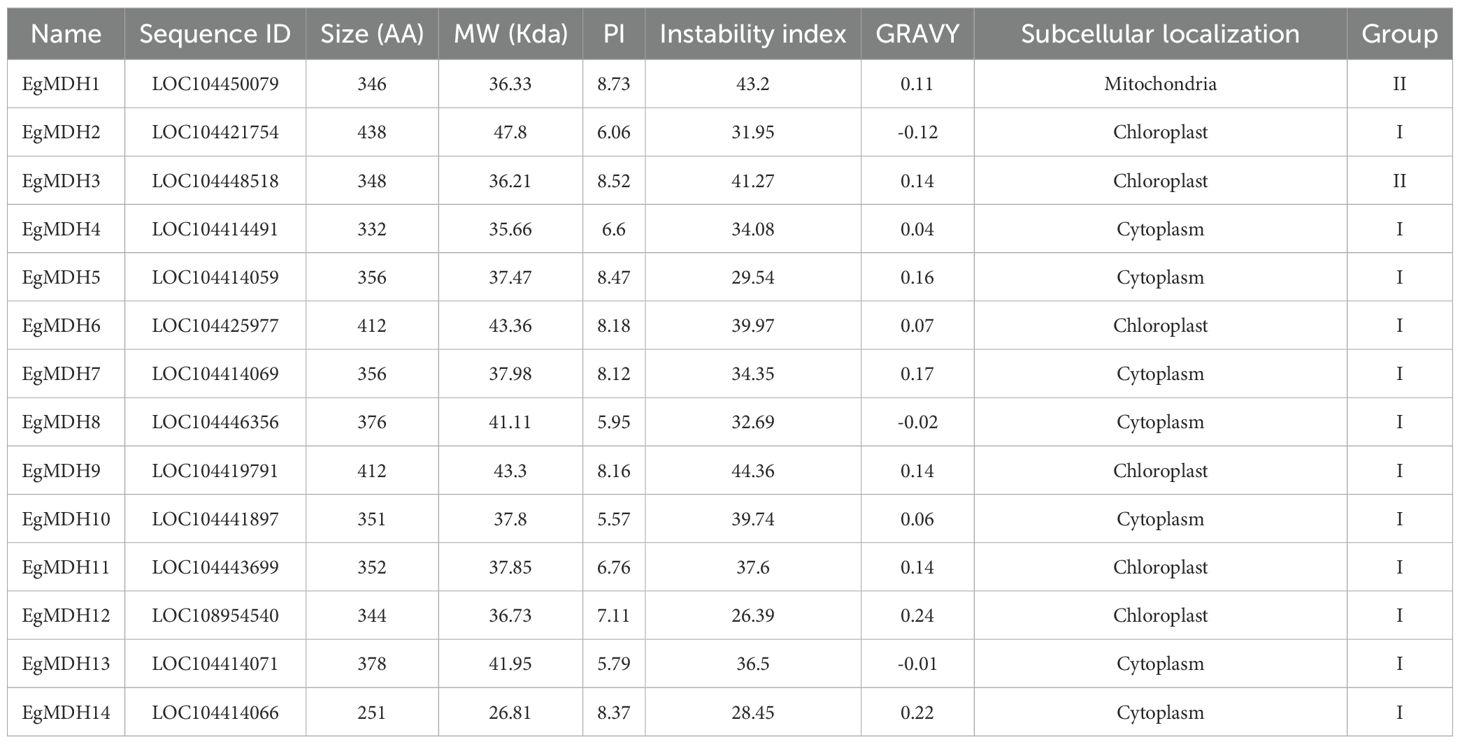
Table 1. The Characterization of MDHs in Eucalyptus grandis..
3.2 Phylogenetic analysis of MDH proteins
To investigate the evolutionary characteristics of EgMDH, we analyzed MDH gene families across 29 species spanning early-diverging algae, mosses, ferns, gymnosperms, and woody angiosperms (Xu et al., 2025). This dataset represents a comprehensive evolutionary lineage from aquatic to terrestrial plants and herbaceous to woody taxa (Xu et al., 2025). A total of 401 proteins containing both the Ldh_1_C and Ldh_1_N domains were identified (Supplementary Table S1). Phylogenetic reconstruction using the neighbor-joining method revealed three major groups: Group I (151 proteins), Group II (66 proteins), and Group III (184 proteins) (Figure 1A). Phylogenetic analysis revealed that Group I and Group II MDH families originated from Chlamydomonas reinhardtii, whereas Group III originated from Porphyra umbilicalis (Supplementary Figure S1; Supplementary Table S2). These findings suggest that Group III represents the earliest evolutionary branch within the MDH family. Early algal species exhibited an average of five MDH genes. During plant terrestrialization, a marked expansion occurred: mosses averaged 18 MDHs, ferns evolved 20 MDHs, while gymnosperms and angiosperms showed slight fluctuations with an average of 14 MDHs (Supplementary Table S2). The substantial increase in MDH gene number during moss evolution may reflect adaptive genomic expansion associated with the aquatic-to-terrestrial transition (Fang et al., 2022). No significant changes were observed in later terrestrial plant lineages. In Eucalyptus grandis, Group I contained the largest MDH cohort (EgMDH5, EgMDH6, EgMDH7, EgMDH9, EgMDH12, EgMDH13, and EgMDH14), while Group II comprised only two members (EgMDH1 and EgMDH3). Group III included five MDHs (EgMDH2, EgMDH4, EgMDH9, EgMDH10, and EgMDH11).
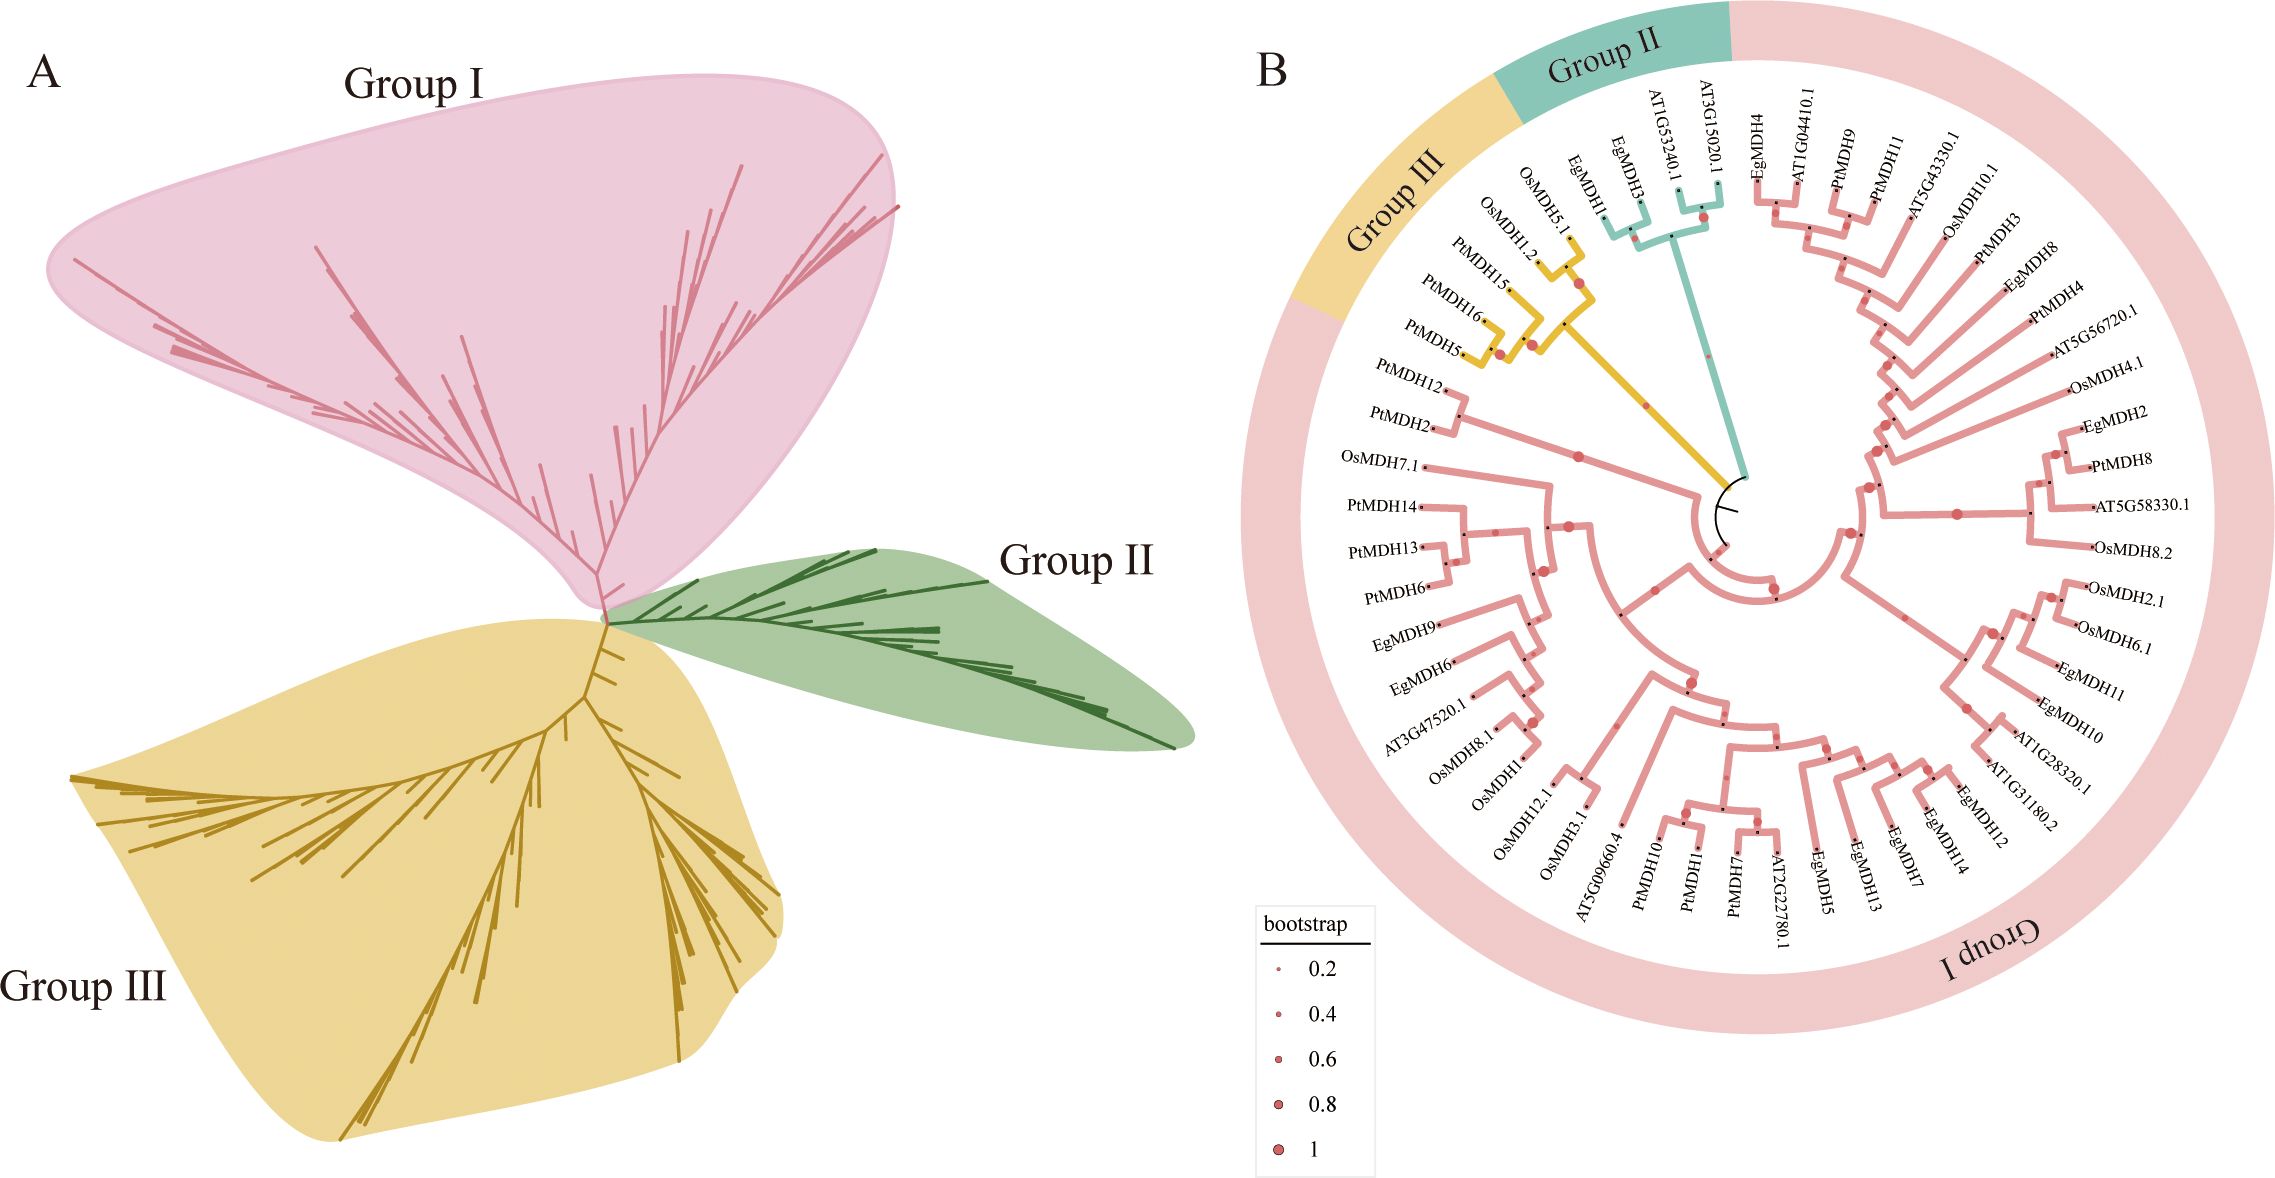
Figure 1. Phylogenetic analysis of MDH proteins. The (A) consists of 401 MDH proteins from 29 plant species and is classified into three categories (Group I, Group II and Group III). The detailed information of MDHs of 29 plant species is shown in the Supplementary Table S1. (B) shows the phylogenetic analysis of the MDH gene family in Eucalyptus grandis compared with Arabidopsis thaliana, Oryza sativa, and Populus trichocarpa. The phylogenetic tree was constructed using the Neighbor-Joining method in MEGA12 with 1000 bootstrap replicates. Red dots represent the guide values/metadata. The size of the circles corresponds to the bootstrap support level of the branches. The diameter of the circles is proportionally scaled to the bootstrap support values (ranging from 0.2 to 1), where a larger diameter indicates a higher statistical confidence. The tree was divided into three distinct evolutionary clades (Group I to Group III), each highlighted by a unique color. MDH genes from Arabidopsis thaliana, Oryza sativa, Populus trichocarpa, and Eucalyptus grandis are prefixed with “At”, “Os”, “Pt”, and “Eg”, respectively. The protein sequences of Arabidopsis thaliana, Oryza sativa, Populus trichocarpa, and Eucalyptus grandis MDHs were listed in Supplementary Table S3.
To elucidate evolutionary patterns, we analyzed 53 MDH protein sequences from Arabidopsis thaliana (11), Oryza sativa (12), Populus trichocarpa (16), and Eucalyptus grandis (14). Phylogenetic clustering resolved three distinct groups (Groups I-III; Figure 1B; Supplementary Table S3). Group I contained the majority of sequences (44 MDHs), with Eucalyptus grandis MDHs (EgMDH2, EgMDH4, EgMDH5-14) clustering alongside homologs from Arabidopsis (9), rice (10), and Populus trichocarpa (13). The balanced distribution of MDHs across these four species in Group I implies conserved functional roles during evolution (Xu et al., 2025). Groups II and III showed reduced diversity, with Group II containing two Eucalyptus grandis (EgMDH1, EgMDH3) and two AtMDHs, while Group III included two rice and two PtMDHs. Notably, the divergent subfamily classifications between Populus trichocarpa and Eucalyptus grandis—both woody perennials—suggest lineage-specific functional diversification of MDHs during evolution.
3.3 Conserved motifs and gene structural features of MDHs
To investigate the structural conservation of EgMDHs, we conducted multiple sequence alignment of the protein sequences from 14 EgMDH members (Supplementary Figure S2). All EgMDHs harbored two conserved domains characteristic of plant MDHs: Ldh_1_C (Pfam ID: PF02866) and Ldh_1_N (Pfam ID: PF00056), with highly consistent domain architecture across all members (Supplementary Figures S2, S3). To further understand the functional conservation, MEME analysis identified the ten most enriched motifs within the EgMDH protein sequences (Figure 2). Notably, three evolutionarily recent paralogous pairs (EgMDH1/EgMDH3, EgMDH6/EgMDH9, and EgMDH10/EgMDH11) shared six, six, and two identical motifs, respectively (Figures 2A, B; Supplementary Figure S4). Gene structure analysis revealed that EgMDH1 and EgMDH3 exhibited identical exon numbers and distributions, whereas EgMDH6/EgMDH9 and EgMDH10/EgMDH11 displayed matching exon counts but minor positional variations (Figure 2C). These findings suggest that evolutionarily related paralogs shared highly conserved motif and exon distribution patterns. Notably, EgMDH13 uniquely lacked Motif2 (CDHIRDWVLGTPEGTWVSMGVYSDGS), which was present in all other members. Structural analysis indicated that EgMDH13 possessed an expansive gene architecture, with coding sequences (CDS) separated by a 70-kb intron (Figure 2C), potentially explaining its divergent motif composition. Among Group I members, exon numbers ranged from 1 (EgMDH6 and EgMDH9, each containing a single ~2000-bp exon) to 14 (EgMDH2). In contrast, Group II members (EgMDH1 and EgMDH3) uniformly contained seven exons. Overall, EgMDH had relatively conserved motifs and gene structure but with variation in certain members.
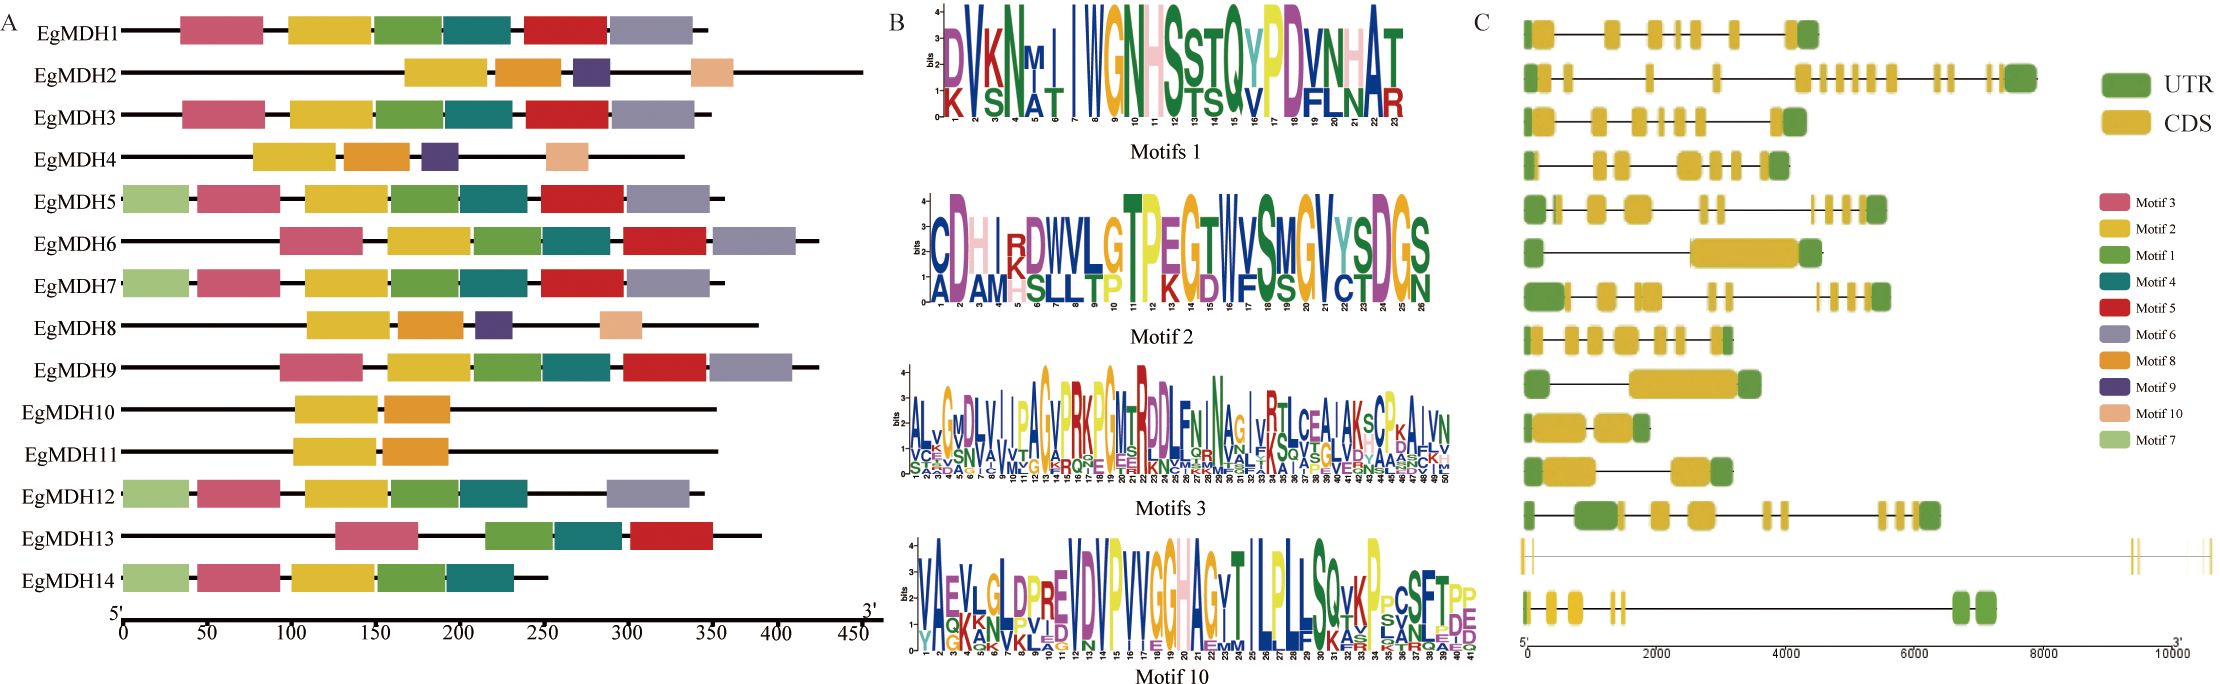
Figure 2. Conserved motifs and gene structural features of MDHs. (A) described the distribution of conserved motifs of EgMDH. (B) showed the sequence identification of several representative EgMDH motifs. (C) represented the genetic structure of EgMDHs, including CDS, UTR, and introns (where the black line indicated the intron, separating the UTR and CDS structures). The position of the sequence motif, its domain, and the size of the UTR or CDS were estimated by the scale at the bottom.
3.4 Intraspecific duplication and interspecific homology of the EgMDH gene family
To investigate intragenomic duplication events within the EgMDH family, we conducted collinearity analysis across the Eucalyptus grandis genome. The results identified four segmentally duplicated gene pairs: EgMDH1 and EgMDH3 on chromosome 6, EgMDH6 and EgMDH9 on chromosomes 2 and 7, EgMDH10 (chromosome 4) paired with EgMDH11 (chromosome 5), and EgMDH12 with EgMDH14 on chromosome 8 (Figure 3A). Notably, these duplicated pairs correspond precisely to the paralogous relationships identified in our evolutionary analysis. Consistent with their shared origins, motif and gene structure analyses revealed high conservation of structural features among these paralogs. To elucidate the evolutionary origins of the EgMDH family, we performed comparative synteny analysis between Eucalyptus grandis and representative species (Arabidopsis thaliana, Oryza sativa, and Populus trichocarpa; Figures 3B-D). The EgMDH family exhibited homologous relationships with 8, 3, and 14 MDH genes from Arabidopsis, rice, and Populus trichocarpa, respectively, demonstrating strong evolutionary conservation across angiosperms. Phylogenetic comparisons revealed closer evolutionary relationships between EgMDHs and MDH families of Populus trichocarpa (a woody dicot) and Arabidopsis than with those of rice (a monocot), suggesting lineage-specific conservation patterns among dicotyledonous plants.
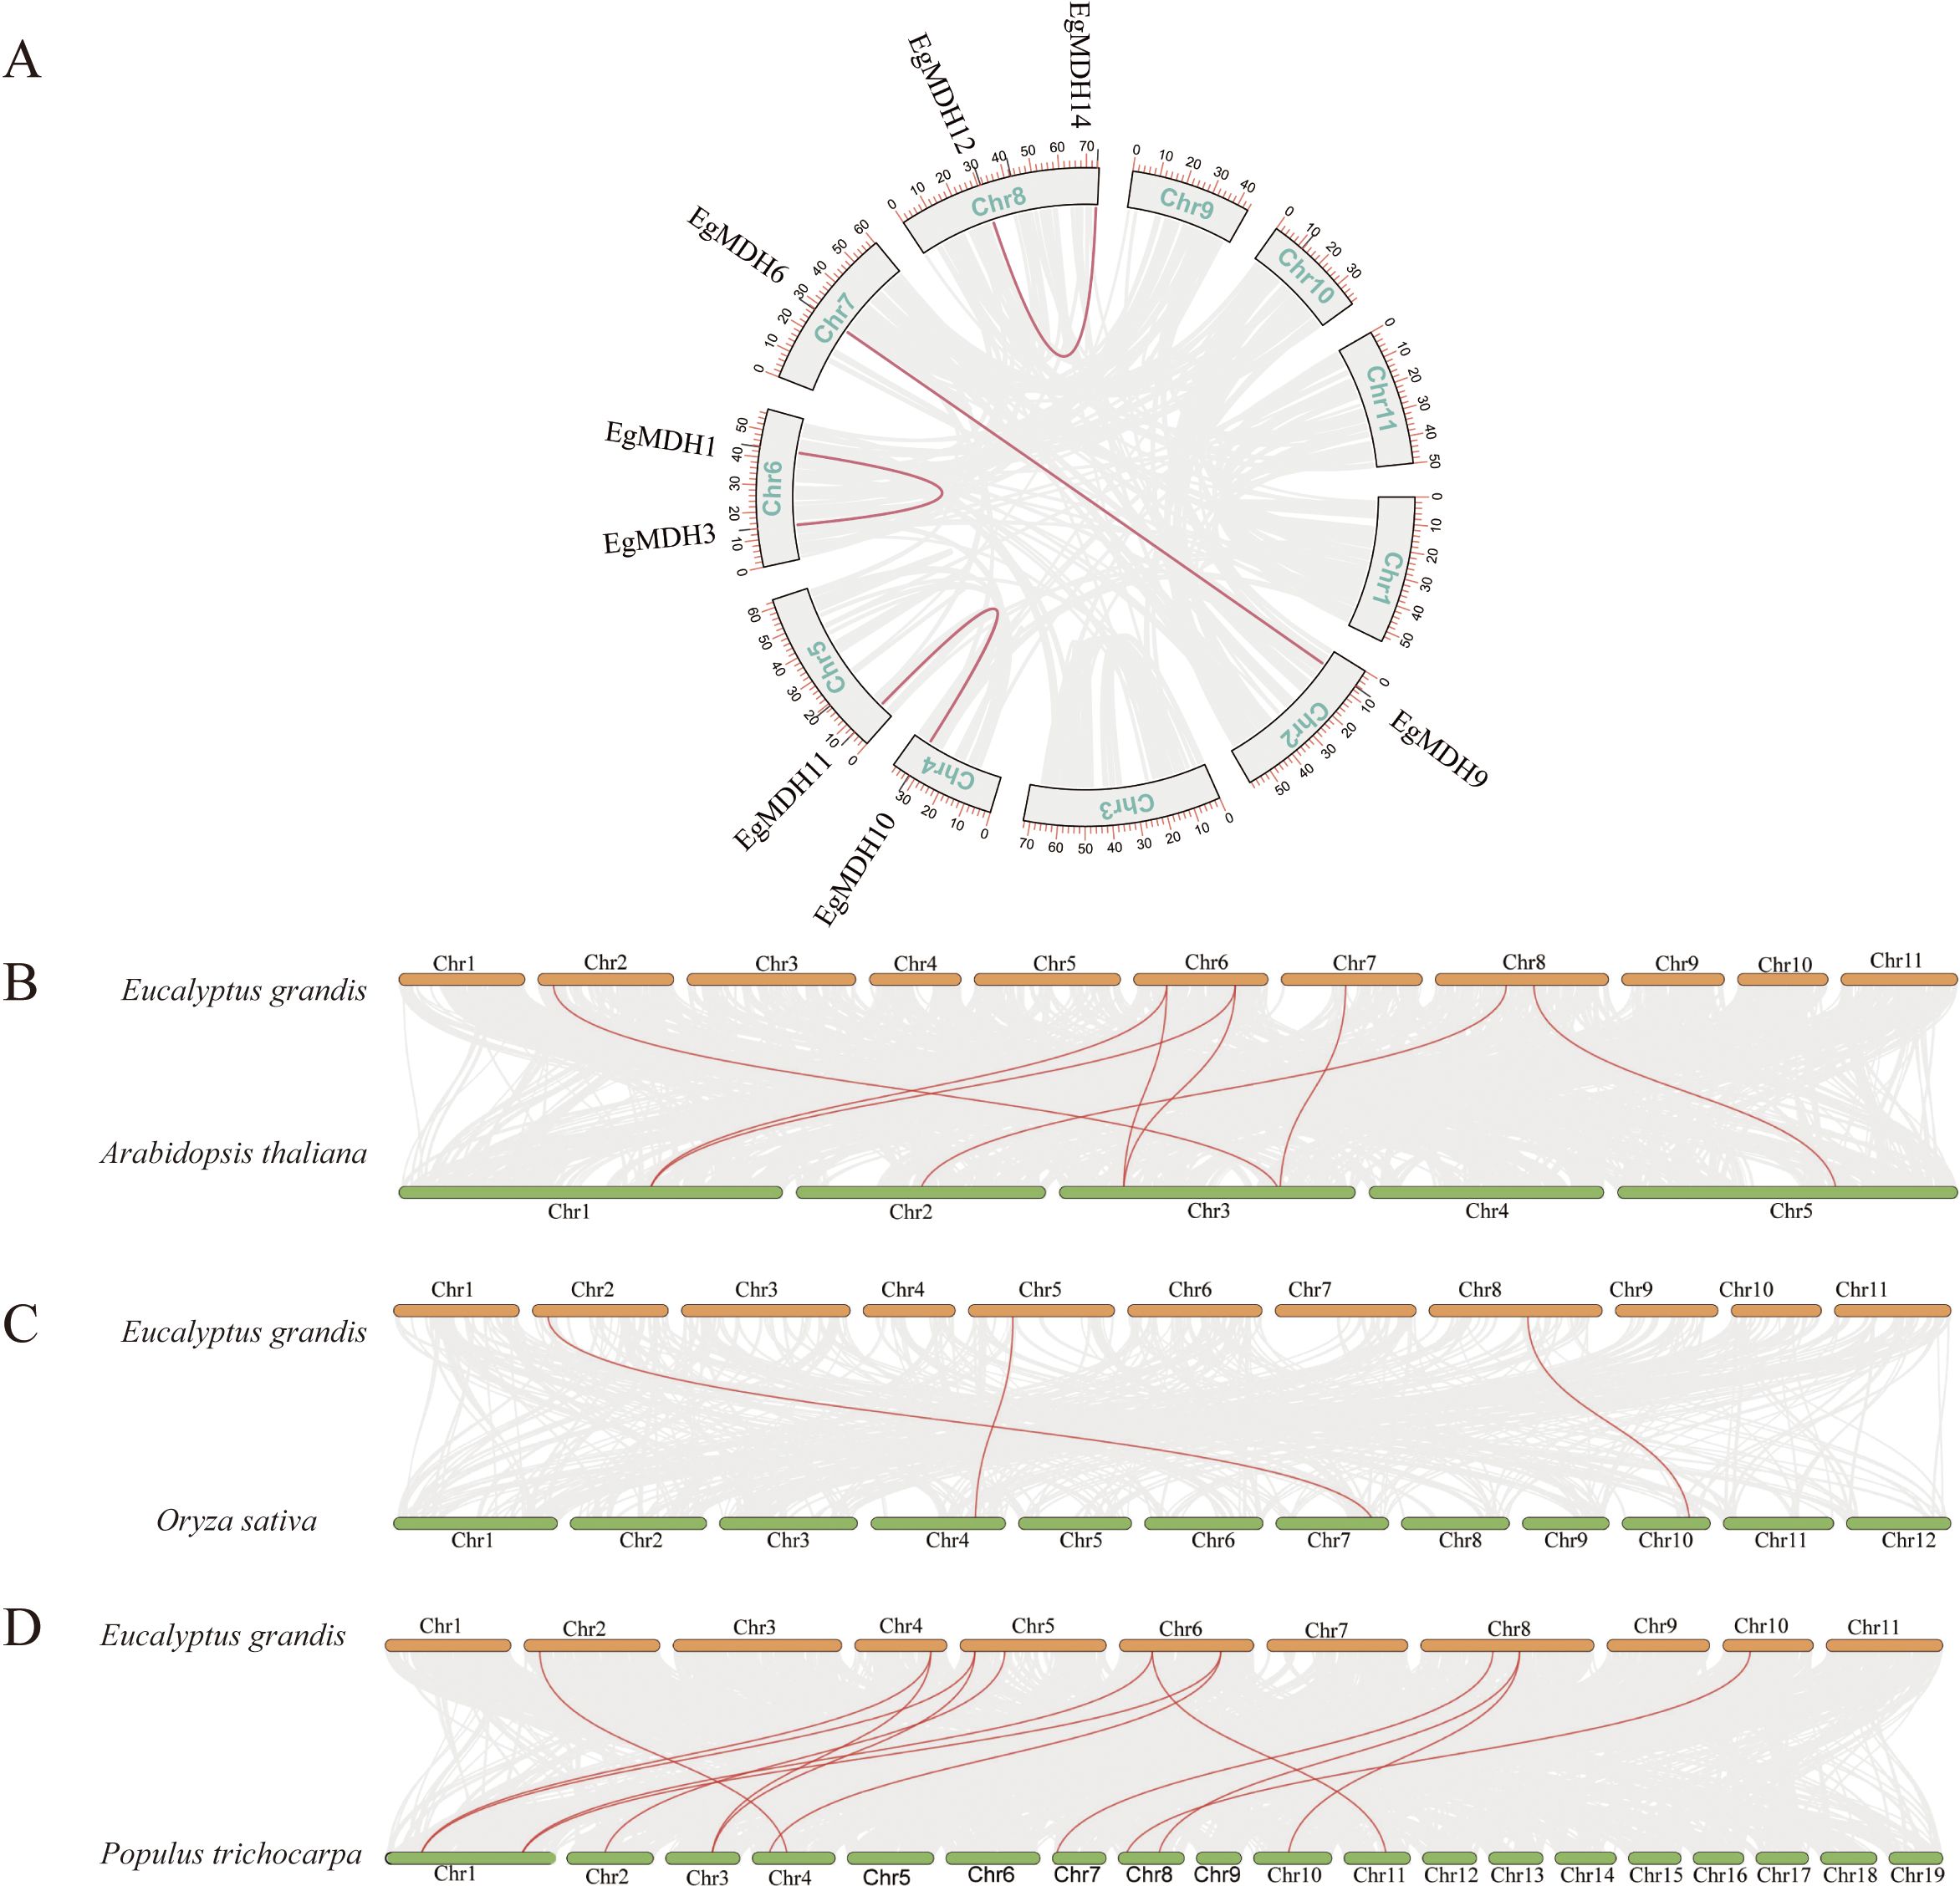
Figure 3. Intraspecific duplication and interspecific homology of the EgMDH gene family. The (A) illustrates the chromosomal localization of the EgMDH gene family in Eucalyptus grandis and its intra-species duplication events. The chromosomes are arranged in boxes (Chr1–Chr11), and the positions of EgMDH genes on each chromosome are marked with black short lines. Red connecting lines indicate homologous duplication relationships among EgMDH genes. Analysis of covariance between Eucalyptus grandis MDHs and Oryza sativa (B), Arabidopsis thaliana (C), and Populus trichocarpa (D). Orange represented the chromosomes of Eucalyptus grandis, green represented the chromosomes of Oryza sativa, Arabidopsis thaliana, and Populus trichocarpa and the red line highlighted MDH gene pairs with covariance.
3.5 Deciphering transcription factor networks upstream of EgMDHs
To identify candidate transcription factors (TFs) regulating EgMDHs expression, we utilized the PlantRegMap database to characterize potential regulatory interactions (Figure 4; Supplementary Table S4). Analysis revealed 60 candidate TFs potentially regulating EgMDHs, with their regulatory networks visualized via chord diagrams (Figure 4A). All identified TFs were enriched in the promoter regions of EgMDHs and classified into seven functional categories (Figure 4B): growth regulation (15 groups of TFs: MYB, WRKY, NAC, Homeobox, MADS-box, YABBY, WUS, LFY, LOB, GT-2, ALC, NAM, AIL6, FLO and REF6); stress adaptation (13 groups of TFs: DREB, AP2, CAMTA, Metallothionein, HSFB2A, VIP1, SGT1, RAX1, SREBP, CDF, RGL1, REM16 and POSF21); plant hormone signaling (9 groups of TFs: ERF, DELLA, ARR1, BZR1, ABI3, TGA1, ARF, E2F/DP and CREB); metabolic regulation (10 groups of TFs: ZF-Dof, NLP6, F5D14.30, RIO, DNAJ (HSP40), SHN, BPC, GLK1, K13N2 and F21H2.9); light/timing responses (4 groups of TFs: HY5, GATA, CDF, GT-2); protein homeostasis and gene dynamics (3 groups of TFs: DNAJA3A, SGT1 and ADA2) and general regulators (5 groups of TFs: bZIP, HLH, bHLH, UNE10, HD and E2FE). Frequency analysis of TF regulatory interactions highlighted AP2/ERF, ZF-Dof, and BPC as high-frequency regulators (Figures 4C, D), suggesting EgMDHs expression is tightly linked to pathways governing energy metabolism, stress adaptation, and secondary metabolism. Notably, GT-2, AIL6, and NLP6 were exclusively enriched in the Group II malate dehydrogenase subclass (EgMDH3), underscoring subtype-specific regulatory mechanisms. Overall, these results suggested that EgMDHs might be highly regulated by transcription factors at the transcriptional level.
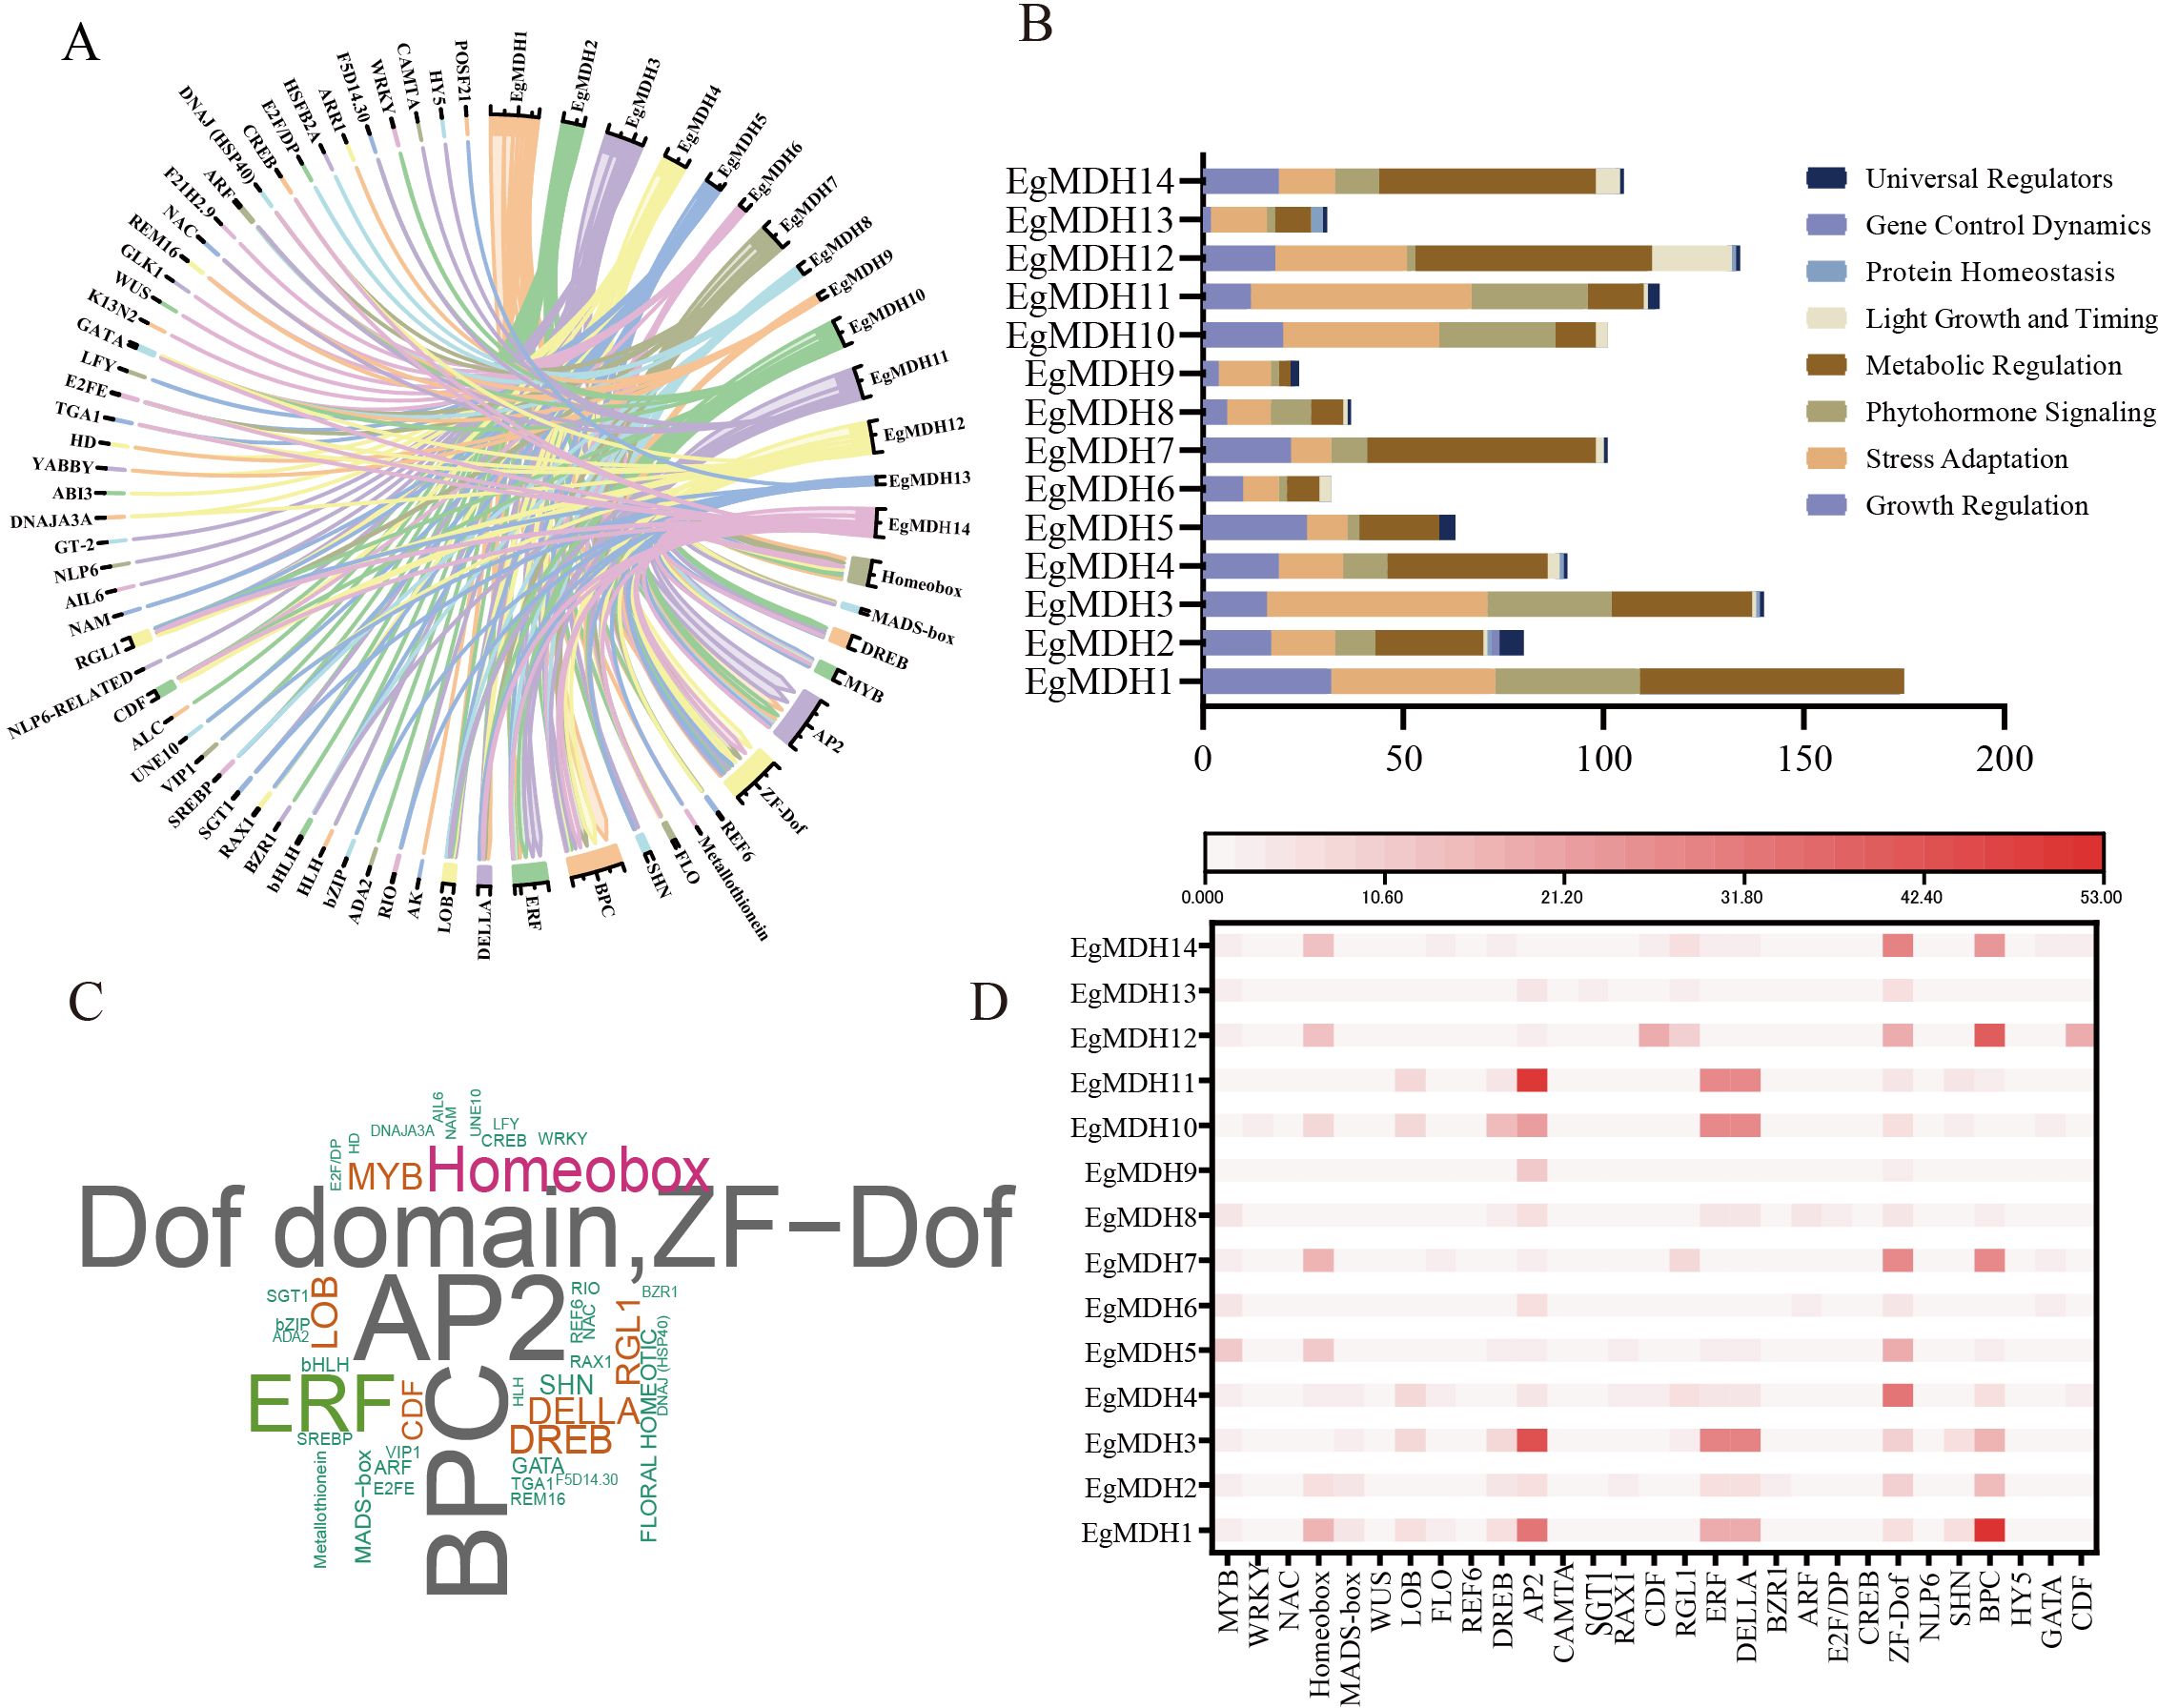
Figure 4. Identification the upstream regulatory transcription factors of EgMDHs. (A) Network chord diagram of predicted transcription factors targeting EgMDH genes. Arrow direction indicates the relationship from EgMDHs to transcription factors. (B) Stacked bar plot representing the counts of transcription factors. (C) Word cloud of transcription factors, where font size is proportional to the number of corresponding transcription factors. (D) Statistical analysis of major potential regulatory transcription factors in the promoter regions of each gene.
3.6 Protein-protein interaction network of EgMDHs
To investigate the potential functions of EgMDHs, we performed protein-protein interaction (PPI) analysis using the STRING database. Integrated PPI and functional characterization revealed that EgMDH family proteins form a sophisticated metabolic regulatory network. The PPI results demonstrated that 11 out of 14 EgMDH members (excluding EgMDH5, EgMDH7, and EgMDH12) participated in intricate regulatory protein-protein interactions (Figure 5A). The EgMDH interacting proteins enriched in proteins included PPC1, ASP3, and ASP2, which were annotated as phosphoenolpyruvate carboxylase (PEPC) and aspartate aminotransferases (Figure 5B). Aspartate aminotransferase is a key enzyme in plant nitrogen assimilation, directly mediating amino acid synthesis and interconversion. Additionally, EgMDHs were found to interact with NADP-ME2 and ACLB-2, which are associated with glyoxylate metabolism (Figure 5B). Glyoxylate cycle activity modulates phosphate metabolism by regulating acetate utilization and phosphate mobilization (Burow et al., 2008). Thus, EgMDHs may also participate in nitrogen and phosphate metabolism in Eucalyptus grandis.
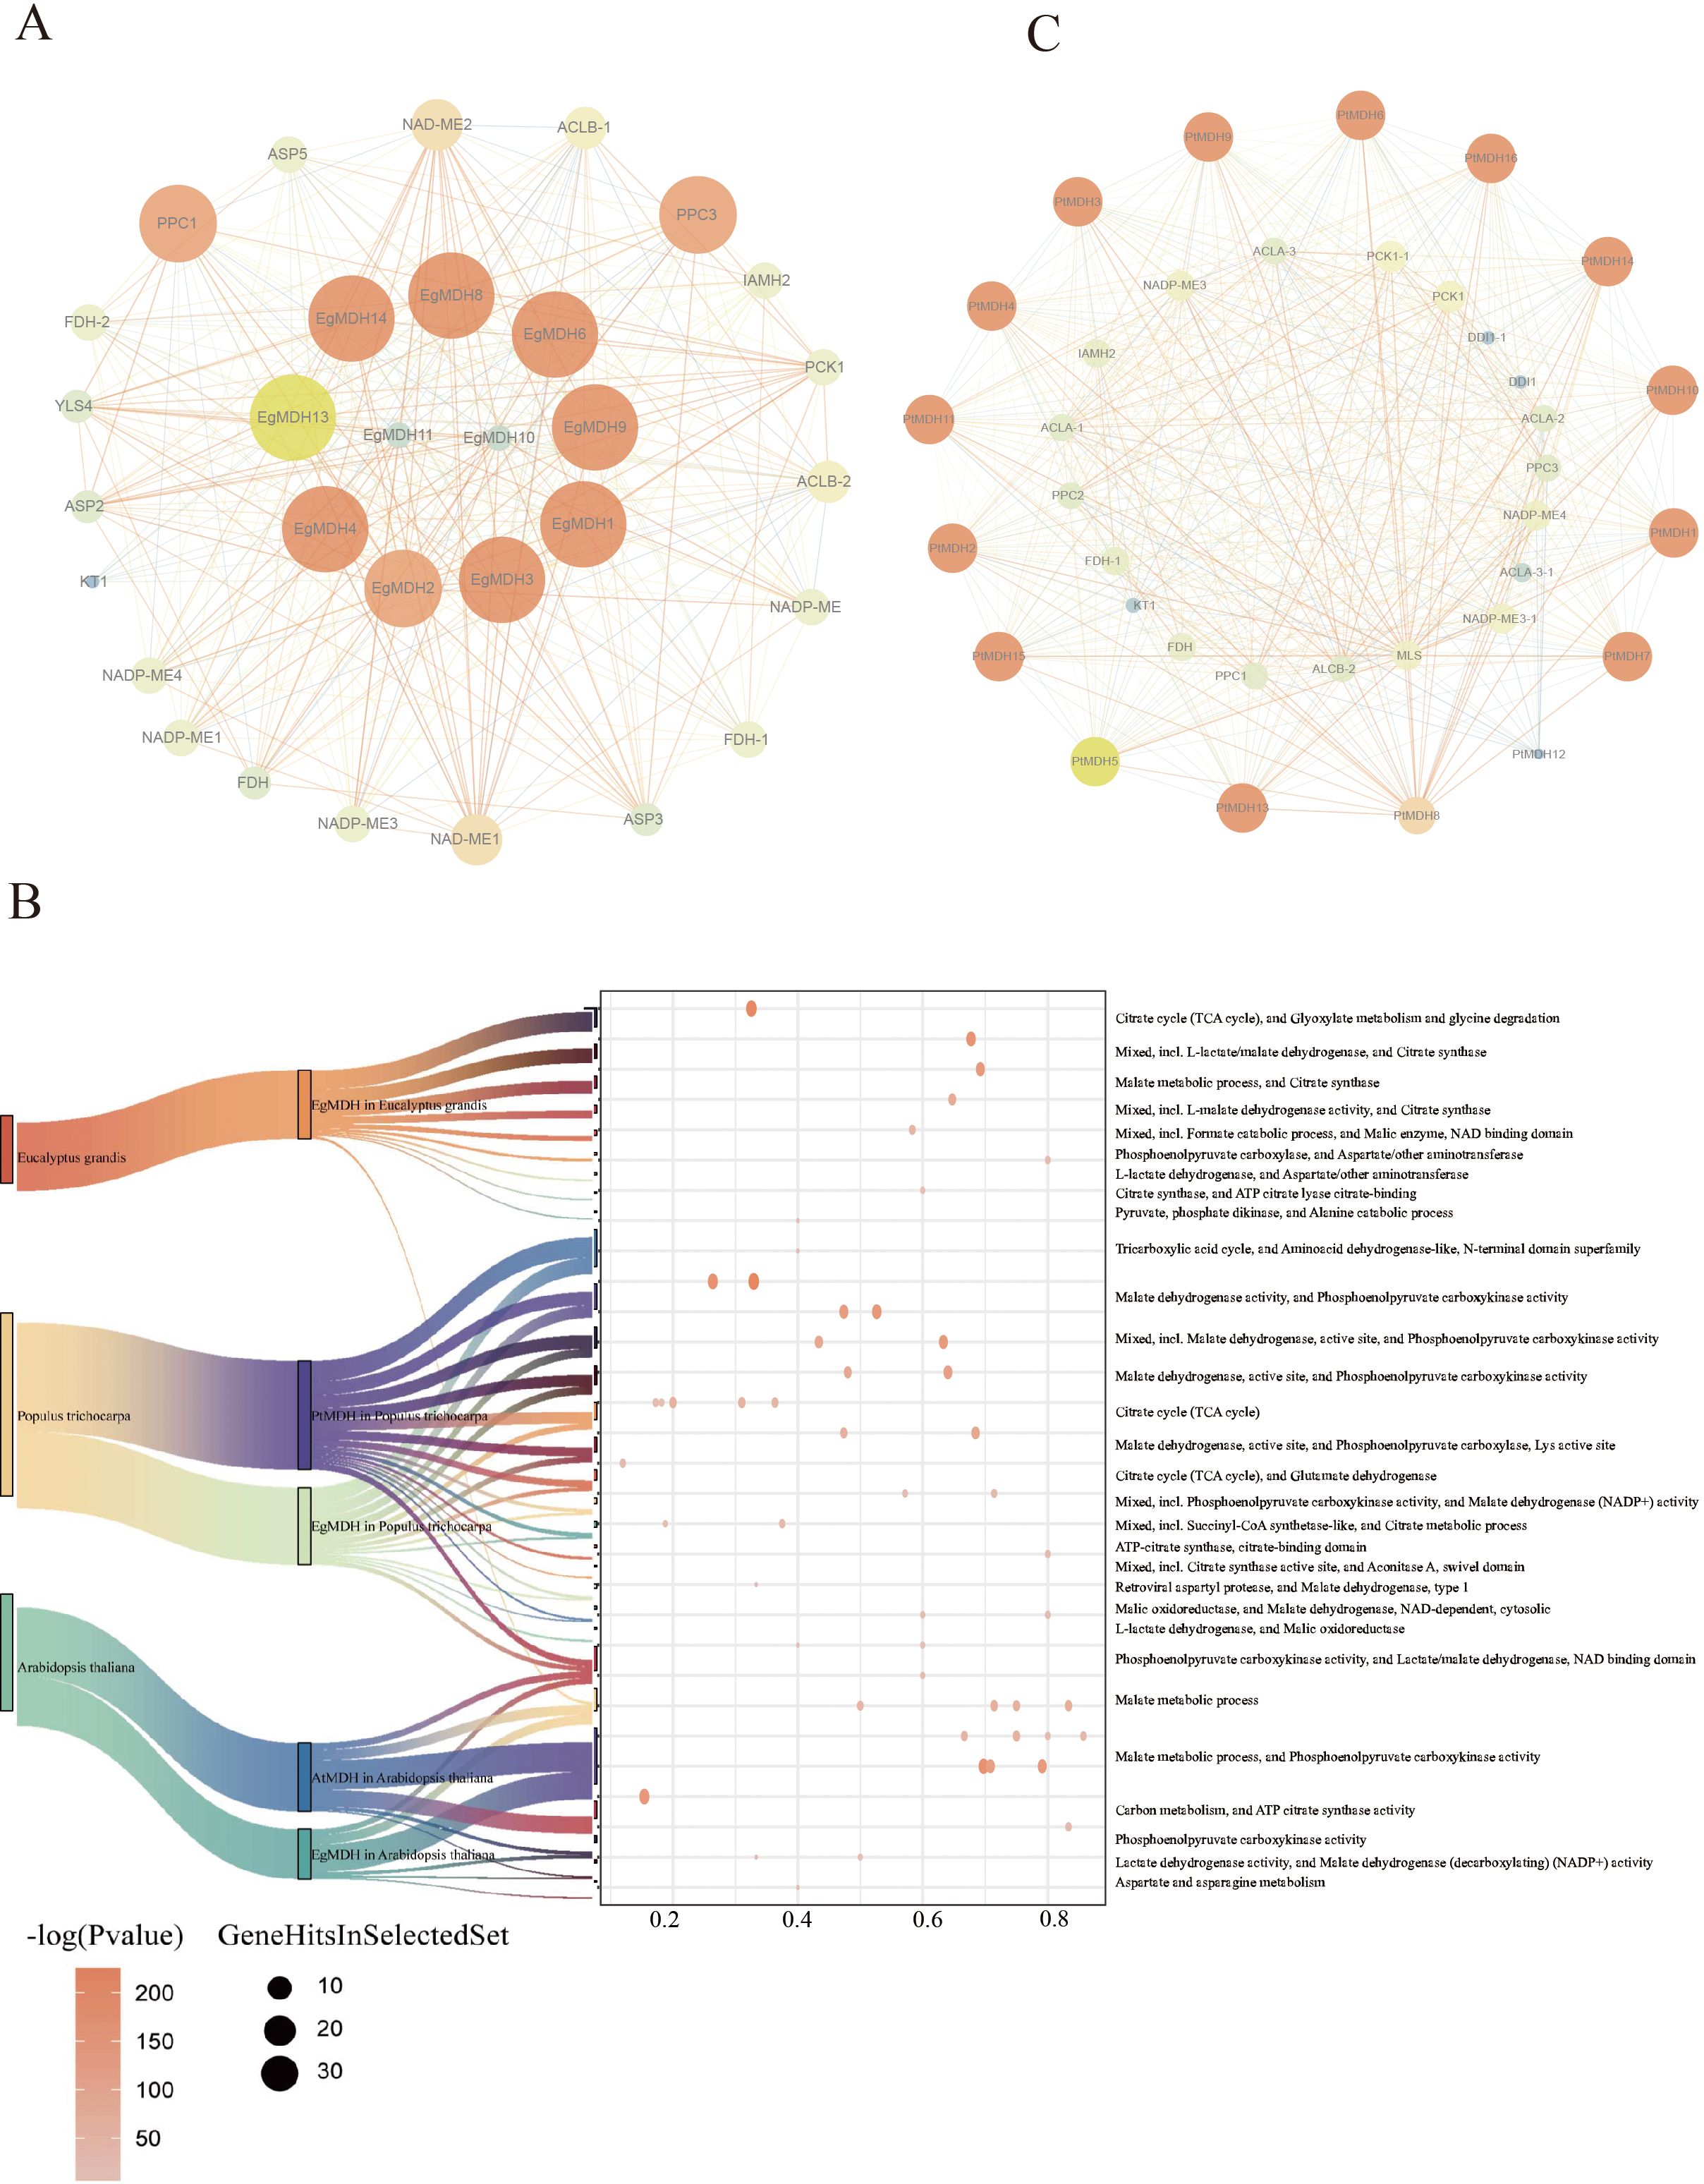
Figure 5. Protein-protein interaction network of EgMDHs. (A) Interaction network between EgMDHs proteins and other Eucalyptus grandis proteins. (B) Cluster enrichment of EgMDH-, PtrMDH-, and AtMDH-interacting proteins in Eucalyptus grandis, Populus trichocarpa, and Arabidopsis thaliana. (C) Interaction network between PtMDHs proteins and Populus trichocarpa proteins.The network map visualizes protein interactions in two dimensions: Node size and color reflect the degree of interaction, with smaller and darker nodes indicating lower degrees, and larger and brighter nodes indicating higher degrees. Edge thickness and color represent the “combined_score,” where thinner and darker edges correspond to lower scores, and thicker and brighter edges correspond to higher scores.
In Populus trichocarpa, several glyoxylate cycle-associated proteins were also linked to formate catabolism. Intriguingly, DDI1 and NLP3 interacted exclusively with PtMDHs. DDI1 has been implicated in cold stress adaptation in cucumber (Wang et al., 2019). Furthermore, PtMDH4 and PtMDH10 exhibited mutual interaction (Figure 5C), with enrichment analysis identifying the interaction protein contained citrate synthase and aconitase A. Aconitase is known to regulate oxidative stress responses and cell death, playing a pivotal role in plant stress adaptation (Moeder et al., 2007). PtMDHs also strongly interacted with B9HIN6_POPTR, B9HLS7_POPTR, and B9I6M7_POPTR (Supplementary Table S5), which were annotated as succinyl-CoA synthetase-like enzymes involved in citrate metabolism (Figure 5C). Therefore, PtMDHs might be involved in the stress adaptation in Populus trichocarpa. Overall, these pathway-specific interactions highlight functional divergence between E. grandis and P. trichocarpa during evolution.
Furthermore, we performed protein-protein interaction analyses between EgMDHs and orthologous proteins from Populus trichocarpa as well as Arabidopsis thaliana (Supplementary Figures S5A–C). Comparative assessment revealed conserved interaction patterns between EgMDHs and AtMDHs in Arabidopsis, with both proteins predominantly associating with PPC1-PPC4 family members. Current genomic annotations confirm that PPC1-PPC3 encode phosphoenolpyruvate carboxylases (PEPCs) in Arabidopsis, all of which exhibit seed-specific expression profiles (Feria et al., 2022). Notably, PPC2 represents the dominant PEPC isoform in mature desiccated seeds, while PPC3 deficiency has been linked to disrupted seed nitrogen metabolism, including reduced nitrate assimilation and impaired amino acid/protein accumulation. These findings collectively imply that EgMDHs may play a regulatory role in maintaining carbon-nitrogen (C/N) metabolic homeostasis, thereby influencing seed development and nutrient partitioning.
3.6.1 Dynamic expression patterns of EgMDH genes across tissues
Transcriptomic analysis of Eucalyptus grandis revealed dynamic expression patterns of the 14 EgMDH genes across tissues (Figure 6A; Supplementary Table S6). EgMDH1 and EgMDH6 exhibited the highest expression in roots, with consistent trends observed in multiple tissues. EgMDH3 and EgMDH4 displayed similar expression profiles to EgMDH1 and EgMDH6 but with slightly reduced root expression and elevated levels in internodal tissues. In contrast, EgMDH5 and EgMDH7 were predominantly expressed in seedlings and leaves but showed minimal activity in internodes. Notably, all EgMDH genes except EgMDH13 were weakly expressed in stems. The remaining members (EgMDH2, EgMDH8, EgMDH9, EgMDH11, and EgMDH14) exhibited higher expression in internodal tissues compared to seedlings, roots, and stems. However, EgMDH9 and EgMDH14 displayed elevated leaf expression, while EgMDH11 was uniquely enriched in lateral branches. These findings highlight the highly tissue-specific expression of EgMDH family members, suggesting functional diversification in Eucalyptus grandis growth and development.
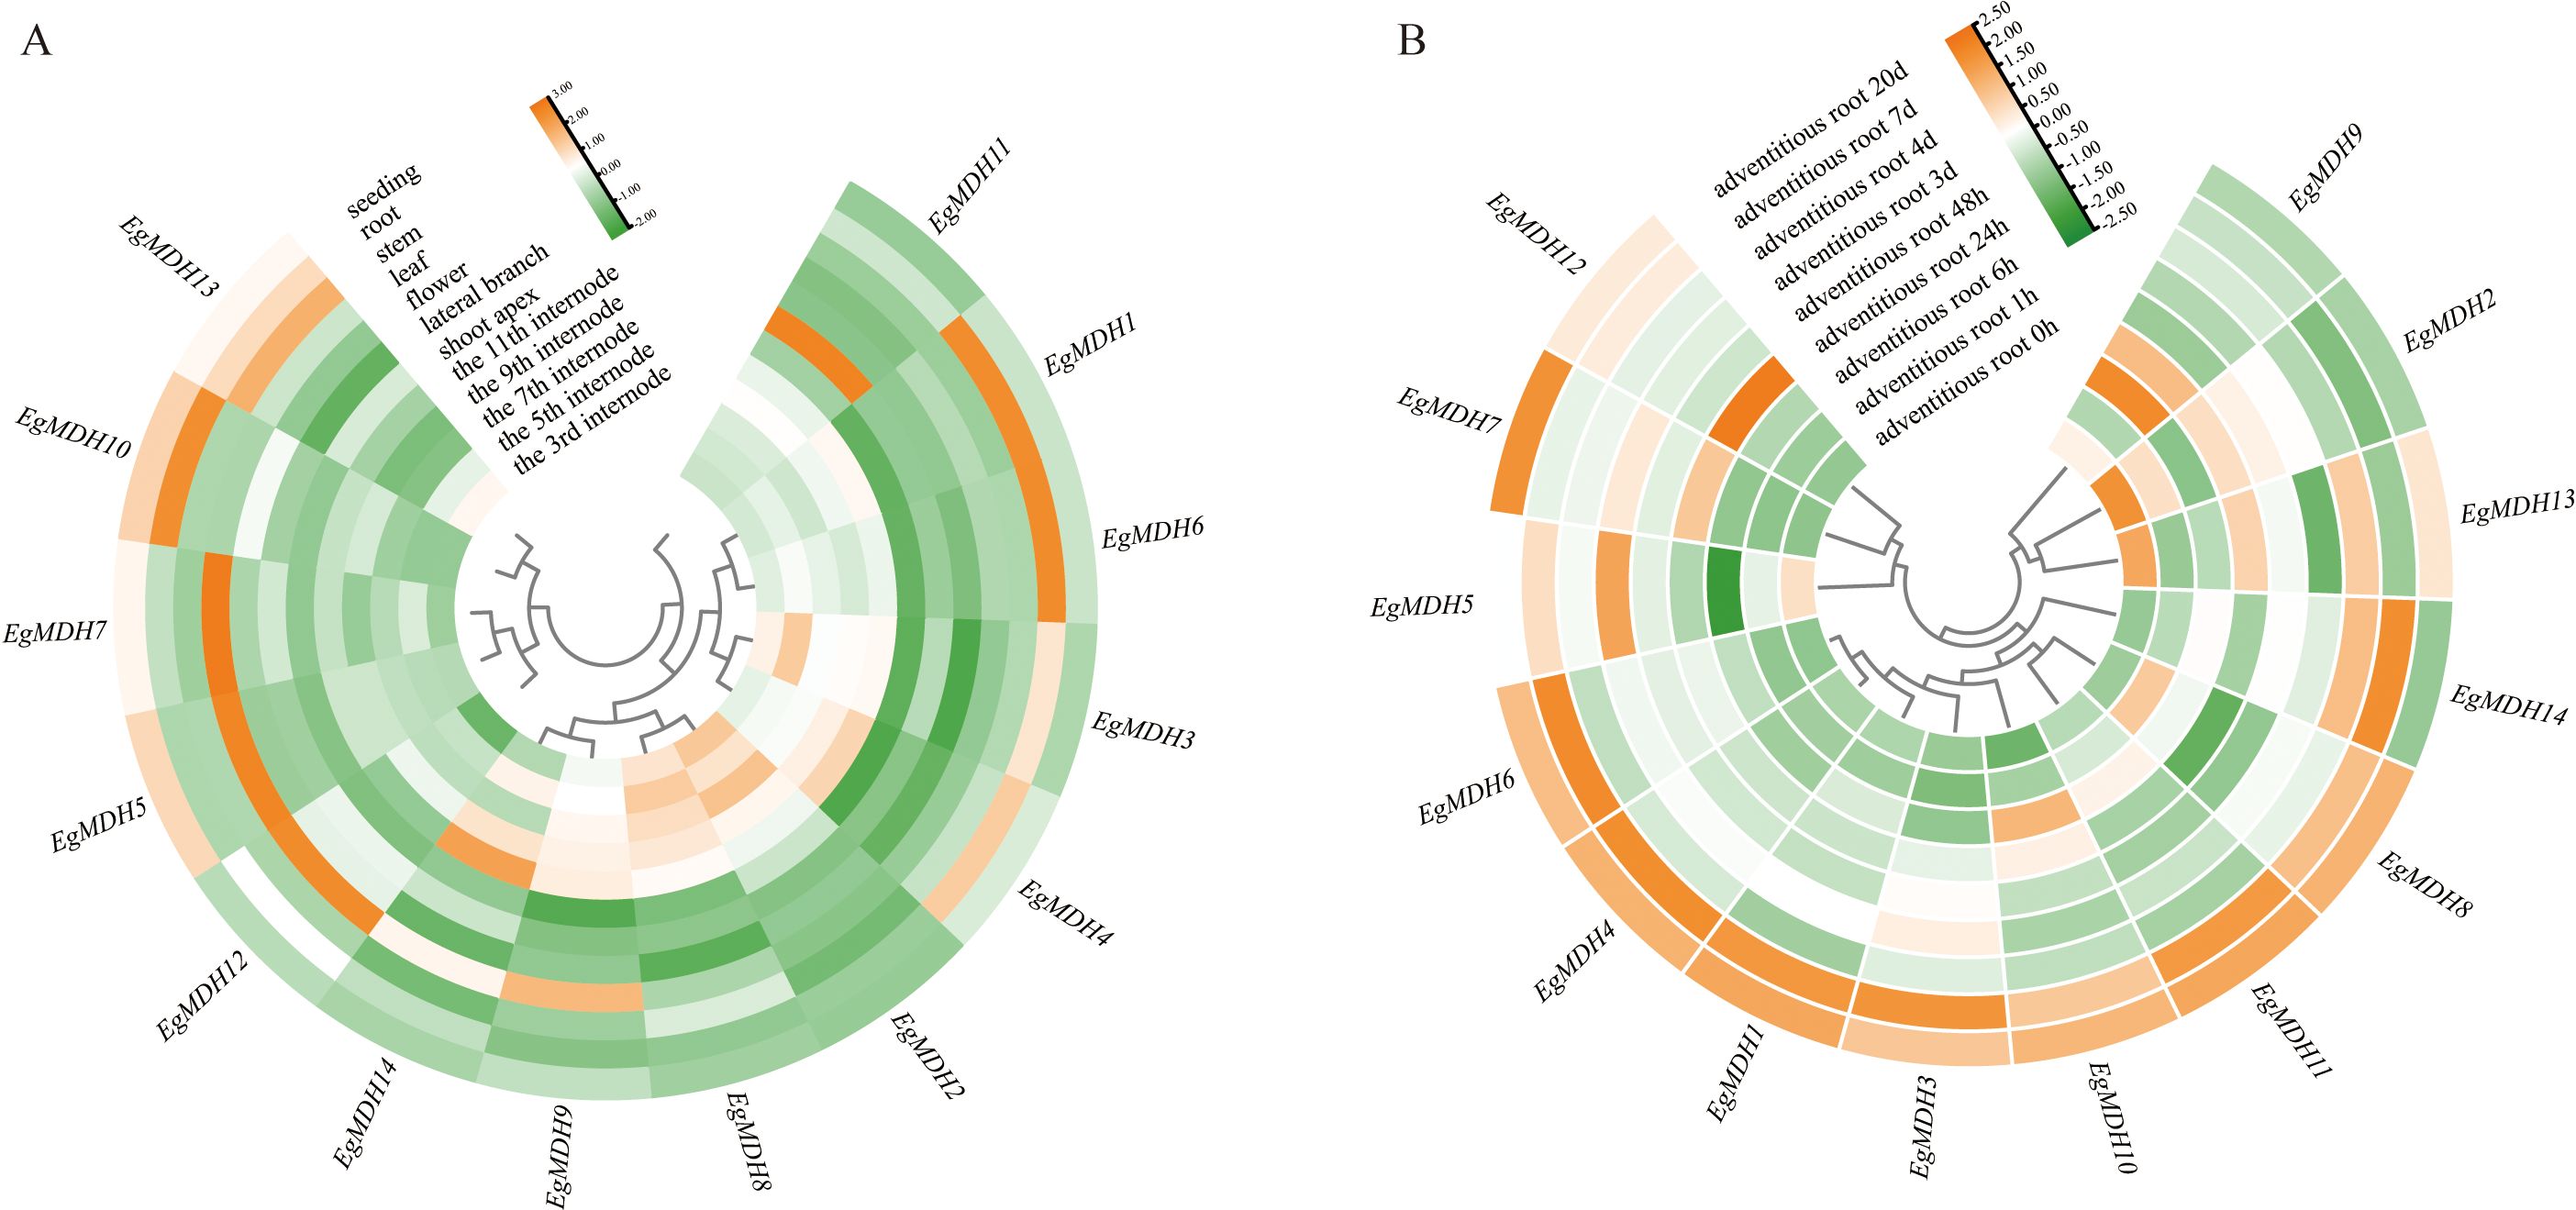
Figure 6. Dynamic expression patterns of EgMDH genes across tissues. (A) Expression profiles of EgMDHs across 12 distinct tissues. (B) Temporal expression patterns of EgMDHs during adventitious root induction at 8 developmental time points. After normalizing all samples using the DESeq2 package in R, the final gene expression matrix was obtained. The heatmap illustrates relative expression levels, with rows clustered based on expression patterns. Color intensity represents normalized expression values, where orange indicates higher expression levels and green indicates lower expression levels.
3.6.2 Expression dynamics of EgMDH genes during adventitious root formation
Efficient adventitious root formation is a pivotal determinant for scaling tissue culture propagation of Eucalyptus grandis in commercial forestry (Xu et al., 2025). To elucidate the role of EgMDH genes in AR formation, we analyzed their expression patterns at nine timepoints (0 h, 1 h, 6 h, 24 h, 48 h, 3 days, 4 days, 7 days, and 20 days) during AR induction (Figure 6B; Supplementary Table S7). Most EgMDH genes (EgMDH2, EgMDH5, EgMDH9, and EgMDH13 excluded) showed low basal expression in non-induced controls. Strikingly, EgMDH1, EgMDH3, EgMDH4, EgMDH6, EgMDH8, EgMDH10, and EgMDH11 were significantly upregulated during later AR stages (7 days and 20 days). EgMDH14 displayed a unique bimodal expression profile, peaking at 4 and 7 days before declining, distinct from other family members. Collectively, these dynamic and stage-specific expression patterns implicated that EgMDH genes might play critical roles for adventitious root development in Eucalyptus grandis.
3.6.3 Expression dynamics of EgMDH genes under JA and SA treatments
To understand the potential function of EgMDH on defense responses, the gene expression analysis of EgMDH were systematically analyzed using transcriptome data under jasmonic acid (JA) treatment at 1 h, 6 h, 24 h, and 7 days (Figure 7A; Supplementary Table S8). Clustering results demonstrated that EgMDH6, EgMDH7, EgMDH9, and EgMDH12 exhibited consistently high expression across all JA treatment time points, suggesting their stable and sustained regulatory roles in Eucalyptus grandis leaves under JA treatment. Conversely, EgMDH1 and EgMDH3 showed pronounced upregulation during early JA treatment (1–24 h), with marked downregulation by day 7. EgMDH11 and EgMDH12 displayed minimal responsiveness to JA at all time points (except weak EgMDH11 induction at 7 days), indicating their limited involvement in JA-mediated responses. Notably, EgMDH8 and EgMDH14 were highly expressed at 6 h post-JA treatment and in controls but showed reduced expression at other intervals, implying activity within a specific JA-responsive temporal window. Strikingly, EgMDH4, EgMDH5, and EgMDH13 exhibited weak responses to short-term JA exposure (1–24 h) but significant upregulation at 7 days, pointing to potential roles in long-term JA-induced physiological regulation. EgMDH10 displayed a unique expression profile, responding exclusively at 7 days post-JA treatment, which may reflect specialized functions during late JA treat. Collectively, these findings highlight the temporal specificity of EgMDH family members in responding to JA treatment.
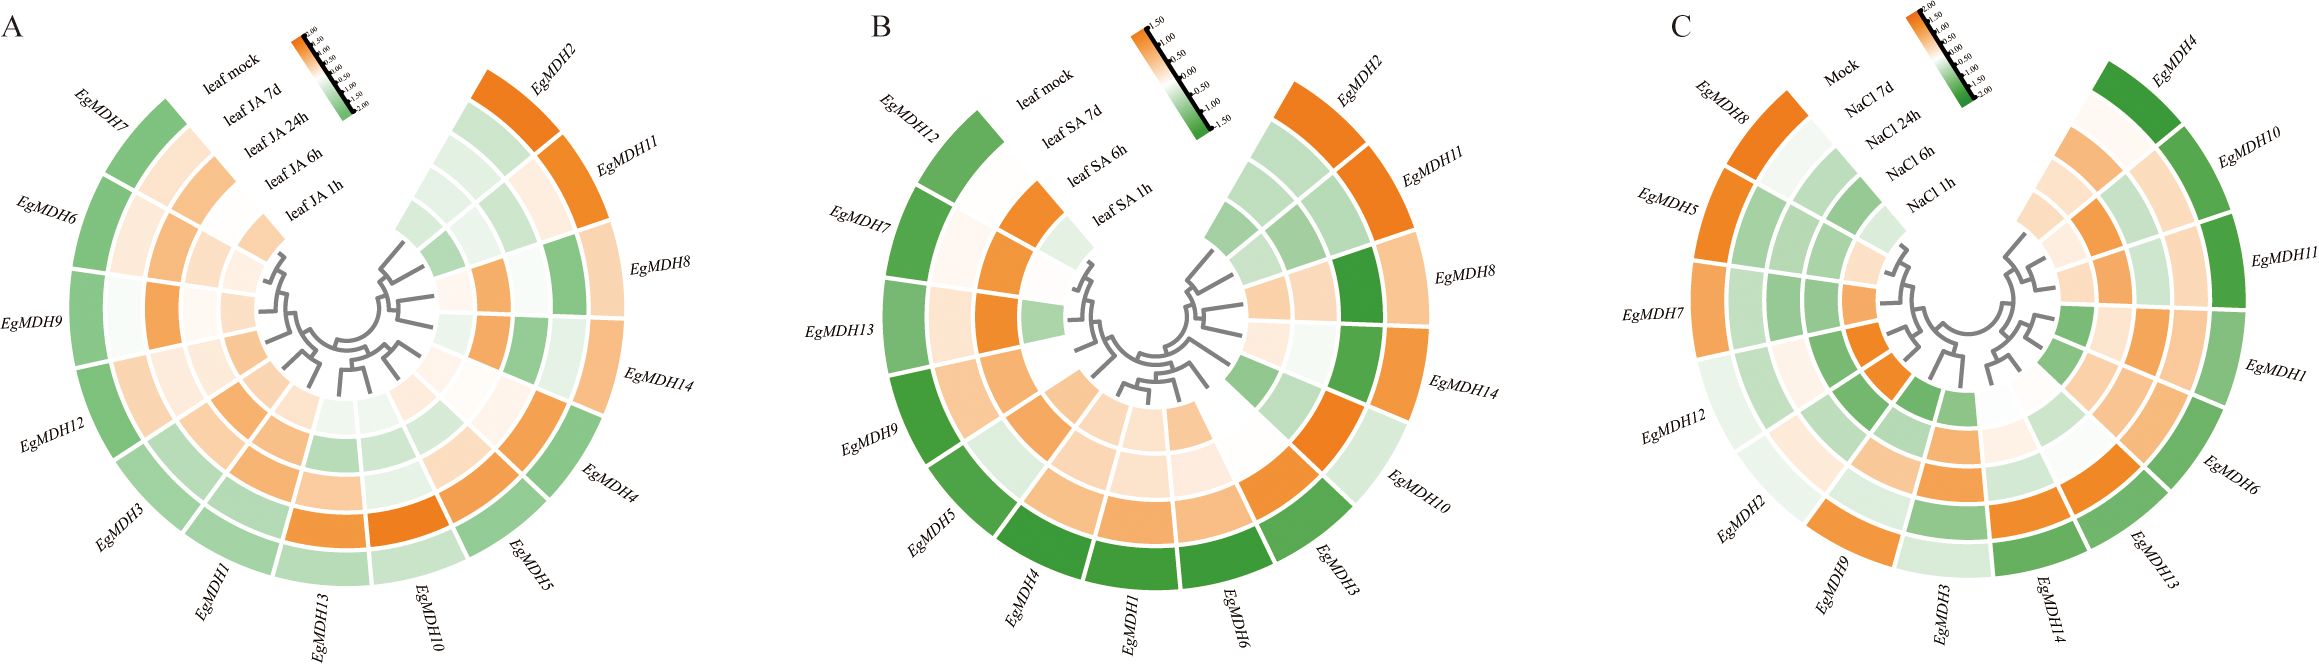
Figure 7. Expression dynamics of EgMDH genes under JA, SA, and salt treatments. The heatmap showed the changes of EgMDHs gene expression after 1 h, 6 h, 24 h and 7 d treatment with JA treatment (A) or SA treatment (B) or 200 mM NaCl treatment (C). R software DEseq2 was used to normalize all samples to obtain the final gene expression matrix. The heat map shows the relative gene expression levels, using a row clustering model. Color intensity represents normalized expression values, with orange indicating higher expression levels and green indicating lower expression levels.
Salicylic acid (SA), a key mediator of Eucalyptus grandis defense against Chrysoporthe austroafricana (Zwart et al., 2017), also modulated EgMDH expression in a time-dependent manner. Systematic analysis of EgMDH expression at 1 h, 6 h, and 7 days post-SA treatment (Figure 7B; Supplementary Table S8) identified seven distinct response patterns. EgMDH1, EgMDH4, and EgMDH6 were strongly induced at all SA treatment time points but remained minimally expressed in controls. Conversely, EgMDH3 and EgMDH10 were exclusively upregulated at 7 days, suggesting involvement in SA-driven long-term physiological adjustments. Early SA treatment (6 h) triggered high expression of EgMDH7 and EgMDH12, indicating their roles in initiation of defense responses. EgMDH9 and EgMDH13 showed dual-phase induction at 6 h and 7 days, indicating their roles in both mid- and long-term SA treatment. EgMDH5 responded robustly during early SA treatment (1–6 h), implicating it in initial SA responses. Intriguingly, EgMDH8 and EgMDH14 were suppressed at 7 days post-SA treatment but expressed highly in other treatment groups and controls. Furthermore, EgMDH2 and EgMDH11 were exclusively expressed in controls, implying SA-mediated repression. These results demonstrate that EgMDH family members exhibited highly time-specific responses to SA treatment.
3.6.4 Expression patterns of EgMDH genes under salt stress
Salt stress represents one of the most widespread abiotic stressors that significantly constrain plant growth and development (Xu et al., 2025). To elucidate the salt-responsive mechanisms of EgMDH genes, we analyzed their transcriptional profiles under salt stress conditions, comparing untreated controls (Mock) with plants exposed to 200 mM NaCl for 1 h, 6 h, 24 h, and 7 days (Figure 7C; Supplementary Table S9). Although most EgMDHs exhibited low basal expression in control conditions, EgMDH5, EgMDH7, EgMDH8, and EgMDH9 showed constitutively high expression levels in untreated plants. Notably, EgMDH2 and EgMDH12 demonstrated rapid induction during short-term salt exposure (1 h), but their responsiveness diminished in prolonged treatments (24 h and 7 days). Conversely, EgMDH1 and EgMDH6 were specifically up-regulated during medium- and long-term stress (6 h to 7 days). Two members, EgMDH13 and EgMDH14, displayed pronounced activation only under sustained salt stress (7 days), suggesting their potential role in late-phase salt stress adaptation. Intriguingly, EgMDH10 and EgMDH11 exhibited biphasic induction patterns, responding strongly to both initial (1–6 h) and extended (7 days) stress exposure, indicative of their dynamic regulatory roles in salt stress responses. These findings collectively demonstrated that EgMDH family members display temporally distinct expression profiles under salt stress, with specific isoforms potentially contributing to early stress responses (EgMDH2/12), intermediate adaptation (EgMDH1/6), and long-term tolerance mechanisms (EgMDH13/14). The observed temporal specificity suggested coordinated functional diversification within this gene family to support salt stress adaptation in Eucalyptus grandis.
3.6.5 Gene expression patterns of EgMDH genes under cold stress
Cold tolerance is a critical environmental constraint limiting large-scale cultivation and productivity of many Eucalyptus species (Liu et al., 2025). To investigate the potential involvement of EgMDH genes in cold stress regulation, we analyzed the transcriptional responses of EgMDH family members in E. grandis seedlings under cold stress. RT-qPCR was performed to quantify EgMDH expression levels in leaves of seedlings exposed to 4°C (cold stress) or 25°C (control) over a 24-hour period (Figure 8; Supplementary Table S10). Eleven EgMDH genes (EgMDH1, EgMDH2, EgMDH3, EgMDH5, EgMDH6, EgMDH7, EgMDH8, EgMDH9, EgMDH10, EgMDH11, EgMDH12, and EgMDH13) exhibited statistically significant differential expression (P < 0.05) under cold stress conditions (Figures 8A-C, E, F-M). Notably, EgMDH10 displayed a distinct transcriptional response, with a significant increase in mRNA accumulation levels (P < 0.05) during cold exposure (Figure 8J). These findings collectively suggested that the majority of EgMDH genes were transcriptionally responsive to cold stress in Eucalyptus grandis.
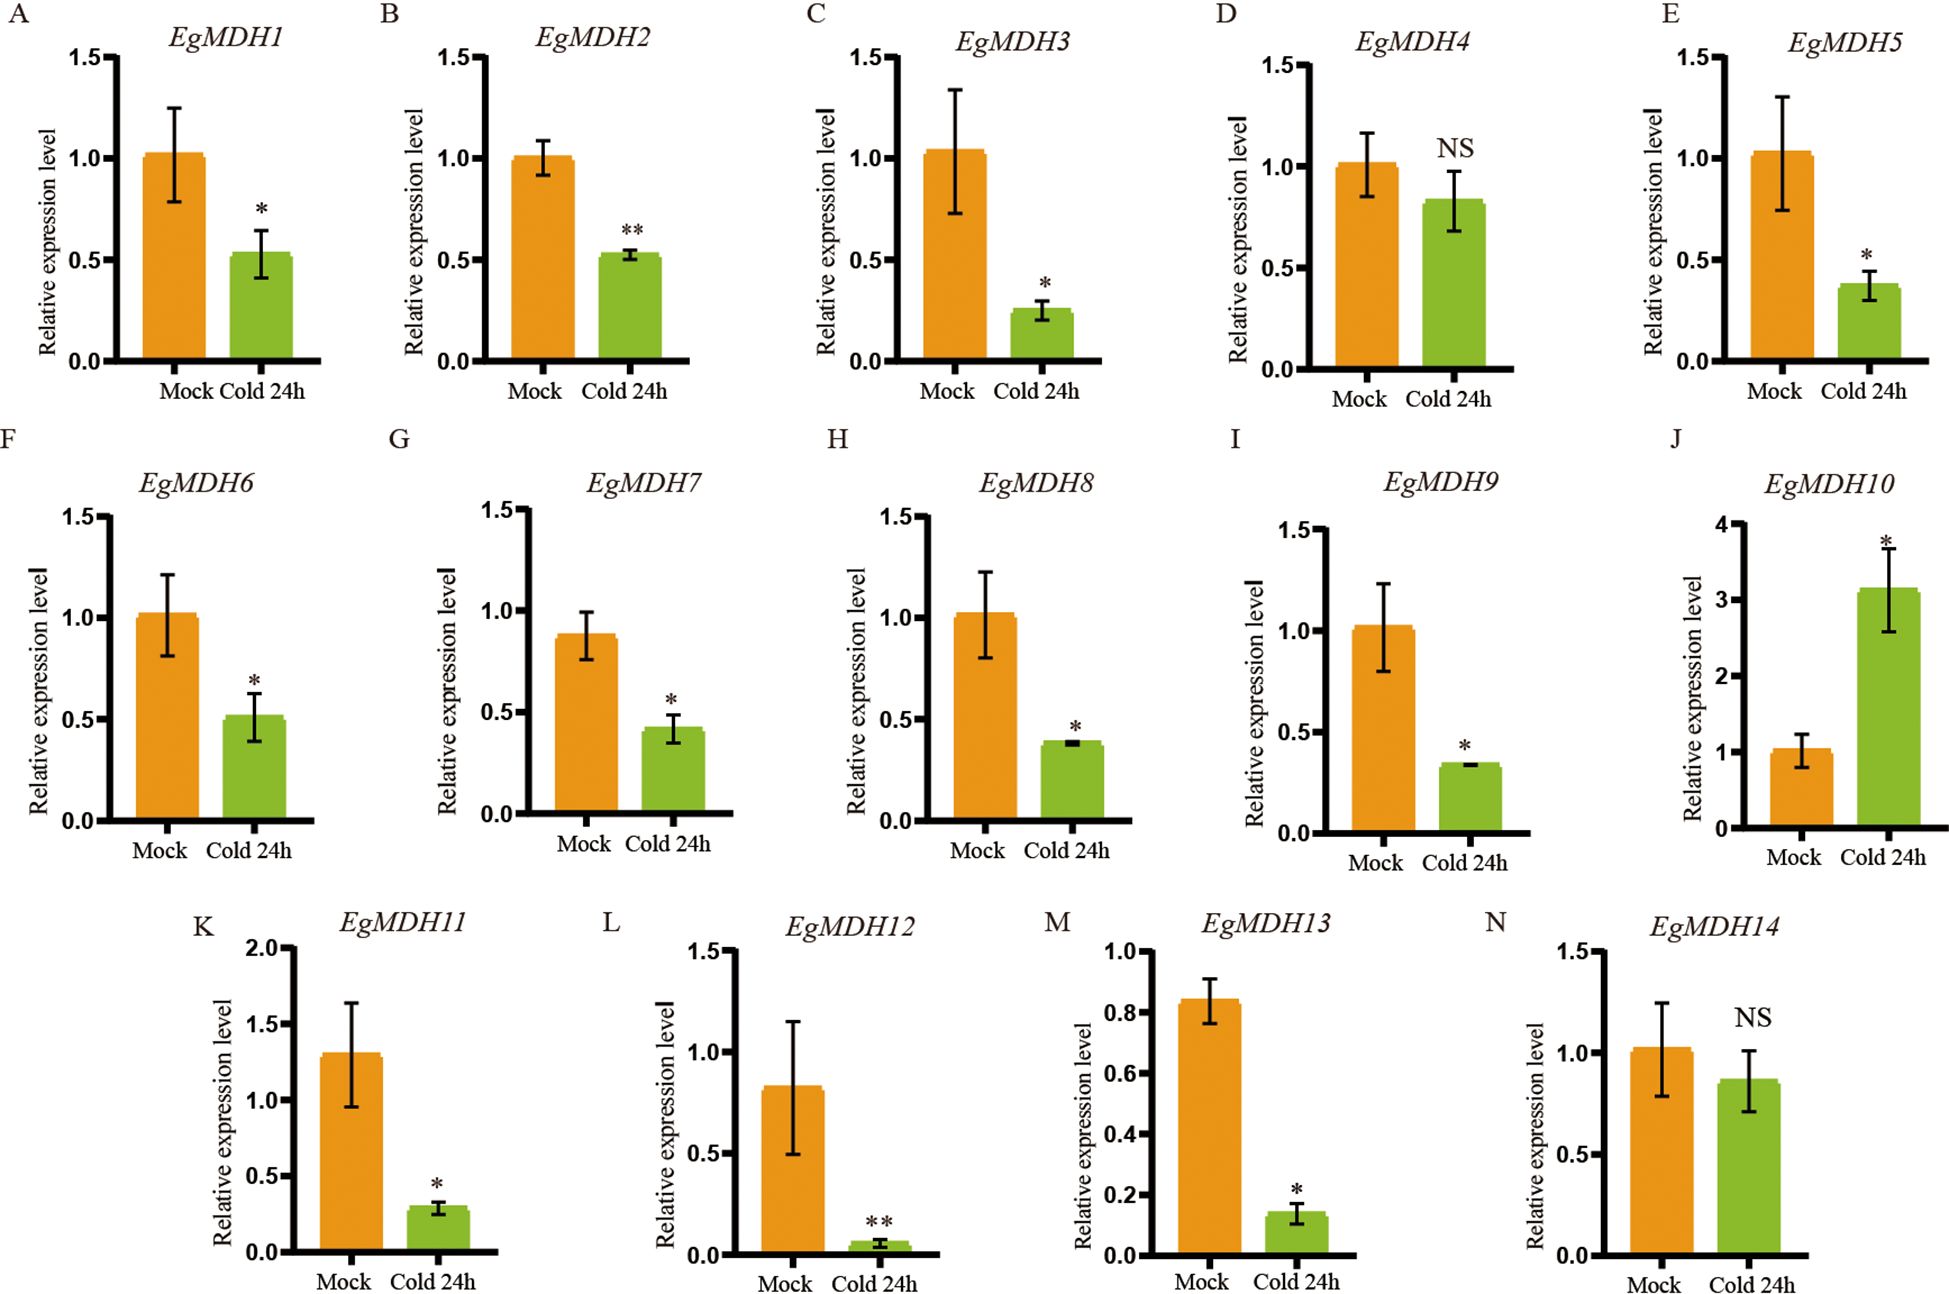
Figure 8. Gene expression patterns of EgMDH genes under cold stress. (A–N) Expression levels of EgMDHs in leaves under control (25°C) and cold stress (4°C) treatments for 24 h. Statistical significance was determined using the t-test: “ NS “ represented no significance, “ * “ represented P < 0.05, “ ** “ represented P < 0.01.
3.6.6 Gene expression patterns of EgMDH genes under phosphate starvation
Phosphorus is the second most limiting factor for plant growth and development, particularly in acidic soils within forest ecosystems (Fang et al., 2024). To investigate the potential role of the EgMDH genes in response to low-phosphate (LP) starvation, we analyzed the expression patterns of its members at distinct time points (6 h, 12 h, 24 h, and 3 days) under LP conditions (0.005 mM KH2PO4) using RT-qPCR, with sufficient phosphate (0.5 mM KH2PO4) treatment as the control (Figure 9). RT-qPCR results revealed that mRNA accumulation of EgMDH1 and EgMDH9 was significantly reduced (P < 0.001) after 3 days of phosphate starvation (Figures 9A, B), whereas EgMDH3 and EgMDH6 exhibited significant upregulation (P < 0.05 and P < 0.001, respectively) under the same conditions (Figures 9C, D). The results suggested these four genes might participate in adaptive regulation during prolonged phosphate starvation. Notably, EgMDH5, EgMDH7, EgMDH8, and EgMDH10 responded acutely to early phosphate starvation (6 h or 12 h) (Figures 9E–H). Transcript levels of EgMDH5 and EgMDH7 increased significantly (P < 0.05) at 6 h (Figures 9E, F), while EgMDH8 showed marked upregulation (P < 0.001) at 6 h, and EgMDH10 expression peaked at 12 h (P < 0.05). These findings implied potential roles for these genes in early phosphate starvation. Intriguingly, EgMDH13 expression was consistently suppressed across all time points (P < 0.001; Figure 9I), indicating negative regulation by phosphate starvation. Overall, these results demonstrated diverse regulatory responses and temporally distinct expression patterns among EgMDH family members under phosphate starvation.
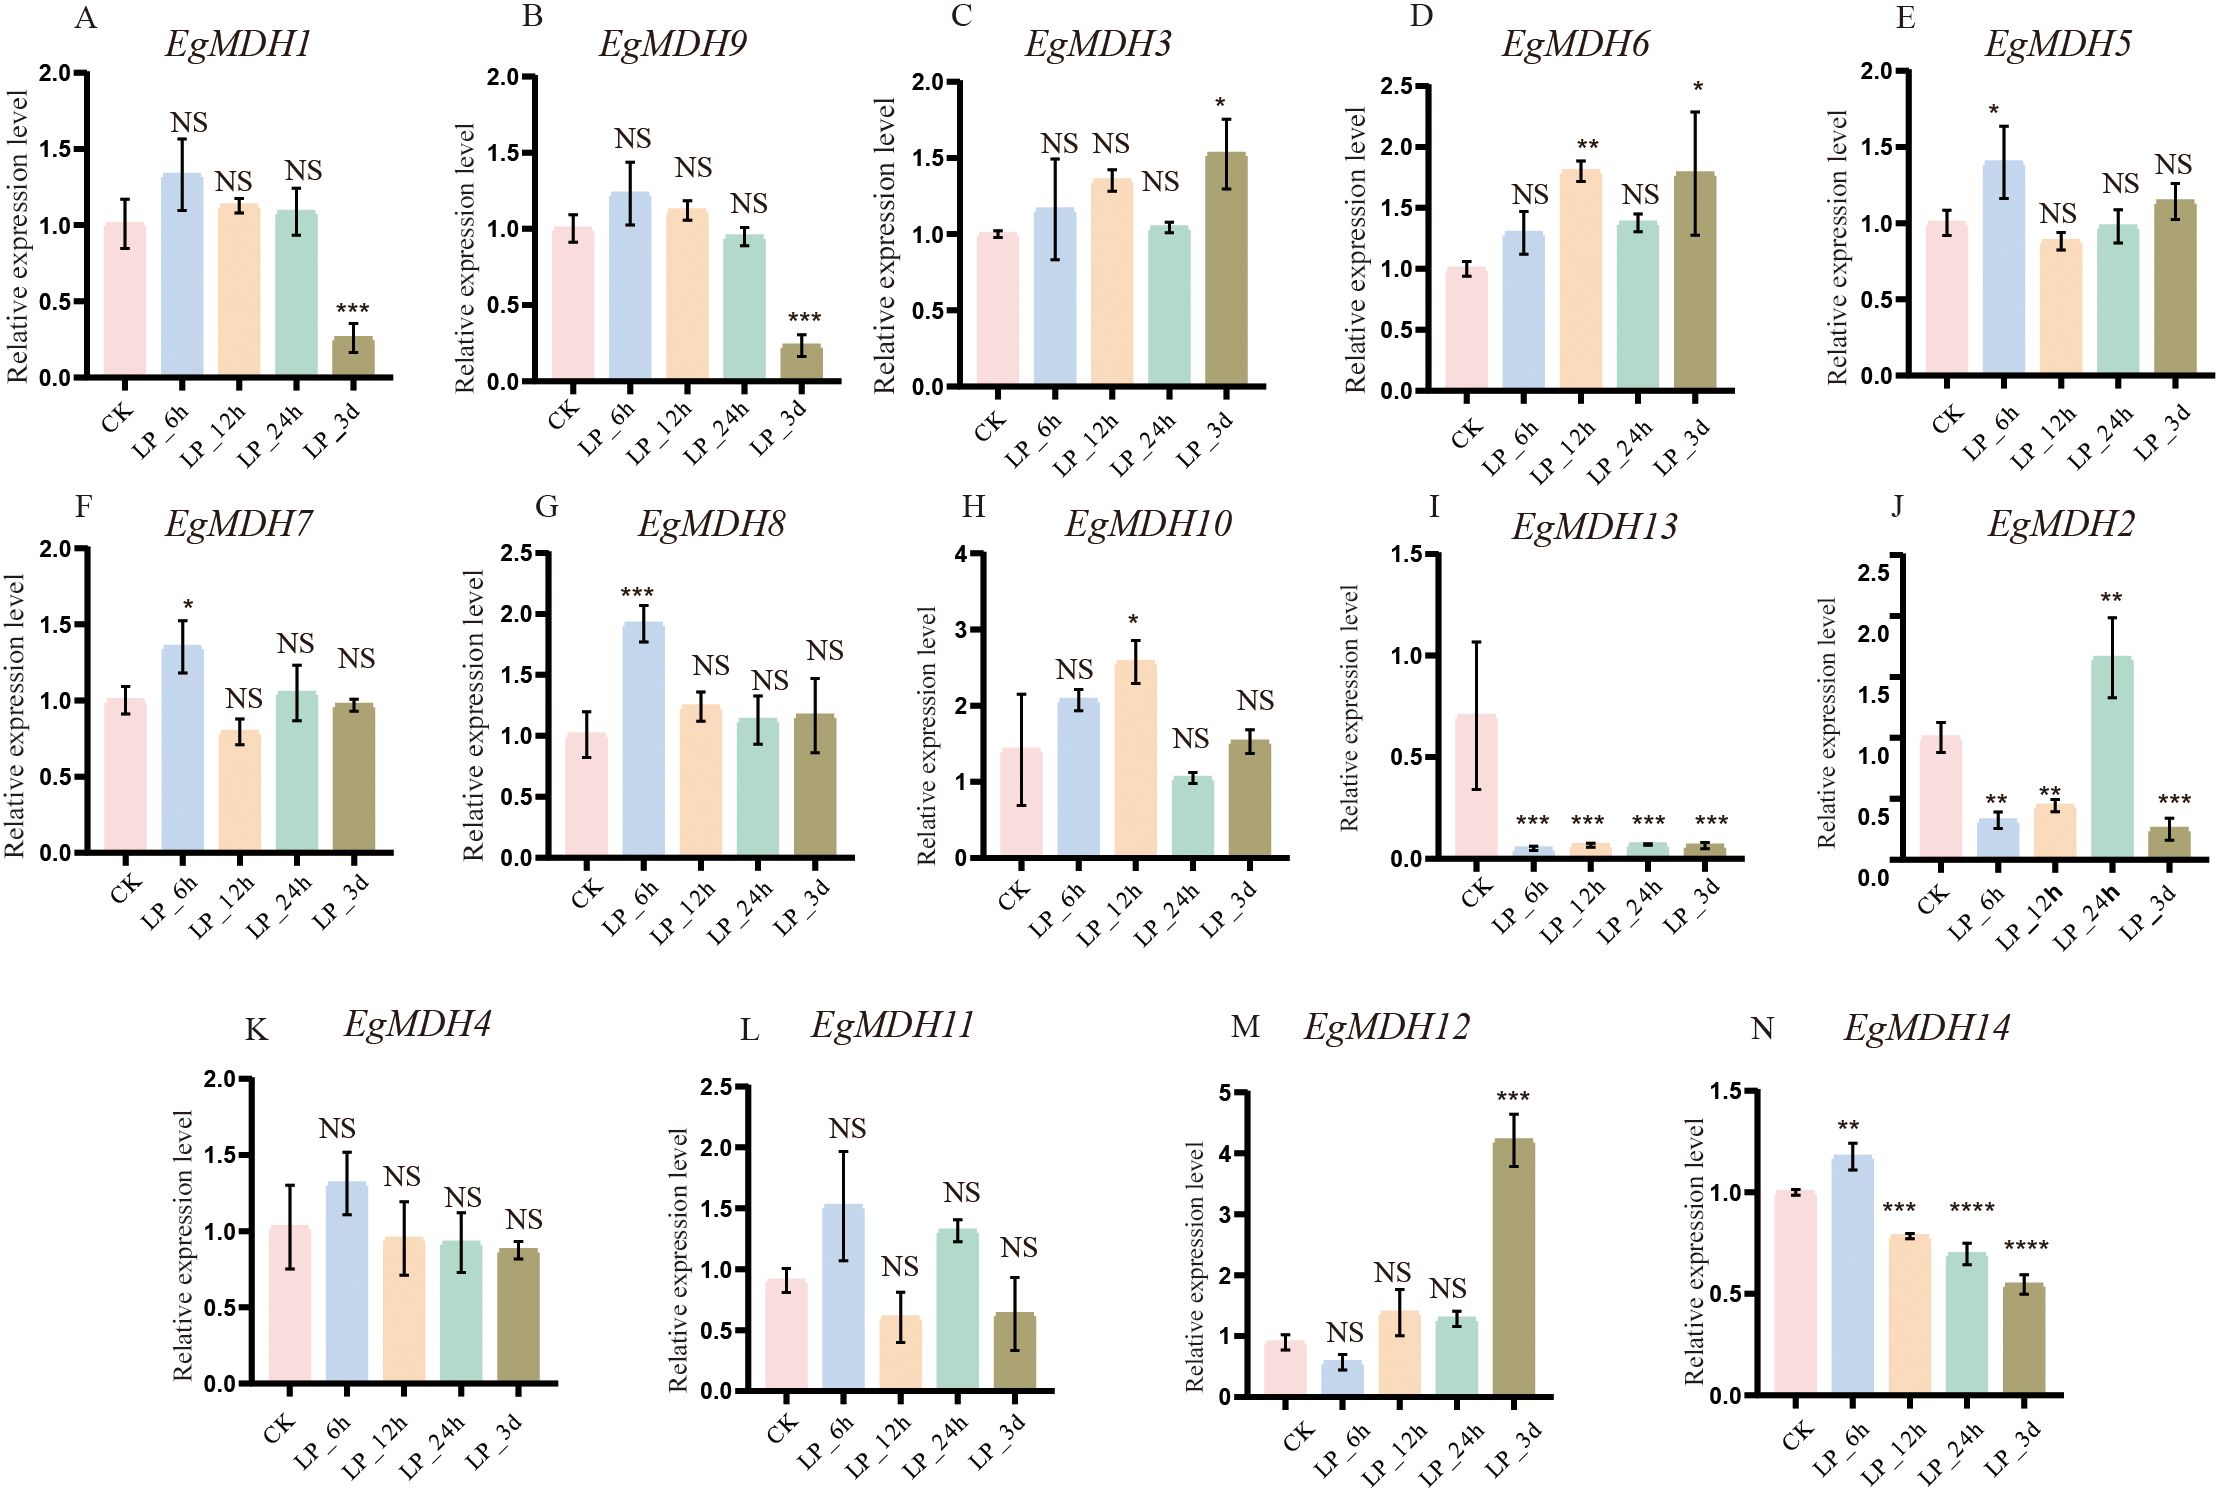
Figure 9. Gene expression patterns of EgMDH genes under phosphate starvation. (A-N) depicted the expression of EgMDHs in the root system under phosphate deficiency treatments of CK, 6 h, 12 h, 24 h, and 3 d. Two-way ANOVA test: “ NS “ represented no significance, “ * “ represented P < 0.05, “ ** “ represented P < 0.01, “ *** “ represented P < 0.001, “ **** “ represented P < 0.0001.
3.6.7 Gene expression dynamics of EgMDH genes under nitrogen starvation
Nitrogen (N) is a macronutrient essential for plant growth and development, primarily absorbed by plants in the forms of nitrate (NO3-) and ammonium (NH4+) (Lin et al., 2021). Notably, nitrate also acts as a signaling molecule that interacts with phosphate starvation signaling pathways to fine-tune the balanced growth of plants (Fang et al., 2024). To investigate the potential involvement of EgMDH genes in nitrogen starvation responses, this study analyzed their expression patterns at two time points (2 h and 24 h) under nitrogen starvation conditions (0 mM KNO3) using RT-qPCR, with sufficient nitrogen supply (10 mM KNO3) as the control. The results revealed significant expression changes (P < 0.05) in nine EgMDH genes (EgMDH2, EgMDH3, EgMDH4, EgMDH6, EgMDH7, EgMDH8, EgMDH10, EgMDH11, EgMDH12, and EgMDH14) under nitrogen starvation. Among these, EgMDH2, EgMDH3, EgMDH6, and EgMDH10 exhibited dramatically upregulation (P < 0.001, P < 0.05, P < 0.001, and P < 0.01, respectively) at 24 h of nitrogen starvation (Figures 10B, C, F, J), suggesting their potential roles in long-term adaptation to nitrogen starvation. Conversely, EgMDH7 and EgMDH8 displayed rapid induction (P < 0.05 and P < 0.01, respectively) at 2 h of nitrogen starvation (Figures 10G, H), indicating their involvement in early nitrogen starvation response. Notably, EgMDH4 expression was significantly suppressed (P < 0.05) at both 2 h and 24 h under nitrogen starvation, while EgMDH11 and EgMDH12 showed reduced expression (P < 0.05) at 2 h. Similarly, EgMDH14 exhibited a significant decrease in mRNA accumulation (P < 0.01) at 24 h (Figure 10N), implying negative regulation of these genes by nitrogen starvation. These findings provided preliminary insights into the potential roles of EgMDH genes in mediating nitrogen starvation responses in Eucalyptus grandis.
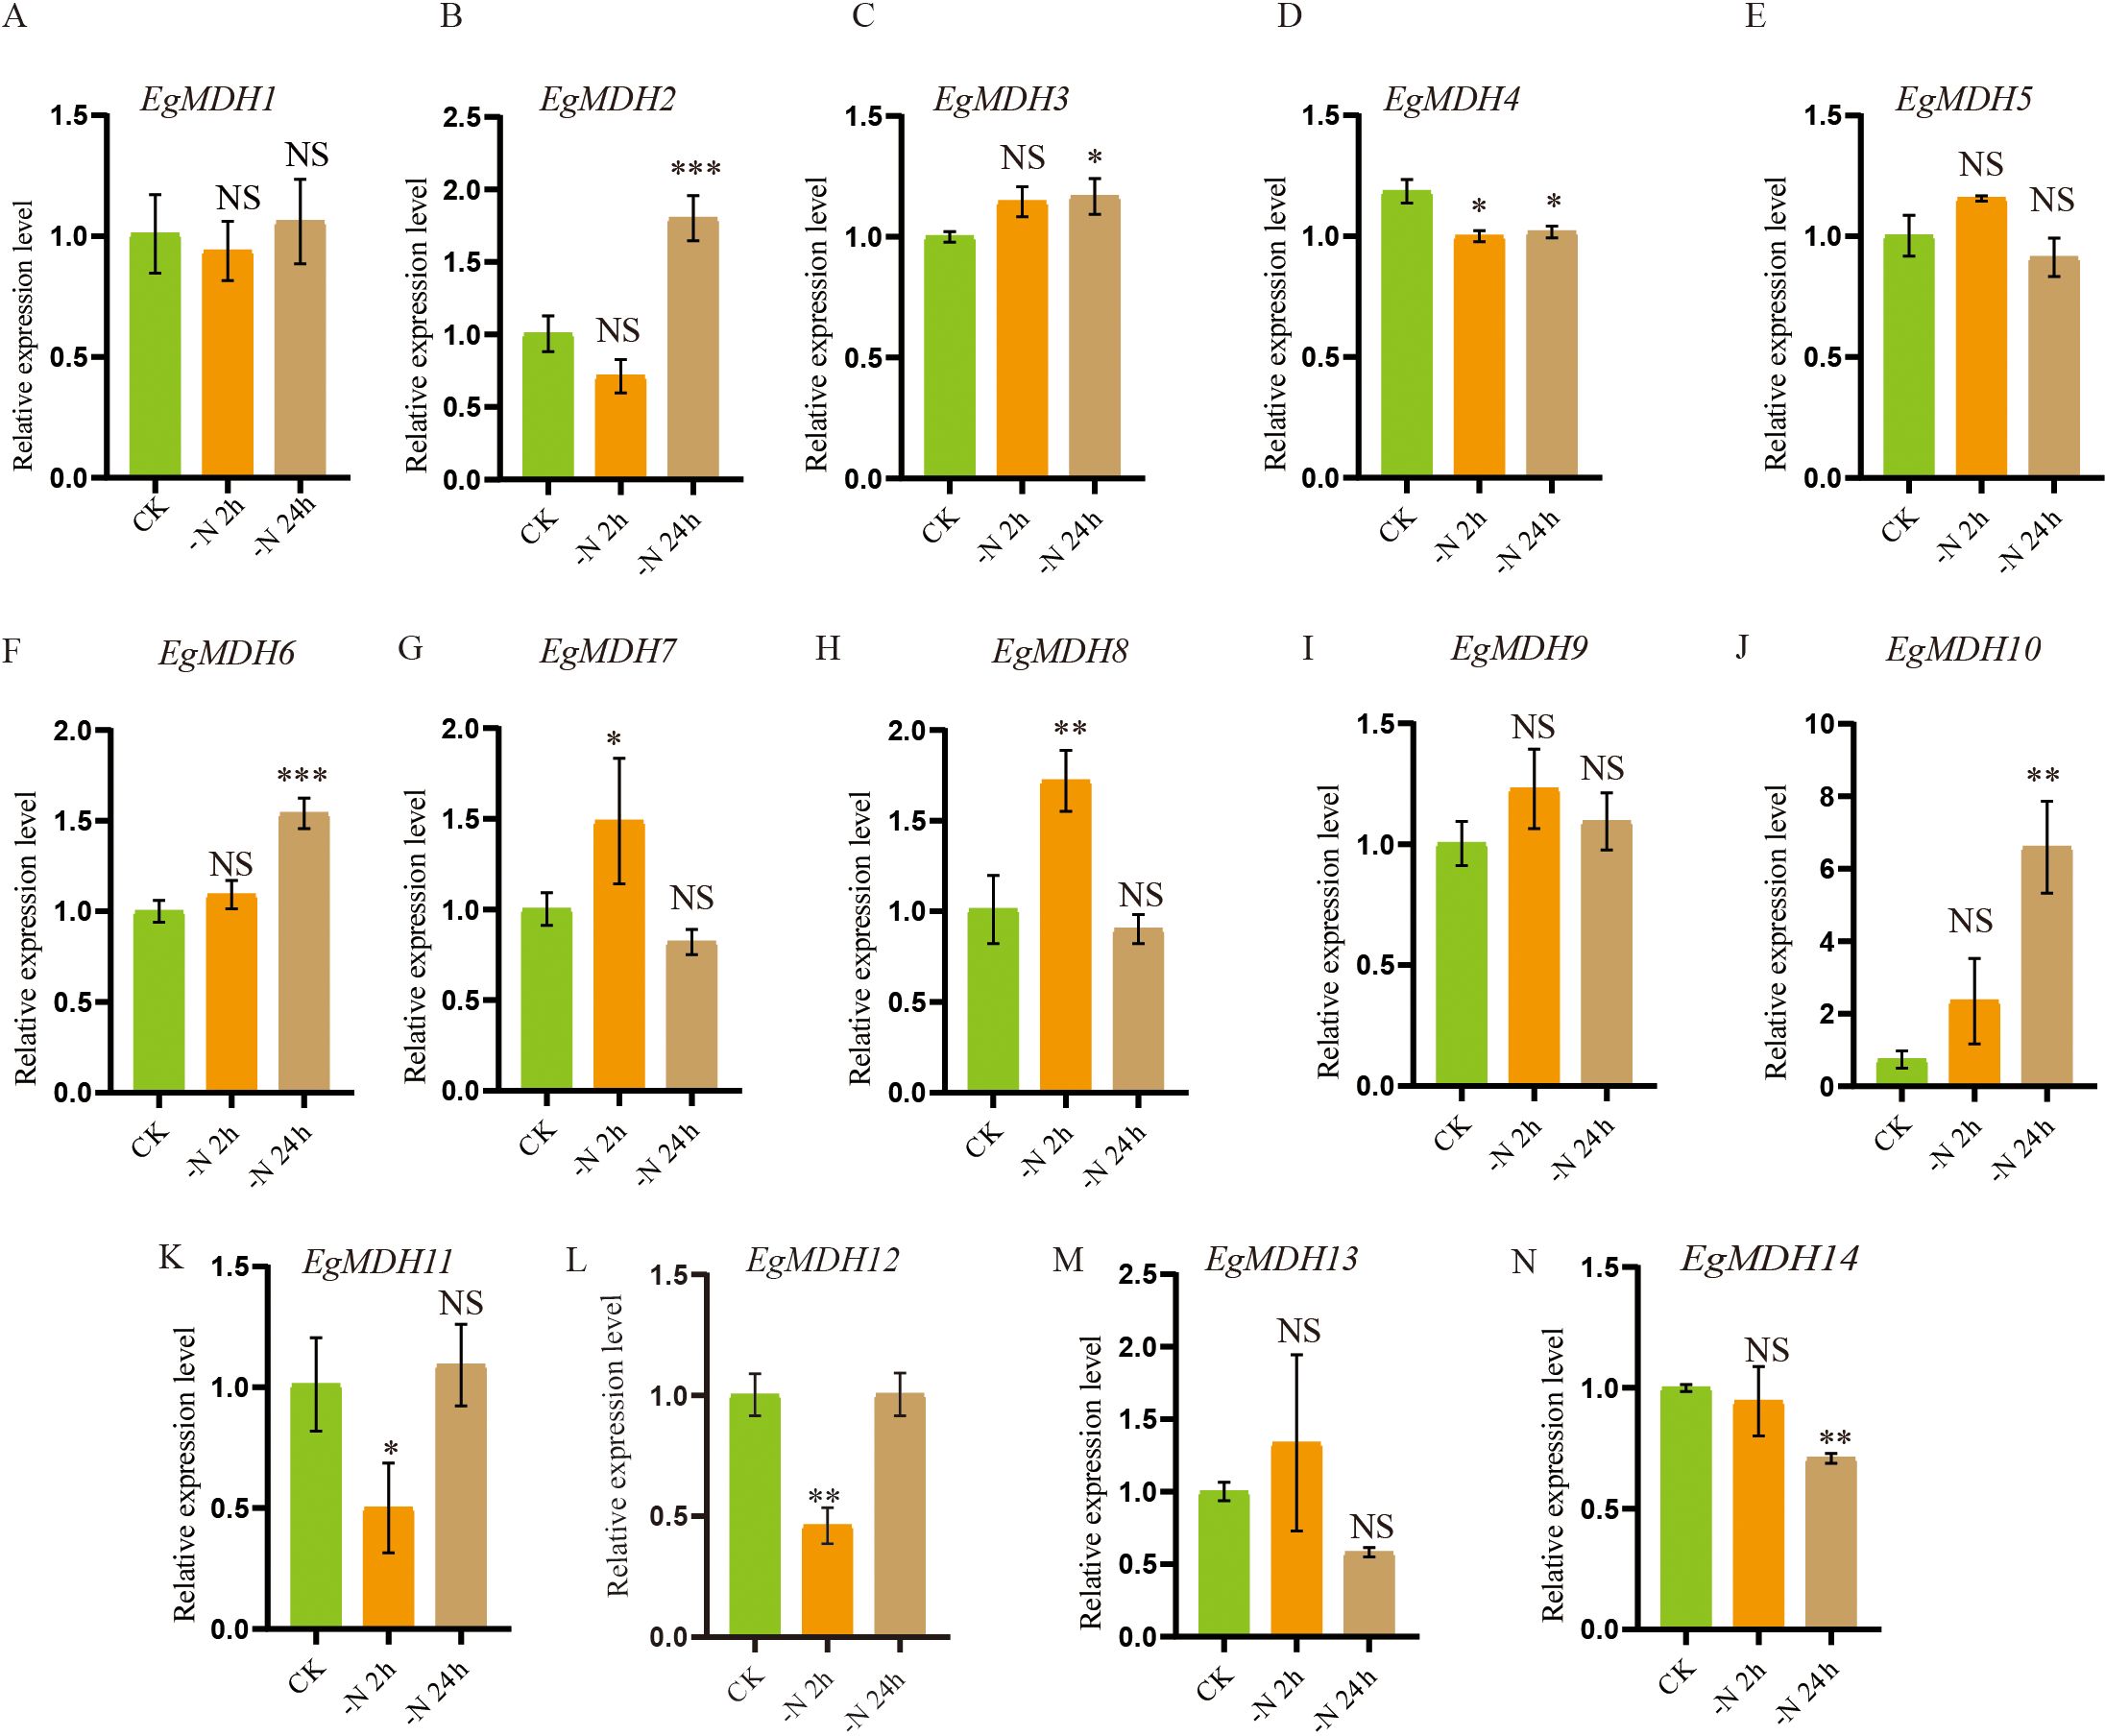
Figure 10. Gene expression dynamics of EgMDH genes under nitrogen starvation. (A-N) describes the relative expression levels of 14 EgMDHs in nitrogen starvation conditions in CK, 6 h, 12 h, 24 h and 3 d in root. Two-way ANOVA test: “ NS “ represented no significance, “ * “ represented P < 0.05, “ ** “ represented P < 0.01, “ *** “ represented P < 0.001.
3.6.8 Gene expression dynamics of EgMDH genes under Boron deficiency
Boron (B) deficiency inhibits shoot apex growth while enhancing top dieback and leaf chlorosis in woody plants (Luo et al., 2019). To investigate the potential roles of EgMDH genes in boron (B) deficiency responses, this study systematically analyzed the expression patterns of 14 EgMDH genes under B-deficient conditions at sequential time points (Supplementary Table S11). The experimental design included two tissue types with distinct observation windows: leaves (control, 6 h, 24 h, 2 day, 4 day, and 21 day) and roots (control, 6 h, 24 h, 2 day, 4 day, and 21 day). Distinct tissue-specific responses were observed between root and leaf tissues. Root tissues exhibited substantially greater B-deficiency-induced gene activation compared to leaves (Figure 11), with 11 responsive genes displaying seven distinct expression patterns. EgMDH14 showed peak expression at 4 day, maintaining elevated levels from 24 h through 4 day. EgMDH7 and EgMDH10 demonstrated coordinated upregulation during prolonged stress (24 h-21 day), contrasting with their low expression at 2 day and in controls. EgMDH1 and EgMDH11 exhibited U-shaped expression profiles with suppression at both early (6 h) and late (21 day) stages. EgMDH12 displayed acute induction specifically at 24 h and 2 day. Notably, EgMDH13 showed upregulation in both control and 2 day-treated groups. Control-dominant expression patterns emerged for EgMDH8 and EgMDH6, though EgMDH8 showed transient induction at 24 h-2 day and secondary activation at 21 day, while EgMDH6 exhibited early-stage responsiveness. Conversely, leaf tissues showed limited responsiveness, with only EgMDH2, EgMDH5, and EgMDH9 expression were significant induction under B deficiency. These three genes exhibited synchronized expression trajectories except for EgMDH2’s delayed response at 6 h. All leaf-responsive genes displayed progressive induction from 6 h to 4 day followed by 21 day suppression. Overall, the EgMDH gene family exhibited hierarchical responsiveness to B-deficiency, with root tissues showing greater transcriptional plasticity than leaves (Figure 11). Therefore, these multi-phase transcriptional reprogramming highlights the dynamic nature of Eucalyptus grandis adaptation to B deficiency.
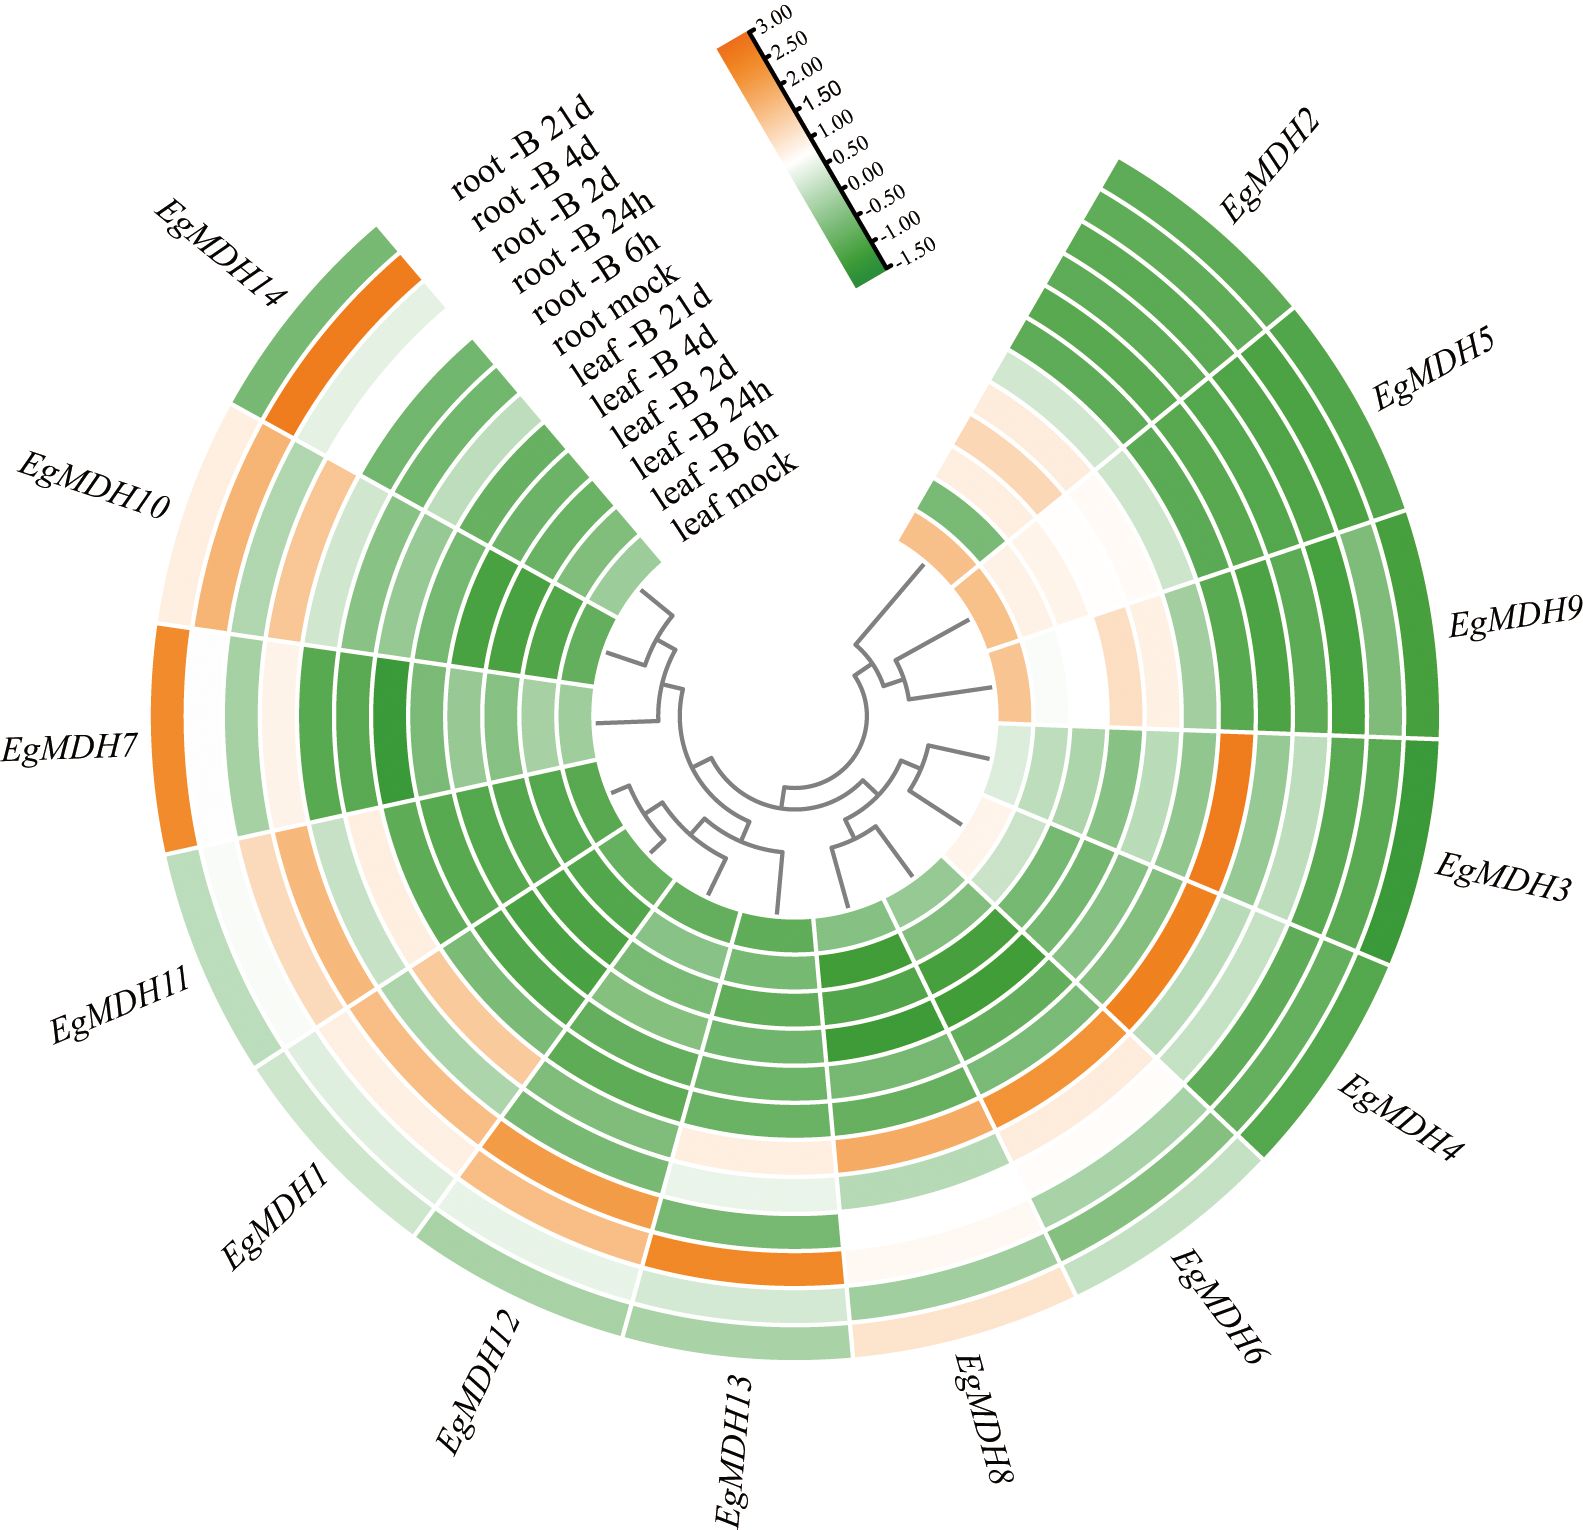
Figure 11. Gene expression dynamics of EgMDH genes under Boron deficiency. Normalized all samples using R soft-ware DEseq2 to obtain the final gene expression matrix. Heatmaps were plotted using R’s pheatmap and ggplot2 packages. Clustering by rows, orange represented high expression and green represented low expression.
4 Discussion
Malate dehydrogenase (MDH) serves as a pivotal oxidoreductase that reversibly catalyzes the malate-oxaloacetate conversion, underpinning cellular energy metabolism, carbon balance, and stress adaptation across diverse plant species (Yudina, 2012; Li et al., 2023; Gao et al., 2024). Eucalyptus spp, dominate global forestry plantations due to their rapid growth (up to 10 m/year), superior timber quality, and extensive cultivation, which is accounting for > 20% of the world’s forest plantations and over one-third of commercial timber production in China (Xu et al., 2025). Studying MDH in Eucalyptus grandis may reveal its involvement in phosphorus stress adaptation, as malate secretion could facilitate soil phosphorus availability.
Phylogenetic analysis of MDH across 29 plant species revealed gene family expansion during the transition from aquatic algae to early terrestrial plants (Figure 1A; Supplementary Table S2), likely associated with environmental stress adaptation. Plant-environment interactions fundamentally shape genome evolution (Kapoor et al., 2023), with genomic divergence prompting species-specific adaptive strategies (He et al., 2024). The MDH gene family showed dynamic changes: from a mean of 5 genes in algae to > 3× expansion in early land plants, while maintaining stable copy numbers in ferns, gymnosperms, and angiosperms (Supplementary Table S2). Exceptions like Amborella trichopoda (7 MDHs) and Psidium guajava (9 MDHs) suggest evolutionary possible equilibrium during terrestrial adaptation. Notably, genome sizes ranged from 9.88 Mb (green algae) to 9.78 Gb (Cunninghamia lanceolata), warranting further exploration of genome-adaptability relationships.
The three closest paralog pairs (EgMDH1/3, EgMDH6/9, and EgMDH10/11) shared conserved gene structures and motifs (Figures 1B, 2A-C). EgMDH1/3 and EgMDH6/9 showed transcriptional suppression under cold stress (Figures 8A, C, F, I), whereas EgMDH6/9 displayed parallel induction by JA (Figure 7A). Concurrently, EgMDH10/11 upregulated dynamically under salt stress (Figure 7C). These results demonstrate multidimensional conservation in genomic organization, motif composition, and stress-responsive synchronization, highlighting evolutionary constraints within Eucalyptus grandis. Comparative analysis revealed differential enrichment between Populus trichocarpa and E. grandis. Only two Arabidopsis thaliana MDHs (AT1G53240/mMDH1, AT3G15020/mMDH2) clustered with E. grandis Group II (Figure 1B). These mitochondrial MDHs are critical for carbon/energy allocation in Arabidopsis leaves (Tomaz et al., 2010), suggesting the putative roles of Group II EgMDHs in carbon/energy allocation. Interestingly, Group III contained exclusively Oryza sativa and P. trichocarpa MDHs (OsMDH5.1, OsMDH1.2), which mediate salt responses (Zhang et al., 2022). Although E. grandis lacks Group III homologs, salt-induced EgMDH expression (Figure 7C) may suggest convergent evolution of stress adaptation (Jarvis et al., 2014).
EgMDH3 uniquely harbored GT-2 and NLP6 transcription factor (TF) binding sites in its promoter (Figure 4A; Supplementary Table S4). GT-2 regulates development and abiotic stress responses (Feng et al., 2019)., consistent with significant EgMDH3 upregulation under N/P deficiency and salt stress (Figures 7C, 9C, 10C). NLP6 is a nitrate-responsive TF (Sato et al., 2017), and NLP6 might also have potential to contribute to EgMDH3 induction under N deficiency. Other nutrient-responsive genes (EgMDH2/6/7) might be regulated by growth-related TFs (Figures 9D, F, J, 10B, F, G). Only EgMDH13 expression significantly decreased under phosphate starvation (Figure 9I), potentially linked to its unique architecture: a 70-kb intron separating CDS regions and absence of Motif 2 (Figures 2B, C). Under N deficiency, EgMDH2/3/6/7/8/10 were induced, while EgMDH4/11/14 were suppressed (Figure 10). Although MDH activity affects nitrogen assimilation during arsenic stress in wheat (Gupta et al., 2023), the direct role of MDH on nitrogen deficiency mechanisms requires further validation.
This study explores how MDH family expansion, lineage-specific networks, and stress-responsive dynamics may contribute to metabolic diversity in Eucalyptus grandis. These insights enhance understanding of woody plant evolution and suggest potential molecular targets for breeding stress-resilient trees.
5 Conclusion
The compartmentalized distribution of malate dehydrogenase (MDH) and the presence of multiple isozymes underpin its functional diversity. In this study, we conducted a comprehensive characterization of the 14-member MDH gene family in Eucalyptus grandis, revealing the key roles of MDH isoforms with three distinct subcellular localizations in stress responses, metabolic adaptation, and evolutionary diversification. Phylogenetic, structural, and expression analyses identified evolutionarily specific expansions in Eucalyptus grandis, conserved functional motifs, and dynamic regulatory networks that contribute to the species’ metabolic versatility. Gene expression profiling demonstrated that EgMDHs were responsive to hormonal signals, salt and cold stress, as well as deficiencies in nitrogen, phosphate, and boron. Collectively, these findings highlight the significance of EgMDH genes in mediating Eucalyptus grandis growth and adaptation to diverse environmental challenges.
Data availability statement
The original contributions presented in the study are included in the article/Supplementary Material. Further inquiries can be directed to the corresponding author.
Author contributions
YX: Formal Analysis, Investigation, Methodology, Writing – original draft. HX: Writing – review & editing, Formal Analysis, Resources. DY: Writing – review & editing, Data curation, Investigation, Software. LD: Writing – review & editing, Formal Analysis, Methodology. GuoL: Writing – review & editing, Data curation, Formal Analysis. ZZ: Data curation, Formal Analysis, Writing – review & editing. ZL: Funding acquisition, Supervision, Writing – review & editing. LM: Conceptualization, Funding acquisition, Supervision, Writing – review & editing. GuaL: Conceptualization, Funding acquisition, Supervision, Writing – review & editing.
Funding
The author(s) declare that financial support was received for the research and/or publication of this article. This work was funded by the National Key Research and Development Program of China during the 14th five-year plan Period (Grant No: 2023YFD2201003), the Eighth Phase of Fujian Forestry Seedling Science and Technology Research Project (Grant No: ZMGG-0808), the Fundamental Research Funds for the Central Non-Profit Research Institution of CAF (Grant No: CAFYBB2022SY017), and the Shangluo Science Research Program (Grant No: 2021-Z-0034).
Conflict of interest
The authors declare that the research was conducted in the absence of any commercial or financial relationships that could be construed as a potential conflict of interest.
Generative AI statement
The author(s) declare that no Generative AI was used in the creation of this manuscript.
Publisher’s note
All claims expressed in this article are solely those of the authors and do not necessarily represent those of their affiliated organizations, or those of the publisher, the editors and the reviewers. Any product that may be evaluated in this article, or claim that may be made by its manufacturer, is not guaranteed or endorsed by the publisher.
Supplementary material
The Supplementary Material for this article can be found online at: https://www.frontiersin.org/articles/10.3389/fpls.2025.1640247/full#supplementary-material
References
Burow, L. C., Mabbett, A. N., and Blackall, L. L. (2008). Anaerobic glyoxylate cycle activity during simultaneous utilization of glycogen and acetate in uncultured Accumulibacter enriched in enhanced biological phosphorus removal communities. ISME. J. 2, 1040–1051. doi: 10.1038/ismej.2008.45, PMID: 18784756
Chen, S., Peng, W., Ansah, E. O., Xiong, F., and Wu, Y. (2022). Encoded C4 homologue enzymes genes function under abiotic stresses in C3 plant. Plant Signaling Behav. 17, 2115634. doi: 10.1080/15592324.2022.2115634, PMID: 36102341
Chen, C., Wu, Y., Li, J., Wang, X., Zeng, Z., Xu, J., et al. (2023). TBtools-II: A “one for all, all for one” bioinformatics platform for biological big-data mining. Mol. Plant 16, 1733–1742. doi: 10.1016/j.molp.2023.09.010, PMID: 37740491
Chen, Y., Yan, Z., Liang, L., Ran, M., Wu, T., Wang, B., et al. (2020). Comparative evaluation of organic acid pretreatment of eucalyptus for kraft dissolving pulp production. Materials 13, 361. doi: 10.3390/ma13020361, PMID: 31940949
da Silva, L. J. R., da Silva Sandim, A., da Silva, A. P. R., Deus, A. C. F., Antonangelo, J. A., and Büll, L. T. (2024). Evaluating the agronomic efficiency of alternative phosphorus sources applied in Brazilian tropical soils. Sci. Rep. 14, 8526. doi: 10.1038/s41598-024-58911-0, PMID: 38609406
Fan, C., Lyu, M., Zeng, B., He, Q., Wang, X., Lu, M. Z., et al. (2024). Profiling of the gene expression and alternative splicing landscapes of Eucalyptus grandis. Plant Cell Environ. 47, 1363–1378. doi: 10.1111/pce.14814, PMID: 38221855
Fang, Y., Jiang, J., Hou, X., Guo, J., Li, X., Zhao, D., et al. (2022). Plant protein-coding gene families: Their origin and evolution. Front. Plant Sci. 13, 995746. doi: 10.3389/fpls.2022.995746, PMID: 36160967
Fang, X., Yang, D., Deng, L., Zhang, Y., Lin, Z., Zhou, J., et al. (2024). Phosphorus uptake, transport, and signaling in woody and model plants. Forestry. Res. 4, e017. doi: 10.48130/forres-0024-0014, PMID: 39524430
Feng, C., Song, X., and Tang, H. (2019). Molecular cloning and expression analysis of GT-2-like genes in strawberry. 3. Biotech. 9, 105. doi: 10.1007/s13205-019-1603-1, PMID: 30800616
Ferguson, S., Jones, A., Murray, K., Andrew, R., Schwessinger, B., and Borevitz, J. (2024). Plant genome evolution in the genus Eucalyptus is driven by structural rearrangements that promote sequence divergence. Genome Res. 34, 606–619. doi: 10.1101/gr.277999.123, PMID: 38589251
Feria, A. B., Ruíz-Ballesta, I., Baena, G., Ruíz-López, N., Echevarría, C., and Vidal, J. (2022). Phosphoenolpyruvate carboxylase and phosphoenolpyruvate carboxylase kinase isoenzymes play an important role in the filling and quality of Arabidopsis thaliana seed. Plant Physiol. Biochem. 190, 70–80. doi: 10.1016/j.plaphy.2022.08.012, PMID: 36099810
Fernie, A. R., Carrari, F., and Sweetlove, L. J. (2004). Respiratory metabolism: glycolysis, the TCA cycle and mitochondrial electron transport. Curr. Opin. Plant Biol. 7, 254–261. doi: 10.1016/j.pbi.2004.03.007, PMID: 15134745
Gao, M., Yang, N., Shao, Y., Shen, T., Li, W., Ma, B., et al. (2024). An insertion in the promoter of a malate dehydrogenase gene regulates Malic acid content in apple fruit. Plant Physiol. 196, 432–445. doi: 10.1093/plphys/kiae303, PMID: 38788771
Gupta, S., Thokchom, S. D., and Kapoor, R. (2023). Arbuscular mycorrhiza fungus alleviates arsenic mediated disturbances in tricarboxylic acid cycle and nitrogen metabolism in Triticum aestivum L. Plant Physiol. Biochem. 197, 107631. doi: 10.1016/j.plaphy.2023.03.008, PMID: 36965318
Guruprasad, K., Reddy, B. V., and Pandit, M. W. (1990). Correlation between stability of a protein and its dipeptide composition: a novel approach for predicting in vivo stability of a protein from its primary sequence. Protein Eng. 4, 155–161. doi: 10.1093/protein/4.2.155, PMID: 2075190
He, B., Liu, W., Li, J., Xiong, S., Jia, J., Lin, Q., et al. (2024). Evolution of plant genome size and composition. Genomics Proteomics Bioinf. 22, qzae078. doi: 10.1093/gpbjnl/qzae078, PMID: 39499156
Huang, X., Xiang, Y., Zhao, Y., Wang, C., Wang, J., Wang, W., et al. (2023). Regulation of a vacuolar proton-pumping P-ATPase MdPH5 by MdMYB73 and its role in malate accumulation and vacuolar acidification. aBIOTECH 4, 303–314. doi: 10.1007/s42994-023-00115-7, PMID: 38106434
Imran, M., Munir, M. Z., Ialhi, S., Abbas, F., Younus, M., Ahmad, S., et al. (2022). Identification and characterization of malate dehydrogenases in tomato (Solanum lycopersicum L.). Int. J. Mol. Sci. 23, 10028. doi: 10.3390/ijms231710028, PMID: 36077425
Imran, M., Tang, K., and Liu, J. Y. (2016). Comparative genome-wide analysis of the malate dehydrogenase gene families in cotton. PloS One 11, e0166341. doi: 10.1371/journal.pone.0166341, PMID: 27829020
Jarvis, D. E., Ryu, C. H., Beilstein, M. A., and Schumaker, K. S. (2014). Distinct roles for SOS1 in the convergent evolution of salt tolerance in Eutrema salsugineum and Schrenkiella parvula. Mol. Biol. Evol. 31, 2094–2107. doi: 10.1093/molbev/msu152, PMID: 24803640
Kapoor, B., Kumar, P., Verma, V., Irfan, M., Sharma, R., and Bhargava, B. (2023). How plants conquered land: evolution of terrestrial adaptation. J. Evol. Biol. 36, 5–14. doi: 10.1111/jeb.14062, PMID: 36083189
Li, Z., Shi, L., Lin, X., Tang, B., Xing, M., and Zhu, H. (2023). Genome-wide identification and expression analysis of malate dehydrogenase gene family in sweet potato and its two diploid relatives. Int. J. Mol. Sci. 24, 16549. doi: 10.3390/ijms242316549, PMID: 38068872
Lin, Y., Chen, W., Yang, Q., Zhang, Y., Ma, X., and Li, M. (2023). Genome-wide characterization and gene expression analyses of malate dehydrogenase (MDH) genes in low-phosphorus stress tolerance of chinese fir (Cunninghamia lanceolata). Int. J. Mol. Sci. 24, 4414. doi: 10.3390/ijms24054414, PMID: 36901845
Lin, Z., Guo, C., Lou, S., Jin, S., Zeng, W., Guo, Y., et al. (2021). Functional analyses unveil the involvement of moso bamboo (Phyllostachys edulis) group I and II NIN-LIKE PROTEINS in nitrate signaling regulation. Plant Sci. 306, 110862. doi: 10.1016/j.plantsci.2021.110862, PMID: 33775367
Liszka, A., Schimpf, R., Cartuche Zaruma, K. I., Buhr, A., Seidel, T., Walter, S., et al. (2020). Three cytosolic NAD-malate dehydrogenase isoforms of Arabidopsis thaliana: on the crossroad between energy fluxes and redox signaling. Biochem. J. 477, 3673–3693. doi: 10.1042/BCJ20200240, PMID: 32897311
Liu, J., Chen, H., Li, C., Du, K., and Yang, J. (2025). Genome-wide identification and expression analysis of GRAS transcription factors under cold stress in diploid and triploid Eucalyptus. Front. Genet. 16, 1436285. doi: 10.3389/fgene.2025.1436285, PMID: 39944594
Luo, J., Liang, Z., Wu, M., and Mei, L. (2019). Genome-wide identification of BOR genes in poplar and their roles in response to various environmental stimuli. Environ. Exp. Bot. 164, 101–113. doi: 10.1016/j.envexpbot.2019.04.006
Ma, B., Yuan, Y., Gao, M., Xing, L., Li, C., Li, M., et al. (2018). Genome-wide identification, classification, molecular evolution and expression analysis of malate dehydrogenases in apple. Int. J. Mol. Sci. 19, 3312. doi: 10.3390/ijms19113312, PMID: 30356028
Moeder, W., Del Pozo, O., Navarre, D. A., Martin, G. B., and Klessig, D. F. (2007). Aconitase plays a role in regulating resistance to oxidative stress and cell death in Arabidopsis and Nicotiana benthamiana. Plant Mol. Biol. 63, 273–287. doi: 10.1007/s11103-006-9087-x, PMID: 17013749
Mohanta, T. K., Khan, A., Hashem, A., Abd Allah, E. F., and Al-Harrasi, A. (2019). The molecular mass and isoelectric point of plant proteomes. BMC Genomics 20, 631. doi: 10.1186/s12864-019-5983-8, PMID: 31382875
Nan, N., Wang, J., Shi, Y., Qian, Y., Jiang, L., Huang, S., et al. (2020). Rice plastidial NAD-dependent malate dehydrogenase 1 negatively regulates salt stress response by reducing the vitamin B6 content. Plant Biotechnol. J. 18, 172–184. doi: 10.1111/pbi.13184, PMID: 31161713
Rinalducci, S., Egidi, M. G., Karimzadeh, G., Jazii, F. R., and Zolla, L. (2011). Proteomic analysis of a spring wheat cultivar in response to prolonged cold stress. Electrophoresis 32, 1807–1818. doi: 10.1002/elps.201000663, PMID: 21710550
Sato, T., Maekawa, S., Konishi, M., Yoshioka, N., Sasaki, Y., Maeda, H., et al. (2017). Direct transcriptional activation of BT genes by NLP transcription factors is a key component of the nitrate response in Arabidopsis. Biochem. Biophys. Res. Commun. 483, 380–386. doi: 10.1016/j.bbrc.2016.12.135, PMID: 28025145
Tian, F., Yang, D., Meng, Y., Jin, J., and Gao, G. (2020). PlantRegMap: charting functional regulatory maps in plants. Nucleic Acids Res. 48, D1104–D1113. doi: 10.1093/nar/gkz1020, PMID: 31701126
Tomaz, T., Bagard, M., Pracharoenwattana, I., Lindén, P., Lee, C. P., Carroll, A. J., et al. (2010). Mitochondrial malate dehydrogenase lowers leaf respiration and alters photorespiration and plant growth in Arabidopsis. Plant Physiol. 154, 1143–1157. doi: 10.1104/pp.110.161612, PMID: 20876337
Wang, Q., Sun, H., Dong, Q., Sun, T., Jin, Z., Hao, Y., et al. (2016). The enhancement of tolerance to salt and cold stresses by modifying the redox state and salicylic acid content via the cytosolic malate dehydrogenase gene in transgenic apple plants. Plant Biotechnol. J. 14, 1986–1997. doi: 10.1111/pbi.12556, PMID: 26923485
Wang, B., Wang, G., and Zhu, S. (2019). DNA damage inducible protein 1 is involved in cold adaption of harvested cucumber fruit. Front. Plant Sci. 10, 1723. doi: 10.3389/fpls.2019.01723, PMID: 32038689
Wang, T., Yang, Y., Lou, S., Wei, W., Zhao, Z., Ren, Y., et al. (2020). Genome-wide characterization and gene expression analyses of GATA transcription factors in moso bamboo (Phyllostachys edulis). Int. J. Mol. Sci. 21, 14. doi: 10.3390/ijms21010014, PMID: 31861396
Wang, T., Ye, W., Zhang, J., Li, H., Zeng, W., Zhu, S., et al. (2023). Alternative 3’-untranslated regions regulate high-salt tolerance of Spartina alterniflora. Plant Physiol. 191, 2570–2587. doi: 10.1093/plphys/kiad030, PMID: 36682816
Wei, J., Han, Y., Xu, H., Deng, L., Li, L., Zhang, S., et al. (2025). AAAP gene family evolution and transcriptional regulation in Eucalyptus grandis under nitrogen, phosphate and boron deficiencies. BMC Plant Biol. 25, 879. doi: 10.1186/s12870-025-06907-x, PMID: 40615974
Wei, Z., Zeng, X., Qin, C., Wang, Y., Bai, L., Xu, Q., et al. (2016). Comparative transcriptome analysis revealed genes commonly responsive to varied nitrate stress in leaves of tibetan hulless barley. Front. Plant Sci. 7, 1067. doi: 10.3389/fpls.2016.01067, PMID: 27493653
Xu, H., Xing, Y., Li, G., Wang, X., Zhou, X., Lu, Z., et al. (2025). Decoding PHR-orchestrated stress adaptation: A genome-wide integrative analysis of transcriptional regulation under abiotic stress in eucalyptus grandis. Int. J. Mol. Sci. 26, 2958. doi: 10.3390/ijms26072958, PMID: 40243569
Yang, N. and Scandalios, J. G. (1974). Purification and biochemical properties of genetically defined malate dehydrogenase in maize. Arch. Biochem. Biophys. 161, 335–353. doi: 10.1016/0003-9861(74)90314-2, PMID: 4365553
Yao, Y., Dong, Q., Zhai, H., You, C., and Hao, Y. (2011). The functions of an apple cytosolic malate dehydrogenase gene in growth and tolerance to cold and salt stresses. Plant Physiol. Biochem. 49, 257–264. doi: 10.1016/j.plaphy.2010.12.009, PMID: 21236692
Yudina, R. (2012). Malate dehydrogenase in plants: Its genetics, structure, localization and use as a marker. Adv. Biosci. Biotechnol. 03, 370–377. doi: 10.4236/abb.2012.34053
Yudina, R. S. and Levites, E. V. (2008). Subcellular localization of isozymes of NAD-dependent malate dehydrogenase in sugar beet Beta vulgaris L. Russian J. Genet. 44, 1419–1423. doi: 10.1134/S1022795408120053, PMID: 19178082
Zhang, Y. and Fernie, A. R. (2023). The role of TCA cycle enzymes in plants. Adv. Biol. 7, e2200238. doi: 10.1002/adbi.202200238, PMID: 37341441
Zhang, Y., Wang, Y., Sun, X., Yuan, J., Zhao, Z., Gao, J., et al. (2022). Genome-wide identification of MDH family genes and their association with salt tolerance in rice. Plants 11, 1498. doi: 10.3390/plants11111498, PMID: 35684271
Zhou, M., Wang, G., Bai, R., Zhao, H., Ge, Z., and Shi, H. (2023). The self-association of cytoplasmic malate dehydrogenase 1 promotes malate biosynthesis and confers disease resistance in cassava. Plant Physiol. Biochem. 201, 107814. doi: 10.1016/j.plaphy.2023.107814, PMID: 37321041
Zhu, S., Chen, Z., Xie, B., Guo, Q., Chen, M., Liang, C., et al. (2021). A phosphate starvation responsive malate dehydrogenase, GmMDH12 mediates malate synthesis and nodule size in soybean (Glycine max). Environ. Exp. Bot. 189, 104560. doi: 10.1016/j.envexpbot.2021.104560
Zwart, L., Berger, D. K., Moleleki, L. N., van der Merwe, N. A., Myburg, A. A., and Naidoo, S. (2017). Evidence for salicylic acid signalling and histological changes in the defence response of Eucalyptus grandis to Chrysoporthe austroafricana. Sci. Rep. 7, 45402. doi: 10.1038/srep45402, PMID: 28349984
Keywords: MDH, Eucalyptus Grandis, gene expression regulation, salt stress, cold stress, phosphate starvation, nitrogen deficiency, boron deficiency
Citation: Xing Y, Xu H, Yang D, Deng L, Li G, Zhao Z, Lu Z, Ma L and Li G (2025) Genome-wide identification and gene expression analysis of the malate dehydrogenase (MDH) gene family in Eucalyptus grandis. Front. Plant Sci. 16:1640247. doi: 10.3389/fpls.2025.1640247
Received: 03 June 2025; Accepted: 21 July 2025;
Published: 05 August 2025.
Edited by:
Baohua Wang, Nantong University, ChinaReviewed by:
Alma Armenta-Medina, National Institute of Forestry and Agricultural Research (INIFAP), MexicoDemissew Tesfaye Teshome, University of Pretoria, South Africa
Copyright © 2025 Xing, Xu, Yang, Deng, Li, Zhao, Lu, Ma and Li. This is an open-access article distributed under the terms of the Creative Commons Attribution License (CC BY). The use, distribution or reproduction in other forums is permitted, provided the original author(s) and the copyright owner(s) are credited and that the original publication in this journal is cited, in accordance with accepted academic practice. No use, distribution or reproduction is permitted which does not comply with these terms.
*Correspondence: Liuyin Ma, bG1hMjIzQGZhZnUuZWR1LmNu; Guangyou Li, bGd5QGNhZi5hYy5jbg==