 Wenshun Hu1†
 Qing Zhang2†
 Chaojun Deng1Qizhi Xu1Jimou Jiang1Xiuping Chen1
 Jianguo Li3*
 Jisen Zhang2*Shaoquan Zheng1*
- 1Fruit Research Institute, Fujian Academy of Agricultural Sciences, Fujian Breeding Engineering Technology Research Center for Longan and Loquat, Fuzhou, China
- 2State Key Lab for Conservation and Utilization of Subtropical Agro-Biological Resources, College of Agriculture, Guangxi University, Nanning, China
- 3College of Horticulture, South China Agricultural University, Guangzhou, China
Aroma is a crucial factor influencing the flavor quality and economic value of longan fruits. This study employed a mapping population consisting of 98 F1 progeny of ‘Shixia × Xiangcui’ (exhibiting broad segregation in fruit aroma trait) and their parents. We performed the SNP genotyping through whole-genome resequencing to construct a high-density linkage map, followed by QTL mapping and candidate gene screening for aroma trait. We obtained a total of 554.9 Gbp of sequencing data, with an average depth of approximately 15× for the parents and 12× for the progeny. Three types of SNP markers (lm×ll, nn×np, and hk×hk) were developed, totaling 317 877. After merging with a 100 kb sliding window, 6 134 Bin markers were generated. A first high-density Bin map was constructed, comprising 15 linkage groups with 3 517 Bin markers (containing 264 385 SNPs), covering a total map length of 1 666.79 cM. The average marker interval was 0.48 cM, with 99.18% of gaps being less than 5 cM. Collinearity analysis confirmed the high quality of the map. Fifty-six QTLs were mapped for 9 aroma-related traits, including (E)-2-hexenal, ethyl acetate, ethyl butyrate, ethyl crotonate, (E)-2-hexenoate, ethanol, linalool, ocimene, and total ester content. These QTLs explained 19.8%–51.0% of the phenotypic variation rates and were distributed across 11 linkage groups, with two QTL-rich regions on LG7 and LG8. Seven pleiotropic QTLs were detected. By analyzing the expression patterns of 1 535 annotated genes within the mapped intervals, six candidate genes potentially regulating the synthesis of ester characteristic aroma compounds were identified: aldo-keto reductase AKRs, acetolactate synthase small subunit ALS2, ACC oxidase ACO1-1, and transcription factors bHLH122, AGL103, and bZip1. This work provides novel insights into the fruit aroma formation, and facilitates breeding efforts to improve quality in longan and potentially other fruit crops.
1 Introduction
Longan (Dimocarpus longan Lour.) is a renowned specialty fruit in tropical and subtropical regions of China and Southeast Asia, occupies approximately ~5.7 million hectares globally with annual production reaching ~4.2 million tons. China is the origin and the leading producer of longan (Zheng et al., 2019), but cultivation is dominated by two varieties, ‘Shixia’ and ‘Chuliang’, which account for about 80% of the national acreage, and the fruit also lacks fragrance. In contrast, the ‘Chompoo’, ‘Biew Kiew’, and ‘E-Daw’ cultivated in Thailand, as well as the ‘Kohala’ grown commercially in the United States and Australia, are all well-known strong fragrant longan varieties in the international fruit market. Therefore, deepening the understanding of the molecular mechanisms underlying longan fruit aroma formation and related breeding research has important significance.
Genetic mapping, also known as linkage mapping, is an effective method for locating genes associated with important economic traits. The construction of genetic maps and QTL mapping for economic traits in longan (2n=2x=30) started relatively late and has evolved through two stages: reference-free and reference-based mapping. Guo et al. (Guo et al., 2009) used 94 F1 progenies of ‘Fengliduo × Dawuyuan’ as mapping population, and constructed the first molecular genetic map of longan by RAPD, ISSR, SRAP, and AFLP markers. The maternal and paternal maps contained 21 and 22 linkage groups, with 183 and 251 marker loci, respectively, and average intervals of 5.84 cM and 4.65 cM. Subsequent studies based on this map identified QTLs for traits such as single fruit weight, soluble solid content, seed weight, peel weight, and edible rate (Guo et al., 2011), as well as trunk circumference (Guo et al., 2012). After the release of the first longan reference genome (at the contig level) (Lin et al., 2017), high-throughput SNP detection methods were applied to linkage mapping. Jue et al. (Jue et al., 2021) expanded the ‘Fengliduo × Dawuyuan’ population to 200 F1 progeny and used RAD-Seq to construct a high-density SNP genetic map with 15 linkage groups (first consistent with chromosome count), 8014 SNPs, and an average interval of 0.36 cM. This map enabled the identification of 17 stable QTLs for single fruit weight and edible rate across years, along with 3 candidate genes. However, the above studies have limitations such as the use of a single hybrid combination, low density of traditional markers like RAPD, or the absence of a chromosome-level reference genome, which hinder the accurate localization of the map.
Currently, high-throughput sequencing can easily generate millions of SNP markers, but this volume exceeds the computational capacity of commonly used mapping software. The recombination breakpoint strategy addresses this by fusing identical genotypes within the sliding window into Bin markers, reducing marker redundancy while retaining complete genetic information. Compared to RFLP, SSR, InDel, or single SNP markers, Bin markers offer greater informativeness for a given population, and the sliding window approach helps eliminate false positives caused by sequencing errors. In recent years, high-density Bin genetic map construction and QTL mapping have been applied to various annual crops such as rice (Zhao et al., 2022), soybean (Ma et al., 2023), maize (Zhou et al., 2016), rapa (Li F. M. et al., 2023), and melon (Pereira et al., 2018), as well as a few woody fruit crops like apple (Di Pierro et al., 2016) and pear (Qin et al., 2022).
Aroma is a typical quantitative trait controlled by multiple genes. High-density genetic maps have proven effective for QTL mapping of aroma trait in annual crops like rice (Amarawathi et al., 2008), wheat (Kiszonas et al., 2017), tomato (Tikunov et al., 2020), cucumber (Sun et al., 2022), and strawberry (Rey-Serra et al., 2022). Perennial fruit trees face challenges such as long breeding cycles, large space requirements, and the complexity of aroma compound identification and quantification. However, with the increasing attention to fruit quality, progress has been made in aroma-related QTL mapping for kiwifruit (Zeng et al., 2020; Souleyre et al., 2022), grape (Koyama et al., 2022), apple (Yang et al., 2023), peach (Eduardo et al., 2013; Sánchez et al., 2014), and citrus (Yu et al., 2017). To date, no studies have reported Bin map construction and aroma-related QTL mapping in longan. Based on the chromosome-level reference genome of the ‘Shixia’ cultivar, this study constructed a high-density Bin-marker linkage map through whole-genome resequencing of an F1 population derived from a ‘Shixia × Xiangcui’ cross. This map was then leveraged to identify aroma-related QTLs/candidate genes, ultimately aiming to elucidate the molecular mechanisms of aroma formation in longan fruit and support marker-assisted breeding.
2 Materials and methods
2.1 Plant material
With high yield, premium quality and rich aroma as the breeding objectives, in 2009, the non-aromatic early-maturing cultivar ‘Shixia’ (a major domestic cultivar) and the aromatic late-maturing large-fruit cultivar ‘Xiangcui’ (a bud sport of Thailand’s major cultivar ‘Biew Kiew’) were cross-pollinated to obtain the F1 progeny. The fruit aroma of the offsping exhibits a wide variation, including none, weak and strong (Hu et al., 2015). For this study, the parental lines and 98 F1 offspring grafted on trees were selected as the mapping population (Figure 1).
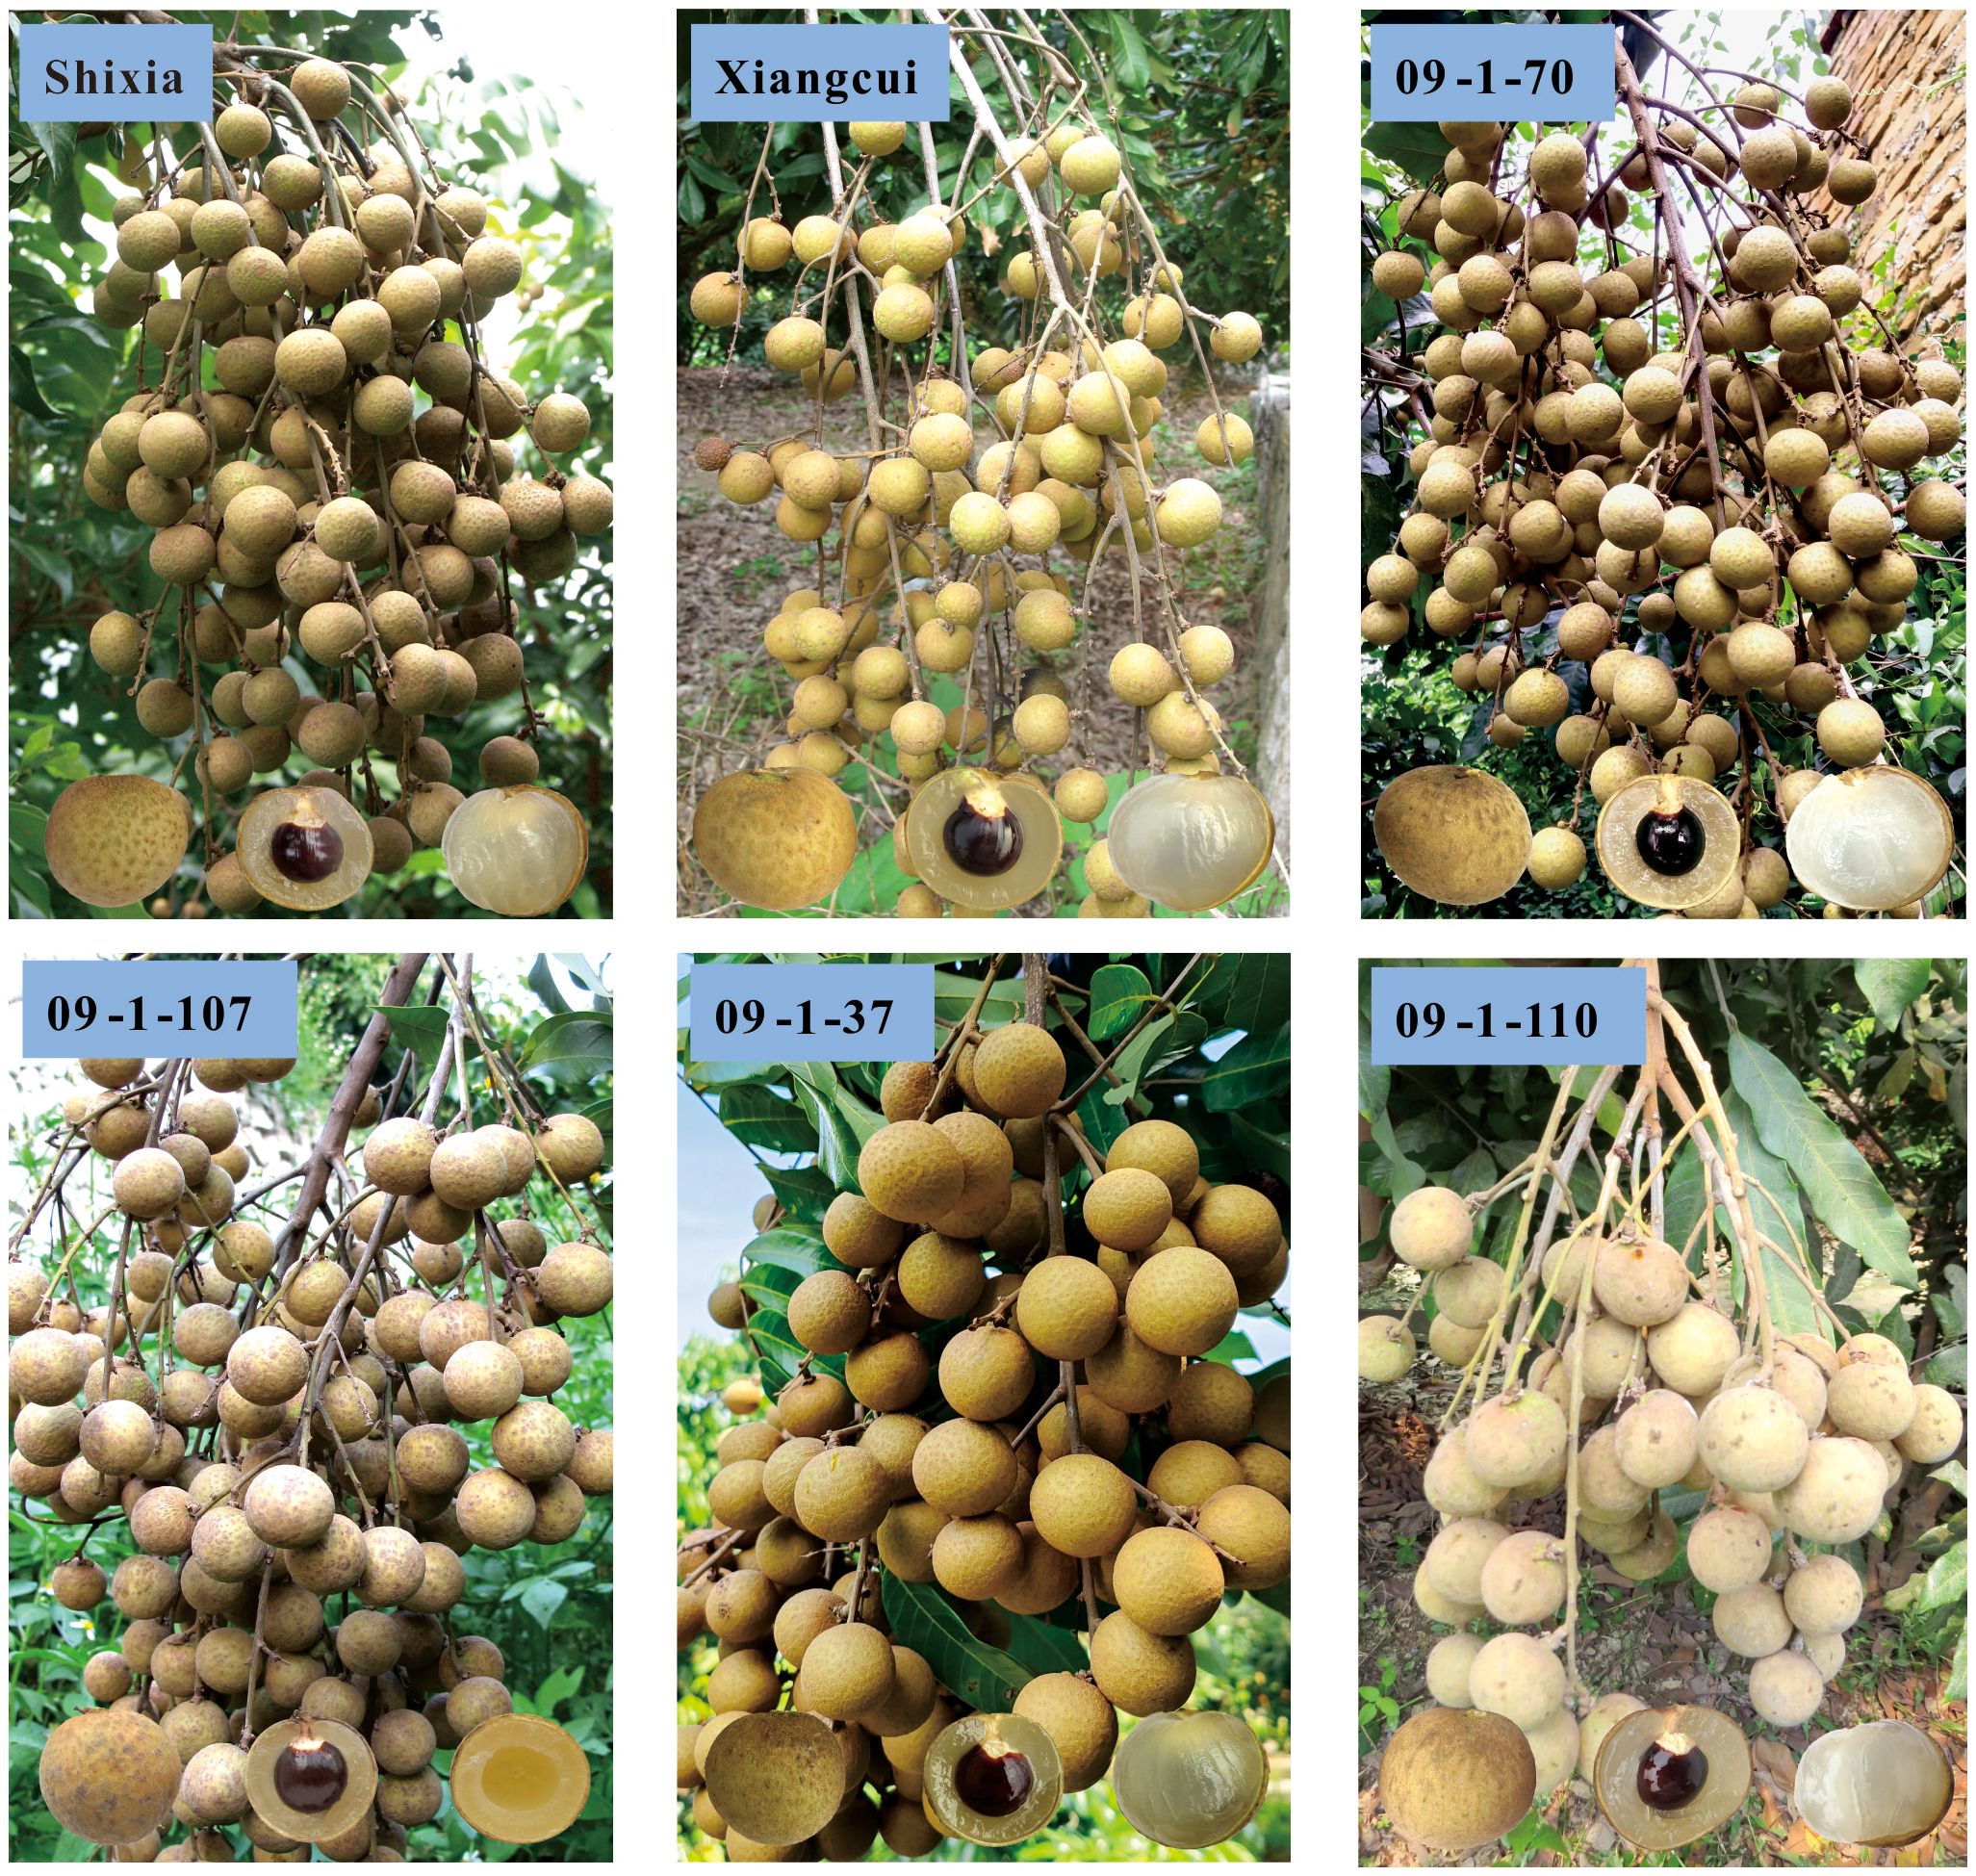
Figure 1. Ear trait of parental lines and partial F1 hybrids progeny. Progeny with light fruit aroma: 09-1-70, and 09-1-107; Progeny with strong fruit aroma: 09-1-37; Progeny without fruit aroma: 09-1-110.
2.2 Experimental methods
2.2.1 Extraction and detection of genome DNA
Young leaves were collected, and genomic DNA was extracted by modified CTAB method. DNA integrity was assessed via 1% agarose gel electrophoresis, and the concentration was measured using a Nanodrop spectrophotometer. Qualified DNA samples were used for high-throughput sequencing.
2.2.2 Resequencing library construction and sequencing
The NEBNext Ultra DNA Library Prep Kit was used to construct whole-genome resequencing libraries of 100 samples from the parents ‘Shixia’, ‘Xiangcui’ and their 98 F1 offspring. The Qualified libraries were sequenced on the Illumina HiSeq 2500 platform at the Fujian Agriculture and Forestry University Genomics and Biotechnology Research Center. The sequencing modes for the hybrid progeny and parents were High-throughput 1×100 nt and High-throughput 2×100 nt, respectively, with a sequencing depth of >10×.
2.2.3 SNP detection
Raw reads from the 100 resequenced samples were quality-controlled using Trimmomatic (Bolger et al., 2014) to remove low-quality reads and adapter sequences. Clean reads were aligned to the ‘Shixia’ reference genome (https://www.ncbi.nlm.nih.gov/bioproject/PRJNA741049/) using BWA (Jo and Koh, 2015) with default parameters. PCR duplicates were marked and removed using Picard (http://sourceforge.net/projects/picard/). SNP calling and filtering were performed using GATK (https://github.com/broadinstitute/gatk/releases) and VCFtools (Danecek et al., 2011) to obtain a SNP dataset.
2.2.4 SNP genotyping and genetic map construction
The SNP dataset was filtered to remove markers located on non-chromosomal contigs. Markers were classified into three types based on parental genotypes: lm×ll, nn×np, and hk×hk. Chi-square tests (P < 0.05) were applied to retain markers with segregation ratios of 1:1, 1:1, and 1:2:1, respectively.
To reduce redundancy while retaining sufficient genetic information, Bin markers were created using the Slide window method in Binmarker-v2.3 (). Methods such as recombination breakpoints determination, genotyping error correction, and window merging of the same genotype were referred to Qin et al. (Qin et al., 2022).
According to the principle of ‘double false testcross’, the CP (Cross Pollinator) model in JoinMap 4.1 was used for genetic map construction through a systematic workflow. First, the three types of Bin markers were combined and loaded into the software, and the population was created after checking the data format. Second, parameters included regression mapping, Kosambi mapping function, a single iteration, and a minimum LOD score of 10.0 for linkage group clustering. Third, markers with severe segregation distortion (χ² test, P < 0.05), missing rates ≥10%, and similarity = 1.0 were removed. Fourth, nodes of linkage group were determined, and the map was drawn after three iterations. MapChart 2.2 was used for visualization (Voorrips, 2002), and ALLMAPs assessed the consistency between the Hi-C-based chromosome-level genome and the genetic map (Tang et al., 2015).
2.2.5 Data acquisition of fruit aroma trait in hybrid population
Prior research by our group identified 22 characteristic aroma compounds through volatile profiling of parental fruits across developmental stages. Comprehensive phenotypic datasets were obtained, including: five-year aroma sensory evaluations (2012–2015 and 2018, 83 progeny) and volatile compound GC-MS detection (2018, 48 progeny), which will be published separately. For the present QTL mapping study, we selected ten key traits: (E)-2-hexenal (A6), ethyl acetate (E1), ethyl butyrate (E3), ethyl crotonate (E4), ethyl (E)-2-hexenoate (E7), ethanol (AO1), ocimene (M1), linalool (M5), total ester content (TE), and 5-year comprehensive value of aroma sensory evaluation (FS). The content of E1, E3, E4, E7, AO1, and TE were significantly correlated with aroma intensity, and A6, M1, and M5 were the main characteristic aroma components.
2.2.6 QTL mapping for aroma traits
QTL analysis was performed using MapQTL 6.0 (Van Ooijen, 2009). Normally distributed traits were analyzed using Interval Mapping, while others used the Kruskal-Wallis (KW) test (Qin et al., 2022). Missing phenotypic data for individual plants were treated as null values. Significance thresholds were established through 10 000 permutation tests (PT), with LOD scores determined as follows: primary threshold calculation considered genome-wide confidence levels (0.95 or 0.90), adopting the more stringent value; if no significant interval was detected, linkage group-specific thresholds (0.95 or 0.90 confidence) were applied, again selecting the higher value. The minimum initial LOD threshold was set at ≥3.0. Bin markers meeting these criteria were designated as putative QTLs. The ‘1 LOD-drop’ method (Lander and Botstein, 1989) defined QTL confidence intervals, and phenotypic variance explained (PVE) was calculated for each QTL. QTLs were named as ‘trait code + peak Bin marker’ (e.g., M1-hk0303 denotes an ocimene-related QTL with peak signal at marker hk0303).
2.2.7 Candidate gene identification
QTL intervals from the genetic map were anchored to physical genomic of ‘Shixia’ genome for gene retrieval and functional annotation. The expression level of gene was derived from prior RNA-seq data (a total of 17 developmental stages of ‘Shixia’, ‘Xiangcui’, and ‘Lidongben’ cultivars), and the mean FPKM < 0.5 genes were filtered out. Subsequent KEGG enrichment analysis was performed using ClusterProfiler in R package (Yu et al., 2012). The goodSamplesGenes function of the WGCNA package was used to detect and remove genes with low-variance (standard deviation ≤ 0.5). Gene correlations were calculated via biweight mid-correlation, with soft-thresholding power (β) determined by pickSoftThreshold (Peter and Steve, 2008). Modules were detected (minModuleSize = 20) and merged (mergeCutHeight = 0.25), followed by co-expression network visualization in Cytoscape v3.7.1 (Shannon et al., 2003). Pearson correlations between gene expression and characteristic aroma compounds were analyzed using SPSS 25. Key candidate genes were screened by referring to metabolic pathway, gene function, and literature report etc.
3 Results
3.1 Resequencing of the hybrid population and SNP detection
Whole-genome resequencing of the two longan parents and 98 F1 progeny generated a total of 554.9 Gb of raw data (Table 1). The parental cultivars ‘Shixia’ and ‘Xiangcui’ yielded 7.1 Gb and 6.9 Gb of data, respectively, and the sequencing amount of the F1 population was 3.9-7.1 Gb. The Q30 values of all samples exceeded 90%, indicating high base accuracy. After filtering, the clean reads were aligned to the ‘Shixia’ reference genome (about 483 Mb). The sequencing depth reached 15.47× for the maternal parent ‘Shixia’ and 15.03× for the paternal parent ‘Xiangcui’, and the average sequencing depth of hybrid offspring was 12.25×.
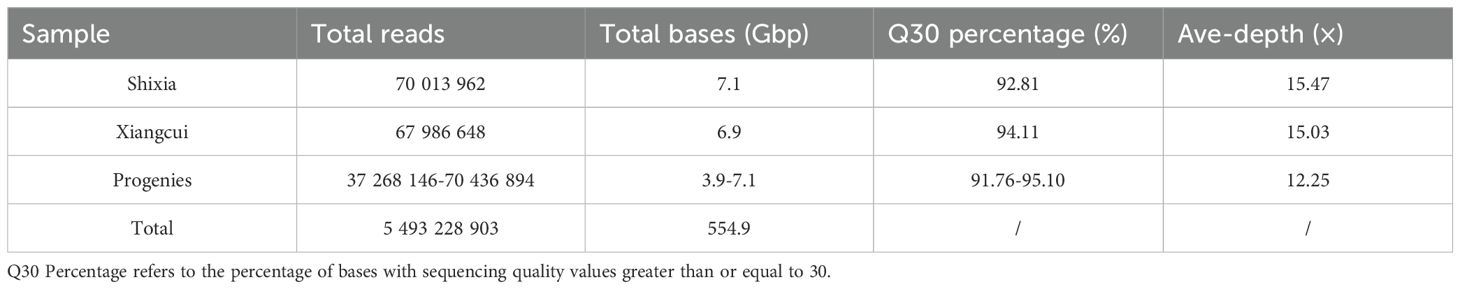
Table 1. The sequences data of parents and progenies.
Through GATK SNP calling and VCFtools filtering, 4 261 436 high-confidence SNP loci were obtained from 11 521 588 raw SNPs. Genotyping and subsequent screening (excluding markers with chi-square test p-values < 0.05 and missing rates ≥ 10%) yielded a total of 317 877 markers suitable for CP model mapping These comprised three types: 59,744 lm×ll (maternal heterozygous, paternal homozygous), 5,704 nn×np (maternal homozygous, paternal heterozygous), and 252,429 hk×hk (both parents heterozygous). The total number of these SNPs far exceeds the computational limits of general mapping software. Five sliding windows with different scales of 25, 50, 100, 200 and 500 kb were used to compare the fusion of three types of markers. and the 100 kb sliding window, which produced 6 134 Bin markers, was determined to be optimal (Figure 2). These Bin markers ranged in length from 1 bp to 874 474 bp (average 58.4 kb) and contained 1 to 1 791 internal SNPs (average 52 SNPs). Joinmap was then used to re-eliminate markers with severe segregation distortion (chi-square test P < 0.01) and missing rate ≥ 10% for three types of markers, and 5 626 Bin markers were obtained for final mapping, of which lm × ll, nn × np, hk × hk were 2 414, 1 189, and 2 023, respectively.
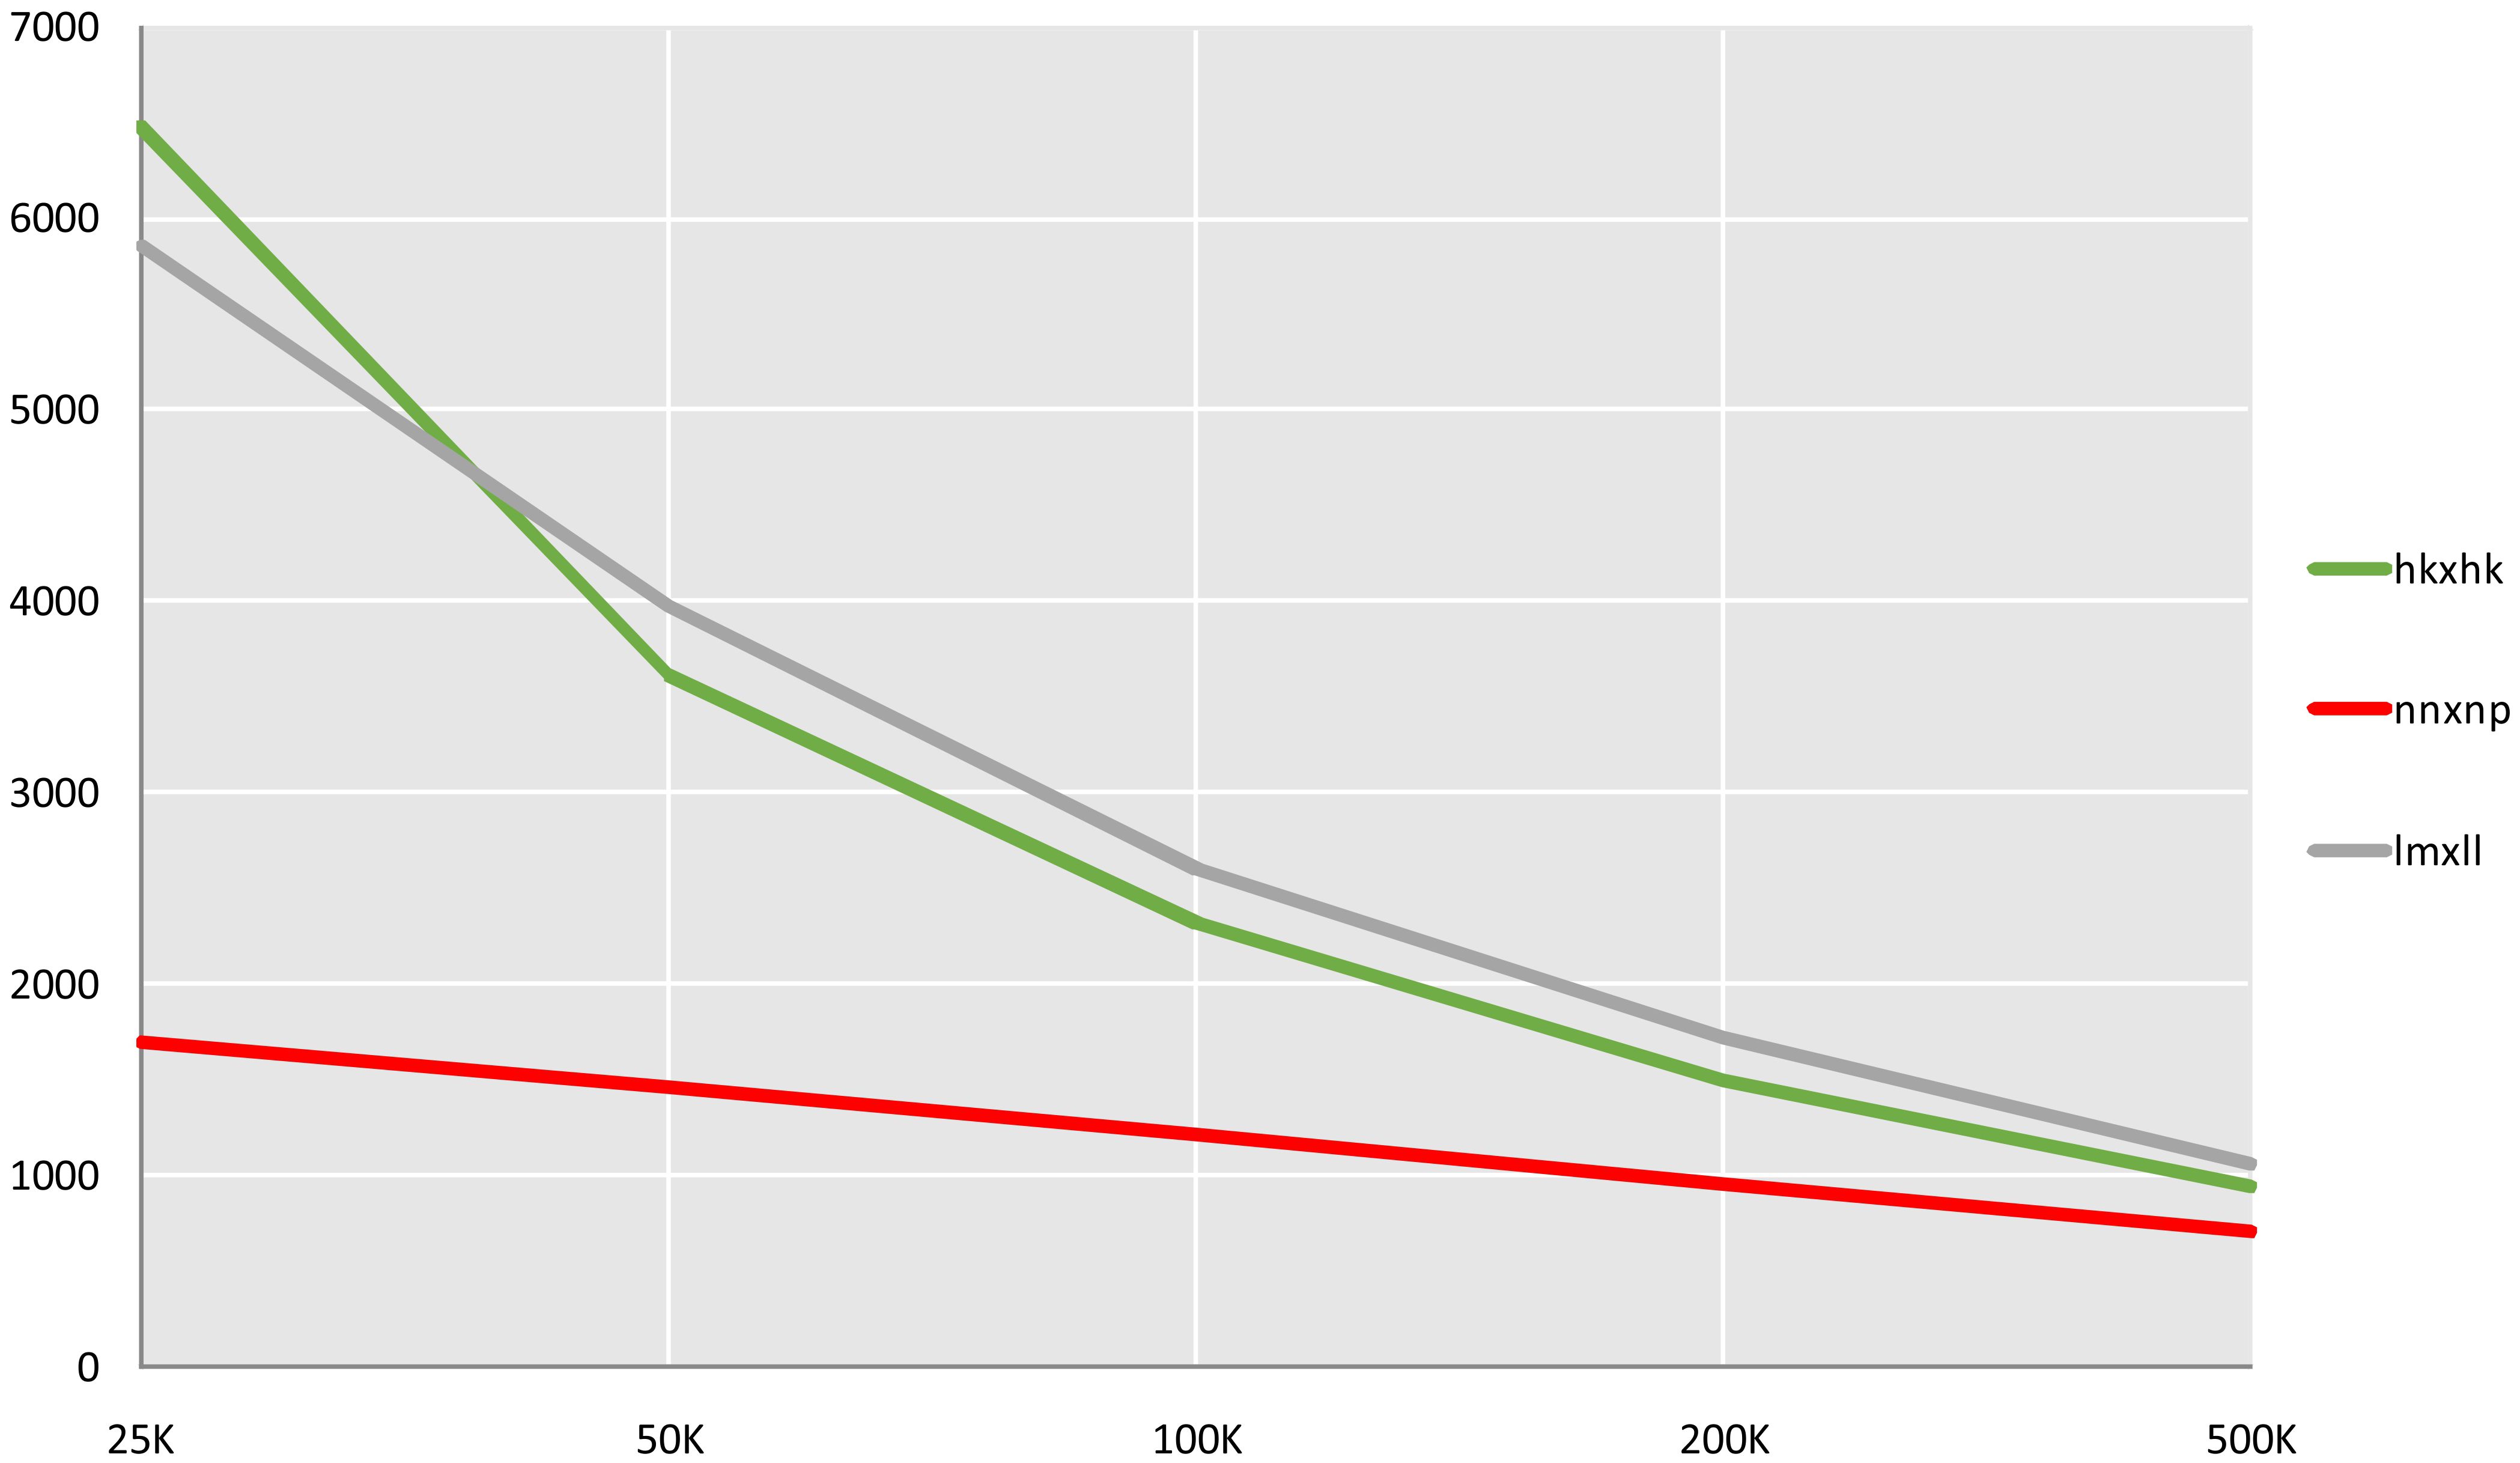
Figure 2. Quantity statistics of Bin markers in slide windows of different length. The X-axis represents the length of the slide window, and the Y-axis represents the number of markers.
3.2 Construction and evaluation of the high-density genetic map
The three types of final markers obtained above were loaded together into Joinmap 4.1 software for grouping, and 15 strong linkage groups (LGs) were selected for map construction. A total of 3 517 Bin markers were ultimately mapped, comprising 1 407 lm×ll, 394 nn×np, and 1 716 hk×hk markers, which collectively contained 264,385 SNPs (Figure 3; Table 2; Supplementary Figure S1). The lengths of the 15 linkage groups ranged from 74.12 cM (LG12) to 181.74 cM (LG8). The number of Bin markers per LG varied from 193 (LG15) to 276 (LG3), and the number of SNP markers ranged from 7 666 (LG5) to 29 368 (LG12). The proportion of gaps <5 cM per linkage group ranged from 98.09% (LG10) to 100% (LG3, LG7, LG12). Overall, the map spanned a total length of 1 666.79 cM, with an average marker interval of 0.48 cM. The proportions of gaps <5 cM and <1 cM reached 99.18% and 90.89%, respectively, indicating uniform marker distribution and small intervals.
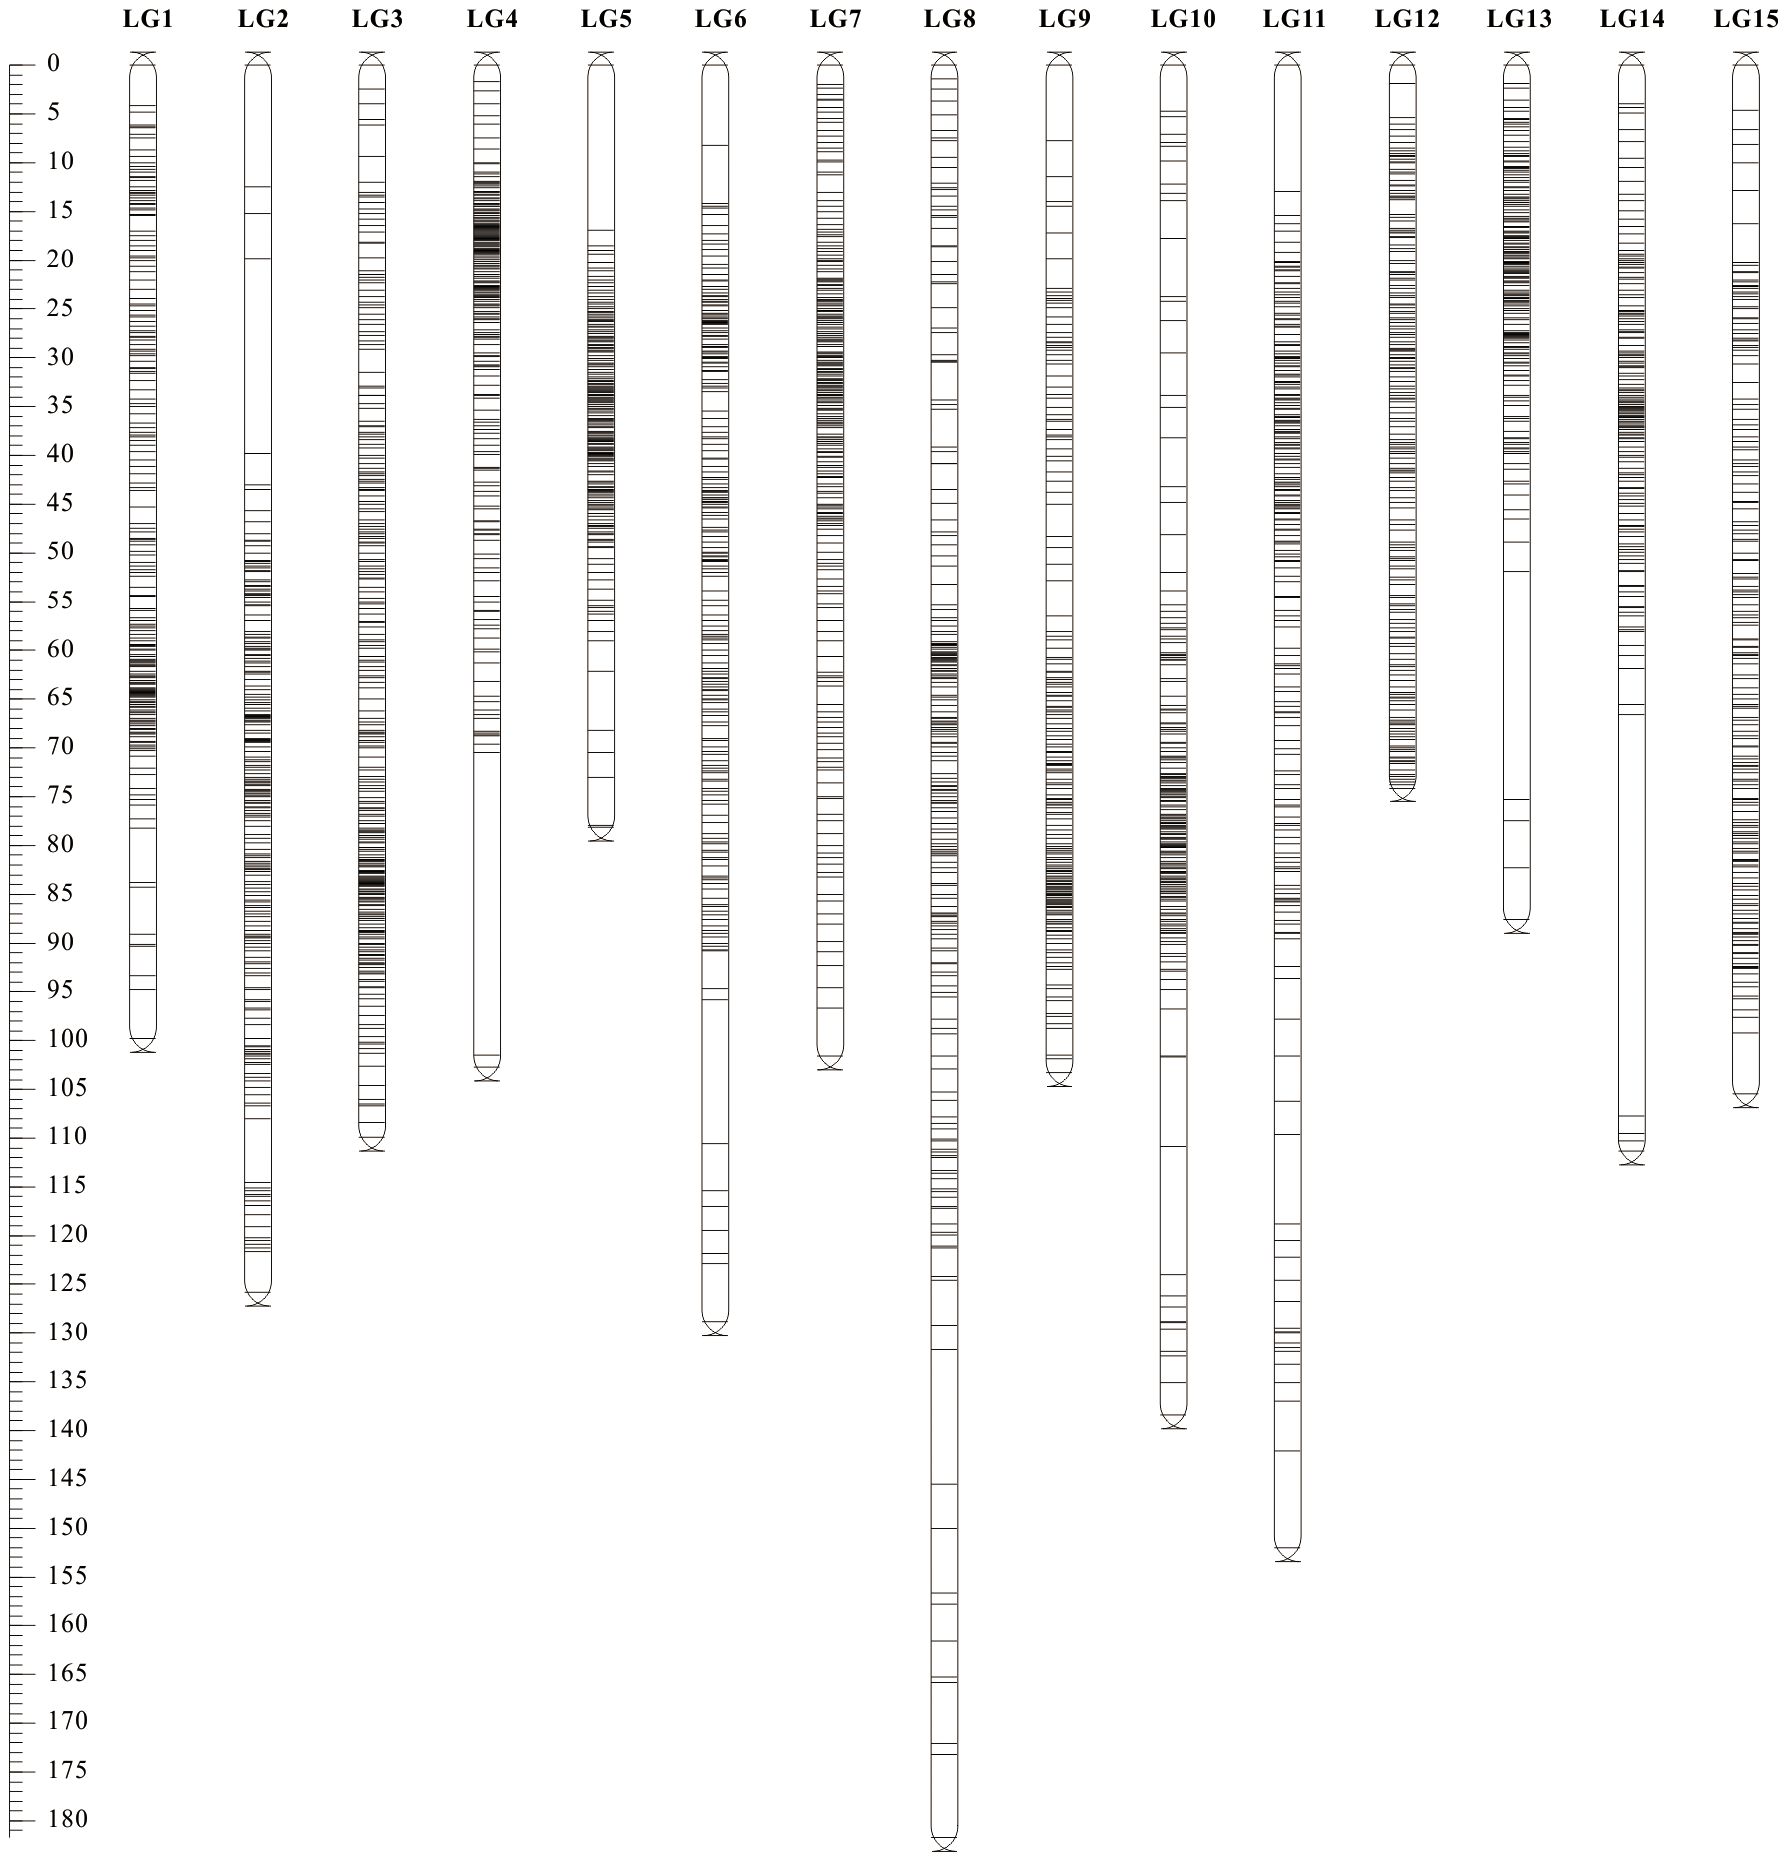
Figure 3. High-density SNP genetic map of longan.
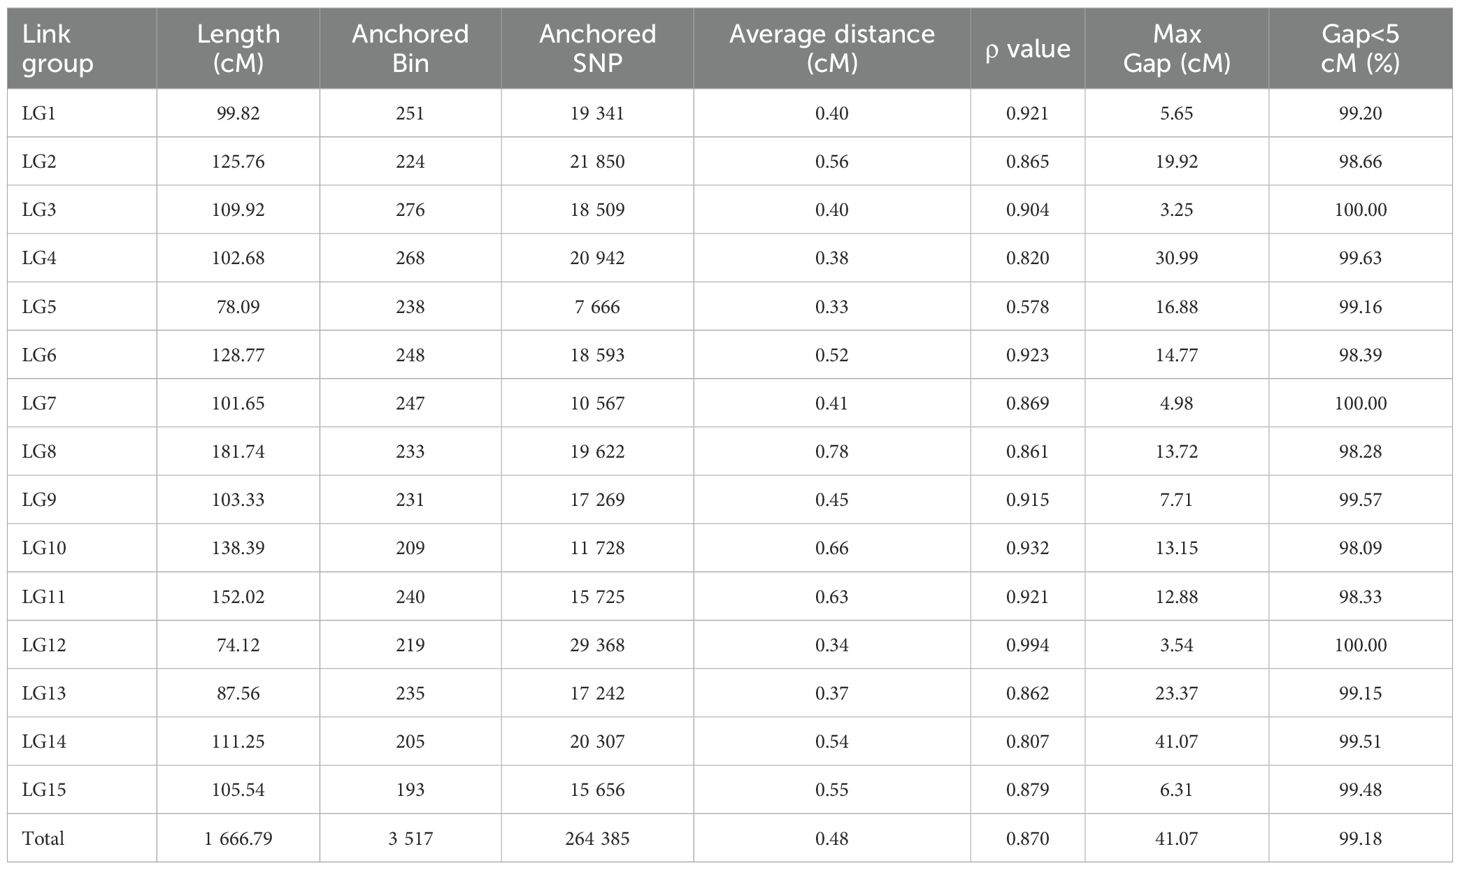
Table 2. SNP genetic map information of longan constructed based on resequencing.
Visualization and evaluation using ALLMAPs software showed that the Spearman’s correlation coefficient (ρ) between the marker order on the genetic map and their corresponding positions on the physical map ranged from 0.578 to 0.994, with an average value of 0.870. Except for LG5, all linkage groups had ρ value greater than 0.8. Seven linkage groups (LG1, LG3, LG6, LG9, LG10, LG11, LG12) exhibited high collinearity with the genomic map in terms of marker order (Table 2; Supplementary Figures S2, S3), all exceeding ρ > 0.9. These results indicate that this linkage map is of high quality and suitable for subsequent QTL analysis.
3.3 Phenotypic data analysis of aroma traits
Genetic variation in progeny of nine aroma-related traits including (E)-2-hexenal (A6), ethyl acetate (E1), ethyl butyrate (E3), ethyl crotonate (E4), ethyl (E)-2-hexenoate (E7), ethanol (AO1), ocimene (M1), linalool (M5), and total ester content (TE) was analyzed. Results showed that all nine traits exhibited quantitative genetic characteristics with continuous and extensive variation (Table 3). Due to the large difference in content between different volatiles and the moderately positive skewness distribution (Z-score > 3), the log2 value was converted and then subjected to normality testing (Table 3). E1, E7, AO1, M1, and TE conformed to normal distributions.
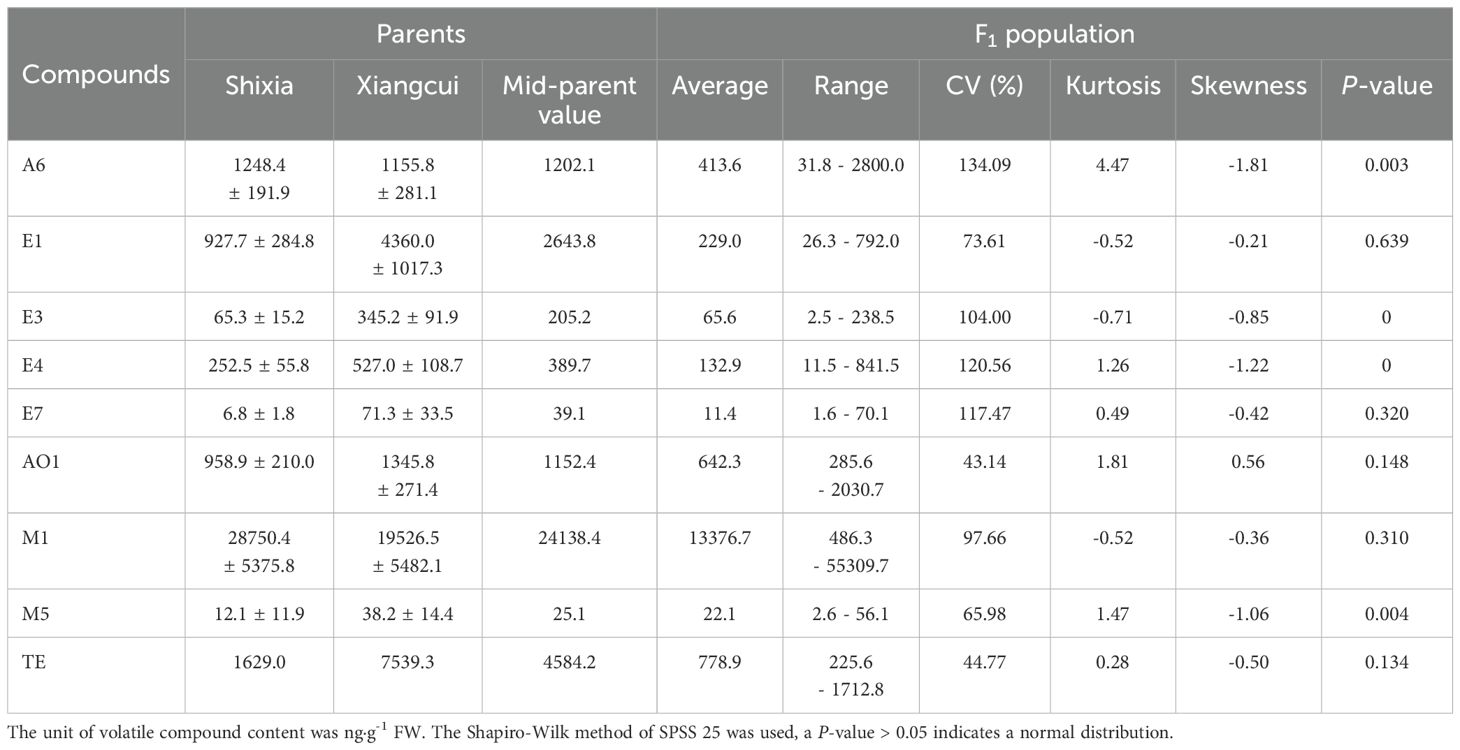
Table 3. Phenotypic statistics of fruit aroma related traits.
3.4 QTL mapping of characteristic aroma compounds
Using the high-density Bin map, 56 QTLs associated with nine aroma traits were identified. These QTLs were unevenly distributed across 11 linkage groups such as LG2, LG4, LG5, with significant enrichment observed on LG7 and LG8 (Table 4; Figure 4).
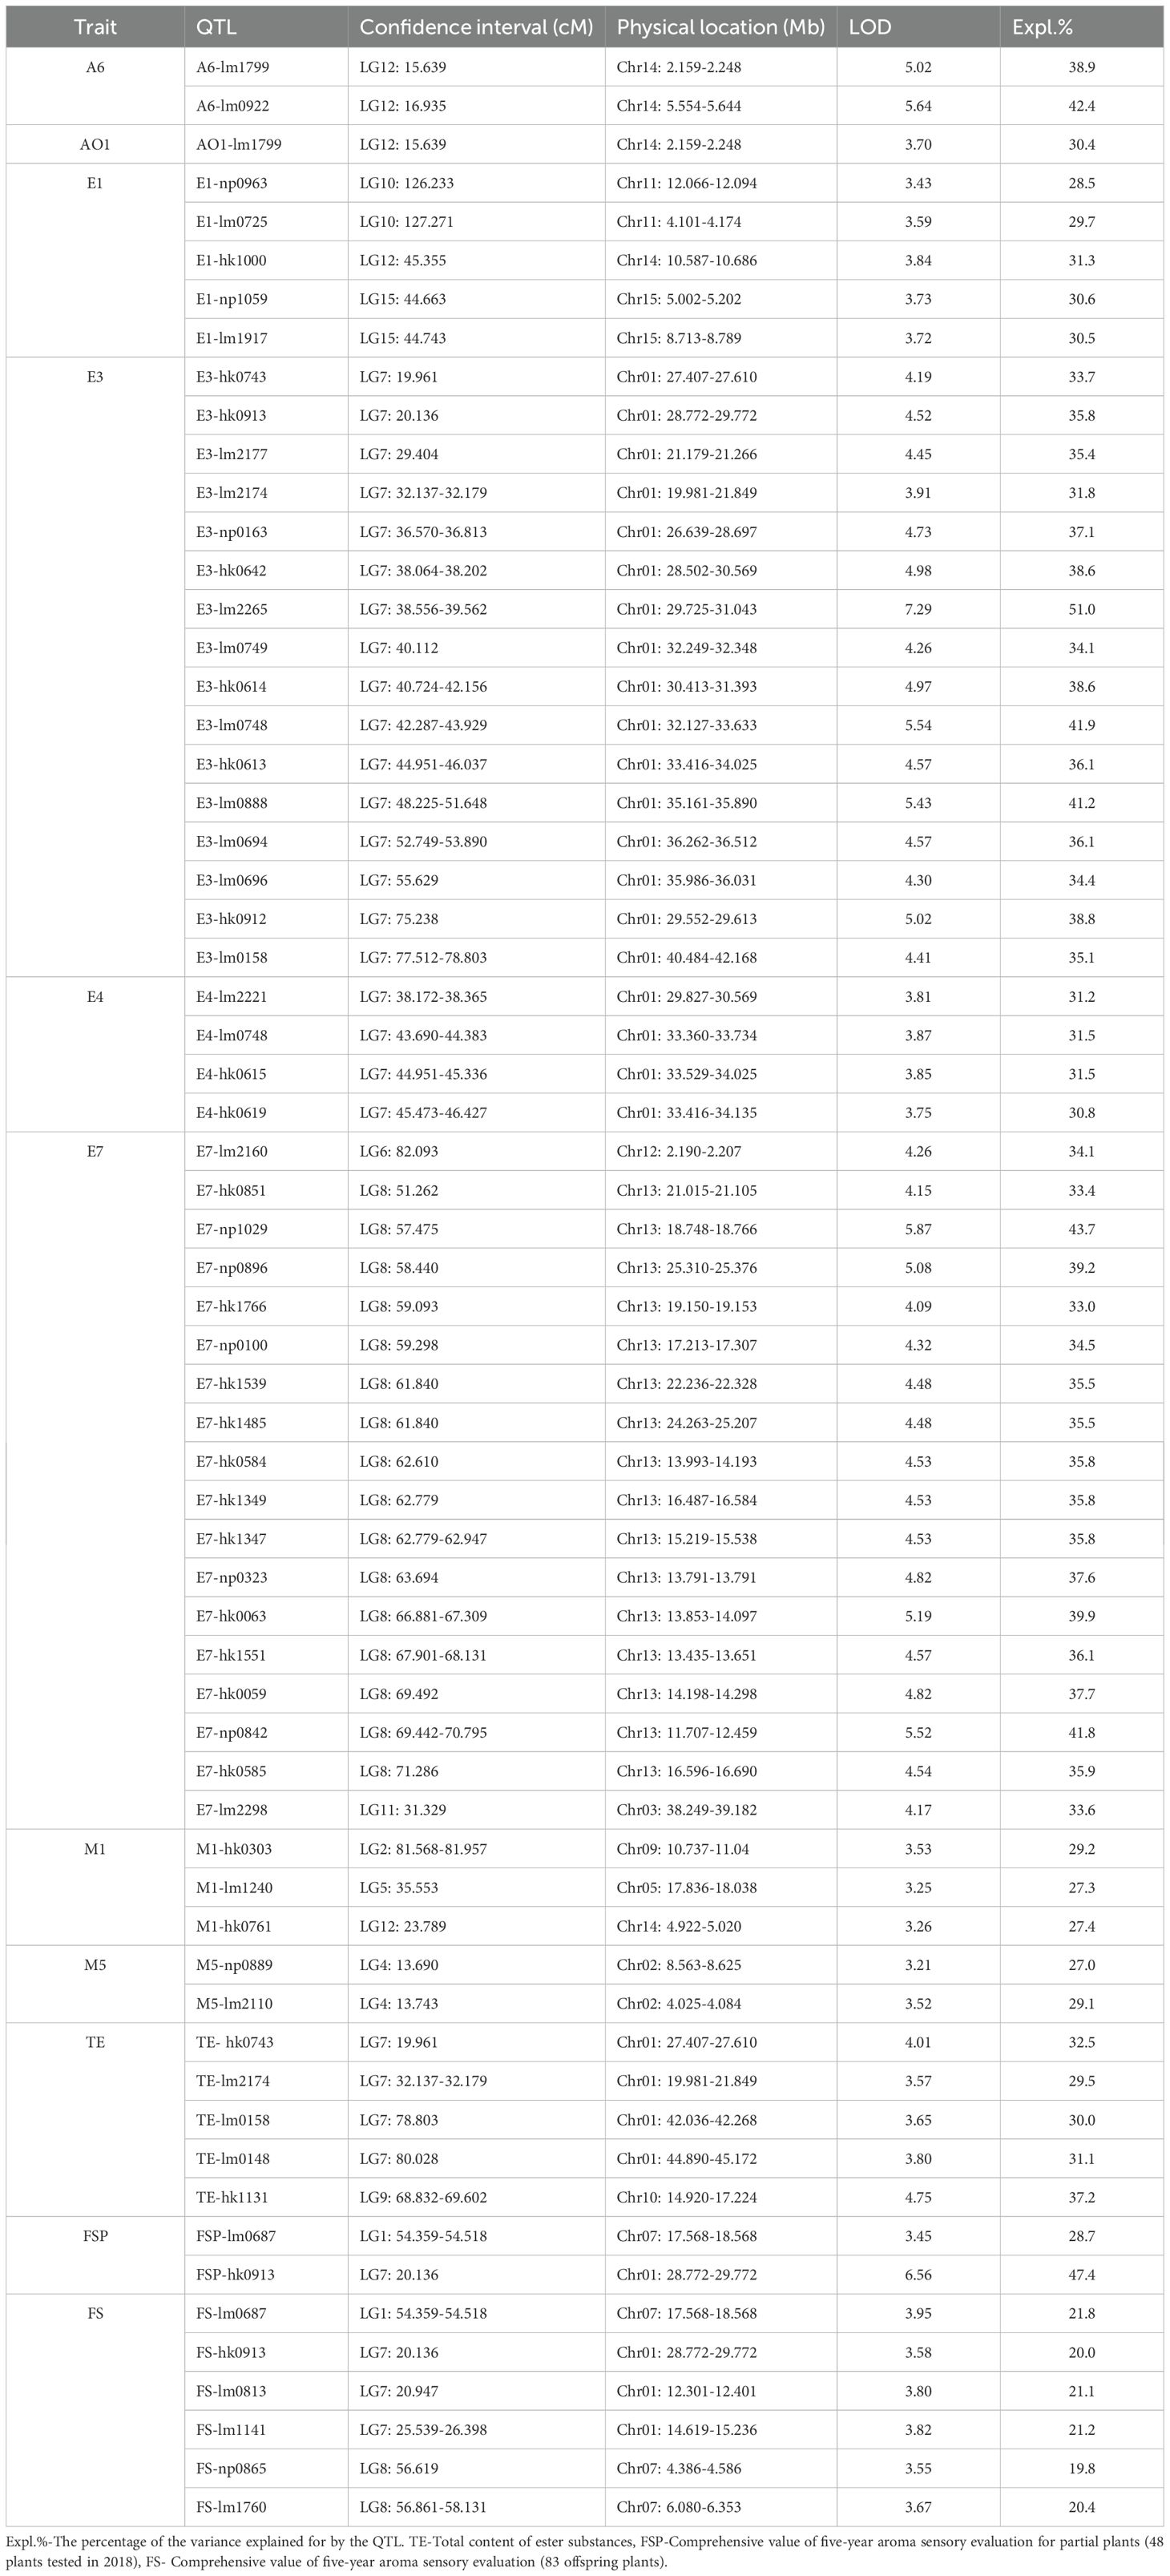
Table 4. QTL mapping results of key aroma compounds on the ‘Shixia×Xiangcui’ linkage map.
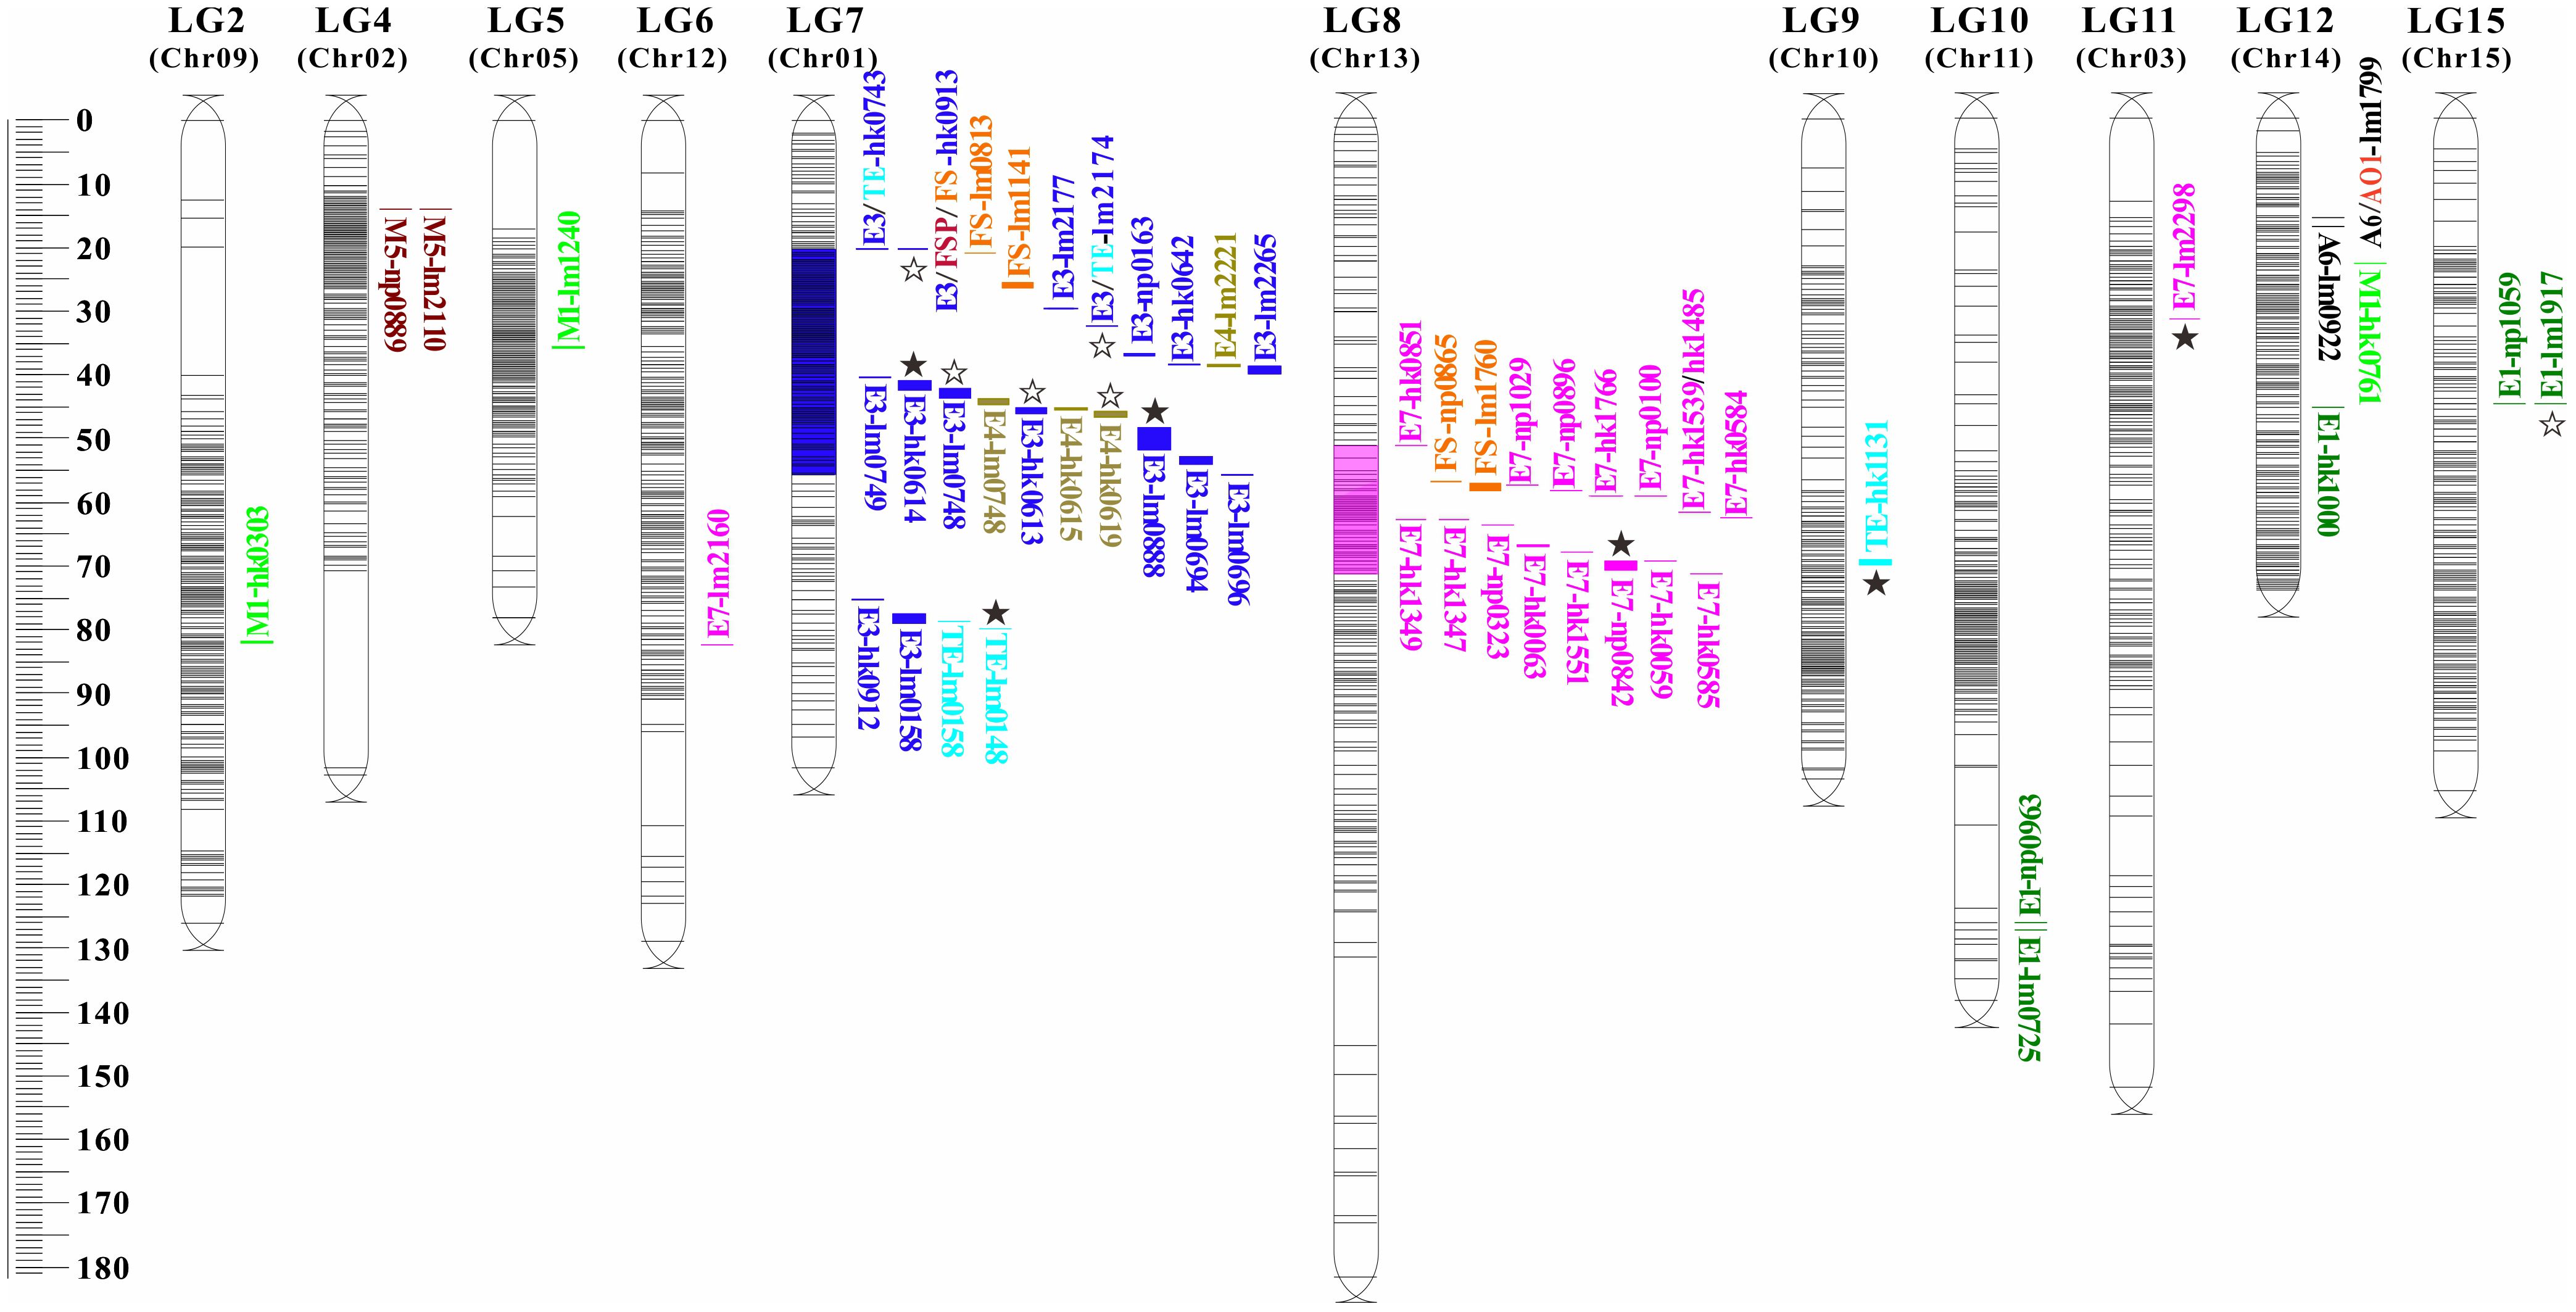
Figure 4. Distribution of QTLs related to characteristic aroma compounds in longan. The QTL loci for traits are named according to Table 3-3. Different colored markers represent different aroma compounds, and the blue and purple red segments labeled on linkage groups (LG) are the loci enrichment regions. The ☆ and ★ represent identified preliminary candidate genes and key candidate genes, respectively.
Two QTLs for (E)-2-hexenal (A6) content were mapped on LG12, both exhibiting LOD scores >5.0 and explaining 38.9%-42.4% of phenotypic variation. One QTLs for ethanol (AO1) content was also detected on LG12 (30.4% PVE). Five QTLs for ethyl acetate (E1) content were localized to LG10, LG12, and LG15 (28.5%-31.3% PVE).
Sixteen QTLs for ethyl butyrate (E3) and four for ethyl crotonate (E4) were all mapped on LG7, and most of them were clustered within the LG7:19.961-55.629 cM region (blue zone, LOD=3.75-7.29, 30.8%-51.0% PVE). Eighteen QTLs for ethyl (E)-2-hexenoate (E7) were mapped on LG6, LG8, and LG11 (33.0%-43.7% PVE), with 16 concentrated in the LG8:51.262-71.286 cM segment (magenta zone). Three QTLs for ocimene (M1) on LG2, LG5, and LG12 explained 27.3%-29.2% PVE. Two adjacent QTLs for linalool (M5) on LG4 explained 27.0%-29.1% PVE. For total ester content (TE), four QTLs on LG7 and one on LG9, explaining 29.5%-37.2% PVE.
Additionally, six of eight QTLs for the 5-year comprehensive value of aroma sensory evaluation were located in the enrichment regions on LG7 and LG8 (Table 4). In summary, seven pleiotropic QTLs were identified across traits, including A6/AO1-lm1799 on LG12, FSP/FS-lm0687 on LG1, and E3/TE-hk0743, E3/FSP/FS-hk0913, E3/TE-lm2174, E3/E4-lm0748, and E3/TE-lm0158 on LG7.
3.5 Pathway enrichment and WGCNA analysis
Within the physical map intervals corresponding to the 56 QTL loci (after deduplication), a total of 1 535 genes were retrieved, with 747 genes retained based on an FPKM value ≥ 0.5. KEGG analysis revealed that 319 genes were assigned to 134 pathways based on their functions (Supplementary Table S3). Among the 14 significantly enriched pathways, four pathways—Butanoate metabolism, Carotenoid biosynthesis, Amino sugar and nucleotide sugar metabolism, Valine, leucine and isoleucine biosynthesis, and Glycine, serine and threonine metabolism—were potentially related to volatile metabolite synthesis in longan fruit (Figure 5A). After filtering the 747 genes for variance in expression levels, WGCNA was performed on the 319 genes. When β=22, the average connectivity approached 0, so this β value was selected to construct the scale-free network (Supplementary Figure S4). The TOM algorithm was used to generate a gene hierarchical clustering tree. Gene modules were partitioned using the dynamic tree cut algorithm, and similar modules were subsequently merged, resulting in 10 final co-expression modules (Figure 5B). The gene count within modules ranged from a maximum of 71 in the purple module to a minimum of 12 in the salmon module.
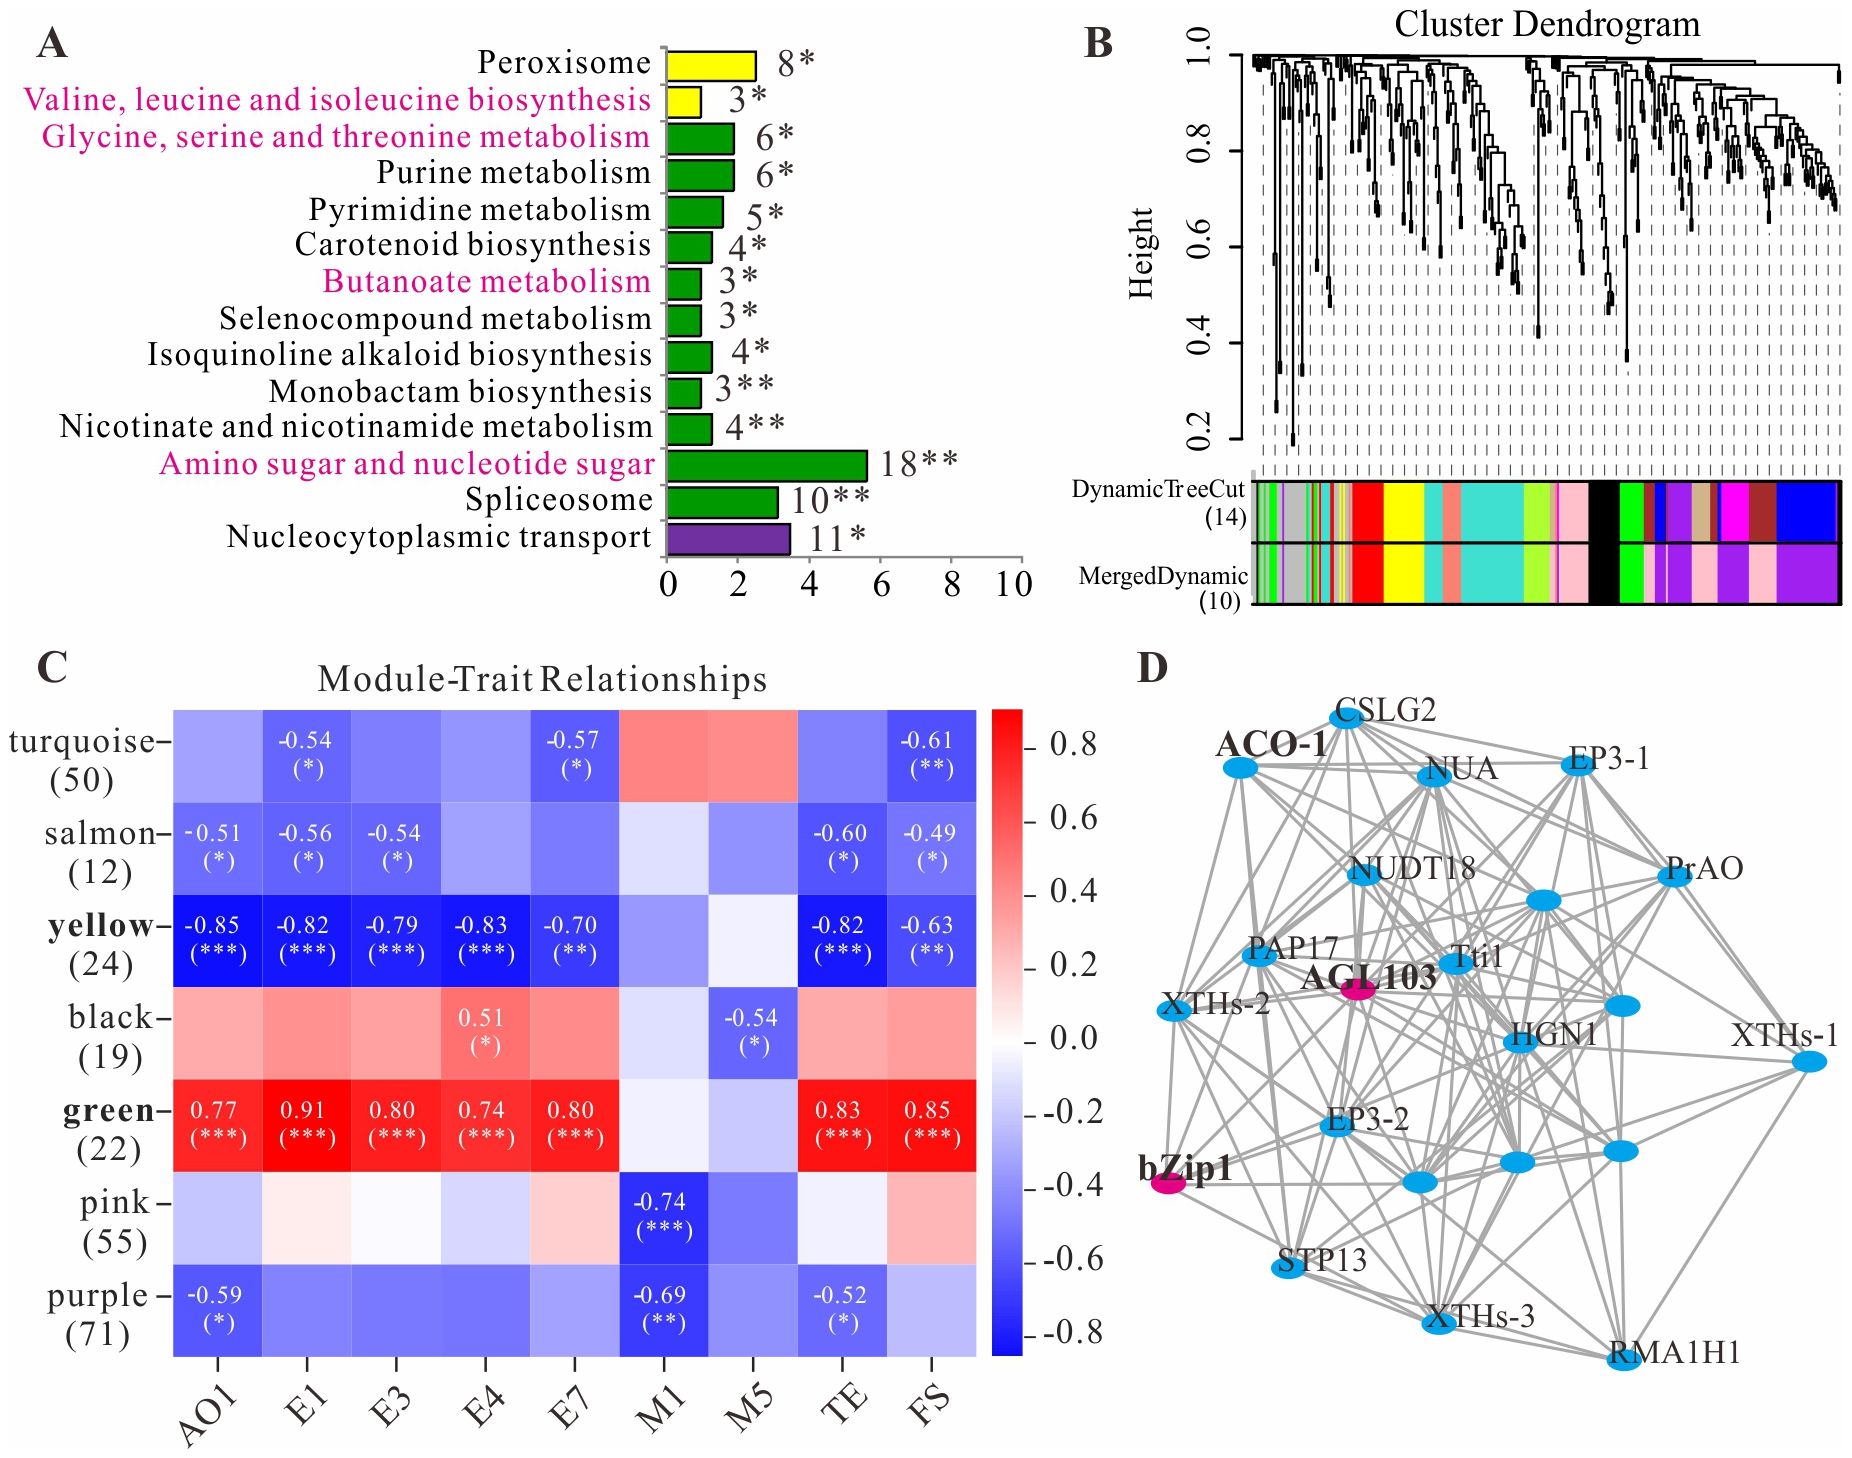
Figure 5. Pathway enrichment and WGCNA analysis of QTL mapping genes. (A), KEGG enrichment pathways. (B), Clustering dendrogram of genes and module division. (C), Heat map of the relationship between modules and aroma traits. (D), Gene co-expression networks within green module. The symbols *, ** and *** indicate statistical significance at P < 0.05, P < 0.01 and P < 0.001, respectively.
An association analysis was conducted between the mapping traits in Table 4 and gene modules (Figure 5C). The results revealed that both the pink and purple modules exhibited a highly significant negative correlation with monoterpene M1 (p<0.01), while the black module showed a significant negative correlation with monoterpene M5 (p<0.05). The green and yellow modules demonstrated highly significant correlations (generally |r|>0.75 and p<0.001) with four straight-chain acetate esters (E1, E3, E4, E7), total ester content (TE), the five-year aroma sensory evaluation value (FS), and ethanol (AO1)—the precursor substrate for acetate ester synthesis. This suggests that these two modules may both harbor common candidate genes regulating the synthesis of multiple aroma compounds. Gene co-expression networks were constructed for each module (Supplementary Figure S5; Supplementary Table S4), identifying genes with high connectivity such as AGL103 (Dil.03g026050.1) and bZip1 (Dil.01g036450.1) in the green module (Figure 5D) and bHLH122 (Dil.13g013320.1) in the yellow module.
3.6 Candidate gene screening and expression pattern validation
Further analysis of correlations between gene expression and characteristic aroma compound contents across 17 developmental stages of 3 longan cultivars, combined with functional relevance assessment, revealed 13 candidate genes significantly or highly significantly associated with aroma synthesis (Table 5; Figure 6; Supplementary Tables S2, S3). These included an S-acyltransferase gene (Dil.15g011360.1) associated with ethyl acetate (E1); six genes linked to ethyl butyrate (E3): RING-H2 zinc finger protein (Dil.01g017920.1), acetolactate synthase (Dil.01g022650.1), endochitinases (Dil.01g024580.1, Dil.01g025280.1), and ACC oxidases (Dil.01g026660.1, Dil.01g026750.1), with endochitinase Dil.01g025280.1 also showing a significant positive correlation with ethyl crotonate (E4); three transcription factors associated with ethyl (E)-2-hexenoate (E7): bHLH122 (Dil.13g013320.1), FAR1 (Dil.13g013360.1), and AGL103 (Dil.03g026050.1); and three genes related to total ester content (TE): RING-H2 zinc finger protein (Dil.01g017920.1), bZip1 (Dil.01g036450.1), and aldo-keto reductase AKRs (Dil.10g007540.1).
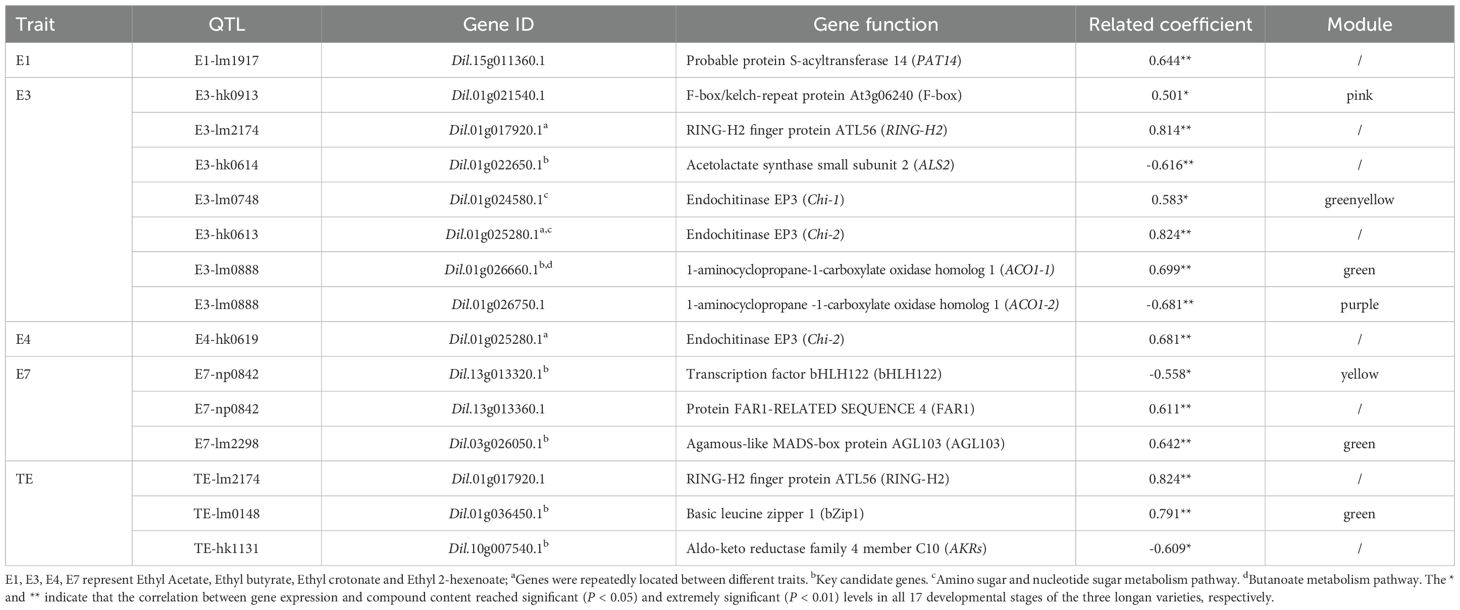
Table 5. 13 candidate gene information related to the synthesis of longan aroma compounds.
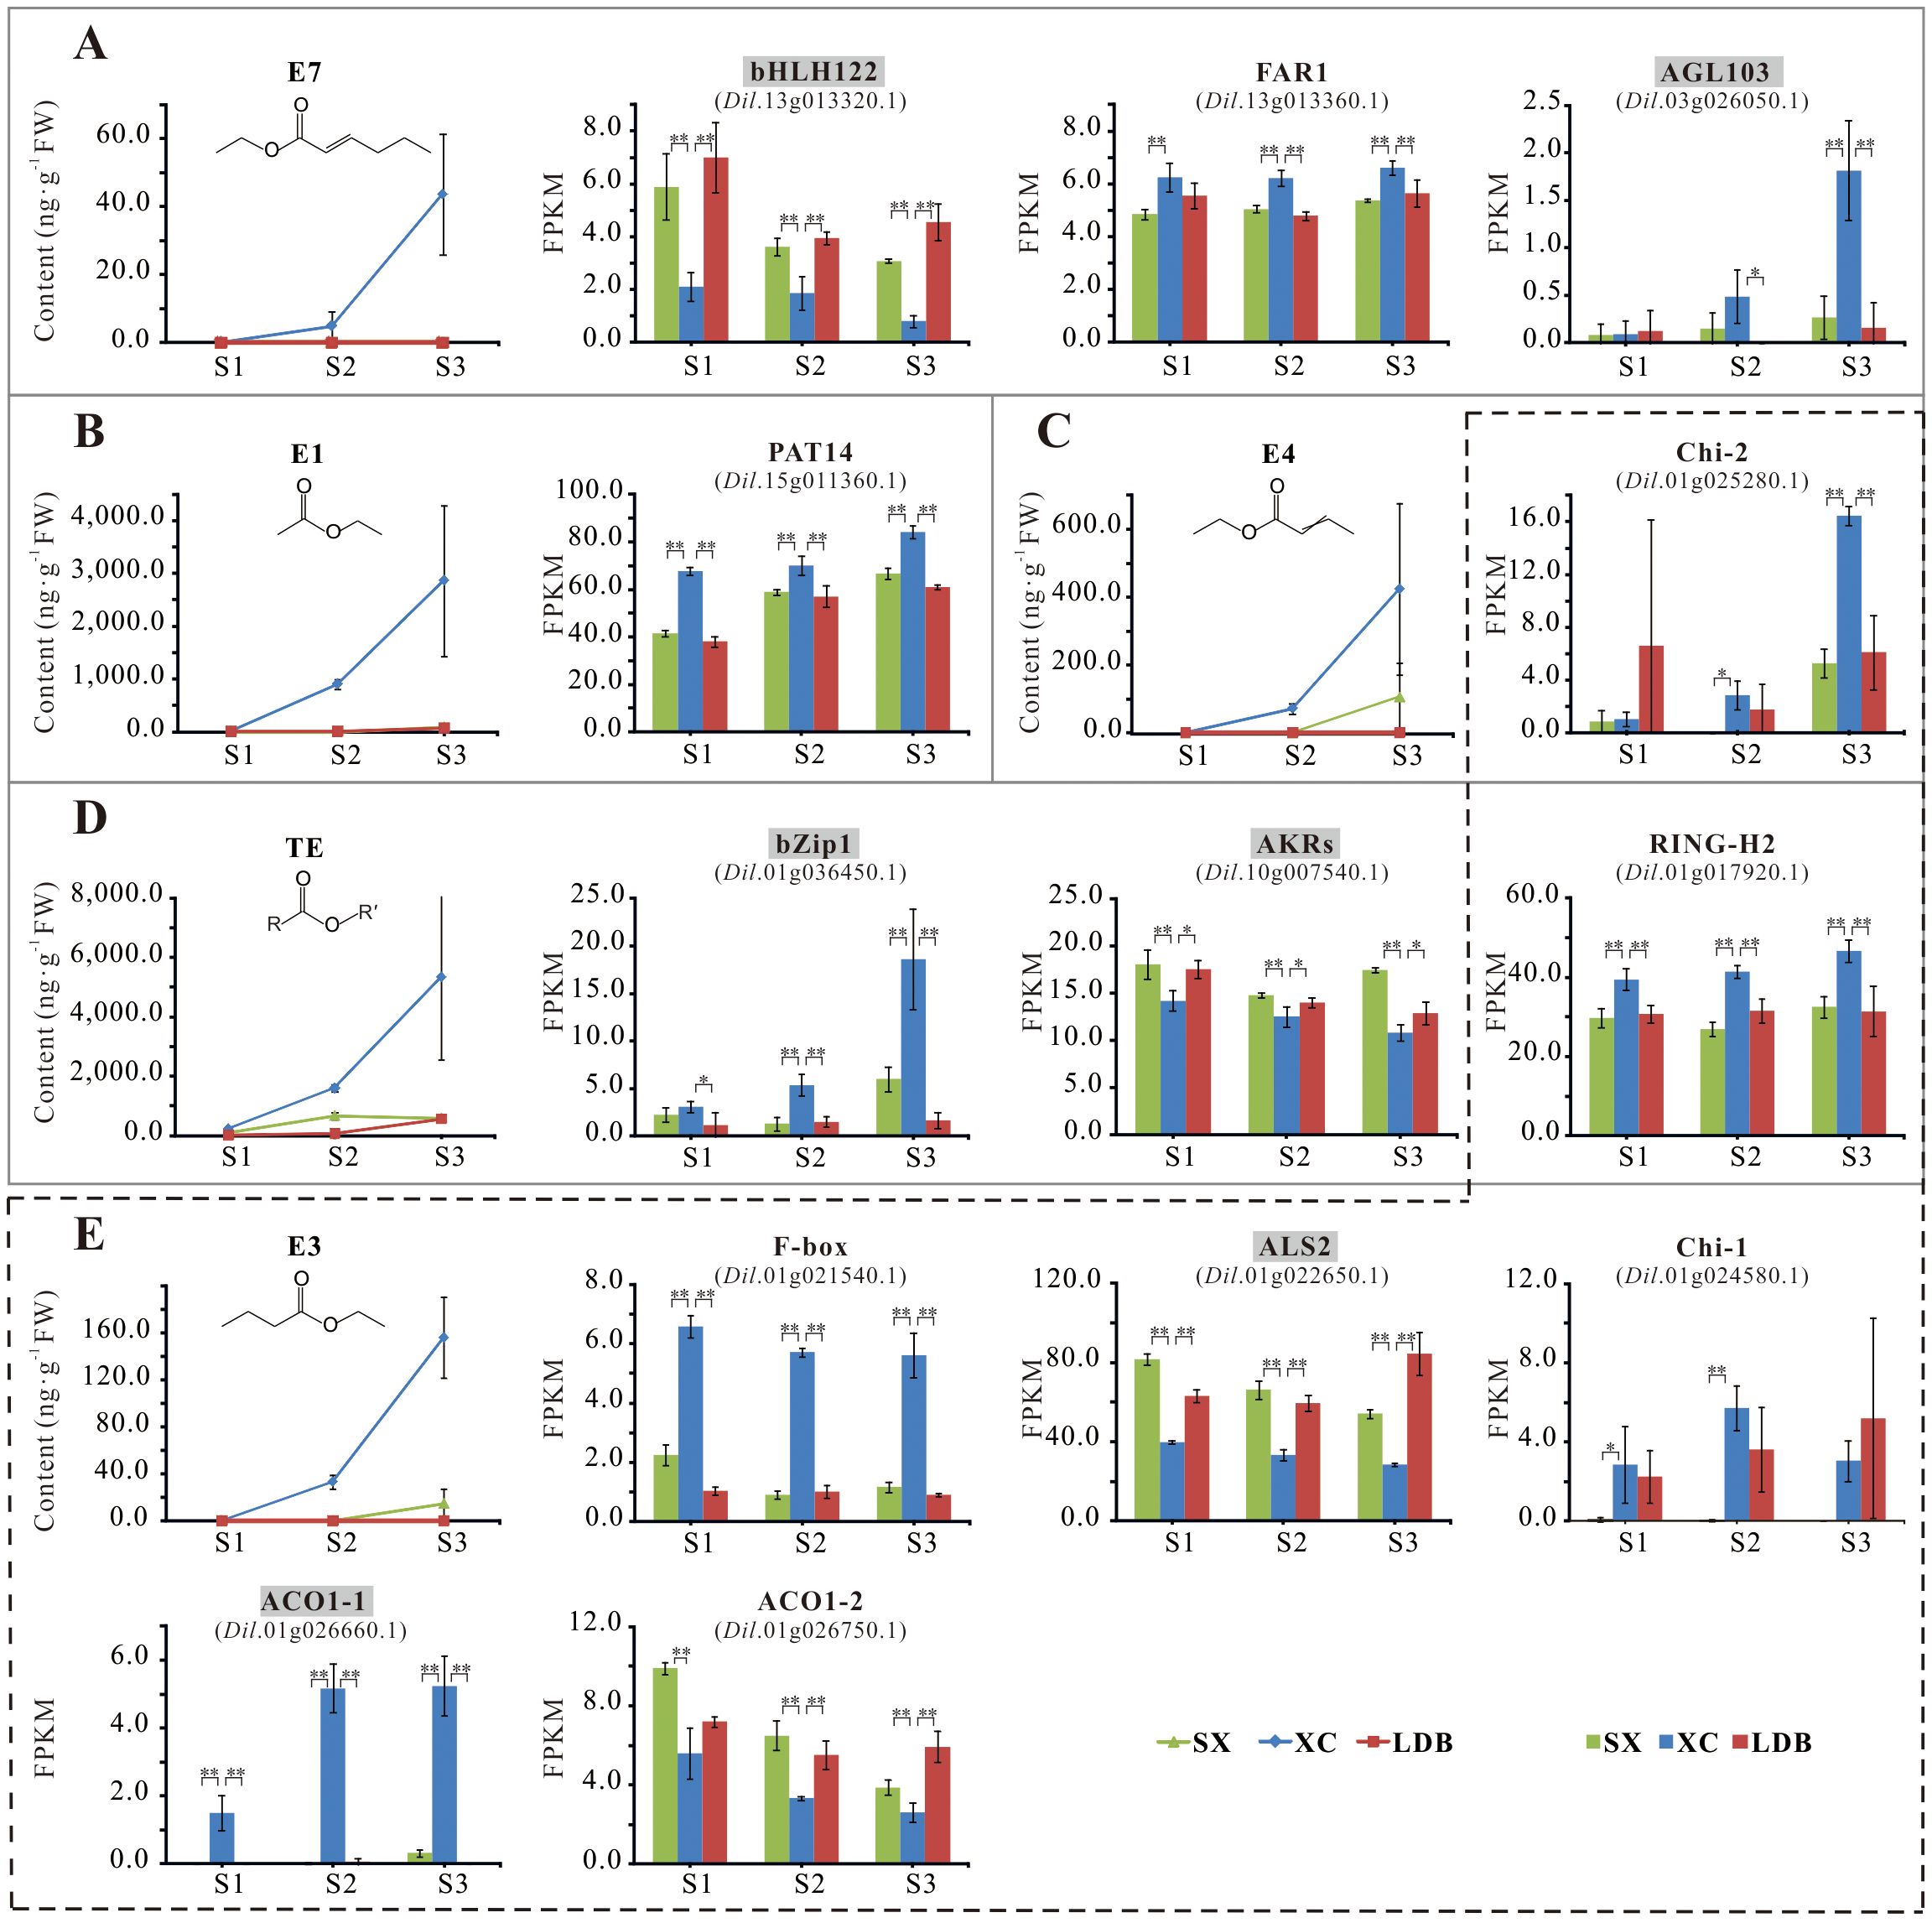
Figure 6. Accumulation of representative aroma compounds and differential expression of 13 candidate genes. (A-E) represents the content of E7, E1, E4, TE, E3, and the expression of candidate genes related to their synthesis, respectively. SX, XC, and LDB represent Shixia, Xiangcui, and Lidongben, respectively, while S1-S3 represent different stages of fruit development. FPKM values are calculated based on RNA-seq data from three biological replicates at each developmental stage. The names of key candidate genes are filled in gray. The * and ** represent significant (P < 0.05) and extremely significant (P < 0.01) differences, respectively.
During the critical S1-S3 stages of aroma formation in longan fruit (aroma profile begins to emerge at S2 stage in the strong-aroma cultivar, and the interval between adjacent stages was 10d), differential accumulation of characteristic aroma compounds (E1, E3, E4, E7) occurred alongside corresponding expression changes in candidate genes (Figure 6). At stage S3, endochitinase Chi-2 (Dil.01g025280.1) expression in the strong-aroma cultivar ‘Xiangcui’ (XC) was approximately triple that of non-aromatic cultivars SX and LDB, and E1 content in XC was 35-40 times higher. Expression of the ALS2 (Dil.01g022650.1) and bHLH122 (Dil.13g013320.1) decreased progressively during fruit development, with their expression in XC was approximately half and one-third of that in SX and LDB at S3, respectively. Concurrently, ethyl butyrate (E3) and ethyl (E)-2-hexenoate (E7) levels were significantly higher in XC.
Further combined with LOD value, Expl. % value, locus overlap stability, and direct correlation degree of gene function, the above 13 candidates genes related to the five aroma compound was re-evaluated. Six genes were ultimately identified as key candidate genes, including AKRs, ALS2, ACO1-1, transcription factors bHLH122, AGL103, and bZip1. These exhibited LOD scores of 3.80–5.52 and Expl.% values of 31.1%–41.8%.
4 Discussion
4.1 Obtaining and evaluating high-quality genetic maps
High-quality genetic linkage maps are fundamental for precise QTL mapping, and its evaluation indicators mainly include marker density, saturation, and ordering accuracy. Traditional genetic maps constructed using first- and second-generation markers (RFLP, AFLP, RAPD, SSR) typically contain only several hundred markers. These are labor-intensive to develop and suffer from low marker density, large intervals, and limited chromosomal position matching, resulting in poor candidate gene localization.
High-throughput SNP detection methods based on reduced-representation genome sequencing, whole-genome resequencing, or SNP arrays have become mainstream for building high-density genetic maps. Such SNP maps contain thousands or tens of thousands of markers, significantly improving density and saturation (Li P. et al., 2023). However, intervals ≥5 cM or 10 cM may persist, and generally ≤1 cM is considered suitable for gene mapping. Strategies to reduce intervals include combining second- and third-generation markers, expanding population size to increase recombination events, and constructing secondary populations for fine-mapping. Of course, if the marker intervals reside in genomic regions with identical parental backgrounds (preventing segregation in progeny) or assembly gaps, alternative approaches are required. Additionally, while marker order should theoretically align with physical positions, several factors can disrupt collinearity: different methods for dividing the marker into linkage group (according to LOD thresholds of linkage relationship or chromosomal origins), insufficient SNPs/Bin markers within contigs for orientation determination, chromosomal inversions, and regional variation in recombination rates (Chen Y. Y. et al., 2022).
This study constructed the first high-density Bin genetic map of longan using whole-genome resequencing of a ‘Shixia × Xiangcui’ population. The map comprises 15 linkage groups anchored by 3 517 Bin markers (representing 264 385 SNPs), spanning 1 666.79 cM at an average marker interval of 0.48 cM, demonstrating high density and uniform distribution. The numbers of mapped markers in this study far exceeded those in previous studies. For example, the framework map developed by Guo et al. (Guo et al., 2011) contained only 243 and 184 markers for the paternal and maternal parents, respectively, while exhibiting inconsistent linkage group numbers (19 and 20) relative to the haploid chromosome number (n=15). Although the map constructed by Jue et al. (Jue et al., 2021) using RAD-seq featured linkage groups matching the haploid chromosome count and with an average marker interval of 0.36 cM, it contained only 8 014 SNPs. The limited occurrence of gaps >5 cM (0.82%) in our map may stem from insufficient population size or localization within non-recombinant regions of the genome (Chen Y. Y. et al., 2022). Collinearity analysis revealed an average Spearman’s ρ of 0.870 between genetic and physical maps (Table 2), with ρ > 0.9 for LG1, 3, 6, 9-12 confirming consistent marker order. However, LG5 showed lower collinearity (ρ = 0.578), potentially due to its fewer SNPs (7 666 markers) reducing recombination events—which may compromise ordering accuracy. Alternative explanations include misassembled contigs or chromosomal translocations/inversions arising from divergent genetic backgrounds of the parental cultivars (Huang et al., 2020). Future efforts could employ F2 populations to increase recombination frequency and further improve map resolution.
4.2 Genome-wide distribution of QTLs for longan fruit aroma
This study represents the first quantitative trait locus (QTL) analysis of fruit aroma compounds in longan. Leveraging the high-density Bin map, 56 QTLs related to 9 compounds such as (E)-2-hexenal (A6), ethyl acetate (E1), ethanol (AO1) were identified in the whole genome of longan (Table 4). These QTLs exhibited LOD scores of 3.21–7.29 and explained phenotypic variation of 19.8%–51.0%. These QTLs were unevenly distributed across 11 linkage groups. Notably, two enriched regions—LG7: hk0743-lm0696 and LG8: hk0851-hk0585—harbored 36 QTLs, which were QTL hotspots controlling the synthesis of ethyl butanoate (E3), ethyl crotonate (E4), and ethyl (E)-2-hexenoate (E7). This phenomenon of QTLs clustering for structurally similarity or same biosynthetic pathway of volatile compounds has been reported in other fruit trees. For instance, Koyama et al. (Koyama et al., 2022) detected a QTL-rich region associated with 14 monoterpene contents in grape, which was located at the top of LG5 on the paternal and consensus maps and the QTLs were closely overlapped. Yang et al. (2023) detected 87 QTLs related to 15 volatiles on 14 linkage groups of apple. Among them, seven QTLs associated with four ester compounds were identified and confirmed on the same region of LG6.
The fruit aroma profile is complex and susceptible to maturity, light, temperature, soil and other factors (Sánchez et al., 2014); thus, multi-year assessment is essential. We conducted longitudinal evaluations of aroma traits in the ‘Shixia × Xiangcui’ population, collecting sensory evaluation data from 83 individuals across five years (2012–2015, 2018) and volatile compound detection from 48 individuals in 2018. These datasets were integrated to cross-validate QTL positions for enhanced accuracy. From the results, six of the eight QTLs for the five-year integrated sensory traits (FSP/FS) fell in two enrichment regions of the characteristic aroma compound traits. In addition, seven pleiotropic QTLs were identified, which did not include some partially overlapping QTLs. This co-localization suggests shared genetic regulation of closely related aroma compounds, such as ethyl butyrate (E3), ethyl crotonate (E4), and total esters content (TE). Collectively, these findings demonstrate robust reliability and stability of the mapped QTLs.
4.3 Key genes regulating ester aroma biosynthesis in longan
Ketoreductase (KRED), a member of the oxidoreductase family, catalyzes the reversible conversion between aldehydes/ketones and alcohols using coenzyme NAD(H) or NADP(H). KREDs is mainly divided into three groups: short-chain dehydrogenases/reductases (SDRs), medium-chain dehydrogenases/reductases (MDRs), and aldo-keto reductases (AKRs). While sharing similar catalytic functions, they exhibit structural and functional distinctions. Notably, the MDR family contains alcohol dehydrogenases (ADHs) (Persson et al., 2008). In this study, an AKRs gene (SwissProt-annotated) showing significant negative correlation with total ester content was identified at the LG9 TE-hk1131 locus, but it was annotated as an ADH enzyme (EC 1.1.1.2) that performs the same function in the KEGG database. We thus hypothesize it primarily catalyzes the conversion of ethanol (an important substrate for ethyl ester synthesis) to acetaldehyde in longan fruit: Ethanol + NADP+ ⇌ Acetaldehyde + NADPH + H+. Both AKRs and ADHs exhibit substrate specificity. For example, the enzyme kinetic analysis of grape VvAdh2 and VvAdh3 revealed differential binding affinities for ethanol versus acetaldehyde (Tesniere and Verries, 2000).
Acetolactate synthase (ALS, EC 2.2.1.6), also termed acetohydroxyacid synthase, comprises distinct large and small subunits (Liu et al., 2017). Here, the ALS small subunit ALS2 demonstrated a highly significant negative correlation with ethyl butyrate at the LG7 E3-hk0614 locus. Within plant butanoate metabolism (map00650), ALS catalyzes the first committed step in branched-chain amino acid synthesis, efficiently converting pyruvate to (S)-2-acetolactate. Alternatively, pyruvate undergoes oxidative decarboxylation to acetyl-CoA, which can be further converted to butanoyl-CoA—a precursor for ethyl butyrate synthesis via alcohol acyltransferase (AAT). We propose that ALS2 activity redirects pyruvate flux toward amino acid biosynthesis, thereby reducing ethyl butyrate accumulation.
ACC oxidase (ACO) and ACC synthase (ACS) are pivotal enzymes in ethylene biosynthesis. Ethylene-mediated aroma synthesis has received considerable attention. In ‘Fuji’ apple, ethylene release was positively correlated with total aroma content during cold storage, in which the ethyl butyrate and ethyl caproate were main volatile components (Qi et al., 2020). Defilippi et al. (Defilippi et al., 2004) reported that the esters biosynthesis in apple ACS/ACO gene-suppressed lines and fruits treated with 1-methylcyclopropene (1-MCP) was significantly reduced, and speculated that AAT enzyme gene was regulated by ethylene. Similarly, ethylene release could not be detected in the fruit of ACO-antisense apple plant, yet exogenous ethylene significantly promoted the production of volatile compounds such as esters and terpenes (Schaffer et al., 2007). Although non-climacteric fruits generate minimal ethylene, emerging evidence implicates ethylene in their ripening (Jiang et al., 2011). We identified ACO1-1 at LG7 E3-lm0888 locus, exhibiting strong positive correlation with ethyl butyrate and cultivar-specific expression in aromatic varieties. Notably, this locus harbors a tandem cluster of 16 ACO genes—mostly negatively correlated with ethyl butyrate—suggesting specialized roles in aroma development of non-climacteric longan. Furthermore, we discovered a tandem cluster of 16 ACO genes at this locus, most negatively correlated with ethyl butyrate content. Their specific roles in aroma formation in non-climacteric longan fruits are worthy of attention.
Transcriptional regulation of fruit ester biosynthesis, primarily through LOX pathway, involves MADS-box, bHLH, bZip, NAC and so on. Tomato MADS-box RIN directly regulates TomloxC, ADH2, and HPL, and rin mutants show reduced hexanal and (E)-2-hexenal during ripening (Qin et al., 2012). Apple MdMADS24 activates MdLOX1a, enhancing ester accumulation in calli (Yue, 2020). Pear PubHLH61, PuMYB91, and PuNAC100-like synergistically positively regulate PuLOX3 and PuAAT, thereby mediating the aroma of ‘Nanguo’ pear during cold storage (Luo, 2022). Banana MabZip4/5 directly activates BaAAT promoters, with reduced expression diminishing aroma under refrigeration (Guo et al., 2018). In this study, bHLH122 and MADS-box AGL103 were identified at LG8:E7-np0842 and LG11:E7-lm2298 sites, which were significantly negatively correlated and positively correlated with ethyl (E)-2-hexenoate, respectively; And bZip1 at LG7:TE-lm0148 demonstrated significant positive correlation with the total content of esters. In our previous transcriptome analysis results, AGL103 and bZip1 were also identified as core transcription factors, which were significantly positively correlated 12 straight-chain esters including ethyl (E)-2-hexenoate (to be published separately).
Additional candidate genes were identified (Table 5), including S-acyltransferase PAT14 (protein palmitoylation) (Liu et al., 2024), RING-H2 zinc finger protein [ubiquitin-mediated degradation (Chen et al., 2022)], endochitinases Chi-1/-2 (β-1,4-glycosidic bond hydrolysis) (Gong et al., 2019), F-box protein (transcription factor specificity modulation) (Rieu et al., 2023), and FAR1 transcription factor (fruit development regulation) (Chen et al., 2021). These genes may indirectly influence aroma accumulation.
5 Conclusions
A first high-density Bin genetic map for longan was constructed using whole-genome resequencing, comprising 15 linkage groups with 3 517 Bin markers (264 385 SNPs). Spanning a total length of 1 666.79 cM, the map features an average marker interval of 0.48 cM, exceptional continuity (99.18% gaps <5 cM) and high collinearity (mean ρ=0.870). We mapped 56 QTLs associated with aroma trait and identified six key candidate genes regulating characteristic ester biosynthesis: aldo-keto reductase AKRs, acetolactate synthase small subunit ALS2, ACC oxidase ACO1-1, and transcription factors bHLH122, AGL103, and bZip1. These results are helpful to further understand the fruit aroma formation and provide valuable guidance for directed breeding of longan.
Data availability statement
The datasets presented in this study can be found in online repositories. The names of the repository/repositories and accession number(s) can be found in the article/Supplementary Material.
Author contributions
WH: Conceptualization, Writing – review & editing, Methodology, Funding acquisition, Writing – original draft. QZ: Data curation, Writing – review & editing. CD: Data curation, Writing – review & editing. QX: Writing – review & editing, Investigation. JJ: Methodology, Writing – review & editing. XC: Writing – review & editing, Investigation. JL: Conceptualization, Writing – review & editing. JZ: Writing – review & editing, Conceptualization, Methodology. SZ: Writing – review & editing, Conceptualization, Funding acquisition.
Funding
The author(s) declare that financial support was received for the research and/or publication of this article. This research was funded by Basic Research Project of Provincial Public Welfare Research Institutes (2021R1028009), Natural Science Foundation of Fujian Province (2023J01370), Research Project of Fujian Academy of Agricultural Sciences (2023, YCZX202504), China Agriculture Research System of MOF and MARA (CARS-32-06) and Fujian Science and Technology Major Project (2024NZ029029).
Acknowledgments
The authors would like to acknowledge Mengfan Qin for assisting in data processing and map construction.
Conflict of interest
The authors declare that the research was conducted in the absence of any commercial or financial relationships that could be construed as a potential conflict of interest.
Generative AI statement
The author(s) declare that no Generative AI was used in the creation of this manuscript.
Publisher’s note
All claims expressed in this article are solely those of the authors and do not necessarily represent those of their affiliated organizations, or those of the publisher, the editors and the reviewers. Any product that may be evaluated in this article, or claim that may be made by its manufacturer, is not guaranteed or endorsed by the publisher.
Supplementary material
The Supplementary Material for this article can be found online at: https://www.frontiersin.org/articles/10.3389/fpls.2025.1642854/full#supplementary-material
References
Amarawathi, Y., Singh, R., Singh, A. K., and Singh, V. P. (2008). Mapping of quantitative trait loci for basmati quality traits in rice (Oryza sativa L.). Mol. Breed. 21, 49–65. doi: 10.1007/s11032-007-9108-8
Bolger, A. M., Lohse, M., and Usadel, B. (2014). Trimmomatic: a flexible trimmer for Illumina sequence data. Bioinformatics 30, 2114–2120. doi: 10.1093/bioinformatics/btu170
Chen, Y., Deng, J., Chen, J. Y., Zeng, T., Yu, T. T., Huang, Q. H., et al. (2021). Genome-wide identification and expression analysis of FAR1/FHY3 transcription factor family in tomato. Plant Physiol. J. 57, 1983–1995. doi: 10.13592/j.cnki.ppj.2021.0061
Chen, Y. Y., Schreiber, M., Bayer, M. M., Dawson, I. K., Hedley, P. E., Lei, L., et al. (2022). The evolutionary patterns of barley pericentromeric chromosome regions. as shaped by linkage disequilibrium and domestication. Plant J. 111, 1580–1594. doi: 10.1111/tpj.15908
Chen, S. J., Xu, K., Kong, D. Y., Wu, L. Y., Chen, Q., Ma, X. S., et al. (2022). Ubiquitin ligase OsRINGzf1 regulates drought resistance by controlling the turnover of OsPIP2;1. Plant Biotechnol. J. 20, 1743–1755. doi: 10.1111/pbi.13857
Danecek, P., Auton, A., Abecasis, G., Albers, C. A., Banks, E., DePristo, M. A., et al. (2011). The variant call format and VCFtools. Bioinformatics 27, 2156–2158. doi: 10.1093/bioinformatics/btr330
Defilippi, B. G., Kader, A. A., and Dandekar, A. M. (2004). Apple aroma: alcohol acyltransferase.; a rate limiting step for ester biosynthesis, is regulated by ethylene. Plant Sci. 168, 1199–1210. doi: 10.1016/j.plantsci.2004.12.018
Di Pierro, E. A., GianFranceschi, L., Di Guardo, M., Koehorst-van Putten, H. J., Kruisselbrink, J. W., Longhi, S., et al. (2016). A high-density.; multi-parental SNP genetic map on apple validates a new mapping approach for outcrossing species. Horticult. Res. 3, 16057. doi: 10.1038/hortres.2016.57
Eduardo, I., Chietera, G., Pirona, R., Pacheco, I., Troggio, M., Banchi, E., et al. (2013). Genetic dissection of aroma volatile compounds from the essential oil of peach fruit: QTL analysis and identification of candidate genes using dense SNP maps. Tree Genet. Genomes 9, 189–204. doi: 10.1007/s11295-012-0546-z
Gong, K. L., Chen, S. H., Ji, X. C., Lin, Y. R., and Zhang, Q. (2019). The research progress of plant chitinases. Mol. Plant Breed. 17, 6840–6849. doi: 10.13271/j.mpb.017.006840
Guo, Y. F., Zhang, Y. L., Shan, W., Cai, Y. J., Liang, S. M., Chen, J. Y., et al. (2018). Identification of two transcriptional activators MabZIP4/5 in controlling aroma biosynthetic genes during banana ripening. J. Agric. Food Chem. 66, 6142–6150. doi: 10.1021/acs.jafc.8b01435
Guo, Y. S., Zhao, Y. H., Fu, J. X., Huang, S. S., Wang, Y., Lu, B. B., et al. (2012). Identification of stable QTLs related to trunk girth in Longan. Sci. Horticult. 134, 248–252. doi: 10.1016/j.scienta.2011.11.007
Guo, Y. S., Zhao, Y. H., and Liu, C. M. (2011). QTLs analysis of several traits in Longan. Biotechnol. Biotechnol. Equip. 25, 2203–2209. doi: 10.5504/bbeq.2011.0014
Guo, Y. S., Zhao, Y. H., Liu, C. J., Reng, P. F., Huang, T. L., Fu, J. X., et al. (2009). Construction of a molecular genetic map for Longan based on RAPD, ISSR, SRAP and AFLP markers. Acta Hortic. Sin. 36, 655–662. doi: 10.16420/j.issn.0513-353x.2009.05.006
Hu, W. S., Huang, A. P., Jiang, F., Jiang, J. M., Chen, X. P., and Zheng, S. Q. (2015). Identification and genetic diversity of reciprocal hybrids in longan (Dimocarpus longan) by SSR. Acta Hortic. Sin. 42, 1899–1908. doi: 10.16420/j.issn.0513-353x.2015-0131
Huang, G., Wu, Z., Percy, R. G., Bai, M. Z., Li, Y., Frelichowski, J. E., et al. (2020). Genome sequence of Gossypium herbaceum and genome updates of Gossypium arboreum and Gossypium hirsutum provide insights into cotton A-genome evolution. Nat. Genet. 52, 516–524. doi: 10.1038/s41588-020-0607-4
Jiang, T. M., Yin, X. R., Wang, P., Sun, C. D., Xu, C. J., Li, X., et al. (2011). Research advance in regulation of ethylene during ripening and senescence of non-climacteric fruit. Acta Hortic. Sin. 38, 371–378. doi: 10.16420/j.issn.0513-353x.2011.02.023
Jo, H. and Koh, G. (2015). Faster single-end alignment generation utilizing multi-thread for BWA. Bio-med. Mater. Eng. 26, S1791–S1796. doi: 10.3233/BME-151480
Jue, D. W., Liu, L. Q., Sang, X. L., Shu, B., Wang, J. H., Wang, Y. C., et al. (2021). SNP-based high-density genetic map construction and candidate gene identification for fruit quality traits of Dimocarpus longan Lour. Sci. Hortic. 284, 110086. doi: 10.1016/j.scienta.2021.110086
Kiszonas, A. M., Boehm Jeffrey, D., See, D., and Morris, C. F. (2017). Identification of SNPs, QTLs and dominant markers associated with wheat grain flavor using genotyping-by-sequencing. J. Cereal Sci. 76, 140–147. doi: 10.1016/j.jcs.2017.06.006
Koyama, K., Kono, A., Ban, Y., Bahena-Garrido, S. M., Ohama, T., Iwashita, K., et al. (2022). Genetic architecture of berry aroma compounds in a QTL (quantitative trait loci) mapping population of interspecific hybrid grapes (Vitis labruscana × Vitis vinifera). BMC Plant Biol. 22, 458. doi: 10.1186/s12870-022-03842-z
Lander, E. S. and Botstein, D. (1989). Mapping Mendelian factors underlying quantitative traits using RFLP markers. Genetics 121, 185–199. doi: 10.1093/genetics/121.1.185
Li, F. M., Liu, Z. Y., Chen, H. X., Wu, J., Cai, X., Wang, H., et al. (2023). QTL mapping of leaf-related traits using a high-density bin map in Brassica rapa. Horticulturae 9, 433. doi: 10.3390/horticulturae9040433
Li, P., Liu, R. T., Tan, X. B., Zhang, Y., and Liu, C. H. (2023). Research progress in genetic map construction and QTL mapping for disease resistance in grapevine. J. Fruit Sci. 40, 1245–1254. doi: 10.13925/j.cnki.gsxb.20220031
Lin, Y. L., Min, J. M., Lai, R. L., Wu, Z. Y., Chen, Y. K., Yu, L. L., et al. (2017). Genome-wide sequencing of longan (Dimocarpus longan Lour.) provides insights into molecular basis of its polyphenol-rich characteristics. Gigascience 5, 1–14. doi: 10.1093/gigascience/gix023
Liu, Y. D., Li, Y. Y., and Wang, X. Y. (2017). Molecular evolution of acetohydroxyacid synthase in bacteria. Microbiologyopen 6, 524. doi: 10.1002/mbo3.524
Liu, F., Qu, P. Y., Li, J. P., Yang, L. N., Geng, Y. J., Lu, J. Y., et al. (2024). Arabidopsis protein S-acyl transferases positively mediates BR signaling through S-acylation of BSK1. Proc. Natl. Acad. Sci. United States America 121, e2322375121. doi: 10.1073/pnas.2322375121
Luo, M. L. (2022). Molecular mechanism of different transcription factors synergistically regulating key genes of ester biosynthesis to mediate aroma loss in cold-stored ‘Nanguo’ pears. Ph.D. Thesis (Shenyang, China: Shenyang Agricultural University). doi: 10.27327/d.cnki.gshnu.2022.000003
Ma, X., Fan, L., Zhang, Z. F., Yang, X., Liu, Y. C., Ma, Y. M., et al. (2023). Global dissection of the recombination landscape in soybean using a high-density 600K SoySNP array. Plant Biotechnol. J. 21, 606–620. doi: 10.1111/pbi.13975
Pereira, L., Ruggieri, V., Pérez, S., Alexiou, K. G., Fernández, M., Jahrmann, T., et al. (2018). QTL mapping of melon fruit quality traits using a high-density GBS-based genetic map. Plant Biol. 18, 324. doi: 10.1186/s12870-018-1537-5
Persson, B., Hedlund, J., and Jornvall, H. (2008). The MDR superfamily. Cell. Mol. Life Sci. 65, 3879–3894. doi: 10.1007/s00018-008-8587-z
Peter, L. and Steve, H. (2008). WGCNA: an R package for weighted correlation network analysis. BMC Bioinf. 9, 1–32. doi: 10.1186/1471-2105-9-559
Qi, W. Y., Wang, H. J., Zhou, Z., Yang, P., Wu, W. B., Li, Z. M., et al. (2020). Ethylene emission as a potential indicator of Fuji apple flavor quality evaluation under low temperature. Hortic. Plant J. 6, 231–239. doi: 10.1016/j.hpj.2020.03.007
Qin, M. F., Li, L. T., Singh, J., Sun, M. Y., Bai, B., Li, S. W., et al. (2022). Construction of a high-density bin-map and identification of fruit quality-related quantitative trait loci and functional genes in pear. Horticult. Res. 9, uhac141. doi: 10.1093/hr/uhac141
Qin, G. Z., Wang, Y. Y., Cao, B. H., Wang, W. H., and Tian, S. P. (2012). Unraveling the regulatory network of the MADS box transcription factor RIN in fruit ripening. Plant J. 70, 243–255. doi: 10.1111/j.1365-313X.2011.04861.x
Rey-Serra, P., Mnejja, M., and Monfort, A. (2022). Inheritance of esters and other volatile compounds responsible for the fruity aroma in strawberry. Front. Plant Sci. 13. doi: 10.3389/fpls.2022.959155
Rieu, P., Turchi, L., Thévenon, E., Zarkadas, E., Nanao, M., Chahtane, H., et al. (2023). The F-box protein UFO controls flower development by redirecting the master transcription factor LEAFY to new cis-elements. Nat. Plants 9, 315–329. doi: 10.1038/s41477-022-01336-2
Sánchez, G., Martínez, J., Romeu, J., García, J., Monforte, A. J., Badenes, M. L., et al. (2014). The peach volatilome modularity is reflected at the genetic and environmental response levels in a QTL mapping population. BMC Plant Biol. 14, 137. doi: 10.1186/1471-2229-14-137
Schaffer, R. J., Friel, E. N., Souleyre, E. J. F., Bolitho, K., Thodey, K., Ledger, S., et al. (2007). A genomics approach reveals that aroma production in apple is controlled by ethylene predominantly at the final step in each biosynthetic pathway. Plant Physiol. 144, 1899–1912. doi: 10.1104/pp.106.093765
Shannon, P., Markiel, A., Ozier, O., Baliga, N. S., Wang, J. T., Ramage, D., et al. (2003). Cytoscape: a software environment for integrated models of biomolecular interaction networks. Genome Res. 13, 2498–2504. doi: 10.1101/gr.1239303
Souleyre, E. J. F., Nieuwenhuize, N. J., Wang, M. Y., Winz, R. A., Matich, A. J., Ileperuma, N. R., et al. (2022). Alcohol acyl transferase genes at a high-flavor intensity locus contribute to ester biosynthesis in kiwifruit. Plant Physiol. 190, 1100–1116. doi: 10.1093/plphys/kiac316
Sun, Y. H., Li, X. Z., Ma, Z. Y., and Chen, S. X. (2022). Quantitative trait locus mapping of fruit aroma compounds in cucumber (Cucumber sativus L.) based on a recombinant inbred line population. Horticult. Res. 9, 2960–2973. doi: 10.1093/hr/uhac151
Tang, H. B., Zhang, X. T., Miao, C. Y., Zhang, J. S., Ming, R., Schnable, J. C., et al. (2015). ALLMAPS: robust scaffold ordering based on multiple maps. Genome Biol. 16, 3. doi: 10.1186/s13059-014-0573-1
Tesniere, C. and Verries, C. (2000). Molecular cloning and expression of cDNAs encoding alcohol dehydrogenases from vitis vnifera L. during berry development. Plant Sci. 157, 77–88. doi: 10.1016/s0168-9452(00)00274-0
Tikunov, Y., Roohanitaziani, R., Meijer-Dekens, F., Molthoff, J., Paulo, J., Finkers, R., et al. (2020). The genetic and functional analysis of flavor in commercial tomato: the FLORAL4 gene underlies a QTL for floral aroma volatiles in tomato fruit. Plant J. 103, 1185–1204. doi: 10.1111/tpj.14795
Van Ooijen, J. W. (2009). MapQTL 6.0, software for the mapping of quantitative trait loci in experimental populations of diploid species [Z] (Wageningen, Netherlands: Kyazma B.V).
Voorrips, R. E. (2002). MapChart: software for the graphical presentation of linkage maps and QTLs. J. Heredity 93, 77–78. doi: 10.1093/jhered/93.1.77
Yang, S. B., Yu, J., Yang, H. J., and Zhao, Z. Y. (2023). Genetic analysis and QTL mapping of aroma volatile compounds in the apple progeny ‘Fuji’×’Cripps Pink’. Front. Plant Sci. 14. doi: 10.3389/fpls.2023.1048846
Yu, Y., Bai, J. H., Chen, C. X., Plotto, A., Yu, Q. B., Baldwin, E. A., et al. (2017). Identification of QTLs controlling aroma volatiles using a ‘Fortune’×’Murcott’ (Citrus reticulata) population. BMC Genomics 18, 646. doi: 10.1186/s12864-017-4043-5
Yu, G. C., Wang, L. G., Han, Y. Y., and Yu, Q. (2012). clusterProfiler: an R package for comparing biological themes among gene clusters. Omics 16, 284–287. doi: 10.1089/omi.2011.0118
Yue, S. S. (2020). Study on apple ethylene response factor ERF1B regulating aroma biosynthesis in LOX pathway. Ph.D. Thesis (Taian, China: Shandong Agricultural University). doi: 10.27277/d.cnki.gsdnu.2020.000588
Zeng, Y., Wang, M. Y., Hunter, D. C., Matich, A. J., McAtee, P. A., Knäbel, M., et al. (2020). Sensory-directed genetic and biochemical characterization of flavor-related volatile terpene production in ripe kiwifruit. Plant Physiol. 183, 51–66. doi: 10.1104/pp.20.00186
Zhao, L., Zhang, Y., Wei, X. D., Liang, W. H., Zhao, C. F., Zhou, L. H., et al. (2022). Mapping of QTLs for chlorophyll content in flag leaves of rice on high-density bin map. Sci. Agricult. Sin. 55, 825–836. doi: 10.3864/j.issn.0578-1752.2022.05.001
Zheng, S. Q., Zeng, L. H., Zhang, J. S., Lin, H. T., Deng, C. J., and Zhuang, Y. M. (2019). Fruit scientific research in New China in the past 70 years: Longan. J. Fruit Sci. 36, 1414–1420. doi: 10.13925/j.cnki.gsxb.Z15
Keywords: longan, high-density bin map, characteristic aroma components, QTL mapping, candidate gene
Citation: Hu W, Zhang Q, Deng C, Xu Q, Jiang J, Chen X, Li J, Zhang J and Zheng S (2025) Construction of high-density bin genetic map and QTL mapping of fruit aroma in longan (Dimocarpus longan Lour.). Front. Plant Sci. 16:1642854. doi: 10.3389/fpls.2025.1642854
Received: 07 June 2025; Accepted: 24 July 2025;
Published: 14 August 2025.
Edited by:
Robin Joshi, University of Pennsylvania, United StatesReviewed by:
Rituraj Khound, University of Nebraska-Lincoln, United StatesShruti Sharma, University of Alabama, United States
Copyright © 2025 Hu, Zhang, Deng, Xu, Jiang, Chen, Li, Zhang and Zheng. This is an open-access article distributed under the terms of the Creative Commons Attribution License (CC BY). The use, distribution or reproduction in other forums is permitted, provided the original author(s) and the copyright owner(s) are credited and that the original publication in this journal is cited, in accordance with accepted academic practice. No use, distribution or reproduction is permitted which does not comply with these terms.
*Correspondence: Jianguo Li, amlhbmxpQHNjYXUuZWR1LmNu; Jisen Zhang, emppc2VuQDEyNi5jb20=; Shaoquan Zheng, enNxMzMzNTU1QDE2My5jb20=
†These authors have contributed equally to this work