 Yajing Zhou1
 Yongbao Shen1,2,3*
- 1College of Forestry and Grassland, Nanjing Forestry University, Nanjing, China
- 2Collaborative Innovation Center of Sustainable Forestry in Southern China, Nanjing Forestry University, Nanjing, China
- 3Southern Tree Seed Inspection Center, National Forestry and Grassland Administration, Nanjing, China
Tilia miqueliana Maxim. is renowned for its rich bioactive compounds, including flavonoids, phenolic acids, coumarins, and other secondary metabolites, which possess antioxidant, anticancer, antidepressant, and analgesic effects. This study aims to investigate the seasonal dynamic changes of secondary metabolites in T. miqueliana leaves and their biosynthetic regulatory mechanisms. The leaves of T. miqueliana were sampled at four different growth stages. Total flavonoids, phenolic acids, amino acids, coumarins, and terpenoid contents were determined using UV spectrophotometry, and enzyme activities of phenylalanine ammonia-lyase (PAL), cinnamate-4-hydroxylase (C4H), and 4-coumarate: CoA ligase (4CL) were measured. Flavonoid monomers such as quercetin and kaempferol, along with endogenous hormones, were quantitatively analyzed using high-performance liquid chromatography (HPLC). Widely targeted metabolomic analysis via UPLC-MS/MS and Illumina transcriptomic sequencing identified 1971 metabolites. The results showed that flavonoids, amino acids and their derivatives, and phenolic acids accounted for nearly half of the total metabolites. The major active substances exhibited significant variations across different developmental stages. The summer months (June to August) represented the most active growth and metabolic phase. Active compounds, represented by flavonoids such as tiliroside, scopoletin, naringenin, dihydrokaempferol, apigenin, luteolin, quercetin, kaempferol, and rutin, are secondary metabolites with potential medicinal value in T. miqueliana leaves. There were significant differences in differentially accumulated metabolites (DAMs) and differentially expressed genes (DEGs) across developmental stages. The synthesis of key secondary metabolites is co-regulated by endogenous hormones, enzyme activities, and differentially expressed candidate genes. This study provides new insights for determining the appropriate harvesting time for T. miqueliana leaves and the metabolic regulation of secondary metabolites.
1 Introduction
Tilia miqueliana Maxim. is a deciduous tree of the Malvaceae family, mainly distributed in Jiangsu, Zhejiang, Anhui, and Guangdong provinces of China. It holds ecological and economic value, serving as timber, nectar source, ornamental plant, and a source of medicinal compounds. Its flowers, leaves, and buds contain bioactive substances with central nervous system effects, including anticonvulsant, sedative, and analgesic properties (Cardenas-Rodriguez et al., 2014; Allio et al., 2015; Aguirre-Hernandez et al., 2010). Methanol extracts from leaves and flowers are rich in flavonoids such as quercetin, rutin, isoquercitrin, and kaempferol glycosides, which exhibit antioxidant and neuropharmacological activities (Loscalzo et al., 2009). In Europe, linden flower tea has traditionally been used to treat colds, bronchitis, and inflammation, due to its high content of flavonoids, phenolic acids, and coumarins with antioxidant, anti-inflammatory, anticancer, and antibacterial effects (Nenni and Karahuseyin, 2024; Pavlović et al., 2020). Flavonoids in T. miqueliana have shown anticancer, antidepressant, and sedative effects, making them promising therapeutic agents (Zhou et al., 2024). Their biosynthesis originates from the phenylalanine pathway, where phenylalanine is converted to cinnamic acid via PAL, followed by sequential reactions involving C4H, 4CL, CHS, and CHI, leading to various flavonoid subtypes such as flavones, flavonols, and isoflavones. These pathways are developmentally regulated and respond to external cues, with key enzymes (CHS, CHI, F3H) controlled by transcription factors like MYB, bHLH, and WD40, which form MYB-bHLH-WD40 complexes (Carvalho Lemos et al., 2019; Yi, 2015; Falcone Ferreyra et al., 2012; Li and Ahammed, 2023).
However, the metabolomic landscape and regulatory mechanisms of flavonoid biosynthesis in T. miqueliana across different developmental stages remain poorly understood. This study integrates widely targeted metabolomics and transcriptomics to profile leaf samples at four growth stages, identifying key metabolites and regulatory pathways. The findings enhance understanding of flavonoid accumulation and offer a foundation for optimized use in pharmacological and nutraceutical applications.
2 Materials and methods
2.1 Plant materials and treatments
Container-grown Tilia miqueliana Maxim. seedlings from Nanjing Forestry University (32.06°N, 118.78°E) were exposed to full sunlight outdoors. The experiment included 30 containers (3 replicates, 10 containers per unit). Seedlings were weeded, watered, and fertilized without pesticides, with controlled environmental conditions (temperature, humidity, light duration, and intensity). Sampling occurred in April, June, August, and October, with leaves collected in the middle of each month, labeled as 4CK, 6CK, 8CK, and 10CK (Figure 1). One healthy leaf from the middle of each tree was collected, de-veined, cut into pieces, mixed, frozen in liquid nitrogen, and stored at -80°C for RNA extraction.
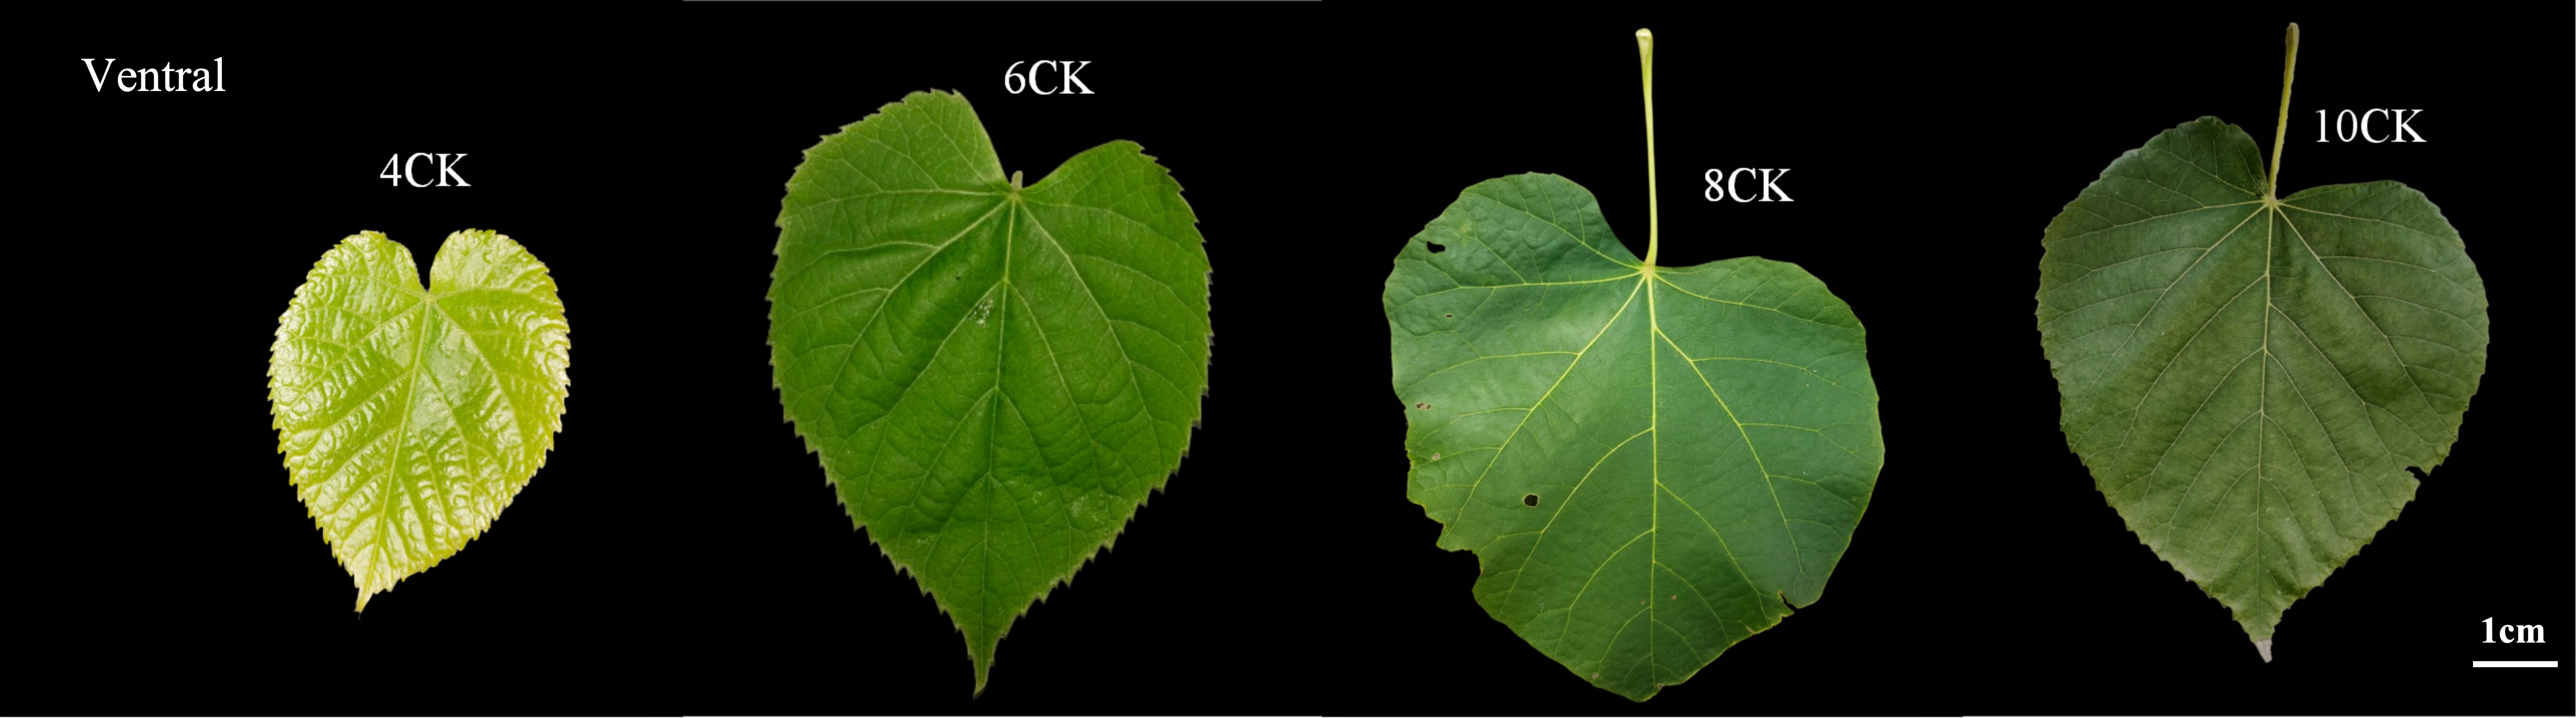
Figure 1. The phenotypes of Tilia miqueliana Maxim. leaves during four developmental stages.
2.2 Widely targeted metabolomics analysis using UPLC-MS/MS
Samples were freeze-dried (Scientz-100F) and ground (MM 400, Retsch). 50 mg of powder was mixed with 1200 μL of -20°C 70% methanolic extract. Vortexed and centrifuged (12000 rpm, 3 min), the supernatant was filtered and stored for UPLC-MS/MS analysis. UPLC conditions: Agilent SB-C18 column (1.8 µm, 2.1 mm × 100 mm), mobile phase: 0.1% formic acid in water (A) and acetonitrile (B). Gradient: 95% A, 5% B to 5% A, 95% B over 9 min, then back to 95% A, 5% B. Flow rate: 0.35 mL/min, column temperature: 40°C, injection volume: 2 μL. MS analysis was performed on an ESI-QTRAP-MS system (https://sciex.com.cn/). ESI parameters: source temperature 550°C, voltage 5500 V (positive)/-4500 V (negative), gases at 50, 60, and 25 psi. MRM scans were used, with collision gas (nitrogen) at medium. MRM transitions were optimized for specific metabolites.
2.3 Transcriptome sequencing and analysis
Tilia miqueliana Maxim. samples were extracted using ethanol precipitation and CTAB-PBIOZOL. After extraction, RNA was dissolved in 50 µL of DEPC-treated water and quantified using a Qubit fluorometer and Qsep400 biofragment analyzer. cDNA libraries were sequenced on the Illumina platform by Metware Biotechnology Co., Ltd. (Wuhan, China). PolyA mRNAs were enriched using Oligo(dT) magnetic beads, fragmented, and reverse transcribed into first-strand cDNA. Strand-specific second-strand synthesis was performed using dUTPs. After adapter ligation, DNA magnetic bead purification, and fragment selection, a 250–350 bp library was amplified by PCR. The library was then cyclized to obtain single-stranded circular DNA and amplified to generate DNA nanoballs (DNBs), which were loaded into the sequencing chip for sequencing on the BGI platform. Raw data were filtered using fastp to remove adapters and low-quality reads. Clean reads were assembled using Trinity (https://github.com/trinityrnaseq/trinityrnaseq), and redundancy was removed using Corset. CDS prediction was performed with TransDecoder (https://github.com/TransDecoder/), and the amino acid sequences were compared to KEGG, NR, Swiss-Prot, GO, COG/KOG, and TrEMBL databases using DIAMOND BLASTX (Buchfink et al., 2015). The Pfam database was used for further annotation. Transcript expression levels were calculated using RSEM, and FPKM was used to estimate gene expression. Differential expression was analyzed with DESeq2 for biological replicates and edgeR for non-replicates, with criteria of |log2Fold Change| ≥ 1, FDR < 0.05, and Padj ≤ 0.05.
2.4 Multivariate analysis of identified metabolites
PCA was performed using the prcomp function in R, with data scaled to unit variance. HCA and Pearson correlation coefficients (PCC) were visualized using heatmaps via the ComplexHeatmap package. Differential metabolites were identified based on VIP > 1 and |Log2FC| ≥ 1.0, extracted from OPLS-DA with 200 permutations to prevent overfitting. Analyses were performed using MetaboAnalystR. Metabolites were annotated with the KEGG Compound database and mapped to pathways in the KEGG Pathway database. Pathway enrichment was analyzed via metabolite set enrichment analysis (MSEA), with significance determined by p-values from the hypergeometric test (Ringnér, 2008; Worley and Powers, 2013; Xia and Wishart, 2010; Kanehisa and Goto, 2000).
2.5 Determination of flavonoid, phenolic, coumarin, amino acid content, and enzyme activity
The total flavonoid (TFC), phenolic (TPC), coumarin(TCC), and amino acid (TAAC) contents were quantified using a UV-Vis spectrophotometer(2014) (Da Silva et al., 2015; Nikzad and Parastar, 2021; Núñez et al., 2021; Nor et al., 2022). Rutin, gallic acid, coumarin, and L-arginine were used as reference standards, with results expressed as rutin, gallic acid, coumarin, and L-arginine equivalents (mg/g extract), respectively. The enzyme activities of phenylalanine ammonia-lyase (PAL), cinnamic acid-4-hydroxylase (C4H) and 4-carboxymethyl coenzyme Aligase (4CL) were measured using UV-Vis spectrophotometer (Ge, 1996; Aydaş et al., 2013).
2.6 Quantification of quercetin, isorhamnetin, kaempferol, scopoletin, and luteolin
Quercetin, isorhamnetin, kaempferol, scopoletin, and luteolin were measured using a Shimadzu LC-30AD HPLC system with an AB Sciex Qtrap 6500 mass spectrometer. About 0.5 g of Tilia miqueliana Maxim. sample was extracted with 5 mL of 75% methanol by ultrasonic extraction (40 min, 250 W, 50 kHz). After filtration through a 0.22 μm membrane, the sample was analyzed. HPLC: Poroshell 120 SB-C18 column (2.1 × 150 mm, 2.7 µm), column temperature 30°C, mobile phase: A = 0.05% formic acid, B = 0.05% formic acid, injection volume 10 µL. MS: ESI negative mode, MRM scan, -4500 V, 650°C. Compound content was calculated as: Content (µg/g) = detected concentration (µg/mL) × extraction volume (mL) ÷ sample mass (g).
2.7 Weighted gene co-expression network analysis
This method involves the construction of a weighted adjacency matrix based on pairwise gene expression correlations, followed by its transformation into a Topological Overlap Matrix (TOM) to enhance the robustness of network connectivity. Genes are clustered into modules using hierarchical clustering, and module eigengenes are then correlated with external traits to explore potential biological associations (Li et al., 2024).
2.8 Statistical analysis
Statistical analyses were conducted using R software and SPSS statistical software. Analysis of variance (ANOVA) was performed, followed by Duncan’s multiple range test to determine significant differences (p < 0.05). Transcriptional and metabolic data were analyzed and visualized using Metware Cloud (https://cloud.metware.cn), while line graphs were generated using GraphPad Prism 9 (GraphPad Prism 9, San Diego, California, USA) (Li et al., 2021).
3 Results
3.1 Detection of metabolites and multivariate analysis in leaves of Tilia miqueliana Maxim.
To thoroughly identify and characterize the metabolites in Tilia miqueliana Maxim. leaves, we performed UPLC-MS/MS analysis on leaf samples from seedlings at four distinct growth stages: 4CK, 6CK, 8CK, and 10CK. Across these developmental stages, a total of 1,971 unique metabolites were annotated. Among these, we identified 449 flavonoids (22.7%), 262 amino acids and their derivatives (13.29%), 239 phenolic acids (12.13%), 186 terpenoids (9.49%), 149 lipids (7.56%), 131 alkaloids (6.65%), 111 lignans and coumarins (5.63%), 78 organic acids (3.96%), 56 nucleotides and their derivatives (2.84%), 22 quinones (1.12%), 25 tannins (1.27%), 9 steroids (0.46%), and 254 other compounds (12.84%) (Figure 2A). Flavonoids, amino acids and their derivatives, along with phenolic acids, together account for nearly half of the total identified metabolites. Principal Component Analysis (PCA) was employed to elucidate the intrinsic structure of multiple variables through the creation of several principal components (Zhong et al., 2024). As shown in Figure 2B, the 3D principal component analysis (PCA) effectively distinguishes samples from the four developmental stages, with clear separation along the principal components. PC1, PC2, and PC3 explain 45.00%, 18.75%, and 10.37% of the total variance, respectively, with the first two components accounting for 63.75%. The clustering of biological replicates within each group, along with the central positioning of the quality control (QC) samples, demonstrates high experimental reproducibility and data reliability. Comprehensive metabolomic profiling revealed pronounced stage-specific differences in metabolite composition during leaf development in Tilia miqueliana Maxim. Among the four developmental stages, the 4CK group (April) exhibited the most distinct metabolic profile, while the 8CK (August) and 10CK (October) groups demonstrated greater compositional similarity. Hierarchical clustering analysis (Figure 2C) effectively distinguished the samples into four discrete clusters, underscoring dynamic metabolic reprogramming across growth stages. Young leaves in April (4CK) were characterized by elevated levels of lipids, amino acids, nucleosides, peptides, carbohydrates, fatty acids, organic acids, flavonoids, and phenolic compounds. Notably, flavonoid and phenolic compound concentrations were highest during the early stages (April and June), but progressively declined with leaf maturation. In contrast, the accumulation of terpenoids, steroids, and certain acids peaked in the late stage (October), while amino acid levels were relatively higher in August and October than in earlier stages.
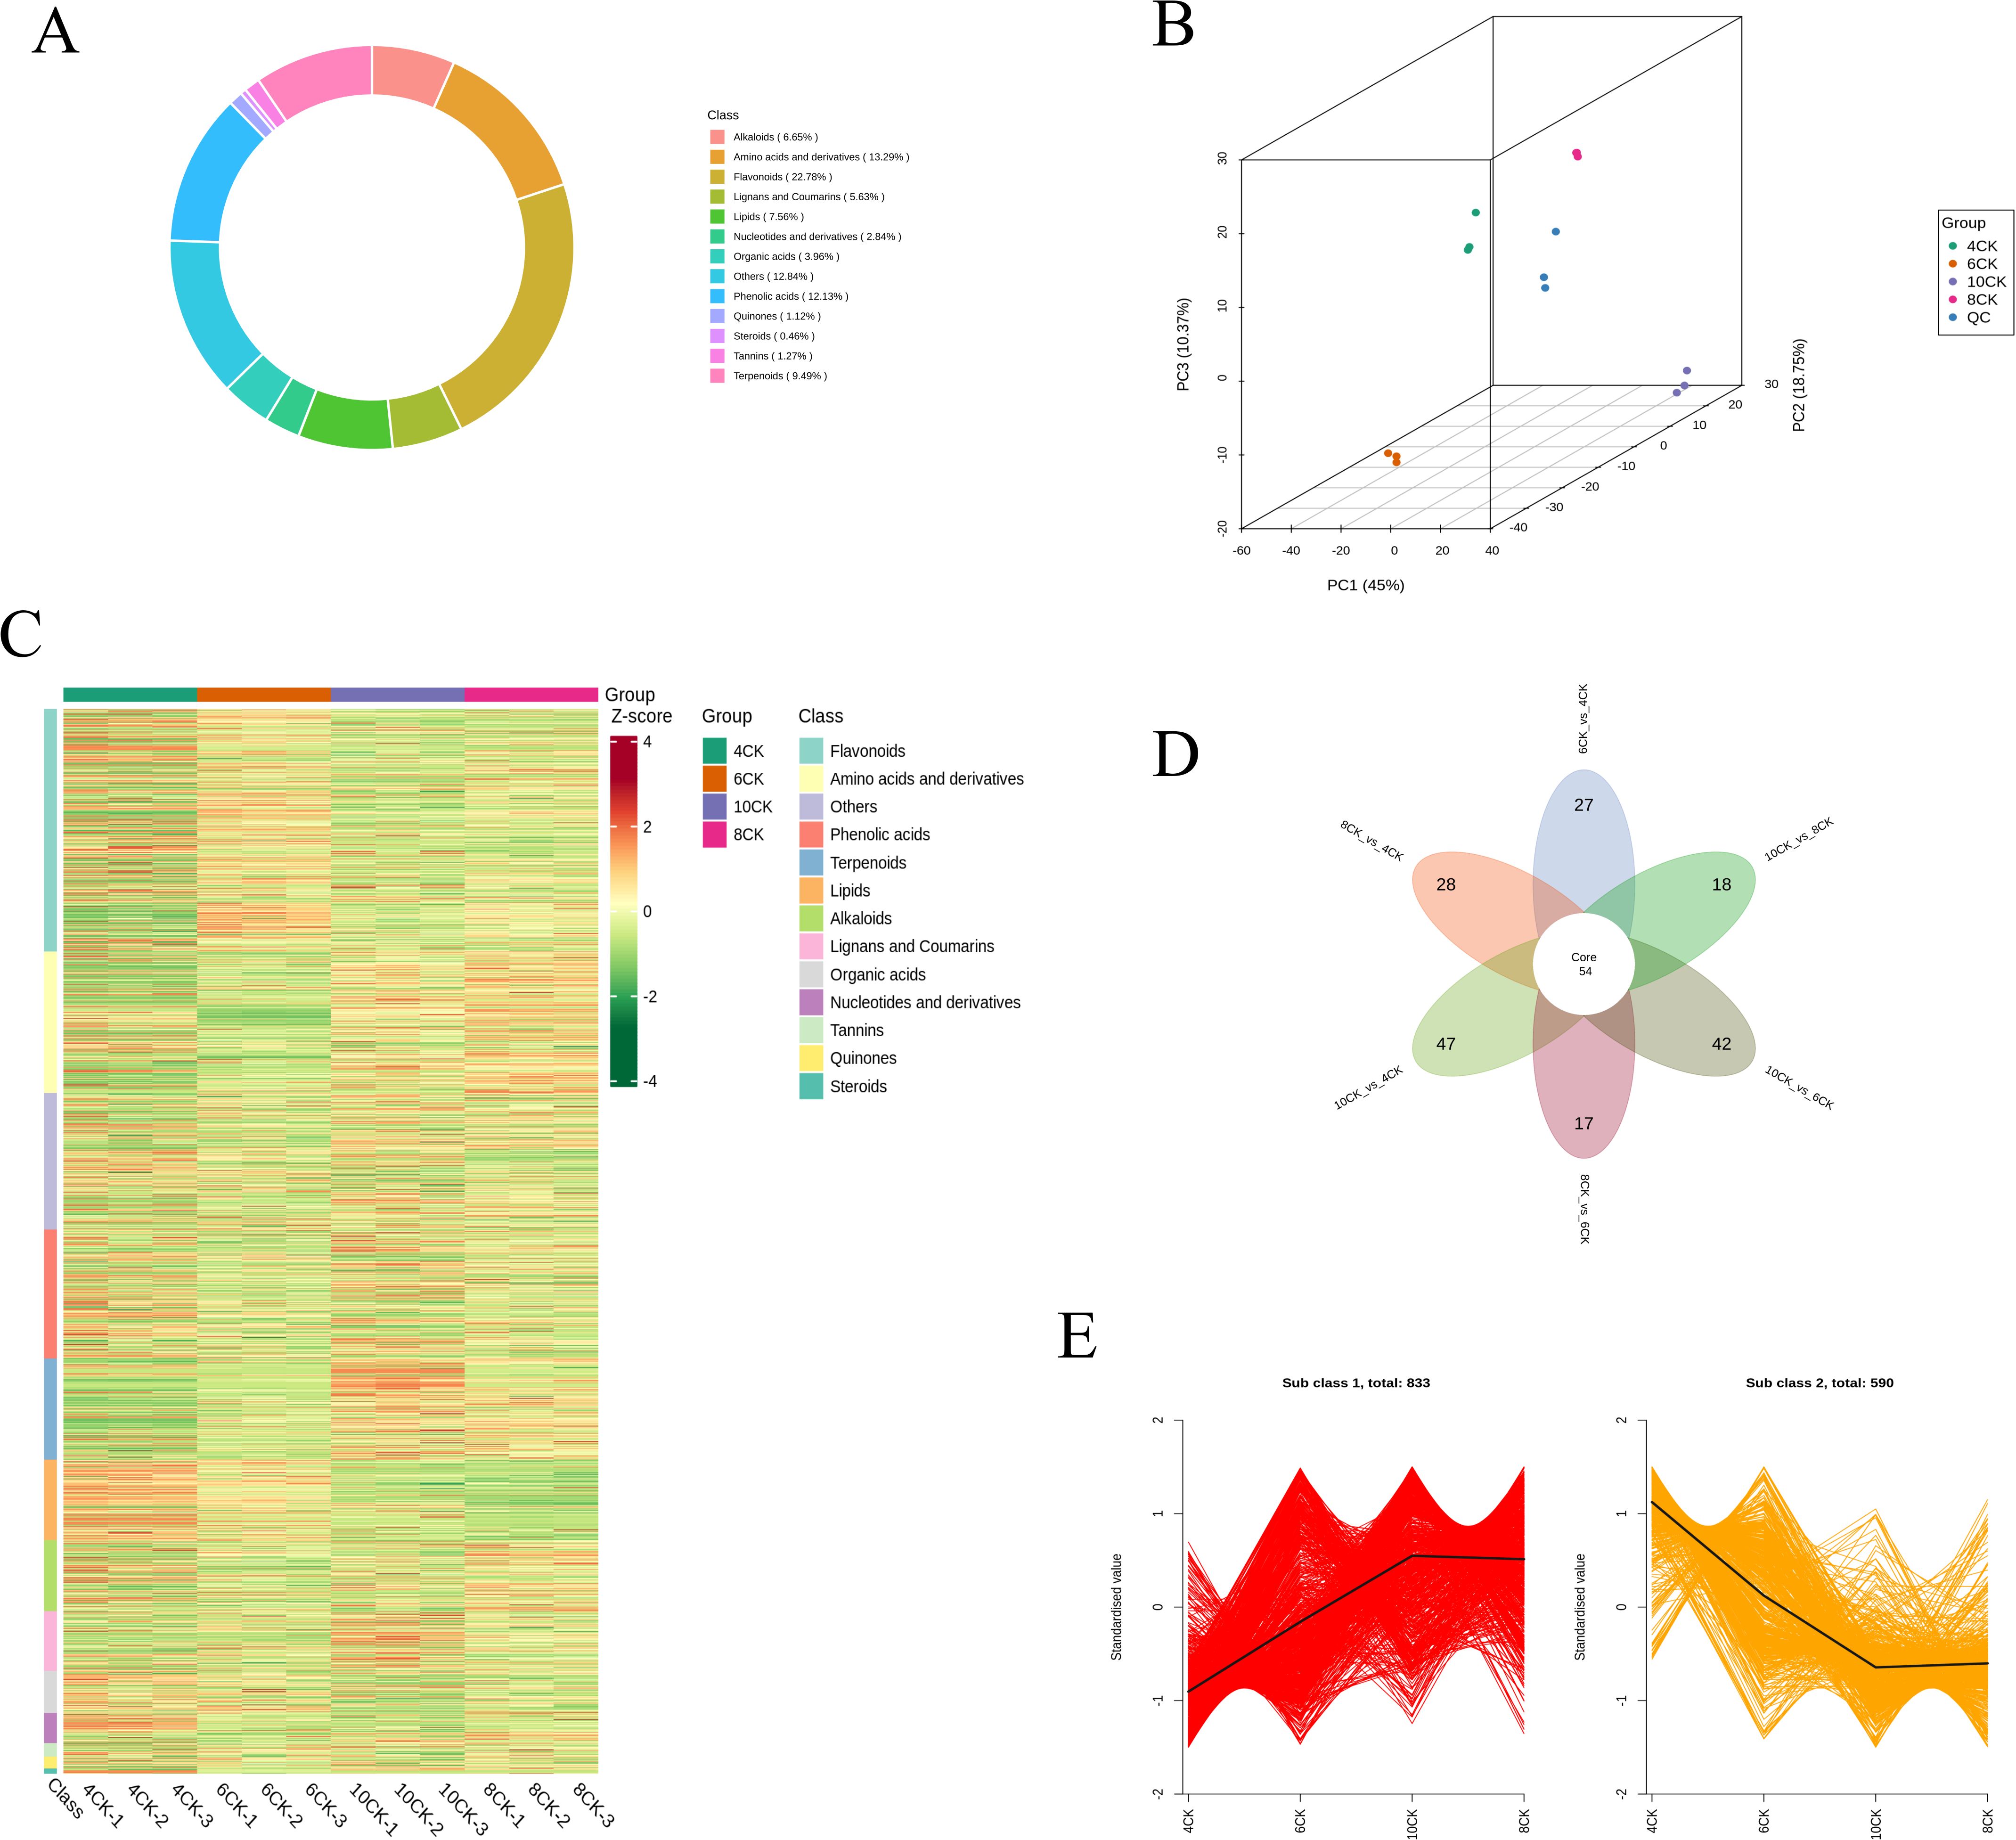
Figure 2. (A) Circular plot of metabolite category composition across the four growth stages. (B) PCA 3D results plot, including QC samples. (C) Heatmap of metabolite contents across the four growth stages, showing categories by metabolite classification. (D) Venn diagram of differential groups between various comparisons. (E) K-Means clustering trend chart of differential metabolites.
Differential metabolite analysis (Figure 2D) identified 54 core metabolites across all developmental stages. The greatest number of differential metabolites was observed between 10CK and 4CK (47 metabolites), followed by 10CK vs. 6CK (42), 10CK vs. 8CK (18), and 8CK vs. 6CK (17), indicating substantial metabolic shifts throughout leaf development. K-means clustering of differential metabolites (Figure 2E) revealed two dominant expression patterns. Subclass 1, comprising 833 metabolites, exhibited a general upregulation trend, with minimal accumulation at 4CK, peaking at 10CK, and a slight decline at 8CK, suggesting activation of specific metabolic pathways during maturation. Conversely, Subclass 2, containing 590 metabolites, displayed a continuous downregulation trend, with the highest levels at 4CK and gradual decline thereafter. This pattern may reflect the repression of certain biosynthetic pathways or enhanced metabolic stress during later stages of development.
3.2 Screening for DAM based on top fold change distribution compounds
We performed a comparative analysis between growth stages (6CK vs. 4CK, 8CK vs. 4CK, 10CK vs. 4CK, 6CK vs. 8CK, 6CK vs. 10CK, and 8CK vs. 10CK) using the supervised OPLS-DA technique to assess metabolite differences (Supplementary Figure S1). The analysis revealed clear separation between groups, indicating significant metabolic differences across the stages. Differentially accumulated metabolites (DAMs) were identified from all detected metabolites (Supplementary Table S1), and results were visualized using volcano plots (Supplementary Figure S2A–F). A total of 759 DAMs were identified between 6CK and 4CK, with 449 upregulated and 310 downregulated. Between 8CK and 4CK, 1045 DAMs were identified, and 666 DAMs were found between 8CK and 6CK. A total of 1059 DAMs were identified between 10CK and 4CK, and the fewest DAMs (371) were found between 10CK and 8CK, with 192 upregulated and 179 downregulated. Detailed data can be found in Supplementary Table S2.
Differential metabolite trend analysis revealed distinct metabolic patterns across the comparisons (Figure 3). In the 6CK vs. 4CK comparison, metabolites such as Gossypetin, Keracyanin, and Hallactone were upregulated, while Methyl linolenate, Cyanidin 3-O-sophoroside, and Tyrosine were downregulated. In the 8CK vs. 4CK comparison, Hallactone, Fraxidin, and Swietenitin were upregulated, while Methoxphaseollin, Toonasterone A, and Tyrosine were downregulated. In the 10CK vs. 4CK comparison, Mudanpinoic acid A, Sanguisorbigenin, and Arjunic acid were elevated, while 2n isomer, Tyrosine, and Pregnane A were reduced. In the 8CK vs. 6CK comparison, Homoproline, L-Arginine, and Hupcrispatine were upregulated, while Aloe-Emodin-9-Anthrone, Vicenin 2, and Pregnane A were downregulated. In the 10CK vs. 6CK comparison, Arjunic acid, Camaldulenic acid, and L-Arginine were upregulated, while Pregnane A, Toonasterone A, and Procyanidin A4 were downregulated. Finally, in the 10CK vs. 8CK comparison, Arjunic acid, Litchiol A, and Rubianol-f were upregulated, while Buddlenol F, Methyldopa, and Procyanidin A4 were downregulated.
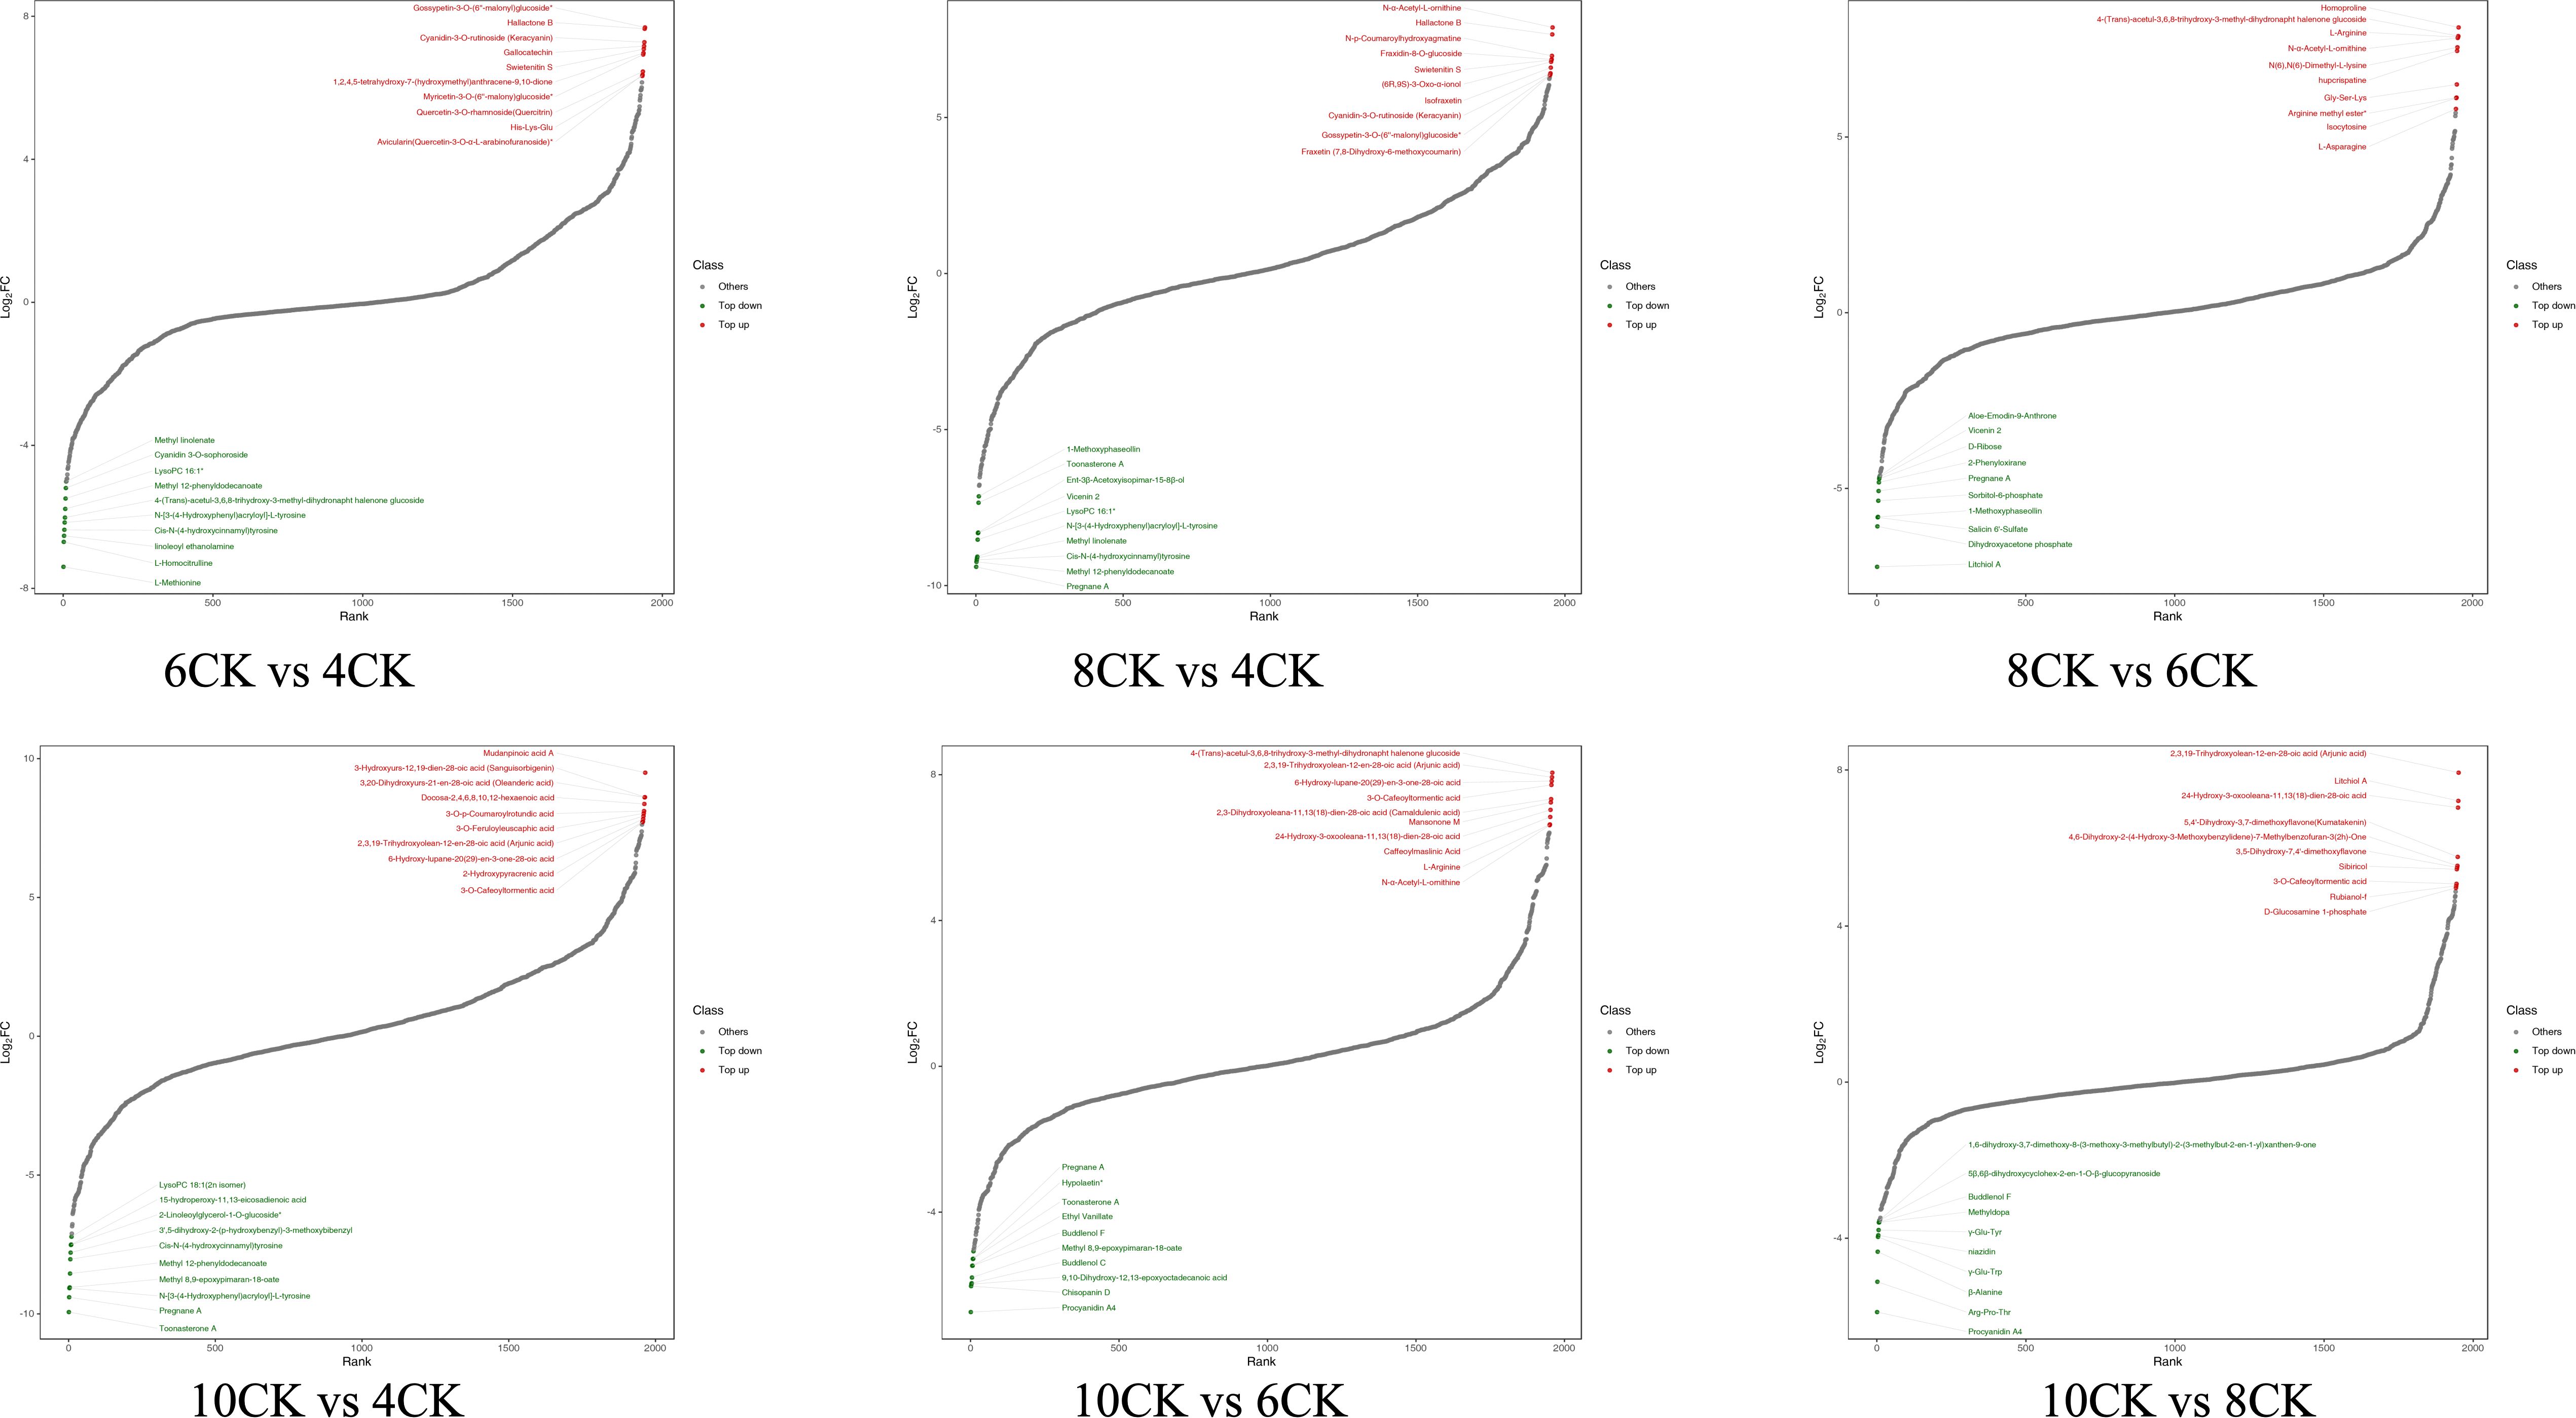
Figure 3. The dynamic distribution map of the top 10 upregulated and downregulated differential metabolites.
3.3 RNA-seq and KEGG enrichment analysis across four growth stages
To investigate gene expression changes at the transcriptional level during different growth stages of Tilia miqueliana Maxim. leaves, RNA-seq analysis was conducted on 12 samples, generating a total of 77.87 Gb of clean data, with each sample achieving at least 5 Gb. All samples had a Q30 base percentage above 94%. The clustering heatmap of differentially expressed genes demonstrated good reproducibility across the four sample groups (Figure 4A). In the 4CK group, certain metabolites exhibited lower Z-scores (blue), while in the 8CK group, some metabolites showed higher Z-scores (red). Principal component analysis (PCA) revealed distinct separation between the sample groups, with PC1 explaining 45% of the total variance, PC2 18.75%, and PC3 10.37% (Figure 4B). K-means clustering grouped genes with similar expression patterns into five major clusters (Figure 4C). Gene functional annotation classified 13,412 genes under General function prediction only, while 8,173 genes were categorized into Posttranslational modification, protein turnover, and chaperones, and 8,278 genes into “Signal transduction mechanisms” (Figure 4D).
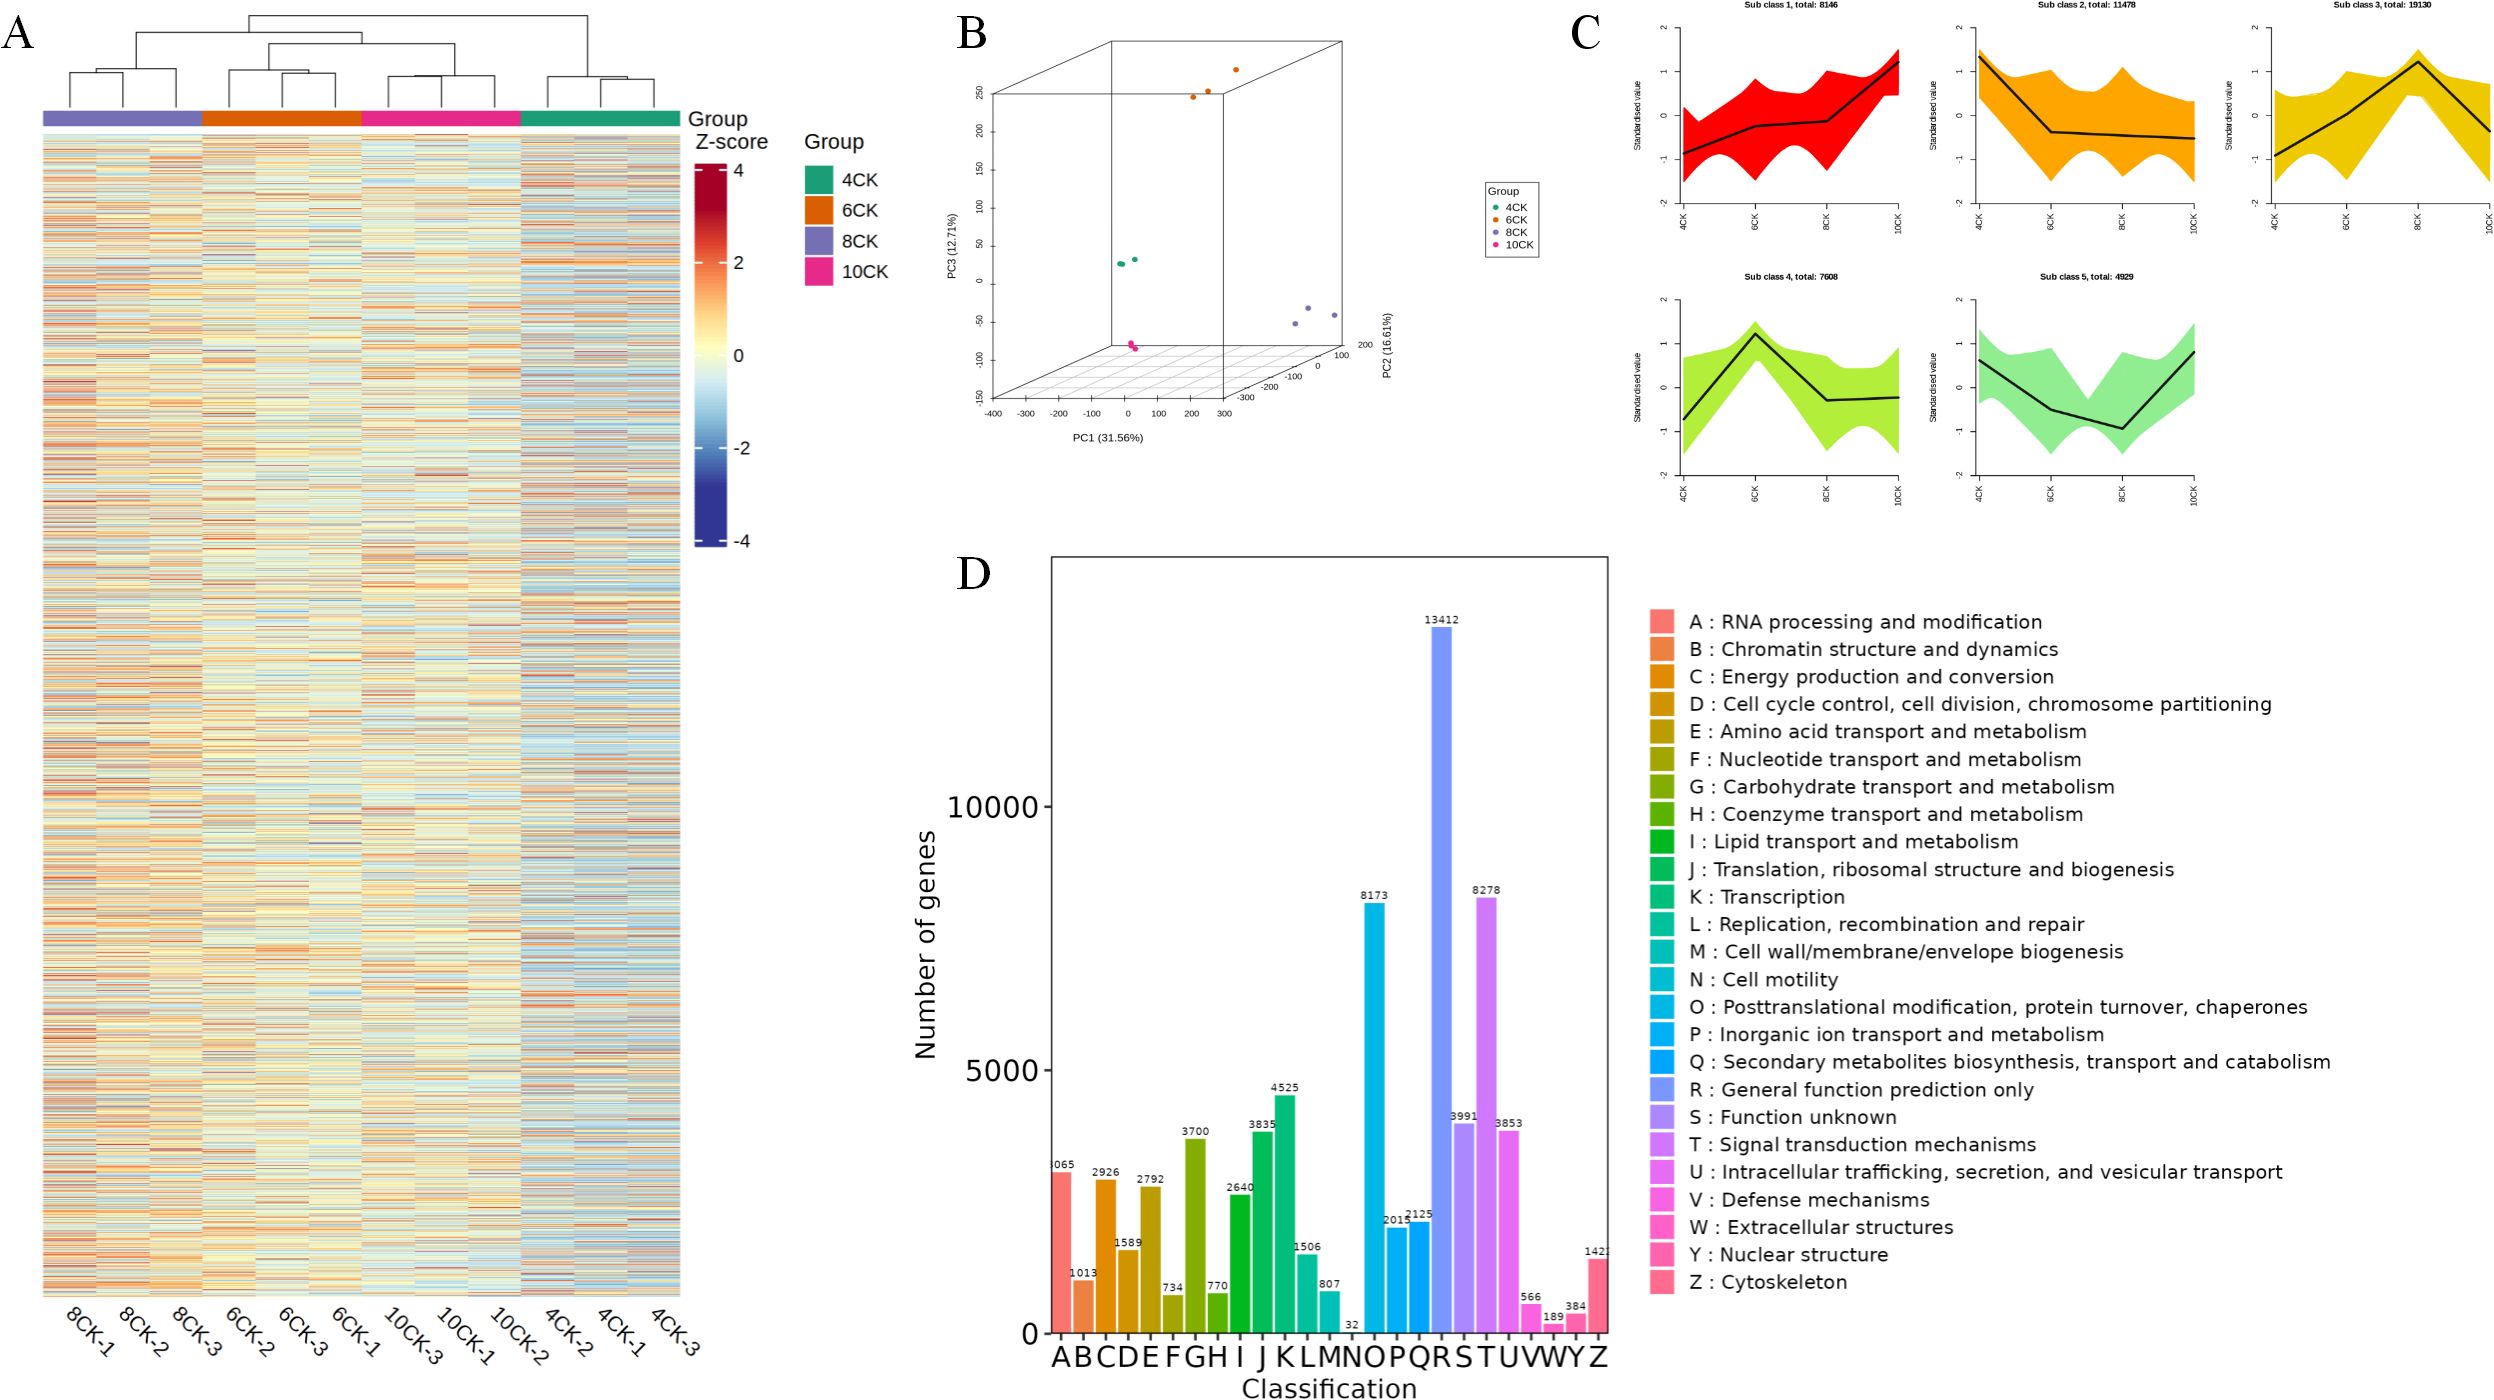
Figure 4. (A) All DEG heatmap. (B) 3D PCA analysis of unigene expression. (C) K-means cluster. (D) Unigene cluster of orthologous groups(KOG) classification.
The pairwise comparison petal diagram (Figure 5A) shows 298 core differentially expressed genes (DEGs). The largest number of DEGs was observed in the 8CK vs. 4CK group (4,002), followed by the 10CK vs. 8CK group (1,904) and 10CK vs. 4CK group (1,543), while the 10CK vs. 6CK group had the fewest (871). GO enrichment analysis (Figure 5B) identified significant enrichment in terms related to lignin metabolism, photosynthesis (photosystem I & II), immune response activation, and other metabolic processes. Particularly, photosynthesis-related genes were enriched across multiple comparisons, indicating their involvement in developmental changes. Immune response-related terms were also enriched, suggesting changes in immune regulation at different stages of leaf development. Lignin biosynthesis terms were enriched in several comparisons, indicating their role in secondary metabolism or stress response in leaves.
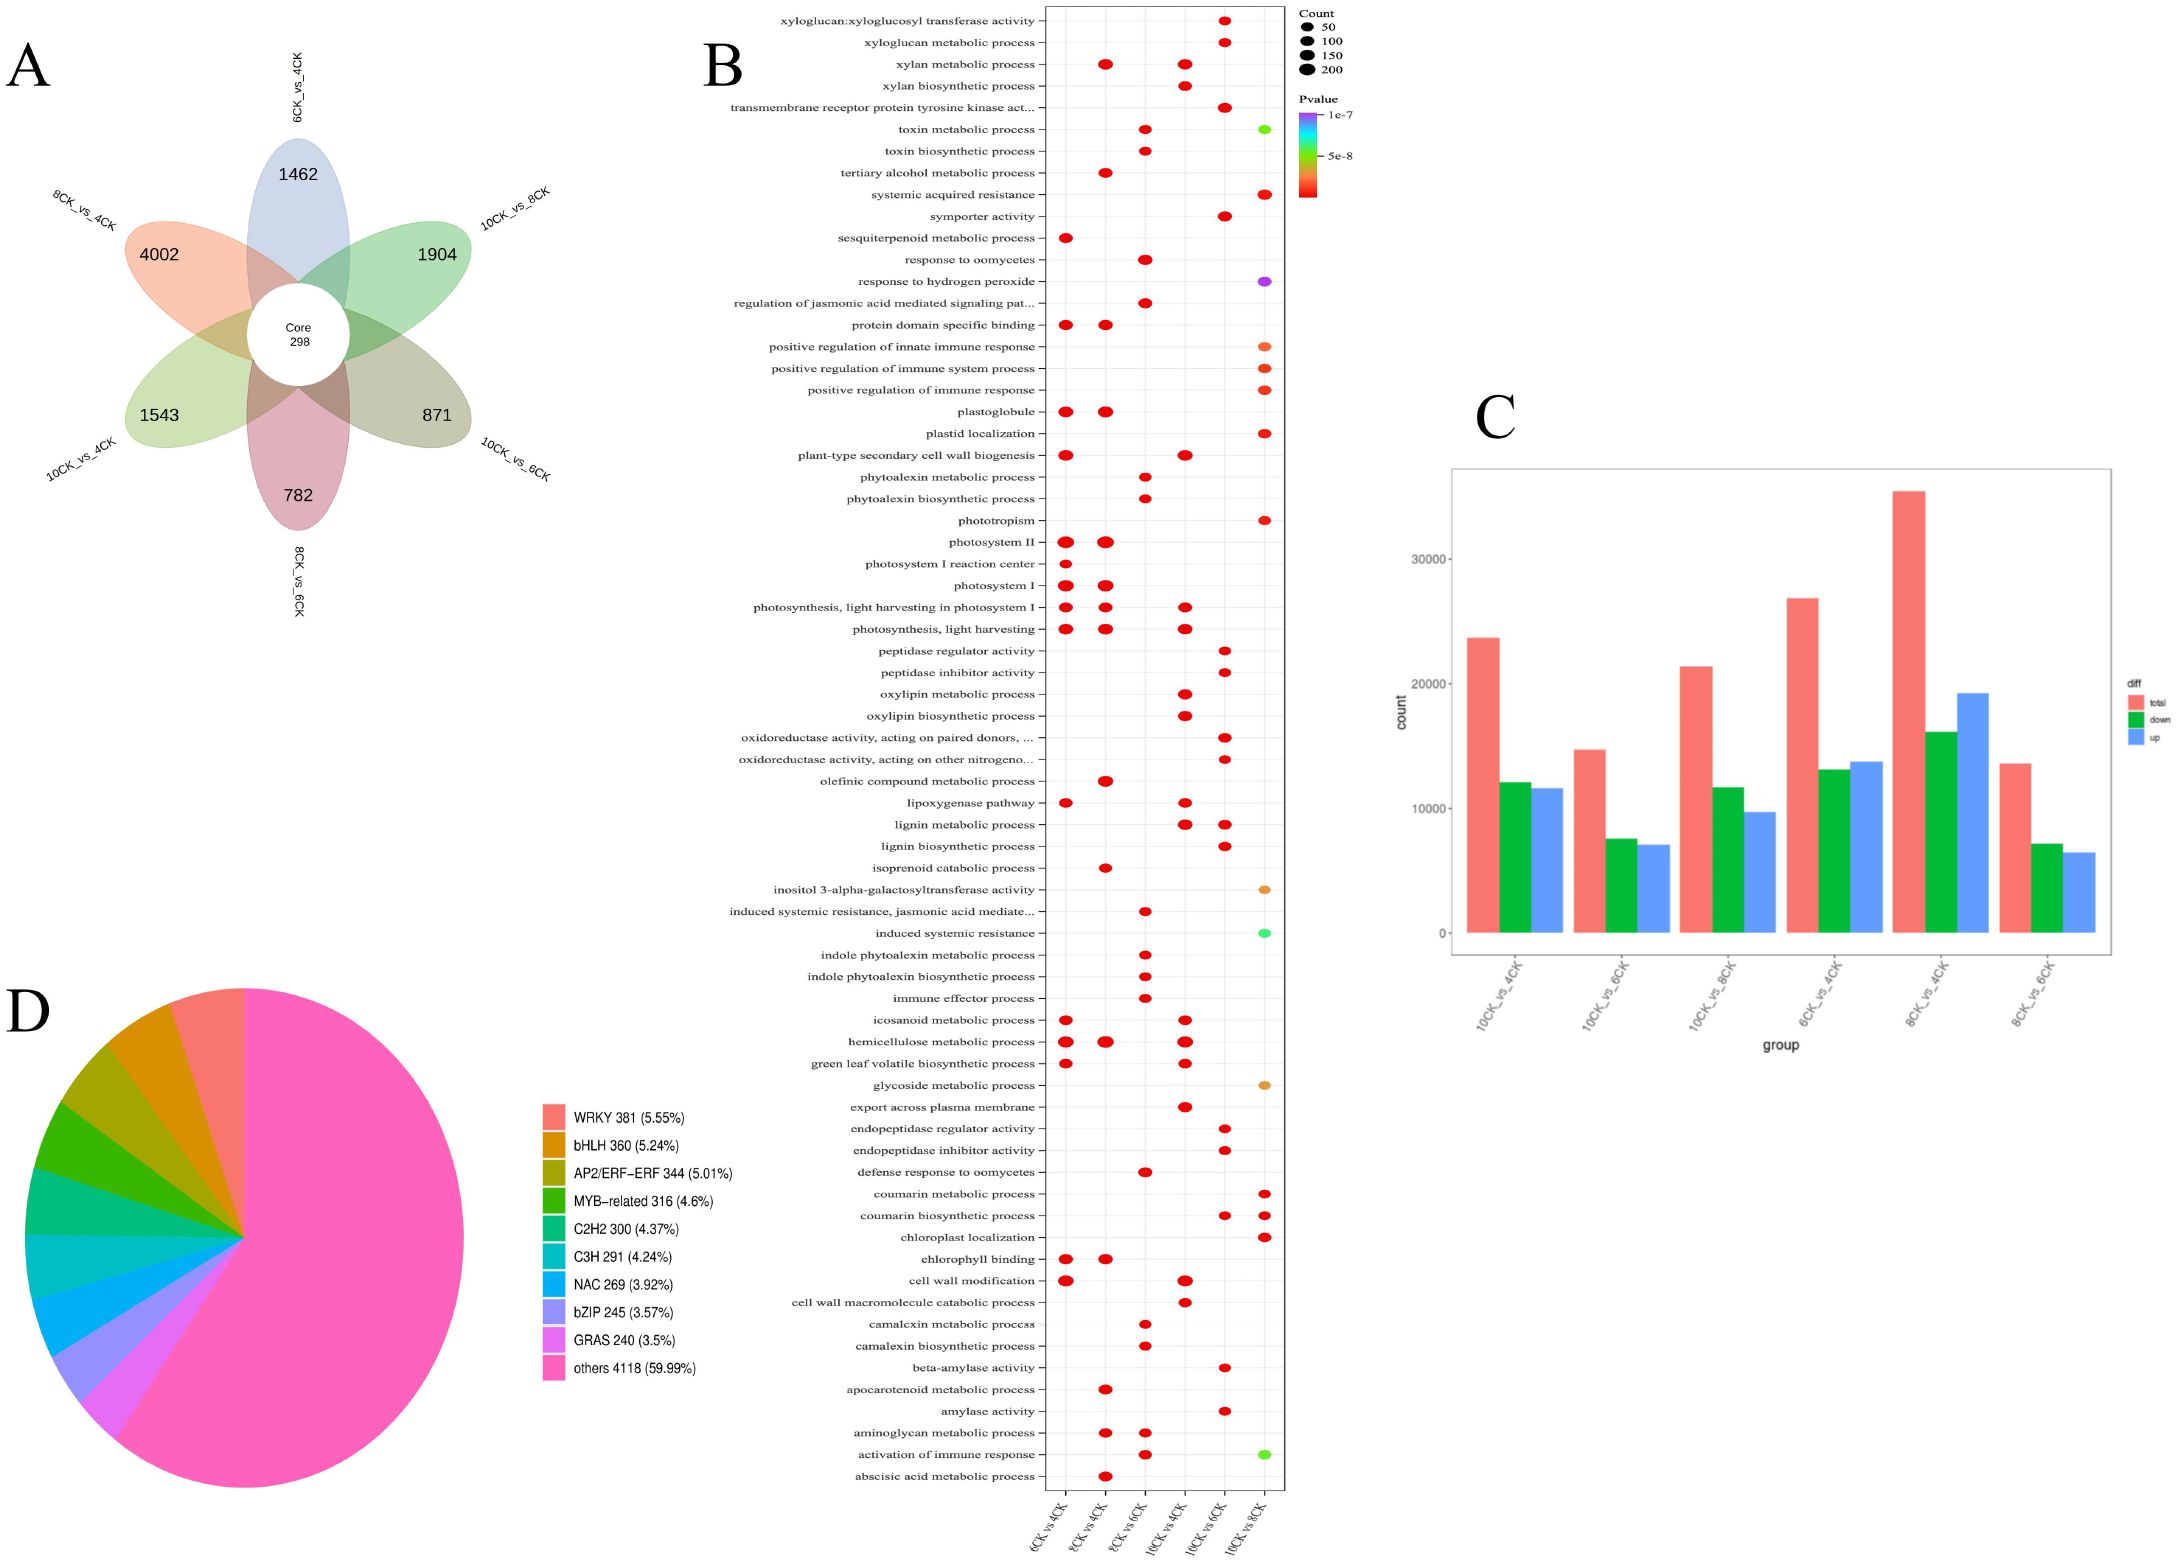
Figure 5. (A) Pairwise comparison of differentially expressed gene (DEG) petal diagram. (B) Pairwise comparison GO enrichment bubble plot. (C) Bar chart of upregulated and downregulated genes in pairwise comparisons. (D) Pie chart of transcription factor distribution among all genes.
A total of 148,737 genes were detected, with 51,291 identified as DEGs, based on the criteria of |log2 FC| ≥ 1 and FDR < 0.05. DEGs across comparisons include: 26,886 between 6CK and 4CK (13,139 downregulated, 13,747 upregulated), 35,464 between 8CK and 4CK (16,178 downregulated, 19,286 upregulated), 13,645 between 8CK and 6CK (7,191 downregulated, 6,454 upregulated), 23,720 between 10CK and 4CK (12,092 downregulated, 11,628 upregulated), 14,687 between 10CK and 6CK (7,560 downregulated, 7,127 upregulated), and 21,394 between 10CK and 8CK (11,667 downregulated, 9,727 upregulated) (Figure 5C). KEGG enrichment analysis of DEGs and DAMs identified the top 25 enriched pathways (Supplementary Figure S3). Transcription factors were largely classified into the WRKY, bHLH, MYB-related, and AP2/ERF families (Figure 5D).
The chord diagram (Figure 6) shows the complex relationships between different gene clusters and associated biological functions, revealing key pathways involved in photosynthesis, metabolic processes, and potentially other cellular functions. The circular plot (Figure 7) visualizes the results of a GO enrichment analysis, highlighting the significant biological processes, cellular components, and molecular functions enriched in the up-regulated and down-regulated gene sets.
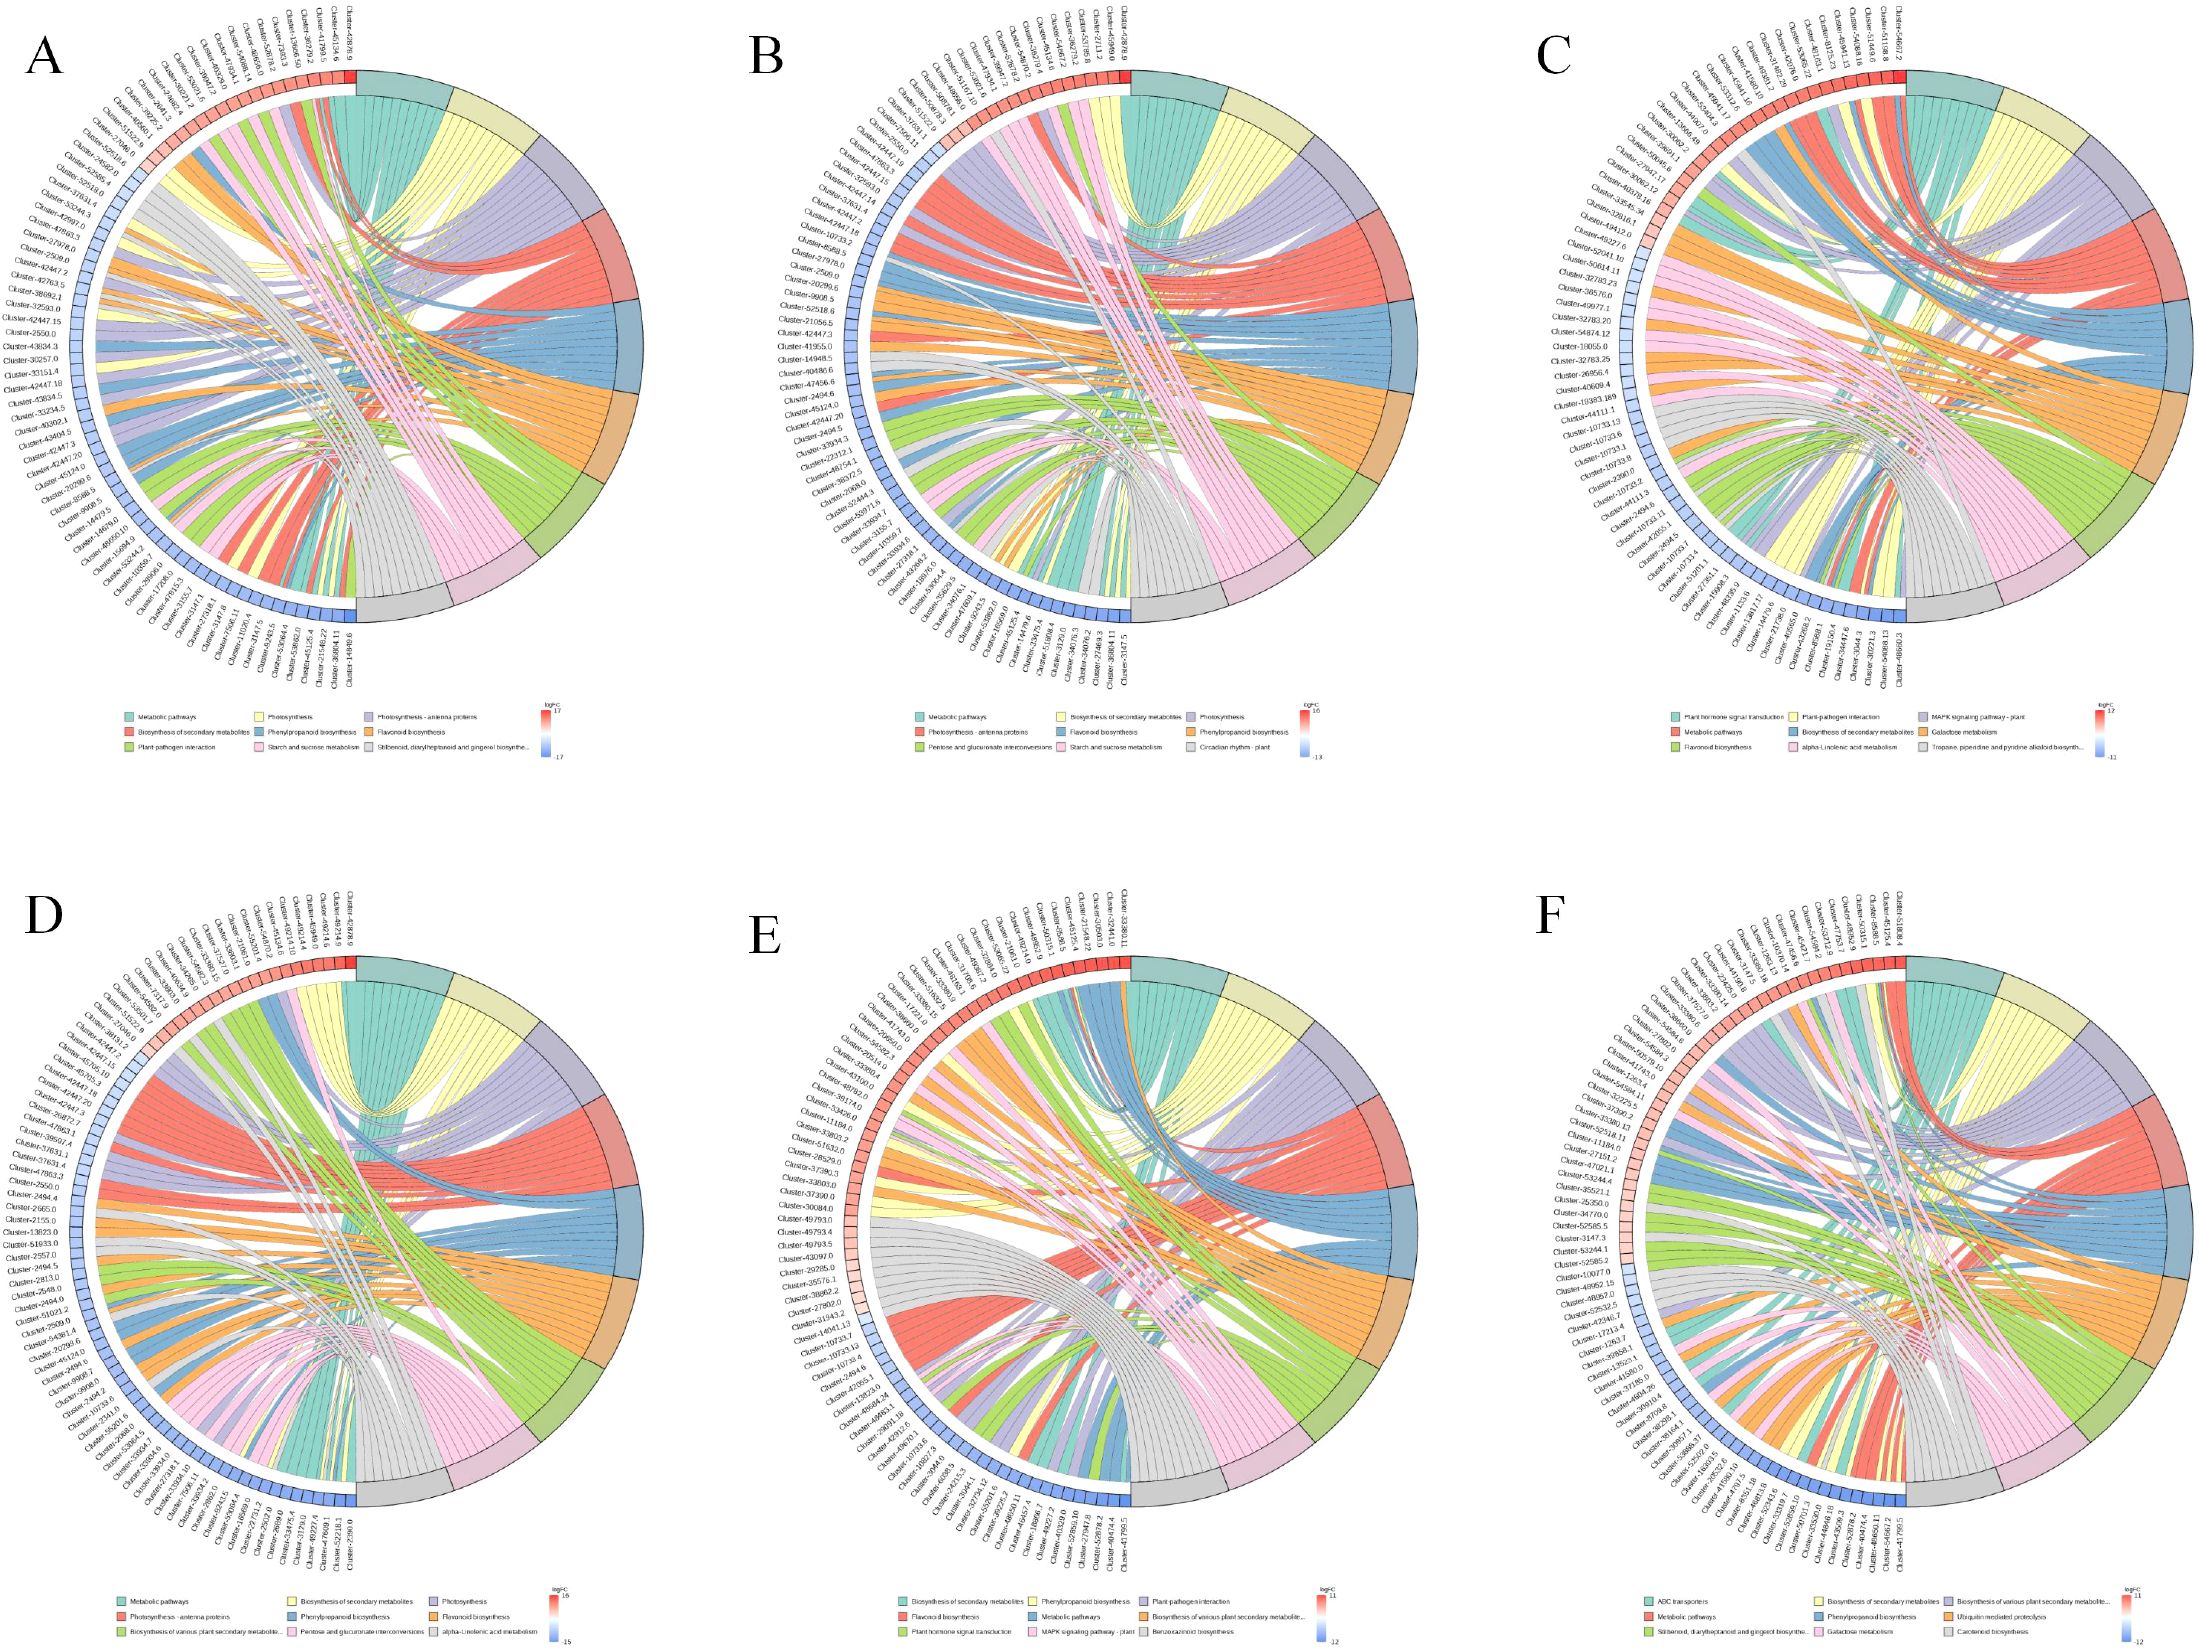
Figure 6. GO Enrichment chordplot. (A) 6CK vs 4CK, (B) 8CK vs 4CK, (C) 10CK vs 4CK, (D) 8CK vs 6CK, (E) 10CK vs 6CK, and (F) 10CK vs 8CK.
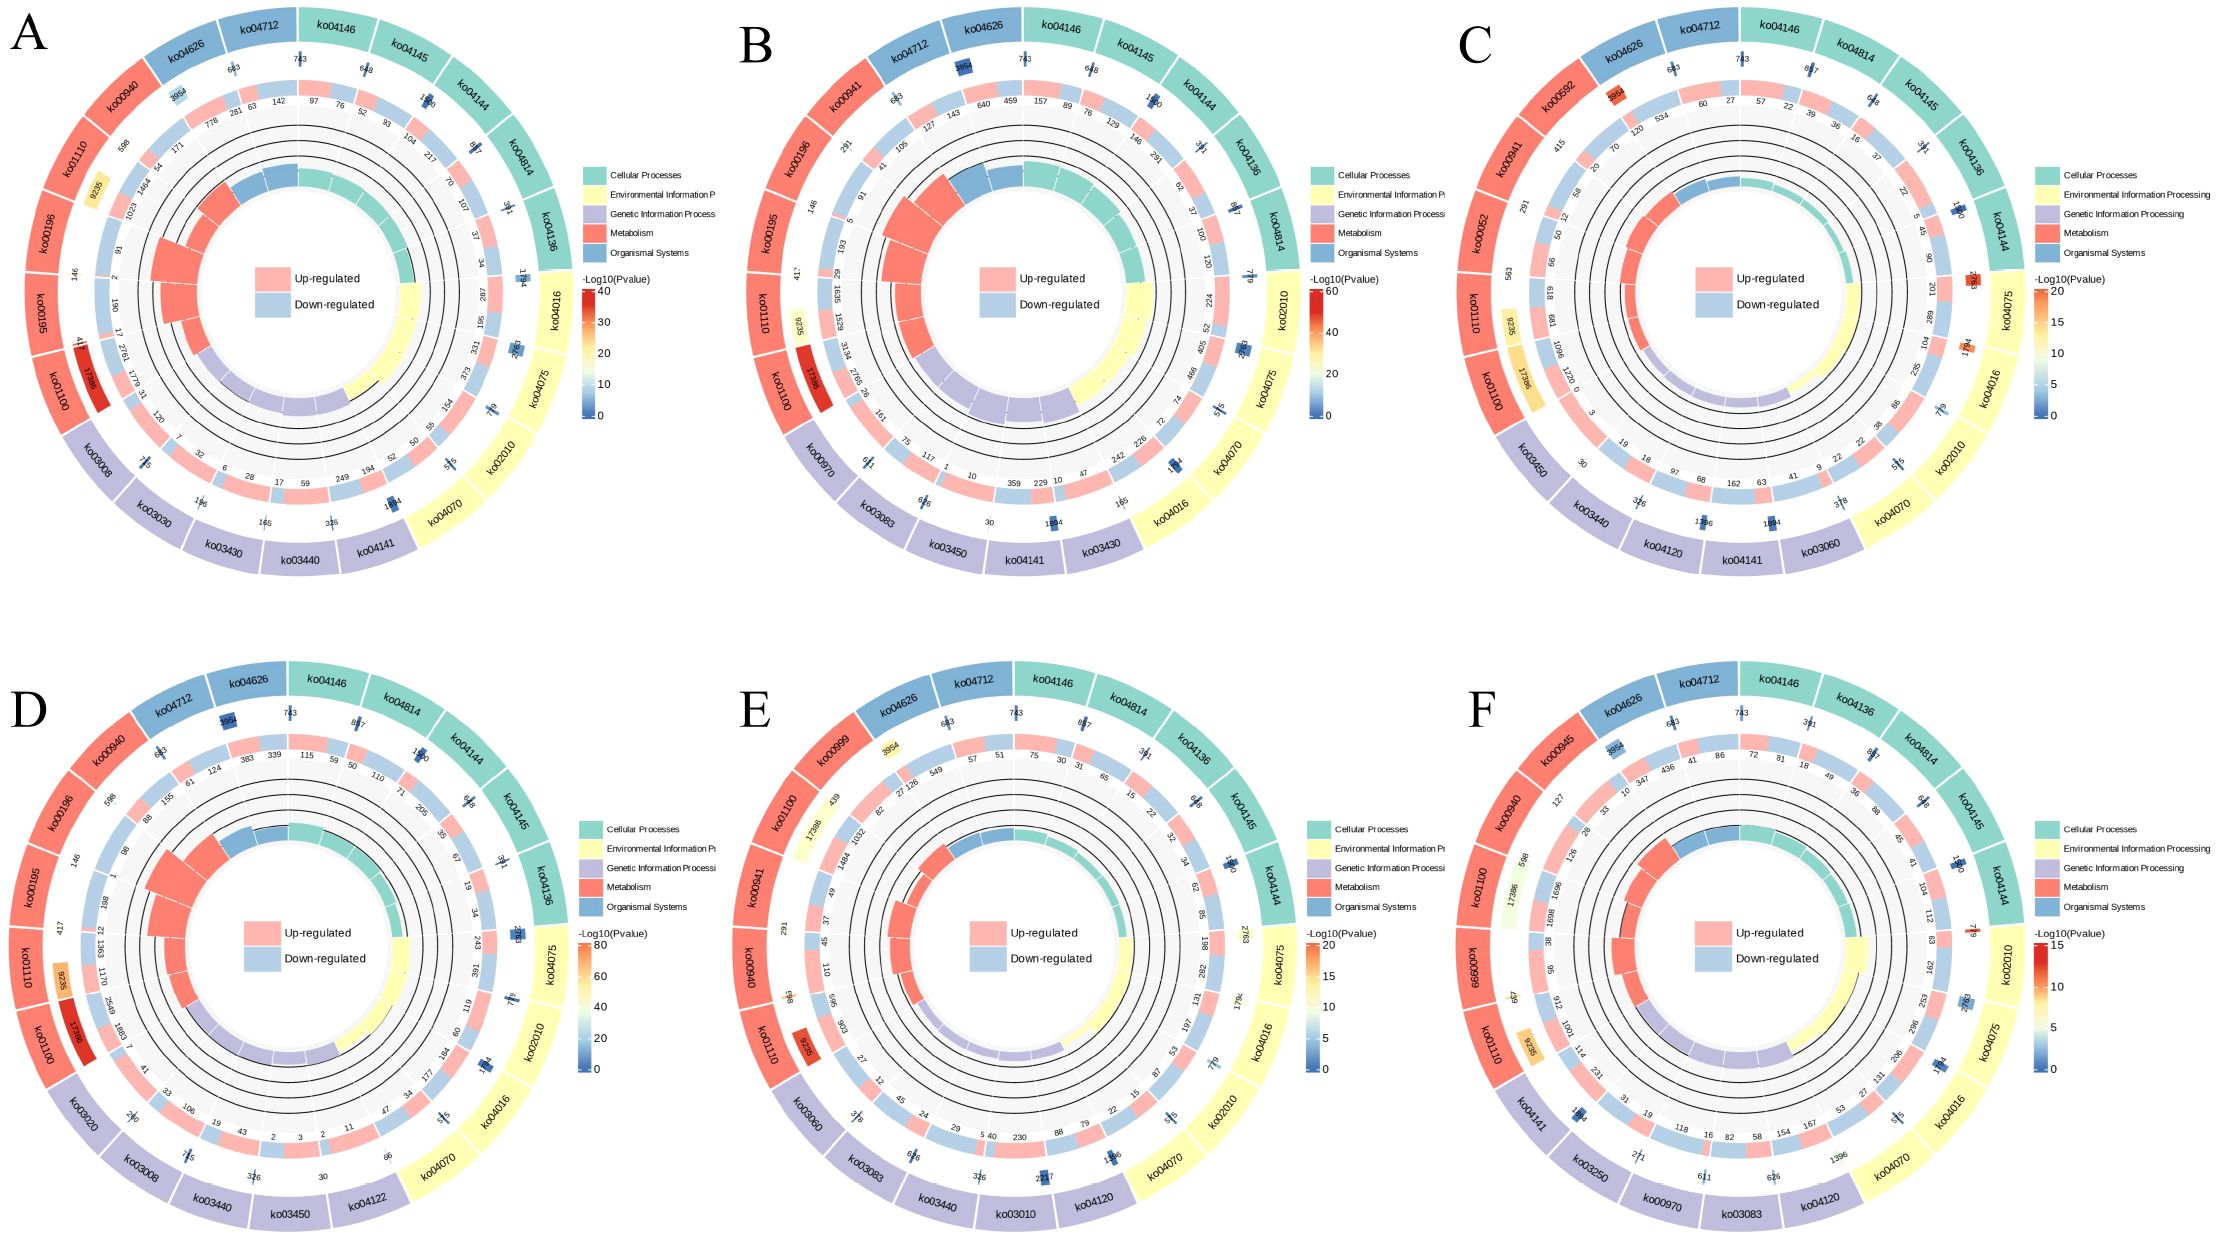
Figure 7. GO Enrichment circos. (A) 6CK vs 4CK, (B) 8CK vs 4CK, (C) 10CK vs 4CK, (D) 8CK vs 6CK, (E) 10CK vs 6CK, and (F) 10CK vs 8CK.
In the transcriptome analysis, the 6CK vs. 4CK, 8CK vs. 4CK, and 10CK vs. 4CK comparisons were enriched in metabolic pathways and secondary metabolite biosynthesis (Figure 8). The 8CK vs. 6CK pathways focused on plant hormone signal transduction and metabolism. For the metabolome, enriched pathways included linoleic acid metabolism, cyanoamino acid metabolism, and arginine biosynthesis. In the 10CK vs. 6CK comparison, transcriptome pathways were enriched in secondary metabolite and phenylpropanoid biosynthesis, while metabolome pathways involved arginine biosynthesis and lysine degradation. The 10CK vs. 8CK comparison showed enrichment in ABC transporters and secondary metabolite biosynthesis at the transcriptome level, and linoleic acid metabolism and glycerophospholipid metabolism in the metabolome. Unigene pathways are listed in Supplementary Table S4.
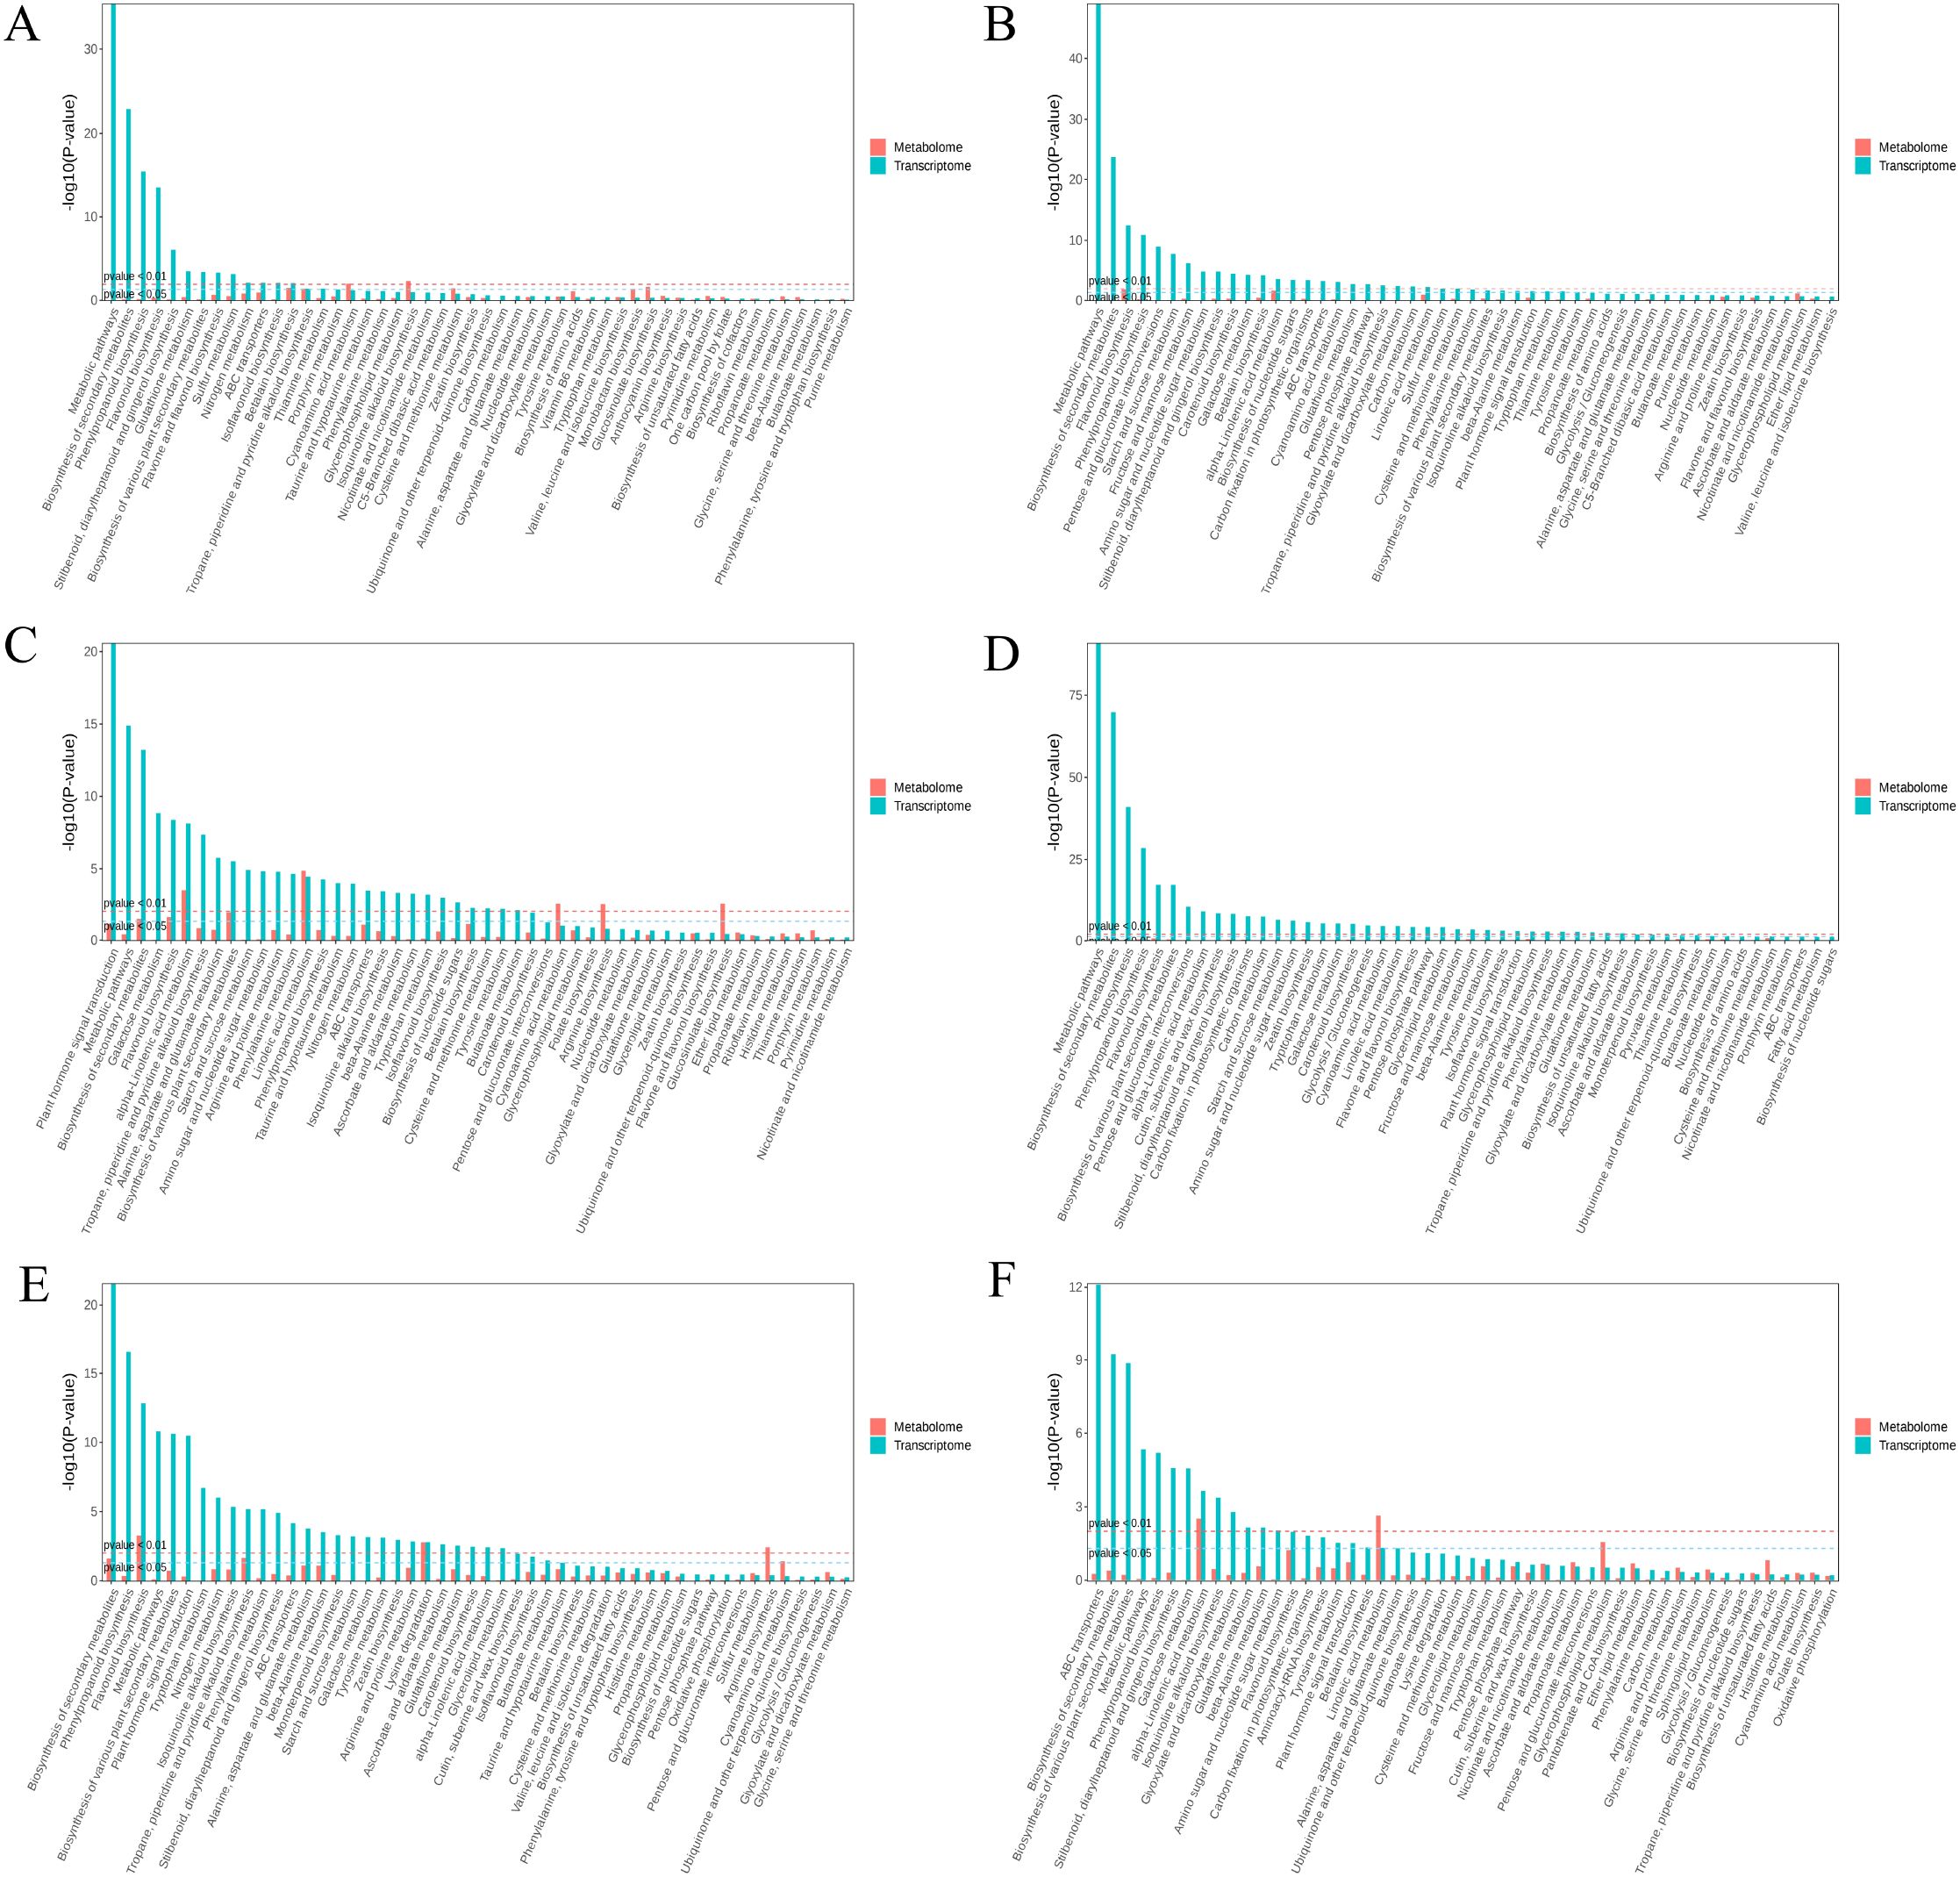
Figure 8. KEGG enrichment analysis for metabolome and transcriptome: (A) 6CK vs. 4CK, (B) 8CK vs. 4CK, (C) 8CK vs. 6CK, (D) 10CK vs. 4CK, (E) 10CK vs. 6CK, and (F) 10CK vs. 8CK.
3.4 The key bioactive metabolites and enzyme activities in Tilia miqueliana Maxim.
In Tilia miqueliana Maxim. leaves, flavonoids were the most abundant bioactive compounds, followed by phenolic acids, coumarins, and other substances. Key flavonoids, including catechin, hesperetin, and quercetin, along with lignans (syringaresinol) and triterpenoids (corosolic acid), were identified. Tiliroside and resveratrol, known for their antidepressant and anticancer properties, were first detected in these leaves (Supplementary Table S3, Supplementary Figure S4). Flavonoid content was lowest in April and highest in June and August, with a decrease in October (Figure 9A). Phenolic acid peaked in June and was lowest in April (Figure 9B). Total amino acids increased in August and decreased in October (Figure 9C). Coumarin levels were highest in June, with significant variation between months (Figure 9D). Enzymes involved in the phenylalanine pathway—PAL, C4H, and 4CL—showed varying activity across months. PAL activity peaked in August (Figure 9E), C4H steadily increased, with the highest activity in October (Figure 9F), while 4CL activity was lowest in August (Figure 9G). These enzymes drive the flavonoid biosynthesis pathway.
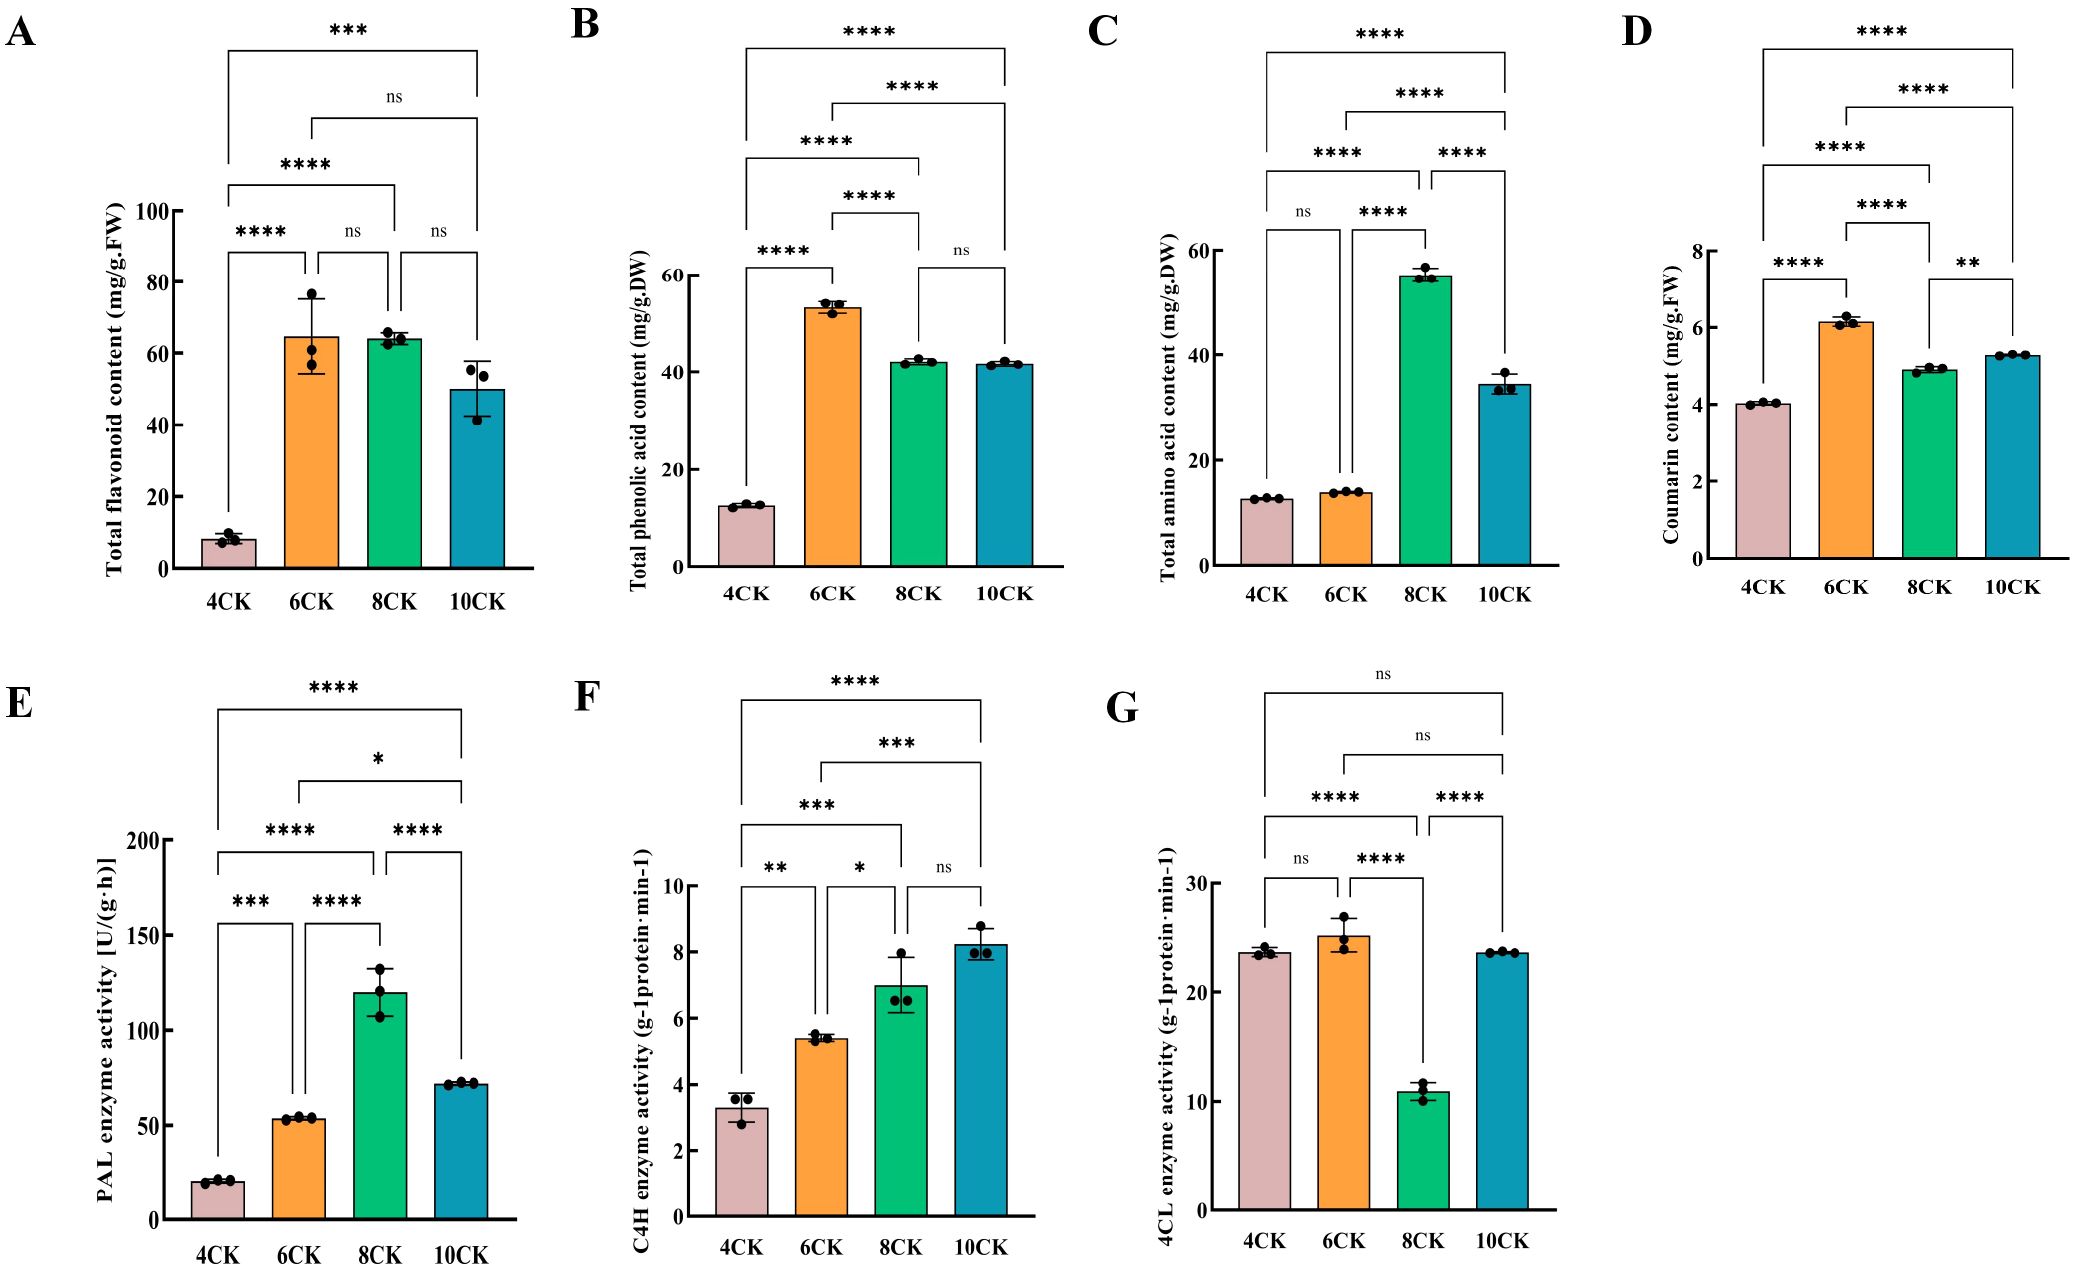
Figure 9. (A) Total flavonoid content, (B) Total phenolic content, (C) Total amino acid content, (D) Total coumarin content, (E) PAL enzyme activity, (F) C4H enzyme activity, (G) 4CL enzyme activity. #:* (one asterisk): Indicates a statistically significant difference with a p-value between 0.01 and 0.05. p < 0.05. ** (two asterisks): Indicates a statistically significant difference with a p-value between 0.001 and 0.01. p < 0.01. *** (three asterisks): Indicates a highly statistically significant difference with a p-value between 0.0001 and 0.001. p < 0.001. **** (four asterisks): Indicates an extremely statistically significant difference with a p-value less than 0.0001. p < 0.0001.
Kaempferol, quercetin, luteolin, isorhamnetin, and scopoletin are the main active compounds contributing to the pharmacological effects in Tilia miqueliana Maxim. leaves (Du et al., 2009). Kaempferol(0.06 µg/g) and isorhamnetin (0.003 µg/g) were highest in June (Figure 10A). Quercetin (0.182 µg/g) exhibited the highest content in August, with values of 0.138 µg/g and 0.145 µg/g observed in April and October, respectively. The lowest content was recorded in June (Figure 10B). Luteolin content was lowest in April(0.0682 µg/g) and highest in August(0.516 µg/g), with significant differences observed across all months (p<0.0001), but no difference between June and October (Figure 10C). Isorhamnetin content in June was significantly higher than in April and August (p<0.05), with no significant differences between other months (Figure 10D). Scopoletin content increased progressively from April to October, with no significant difference between April and June. August showed higher levels than June (p<0.001), and October (0.0536 µg/g) had the highest content compared to all other months (p<0.0001) (Figure 10E).
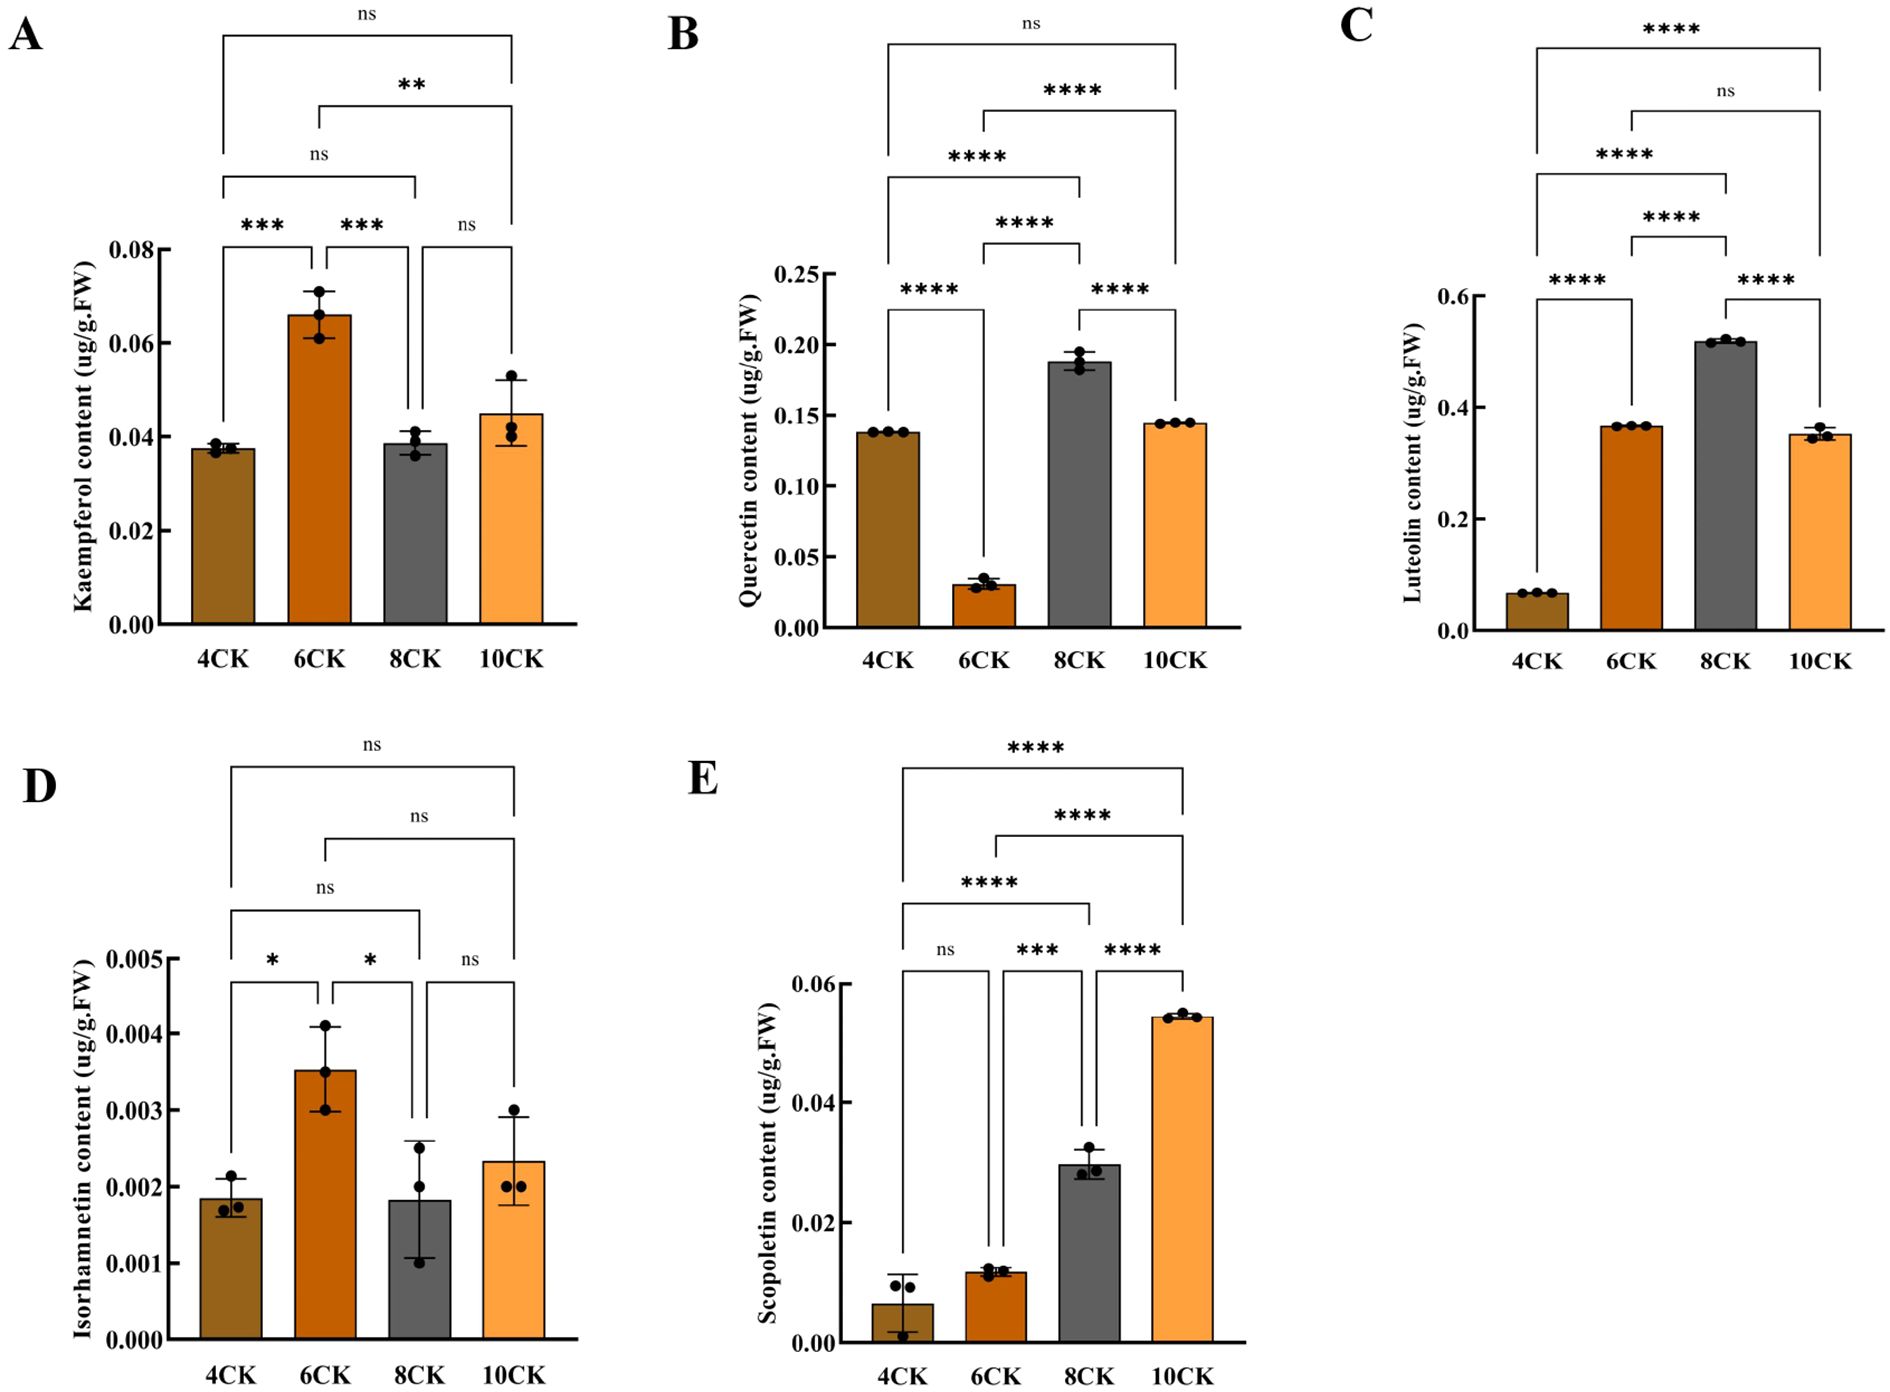
Figure 10. (A) Kaempferol content, (B) Quercetin content, (C) Luteolin content, (D) Isorhamnetin content, (E) Scopoletin content. #:* (one asterisk): Indicates a statistically significant difference with a p-value between 0.01 and 0.05. p < 0.05. ** (two asterisks): Indicates a statistically significant difference with a p-value between 0.001 and 0.01. p < 0.01. *** (three asterisks): Indicates a highly statistically significant difference with a p-value between 0.0001 and 0.001. p < 0.001. **** (four asterisks): Indicates an extremely statistically significant difference with a p-value less than 0.0001. p < 0.0001.
The correlations between the enzymes PAL, C4H, and 4CL and various compounds in Tilia miqueliana Maxim. leaves exhibit distinct and significant patterns. Both PAL and C4H demonstrate strong, highly significant correlations with flavonoids and phenolic acids (p<0.01, r>0.4), while 4CL shows weak or non-significant correlations with these metabolites (p>0.05, r<0.2). In the case of amino acids, PAL and 4CL exhibit strong, highly significant correlations (p<0.01, r>0.4), whereas C4H displays a moderate but significant correlation (0.01<p<0.05, 0.2<r<0.4). Similarly, PAL and C4H are strongly correlated with coumarins (p<0.01, r>0.4), while 4CL shows a weak, non-significant correlation (p>0.05, r<0.2). Regarding specific flavonoids, all three enzymes exhibit weak or non-significant correlations with kaempferol, quercetin, and isorhamnetin (p>0.05, r<0.2). Notably, PAL and C4H show strong, highly significant correlations with luteolin (p<0.01, r>0.4), while 4CL presents a moderate but significant correlation (0.01<p<0.05, 0.2<r<0.4). For scopoletin, C4H exhibits a strong, highly significant correlation (p<0.01, r>0.4), PAL shows a moderate but significant correlation (0.01<p<0.05, 0.2<r<0.4), and 4CL demonstrates a weak, non-significant correlation (p>0.05, r<0.2) (Figure 11).
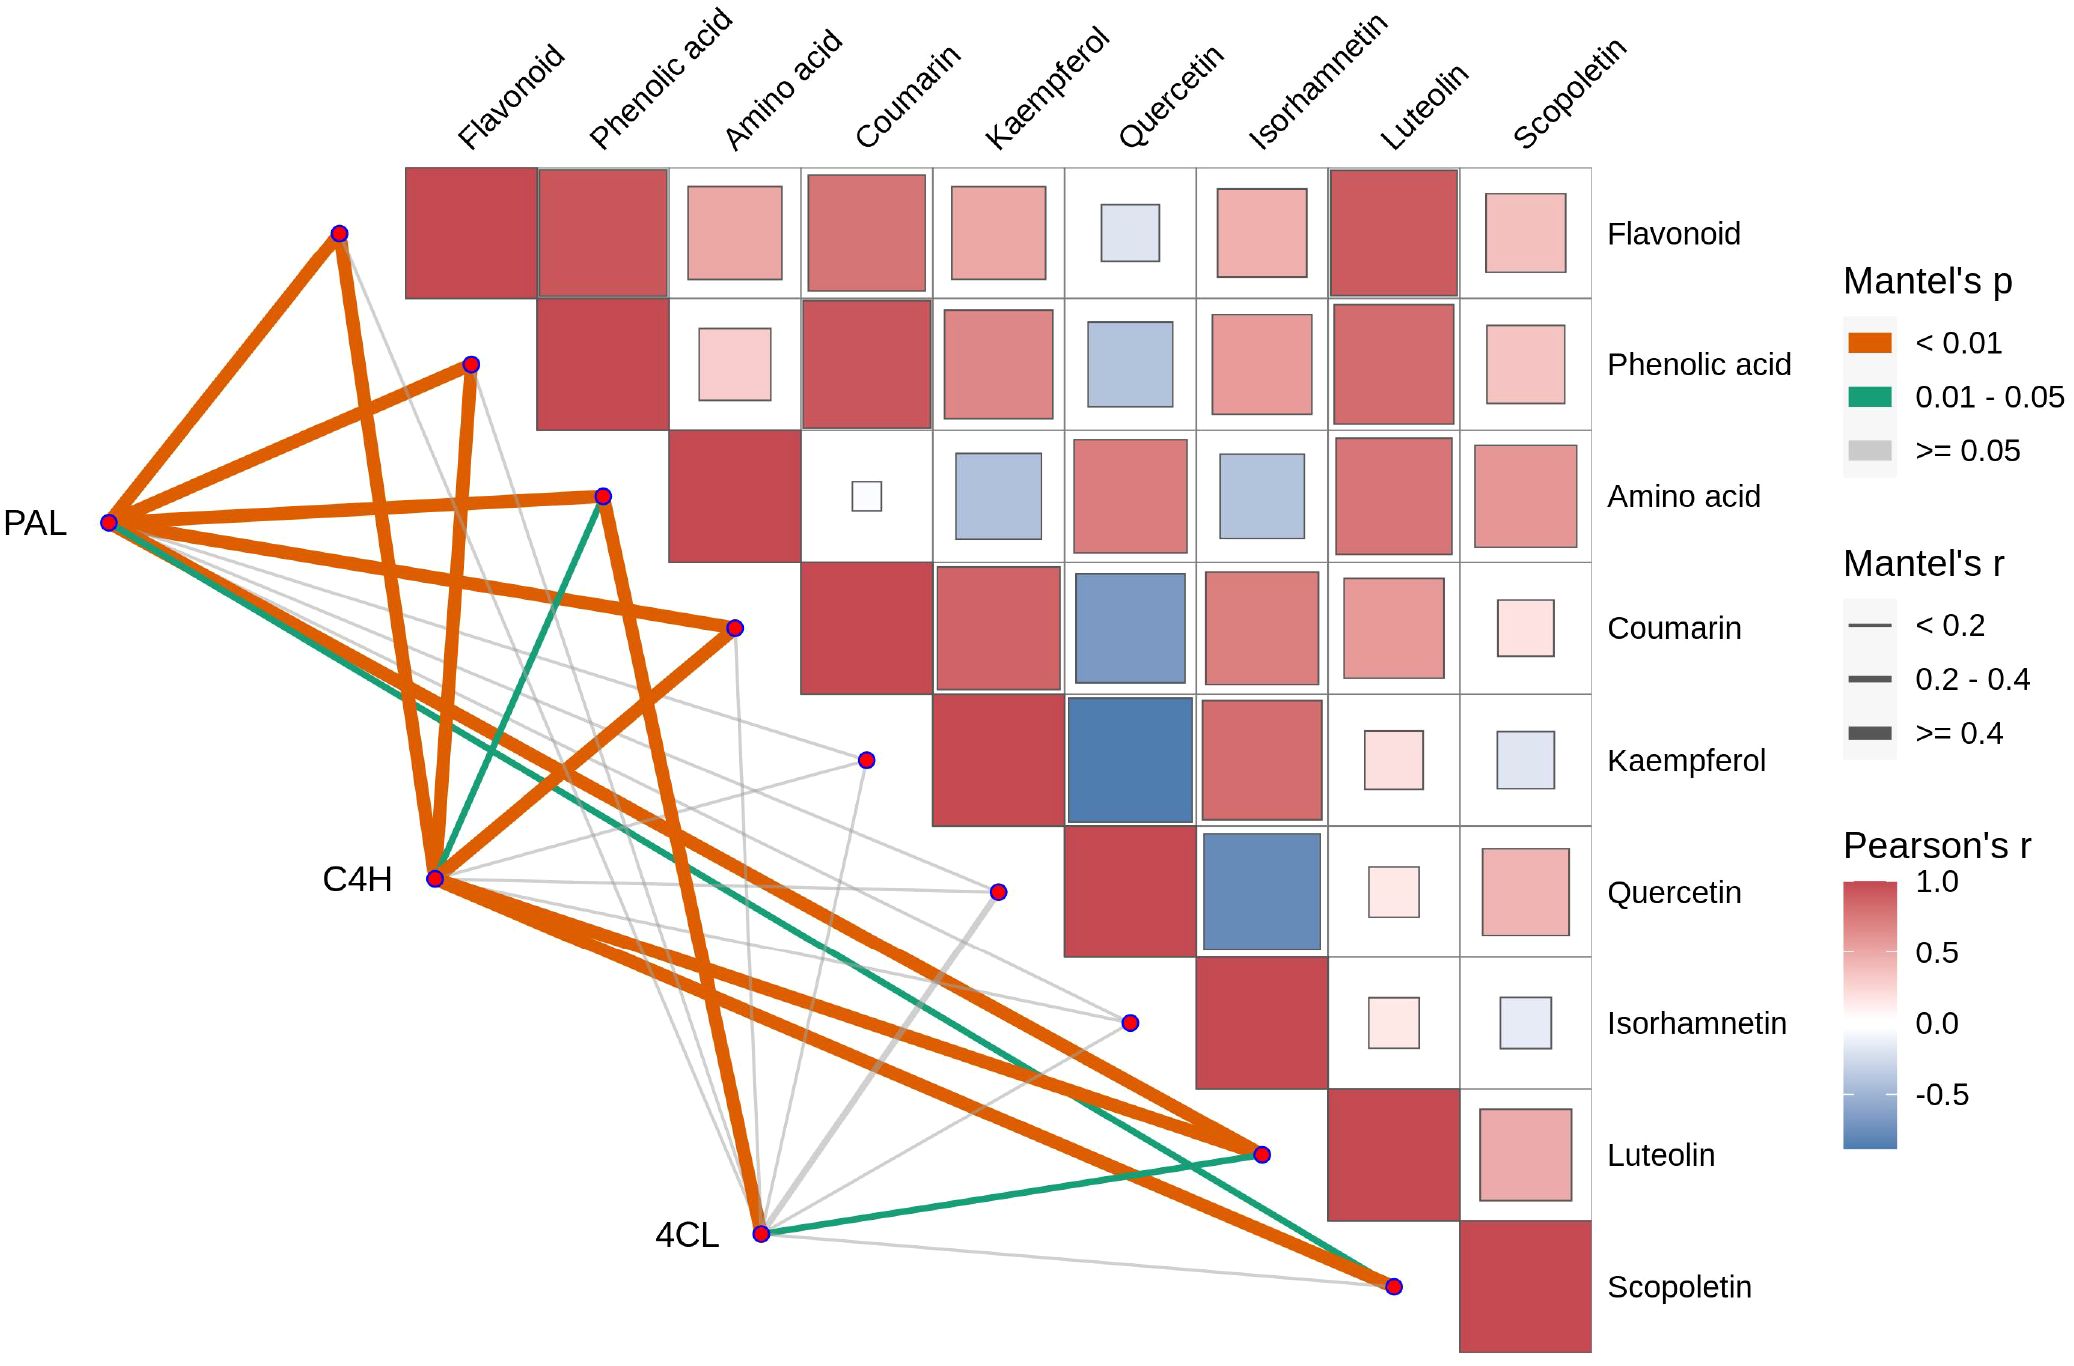
Figure 11. Mantel Test and Pearson correlation coefficient analysis of the relationships between various compounds (flavonoid, phenolic acid, amino acid, coumarin, kaempferol, quercetin, isorhamnetin, luteolin, scopoletin) and the enzymes PAL, C4H, and 4CL. Metabolic modules with significant Mantel correlations (p < 0.05 and r ≥ 0.2) with key enzymes should be prioritized. In the Pearson’s r heatmap, red denotes positive correlations, with darker shades indicating stronger correlations, while blue represents negative correlations, with darker shades indicating stronger negative correlations. White represents no significant or near-zero correlation. In the Mantel test, orange p-values (< 0.01) indicate highly significant correlations, green p-values (0.01-0.05) indicate significant correlations, and gray p-values (> 0.05) indicate non-significant correlations. Line thickness reflects Mantel’s r: thick lines (r ≥ 0.4) indicate strong correlations, medium lines (r = 0.2-0.4) indicate moderate correlations, and thin lines (r < 0.2) indicate weak correlations.
3.5 WGCNA Analysis of piceid, coumarins, and flavonoids
To explore circadian relationships between the transcriptome and metabolome, we constructed a co-expression network using WGCNA, correlating 3 piceids, 43 coumarins, and 146 flavonoids (including 19 apigenins, 21 luteolins, 14 isorhamnetins, 44 kaempferols, and 48 quercetins) across different growth stages. Sixteen distinct modules were identified, labeled as brown, black, green, cyan, purple, midnight blue, tan, blue, red, green-yellow, turquoise, salmon, pink, magenta, yellow, and grey (Figure 12). Piceid was positively correlated with the brown, tan, and magenta modules, and negatively correlated with the blue, red, and turquoise modules. Coumarins showed positive correlations with the blue, red, and green modules, and negative correlations with the tan, midnight blue, and magenta modules. Apigenin strongly correlated with the brown, tan, and magenta modules, especially the brown module, which was positively correlated with specific apigenin derivatives, such as 8-Methoxyapigenin (MWSHC20110), Apigenin-7-O-(6’’-p-Coumaryl)glucoside (Lmpp003930), Apigenin-7-O-Gentiobioside (Wajp004095), Apigenin-7-O-neohesperidoside (Rhoifolin) (MWSmce498), Apigenin-7-O-rutinoside (Isorhoifolin) (pme0368), and Apigenin-7-O-rutinoside-4’-O-rhamnoside (Hmmp002447) (Supplementary Figure S5). Isorhamnetins, kaempferols, and quercetins had the strongest positive correlations with the yellow module and negative correlations with the black module. Flavonoids were positively correlated with the yellow, magenta, pink, salmon, turquoise, red, and midnight blue modules, but negatively correlated with the brown, black, green, and purple modules. The black and green modules were negatively correlated with all metabolites except coumarins, whereas the midnight blue and magenta modules showed the opposite trend (Cui et al., 2024).
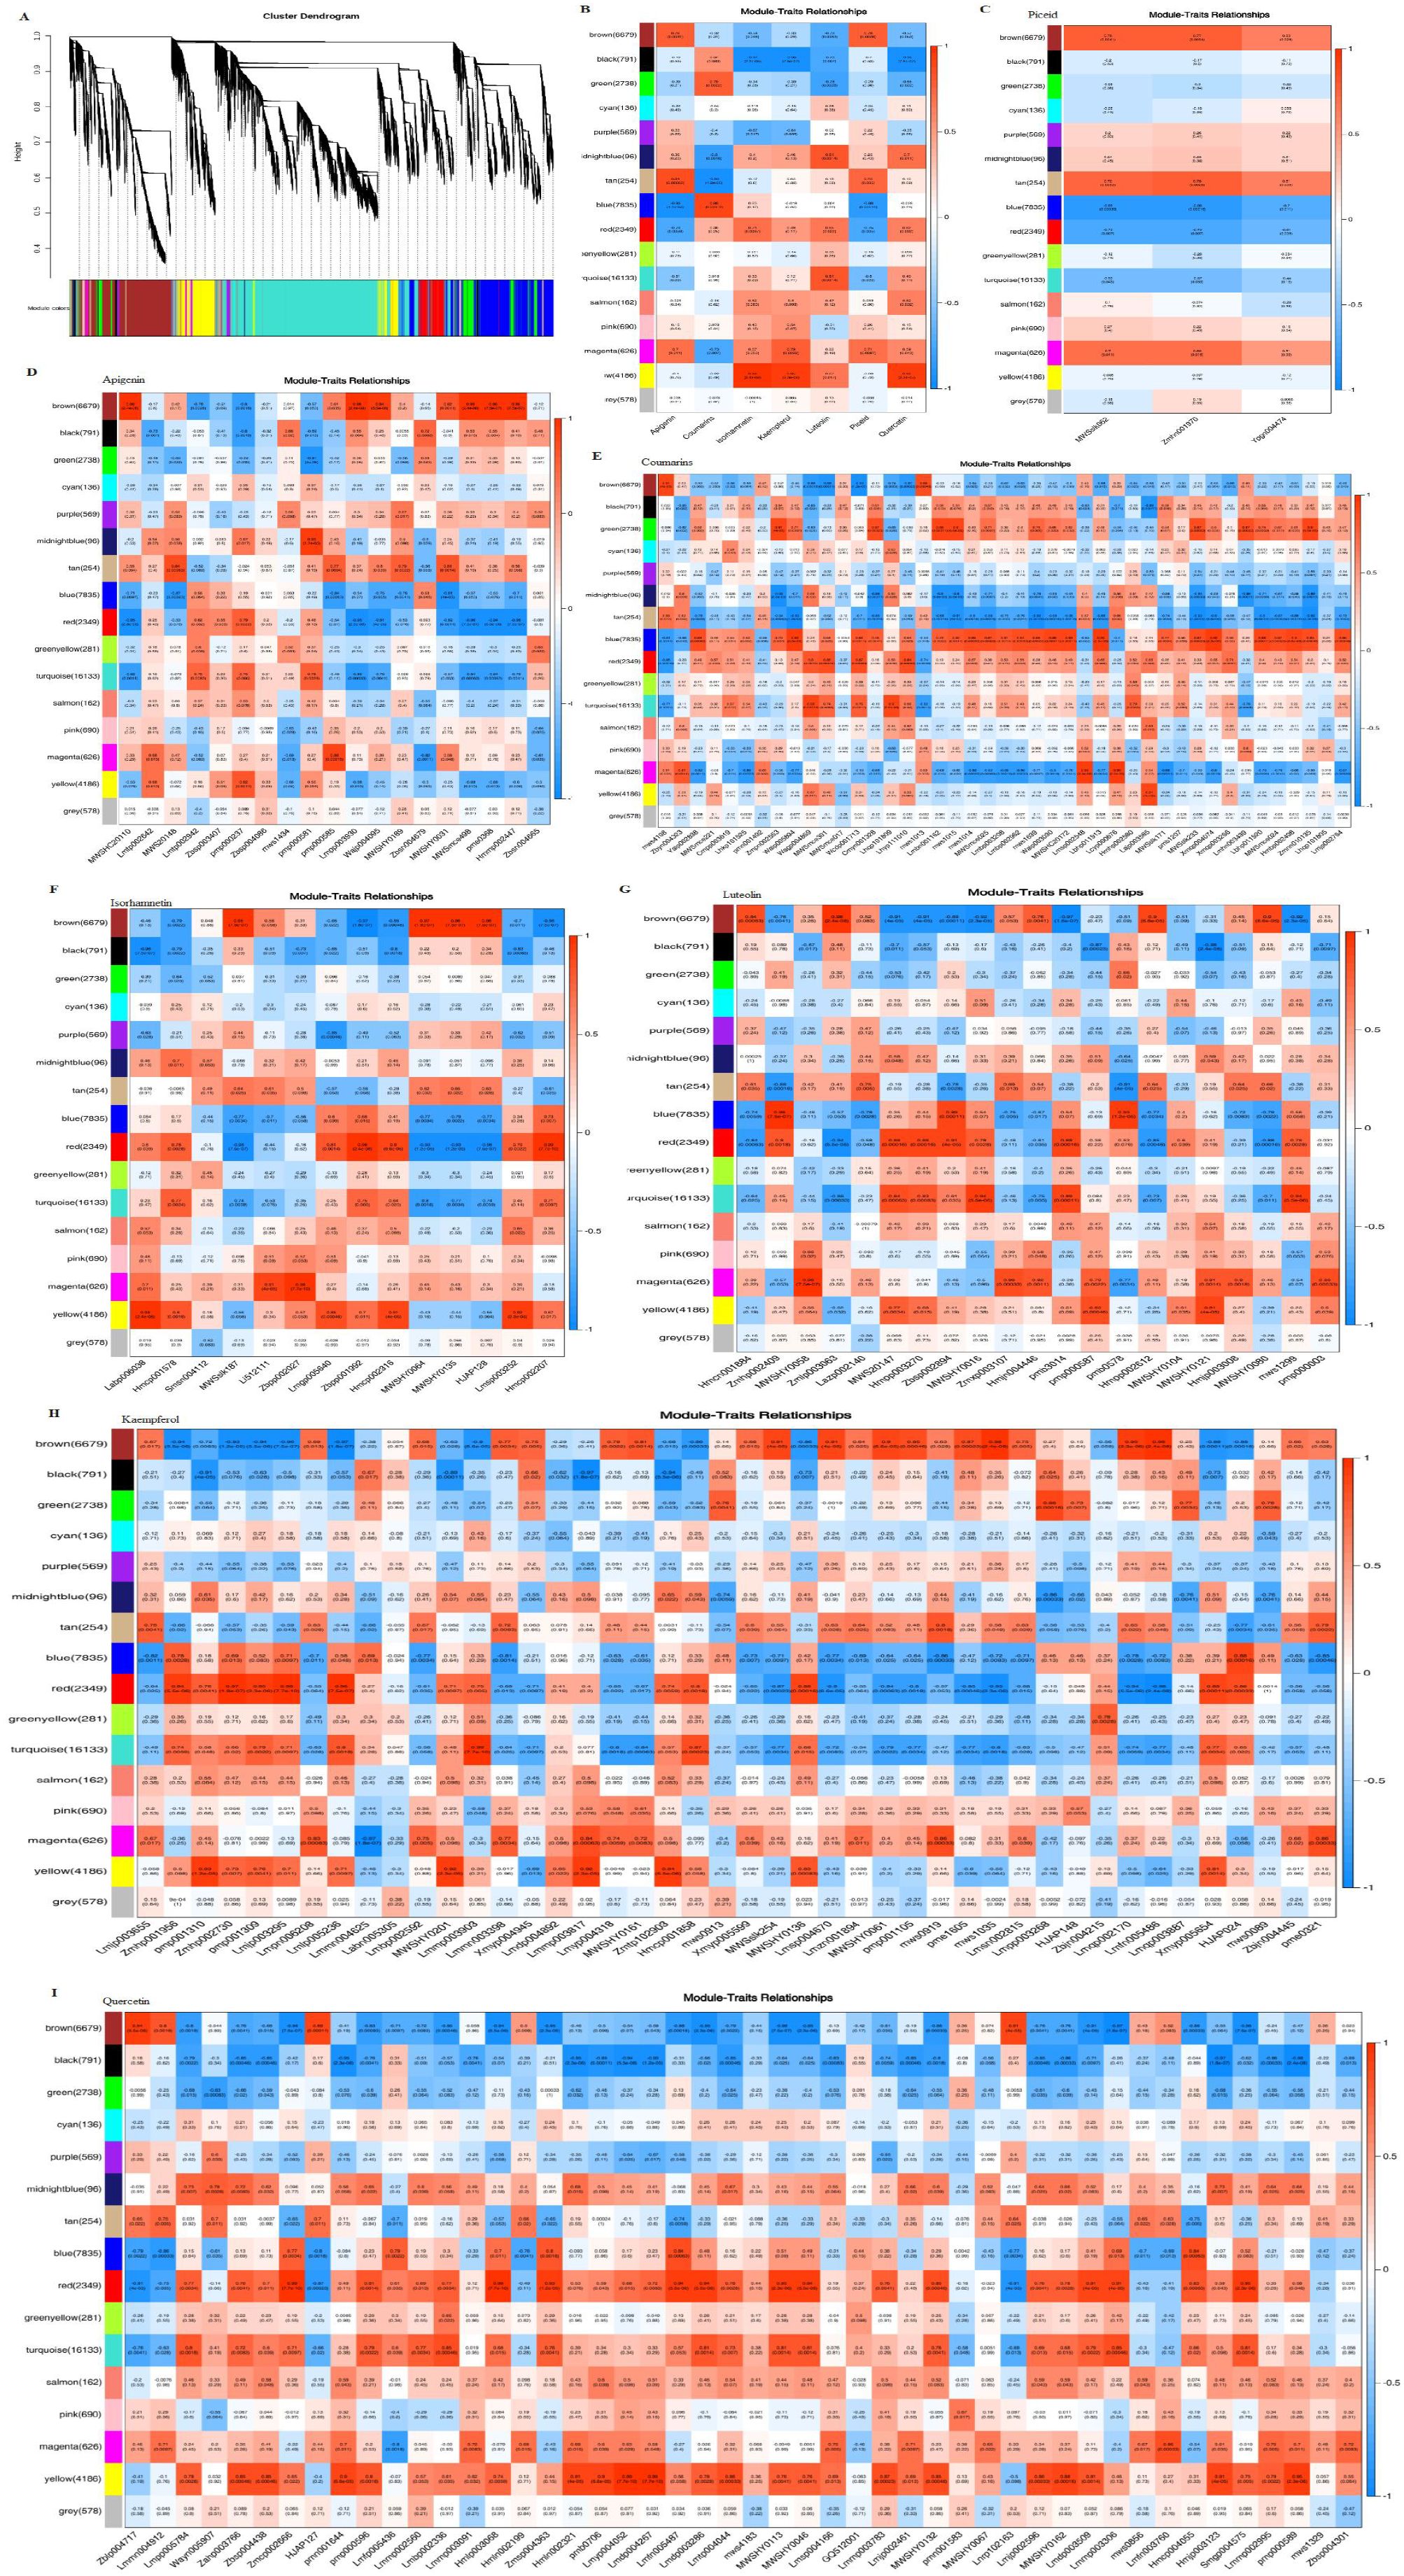
Figure 12. Correlation of seven major bioactive metabolites with WGCNA gene modules: (A) Hierarchical cluster dendrogram of 16 expression modules. (B) Relationship analysis of the seven major bioactive metabolites. (C) Module-piceid relationship analysis. (D) Module-apigenin relationship analysis. (E) Module-coumarin relationship analysis. (F) Module-isorhamnetin relationship analysis. (G) Module-luteolin relationship analysis. (H) Module-kaempferol relationship analysis. (I) Module-quercetin relationship analysis. Each box contains values representing the correlation and significance between the module and the metabolites, with the numbers in each cell indicating the correlation coefficient (r), and the numbers in parentheses representing the p-value. Red indicates a positive correlation, while blue represents a negative correlation. The intensity of the color reflects the strength of the correlation, with darker colors indicating stronger correlations.
4 Discussion
4.1 Bioactive compounds in leaves of Tilia miqueliana Maxim.
Studies have shown that secondary metabolites in Tilia species, including flavonoids, phenolic compounds, and terpenoids, exhibit significant variability depending on developmental stages and environmental factors (Borghi and Fernie, 2021; Bao and Shen, 2022; Cai et al., 2023). For instance, the flavonoid profiles in Tilia miqueliana Maxim., Tilia cordata, Tilia amurensis, and Tilia tomentosa are influenced by growth stage, with distinct variations observed in the leaves, bracts, and flowers of these species. Similarly, flavonoid and phenolic compound content in other species, such as Picea abies (Pinaceae) and Olea europaea, exhibit seasonal fluctuations (Kabbash et al., 2023). In Tilia miqueliana Maxim., flavonoids, particularly flavonols, show marked seasonal changes, with peak concentrations of compounds like Naringenin-7-O-glucoside in early spring (April) and quercetin-3-O-galactoside in mid-summer (June). The overall flavonoid content, including catechins and gallocatechins, is highest during the warmer months, with a notable increase in August. These trends are similar to those observed in tea plants, where the composition of flavonoids, including flavonols, varies depending on the harvest season (Liu et al., 2023). In Actinidia valvata, kaempferol glycosides are most abundant in June, while other flavonoids peak in October, with isorhamnetin glycosides rising sharply from September to October (Du et al., 2016). The phenolic content in Tilia miqueliana Maxim. also peaks in June, consistent with seasonal trends in tea leaves (Zhu et al., 2020).
Coumarins and isoflavones also follow seasonal patterns, with Tilia miqueliana Maxim. showing an increase in these compounds during late summer, likely in response to heightened environmental stress, such as increased light intensity and water evaporation. The upregulation of key enzyme genes like PAL, CHI, and F3H under these conditions contributes to the biosynthesis of these secondary metabolites, which play a role in plant defense mechanisms (Ali, 2013). These compounds, such as kaempferol and quercetin, possess antimicrobial and anti-inflammatory properties, and also act as signaling molecules regulating stress responses in plants (Jan et al., 2022). In vegetables, quercetin glycosides dominate, though kaempferol, luteolin, and apigenin are also present, while fruits primarily contain quercetin glycosides, with only trace amounts of kaempferol and myricetin (Miean and Mohamed, 2001). Flavonoids such as quercetin, kaempferol, and apigenin in Carica papaya leaves exhibit significant biological activities (Nugroho et al., 2017). In chicory, kaempferol and quercetin glucuronides have been identified (Rees and Harborne, 2008), and in grape leaves, quercetin 3-O-glucoside, isorhamnetin 3-O-glucoside, and small amounts of kaempferol 3,7-O-diglycoside are present (Park and Cha, 2003).Tiliroside, a unique flavonoid identified in Tilia miqueliana Maxim., exhibits diverse biological activities, including anti-oxidation, anti-microbial, anti-inflammatory, anti-diabetic, and hepatoprotective effects (Grochowski et al., 2018; Matsuda et al., 2002; Goto et al., 2012; Silva et al., 2013; Luhata and Luhata, 2017; Kaur et al., 2024). Its broad therapeutic potential underscores its significance for health care. Furthermore, studies on Camellia sinensis reveal that light exposure significantly affects phenolic content, with total phenolic levels being higher in July compared to May or September (Soni et al., 2015).
4.2 Structural genes promote the accumulation of flavonoids in the leaves of Tilia miqueliana Maxim.
Flavonoid biosynthesis begins with key precursors: phenylalanine and malonyl CoA, which are derived from the shikimic acid pathway and the TCA cycle. Phenylalanine is converted into cinnamic acid by phenylalanine ammonia lyase (PAL), which is then hydroxylated to p-coumaric acid by cinnamic acid 4-hydroxylase (C4H). P-coumaric acid is subsequently converted into 4-coumaroyl CoA by p-coumaric acid coenzyme A ligase (4CL). Several enzymes, such as FLS, F3H, and UFGT, catalyze further reactions, converting these intermediates into various flavonoid compounds (Cheng et al., 2009; Samanta et al., 2011). Among these enzymes, PAL, C4H, and 4CL play critical roles in flavonoid metabolism, with PAL and C4H showing significant correlations with many metabolites (Du et al., 2024). Studies have shown a positive correlation between quercetin levels and PAL mRNA expression, while C4H expression does not align with quercetin concentration (Cheniany and Ganjeali, 2016). In Camellia sinensis, the biosynthesis of lignin and flavonoids shares a key intermediate, 4CL. Overexpression of the Cs4CL2 gene in leaves significantly increases flavonoid levels (Li et al., 2022). In Tilia miqueliana Maxim., PAL activity is positively correlated with flavonoid content. Research has demonstrated that high expression of PAL, 4CL, and UDP-glucose-flavonoid 3-O-glucosyltransferase (UF3GT) promotes flavonoid accumulation, while high expression of flavonoid 3’-hydroxylase (F3’H) and flavonol synthase (FLS) results in the predominance of flavonols (Park et al., 2023; Lu et al., 2024). The Pearson heatmap analysis in this study revealed a strong positive correlation between flavonoids, phenolic acids, and amino acids, suggesting shared biosynthetic pathways or regulatory mechanisms. In contrast, quercetin, isorhamnetin, and luteolin exhibited weaker correlations with other compounds, implying that these metabolites may have more independent regulation and synthesis pathways. The weak correlation between luteolin and scopoletin suggests their potential independence or distinct roles within the metabolic pathway. Supporting studies have observed similar patterns. In Glycyrrhiza species, key differentially expressed genes (DEGs) involved in flavonoid biosynthesis include CYP81E, PTS, VR, IFR, CYP93B2_16, IF7MAT, and HIDH (Lu et al., 2025). During flower development in Chrysanthemum morifolium ‘Boju’, CYP81E contributes to the biosynthesis of flavonoids like kaempferol (Chu et al., 2024). In Tetrastigma hemsleyanum, genes such as CHS, CHR, and IF7MAT are key to flavonoid and isoflavonoid biosynthesis, particularly under cold stress (Liu et al., 2022). In Sophora alopecuroides L., structural genes like IFS, HID, IF7GT, and IF7MAT regulate isoflavonoid biosynthesis (Huang et al., 2023).The candidate DEGs related to flavonoid biosynthesis identified across the four developmental stages in Tilia miqueliana Maxim. leaves are consistent with those found in other plant species, suggesting a conserved flavonoid biosynthetic pathway (Figure 13).
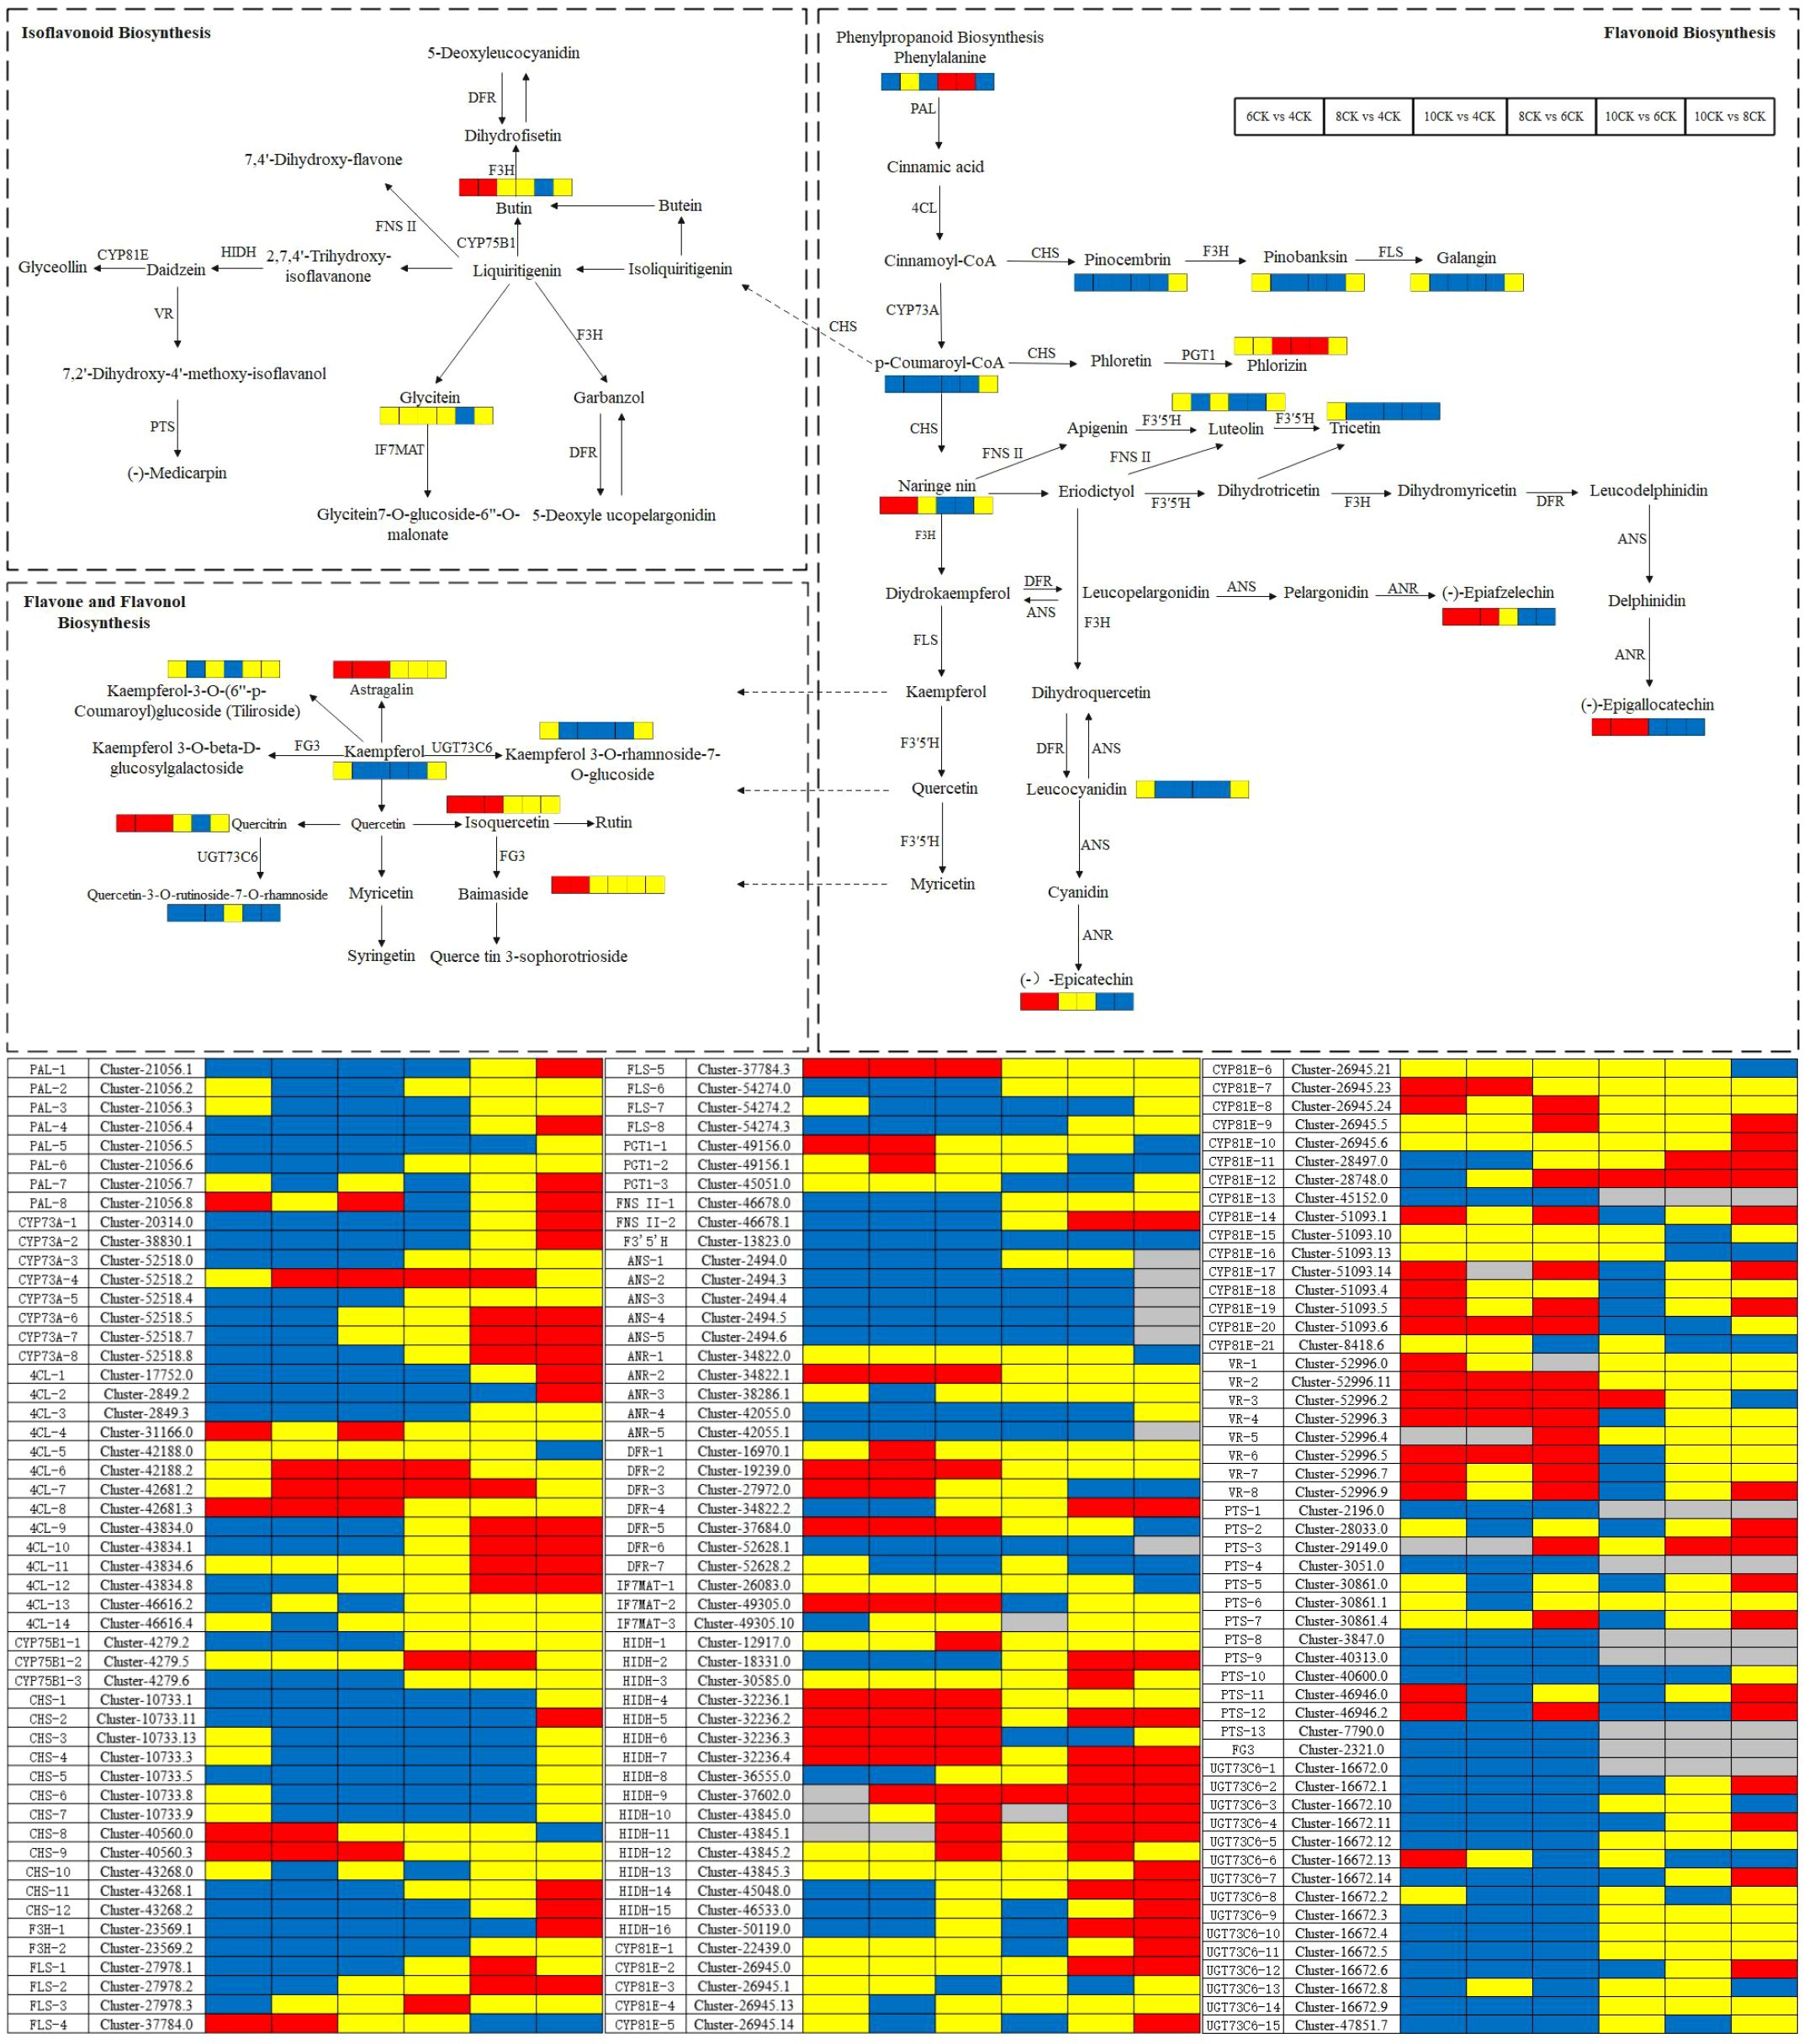
Figure 13. Schematic representation of flavonoid biosynthesis, isoflavonoid biosynthesis, and flavone and flavonol biosynthesis regulation with comparative analysis between distinct experimental groups. Metabolite expression levels are annotated adjacent to their corresponding metabolites within the pathway, while gene expression levels are displayed below. Red rectangles denote significant upregulation of expression, blue rectangles indicate significant downregulation, yellow rectangles represent no statistically significant change, and gray rectangles reflect data points without meaningful reference values.
5 Conclusion
This study used targeted metabolomic and transcriptomic analyses (UPLC-ESI-MS/MS) to identify 1,971 metabolites in Tilia miqueliana Maxim. leaves, including flavonoids, amino acids, phenolic acids, and terpenoids. Flavonoids, amino acids, and phenolic acids comprised nearly half of the metabolites, with key bioactive compounds like tiliroside, scopoletin, quercetin, and puerarin. Significant differences in differentially accumulated metabolites (DAMs) and differentially expressed genes (DEGs) were found across developmental stages, with the largest differences between 10CK vs 4CK and 10CK vs 6CK. Over 30,000 DEGs were identified, showing substantial differences between leaves in August and April. Quantification revealed variability in metabolite levels, with strong correlations between PAL and C4H enzymes and metabolite synthesis, indicating shared biosynthetic pathways. WGCNA and pathway analysis highlighted links between gene expression and flavonoid levels. This study provides insights into pharmacologically active compounds in Tilia miqueliana Maxim. leaves, aiding the selection of optimal harvest times for compound extraction.
Data availability statement
The datasets presented in this study can be found in online repositories. The names of the repository/repositories and accession number(s) can be found in the article/Supplementary Material.
Author contributions
YZ: Methodology, Writing – original draft, Formal Analysis, Software, Writing – review & editing, Data curation. YS: Writing – review & editing, Funding acquisition, Resources, Project administration, Visualization, Conceptualization, Supervision.
Funding
The author(s) declare financial support was received for the research and/or publication of this article. This work was supported by the project “Innovation and popularization of forest technology in Jiangsu Province, Long-term scientific research base for the in vitro conservation of ray native tree germplasm resources in Jiangsu Province: LYKJ (2021) 03”.
Conflict of interest
The authors declare that the research was conducted in the absence of any commercial or financial relationships that could be construed as a potential conflict of interest.
Generative AI statement
The author(s) declare that no Generative AI was used in the creation of this manuscript.
Any alternative text (alt text) provided alongside figures in this article has been generated by Frontiers with the support of artificial intelligence and reasonable efforts have been made to ensure accuracy, including review by the authors wherever possible. If you identify any issues, please contact us.
Publisher’s note
All claims expressed in this article are solely those of the authors and do not necessarily represent those of their affiliated organizations, or those of the publisher, the editors and the reviewers. Any product that may be evaluated in this article, or claim that may be made by its manufacturer, is not guaranteed or endorsed by the publisher.
Supplementary material
The Supplementary Material for this article can be found online at: https://www.frontiersin.org/articles/10.3389/fpls.2025.1642949/full#supplementary-material
References
Aguirre-Hernandez, E., Gonzalez-Trujano, M. E., Martinez, A. L., Moreno, J., Kite, G., Terrazas, T., et al. (2010). HPLC/MS analysis and anxiolytic-like effect of quercetin and kaempferol flavonoids from Tilia americana var. mexicana. J. Ethnopharmacol 127, 91–97. doi: 10.1016/j.jep.2009.09.044
Ali, M. B. (2013). “Secondary metabolites and environmental stress in plants: biosynthesis, regulation, and function,” in Physiological Mechanisms and Adaptation Strategies in Plants Under Changing Environment: Volume 2 (New York: Springer), 55–85.
Allio, A., Calorio, C., Franchino, C., Gavello, D., Carbone, E., and Marcantoni, A. (2015). Bud extracts from Tilia tomentosa Moench inhibit hippocampal neuronal firing through GABAA and benzodiazepine receptors activation. J. Ethnopharmacol 172, 288–296. doi: 10.1016/j.jep.2015.06.016
Aydaş, S. B., Ozturk, S., and Aslım, B. (2013). Phenylalanine ammonia lyase (PAL) enzyme activity and antioxidant properties of some cyanobacteria isolates. Food Chem. 136, 164–169. doi: 10.1016/j.foodchem.2012.07.119
Bao, W. and Shen, Y. (2022). Dynamic changes on floral aroma composition of the three species from tilia at different flowering stages. Horticulturae 8, 719. doi: 10.3390/horticulturae8080719
Borghi, M. and Fernie, A. R. (2021). From flowers to seeds: how the metabolism of flowers frames plant reproduction. Biochemist 43, 14–18. doi: 10.1042/bio_2021_134
Buchfink, B., Xie, C., and Huson, D. H. (2015). Fast and sensitive protein alignment using DIAMOND. Nat. Methods 12, 59–60. doi: 10.1038/nmeth.3176
Cai, K., Zhao, Q., Li, H., Zhang, Q., Li, Y., Han, R., et al. (2023). Deciphering aroma formation during flowering in nectar tree (Tilia amurensis): Insights from integrated metabolome and transcriptome analysis. Forestry Res. 23, 24. doi: 10.48130/FR-2023-0024
Cardenas-Rodriguez, N., Gonzalez-Trujano, M. E., Aguirre-Hernandez, E., Ruiz-Garcia, M., Sampieri, A., 3rd, Coballase-Urrutia, E., et al. (2014). Anticonvulsant and antioxidant effects of Tilia americana var. mexicana and flavonoids constituents in the pentylenetetrazole-induced seizures. Oxid. Med. Cell Longev 2014, 329172. doi: 10.1155/2014/329172
Carvalho Lemos, V., Reimer, J. J., and Wormit, A. (2019). Color for life: biosynthesis and distribution of phenolic compounds in pepper (Capsicum annuum). Agriculture 9, 81. doi: 10.3390/agriculture9040081
Cheng, S.-Y., Xu, F., and Wang, Y. (2009). Advances in the study of flavonoids in Ginkgo biloba leaves. J. Medicinal Plants Res. 3, 1248–1252. Available at: http://www.academicjournals.org/JMPR.
Cheniany, M. and Ganjeali, A. (2016). Developmental role of phenylalanine-ammonia-lyase (PAL) and cinnamate 4-hydroxylase (C4H) genes during adventitious rooting of Juglans regia L. microshoots. Acta Biol. Hung 67, 379–392. doi: 10.1556/018.67.2016.4.4
Chu, Z., Xiong, R., Peng, X., Cui, G., Dong, L., and Li, W. (2024). Delineating Molecular Regulatory of Flavonoids Indicated by Transcriptomic and Metabolomics Analysis during Flower Development in Chrysanthemum morifolium ‘Boju’. Int. J. Mol. Sci. 25, 10261. doi: 10.3390/ijms251910261
Cui, Z., Huang, X., Li, M., Li, M., Gu, L., Gao, L., et al. (2024). Integrated multi-omics analysis reveals genes involved in flavonoid biosynthesis and trichome development of Artemisia argyi. Plant Sci. 346, 112158. doi: 10.1016/j.plantsci.2024.112158
Da Silva, L., Pezzini, B. R., and Soares, L. (2015). Spectrophotometric determination of the total flavonoid content in Ocimum basilicum L.(Lamiaceae) leaves. Pharmacognosy magazine 11, 96. doi: 10.4103/0973-1296.149721
Du, Y., Gao, F., Yuan, S., Yu, H., Guo, Y., Cheng, Y., et al. (2024). Metabolomic, transcriptomic and physiological analysis reveal the effects and potential mechanisms of cold plasma treatment on resistance of wolfberry during storage. Postharvest Biol. Technol. 218, 113128. doi: 10.1016/j.postharvbio.2024.113128
Du, Q. H., Zhang, Q. Y., Han, T., Jiang, Y. P., Peng, C., and Xin, H. L. (2016). Dynamic changes of flavonoids in Actinidia valvata leaves at different growing stages measured by HPLC-MS/MS. Chin. J. Nat. Med. 14, 66–72. doi: 10.3724/SP.J.1009.2015.00066
Du, H., Zhang, L., Liu, L., Tang, X.-F., Yang, W.-J., Wu, Y.-M., et al. (2009). Biochemical and molecular characterization of plant MYB transcription factor family. Biochem. (Moscow) 74, 1–11. doi: 10.1134/S0006297909010015
Falcone Ferreyra, M. L., Rius, S., and Casati, P. (2012). Flavonoids: biosynthesis, biological functions, and biotechnological applications. Front. Plant Sci. 3. doi: 10.3389/fpls.2012.00222
Ge, L. (1996). ). Molecular cloning of trans-cinnamate 4-hydroxylase and purification of cytochrome P450 proteins from aspen (Houghton, Michigan, USA: Michigan Technological University).
Goto, T., Horita, M., Nagai, H., Nagatomo, A., Nishida, N., Matsuura, Y., et al. (2012). Tiliroside, a glycosidic flavonoid, inhibits carbohydrate digestion and glucose absorption in the gastrointestinal tract. Mol. Nutr. Food Res. 56, 435–445. doi: 10.1002/mnfr.201100458
Grochowski, D. M., Locatelli, M., Granica, S., Cacciagrano, F., and Tomczyk, M. (2018). A review on the dietary flavonoid tiliroside. Compr. Rev. Food Sci. Food Saf. 17, 1395–1421. doi: 10.1111/1541-4337.12389
Huang, X., Chu, G., Wang, J., Luo, H., Yang, Z., Sun, L., et al. (2023). Integrated metabolomic and transcriptomic analysis of specialized metabolites and isoflavonoid biosynthesis in Sophora alopecuroides L. under different degrees of drought stress. Ind. Crops Products 197, 116595. doi: 10.1016/j.indcrop.2023.116595
Jan, R., Khan, M., Asaf, S., Lubna, Asif, S., and Kim, K.-M. (2022). Bioactivity and therapeutic potential of kaempferol and quercetin: new insights for plant and human health. Plants 11, 2623. doi: 10.3390/plants11192623
Kabbash, E. M., Abdel-Shakour, Z. T., El-Ahmady, S. H., Wink, M., and Ayoub, I. M. (2023). Comparative metabolic profiling of olive leaf extracts from twelve different cultivars collected in both fruiting and flowering seasons. Sci. Rep. 13, 612. doi: 10.1038/s41598-022-27119-5
Kanehisa, M. and Goto, S. (2000). KEGG: kyoto encyclopedia of genes and genomes. Nucleic Acids Res. 28, 27–30. doi: 10.1093/nar/28.1.27
Kaur, G., Kaur, J., Goyal, J., Vaid, L., Singh, T. G., Singh, R., et al. (2024). Multifaceted role of tiliroside in inflammatory pathways: mechanisms and prospects. Recent Adv. Inflammation Allergy Drug Discovery. 19 (3), 316–327. doi: 10.2174/0127722708316269241015160515
Li, Z. and Ahammed, G. J. (2023). Hormonal regulation of anthocyanin biosynthesis for improved stress tolerance in plants. Plant Physiol. Biochem. 201, 107835. doi: 10.1016/j.plaphy.2023.107835
Li, S., Deng, B., Tian, S., Guo, M., Liu, H., and Zhao, X. (2021). Metabolic and transcriptomic analyses reveal different metabolite biosynthesis profiles between leaf buds and mature leaves in Ziziphus jujuba mill. Food Chem. 347, 129005. doi: 10.1016/j.foodchem.2021.129005
Li, M., Guo, L., Wang, Y., Li, Y., Jiang, X., Liu, Y., et al. (2022). Molecular and biochemical characterization of two 4-coumarate: CoA ligase genes in tea plant (Camellia sinensis). Plant Mol. Biol. 109, 579–593. doi: 10.1007/s11103-022-01269-6
Li, G., Tang, Z., Song, Z., Shi, X., Liu, C., Chen, Q., et al. (2024). Integrated transcriptomic and metabolomic analysis reveal the molecular and metabolic basis of flavonoids in Chinese sour jujube fruits in different harvest times. Postharvest Biol. Technol. 209, 112685. doi: 10.1016/j.postharvbio.2023.112685
Liu, C., Li, J., Li, H., Xue, J., Wang, M., Jian, G., et al. (2023). Differences in the quality of black tea (Camellia sinensis var. Yinghong No. 9) in different seasons and the underlying factors. Food Chem. X 20, 100998. doi: 10.1016/j.fochx.2023.100998
Liu, Y., Pan, J., Ni, S., Xing, B., Cheng, K., and Peng, X. (2022). Transcriptome and metabonomics combined analysis revealed the defense mechanism involved in hydrogen-rich water-regulated cold stress response of Tetrastigma hemsleyanum. Front. Plant Sci. 13, 889726. doi: 10.3389/fpls.2022.889726
Loscalzo, L. M., Wasowski, C., and Marder, M. (2009). Neuroactive flavonoid glycosides from Tilia petiolaris DC. extracts. Phytother. Res. 23, 1453–1457. doi: 10.1002/ptr.2800
Lu, Y., Ding, Z., Zhang, D., Zhu, F., and Gao, B. (2025). Integrated metabolomic and transcriptomic analysis reveals the pharmacological effects and differential mechanisms of isoflavone biosynthesis in four species of glycyrrhiza. Int. J. Mol. Sci. 26, 2539. doi: 10.3390/ijms26062539
Lu, C., Yan, X., Zhang, H., Zhong, T., Gui, A., Liu, Y., et al. (2024). Integrated metabolomic and transcriptomic analysis reveals biosynthesis mechanism of flavone and caffeoylquinic acid in chrysanthemum. BMC Genomics 25, 759. doi: 10.1186/s12864-024-10676-6
Luhata, L. P. and Luhata, W. G. (2017). Tiliroside: Biosynthesis, bioactivity and structure activity relationship (SAR)-A review. J. Phytopharmacology 6, 343–348. doi: 10.31254/phyto.2017.6607
Matsuda, H., Ninomiya, K., Shimoda, H., and Yoshikawa, M. (2002). Hepatoprotective principles from the flowers of Tilia argentea (linden): structure requirements of tiliroside and mechanisms of action. Bioorganic medicinal Chem. 10, 707–712. doi: 10.1016/S0968-0896(01)00321-2
Miean, K. H. and Mohamed, S. (2001). Flavonoid (Myricetin, quercetin, kaempferol, luteolin, and apigenin) content of edible tropical plants. J. Agric. Food Chem. 49, 3106–3112. doi: 10.1021/jf000892m
Nenni, M. and Karahuseyin, S. (2024). “Medicinal plants, secondary metabolites, and their antiallergic activities,” in Biotechnology of Medicinal Plants with Antiallergy Properties: Research Trends and Prospects (Springer Nature Singapore Pte Ltd: Springer), 37–126.
Nikzad, N. and Parastar, H. (2021). Evaluation of the effect of organic pollutants exposure on the antioxidant activity, total phenolic and total flavonoid content of lettuce (Lactuca sativa L.) using UV–Vis spectrophotometry and chemometrics. Microchemical J. 170, 106632. doi: 10.1016/j.microc.2021.106632
Nor, S. N. N. M., Hamidi, N. H., Nawi, W. N. R. M., and Izhab, I. (2022). “Effect of extraction time and temperature on total flavonoids and coumarins content of Petai Belalang (Leucaena leucocephala) seeds,” in AIP Conference Proceedings (Melville, New York, USA: AIP Publishing LLC).
Nugroho, A., Heryani, H., Choi, J. S., and Park, H.-J. (2017). Identification and quantification of flavonoids in Carica papaya leaf and peroxynitrite-scavenging activity. Asian Pacific J. Trop. Biomedicine 7, 208–213. doi: 10.1016/j.apjtb.2016.12.009
Núñez, L., Serratosa, M. P., Godoy, A., Fariña, L., Dellacassa, E., and Moyano, L. (2021). Comparison of physicochemical properties, amino acids, mineral elements, total phenolic compounds, and antioxidant capacity of Cuban fruit and rice wines. Food Sci. Nutr. 9, 3673–3682. doi: 10.1002/fsn3.2328
Park, H. J. and Cha, H. C. (2003). Flavonoids from leaves and exocarps of the grape Kyoho. Korean J. Biol. Sci. 7, 327–330. doi: 10.1080/12265071.2003.9647723
Park, Y. J., Kwon, D. Y., Koo, S. Y., Truong, T. Q., Hong, S.-C., Choi, J., et al. (2023). Identification of drought-responsive phenolic compounds and their biosynthetic regulation under drought stress in Ligularia fischeri. Front. Plant Sci. 14. doi: 10.3389/fpls.2023.1140509
Pavlović, T., Dimkić, I., Andrić, S., Milojković-Opsenica, D., Stanković, S., Janaćković, P., et al. (2020). Linden tea from Serbia–an insight into the phenolic profile, radical scavenging and antimicrobial activities. Ind. Crops Products 154, 112639. doi: 10.1016/j.indcrop.2020.112639
Rees, S. and Harborne, J. (2008). Flavonoids and other phenolics of Cichorium and related members of the Lactuceae (Compositae). Botanical J. Linn. Soc. 89, 313–319. doi: 10.1111/j.1095-8339.1984.tb02563.x
Ringnér, M. (2008). What is principal component analysis? Nat. Biotechnol. 26, 303–304. doi: 10.1038/nbt0308-303
Silva, G. C., Pereira, A. C., Rezende, B. A., Da Silva, J. P. F., Cruz, J. S., De Souza, M. D. F. V., et al. (2013). Mechanism of the antihypertensive and vasorelaxant effects of the flavonoid tiliroside in resistance arteries. Planta Med. 79, 1003–1008. doi: 10.1055/s-0032-1328765
Soni, U., Brar, S., and Gauttam, V. K. (2015). Effect of seasonal variation on secondary metabolites of medicinal plants. Int. J. Pharm. Sci. Res. 6, 3654. Available at: http://ijpsr.com/bft-article/effect-of-seasonal-variation-on-secondary-metabolites-of-medicinal-plants/?view=fulltext
Worley, B. and Powers, R. (2013). Multivariate analysis in metabolomics. Curr. Metabolomics 1, 92–107. doi: 10.2174/2213235X11301010092
Xia, J. and Wishart, D. S. (2010). MSEA: a web-based tool to identify biologically meaningful patterns in quantitative metabolomic data. Nucleic Acids Res. 38, W71–W77. doi: 10.1093/nar/gkq329
Yi, L. (2015). Paralogous genes in Arabidopsis thaliana contribute to diversified phenylpropanoid metabolism. Open Access Dissertations. 612. Available at:https://docs.lib.purdue.edu/open_access_dissertations/612.
Zhong, Y., Xie, Y., Zhang, D., Li, G., and Yu, J. (2024). Integrated metabolomic and transcriptomic analysis of metabolic diversity and biosynthesis of glucosinolates and flavonoids in various cultivars of radish microgreens. Food Bioscience 59, 104055. doi: 10.1016/j.fbio.2024.104055
Zhou, Y.-J., Ren, Q., and Shen, Y.-B. (2024). Comprehensive review of Tilia L.: phytochemical profiles, edible value, therapeutic potentials, and ecological significance. Food Med. Homology. 2 (2), 9420048. doi: 10.26599/FMH.2025.9420035
Keywords: Tilia miqueliana Maxim. leaf, secondary metabolites, flavonoids, transcriptomics and metabolomics, WGCNA analysis
Citation: Zhou Y and Shen Y (2025) Integrative transcriptomics and metabolomics reveal the biosynthesis of flavonoid metabolites in Tilia miqueliana Maxim. leaves. Front. Plant Sci. 16:1642949. doi: 10.3389/fpls.2025.1642949
Received: 07 June 2025; Accepted: 15 August 2025;
Published: 12 September 2025.
Edited by:
Rakesh Kumar Shukla, Council of Scientific and Industrial Research (CSIR), IndiaReviewed by:
Neelam Prabha Negi, Council of Scientific and Industrial Research (CSIR), IndiaAshish Sharma, Council of Scientific and Industrial Research (CSIR), India
Copyright © 2025 Zhou and Shen. This is an open-access article distributed under the terms of the Creative Commons Attribution License (CC BY). The use, distribution or reproduction in other forums is permitted, provided the original author(s) and the copyright owner(s) are credited and that the original publication in this journal is cited, in accordance with accepted academic practice. No use, distribution or reproduction is permitted which does not comply with these terms.
*Correspondence: Yongbao Shen, eWJzaGVuQG5qZnUuZWR1LmNu