 Cai-yun Wang1†
 Ming-yu Yin
 Hong-jiang Hu
 Jun-jie Guo
- 1Research Institute of Tropical Forestry, Chinese Academy of Forestry, Longdong, Guangzhou, Guangdong, China
- 2Forestry and Grassland Technique Promotion Station of Baoshan City, Baoshan, Yunnan, China
The diverse topographies of high mountains and deep river valleys in Yunnan, China create geographic and environmental barriers that promote intraspecific genetic differentiation. This study employed amla (Phyllanthus emblica L.) to reveal the effects of geographic and environmental isolation on genetic differentiation of plant species. We sampled 18 natural P. emblica populations from upstream to downstream in the Longchuan, Nu, Lancang, Yuanjiang and Jinsha Rivers valleys (three or four per valley) in 2017. Genetic diversity and structure of P. emblica were assessed across these populations using 16 SSR loci developed, and analyzed with GenAlEx, ATetra, and STRUCTURE software packages. Ecological niche modeling (MaxEnt) estimated its historical and contemporary potential geographic distribution patterns, and redundancy analysis (RDA) identified key environmental factors influencing genetic diversity. P. emblica exhibited high genetic diversity, primarily influenced by mean temperature of the warmest quarter (Bio10) and precipitation of the warmest quarter (Bio18). STRUCTURE analysis revealed a distinct division of these populations into western and eastern groups, closely aligned with the Tanaka-Kaiyong Line. Significant genetic differentiation existed between the western and eastern populations, and suggesting that long-term geographic isolation and environmental heterogeneity promote genetic differentiation and local adaptation of this species. MaxEnt modelling indicated a significant expansion in the potential habitat of P. emblica from the Last Glacial Maximum (LGM) to the present, likely due to climate warming. Our findings provide evidence for genetic differentiation in P. emblica driven by geographical and environmental isolation, and offer critical insights into developing effective conservation and utilization strategies for its genetic resources.
1 Introduction
Mountain uplift events and climatic oscillations during ancient geological periods jointly drive species divergence mechanisms intra- and interspecific levels, fundamentally shaping current biodiversity patterns (Hewitt, 2000; He and Jiang, 2014; Favre et al., 2015; Badgley et al., 2017). Genetic differentiation generally occurs in allopatric populations of a species due to geographic barriers and environmental isolation (Meng et al., 2017; Xing and Ree, 2017). For example, Wu et al. (2024), found that the Morella nana population on the Yunnan-Guizhou Plateau was divided into two groups, one in the eastern and the other in the western part of the Wumeng Mountains. This distribution pattern was likely related to the geographical isolation of the Wumeng Mountains and climate fluctuation during the last glacial maximum. Li et al. (2019), considered that mountain barriers enhanced the genetic differentiation of Quercus chenii populations through both geographic and environmental isolation in East China. Jinga and Ashley (2018), found that the Kalahari-Zimbabwe axis forms a strong genetic barrier between populations of Afzelia quanzensis in the northern and southern regions. Understanding the impact of geographic isolation and environmental heterogeneity on genetic diversity and population genetic structure of a species will help unravel its complex evolutionary history and its responses to climate change.
Yunnan is located in southwestern China, and its terrain is mainly characterized by a gradual descent from the northwest to the southeast, intersected by mountain ranges and deeply incised river valleys. The most notable rivers are the Nu, Lancang, Yuanjiang and Jinsha Rivers, along with their tributaries (Li and Zhao, 2007; Wang et al., 2017). The unique and intricate geomorphological landscape of this region, in synergy with its heterogeneous climatic regimes, has engendered a vast reservoir of genetic diversity through evolutionary adaptation processes. The genetic diversity and population genetic structure have been investigated in the river valleys of this region for some critically endangered and extremely small population plant species (Jia et al., 2016; Tang et al., 2020) as well as for a limited number of populations for widely distributed species (Li and Zhao, 2007; Liu et al., 2020).
Amla (Phyllanthus emblica L.; syn. Emblica officinalis Gaertner), a medicinal plant belonging to the Phyllanthaceae family, is widely distributed across tropical and warm subtropical regions in China, Southeast Asia, and South Asia. In China, it primarily occurs in Yunnan, Guangxi, Guangdong, Hainan, Fujian, Guizhou and Sichuan provinces (Ma et al., 2024). P. emblica is a deciduous tree characterized by thin, light grey bark that exfoliates in small irregular flakes, small light green leaves densely set along the branchlets, and globose fruits with six vertical furrows (Saini et al., 2022). As an economically significant plant, amla plays a crucial role in regional agriculture and forestry. Its fruits are rich in compounds including vitamin C, pentagalloylglucose, and gallic acid (Krishnaiah et al., 2009; Ma et al., 2024). Modern pharmacological studies have shown that P. emblica possesses various pharmacological activities, such as antioxidant, anti-tumor, hypoglycemic, and sore throat-relieving effects (Chaphalkar et al., 2017; Variya et al., 2016). This species exhibits tolerance to barren soils and possesses strong soil conservation capacities, contributing to its ecological value. Its pollen dispersal, primarily mediated by bees and wind, facilitates long-distance gene flow between populations (Nakanishi et al., 2020). Yin et al. (2018) assessed phenotypic diversity in fruits, seeds and offspring seedlings across nine natural P. emblica populations in the Nu and Longchuan River valleys of western Yunnan, finding significant correlations between most seed and seedling traits and geographical and environmental factors. However, the influence of geographic distance and environmental variables on the genetic diversity and population genetic structure of P. emblica within these river valleys of Yunnan remain poorly understood.
In this study, we developed polymorphic SSR markers and used them to analyze the genetic diversity and structure across 18 natural P. emblica populations from five river valleys in Yunnan. We hypothesized that complex topography drives genetic differentiation through two primary mechanisms: (1) geographic isolation imposed by mountain barriers promotes population divergence, and (2) environmental heterogeneity in valleys generates adaptive genetic variation. Our objectives were: (i) to investigate effects of geographic isolation and environmental heterogeneity on genetic diversity and population genetic structure; and (ii) to reconstruct past and present geographic distribution using ecological niche modelling. This approach quantifies correlation between species occurrence and environmental variables to describe ecological niches and habitat suitability (Guisan and Zimmermann, 2000; Gao et al., 2022). The findings will not only advance our understanding of how geographic and environmental isolation shape genetic differentiation in complex terrains, but also provide a foundation for developing conservation and utilization strategies for this species.
2 Materials and methods
2.1 Plant materials and DNA extraction
The sampling sites were primarily located in the valley areas of five rivers, including the Longchuan, Nu, Lancang, Yuanjiang and Jinsha Rivers, in Yunnan and Sichuan Provinces (Figure 1). In each river valley, three or four natural populations of P. emblica were sampled from upstream to downstream in 2017. More than 30 individuals were sampled from each population, with a minimum distance of 50 m between them (Table 1). In total, 564 leaf samples were collected from 18 natural P. emblica populations in the region. The sampled leaves were dried using silica gel, and their total DNAs were extracted using the modified CTAB method (Zeng et al., 2002).
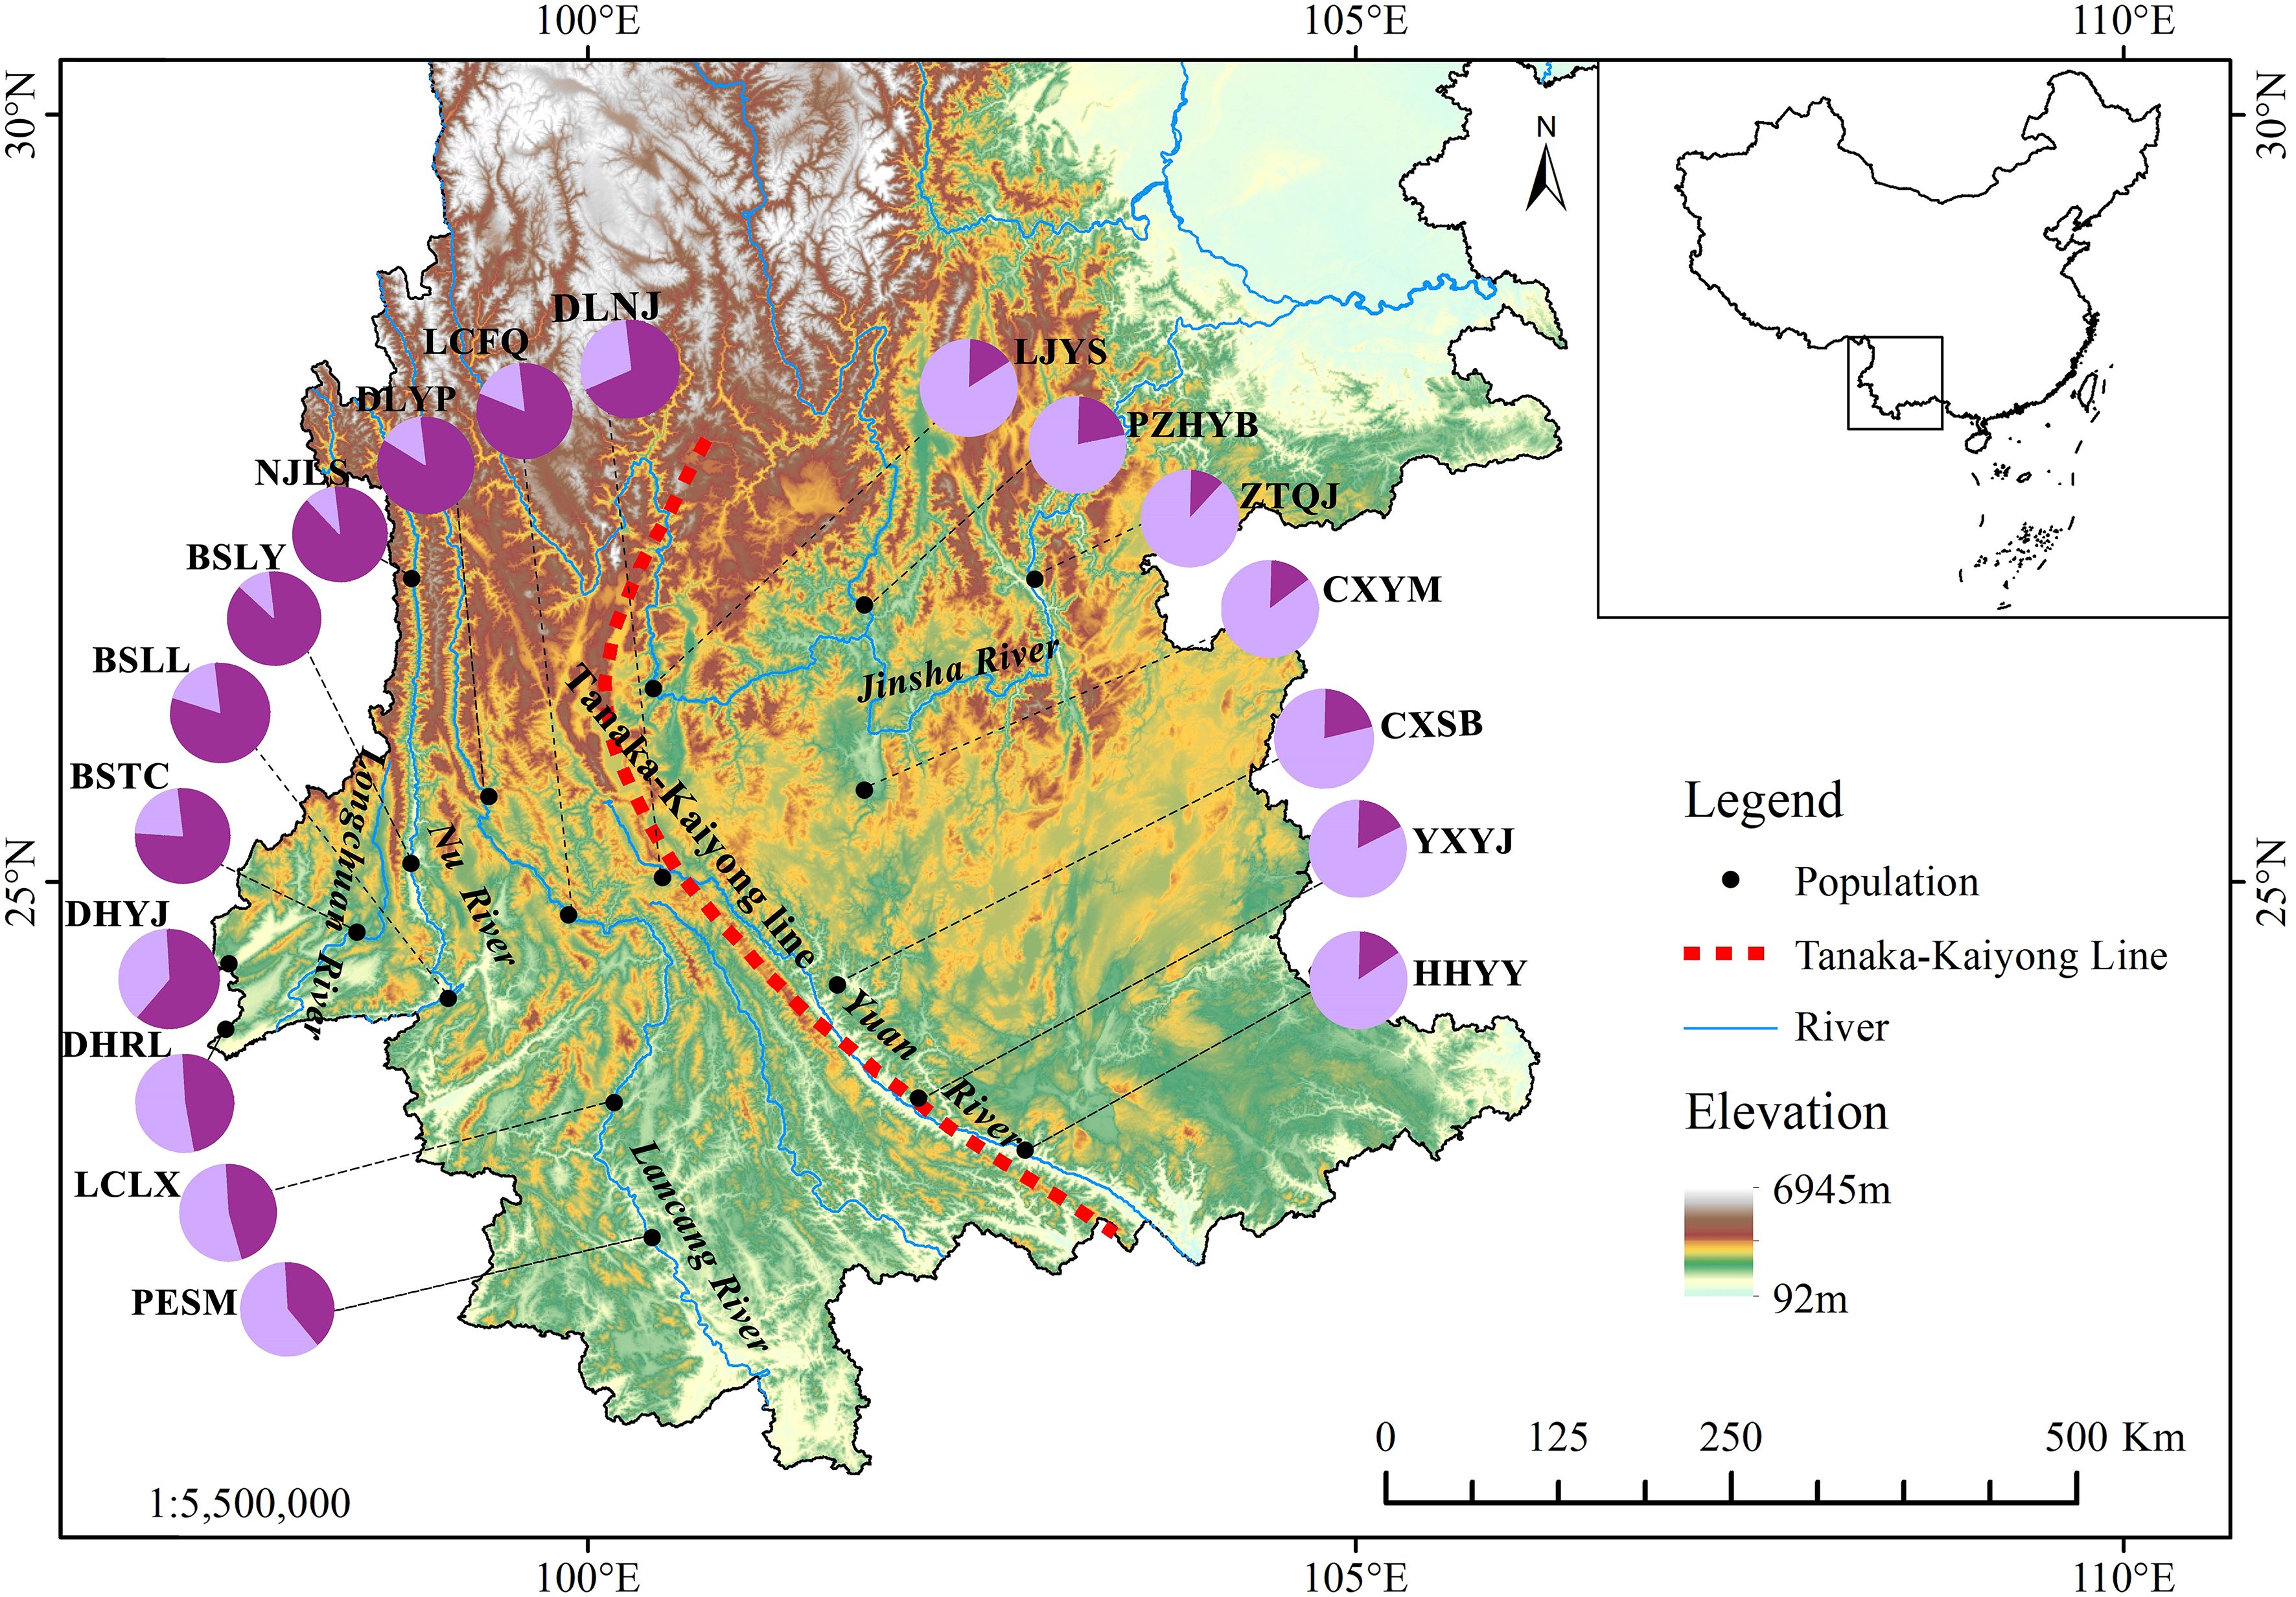
Figure 1. Localities of 18 natural Phyllanthus emblica populations in the valleys of five rivers of Yunnan, China. The pie chart shows the proportions of two genetic groups assigned to each population based on STRUCTURE analysis. Population information is provided in Table 1. The delineation of the Tanaka-Kaiyong Line is based on Fan et al. (2013).
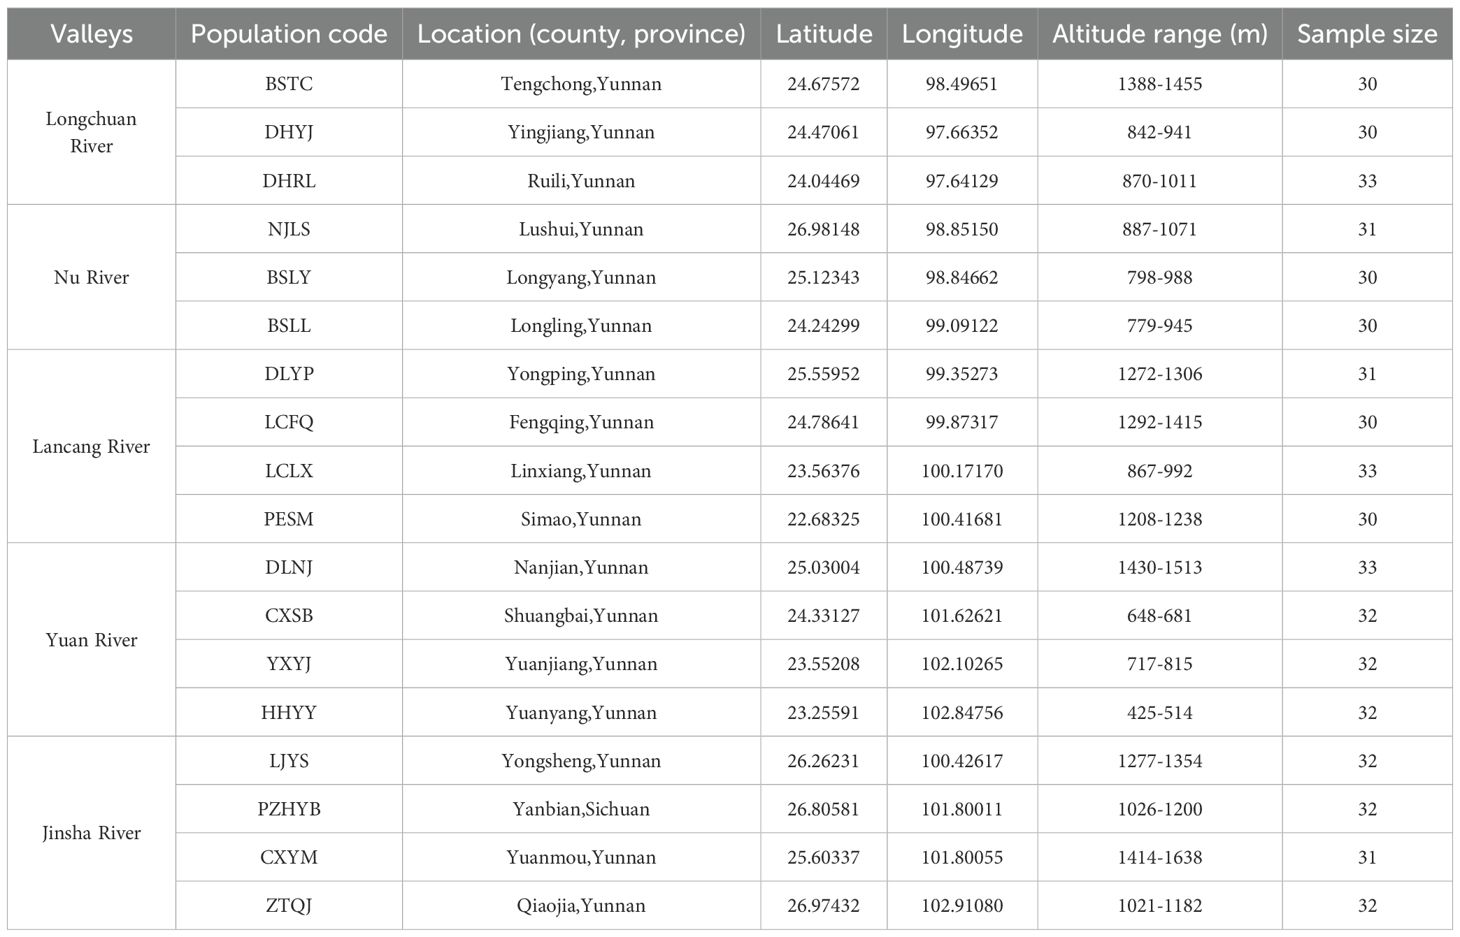
Table 1. General information of 18 natural Phyllanthus emblica populations from the valley areas of five rivers.
2.2 SSR marker development
Genomic DNA from a single sample of P. emblica was broken into fragments of 300–500 bp in length. The paired-end sequencing library was constructed with NEXTflex Rapid DNA-Seq Kit (Bioo Scientific Corp., Austin, USA) following the manufacturer’s instructions. According to the sequencing methodology described in Guo et al. (2017). The sequencing data have been deposited in GeneBank. Prior to the genome assembly, quality control was conducted on the raw data by discarding reads containing more than 10% of bases with a quality score (Q) below 20, reads containing more than 10% ambiguous sequences, and those with adaptor contamination. De novo genome assembly was then performed using SPAdes 3.9.0 software (Bankevich et al., 2012) with the default settings.
SSRs were detected in the assembled genome using the MISA tool (Labbé et al., 2011), targeting motifs from di- to hexa-nucleotides. The minimum repeat numbers were set as follows: five for dinucleotide, four for trinucleotide, and three for tetranucleotide, pentanucleotide and hexanucleotide. The maximal number of bases interrupting two SSR loci was 20 in a compound microsatellite. One hundred and ten primers were designed using Primer 3 v4.1.0 (Untergasser et al., 2012) (http://fokker.wi.mit.edu/primer3/) with default parameters.
The PCR reaction mixture (10 μL) contained 50 ng of DNA template, 150 μM dNTPs, 2.0 μM MgCl2, 0.5 μM forward and reverse primers, 1× PCR buffer (Tiangen Biotech Ltd., Beijing, China), and 0.04 U/μL of Taq DNA polymerase (Tiangen Biotech Ltd). PCR was performed on an Applied Biosystems Veriti thermal cycler (Applied Biosystems, Waltham, Massachusetts, USA) with the following program: 94°C for 4min; 94°C for 30 s, annealing temperature (Ta) for 30 s, 72°C for 30 s (31 cycles); and 72°C for 10 min. The optimized Ta were determined as 60°C through a PCR trial with temperature gradient. The PCR products were detected by electrophoresis on 1% agarose gel. The PCR products were analyzed using ABI 3730XL (Applied Biosystems, USA) with GeneScan 500 LIZ Size Standard (Applied Biosystems, USA). Genotyping was performed using GeneMarker v2.2 software (Hulce et al., 2011).
2.3 Genetic diversity and genetic structure analysis
The SSR primers developed were further used to conduct SSR analysis for all samples using the methods outlined above. Since P. emblica is of complex ploidy (Rahman et al., 2021), the genotype data were converted into binary data (0, 1) using the poppr package in R (Kamvar et al., 2014; López-González et al., 2021; Thapa et al., 2021). The number of alleles (Na), the observed heterozygosity (Ho) and private allele (Ap) were calculated for each P. emblica population using Excel 2010 software. The expected heterozygosity (He) and the Shannon-Weiner diversity index (I) were estimated with ATetra v1.2 software (Markwith et al., 2006; Van-Puyvelde et al., 2010). He and I were calculated with the formulae and , where Pi is the frequency of the ith allele at a given locus within a population. Analysis of molecular variation (AMOVA), principal component analysis (PCoA), and calculation of Nei’s genetic distance were performed using GenAlEx v6.51 software (Peakall and Smouse, 2006). Genetic differentiation values (PhiPT) were calculated for each pair of river valleys or populations on the basis of AMOVA. An unweighted pair group method with arithmetic mean (UPGMA) dendrogram was constructed based on Nei’s genetic distance using MEGA v7.0 (Kumar et al., 2016). The genetic structure of P. emblica was examined using STRUCTURE v2.3.4 software (Pritchard et al., 2000). The number of clusters (K) was tested from one to 18, with 10 runs for each K. The burn-in length was set to 100,000, with Markov Chain Monte Carlo iterations of 100,000. The optimum K value was determined based on the highest delta K value, using STRUCTURE Harvester on-line (Earl and vonHoldt, 2012).
Altitude and six climatic variables (Supplementary Table S1) were selected from 20 environmental factors (See subsection 2.4 Ecological niche modelling) to avoid multicollinearity. This was achieved by calculating Pearson’s correlation coefficients and retaining only one variable per correlated group (|r|≥0.8) (Zhu et al., 2025). These seven selected variables were subsequently used in further analyses. The Mantel and partial Mantel tests were conducted 9999 times using the vegan package in R software to assess correlation between genetic differentiation (Bray-Curtis distance) and geographic distance or these selected environmental variables (Euclidean distance). Redundancy analysis (RDA) was employed to identify whether these selected environmental factors significantly influencing genetic diversity or not, using Canoco v5.0 software (Morris, 2015).
2.4 Ecological niche modelling
Data for all but of 18 populations in Yunnan were mainly obtained from online species information resources after species identification and distribution calibration, including the Chinese Virtual Herbarium (https://www.cvh.ac.cn/), the Global Biodiversity Information Facility (http://www.gbif.org) and related references. Coordinates were picked through the Baidu Maps coordinate system. A total of 97 distribution points of P. emblica were obtained for model prediction. Data of 19 climatic variables and one topographic factor (altitude) were sourced from the Global Climate Database (http://www.worldclim.org/) for three periods (Last Glacial Maximum; Middle Holocene; Present 1970-2000). MaxEnt v3.4.4 software was used to import geographic distribution data and the environment variable layer into the model, and the analysis was performed using the jackknife method. The prediction maps from the MaxEnt model were imported into ArcGIS10.1, where the viable range was divided into four levels using the reclassification tool.
3 Results
3.1 SSR marker development
A total of 346,029 contig sequences were obtained in the P. emblica genome, with an average length of 193 bp. Among all contigs examined, 8511 contained SSR loci, of which 5965 could be used to design PCR primers, with the expected product sizes ranging from 100 to 280 bp. Of the 110 pairs of SSR primers designed, 58 could generate polymorphic loci. Subsequently, 16 pairs of SSR primers with good amplification performance were selected to assess the genetic diversity and structure across 18 natural P. emblica populations (Table 2).
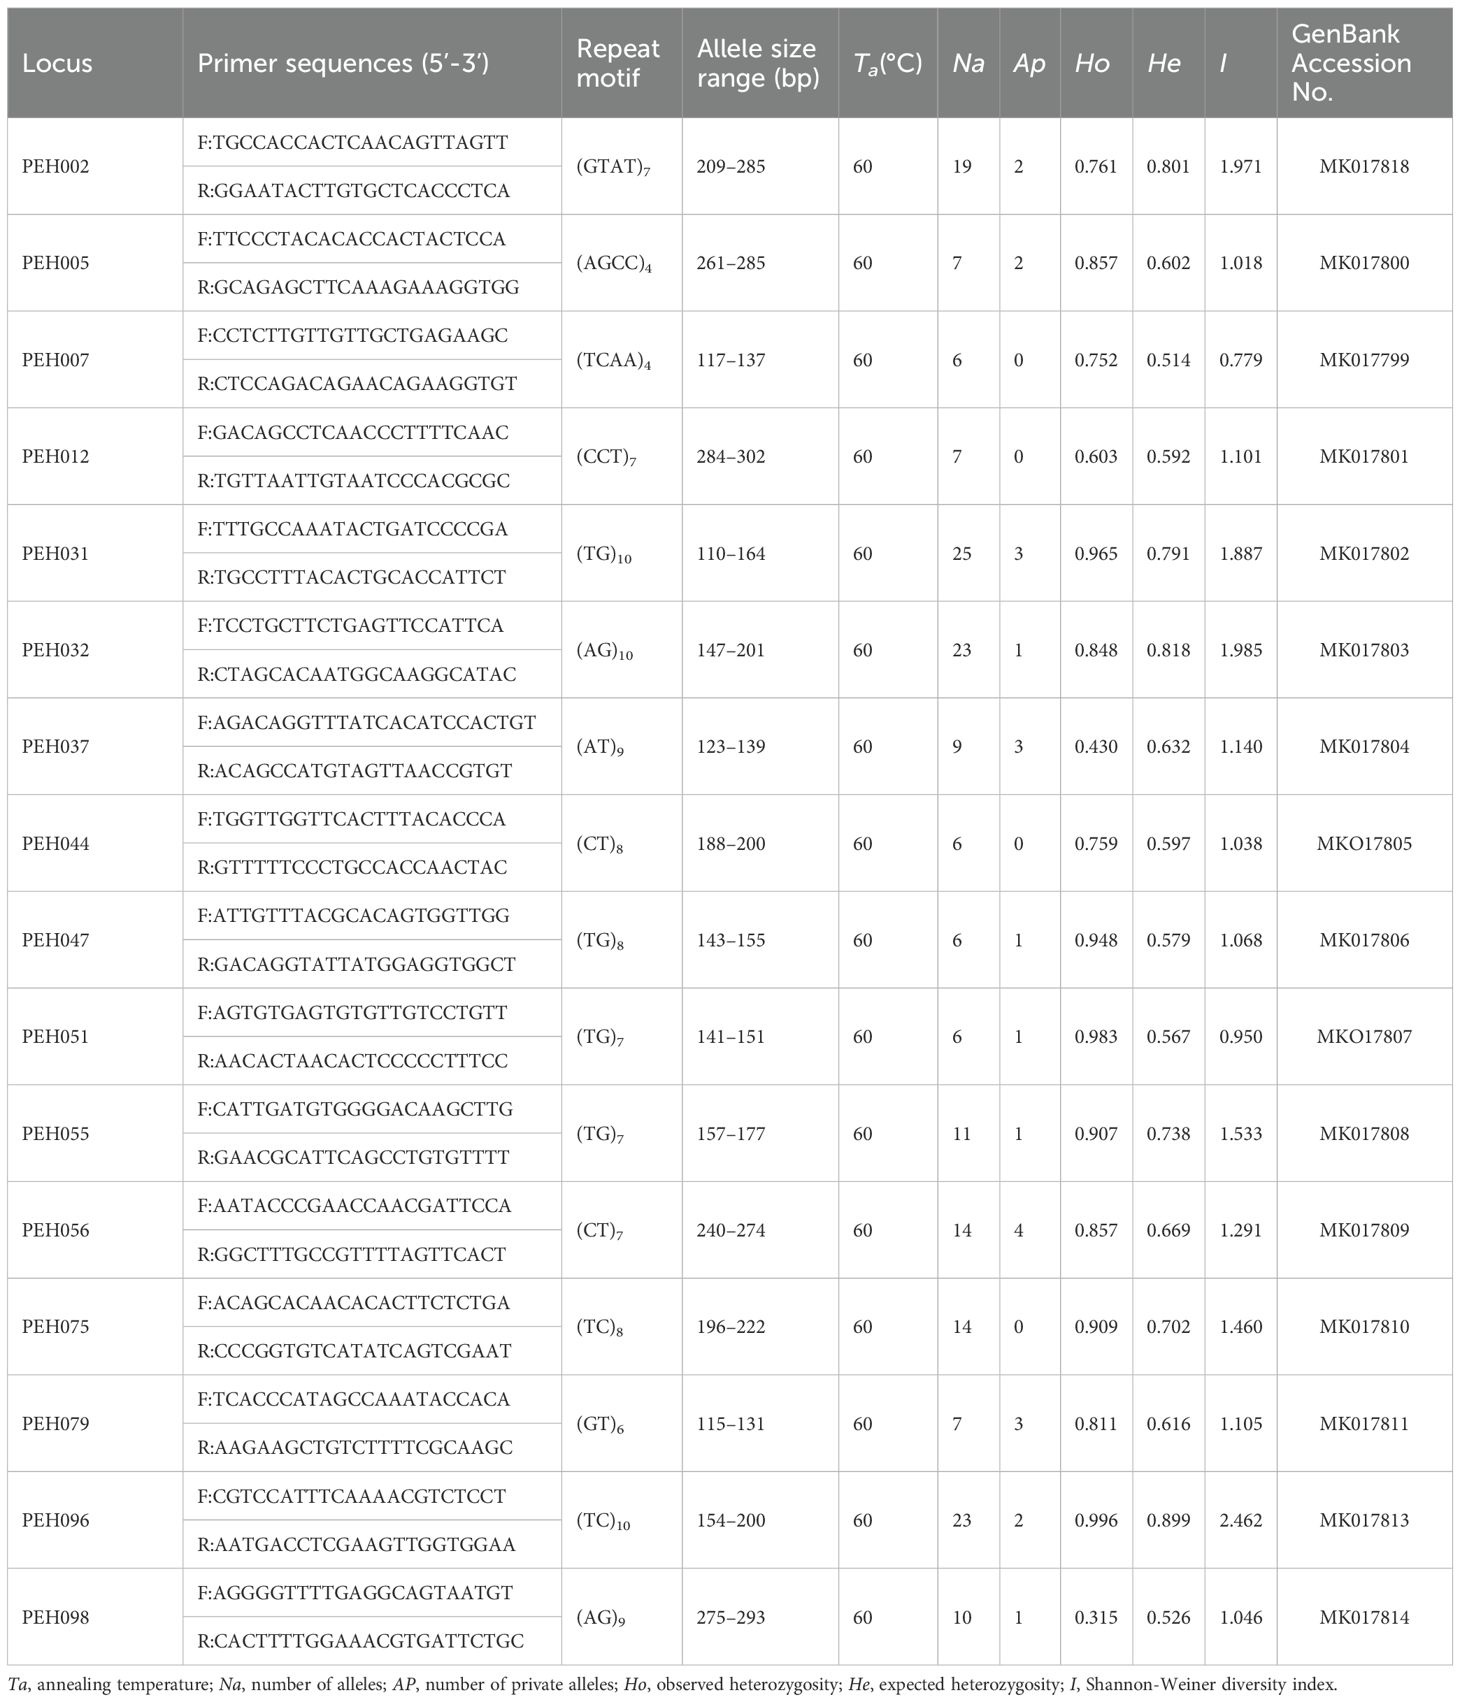
Table 2. Characterization of 16 microsatellite (SSR) loci for Phyllanthus emblica.
3.2 Genetic diversity
A total of 193 alleles were detected at 16 SSR loci in 564 individuals from 18 populations of P. emblica across five river valleys (Table 2). The number of alleles (Na) per locus varied from six at loci PEH07, PEH44, PEH47 and PEH51 to 25 at locus PEH31 with overall mean of 12.063. The expected heterozygosity (He) and the Shannon-Weiner diversity index (I) ranged from 0.514 and 0.779 at locus PEH07 to 0.899 and 2.462 at locus PEH96, with means of 0.665 and 1.365, respectively. The number of private alleles (Ap) was high up to four at locus PEH56, while none was detected at loci PEH07, PEH12, PEH44 and PEH75 (Table 2).
Na of each population ranged from 6.125 in CXYM to 8.125 in LCLX, averaging 6.990. The He varied from 0.632 in LJYS to 0.701 in DLYP, with mean of 0.666. I ranged from 1.246 in LJYS to 1.476 in BSTC, averaging 1.367. LJYS exhibited the lowest level of genetic diversity. Populations LCLX and DLNJ had the most private alleles (three) among 18 populations, while none was detected in populations NJLS, BSLY, YXYJ, HHYY and CXYM (Table 3).
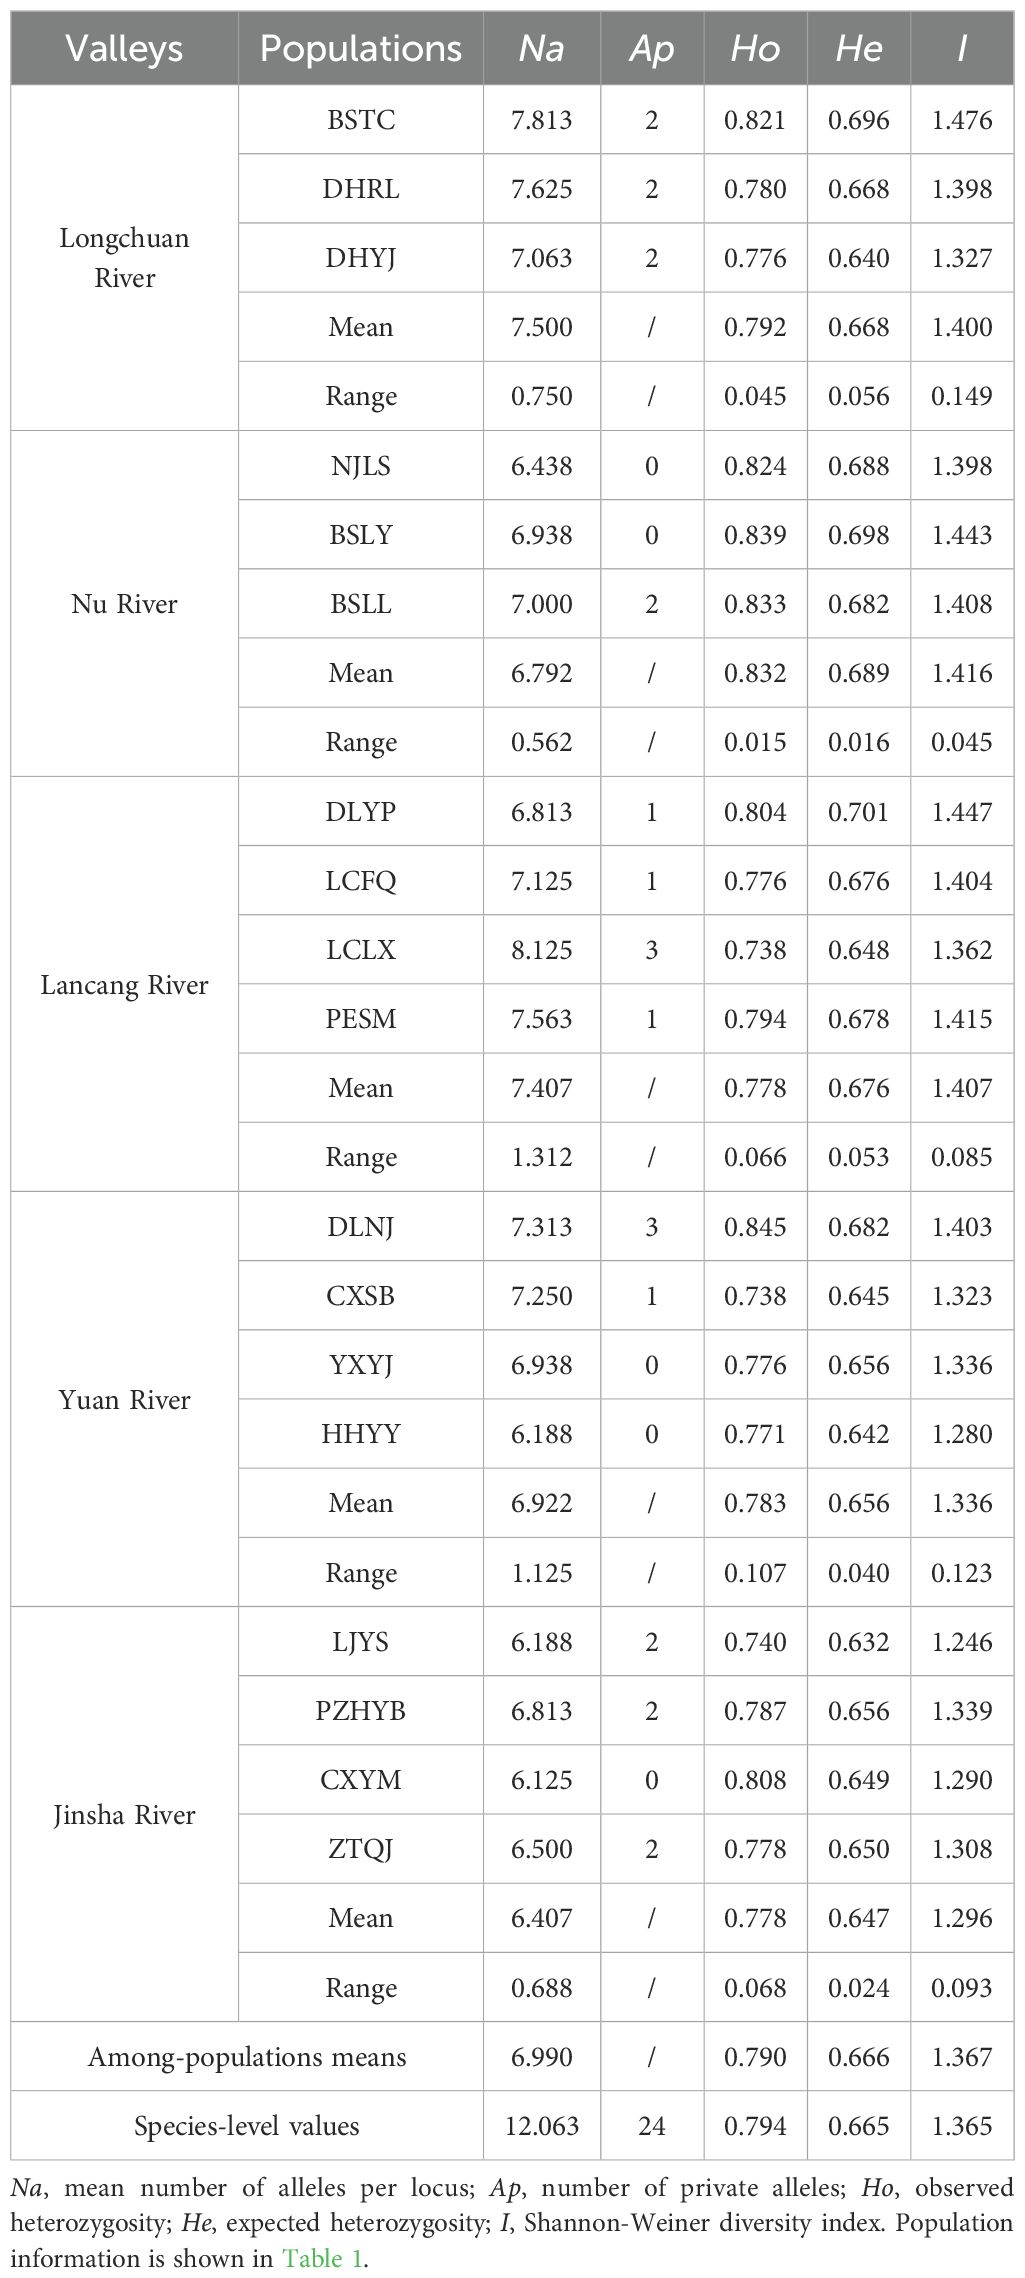
Table 3. Genetic diversity of 18 natural Phyllanthus emblica populations in five river valleys.
Among the five river valleys, the Jinsha River valley exhibited the lowest mean Na (6.406), Ho (0.778), He (0.647), and I (1.296), while the Longchuan River valley showed the highest mean Na (7.500), and the Nu River valley did the largest mean Ho (0.832), He (0.689) and I (1.416). Only two private alleles were detected in the Nu River, whereas six private alleles in the Longchuan, Lancang and Jinsha River valleys (Table 3). The populations in Nu River valley exhibited the narrowest ranges for Na, Ho, He and I, while the widest ranges for Na in the Lancang River valley, for Ho in the Yuan River valley, and for He and I in the Longchuan River valley.
From upper stream to downstream in each river valley, Na demonstrated a downward trend in the Longchuan and Yuan River valleys, an upward trend in the Nu River, and no clear pattern in the Langcang and Jinsha River valleys. Ho, He and I showed decreasing trend in the Longchuan, Lancang and Yuan River valleys, remained almost stable in the Nu River valley, and did not show any clear pattern in the Jinsha River valley (Table 3).
3.3 Population genetic structure and differentiation
Principal component analysis (PCoA) indicated that PCoA1 and PCoA2 explained 50.32% and 10.92% of the overall genetic variation, respectively (Figure 2). The 18 populations could be divided into two clusters. Cluster I included the populations from the Longchuan (BSTC, DHYJ, DHRL), Nu (NJLS, BSLY, BSLL), Lancang (DLYP, LCFQ, LCLX, PESM) and Yuan River valleys (DLNJ); Cluster II contained the populations from Yuan (CXSB, YXYJ, HHYY) and Jinsha River valleys (LJYS, CXYM, PZH, ZTQJ). Both clusters were just located on the western and eastern sides of the Tanaka-Kaiyong Line (see details in section Discussion). The unweighted pair group method with arithmetic mean (UPGMA) dendrogram resolved three clusters at a distance threshold of 0.009, with the western populations divided into two clusters, different from the PCoA grouping pattern (Figure 3). The STRUCTURE analysis identified K = 2 as optimal (Figure 4A), dividing 18 populations into two groups (Figure 4B) that aligned with PCoA clustering.
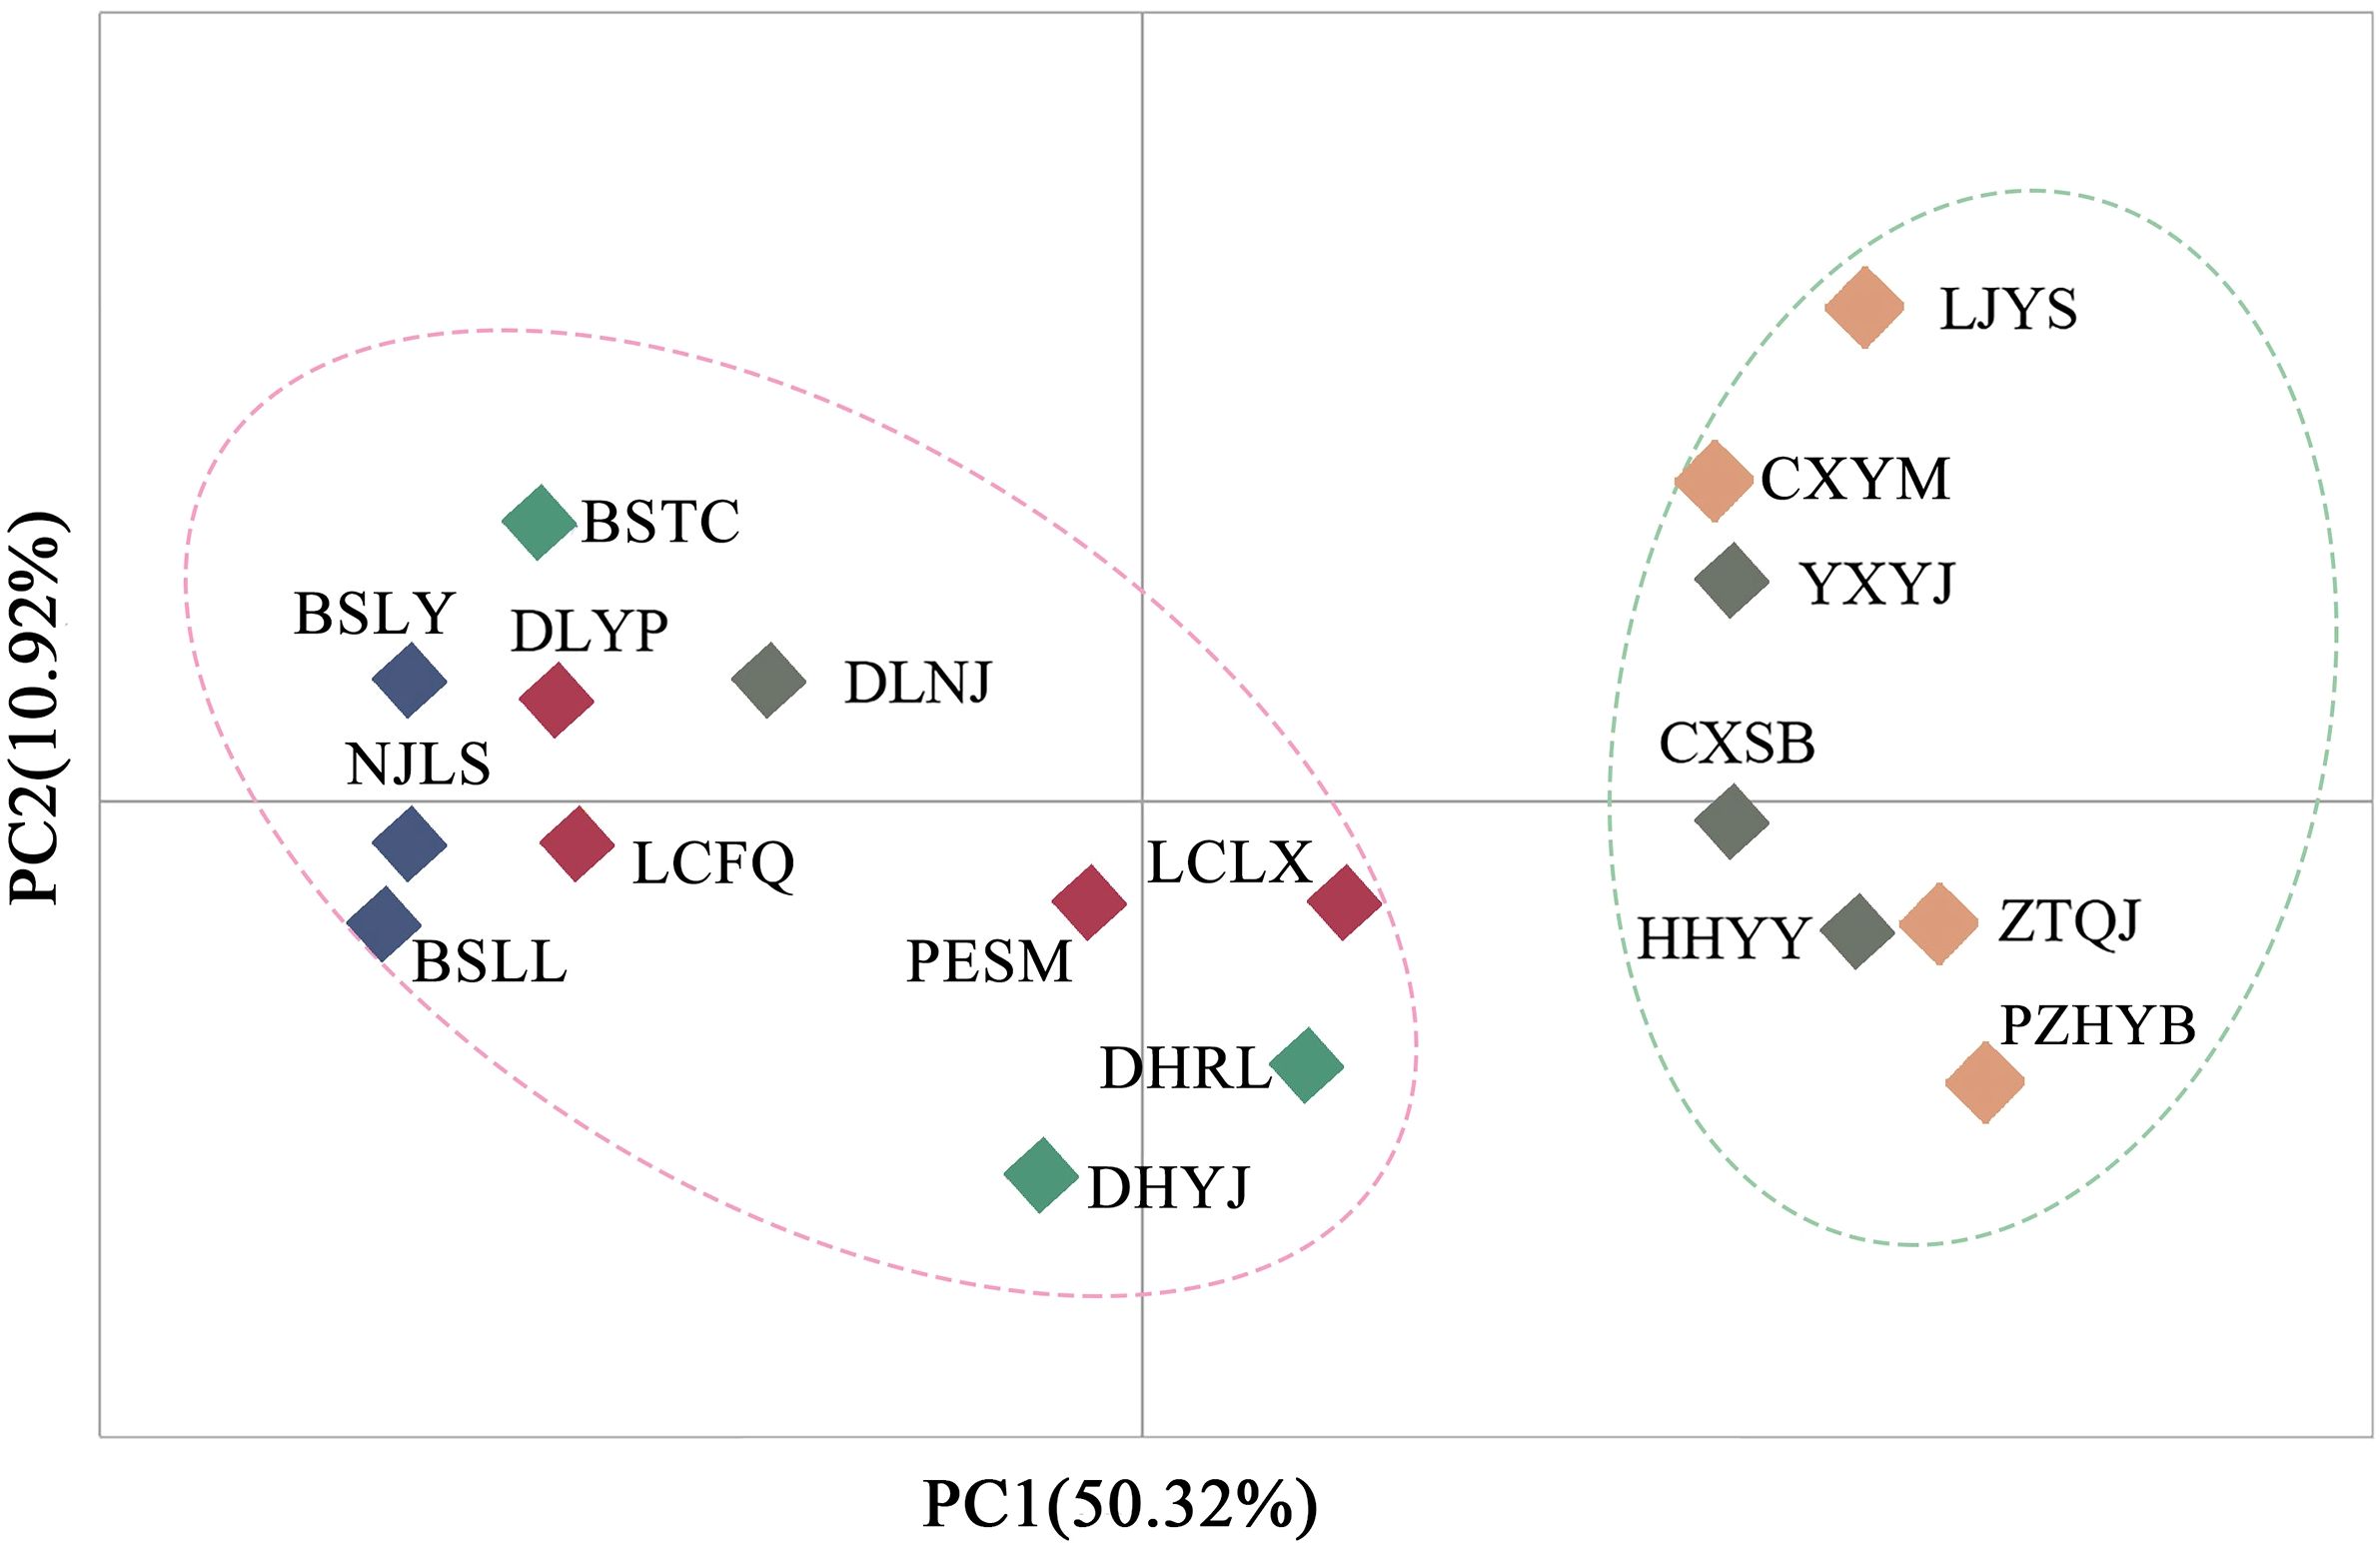
Figure 2. Principal component analysis (PCoA) for 18 natural Phyllanthus emblica populations based on genetic distance. Population information is shown in Table 1.
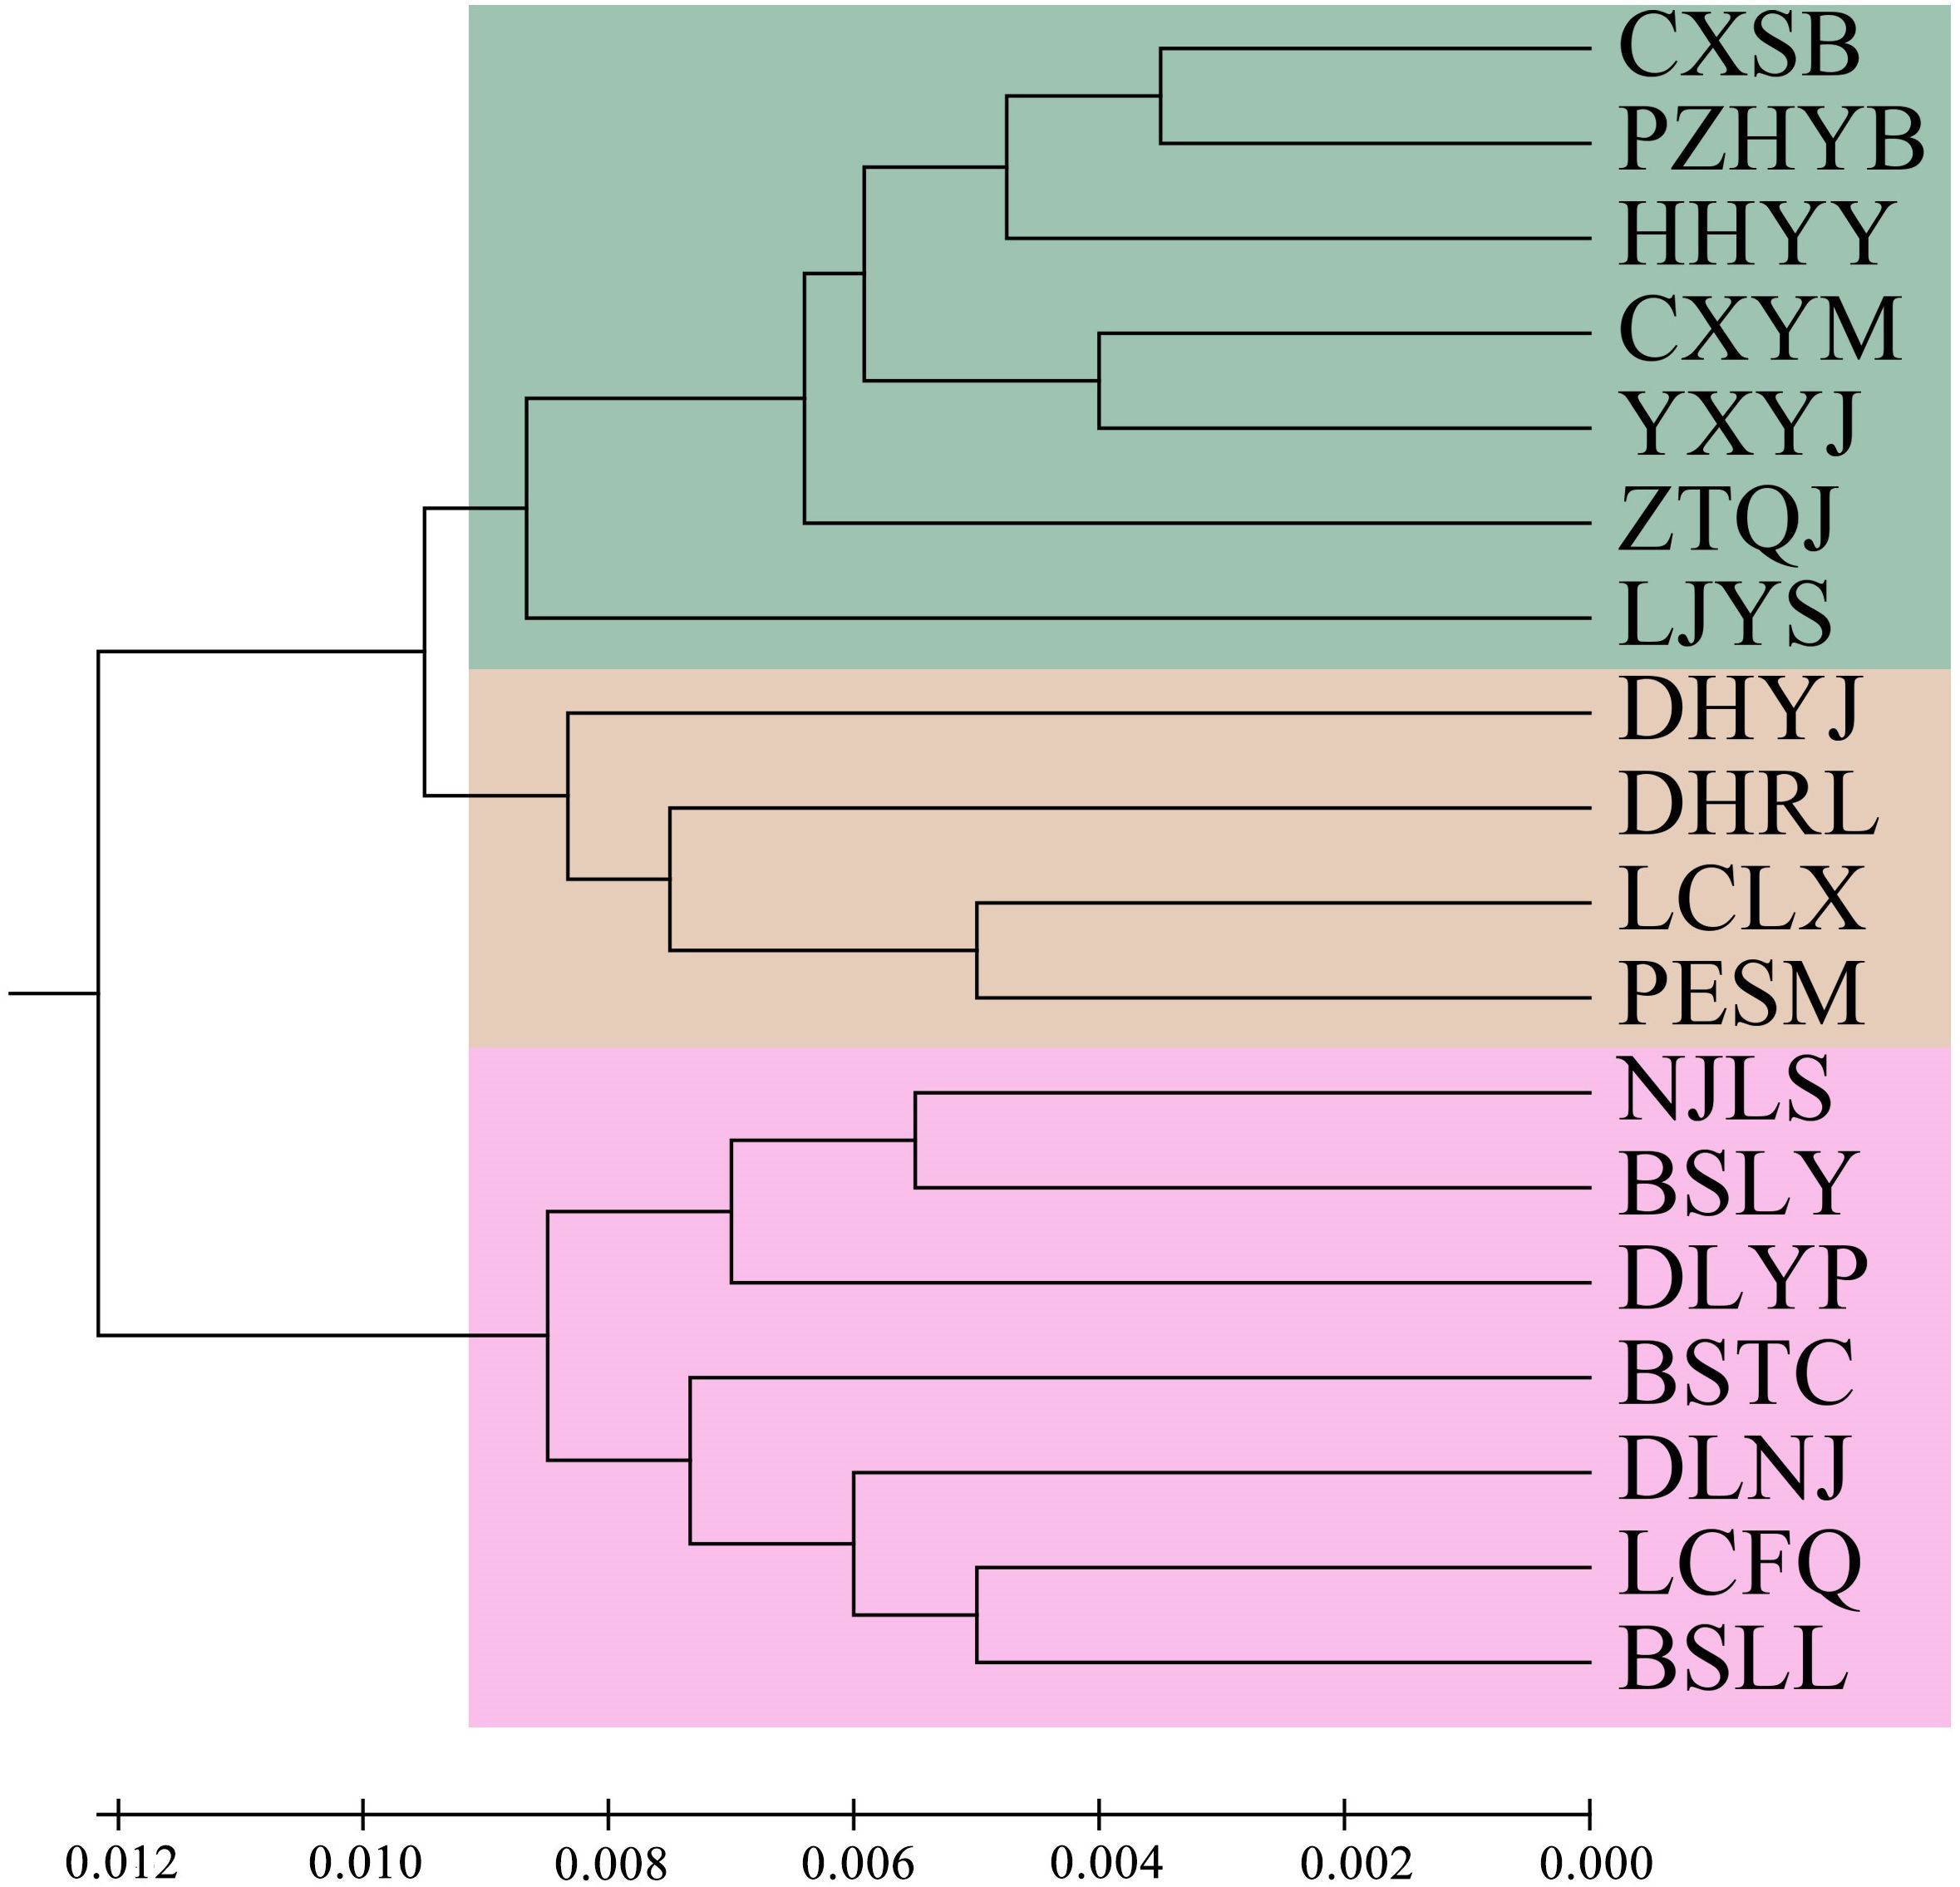
Figure 3. UPGMA dendrogram of 18 natural Phyllanthus emblica populations based on Nei’s genetic distances. Population information is shown in Table 1.

Figure 4. Genetic structure for 18 natural Phyllanthus emblica populations. (A) relationship between group number (K) of Phyllanthus emblica and estimated delta K revealed with STRUCTURE analysis. (B) the genetic structure plot of natural Phyllanthus emblica populations on the basis of STRUCTURE analysis. Population information is shown in Table 1.
Analysis of molecular variation (AMOVA) revealed significant genetic variation (p<0.001) across three hierarchical levels: among river valleys (2.32%), among populations within river valleys (4.32%), and within populations (93.36%). The Longchuan River valley exhibited the highest (5.69%) while the Nu River valley the lowest (2.65%) genetic variations among populations (Supplementary Table S2). Taking two groups mentioned above into consideration, genetic variation was partitioned as follows: among groups (3.66%), among populations within groups (4.34%), and within populations (92.00%). Notably, the genetic variations within and among populations were similar in the eastern and western groups (Table 4).
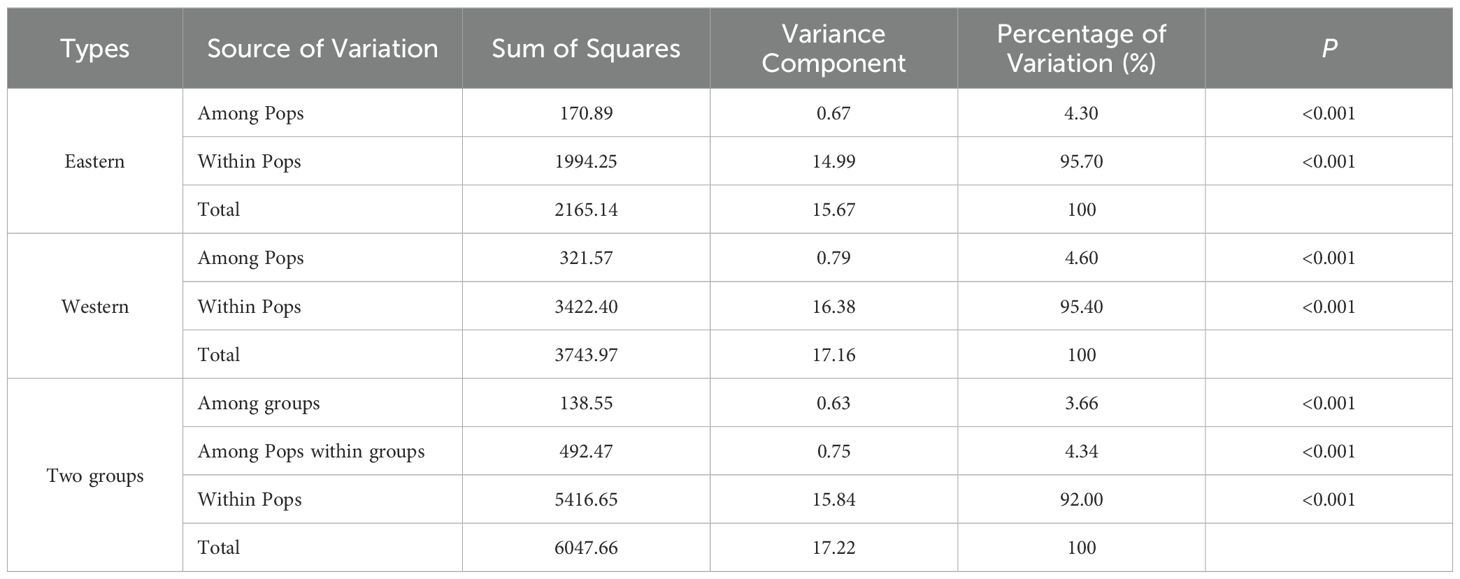
Table 4. Analysis of molecular variation (AMOVA) for natural Phyllanthus emblica populations (Pops) in two groups (eastern and western) based on 16 SSR markers.
At the river valley level, the genetic differentiation (PhiPT) was the largest (0.081) between the Nu and Jinsha Rivers, and the smallest (0.010) between the Longchuan and Lancang River valleys (Table 5). At the population level, the PhiPTs between paired populations from the western group as well as from the eastern group were mostly lower than those between any paired populations including one from the western and another from the eastern groups (Supplementary Table S3). Furthermore, both the Mantel test and the partial Mantel test (Table 6) demonstrated a significant correlation between PhiPT and geographic distance regardless of whether environmental distance was controlled for paired populations (r = 0.4326, p = 0.0002) or not (r = 0.4265, p = 0.0002). No significant relationship was observed between PhiPT and environmental distance (r = 0.0788, p = 0.2081).
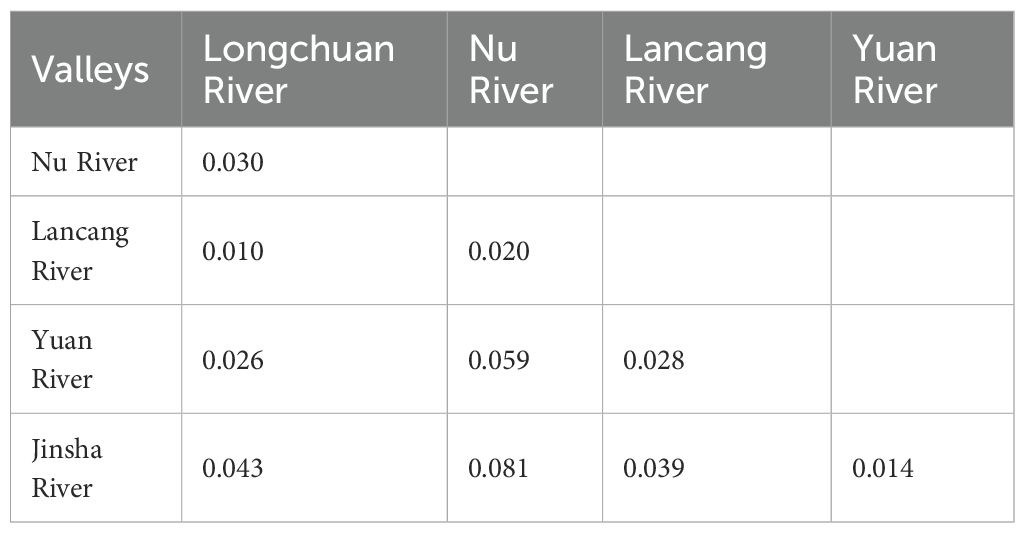
Table 5. Genetic differentiation values (PhiPT) between five river valleys for Phyllanthus emblica based on analysis of molecular variation (AMOVA).
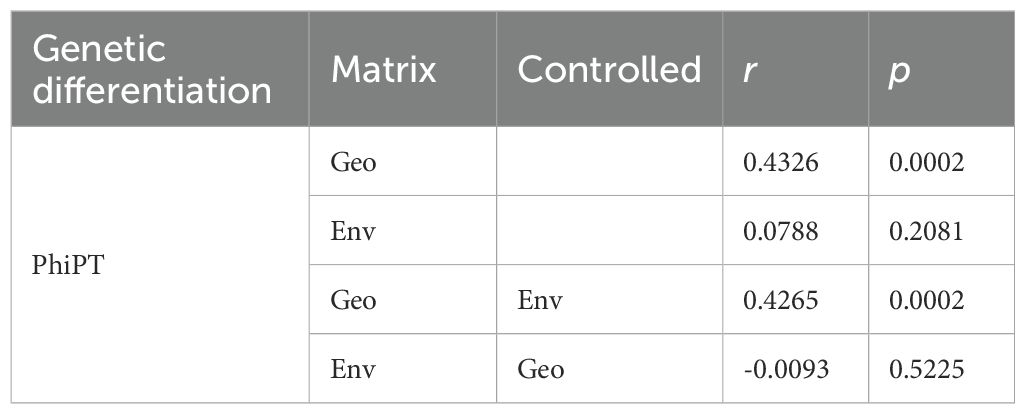
Table 6. Results of Mantel and partial Mantel tests for correlations between population genetic differentiation values (PhiPT) and geographical distance (Geo) as well as PhiPT and environmental distance for 18 Phyllanthus emblica populations.
3.4 Geographic and environmental drivers of genetic diversity
Redundancy analysis (RDA) demonstrated that the first and second ordination axes explained 62.70% and 6.29% of the variation in genetic diversity, respectively (Figure 5A). Ho, He and I of P. emblica populations were in significantly positive correlation with Bio18 (Precipitation of the warmest quarter), and were in negative correlation with Bio10 (Mean temperature of warmest quarter). The Monte Carlo permutation test further showed that only Bio18 and Bio10 had significant effects on genetic diversity (P<0.05), with their interpretation degree to the genetic diversity being 23.70% and 22.70%, respectively (Figure 5B). Based on T test, there existed significant differences in Bio8 and Bio10 between the western and eastern groups (Table 7).
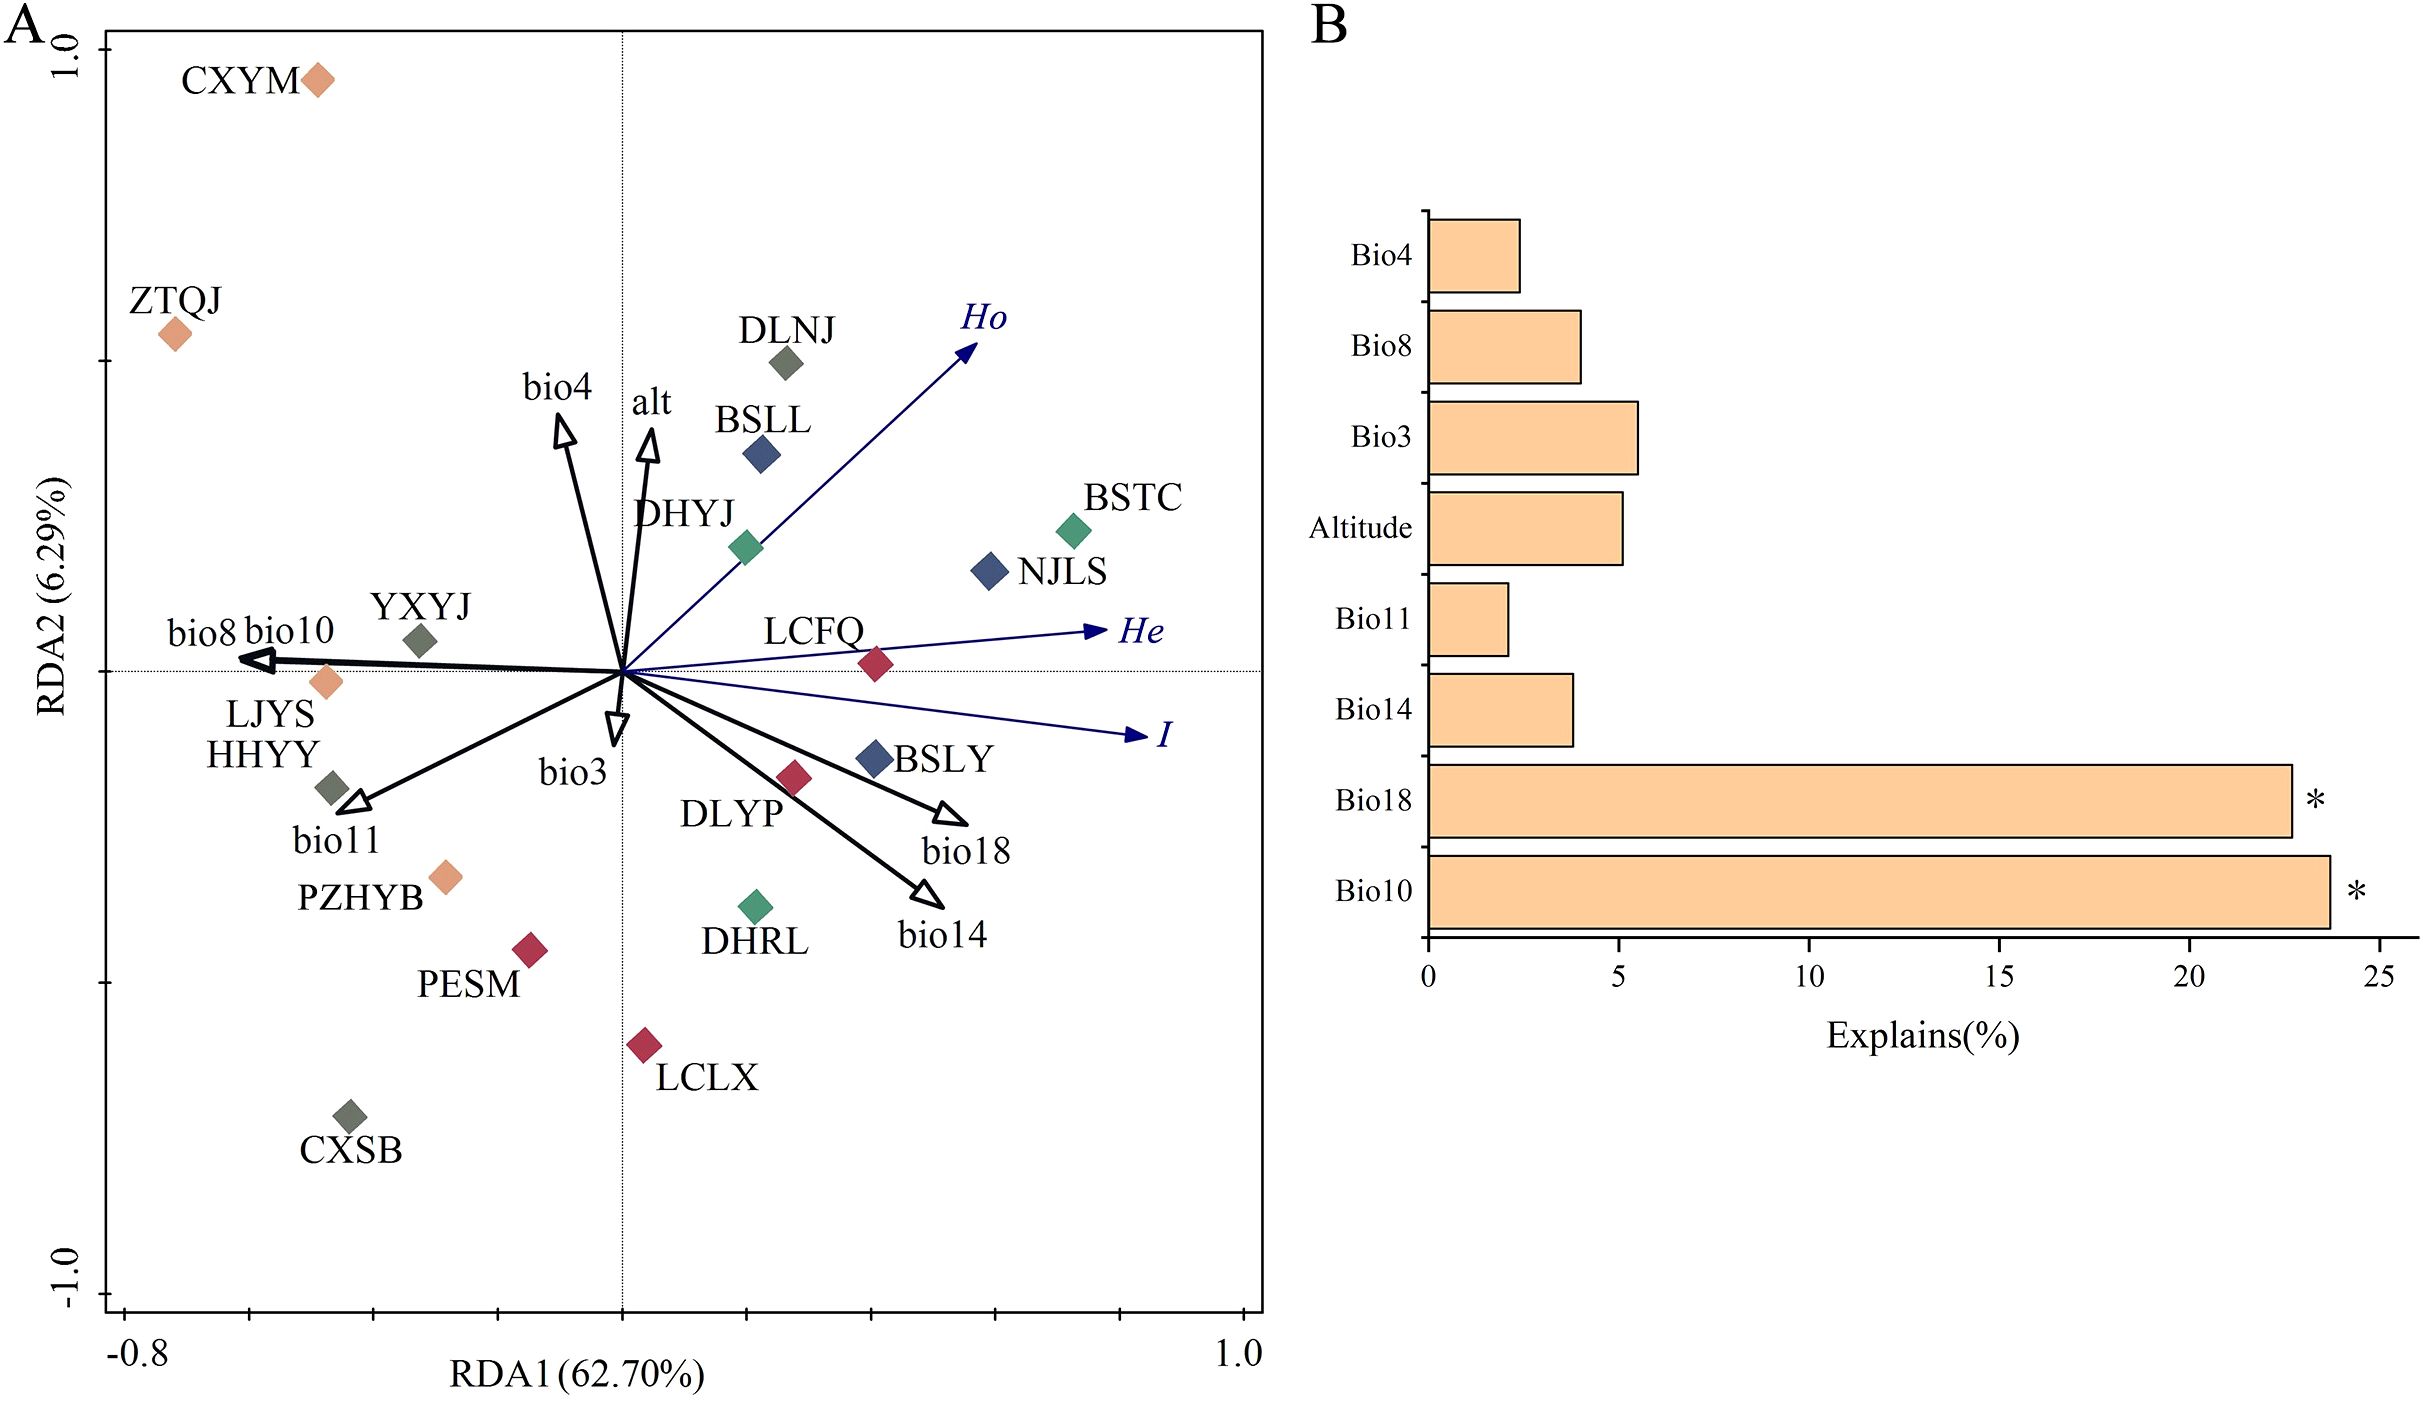
Figure 5. Ordination plots of the redundancy analysis (RDA) for genetic diversity versus environmental factors. (A) relationship between genetic diversity and environmental factors; and (B) the contribution of environmental factors to genetic diversity variation for Phyllanthus emblica. Population information is shown in Table 1, and environmental factor information in Supplementary Table S1.
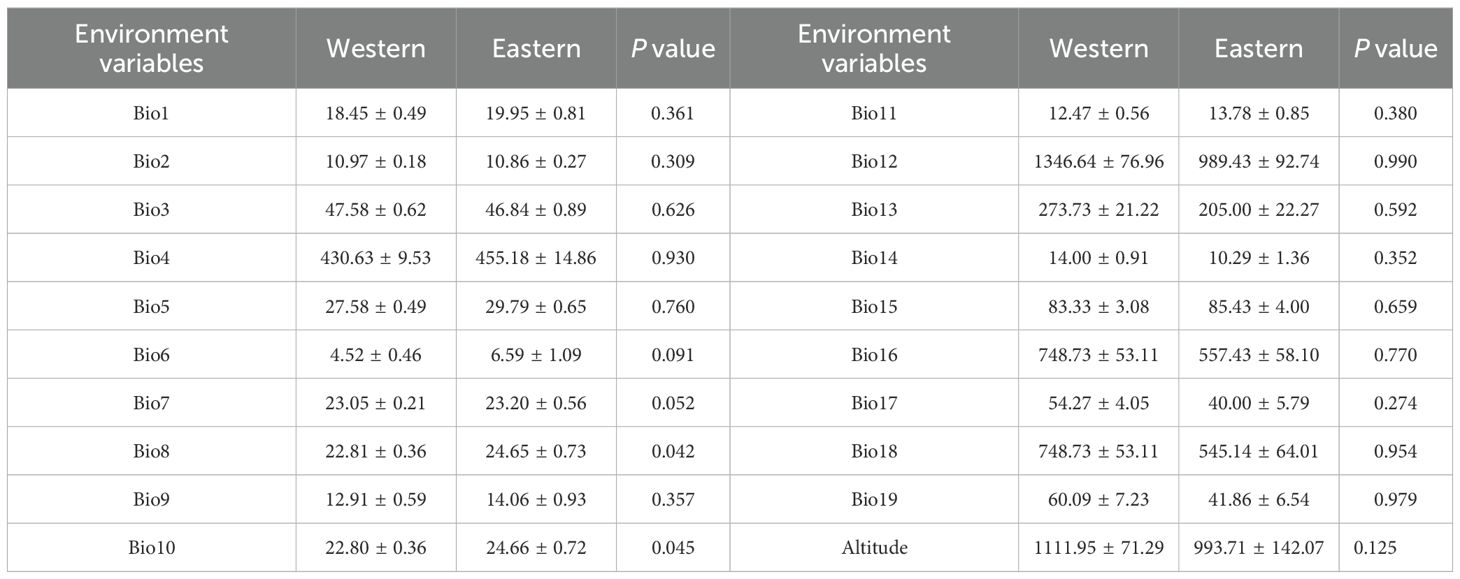
Table 7. T test of differences in 20 environmental factors between the eastern and western groups.
3.5 Historical changes of ecological niche for P. emblica
The mean area under the curve (AUC) value for the current potential distribution zones of P. emblica was 0.972 ± 0.001, indicating a better predictive model. From the Last Glacial Maximum (LGM) through the Middle Holocene (MH) to the present, the area of optimal class had shown a trend of increasing (Figures 6A–C). The current optimal area was 14.04×10⁴ km2 higher than those of LGM and MH, respectively (Table 8). The LGM had the smallest area for each potential distribution class. In the past two periods, P. emblica was primarily distributed below 26°N in latitude, whereas the contemporary distribution expanded well beyond 26°N, showing a much broader spread across the river valleys studied and their surrounding areas. In particular, it was demonstrated in Figure 6C that the optimal distributions on the western side were more continuous than those on the eastern side of the Tanaka-Kaiyong Line, that’s to say, the optimal distribution of P. emblica on the eastern side was more fragmented at present.
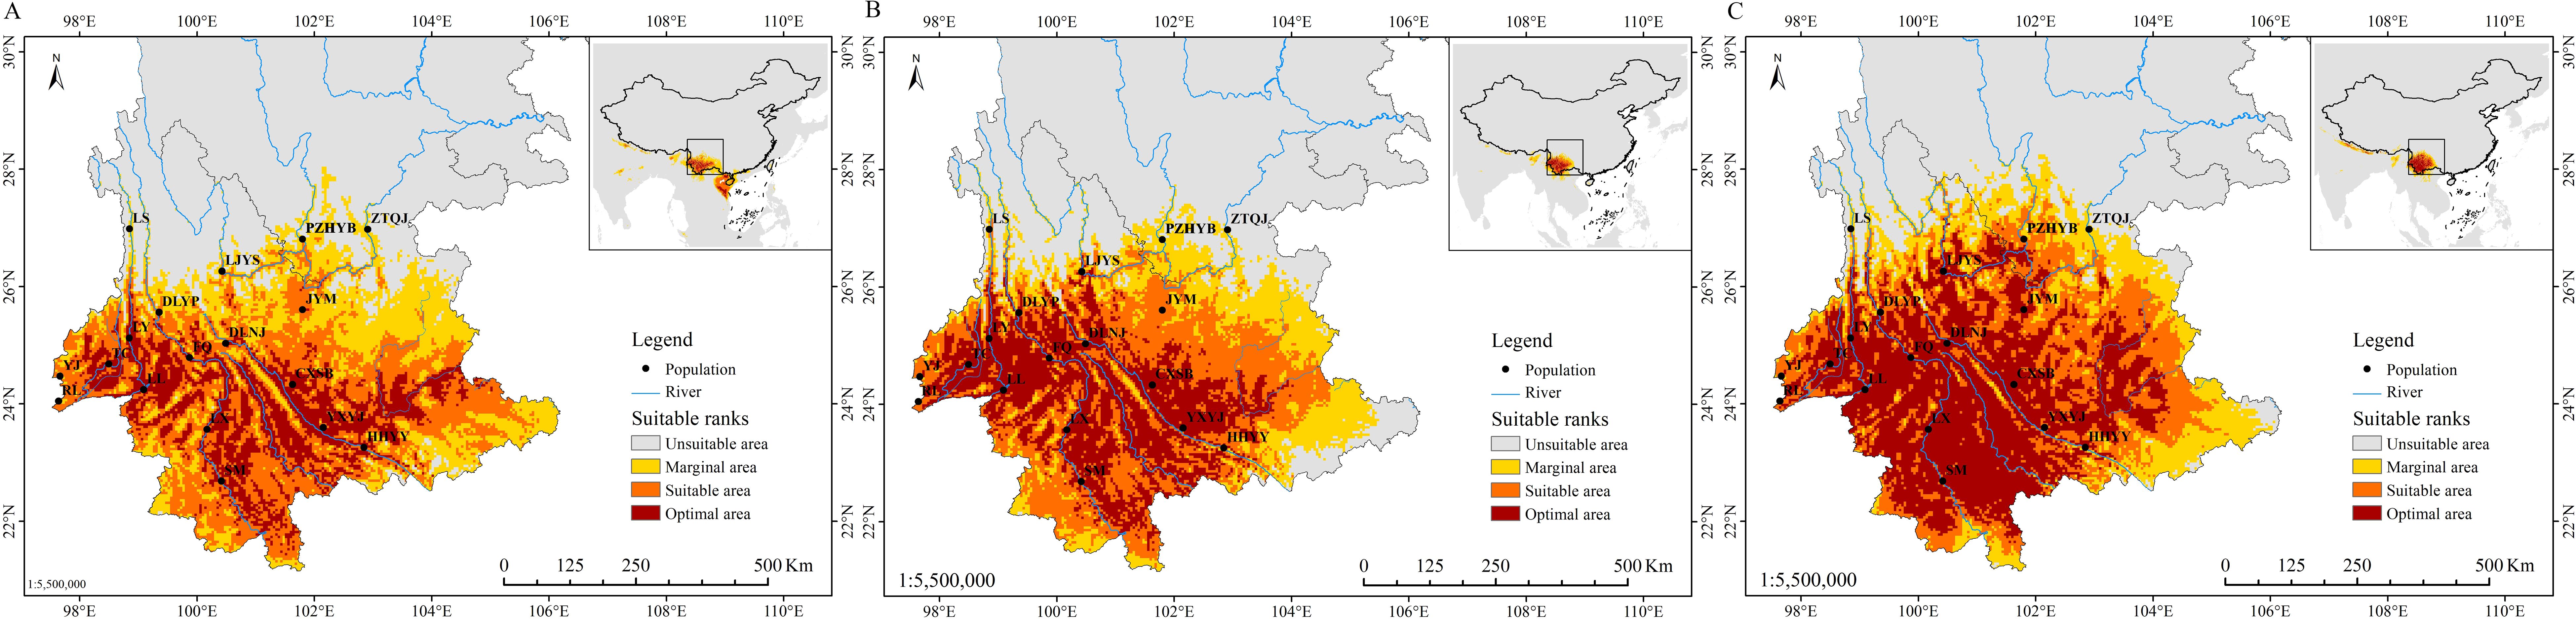
Figure 6. Potential distribution range of Phyllanthus emblica in the three periods. (A) Last Glacial Maximum; (B) Middle Holocene; and (C) present. LGM, Last Glacial Maximum; and MH, Middle Holocene.
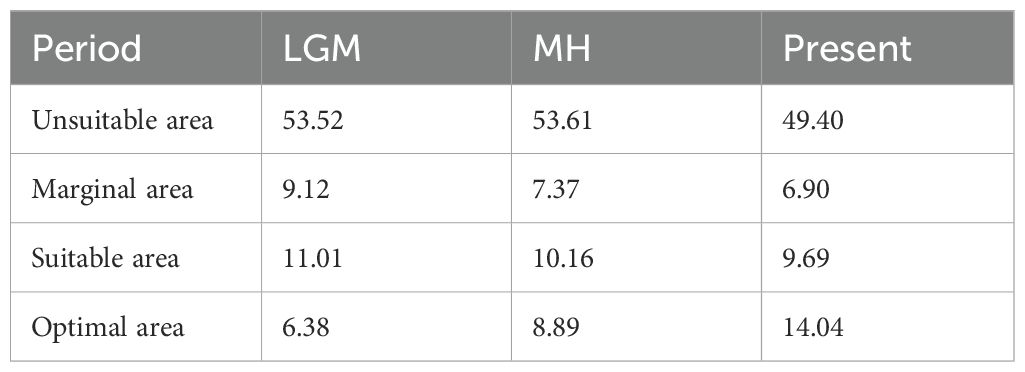
Table 8. Areas of suitable zone of in the three period (×104km2).
4 Discussion
4.1 Genetic diversity
This study revealed high genetic diversity across 18 natural P. emblica populations in Yunnan, China, based on 16 SSR loci. The mean number of alleles per locus (Na), the observed heterozygosity (Ho) and the expected heterozygosity (He) were 6.990, 0.790 and 0.666 respectively (Table 3). These values exceed those reported for two populations in Thailand (5 SSR loci; Na=4.900, Ho=0.548, He=0.619; Pandey and Changtragoon, 2012), and 20 individuals in India (15 SSR loci; Na=4.000, He=0.607; Geethika et al., 2018). However, they were lower than values from 10 natural populations in Yunnan and Guangxi, China (20 EST-SSR loci; Na: 10.425, He: 0.792; Liu et al., 2020). Differences in genetic diversity parameters among these studies likely stem not only from variations in the number of populations, areas studied, and SSR markers used, but also from complex ploidy of P. emblica (diploid, polyploid, or mixed), a factor known to significantly influence such results (Kosman and Leonard, 2005). Notably, ploidy status was unspecified in the three comparative studies, all of which employed diploid-specific analytical softwares for genetic diversity estimation. This methodological limitation is critical, as standard diploid frameworks cannot accurately resolve heterozygous genotypes in polyploids, potentially biasing diversity estimates (Meirmans et al., 2018). Nevertheless, the P. emblica populations in this study exhibit high genetic diversity.
Among the five river valleys, P. emblica populations in the Longchuan, Nu and Lancang River valleys exhibited higher level of genetic diversity than those in the Jinsha and Yuan River valleys (Table 3). This could be explained by the deduction from Figure 6 that the Nu and Lancang River valleys may serves as refuge for P. emblica during the LGM and MH. No clearly consistent trend was observed in the changes of genetic diversity from upstream to downstream across five river valleys. For example, the Shannon-Wiener diversity index (I) exhibited a decline in the Longchuan, Lancang and Yuan River valleys, maintained nearly stable in the Nu River valley, and displayed no discernible pattern in the Jinsha River valley. These differences may be attributed to a complex interplay of altitude (Liang et al., 2008), microclimate (Zhao et al., 2021), microtopography (Ohsawa et al., 2008), and soil properties (Yang et al., 2018), etc. Interestingly, genetic diversity in P. emblica was significantly influenced by Bio18 (Precipitation of the warmest quarter) and Bio10 (Mean temperature of the warmest quarter) in this study (Figure 5). Furthermore, the absence of a consistent upstream-downstream genetic diversity trend may also stem from pollen- and seed-mediated gene flow shaped by the landscape complexity in the region (Cruzan and Hendrickson, 2020).
4.2 Genetic differentiation
The present study revealed that 18 P. emblica populations from Yunnan could be divided into two groups: eastern and western, corresponding to the biogeographical partitioning across the Tanaka-Kaiyong Line, a major floristic boundary. The genetic differentiation were significant between the eastern and western groups (Table 4, Supplementary Table S3). Previous studies of perennial herbs (Zhang et al., 2006), shrubs (Fan et al., 2013), and deciduous trees (Tian et al., 2015) in phylogeography have also demonstrated distinct intraspecific genetic patterns on both sides of the Tanaka-Kaiyong Line. This phenomenon may be attributed to the environmental disparity on eastern and western sides of the Tanaka-Kaiyong Line. The climate is mainly shaped by the East Asian monsoon on the eastern side, while by the Southeast Asian monsoon on the western side (Fan et al., 2013; Tian et al., 2015). Fossil assemblages, palaeogeographic data, and paleoclimate evidence also indicate that Tanaka-Kaiyong Line of biogeographic importance stems from historical tectonic activity and/or prolonged environmental differentiation, effectively restricting plant dispersal and gene flow between the eastern and western populations (Li and Li, 1997; Zhao and Gong, 2015).
In the present study, further explanations can be described in more detail. Temperature is higher and rainfall is lower on the eastern side than on the western side of the Tanaka-Kaiyong Line in the current period (Table 7), and mean temperature of the warmest quarter and precipitation of the warmest quarter were the most important factors influencing the genetic diversity of P. emblica (Figure 4). Such environmental heterogeneity likely imposes divergent selection pressure, and amplifying the genetic differentiation between the eastern and western populations.
Notably, the lowest genetic differentiation occurred between the Longchuan and Lancang River valleys. This pattern may be attributed to the geographical configuration of the DHRL and DHYJ populations in Longchuan River valley and LCLX and PESM populations in Langcang River valley, which inhabit the middle or lower reaches characterized by reduced topographic complexity. Environmental homogeneity across these populations might have reinforced genetic cohesion via stabilizing selection. Furthermore, the absence of significant mountain barriers in these regions likely facilitated sustained gene flow via pollen or seed dispersal. Pollen flow, particularly in wind-pollinated species, typically exhibits long dispersal distances and great permeability compared to seed flow (e.g., gravity/rodent-dispersed plants) (Wang et al., 2012). The effectiveness of both dispersal modes is contingent upon the severity of topographic barriers (Gugger et al., 2008). Additionally, river corridors can facilitate seed dispersal (Nurtaza et al., 2024; Perez-Garcia et al., 2025). Collectively, the open topography and river networks likely explain the low genetic differentiation.
Similarly, relatively low genetic differentiation was observed between the Yuan and Jinsha River valleys. Paleogeological evidence indicates that the Jinsha River was once a tributary of the Yuan River, and was isolated from the Yuan River due to the reorganization of the ancient drainage systems associated with river capture and flow reversal events (Clark et al., 2004). These tectonic processes, which predated or coincided with the Miocene uplift (Clark et al., 2004; Yue et al., 2012), likely preserved ancestral genetic connectivity between P. emblica populations in these two valleys, explaining their limited contemporary genetic differentiation.
4.3 Distribution dynamics under climate change
Understanding changes in the potential distribution patterns of a species is crucial for assessing the impacts of climate change and developing effective conservation strategies (Deb et al., 2017). Ecological niche analyses showed that the size of the habitable zone of P. emblica gradually increased from the Last Glacial Maximum (LGM) to the present (Table 8). Studies of Tierney et al (Tierney et al., 2020). and Osman et al. (2021) indicate that the mean temperatures during the LGM and the MH were 6.1°C and 0.5-1.5°C lower than that at the present, respectively. Climate warming has led to an upward shift in the suitable altitude range, significantly expanding the suitable habitats for P. emblica in Yunnan. Overall, the species exhibits a low extinction risk in the context of future global warming.
These highly diverse P. emblica populations constitute a valuable genetic resource. Under the background of global climate change, exploiting their rich genetic variation can facilitate the selection of climate-resilient, high-quality varieties, and support breeding programs for high-yielding cultivars with specific medicinal values (Swarup et al., 2021). Furthermore, in ecological restoration initiatives, utilizing seeds from these genetically diverse populations ensures rehabilitated stands maintain sufficient genetic variation. This inherent diversity enhances population resilience against future environmental changes, such as climate shifts and emergence of pests or diseases (Kistner et al., 2018).
5 Conclusions
High genetic diversity of P. emblica was identified across five river valleys in Yunnan, China using SSR markers. The genetic diversity could potentially be influenced by mean temperature of warmest quarter and precipitation of the warmest quarter. Significant genetic differentiation was observed between the western and eastern P. emblica populations, potentially due to geographic isolation and environmental heterogeneity, with the Tanaka-Kaiyong Line possibly acting as a contributing barrier. The distribution of P. emblica in the eastern region is more fragmented than that in the western region. Given that the natural populations of P. emblica have not yet reached an endangered level, it is recommended that in situ conservation be the primary conservation approach in the future. Populations with high genetic diversity such as those in the Nu and Longchuan River valleys should be given the highest conservation priority. Concurrently, integrating genetic diversity and genetic structure with fruit morphological and quality characteristics in germplasm collection and evaluation will facilitate the improvement of P. emblica germplasms.
Data availability statement
The datasets presented in this study can be found in online repositories. The names of the repository/repositories and accession number(s) can be found below: https://www.ncbi.nlm.nih.gov/genbank/, MK017818 https://www.ncbi.nlm.nih.gov/genbank/, MK017800 https://www.ncbi.nlm.nih.gov/genbank/, MK017799 https://www.ncbi.nlm.nih.gov/genbank/, MK017801 https://www.ncbi.nlm.nih.gov/genbank/, MK017802 https://www.ncbi.nlm.nih.gov/genbank/, MK017803 https://www.ncbi.nlm.nih.gov/genbank/, MK017804 https://www.ncbi.nlm.nih.gov/genbank/, MKO17805 https://www.ncbi.nlm.nih.gov/genbank/, MK017806 https://www.ncbi.nlm.nih.gov/genbank/, MKO17807 https://www.ncbi.nlm.nih.gov/genbank/, MK017808 https://www.ncbi.nlm.nih.gov/genbank/, MK017809 https://www.ncbi.nlm.nih.gov/genbank/, MK017810 https://www.ncbi.nlm.nih.gov/genbank/, MK017811 https://www.ncbi.nlm.nih.gov/genbank/, MK017813 https://www.ncbi.nlm.nih.gov/genbank/, MK017814.
Author contributions
C-YW: Methodology, Writing – original draft, Visualization. J-CH: Investigation, Conceptualization, Writing – review & editing. M-YY: Data curation, Writing – original draft. H-JH: Visualization, Software, Writing – original draft. Y-PY: Software, Investigation, Writing – original draft, Data curation. J-JG: Conceptualization, Supervision, Writing – review & editing. JZ: Investigation, Writing – review & editing.
Funding
The author(s) declare financial support was received for the research and/or publication of this article. This work was supported by the Fundamental Research Funds for the Central Non-profit Research Institution of CAF (CAFYBB2020ZB003 and CAFYBB2020SY019) and “Yunling Industrial Technology Leading Talents” Training Fund of Yunnan Province (2015-30).
Acknowledgments
The authors thank forest and grass departments of each city or prefecture in the study areas for providing investigation and sampling supports.
Conflict of interest
The authors declare that the research was conducted in the absence of any commercial or financial relationships that could be construed as a potential conflict of interest.
Generative AI statement
The author(s) declare that no Generative AI was used in the creation of this manuscript.
Any alternative text (alt text) provided alongside figures in this article has been generated by Frontiers with the support of artificial intelligence and reasonable efforts have been made to ensure accuracy, including review by the authors wherever possible. If you identify any issues, please contact us.
Publisher’s note
All claims expressed in this article are solely those of the authors and do not necessarily represent those of their affiliated organizations, or those of the publisher, the editors and the reviewers. Any product that may be evaluated in this article, or claim that may be made by its manufacturer, is not guaranteed or endorsed by the publisher.
Supplementary material
The Supplementary Material for this article can be found online at: https://www.frontiersin.org/articles/10.3389/fpls.2025.1648822/full#supplementary-material
References
Badgley, C., Smiley, T. M., Terry, R., Davis, E. B., DeSantis, L. R. G., Fox, D. L., et al. (2017). Biodiversity and topographic complexity: Modern and geohistorical perspectives. Trends Ecol. Evol. 32, 211–226. doi: 10.1016/j.tree.2016.12.010
Bankevich, A., Nurk, S., Antipov, D., Gurevich, A. A., Dvorkin, M., Kulikov, A. S., et al. (2012). SPAdes: A new genome assembly algorithm and its applications to single-cell sequencing. J. Comput. Biol. 19, 455–477. doi: 10.1089/cmb.2012.0021
Chaphalkar, R., Apte, K. G., Talekar, Y., Ojha, S. K., and Nandave, M. (2017). Antioxidants of Phyllanthus emblica L. bark extract provide hepatoprotection against ethanol-induced hepatic damage: A comparison with silymarin. Oxid. Med. Cell. Longev. 1, 3876040. doi: 10.1155/2017/3876040
Clark, M. K., Schoenbohm, L. M., Royden, L. H., Whipple, K. X., Burchfiel, B. C., Zhang, X., et al. (2004). Surface uplift, tectonics, and erosion of eastern Tibet from largescale drainage patterns. Tectonics 23, 2002TC001402. doi: 10.1029/2002TC001402
Cruzan, M. B. and Hendrickson, E. C. (2020). Landscape genetics of plants: Challenges and opportunities. Plant Commun. 1, 100100. doi: 10.1016/j.xplc.2020.100100
Deb, J. C., Phinn, S., Butt, N., and McAlpine, C. A. (2017). The impact of climate change on the distribution of two threatened Dipterocarp trees. Ecol. Evol. 7, 2238–2248. doi: 10.1002/ece3.2846
Earl, D. A. and vonHoldt, B. M. (2012). STRUCTURE HARVESTER: A website and program for visualizing STRUCTURE output and implementing the Evanno method. Conserv. Genet. Resour. 4, 359–361. doi: 10.1007/s12686-011-9548-7
Fan, D. M., Yue, J. P., Nie, Z. L., Li, Z. M., Comes, H. P., and Sun, H. (2013). Phylogeography of Sophora davidii (Leguminosae) across the ‘Tanaka-Kaiyong Line’, an important phytogeographic boundary in Southwest China. Mol. Ecol. 22, 4270–4288. doi: 10.1111/mec.12388
Favre, A., Päckert, M., Pauls, S. U., Jähnig, S. C., Uhl, D., and Michalak, I. (2015). The role of the uplift of the Qinghai-Tibetan Plateau for the evolution of Tibetan biotas. Biol. Rev. 90, 236–253. doi: 10.1111/brv.12107
Gao, X. X., Liu, J., and Huang, Z. H. (2022). The impact of climate change on the distribution of rare and endangered tree Firmiana kwangsiensis using the Maxent modeling. Ecol. Evol. 12, e9165. doi: 10.1002/ece3.9165
Geethika, E., Triveni, H. N., Srirama, R., Siva, R., Siddappa, S., and Ravikanth, G. (2018). Development and characterization of microsatellite markers for Phyllanthus emblica Linn, important nontimber forest product species. J. Genet. 97, 1001–1006. doi: 10.1007/s12041-018-0979-8
Gugger, P. F., McLachlan, J. S., Manos, P. S., and Clark, J. S. (2008). Inferring long-distance dispersal and topographic barriers during post-glacial colonization from the genetic structure of red maple (Acer rubrum L.) in New England. J. Biogeogr. 35, 1665–1673. doi: 10.1111/j.1365-2699.2008.01915.x
Guisan, A. and Zimmermann, N. E. (2000). Predictive habitat distribution models in ecology. Ecol. Model. 135, 147–186. doi: 10.1016/S0304-3800(00)00354-9
Guo, J. J., Shang, S. B., Wang, C. S., Zhao, Z. G., and Zeng, J. (2017). Twenty microsatellite markers for the endangered Vatica mangachapoi (Dipterocarpaceae). Appl. Plant Sci. 5, 1600134. doi: 10.3732/apps.1600134
He, K. and Jiang, X. (2014). Sky islands of southwest China. I: an overview of phylogeographic patterns. Chin. Sci. Bull. 59, 1–13. doi: 10.1007/s11434-013-0089-1
Hewitt, G. M. (2000). The genetic legacy of the quaternary ice ages. Nature 405, 907–913. doi: 10.1038/35016000
Hulce, D., Li, X., Snyder-Leiby, T., and Liu, C. J. (2011). GeneMarker® genotyping software: Tools to increase the statistical power of DNA fragment analysis. J. Biomole. Tech. 22, S35.
Jia, J., Zeng, L., and Gong, X. (2016). High genetic diversity and population differentiation in the critically endangered plant species Trailliaedoxa gracilis (Rubiaceae). Plant Mol. Biol. Rep. 34, 327–338. doi: 10.1007/s11105-015-0924-4
Jinga, P. and Ashley, M. V. (2018). A mountain range is a strong genetic barrier between populations of Afzelia quanzensis (pod mahogany) with low genetic diversity. Tree Genet. Genomes 14, 1–10. doi: 10.1007/s11295-017-1217-x
Kamvar, Z. N., Tabima, J. F., and Grünwald, N. J. (2014). Poppr: An R package for genetic analysis of populations with clonal, partially clonal, and/or sexual reproduction. Peer J. 2, e281. doi: 10.7717/peerj.281
Kistner, E., Kellner, O., Andresen, J., Todey, D., and Morton, L. W. (2018). Vulnerability of specialty crops to short-term climatic variability and adaptation strategies in the Midwestern USA. Climatic Change 146, 145–158. doi: 10.1007/s10584-017-2066-1
Kosman, E. and Leonard, K. J. (2005). Similarity coefficients for molecular markers in studies of genetic relationships between individuals for haploid, diploid, and polyploid species. Mol. Ecol. 14, 415–424. doi: 10.1111/j.1365-294X.2005.02416.x
Krishnaiah, D., Devi, T., and Bono, A. (2009). Studies on phytochemical constituents of six Malaysian medicinal plants. J. Med. Plants Res. 3, 67–72.
Kumar, S., Stecher, G., and Tamura, K. (2016). MEGA7: molecular evolutionary genetics analysis version 7.0 for bigger datasets. Mol. Biol. Evol. 33, 1870–1874. doi: 10.1093/molbev/msw054
Labbé, J., Murat, C., Morin, E., Le Tacon, F., and Martin, F. (2011). Survey and analysis of simple sequence repeats in the Laccaria bicolor genome, with development of microsatellite markers. Curr. Genet. 57, 75–88. doi: 10.1007/s00294-010-0328-9
Li, X. W. and Li, J. (1997). The Tanaka-Kaiyong line - An important floristic line for the study of the flora of East Asia. Ann. Mo. Bot. Gard. 84, 888–892. doi: 10.2307/2992033
Li, Y., Zhang, X., and Fang, Y. (2019). Landscape features and climatic forces shape the genetic structure and evolutionary history of an oak species (Quercus chenii) in East China. Front. Plant Sci. 10. doi: 10.3389/fpls.2019.01060
Li, Q. M. and Zhao, J. L. (2007). Genetic diversity of Phyllanthus emblica populations in dry-hot valleys in Yunnan. Bio. Sci. 15, 84–91. doi: 10.1360/biodiv
Liang, Y., Liu, J., Zhang, S. P., Wang, S. J., Guo, W. H., and Wang, R. Q. (2008). Genetic diversity of the invasive plant Coreopsis grandiflora at different altitudes in Laoshan Mountain, China. Can. J. Plant Sci. 88, 831–837. doi: 10.4141/CJPS07020
Liu, X., Ma, Y., Wan, Y., Li, Z., and Ma, H. (2020). Genetic diversity of Phyllanthus emblica from two different climate type areas. Front. Plant Sci. 11. doi: 10.3389/fpls.2020.580812
López-González, N., Bobo-Pinilla, J., Padilla-García, N., Loureiro, J., Castro, S., Rojas-Andrés, B. M., et al. (2021). Genetic similarities versus morphological resemblance: Unraveling a polyploid complex in a Mediterranean biodiversity hotspot. Mol. Phylogenet. Evol. 155, 107006. doi: 10.1016/j.ympev.2020.107006
Ma, Q. G., Wang, L., Liu, R. H., Yuan, J. B., Xiao, H., Shen, Z. Y., et al. (2024). Phyllanthus emblica Linn: A comprehensive review of botany, traditional uses, phytonutrients, health benefits, quality markers, and applications. Food Chem. 446, 138891. doi: 10.1016/j.foodchem.2024.138891
Markwith, S. H., Stewart, D. J., and Dyer, J. L. (2006). TETRASAT: a program for the population analysis of allotetraploid microsatellite data. Mol. Ecol. Notes 6, 586–589. doi: 10.1111/j.1471-8286.2006.01345.x
Meirmans, P. G., Liu, S., and van Tienderen, P. H. (2018). The analysis of polypoid genetic data. J. Hered. 109, 283–296. doi: 10.1093/jhered/esy006
Meng, H. H., Su, T., Gao, X. Y., Li, J., Jiang, X. L., Sun, H., et al. (2017). Warm–cold colonization: response of oaks to uplift of the Himalaya–Hengduan Mountains. Mol. Ecol. 26, 3276–3294. doi: 10.1111/mec.14092
Morris, C. (2015). Multivariate analysis of ecological data using Canoco 5, 2nd Edition. Afr. J. Range For. Sci. 32, 289–290. doi: 10.2989/10220119.2015.1015053
Nakanishi, A., Takeuchi, T., Ueno, S., Nishimura, N., and Tomaru, N. (2020). Spatial variation in bird pollination and its mitigating effects on the genetic diversity of pollen pools accepted by Camellia japonica trees within a population at a landscape level. Heredity 124, 170–181. doi: 10.1038/s41437-019-0262-7
Nurtaza, A., Dyussembekova, D., Shevtsov, A., Islamova, S., Samatova, I., Koblanova, S., et al. (2024). Assessing genetic variability and population structure of Alnus glutinosa (black alder) in Kazakhstan using SSR markers. Plants 13, 3032. doi: 10.3390/plants13213032
Ohsawa, T., Saito, Y., Sawada, H., and Ide, Y. (2008). Impact of altitude and topography on the genetic diversity of Quercus serrata populations in the Chichibu Mountains, central Japan. Flora 203, 187–196. doi: 10.1016/j.flora.2007.02.007
Osman, M. B., Tierney, J. E., Zhu, J., Tardif, R., and Hakim, G. J. (2021). Globally resolved surface temperatures since the Last Glacial Maximum. Nature 599, 239–244. doi: 10.1038/s41586-021-03984-4
Pandey, M. and Changtragoon, S. (2012). Isolation and characterization of microsatellites in a medicinal plant, Phyllanthus emblica (Euphorbiaceae). Am. J. Bot. 99, e468–e469. doi: 10.3732/ajb.1200157
Peakall, R. and Smouse, P. E. (2006). GENALEX 6: Genetic analysis in Excel. Population genetic software for teaching and research. Mol. Ecol. Notes 6, 288–295. doi: 10.1111/j.1471-8286.2005.01155.x
Perez-Garcia, L., Pérez-Alquicira, J., Rico, Y., Vargas-Ponce, O., Montti, L., and Ruiz-Sanchez, E. (2025). Despite forest fragmentation, river connectivity maintains gene flow and diversity in Guadua trinii, a woody bamboo of the Atlantic Forest in Argentina. Hydrobiologia 852, 1637–1650. doi: 10.1007/s10750-024-05764-3
Pritchard, J. K., Stephens, M., and Donnelly, P. (2000). Inference of population structure using multilocus genotype data. Genetics 155, 945–959. doi: 10.1093/genetics/155.2.945
Rahman, M. S., Sultana, S. S., and Hassan, M. A. (2021). Variable chromosome number and ploidy level of five Phyllanthus species in Bangladesh. Cytologia 86, 143–148. doi: 10.1508/cytologia.86.143
Saini, R., Sharma, N., Oladeji, O. S., Sourirajan, A., Dev, K., Zengin, G., et al. (2022). Traditional uses, bioactive composition, pharmacology, and toxicology of Phyllanthus emblica fruits: A comprehensive review. J. Ethnopharmacol. 282, 114570. doi: 10.1016/j.jep.2021.114570
Swarup, S., Cargill, E. J., Crosby, K., Flagel, L., Kniskern, J., and Glenn, K. (2021). Genetic diversity is indispensable for plant breeding to improve crops. Crop Sci. 61, 839–852. doi: 10.1002/csc2.20377
Tang, R., Liu, E., Zhang, Y., Schinnerl, J., Sun, W., and Chen, G. (2020). Genetic diversity and population structure of Amorphophallus albus, a plant species with extremely small populations (PSESP) endemic to dry-hot valley of Jinsha River. BMC Genet. 21, 102. doi: 10.1186/s12863-020-00910-x
Thapa, R., Bayer, R. J., and Mandel, J. R. (2021). Genetic diversity, population structure, and ancestry estimation in the Antennaria rosea (Asteraceae: Gnaphalieae) polyploid agamic complex. Taxon 70, 139–152. doi: 10.1002/tax.12420
Tian, B., Zhou, Z., Du, F. K., He, C., Xin, P., and Ma, H. (2015). The Tanaka Line shaped the phylogeographic pattern of the cotton tree (Bombax ceiba) in southwest China. Biochem. Syst. Ecol. 60, 150–157. doi: 10.1016/j.bse.2015.04.014
Tierney, J. E., Zhu, J., King, J., Malevich, S. B., Hakim, G. J., and Poulsen, C. J. (2020). Glacial cooling and climate sensitivity revisited. Nature 584, 569–573. doi: 10.1038/s41586-020-2617-x
Untergasser, A., Cutcutache, I., Koressaar, T., Ye, J., Faircloth, B. C., Remm, M., et al. (2012). Primer 3–New capabilities and interfaces. Nucleic Acids Res. 40, e115. doi: 10.1093/nar/gks596
Van-Puyvelde, K., Van-Geert, A., and Triest, L. (2010). ATETRA, a new software program to analyse tetraploid microsatellite data: Comparison with TETRA and TETRASAT. Mol. Ecol. Resour. 10, 331–334. doi: 10.1111/j.1755-0998.2009.02748.x
Variya, B. C., Bakrania, A. K., and Patel, S. S. (2016). Emblica officinalis (Amla): A review for its phytochemistry, ethnomedicinal uses and medicinal potentials with respect to molecular mechanisms. Pharmacol. Res. 111, 180–200. doi: 10.1016/j.phrs.2016.06.013
Wang, R., Compton, S. G., Shi, Y. S., and Chen, X. Y. (2012). Fragmentation reduces regional-scale spatial genetic structure in a wind-pollinated tree because genetic barriers are removed. Ecol. Evol. 2, 2250–2261. doi: 10.1002/ece3.344
Wang, Y. X., Ding, K., and Zhou, R. L. (2017). Spatial estimation of the terrestrial biodiversity enrichment based on topographical and water–energy indexes: As Yunnan for example. J. Yunnan Uni. 39, 481–493. doi: 10.1016/j.phrs.2016.06.013
Wu, M., Cheng, Y., Jiang, C. X., Zhang, M. S., Shi, T., and Zhao, C. (2024). Phylogeography of Morella nana: The Wumeng Mountains as a natural geographical isolation boundary on the Yunnan-Guizhou Plateau. Ecol. Evol. 14, e11566. doi: 10.1002/ece3.11566
Xing, Y. and Ree, R. H. (2017). Uplift-driven diversification in the Hengduan Mountains, a temperate biodiversity hotspot. Proc. Natl. Acad. Sci U.S.A. 114, 3444–3451. doi: 10.1073/pnas.1616063114
Yang, J., Vázquez, L., Feng, L., Liu, Z., and Zhao, G. (2018). Climatic and soil factors shape the demographical history and genetic diversity of a deciduous oak (Quercus liaotungensis) in Northern China. Front. Plant Sci. 9. doi: 10.3389/fpls.2018.01534
Yin, R. P., Huang, J. C., Yin, G. S., and Wu, J. H. (2018). Phenotypic diversity of fruits, seeds and offspring seedlings in natural populations of Phyllanthus emblica from Western Yunnan. J. Yunnan Uni. 40, 174–182. doi: 10.7540/j.ynu.20170255
Yue, L. L., Chen, G., Sun, W. B., and Sun, H. (2012). Phylogeography of Buddleja crispa (Buddlejaceae) and its correlation with drainage system evolution in southwestern China. Am. J. Bot. 99, 1726–1735. doi: 10.3732/ajb.1100506
Zeng, J., Zou, Y. P., Bai, J. Y., and Zheng, H. S. (2002). Preparation of total DNA from ‘recalcitrant plant taxa’. Acta Bot. Sin. 44, 694–697.
Zhang, L., Li, Q. J., Li, H. T., Chen, J., and Li, D. Z. (2006). Genetic diversity and geographic differentiation in Tacca chantrieri (Taccaceae): an autonomous selfing plant with showy floral display. Ann. Bot. 98, 449–457. doi: 10.1093/aob/mcl123
Zhao, Y. J. and Gong, X. (2015). Genetic divergence and phylogeographic history of two closely related species (Leucomeris decora and Nouelia insignis) across the ‘Tanaka Line’ in Southwest China. BMC Evol. Biol. 15, 134. doi: 10.1186/s12862-015-0374-5
Zhao, W., Wang, X., Li, L., Li, J., Yin, H., Zhao, Y., et al. (2021). Evaluation of environmental factors affecting the genetic diversity, genetic structure, and the potential distribution of Rhododendron aureum Georgi under changing climate. Ecol. Evol. 11, 12294–12306. doi: 10.1002/ece3.7803
Keywords: Phyllanthus emblica, SSR, genetic diversity, environmental factors, geographic isolation
Citation: Wang C-y, Huang J-c, Yin M-y, Hu H-j, Yang Y-p, Guo J-j and Zeng J (2025) Geographic isolation and environmental heterogeneity shape population genetic differentiation of a medicinal plant, amla (Phyllanthus emblica L.) in river valleys of Yunnan, China. Front. Plant Sci. 16:1648822. doi: 10.3389/fpls.2025.1648822
Received: 17 June 2025; Accepted: 22 August 2025;
Published: 10 September 2025.
Edited by:
Yin-Zheng Wang, Chinese Academy of Sciences (CAS), Beijing, ChinaReviewed by:
Jiban Shrestha, Nepal Agricultural Research Council, NepalHafiz Muhammad Wariss, University of Sargodha, Pakistan
Copyright © 2025 Wang, Huang, Yin, Hu, Yang, Guo and Zeng. This is an open-access article distributed under the terms of the Creative Commons Attribution License (CC BY). The use, distribution or reproduction in other forums is permitted, provided the original author(s) and the copyright owner(s) are credited and that the original publication in this journal is cited, in accordance with accepted academic practice. No use, distribution or reproduction is permitted which does not comply with these terms.
*Correspondence: Jun-jie Guo, Z3VvanVuamllQGNhZi5hYy5jbg==
†These authors have contributed equally to this work