 Qinchao Fu1
 Peijian Shi
 Johan Gielis
 Karl J. Niklas
- 1School of Life Science, Leshan Normal University, Leshan, China
- 2Bamboo Research Institute, Nanjing Forestry University, Nanjing, China
- 3Department of Biosciences Engineering, University of Antwerp, Antwerp, Belgium
- 4School of Integrative Plant Science, Cornell University, Ithaca, NY, United States
This study addresses the critical need for efficient phenotyping methods in plant ecology by exploring predictive models for total leaf area per shoot (AT) and total leaf dry mass per shoot (MT), which are both key determinants of photosynthetic capacity and carbon allocation, using two fast-growing bamboo species (Indocalamus decorus and I. longiauritus) as proof of concept. Traditional approaches to measuring these traits are destructive and labor-intensive, motivating our exploration of non-destructive proxies based on one-dimensional leaf metrics. We validated the Montgomery equation for individual leaves, confirming a robust proportional relationship between leaf area (A) and the product of length and width (LW) in both Indocalamus species (k ≈ 0.72). Extending this to the shoot level, the Montgomery-Koyama-Smith equation (MKSE) revealed significant proportionality between total leaf area (AT) and the composite metric LKSWKS (where LKS denotes the sum of leaf widths and WKS denotes maximum leaf length, and the subscript “KS” stands for Koyama-Smith). However, power-law scaling analysis demonstrated allometric, non-isometric relationships for AT vs. LKSWKS (with a scaling exponent α < 1), indicating diminishing leaf area expansion per unit dimensional increase, and AT vs. total leaf dry mass (MT) (α < 1), indicating an increased biomass investment per unit area (i.e., increasing leaf mass per unit area) in larger shoots. These findings validate using simplified one-dimensional metrics that enable accurate, non-destructive predictions of shoot-level functional traits, advancing phenotyping in bamboo ecology, which may hold true more generally for other types of plant species.
1 Introduction
Leaves are the primary organ for photosynthetic carbon assimilation in vascular land plants, thereby fundamentally driving ecosystem productivity (Lambers and Poorter, 1992; Wright et al., 2004). Their size, arrangement, and biomass investment are governed by two critical trade-offs. First, a fundamental scaling relationship exists between individual leaf dry mass (M) and area (A), where larger leaves require disproportionately more structural and hydraulic investments, increasing biomass per unit area (i.e., larger leaf mass per unity area, LMA) and reducing carbon-use efficiency (Shipley, 1995; Milla and Reich, 2007; Niklas et al., 2007; Sack et al., 2012). This reflects a universal trade-off: maximizing photosynthetic area necessitates greater carbon investment per unit area, with LMA serving as a core component of the global leaf economics spectrum (Wright et al., 2004; Poorter et al., 2009). Second, canopy architecture mediates a trade-off between total leaf area per shoot (AT) and its deployment, as dense foliage packing increases self-shading, significantly reducing photosynthetic efficiency in lower canopy layers (Niklas, 1988; Smith et al., 2017; Wang et al., 2024). Architectural adaptations, such as variations in leaf size, total number (NT), and phyllotaxy, optimize light capture under this constraint. This optimization is evident in the divergent numerical values for the scaling exponents (α) governing the AT vs. NT scaling relationship between species with high versus low self-shading canopies (Smith et al., 2017; Koyama and Smith, 2022; Wang et al., 2024).
For example, Smith et al. (2017) report a conserved intraspecific scaling exponent of approximately 0.6 between mean leaf area () and total leaf area per twig (Atwig), reflecting an economic optimization where partitioning larger Atwig into fewer, larger leaves maximizes carbon gain relative to construction costs under varying self-shading regimes. Similarly, Wang et al. (2024) examined two dwarf bamboo species exhibiting contrasting leaf distributions: Shibataea chinensis (with leaves evenly dispersed, and high self-shading) and Sasaella kongosanensis ‘Aureostriatus’ (with leaves clustered apically, and low self-shading), and confirmed a power-law scaling relationship between AT and NT but with divergent scaling exponents: for S. chinensis versus for S. kongosanensis ‘Aureostriatus’. This numerical difference in α–values was interpreted to reflect adaptive responses to self-shading, i.e., with pronounced shading in S. chinensis driving a disproportionate increase in AT with increasing NT to compensate for pronounced self-shading, in contrast to minimal shading in S. kongosanensis ‘Aureostriatus’ with smaller incremental increases in AT. In addition, the coefficient of variation in individual leaf area increased with NT in both species, highlighting developmental plasticity in leaf size allocation. Collectively, these studies indicate that plant architecture, particularly the integration of branching patterns, phyllotaxy, and leaf trait scaling, mediates a critical trade-off between maximizing photosynthetic area and minimizing the costs imposed by self-shading. The convergence of empirical patterns, such as the conserved vs. Atwig scaling relationship (Smith et al., 2017), with theoretical optimization models demonstrates that architectural evolution is fundamentally constrained by biophysical economics and hydraulic efficiency (Givnish, 1984; Niklas, 1988; Westoby et al., 2002).
Quantifying the trade-offs between AT (which affects light interception) and total leaf dry mass per shoot (MT, which measures carbon investment) is therefore essential for understanding plant ecological strategies, carbon allocation, and stand-level productivity (Westoby et al., 2002; Poorter et al., 2009). The scaling relationship between MT and AT also integrates whole-plant economics, dictating photosynthetic efficiency and environmental adaptation (Westoby, 1998; Westoby et al., 2002). Importantly, leaf mass per unit area (LMA) stands as a pivotal metric representing biomass investment per unit light-capturing surface area (Wright et al., 2004). It integrates structural and physiological trade-offs, directly influencing photosynthetic capacity, leaf longevity, and resource use efficiency (Reich et al., 2003; Wright et al., 2004). Leaves characterized by low LMA typically exhibit faster mass-based photosynthetic rates and shorter lifespans, traits associated with resource-rich environments or fast-growing species (Wright et al., 2004; Poorter et al., 2009). Conversely, high LMA indicates a greater investment in structural durability, defense compounds, and longer leaf lifespans, often linked to resource conservation strategies in stressful habitats (Wright et al., 2004; Sterck et al., 2006; Poorter et al., 2009). Consequently, LMA serves as a core component of the global leaf economics spectrum (Wright et al., 2004).
However, although prior work has emphasized the importance of “whole-plant” traits (Westoby et al., 2002), the empirical quantification of the AT vs. MT scaling relationship across diverse species and environments remains limited. Most studies have focused on interspecific comparisons, which may mask crucial intraspecific variation and plasticity (Poorter et al., 2009) and can be confounded by phylogenetic constraints and differences in plant size or architecture (Westoby, 1998). A significant barrier to addressing these concerns is the destructive and labor-intensive nature of traditional methods for measuring AT and MT, hindering broad studies and large-scale phenotyping (Koyama and Smith, 2022; Wang et al., 2024). Non-destructive proxies offer a solution. For example, building on the Montgomery equation, which assumes that individual leaf area (A) is proportional to the product of leaf length (L) and width (W) (A ∝ LW) (Montgomery, 1911; Shi et al., 2021), Koyama and Smith (2022) extrapolated this relationship to shoots via the Montgomery-Koyama-Smith equation (MKSE), i.e., , where kKS is a normalization constant, WKS is the maximum leaf length per shoot, LKS is the sum of leaf widths, which is usually greater than WKS for most shoots that have many leaves, and the subscript KS is the acronym for Koyama and Smith (Meng et al., 2025). However, the MKSE assumes that kKS is numerically a constant across leaves within any given shoot, an assumption potentially sensitive to architectural heterogeneity, leaf number, and ontogenetic changes during leaf or stem growth, which may limit the accuracy of the MKSE (Meng et al., 2025).
To explore the utility of the MKSE and the power-law equation (PLE), we examined two species within Indocalamus, a genus in the Bambusoideae subfamily (Poaceae), a phylogenetically and ecologically pivotal lineage driving significant carbon sequestration (Vorontsova et al., 2016). The genus Indocalamus was selected because it presents an architecturally tractable model due to its large leaves, monopodial rhizomes generating culms bearing a limited number of leaves with pronounced leaf size variation. These features combined with a relatively open canopy architecture enable non-destructive measurements of leaf width, length, and number. We focus on two bamboo species (I. decorus and I. longiauritus) because of their contrasting leaf-arrangements and internodal lengths (Figure 1).
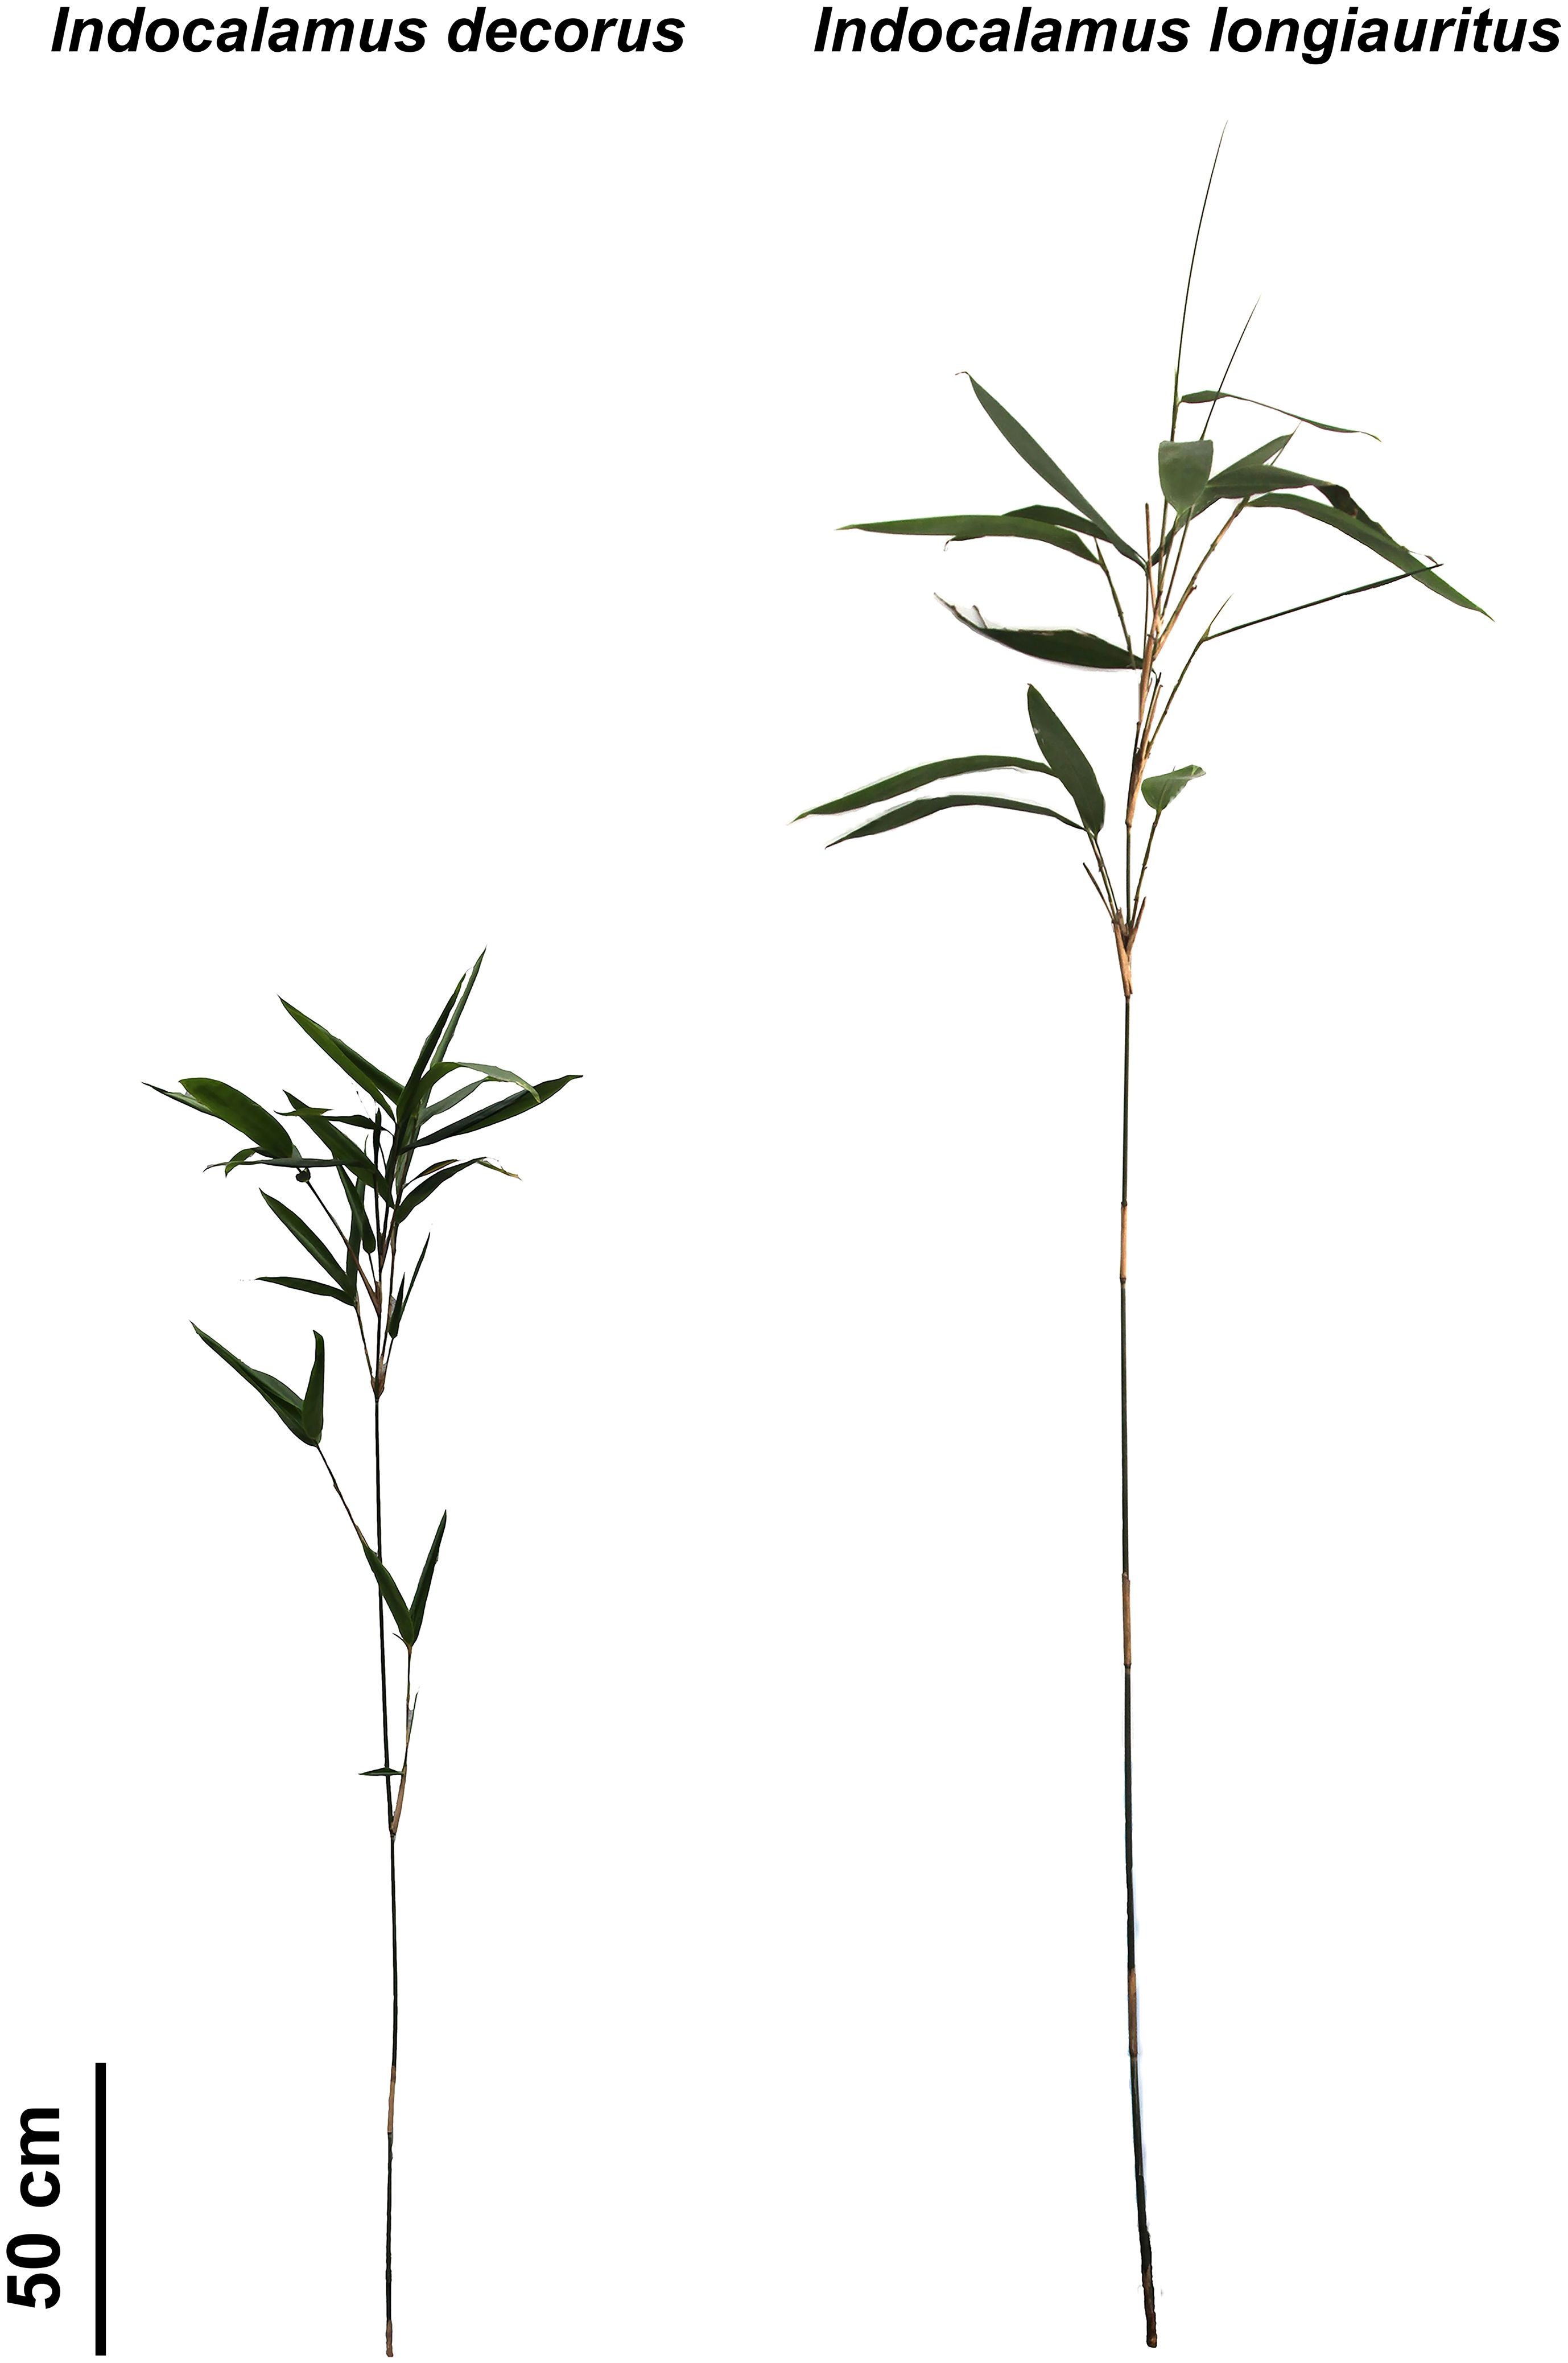
Figure 1. Representative examples of the culms of I. decorus (left) and I. longiauritus (right).
2 Materials and methods
2.1 Plant material and measurements
A total of 122 I. decorus culms were sampled in Hongya County, Meishan, Sichuan Province, China (103°27’53’’ E, 29°55’33’’ N, 504.5 m a.s.l.), and a total of 120 I. longiauritus culms were sampled on the Leshan Normal University Campus, Leshan, Sichuan Province, China (103°44’57’’ E, 29°33’54’’ N, 419.6 m a.s.l.) in November 2024. Indocalamus decorus is native to Meishan, whereas I. longiauritus was introduced from the White Horse Experimental Station of Nanjing Forestry University, Jiangsu Province, China to the current sampling site in 2018, where it has naturalized on the campus. All sampled shoots originated from sprouts appearing in spring 2023. Sampling occurred near the end of their second growth season, ensuring that shoots were mature and leaves had fully matured. Sampling sites for I. decorus and I. longiauritus were selected to ensure minimal anthropogenic disturbance and climatic consistency and similarity. Both locations represent naturalized growth: I. decorus in its native habitat and I. longiauritus naturalized since 2018 without subsequent management. The close distance of 48.6 km between sites minimizes climatic differences, while architectural simplicity (low leaf counts and open canopies) facilitated accurate non-destructive trait measurements. Sampling at this time of year ensured full leaf maturation and dry mass stabilization (i.e., completion of leaf expansion (lamina size stabilized) and sclerification, eliminating ontogenetic biases in area/mass relationships). This rendered oven-drying protocols following standardized methods sufficient to achieve constant dry weight, ensuring stable biomass measurements.
The lamina length (L) and width (W) of each leaf of the 242 shoots were measured. According to prior studies (Shi et al., 2021), individual leaf lamina area (A) can be estimated as the product of L and W multiplied by a proportionality coefficient (k, called the Montgomery parameter) called the Montgomery equation, i.e., A = kLW) as proposed by Montgomery (1911). To determine the numerical value of k, 254 I. decorus leaves and 251 I. longiauritus leaves were scanned using a photo scanner (M208, BenQ Corporation, Shanghai, China). The leaf images were transferred to black-and-white images in bitmap (bmp) format, and the Matlab procedure proposed by Su et al. (2019) was used to extract the planar coordinates for each lamina. The “bilat’ function in the R packaged “biogeom” (v.1.4.3) based on R (v4.3.1; R Core Team, 2023) was used to determine A, L, and W for each leaf. For each shoot, all the leaves were subsequently dried in an oven (DHG-9240A, Shanghai Yiheng Scientific Instruments Co., Ltd., Shanghai, China) at 105°C for 30 min and then continuously at 75°C until achieving a constant dry weight. The dried leaves for each shoot were measured to determine dry mass using an electronic balance (ML203; Mettler Toledo Company, Greifensee, Switzerland; measurement accuracy 0.001 g).
Total leaf area per shoot (AT) was obtained by summing the individual leaf areas per shoot; the sum of individual leaf widths on a shoot is referred to as WKS; and the maximum individual leaf length on a shoot is referred to as LKS. The subscript KS is used in honor of Koyama and Smith.
The raw data of the length and width for all leaves on the 242 shoots, those of the length, width and area for the 505 randomly sampled leaves (used to estimate the Montgomery parameter), and those of the total leaf dry mass for each of the 242 shoots of the two bamboo species are assessable from Supplementary Tables S1−S3, respectively.
2.2 Statistical analysis
The frequency distributions of the number of leaves, total leaf mass, and total leaf area per shoot of the two bamboo species were modeled using the normal, log-normal, and two-parameter Weibull probability density functions. The Weibull probability density function takes the form (Weibull, 1951):
where δ is the shape parameter, and λ is the scale parameter. The two parameters in Equation 1 were estimated using maximum likelihood estimation (MLE) which was carried out by the “mle2” function in the R package bbmle (v1.0.25.1). The numerical value of the parameter δ can be used to determine whether the distribution is left-skewed, right-skewed or symmetrical, i.e., δ < 3.6 indicates a right-skewed distribution; δ > 3.6 indicates a left-skewed distribution is indicated; and δ = 3.6 indicates a symmetrical distribution (Murthy et al., 2004).
The log-transformed version of the Montgomery equation (Montgomery, 1911; Shi et al., 2021) was fitted to determine the Montgomery parameter:
We tested the validity of the Koyama and Smith (2022) model, which assumes a one-to-one proportional relationship between AT and LKSWKS (which is referred to as the Montgomery-Koyama-Smith equation, denoted as MKSE), i.e.,
where kKS is the proportionality coefficient of the MKSE. To stabilize the variances of AT and LKSWKS, we also used the log-transform of Equation 3 for carrying out a linear fitting:
Across diverse plant species, two interdependent variables of Y1 and Y2, such as leaf area and mass, are frequently found to follow a power-law equation (denoted as PLE) (Niklas, 1994):
where β is the normalization constant and α is the scaling exponent (i.e., the rate of change in Y2 with respect to Y1; Niklas, 1994) Because , it follows that (i) α > 1 indicates that increases in Y1 do not keep pace with the increases in Y2; (ii) α < 1 indicates that increases in Y2 do not keep pace with the increases in Y1; and (iii) α = 1 indicates an isometric relationship between Y1 and Y2. Cases (i) and (ii) are referred to as allometric scaling relationships, whereas case (iii) is referred to as an isometric scaling relationship. We examined whether the AT vs. LKSWKS relationship tends to be allometric or isometric. Log-transformation of Equation 5 takes the form:
where y = log(Y2), x = log(Y1), and γ = log(β) is the log-log y-intercept. Equation (5) was used to describe the probable scaling relationship between AT and LKSWKS. In addition, it was also used to describe the scaling relationships between AT and the total number of leaves per shoot (NT), and between AT and MT, where MT represents total leaf dry mass per shoot.
Given that LW has the same physical dimensions as A, and LKSWKS has the same dimensions as AT, common least-squares regression was used to fit Equations 2, 4 and 6. However, both AT and NT, and AT and MT have different physical dimensions. Thus, reduced major axis protocols (Niklas, 1994; Quinn and Keough, 2002) were used to estimate the slope and y-intercept of the AT vs. NT and the AT vs. MT scaling relationships. The root-mean-square error (RMSE) and coefficient of determination (r2) were used to assess the goodness of fit of the linear fitting.
The bootstrap percentile method (Efron and Tibshirani, 1993) was used to calculate the 95% confidence intervals (CIs) of α and β. The bootstrap percentile method based on 3000 bootstrap replicates was used to test the significance of the difference between any two scaling exponents and any two normalization constants between the two bamboo species. If the 95% CI of the differences between the bootstrap replicates of one scaling exponent (or one normalization constant) and those of another scaling exponent (or another normalization constant) included zero, the difference between the two statistical parameters was judged not to be significant; if the 95% CI did not include zero, the difference was judged to be statistically significant.
All analyses were conducted in R (v4.3.1; R Core Team, 2023).
3 Results
The distributions of the number of leaves, total leaf mass, and total leaf area per shoot in both bamboo species were assessed using normal, log-normal, and two-parameter Weibull probability density functions (Section 2.2). Kolmogorov-Smirnov goodness-of-fit tests revealed that the data for all three traits in both species were best described by right-skewed Weibull distributions (all PWeibull > 0.05, δ < 3.6; Figure 2). In contrast, the normal and log-normal distributions provided significantly poorer fits (all Pnorm< 0.05 and Plognorm< 0.05, respectively; Figure 2), justifying the selection of the Weibull model. Despite taxonomic congruence at the genus level, I. decorus exhibited a significantly higher mean leaf count per shoot (26.34 ± 13.14, mean ± SD) compared to I. longiauritus (12.51 ± 6.52). The twofold difference between the two species was interpreted to reflect interspecies variation in foliar architecture. However, there was a negligible difference in total leaf area between the two species (Figures 2E, F).
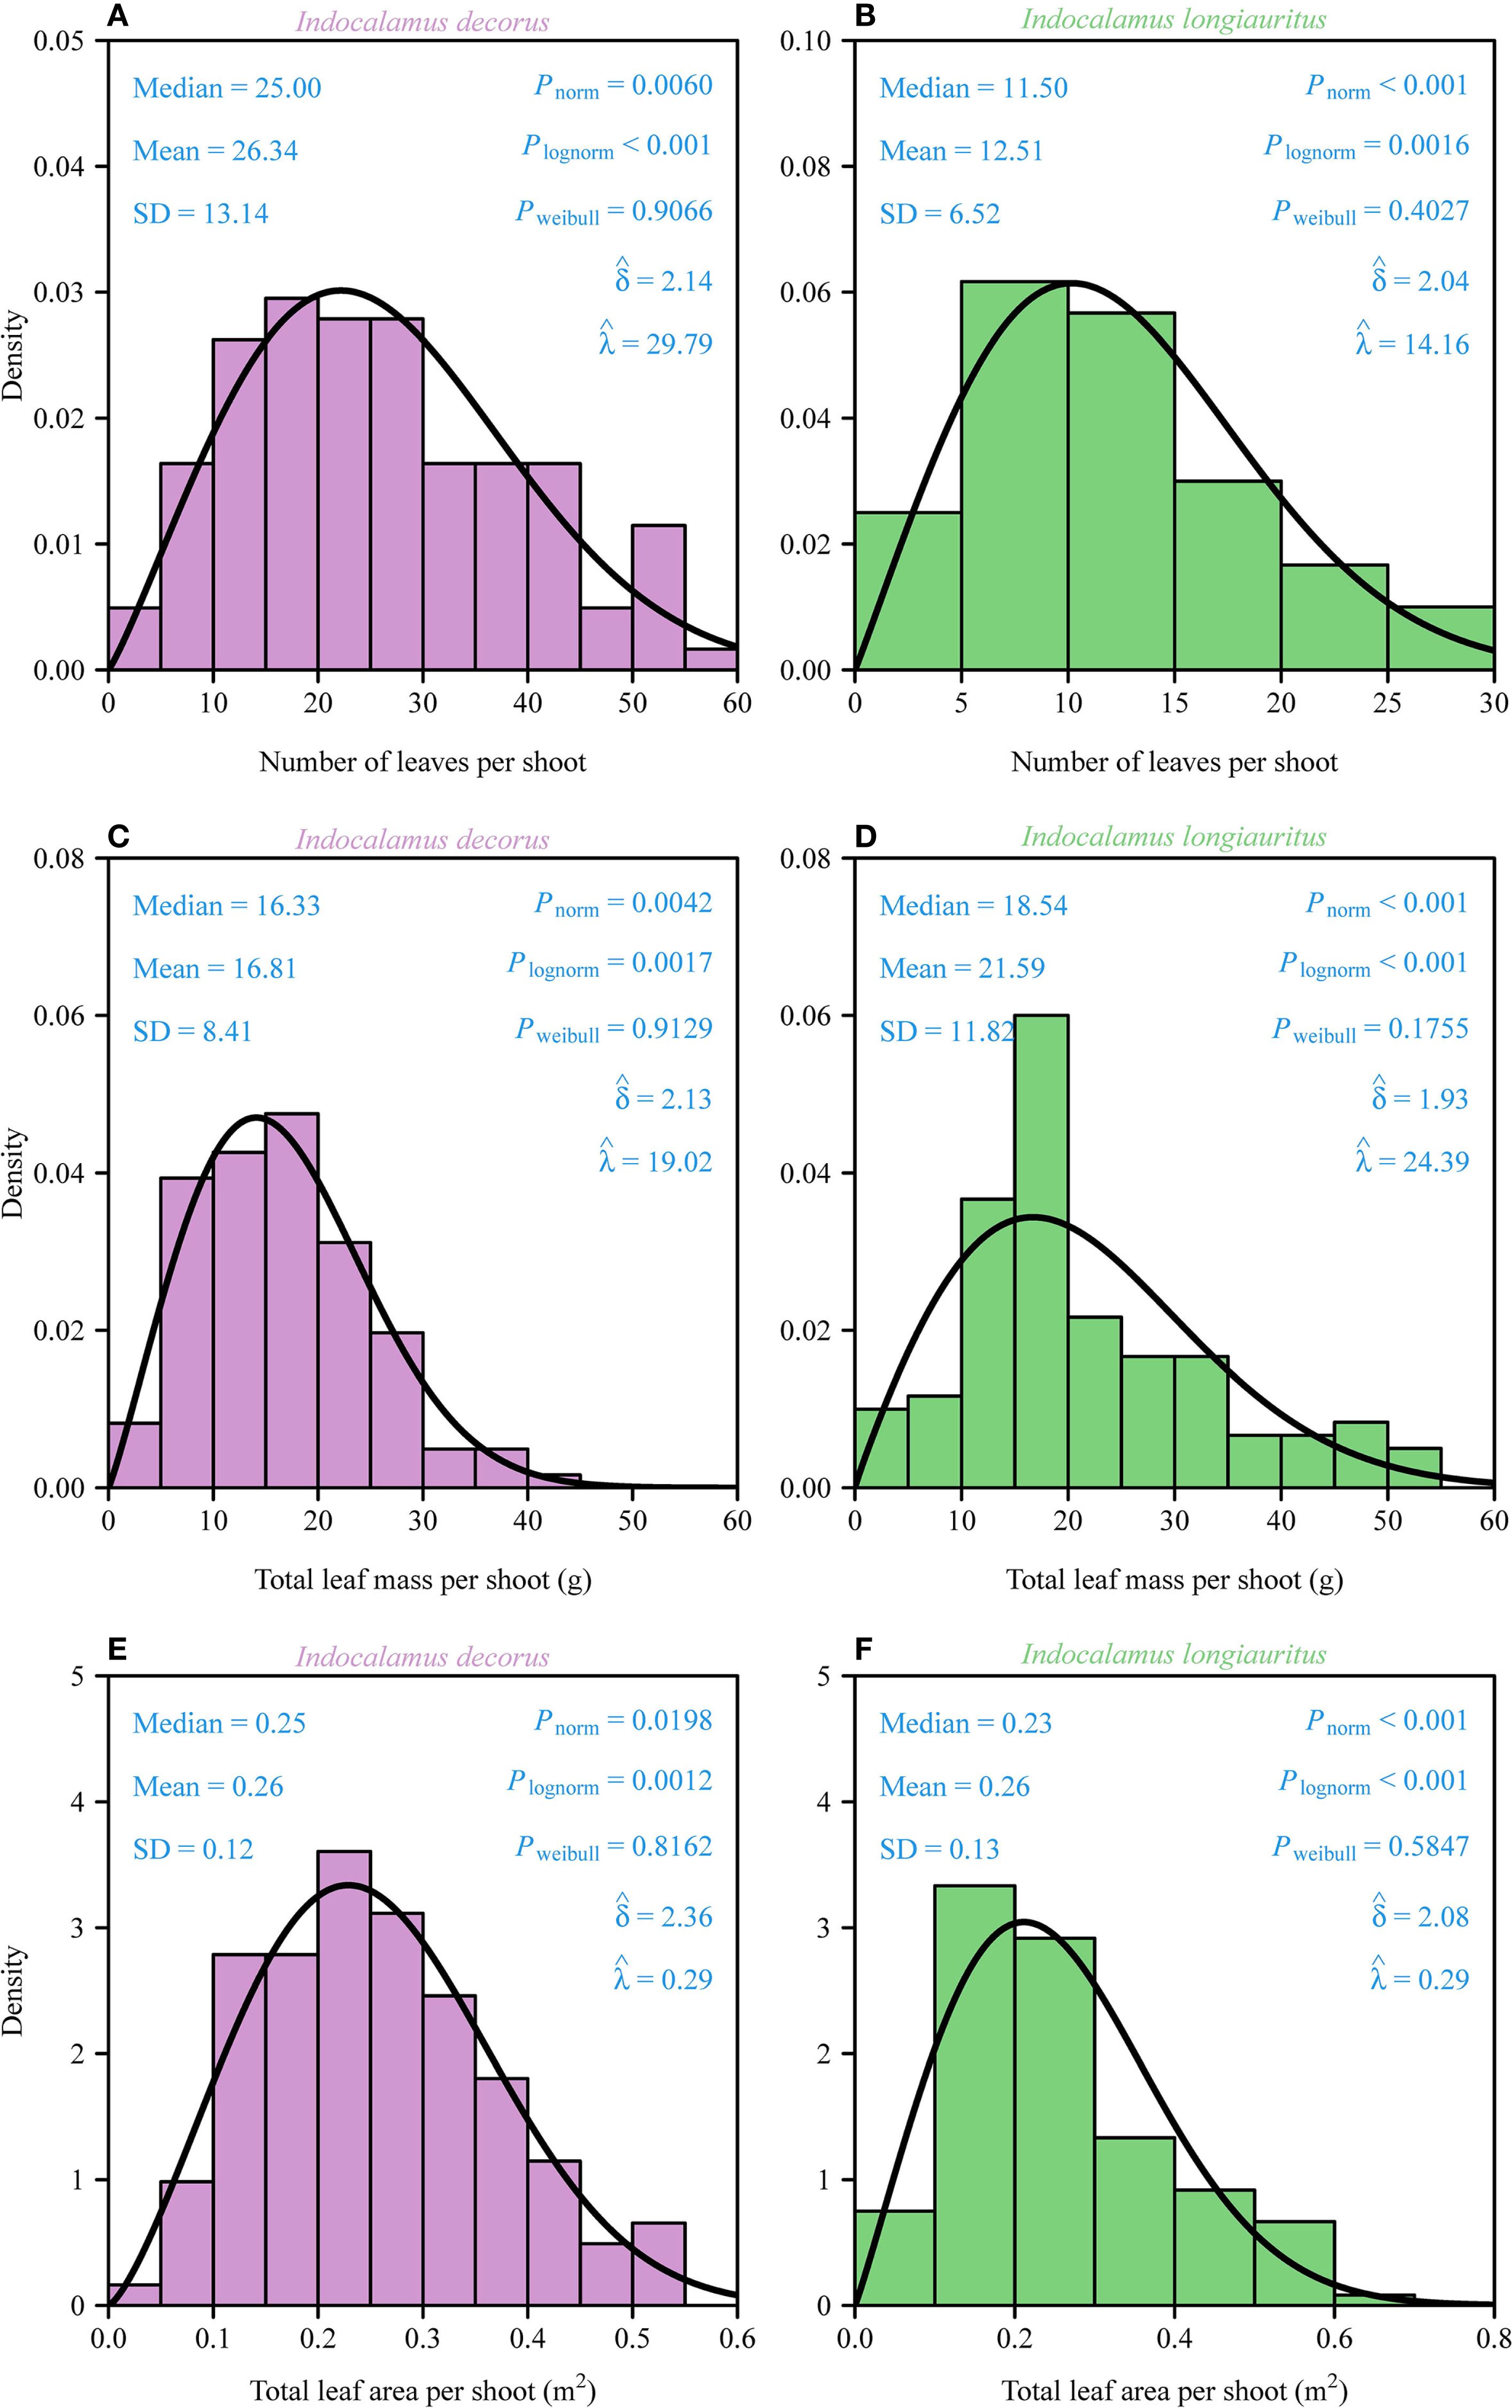
Figure 2. Density distributions of the total number of leaves, total leaf dry mass, and total leaf area per shoot for I. decorus (A, C, E) and I. longiauritus (B, D, F). SD is the standard error; Pnorm is the probability that the data are consistent with the null hypothesis of a normal distribution; Plognorm is the probability that the data are consistent with the null hypothesis of a log-normal distribution; Pweibull is the probability that the data are consistent with the null hypothesis of a Weibull distribution. and are the estimates of the shape and scale parameters in the Weibull probability density function. The solid curves represent the predicted Weibull probability densities.
Individual leaf area (A) exhibited a strong proportional relationship with the product of leaf length and width (LW) in both species as predicted by the Montgomery equation (Figure 3). The estimated Montgomery parameter (k) was the same between the two species (0.72), with high coefficients of determination (> 0.98) and low prediction errors (RMSE < 0.05). At the shoot level, a significant proportionality was observed between total leaf area (AT) and the product of the sum of leaf widths (LKS) and maximum leaf length (WKS), as described by the MKSE (Figures 4A, C). The proportionality coefficients (kKS) of the two species were not statistically significantly different. Regression analyses confirmed allometric rather than isometric scaling relationships for AT vs. LKSWKS (α < 1; Figures 4B, D), indicating diminishing area gains per unit increase in the dimensional composite, and for AT and MT (α < 1; Figure 5), revealing increasing biomass investment per unit leaf area in larger shoots. Bootstrap analyses confirmed that the scaling exponents differed significantly from isometry (95% CIs excluded unity) for both relationships. There was a significant difference in the estimated scaling exponents of AT vs. NT between the two species, i.e., the upper bound of the 95% CI was smaller than unity for I. decorus, whereas the 95% CI of AT vs. NT included unity for I. longiauritus.
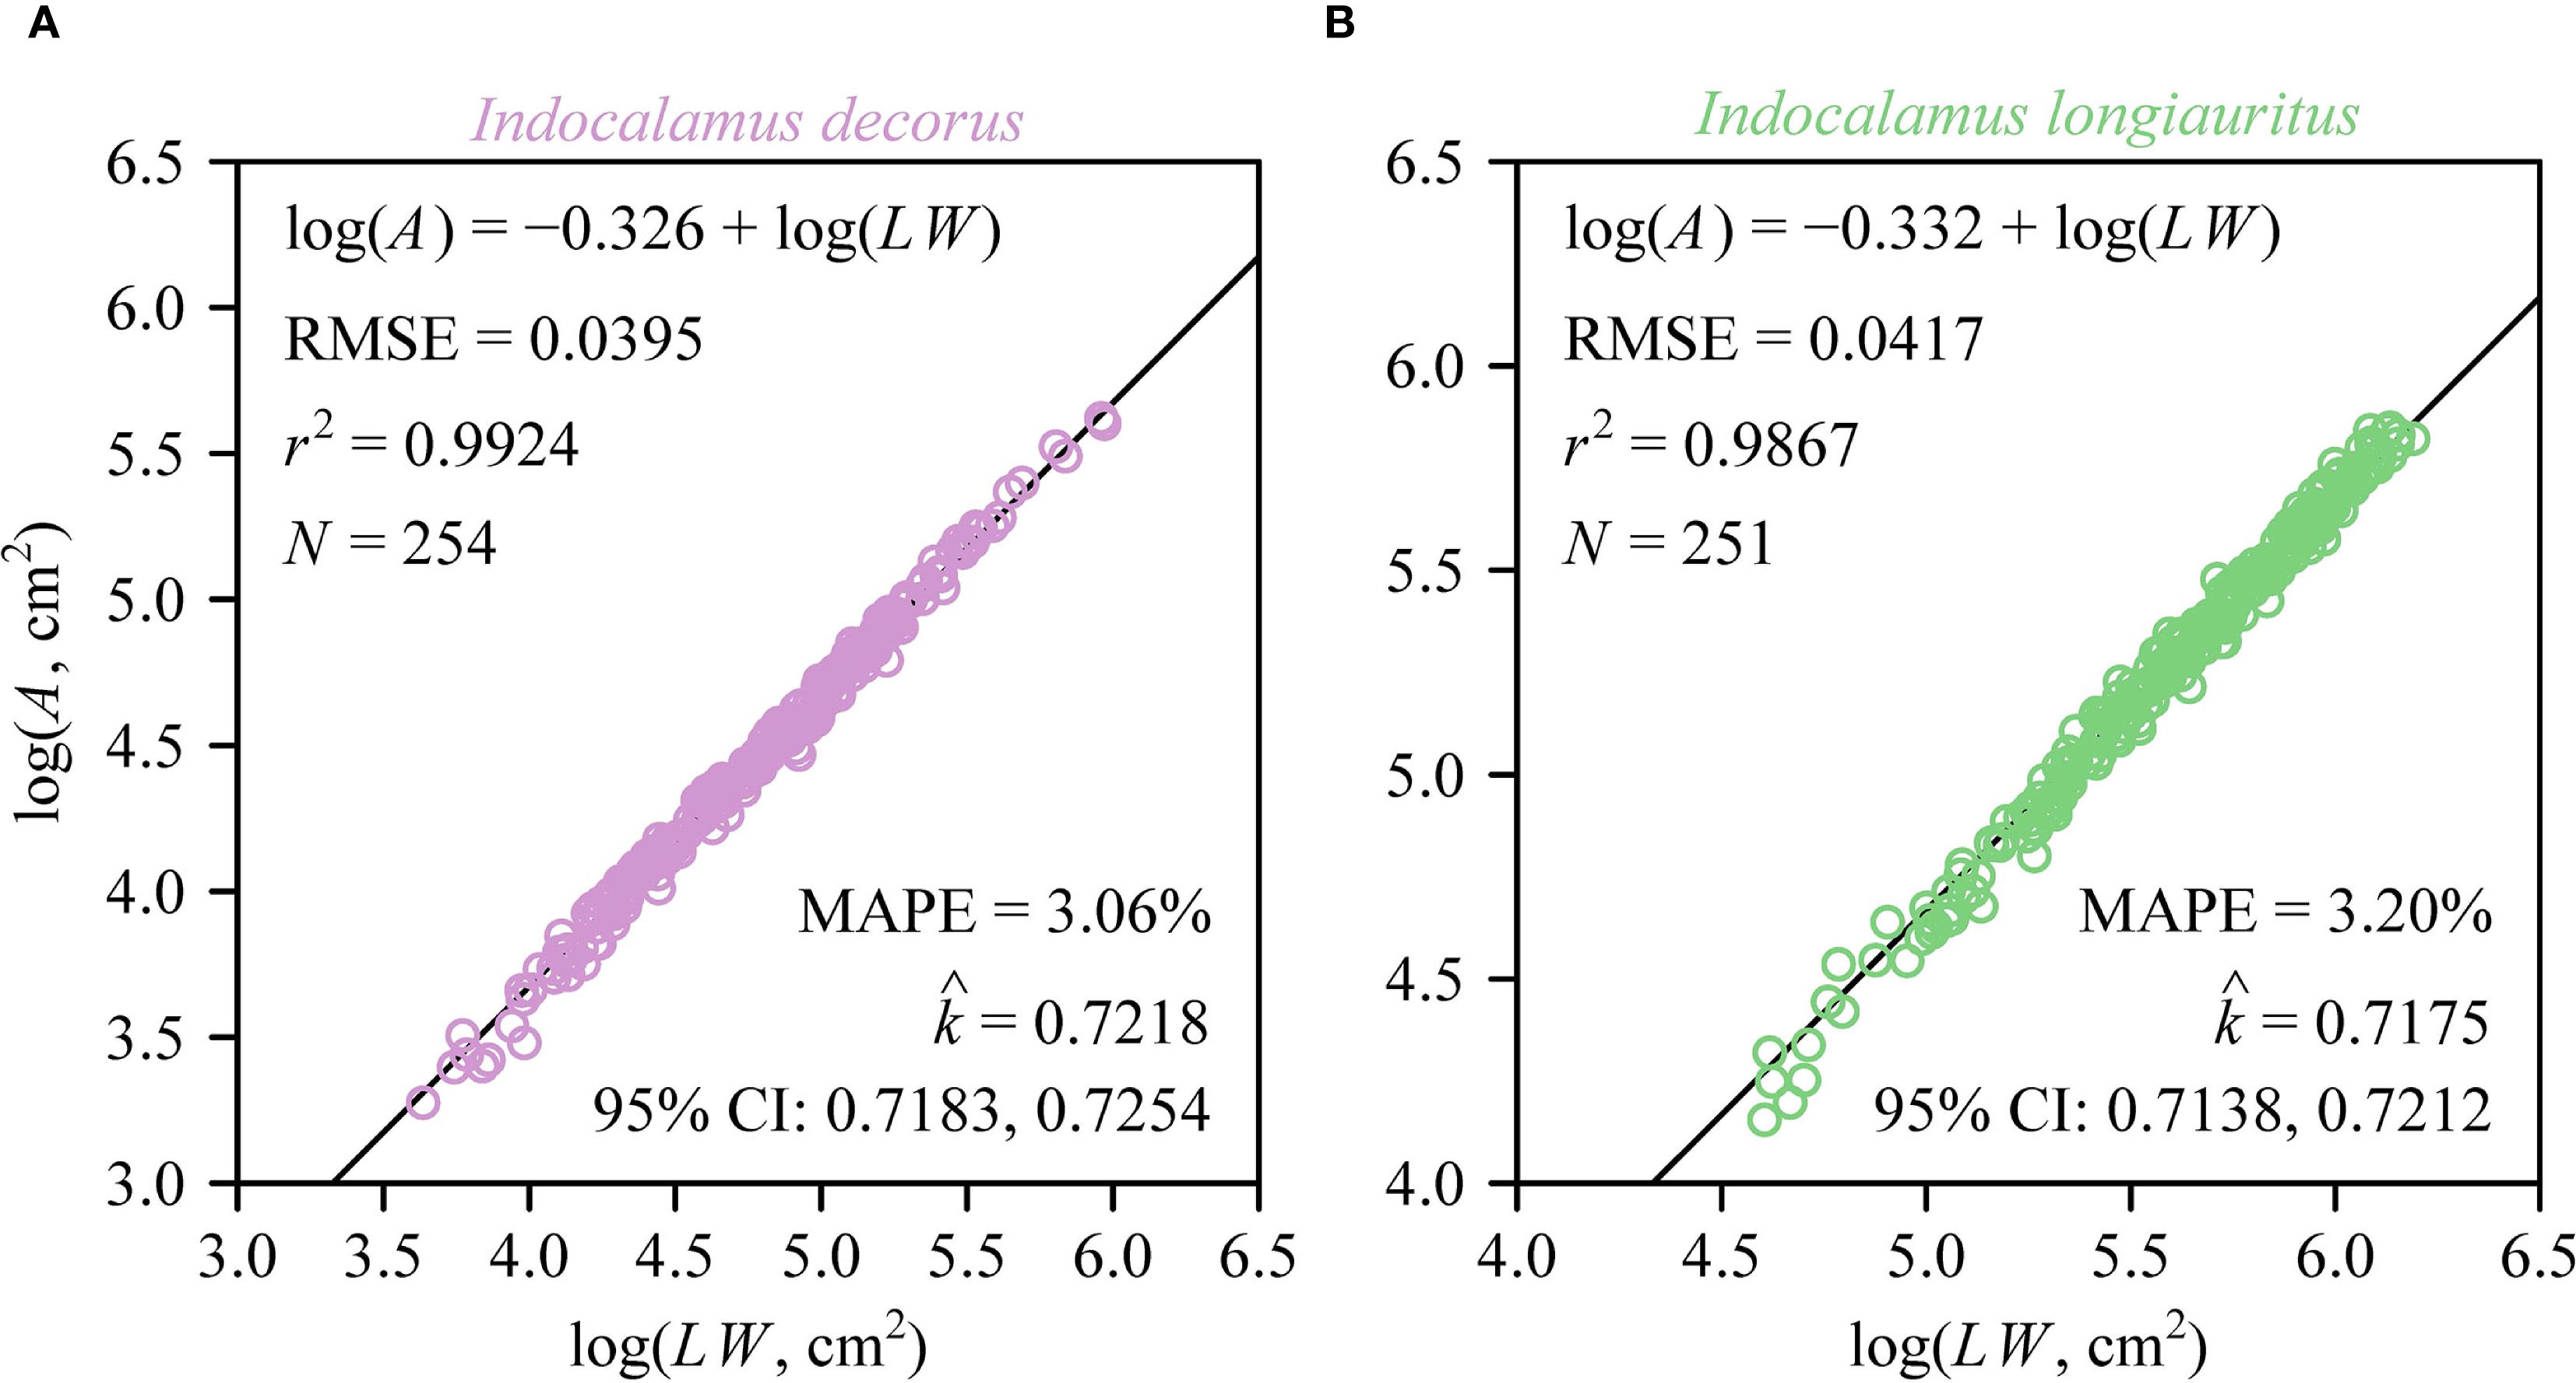
Figure 3. Fitted log-log bivariate plots of the relationships between leaf area (A) and the product of leaf length and leaf width (LW) for I. decorus (A) and I. longiauritus (B). RMSE is the root-mean-square error of the linear fit; r2 is the coefficient of determination; N is the sample size; MAPE is the mean absolute percent error between the observed and predicted leaf areas; is the estimated Montgomery parameter, i.e., the estimated proportionality coefficient between A and LW; 95% CI represents the 95% confidence interval of the estimated Montgomery parameter.
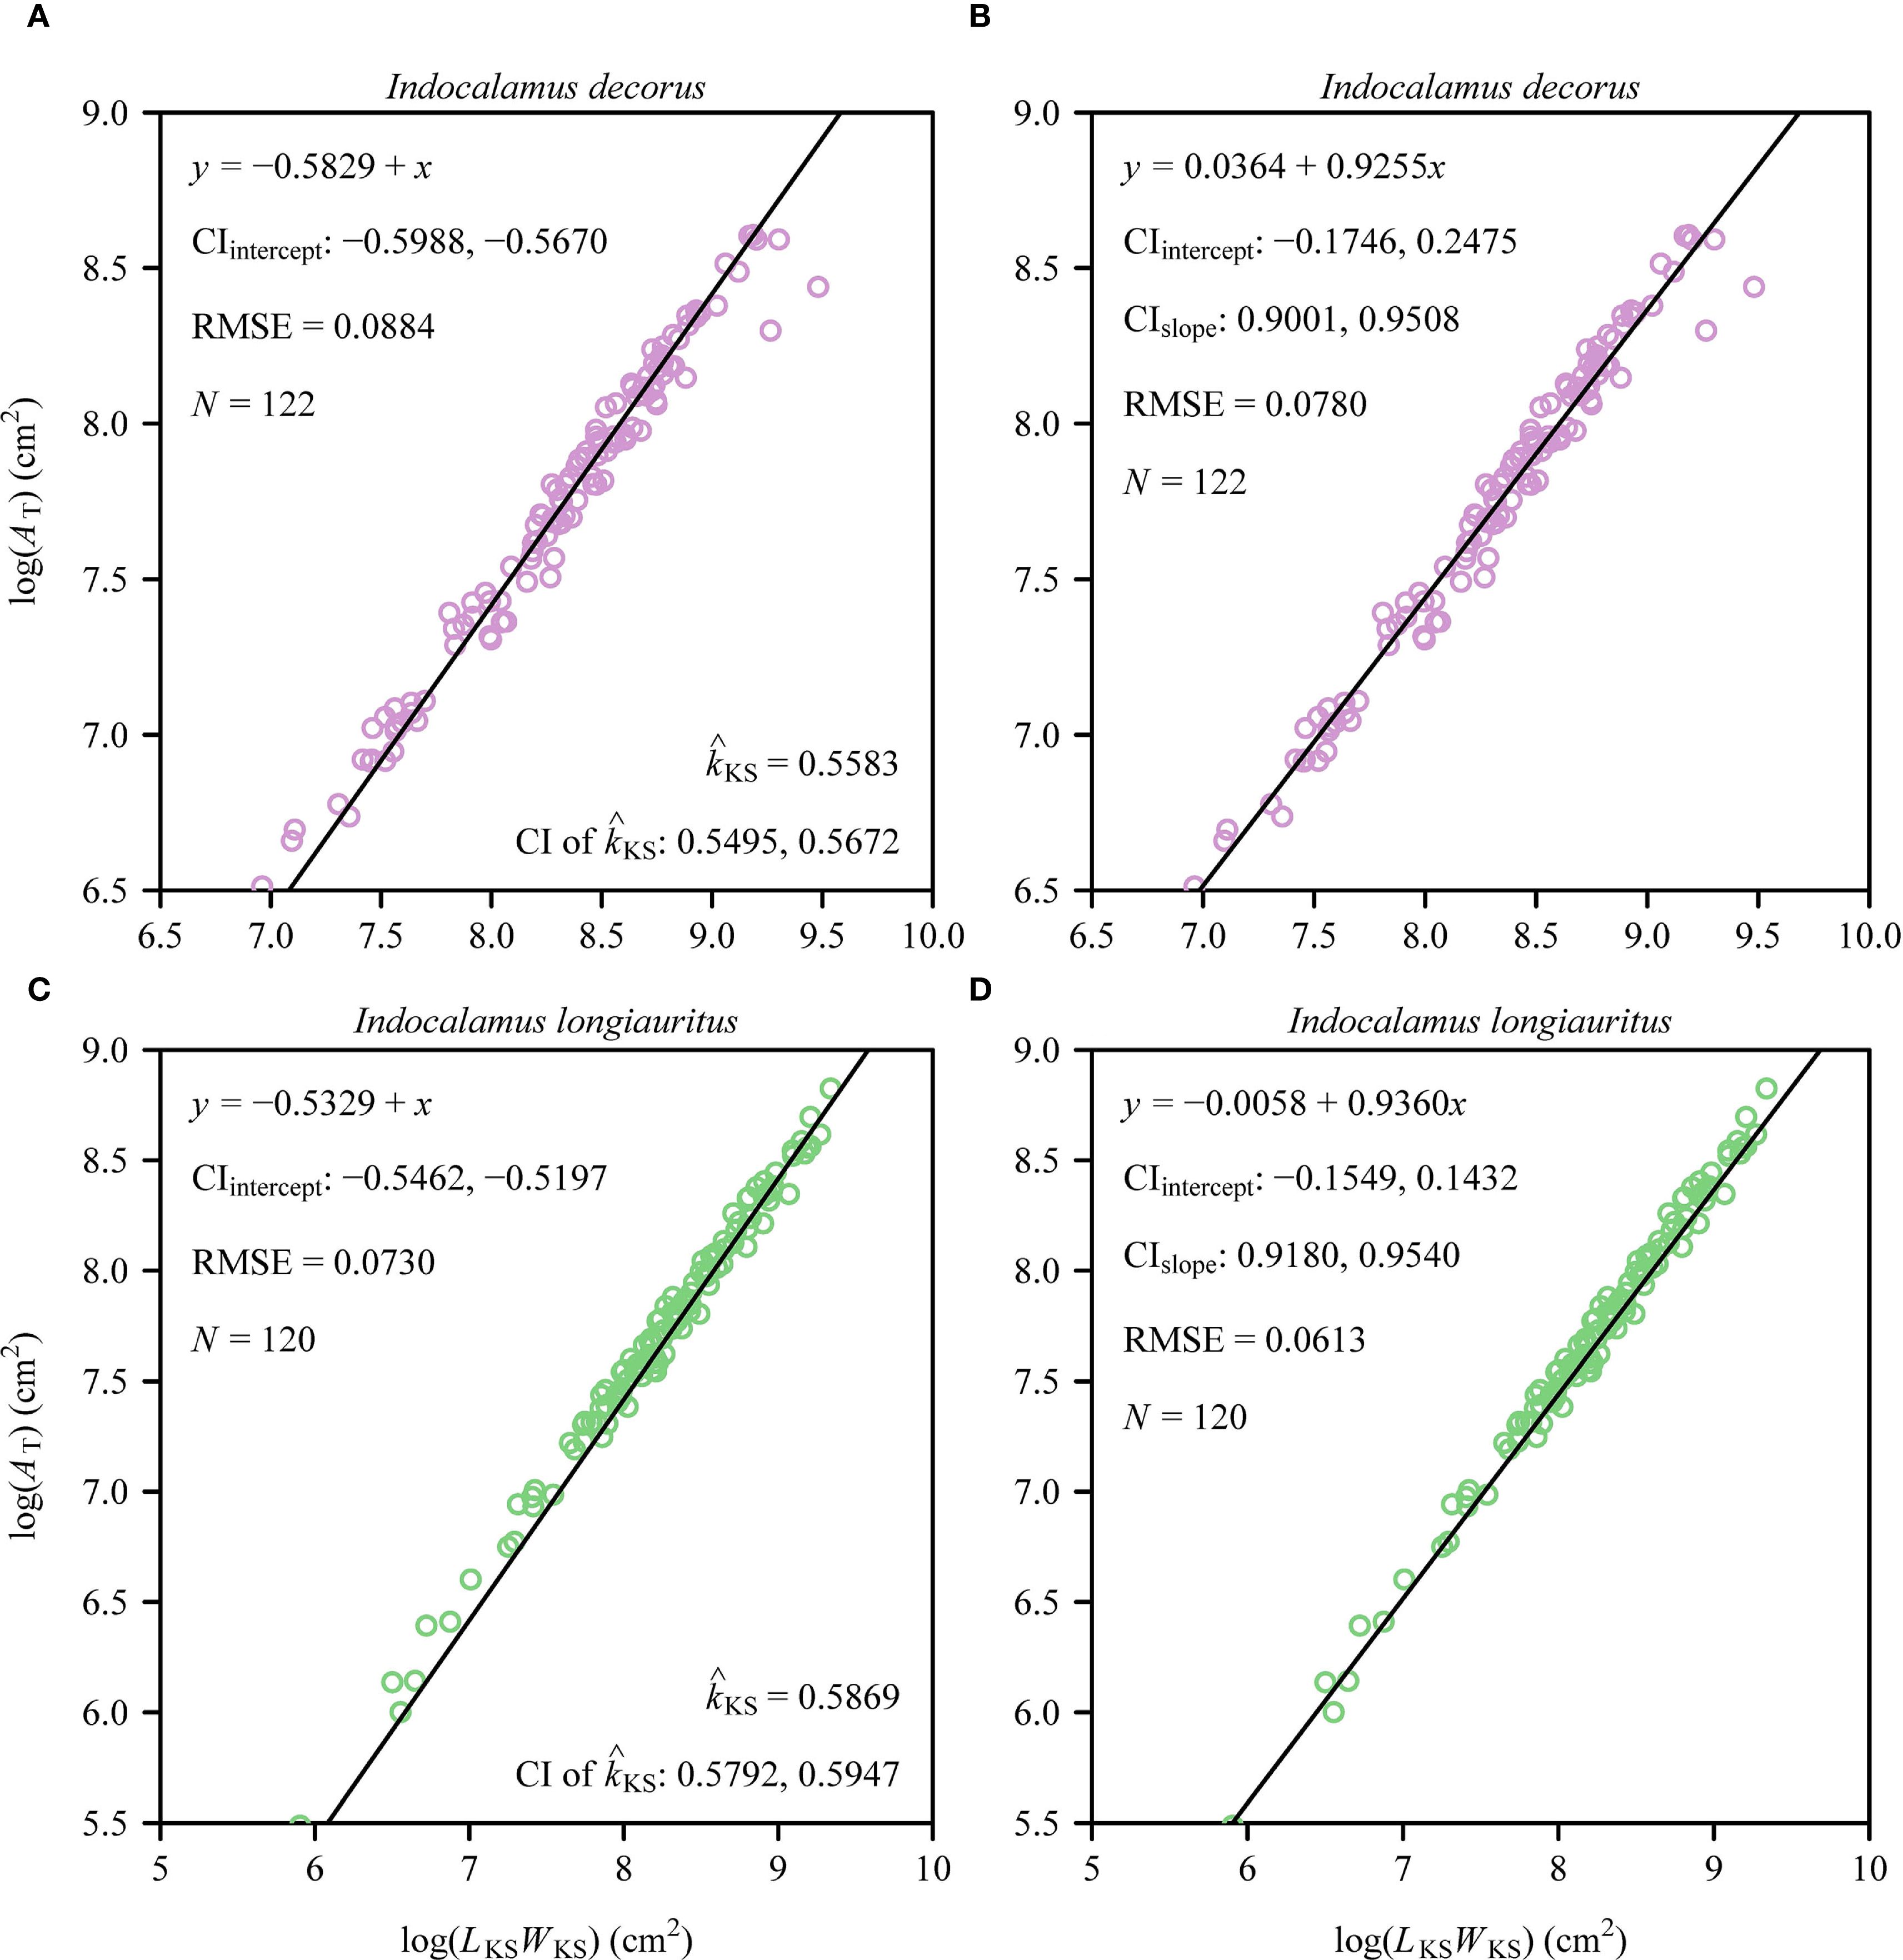
Figure 4. Fitted log-log bivariate plots of the relationships between total leaf area per shoot (AT) and the product of the sum of individual leaf widths (LKS) and the maximum individual leaf length (WKS) for I. decorus (A, B) and I. longiauritus (C, D). Panels (A, C) show the fitted results using the Montgomery-Koyama-Smith equation that hypothesizes the log-log slope to be unity, and panels (B, D) show the fitted results using the power-law equation. The open circles represent the observations; the solids represent the regression lines; CIintercept represents the 95% confidence interval of the estimated y-intercept; CIslope represents the 95% confidence interval of the estimated slope; is the estimated proportionality coefficient of the MKSE; CI of represents the 95% confidence interval of the estimated proportionality coefficient of the MKSE; RMSE is the root-mean-square error of the linear fitting; and N is the sample size, i.e., the number of shoots.
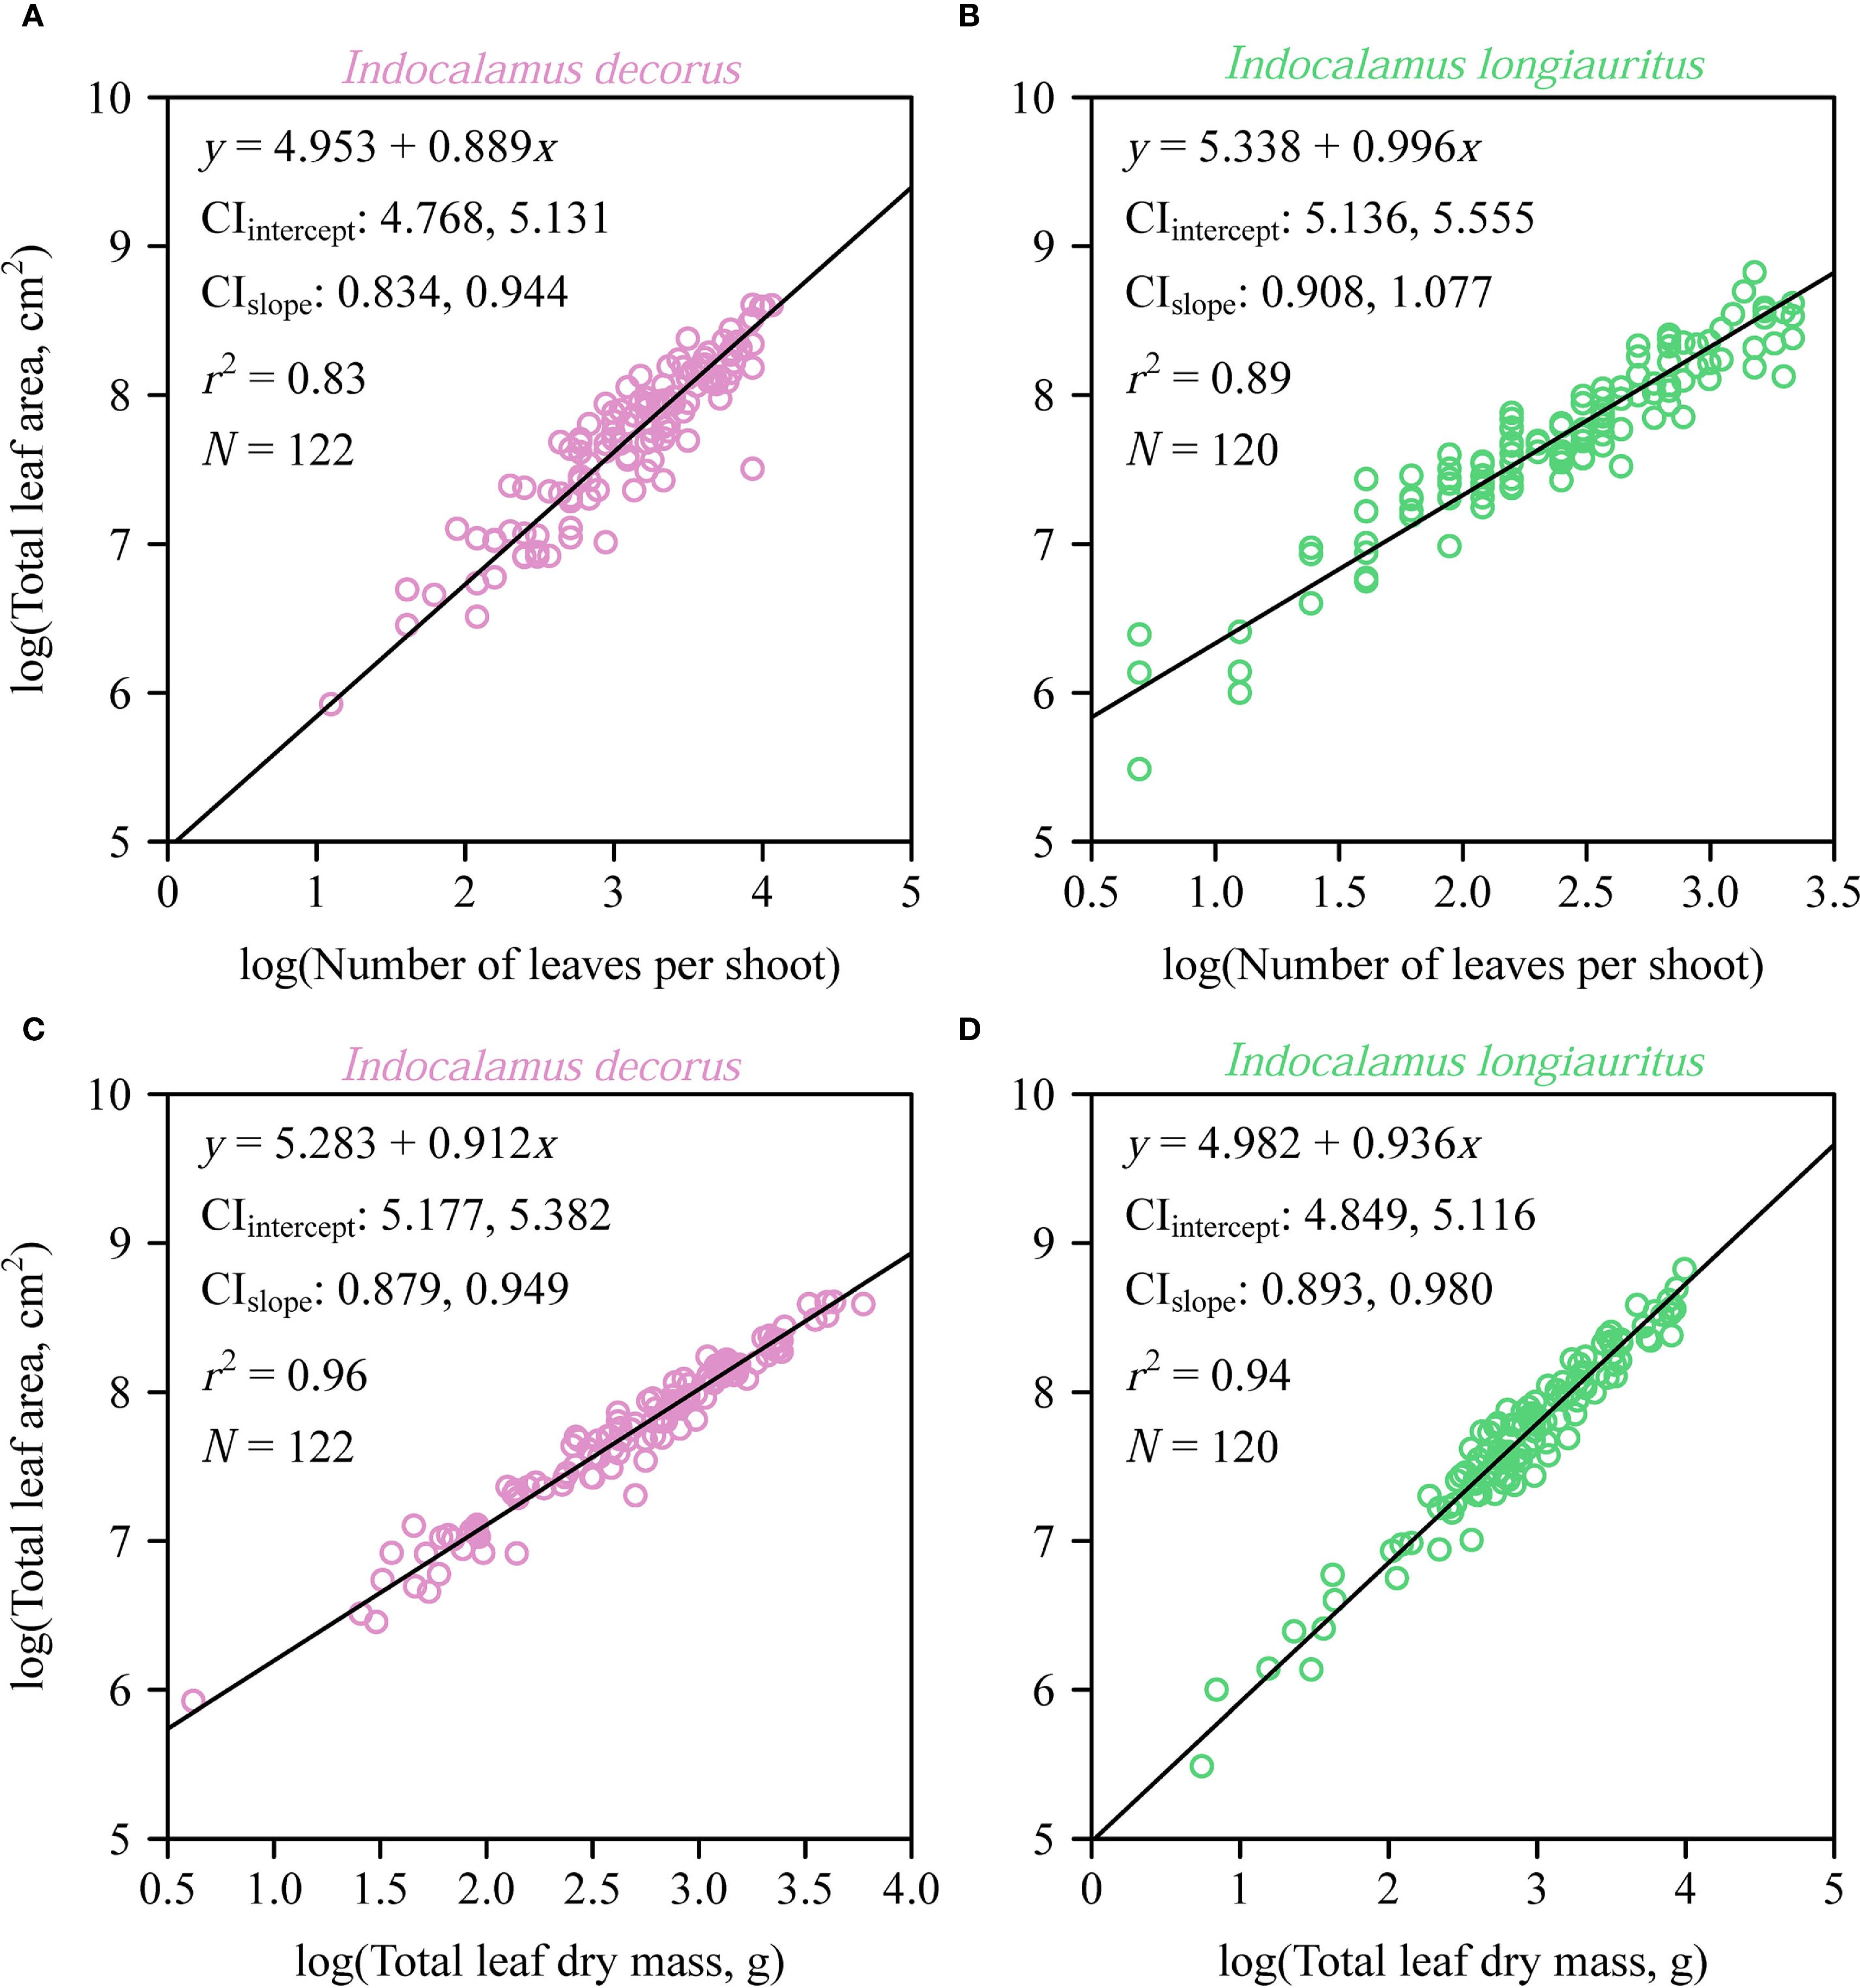
Figure 5. Fitted log-log bivariate plots of the relationships between total leaf area per shoot (AT) and the number of leaves per shoot, and between AT and the total leaf dry mass for Indocalamus decorus (A, C) and I. longiauritus (B, D). The open circles represent the observations; the solids represent the regression lines; CIintercept represents the 95% confidence interval of the estimated y-intercept; CIslope represents the 95% confidence interval of the estimated slope; r2 is the coefficient of determination; and N is the sample size, i.e., the number of shoots.
4 Discussion
The development of non-destructive methods to quantify functional traits such as total leaf area per shoot (AT) and total leaf dry mass per shoot (MT) represents an important advance in plant ecology, particularly for economically and ecologically significant taxa such as Indocalamus bamboos. Our study provides promising predictive models for the measurement of these traits using simplified one-dimensional leaf metrics, which is shown to be valid for two representative and important bamboo species (I. decorus and I. longiauritus). The three key findings of this study are the identification of (1) a strong proportionality for individual leaves via the Montgomery equation (A ∝ LW), (2) a species-specific proportionality at the shoot level using the Montgomery-Koyama-Smith equation (MKSE, AT ∝ LKSWKS), and (3) allometric AT vs. LKSWKS, AT vs. NT and AT vs. MT scaling relationships, which reveal fundamental architectural and allocational constraints. These findings are contextualized in the following sections through three interrelated lenses: (1) the mechanistic basis of the AT vs. LKSWKS allometry, (2) the ecological drivers of divergent AT vs. NT scaling relationships between species, and (3) the implications of the AT vs. MT allometry for carbon investment strategies.
4.1 AT vs. LKSWKS allometry: architectural constraints and the limits of proportionality
The MKSE posits a strict isometric scaling relationship (α = 1) between AT and the composite metric LKSWKS (i.e., the product of the sum of leaf widths and maximum leaf length). The rationale for assuming constant kKS in the MKSE merges from the foundational Montgomery equation (individual leaf area A ∝ LW), where a species-specific constant k captures the geometric proportionality between A and the LW product. Extending this proportionality to the shoot level (AT ∝ LKSWKS) implicitly assumes that the average proportionality (k) across all leaves within a shoot remains constant, or that variations cancel out, allowing LKSWKS to serve as a dimensionally consistent proxy for total area. Furthermore, prior theoretical work (Meng et al., 2025) shows that, if four strict conditions hold true simultaneously for shoots, AT scales isometrically with LKSWKS (α = 1): (1) the number of leaves is constant across shoots, (2) individual leaf areas sorted in ascending order for each shoot follow a geometric series, (3) the common ratio of this geometric series is constant across shoots, and (4) individual leaf width scales (isometrically or allometrically) with leaf length. However, our analyses reveal a significant sub-linearity (α < 1) in both species (Figures 4B, D), indicating that AT increases at a disproportionately slower rate than LKSWKS as shoots increase in overall size. This deviation from the idealized MKSE proportionality arises from intrinsic architectural heterogeneities neglected in the model’s assumptions. The MKSE requires that the numerical value of the Montgomery parameter (k) is constant or nearly so across all leaves per shoot (Koyama and Smith, 2022). However, in the case of Indocalamus, pronounced intra-shoot leaf size variation is evident, which is interpreted to reflect an ontogenetic gradient in leaf development along the length of shoots (e.g., smaller basal leaves vs. larger apical leaves), which results in a basipetal shift in the numerical value of k (Shi et al., 2021). As shoot size increases, larger leaves tend to exhibit lower k-values due to the thickening of vascular bundles and the mesophyll, reducing the area gained per unit LW (Meng et al., 2025). Consequently, LKSWKS overestimates AT in larger shoots, as dimensional increases in LKSWKS outpace actual area expansion (AT). This aligns with the results reported by Meng et al. (2025), who observed that MKSE yields less than optimal results using Sasaella kongosanensis ‘Aureostriatus’, presumably because of inconsistent leaf-number-dependent allometries. In the case of Indocalamus, architectural simplicity (low leaf counts, and open canopies) likely reduces (but does not eliminate) this bias, highlighting the fact that plants tend to optimize leaf deployment not for geometric proportionality but for light capture efficiency as a consequence of hydraulic and mechanical trade-offs (Givnish, 1984; Niklas, 1994; Westoby et al., 2002). Thus, scaling exponents with numerical values less than unity (α < 1) identify the “cost” of producing larger shoots, where diminishing returns in area gain per unit dimensional investment reflect selection for reducing self-shading and enhancing hydraulic safety (Smith et al., 2017; Wang et al., 2024).
Our findings confirm that structural heterogeneity within shoots, particularly the ontogenetic gradient in leaf size and associated variation in the Montgomery parameter (k), is a key driver of the observed deviation from strict proportionality in the MKSE. It is therefore acknowledged that intra-shoot variability in k-values represents a potential source of prediction error, especially in shoots with more complex architecture or pronounced developmental gradients. Future studies should focus on the quantification of k-value variation across different leaf sizes, phyllotaxies, and developmental stages. Such analyses are crucial for assessing the robustness of the MKSE across diverse plant forms and for developing refined predictive models that account for inherent structural heterogeneity.
The nonlinear scaling of AT vs. LKSWKS observed when α < 1 also mirrors light attenuation patterns in tropical canopies. Kitajima et al. (2005) quantified how late-successional trees with orthotropic branching enhance shading through high cumulative leaf area index (LAI) ranging between 5 and 8 despite low light extinction coefficients (K = 0.35), whereas pioneers maintain minimal LAI (< 0.5) for maximizing light penetration. In the case of Indocalamus, similar architectural optimization occurs, e.g., larger shoots exhibit diminishing area gains per unit dimensional increases (LKSWKS), reflecting trade-offs between hydraulic safety and light capture efficiency. Although our models demonstrate robustness in the studied populations, environmental factors (e.g., light, water, or nutrient gradients) may influence scaling parameters in heterogeneous habitats, e.g., resource limitation could exacerbate diminishing returns in the scaling of AT/LKSWKS (α < 1) by constraining leaf expansion. Future studies manipulating environmental stressors are needed to test the plasticity of these relationships across ecological settings.
4.2 Divergent AT vs. NT scaling relationships: self-shading, canopy architecture, and species-specific strategies
Our data reveal an interspecific contrast in how AT scales with respect to leaf number (NT) in two closely related species. Specifically, we observe an allometric AT vs. NT scaling relationship in the case of I. decorus (α < 1) and an isometric scaling relationship in the case of I. longiauritus (α ≈ 1) (Figures 5A, B). We interpret this difference to reflect adaptations to divergent self-shading intensity, modulated by canopy architecture. Specifically, I. decorus shoots, on average, bear twice as many leaves per shoot (mean NT = 26.3) compared to I. longiauritus (mean NT = 12.5), and consequently experience significantly more self-shading. Consequently, I. decorus exhibits an allometric scaling relationship (i.e., ), such that the addition of each leaf contributes disproportionately more to total leaf area per shoot. This observation differs from the data reported by Wang et al. (2024), who observed an AT vs. NT scaling relationship governed by α = 1.128 in Shibataea chinensis (experiencing considerable self-shading), compared to α = 0.820 in Sasaella kongosanensis ‘Aureostriatus’ (experiencing little or no self-shading). The difference between α > 1 in S. chinensis and α < 1 in I. decorus (both high self-shading species) likely reflects distinct architectural adaptations to shading. S. chinensis mitigates shading by means of an even vertical leaf distribution, where the addition of leaves necessitates disproportionate area increases (α > 1) to compensate for layered shading. In contrast, I. decorus exhibits apical leaf clustering, where adding leaves expands existing clusters rather than adding new shaded layers. This architecture imposes stronger self-thinning constraints, limiting area gains per added leaf (α < 1) despite high overall shading. Thus, though both species experience considerable self-shading, their divergent leaf deployment strategies drive contrasting scaling exponents. Thus, the numerical value of the AT vs. NT scaling exponent emerges as an important functional signature of species-specific light-harvesting optimization as summarized by Corner’s rules (Corner, 1949), which proposes that branching geometry dictates whether area expansion prioritizes leaf size or number (Olson et al., 2018).
Our observations of crown architecture also align with recent discoveries of life-form-dependent shade avoidance strategies. For example, Aoyagi et al. (2024) have shown that Japanese monoaxial trees exhibit divergent leaf arrangements, i.e., deciduous species minimize self-shading through top-down (basipetal) decreasing petiole lengths (r = −0.94) and deflection angles, enabling apical leaf expansion, whereas evergreen species employ bottom-up (acropetal) increasing angles (r = 0.82) to create vertical inter-whorl spacing. This dichotomy underscores how phylogenetic constraints shape crown plasticity, which is evident in I. decorus (high leaf count) and I. longiauritus (low leaf count), where architectural simplicity permits flexible adaptations to self-shading.
4.3 AT vs. MT allometry and its implications for biomass investment efficiency
We suspect that the AT vs. MT allometry integrates two key trade-offs: (i) potentially competing leaf-level structural and physiological requirements, and (ii) shoot-level leaf biomass partitioning trade-offs. Across diverse species, individual leaves tend to exhibit a positive M vs. A scaling allometry (), wherein larger leaves require disproportionately more mass with increasing lamina area, presumably for mechanical and hydraulic tissue systems (Milla and Reich, 2007; Niklas et al., 2007; Niinemets et al., 2007). However, in the case of Indocalamus, larger shoots appear to produce thinner leaves or leaves with reduced tissue density to optimize carbon allocation. In Indocalamus, both mechanisms likely operate. First, the conserved Montgomery parameter (k ≈ 0.72) indicates geometric similarity in leaf shape, but the shoot-level AT vs. MT allometry (α = 0.912 and 0.936 for the two investigated bamboo species) indicates increasing mass per unit area. This agrees with the “diminishing returns” pattern observed in subtropical ferns, where total leaf area scales allometrically with biomass (α < 1.0) across elevations (Chen et al., 2023). This further indicates that there are similar resource allocation strategies governing the AT vs. MT scaling relationship, i.e., increased individual plant (or shoot) size requires increases in LMA to enhance structural support under variable light regimes. Second, as shoots enlarge, resource allocation shifts toward higher LMA. This increased investment per unit area supports greater structural integrity (e.g., thicker mesophyll, denser vascular bundles) and potentially enhanced longevity or defense, which may be advantageous in environments where larger shoots experience greater mechanical stress or herbivory pressure, even within generally resource-rich habitats (Wright et al., 2004; Poorter et al., 2009). Importantly, the AT vs. MT allometry (α < 1) confirms the “diminishing returns” pattern reported for whole-plant LMA scaling (Niklas et al., 2007). This reflects an economic strategy where larger shoots exhibit a relative increase in biomass investment per unit photosynthetic area (higher LMA). While this prioritization of structural biomass over maximal area expansion (AT/MT decreases as MT increases) might seem to constrain potential photosynthetic gains per unit carbon invested, it likely enhances hydraulic safety, mechanical stability, and leaf longevity in larger architectural units. This strategy optimizes carbon gain under the specific constraints faced by larger shoots (e.g., greater self-loading, longer hydraulic pathways), rather than maximizing area per se under non-limiting conditions (Poorter et al., 2009). The conserved low average LMA characteristic of fast-growing bamboos like Indocalamus (Wright et al., 2004) is thus achieved alongside this ontogenetic increase in LMA within shoots as they develop.
5 Conclusions
This study fulfills the critical need for efficient, non-destructive phenotyping methods in plant ecology by establishing robust predictive models for total leaf area per shoot (AT) and total leaf dry mass per shoot (MT), as shown for two Indocalamus bamboo species. The validation of the Montgomery equation confirms a strong proportional relationship between individual leaf area (A) and the product of leaf length and width (LW) for both I. decorus and I. longiauritus, with statistically equivalent Montgomery parameters (k ≈ 0.72) and high predictive accuracy across the two species. Extending this principle to the shoot level, the data show that the Montgomery-Koyama-Smith equation (MKSE) captures the proportionality between AT and the composite metric LKSWKS (the product of the sum of leaf widths and maximum leaf length), although species-specific coefficients highlight nuanced biological variation. Crucially, power-law scaling analyses confirm pervasive allometric relationships, i.e., the scaling exponent (α < 1) for AT versus LKSWKS indicates that leaf area expansion lags behind dimensional increases, reflecting architectural constraints on light-harvesting efficiency. Similarly, the allometric scaling (α < 1) between AT and MT reveals increasing biomass investment per unit leaf area in larger shoots, indicating an increase in leaf mass per unit area (LMA) with shoot development. This non-isometric investment strategy optimizes carbon allocation by prioritizing structural biomass over photosynthetic surface expansion as shoots grow, aligning with ecological optimizations for hydraulic safety and durability under increasing size constraints. Methodologically, our findings validate that simplified one-dimensional leaf metrics can be used to accurately predict shoot-level functional traits, bypassing labor-intensive destructive sampling. The architectural simplicity of Indocalamus, which is characterized by limited leaf counts, pronounced size variation, and open canopies, proved instrumental in minimizing noise from branching complexity, thereby enhancing model robustness. However, the observed sensitivity of proportionality constants to species identity and shoot size indicates the need for taxon-specific calibrations when applying the MKSE across diverse bamboo lineages or complex plant architectures. Future research should explore (1) the transferability of these models to other genera, (2) the effects of environmental modulators of scaling exponents, and (3) integrate remote-sensing technologies for field-scale phenotyping. As Valladares and Niinemets (2008) have shown, elevated CO2 may temporarily enhance carbon gain in shade-tolerant species, but concurrent warming and fragmentation threaten their understory niches, especially given low phenotypic plasticity. Our models for Indocalamus suggest that allometric AT vs. MT scaling (α < 1) could mitigate these pressures by prioritizing photosynthetic area over structural biomass, offering a buffer against environmental instability. Research focused on projected climate effects on shade-adapted species should account for multifactorial stressors.
Data availability statement
The original contributions presented in the study are included in the article/Supplementary Material. Further inquiries can be directed to the corresponding authors.
Author contributions
QF: Writing – original draft, Investigation, Funding acquisition, Formal Analysis. PS: Formal Analysis, Writing – original draft, Supervision. JG: Writing – review & editing. KN: Formal Analysis, Writing – review & editing, Supervision.
Funding
The author(s) declare financial support was received for the research and/or publication of this article. QF was supported by the Opening Foundation of Key Laboratory of Sichuan Province for Bamboo Pests Control and Resource Development (ZL2019002).
Acknowledgments
We thank Azuo Jimu, Jing Li, Lin Wang, and Ximeng Xiao for their valuable help in the preparation of this work. We also thank two expert reviewers for their constructive comments that have improved the quality of the manuscript.
Conflict of interest
The authors declare that the research was conducted in the absence of any commercial or financial relationships that could be construed as a potential conflict of interest.
Generative AI statement
The author(s) declare that no Generative AI was used in the creation of this manuscript.
Any alternative text (alt text) provided alongside figures in this article has been generated by Frontiers with the support of artificial intelligence and reasonable efforts have been made to ensure accuracy, including review by the authors wherever possible. If you identify any issues, please contact us.
Publisher’s note
All claims expressed in this article are solely those of the authors and do not necessarily represent those of their affiliated organizations, or those of the publisher, the editors and the reviewers. Any product that may be evaluated in this article, or claim that may be made by its manufacturer, is not guaranteed or endorsed by the publisher.
Supplementary material
The Supplementary Material for this article can be found online at: https://www.frontiersin.org/articles/10.3389/fpls.2025.1650196/full#supplementary-material
References
Aoyagi, H., Nakabayashi, M., and Yamada, T. (2024). Newly found leaf arrangement to reduce self-shading within a crown in Japanese monoaxial tree species. J. Plant Res. 137, 203–213. doi: 10.1007/s10265-024-01524-5
Chen, S. B., Li, J. L., Sun, J., Zhong, Q. L., Hu, D. D., and Cheng, D. L. (2023). Diminishing returns” and leaf area-biomass scaling of ferns in subtropical ecosystems. Front. Plant Sci. 14, 1187704. doi: 10.3389/fpls.2023.1187704
Corner, E. J. H. (1949). The durian theory or the origin of the modern tree. Ann. Bot. 13, 367–414. doi: 10.1093/oxfordjournals.aob.a083225
Efron, B. and Tibshirani, R. J. (1993). An introduction to the bootstrap (New York, NY, USA: Chapman and Hall/CRC).
Givnish, T. J. (1984). “Leaf and canopy adaptations in tropical forests,” in Physiological Ecology of Plants of the Wet Tropics, vol. 12 . Eds. Medina, E., Mooney, H. A., and Vázquez-Yánes, C. (Springer, Dordrecht, The Netherlands), 51–84.
Kitajima, K., Mulkey, S. S., and Wright, S. J. (2005). Variation in crown light utilization characteristics among tropical canopy trees. Ann. Bot. 95, 535–547. doi: 10.1093/aob/mci051
Koyama, K. and Smith, D. D. (2022). Scaling the leaf length-times-width equation to predict total leaf area of shoots. Ann. Bot. 130, 215–230. doi: 10.1093/aob/mcac043
Lambers, H. and Poorter, H. (1992). Inherent variation in growth rate between higher plants: A search for physiological causes and ecological consequences. Adv. Ecol. Res. 23, 187–261. doi: 10.1016/S0065-2504(03)34004-8
Meng, Y., Ratkowsky, D. A., Yao, W. H., Heng, Y., and Shi, P. J. (2025). The geometric series hypothesis of leaf area distribution and its link to the calculation of the total leaf area per shoot of Sasaella kongosanensis ‘Aureostriatus’. Plants 14, 73. doi: 10.3390/plants14010073
Milla, R. and Reich, P. B. (2007). The scaling of leaf area and mass: the cost of light interception increases with leaf size. Proc. R. Soc. B 274, 2109–2114. doi: 10.1098/rspb.2007.0417
Montgomery, E. G. (1911). Correlation studies in corn, Annual Report No. 24. Nebraska Agricultural Experimental Station (Lincoln, NB, USA: University of Nebraska Press), 108–159.
Niinemets, Ü., Portsmuth, A., Tena, D., Tobias, M., Matesanz, S., and Valladares, F. (2007). Do we underestimate the importance of leaf size in plant economics? Disproportional scaling of support costs within the spectrum of leaf physiognomy. Ann. Bot. 100, 283–303. doi: 10.1093/aob/mcm107
Niklas, K. J. (1988). The role of phyllotactic pattern as a “Developmental Constraint” on the interception of light by leaf surfaces. Evolution 42, 1–16. doi: 10.1111/j.1558-5646.1988.tb04103.x
Niklas, K. J. (1994). Plant allometry: the scaling of form and process (Chicago, IL, USA: University of Chicago Press).
Niklas, K. J., Cobb, E. D., Nilimenets, Ü., Reich, P. B., Sellin, A., Shipley, B., et al. (2007). “Diminishing returns” in the scaling of functional leaf traits across and within species groups. Proc. Natl. Acad. Sci. 104, 8891–8896. doi: 10.1073/pnas.0701135104
Olson, M. E., Soriano, D., Rosell, J. A., Anfodillo, T., Donoghue, M. J., Edwards, E. J., et al. (2018). Plant height and hydraulic vulnerability to drought and cold. Proc. Natl. Acad. Sci. U.S.A. 115, 7551–7556. doi: 10.1073/pnas.1721728115
Poorter, H., Niinemets, Ü., Poorter, L., Wright, I. J., and Villar, R. (2009). Causes and consequences of variation in leaf mass per area (LMA): a meta-analysis. New Phytol. 182, 565–588. doi: 10.1111/j.1469-8137.2009.02830.x
Quinn, G. P. and Keough, M. J. (2002). Experimental design and data analysis for biologists (Cambridge: Cambridge University Press).
R Core Team (2023). R: a language and environment for statistical computing (Vienna, Austria: R Foundation for Statistical Computing). Available online at: https://www.r-project.org/ (Accessed July 26, 2023).
Reich, P. B., Wright, I. J., Cavender-Bares, J., Craine, J. M., Oleksyn, J., Westoby, M., et al. (2003). The evolution of plant functional variation: traits, spectra, and strategies. Int. J. Plant Sci. 164, S143–S164. doi: 10.1086/374368
Sack, L., Scoffoni, C., McKown, A. D., Frole, K., Rawls, M., Havran, J. C., et al. (2012). Developmentally based scaling of leaf venation architecture explains global ecological patterns. Nat. Commun. 3, 837. doi: 10.1038/ncomms1835
Shi, P. J., Li, Y. R., Niinemets, Ü., Olson, E., and Schrader, J. (2021). Influence of leaf shape on the scaling of leaf surface area and length in bamboo plants. Trees Struct. Funct. 35, 709–715. doi: 10.1007/s00468-020-02058-8
Shipley, B. (1995). Structured interspecific determinants of specific leaf area in 34 species of herbaceous angiosperms. Funct. Ecol. 9, 312–319. doi: 10.2307/2390579
Smith, D. D., Sperry, J. S., and Adler, F. R. (2017). Convergence in leaf size versus twig leaf area scaling: Do plants optimize leaf area partitioning? Ann. Bot. 119, 447–456. doi: 10.1093/aob/mcw231
Sterck, F. J., Poorter, L., and Schieving, F. (2006). Leaf traits determine the growth-survival trade-off across rain forest tree species. Am. Nat. 167, 758–765. doi: 10.1086/503056
Su, J. L., Niklas, K. J., Huang, W. W., Yu, X. J., Yang, Y. Y., and Shi, P. J. (2019). Lamina shape does not correlate with lamina surface area: An analysis based on the simplified Gielis equation. Glob. Ecol. Conserv. 19, e00666. doi: 10.1016/j.gecco.2019.e00666
Valladares, F. and Niinemets, Ü. (2008). Shade tolerance, a key plant feature of complex nature and consequences. Annu. Rev. Ecol. Evol. Syst. 39, 237–257. doi: 10.1146/annurev.ecolsys.39.110707.173506
Vorontsova, M. S., Clark, L. G., Dransfield, J., Govaerts, R., and Baker, W. J. (2016). World checklist of bamboos and rattans, INBAR Technical Report No. 37. International Network for Bamboo and Rattan (China: Beijing).
Wang, C. K., Heng, Y., Xu, Q. W., Zhou, Y. J., Sun, X. Y., Wang, Y. C., et al. (2024). Scaling relationships between the total number of leaves and the total leaf area per culm of two dwarf bamboo species. Ecol. Evol. 14, e70002. doi: 10.1002/ece3.70002
Weibull, W. (1951). A statistical distribution function of wide applicability. J. Appl. Mech. 18, 293–297. doi: 10.1115/1.4010337
Westoby, M. (1998). A leaf-height-seed (LHS) plant ecology strategy scheme. Plant Soil 199, 213–227. doi: 10.1023/A:1004327224729
Westoby, M., Falster, D. S., Moles, A. T., Vesk, P. A., and Wright, I. J. (2002). Plant ecological strategies: Some leading dimensions of variation between species. Annu. Rev. Ecol. Syst. 33, 125–159. doi: 10.1146/annurev.ecolsys.33.010802.150452
Keywords: Montgomery equation, Montgomery-Koyama-Smith equation, proportional relationship, scaling relationship, total leaf area, total leaf dry mass
Citation: Fu Q, Shi P, Gielis J and Niklas KJ (2025) Non-destructive prediction of shoot-level leaf area and biomass in Indocalamus bamboo via scaling laws. Front. Plant Sci. 16:1650196. doi: 10.3389/fpls.2025.1650196
Received: 19 June 2025; Accepted: 28 August 2025;
Published: 17 September 2025.
Edited by:
Lucian Copolovici, Aurel Vlaicu University of Arad, RomaniaReviewed by:
Jun Sun, Anqing Normal University, ChinaJae Hwan Lee, Sahmyook University, Republic of Korea
Copyright © 2025 Fu, Shi, Gielis and Niklas. This is an open-access article distributed under the terms of the Creative Commons Attribution License (CC BY). The use, distribution or reproduction in other forums is permitted, provided the original author(s) and the copyright owner(s) are credited and that the original publication in this journal is cited, in accordance with accepted academic practice. No use, distribution or reproduction is permitted which does not comply with these terms.
*Correspondence: Peijian Shi, cGpzaGlAbmpmdS5lZHUuY24=; Karl J. Niklas, a2puMkBjb3JuZWxsLmVkdQ==