 Shipeng Liu1,2*
 Shuang Liang1Tingrui Jing1
 Xinyi Guo1
 Hairuo Wang1
 Quan Ma1Junshen Wang1
 Kai Wang2Xiaolong He1,2Haibing Zhao2Wenting Jiang1,2Xiangqian Zhang1,2
- 1College of Life Sciences, Yan’an University, Yan’an, China
- 2Engineering Research Center of Microbial Resources Development and Green Recycling, University of Shaanxi Province, Yan’an University, Yan’an, China
Introduction: COBRA-Like (CBL) genes encode glycosylphosphatidylinositol (GPI) -anchored proteins specific to plants that play important roles in cellulose biosynthesis in primary and secondary cell walls.
Methods: This study used a bioinformatics approach to characterize the CBL family genes in Sorghum bicolor (S. bicolor) at the genome-wide level to investigate their potential functions in S. bicolor development.
Results: The results revealed the identification of 10 CBL genes in the BTx623 and E048 S. bicolor genomes, respectively. A comparative analysis of conserved Motifs revealed that all CBL family genes in S. bicolor possess CCVS conserved structural domains. Phylogenetic analysis revealed that the family can be divided into two subfamilies, with genes within each subfamily exhibiting similar gene structures and physicochemical properties. Whole Genome Duplication (WGD) played an important role in the expansion of SbCBL gene family. The tissue-specific expression patterns of SbCBL genes suggest varying expression levels across different organs and tissues in S. bicolor, with SbCBL1, SbCBL5, and SbCBL9 showing significantly higher expression levels in roots. PEG and NaCl treatments significantly affected SbCBL expression levels. SbCBL4 expression increased after PEG treatment, while SbCBL9 expression decreased after NaCl treatment.
Conclusions: Overall, this study provides new insights into the role of the CBL gene family in S. bicolor.
1 Introduction
The COBRA-Like (CBL) gene family encodes a class of glycosylphosphatidylinositol (GPI)-anchored proteins that act as cell surface receptors localized directly to the outer surface of plant plasma membranes and are involved in the perception and transduction of cell wall remodeling signals (Schindelman et al., 2001; Roudier et al., 2002; Ringli, 2010). CBL gene family was originally identified in mutants of Arabidopsis thaliana (A. thaliana) root cells that are abnormally expanded (Benfey et al., 1993). The number of members of the CBL gene family varies considerably among species: A. thaliana, Oryza sativa (O. sativa), Zea mays (Z. mays), and Gossypium hirsutum (G. hirsutum) contain 12, 11, 9, and 39 members, respectively (Roudier et al., 2002; Li et al., 2003; Brady et al., 2007; Fu et al., 2024). Typical structural features include an N-terminal signal peptide that mediates endoplasmic reticulum localization, an aromatic amino acid-rich region that constitutes the cellulose binding site, a central CCVS structural domain (containing cysteine clusters) that maintains protein conformation, and a C-terminal GPI-anchored signal sequence (containing a ω-site) that mediates membrane localization (Roudier et al., 2002).
The cob mutant in A. thaliana exhibits abnormal root cell expansion and a dwarfing phenotype (Roudier et al., 2005). In situ hybridization results showed that the COB gene is highly expressed in the root elongation region, suggesting its involvement in regulating cellulose deposition during cell elongation (Roudier et al., 2005). Further studies revealed that COB gene mutations disrupt the orientation of cellulose microfilament arrangement, triggering a decrease in cellulose content (Roudier et al., 2005). The COBL4 mutant, homologous to COB, exhibited a significant decrease in secondary wall cellulose content (Brown et al., 2005). In addition to CBL, five other cloned A. thaliana family members (e.g., AtCOBL4, AtCOBL9 and AtCOBL2) are involved in cell wall synthesis. The AtCOBL4 affects secondary wall cellulose synthesis (Brown et al., 2005); the AtCOBL9 mutation results in defective polar root hair growth (Jones et al., 2006); and the AtCOBL2 is involved in seed coat cellulose deposition (Ben et al., 2015). Notably, complete deletion of the COB gene triggers plant growth arrest and aberrant expression of defense-related genes (Ko et al., 2006). In monocotyledonous plants, a mutant of the O. sativa BC1 gene (which encodes a CBL protein) exhibits a “brittle rod” phenotype and has 60.7% amino acid sequence homology with the A. thaliana COB protein (Li et al., 2003). This mutation results in reduced cell wall thickness, decreased cellulose content, abnormal lignin deposition, and decreased mechanical strength (Li et al., 2003). Wu Lab identified the OsBCL4 gene, which encodes a CBL protein containing a typical GPI structural domain. Its T-DNA insertion mutant exhibits cell expansion, cellulose reduction, and pectin accumulation (Dai et al., 2011). In addition, the OsBCL5 mutation affects male gametophyte transport (Dai et al., 2009), OsBC5 is involved in secondary wall formation in stem nodes (Aohara et al., 2009), and OsBC6 encodes a CESA-related protein that affects secondary wall synthesis (Kotake et al., 2011). In maize, ZmBK2L3, a member of the ZmBK2L family, is closely related to AtCOB, and its encoded protein retains conserved structural domains and is widely expressed at different developmental stages (Brady et al., 2007; Cao et al., 2012). Recent studies have confirmed that ZmBK2L1 is involved in the regulation of root hair development (Hochholdinger et al., 2008). Studies have shown that COBL genes play a role in how plants respond to abiotic stresses. For instance, DROT1 encodes a COBL protein. It was discovered that DROT1 increases cellulose content and maintains cellulose crystallinity in rice. This modulates the cell wall structure and enhances the plant’s resistance to drought (Sun et al., 2022). In A. thaliana, overexpressing PtCOBL12 promotes plant growth and increases cellulose content and relative crystallinity (Geng et al., 2023). It also improves growth under drought stress conditions. Additionally, the GhCOBL22 gene plays a pivotal role in cotton’s response to drought stress (Fu et al., 2024).
Sorghum bicolor (S. bicolor), as the fifth largest cereal crop in the world, is an important energy and forage crop with excellent agronomic traits such as high photosynthetic efficiency, high nutritional value, high adaptability, and resistance to drought and salinity, and an important model crop for the study of other energy crops (Silva et al., 2022). BTx623 and E048 are two distinct sorghum varieties. BTx623 was the first variety for which a high-quality whole genome was sequenced and assembled (Paterson et al., 2009). Its genome has become a universal “reference template” for sorghum research, providing an important foundation for gene targeting and editing (e.g., CRISPR) as well as functional validation. E048, on the other hand, is derived from Sudanese tropical germplasm (Early Hegari) and differs significantly from BTx623 in terms of disease resistance gene clusters and metabolic pathways. These differences make E048 ideal for comparative genomics studies. For these reasons, BTx623 and E048 were selected for this study. In this study, we identified members of the S. bicolor CBL gene family at the genome-wide level using bioinformatics methods, analyzed their gene structures, evolutionary relationships, selective pressures, and expression patterns, and laid the groundwork for elucidating the functions of this gene family in the stress response of S. bicolor.
2 Materials and methods
2.1 Identification of gene family members
In this study, HMMER 3.3.2 software was used to perform a homology search (E-value threshold of 1e-5) based on the Hidden Markov Model (HMM) of the CBL domain (PF04833) in the Pfam database (https://pfam.xfam.org/) (Mistry et al., 2021) for S. bicolor BTx623 and E048 protein sequences downloaded from the Phytozome v13 (https://phytozome-next.jgi.doe.gov/) (Goodstein et al., 2012) and SGMD databases (https://S.bicolor.genetics.ac.cn/SGMD, accessed on 5 May 2025) (Chen et al., 2025), respectively. The gene sequences obtained from the initial screening were further validated for conserved structural domains using NCBI Conserved Domain Database (CDD) (https://www.ncbi.nlm.nih.gov/Structure/bwrpsb/bwrpsb.cgi) to ensure that the identified sequences contained complete and typical CBL domains, thus accurately identifying members of the S. bicolor CBL gene family.
2.2 Analysis of gene structure and conserved motifs
The coding sequences (CDS) of the genes were aligned with the corresponding genomic sequences and visualized using TBtools software (Chen et al., 2023) to show the exon-intron structure of the SbCBL genes. Then, the conserved motifs of S. bicolor CBL proteins were predicted using MEME Suite 5.5.3 (https://meme-suite.org/meme/tools/meme) (Bailey et al., 2009) software, setting the maximum number of motifs to 10, the motif length range from 6-50 amino acids, and other parameters as default. In addition, the conserved structural domains of the S. bicolor CBL gene family were predicted by NCBI-CDD. Finally, the gene structures, conserved motifs, and conserved structural domains of S. bicolor CBL gene family members were comprehensively analyzed using TBtools software (Chen et al., 2023).
2.3 Phylogenetic tree construction
The amino acid sequences of S. bicolor CBL gene family members and CBL protein sequences of A. thaliana, O. sativa, Z. mays, Solanum lycopersicum (S. lycopersicum) and Setaria italica (S. italica) were subjected to multiple sequence comparison using MEGA 7.0 software (Kumar et al., 2016). Neighbor-joining (NJ) was then used to construct the phylogenetic tree. In the parameter settings, the number of bootstrap tests was 1000, and the Poisson correction model was selected to calculate the genetic distance. Finally, the evolutionary tree was embellished by iTOL (https://itol.embl.de/) online website to show the evolutionary relationship between S. bicolor CBL gene family and members of this gene family in other plants, and to analyze the evolutionary pattern and classification of the gene family.
2.4 Analysis of replication events and selection pressure
Tandem and genome-wide replication events of the S. bicolor CBL gene family were analyzed using MCScan X (Wang et al., 2012). The Simple Ka/Ks Calculator module in TBtools software was used to input the coding sequences (CDS), protein sequences, and immediately homologous gene pairs of the genes, respectively, and the Ka (non-synonymous substitution rate)/Ks (synonymous substitution rate) values between homologous genes were calculated to estimate the selection pressure. In addition, MCScan X (Wang et al., 2012) was applied to analyze the covariation events between S. bicolor and A. thaliana, S. lycopersicum, O. sativa, and S. italica CBL gene families.
2.5 Gene expression analysis
Transcriptome data of different tissues of S. bicolor (including seedlings, leaves, roots, stems, inflorescences, and seeds, etc.) at different developmental stages were obtained from the S. bicolor Genome and Mutant Bank SGMD database (Chen et al., 2025). Then, we utilized Tbtools software to analyze gene expression data from various tissues, screening for CBL genes that exhibited high expression levels across different tissues and developmental stages. The data are shown in a heatmap with gene expression in different tissues with row-scaled transcriptome atlas (TPM values). Red and blue boxes indicate high and low expression levels of SbCBL genes.
2.6 RT-qPCR
S. bicolor was grown in a growth chamber at Yan’an University with 16.0 hours of light, temperature maintained at 25°C and 70% humidity. To determine the expression level of CBL gene after NaCl and PEG treatments, S. bicolor seedlings at the three-leaf-one-heart stage were selected and treated with 150 mM NaCl and 15% PEG, respectively, followed by collection of S. bicolor root samples 7 days. All experiments were performed in three biological replicates (Three biological replicates and three technical replicates per biological sample were performed.). Total RNA was isolated using the Plant Total RNA Kit from Beijing Zhuangmeng International BioGenetics Co. Ltd. and reverse transcription was performed using HiScript IV All-in-One Ultra RT SuperMix for qPCR from Novozymes. The RT-qPCR amplification reaction system consisted of 5 μL 2×SYBR, 3 μL ddH2O, 1 μL cDNA template, and 0.5 μM forward and reverse primers in a total volume of 10 μL. The expression level of SbCBL gene was analyzed by the 2-ΔΔCT method in response to different stress treatments (Xue et al., 2024), and SbACTIN was used as an internal reference gene to analyze the expression level of SbCBL gene under different stress treatments.
3 Result
3.1 Identification of S. bicolor CBL gene family members
Using HMMER 3.3.2 software based on the Hidden Markov Model of the CBL conservative domain (PF04833) in the Pfam database, we searched and validated S. bicolor protein sequences using NCBI-CDD. Finally, we identified ten CBL gene family members. These genes were named SbCBL1-SbCBL10 and SbECBL1-SbECBL10 based on their location on the chromosomes. The distribution of these 20 genes on the S. bicolor chromosomes was visualized using TBtools software, and the results are shown in Figure 1. S. bicolor CBL gene family members were unevenly distributed across three chromosomes: five genes (SbCBL1-SbCBL5) were found on chromosome 1; four genes were found on chromosome 2; and one gene was found on chromosome 6. This uneven distribution pattern may be related to the evolution of gene families, chromosome structure, and gene function.
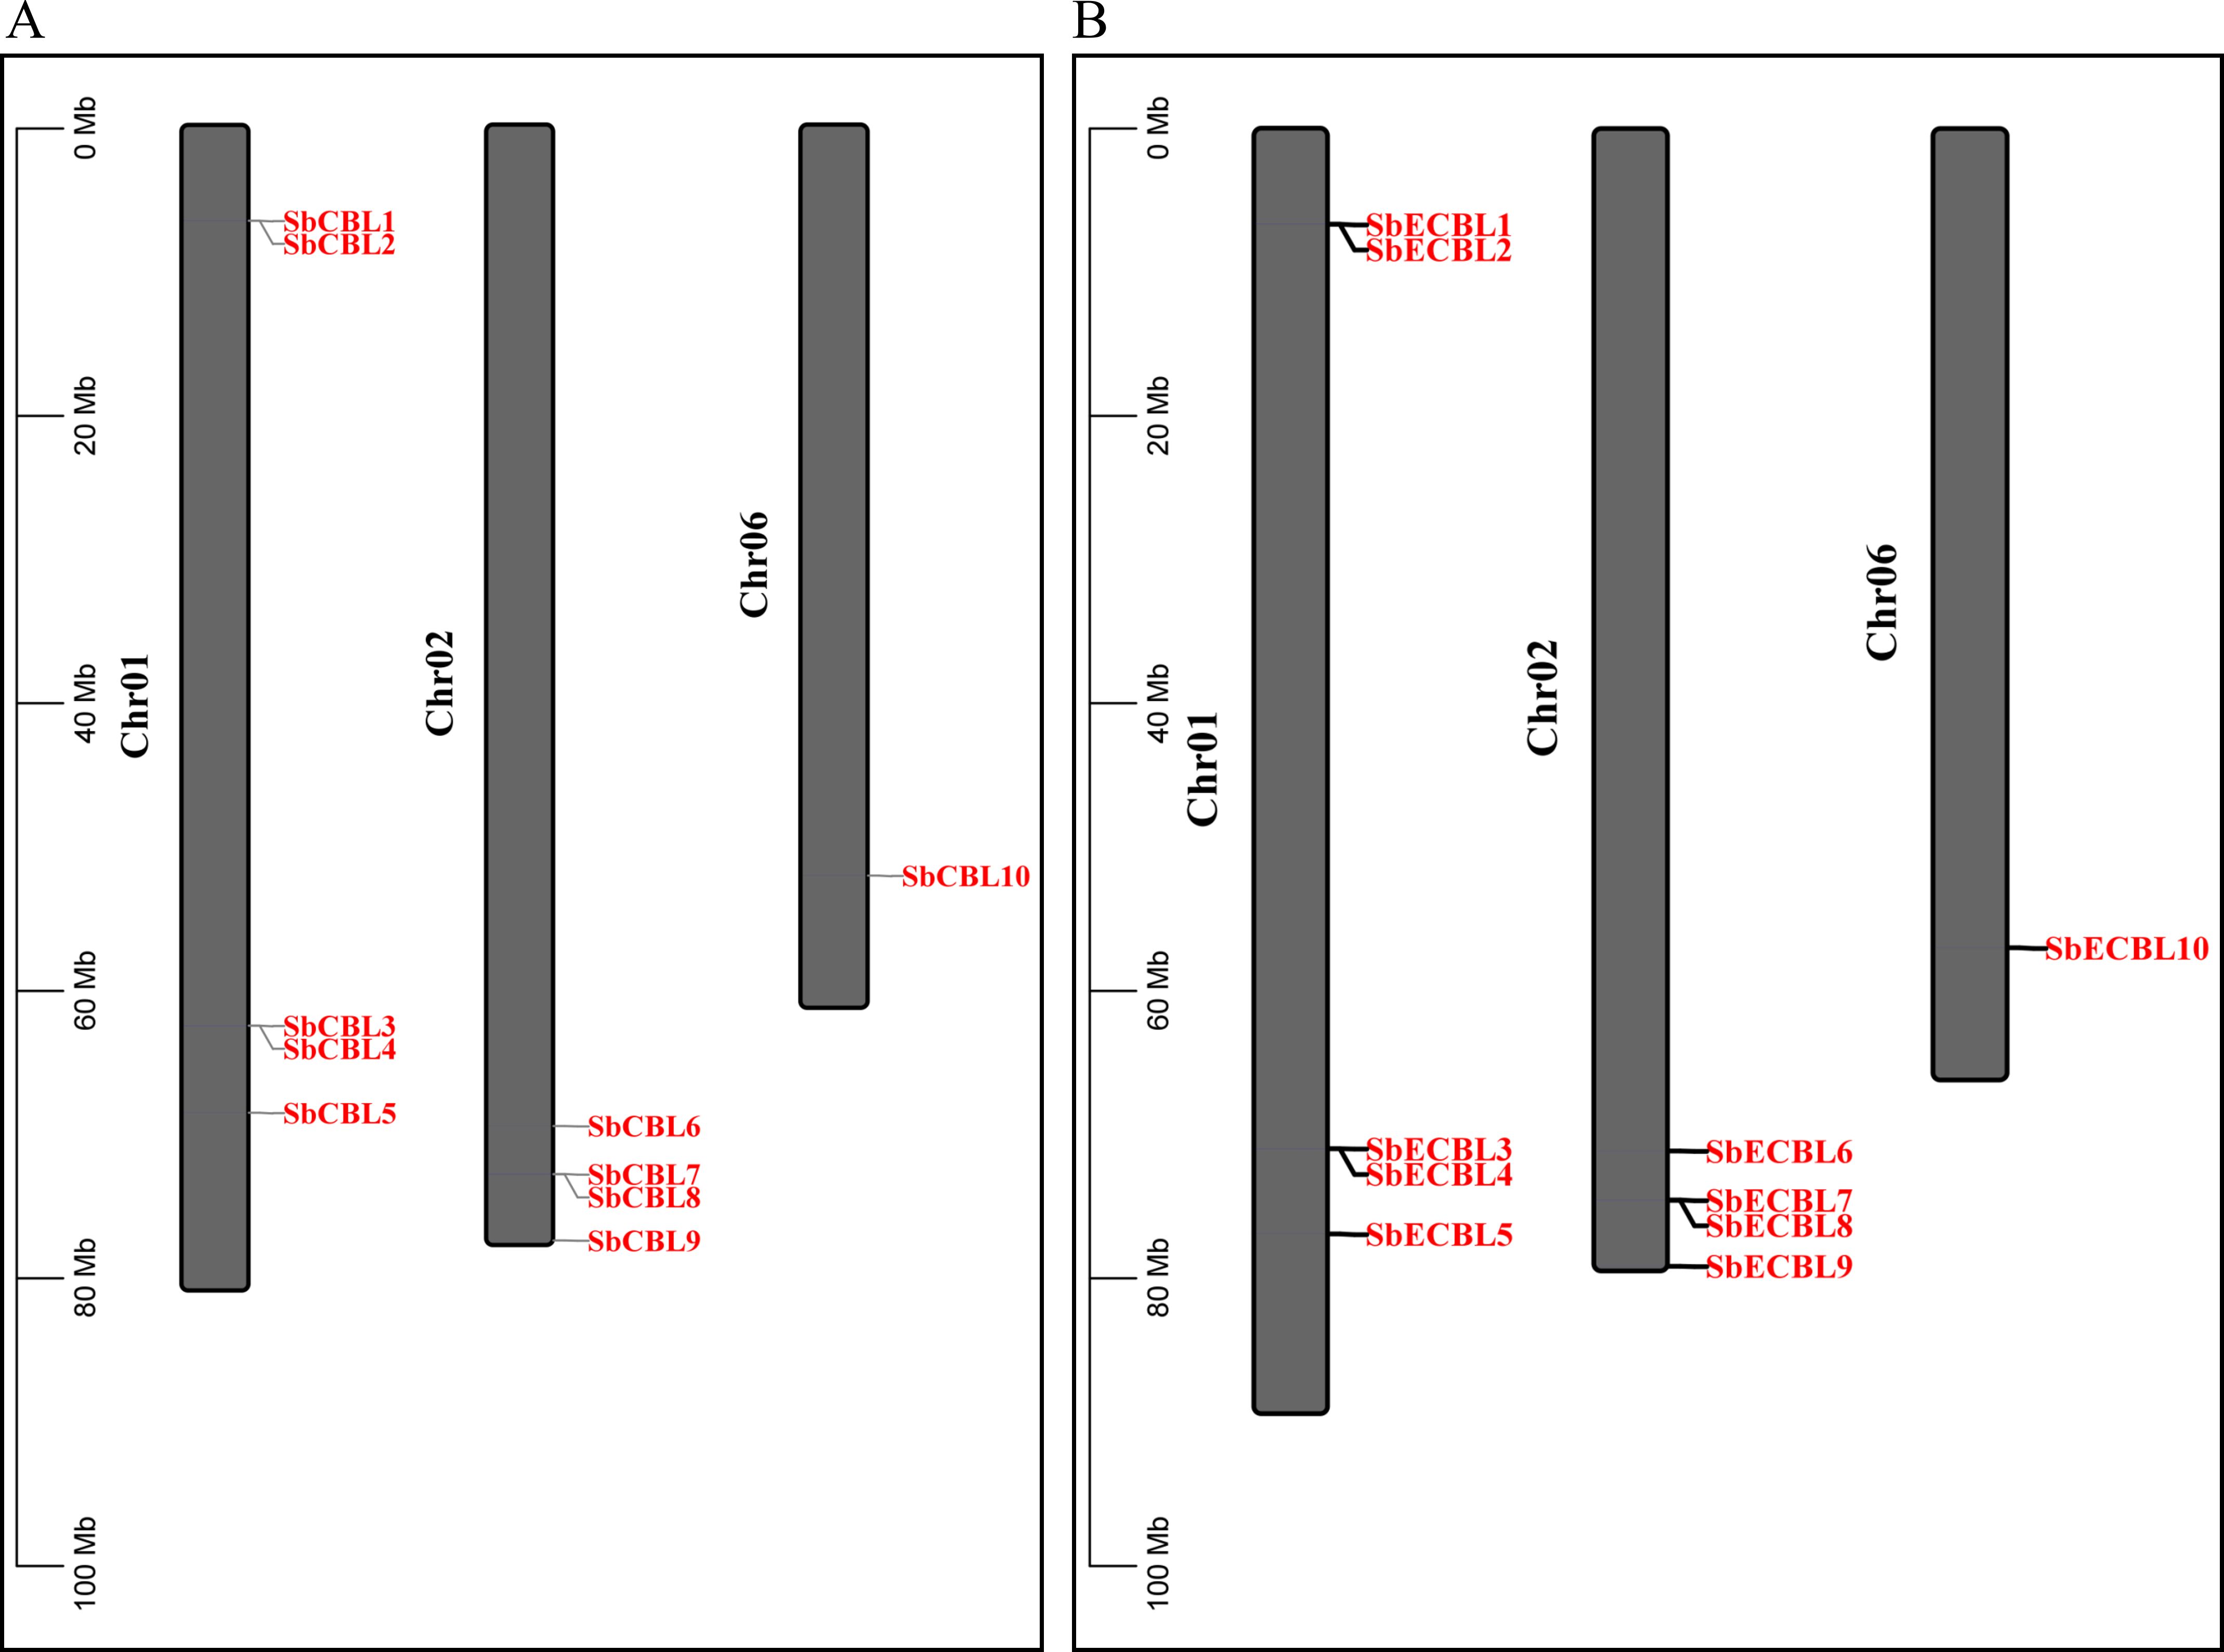
Figure 1. Chromosomal distribution of CBL genes in S. bicolor. (A) Chromosomal distribution of CBL genes in S. bicolor BTx623. (B) Chromosomal distribution of CBL genes in S. bicolor E048.
This study systematically analyzed the amino acid length, molecular weight, isoelectric point, instability index, and hydrophilicity of these members. The results showed that the lengths of the amino acid sequences encoded by the S. bicolor CBL gene family members differed significantly. For instance, SbCBL1 encodes 187 amino acids, whereas SbCBL7 encodes a protein consisting of 673 amino acids (Figure 2A). Additionally, the amino acid lengths of CBL homologous genes differed between the two S. bicolor varieties. For instance, SbCBL9 corresponds to SbECBL9, which has 446 and 686 amino acids, respectively. This difference in length may reflect the functional complexity of different members. In terms of molecular weight, members of the S. bicolor CBL gene family exhibited similar diversity. The results showed that family proteins have a wide range of molecular weights. For example, SbCBL1 has a molecular weight of 46.832 kDa, while SbCBL7 has a molecular weight as high as 74.62 kDa. There are also members with a predicted molecular weight of about 36.72 kDa (Figure 2B). This difference in molecular weight may be closely related to the structural and functional diversity of the proteins. Notably, 70% of the SbCBL gene family members in Sorghum bicolor exhibit an isoelectric point (pI) exceeding 7. This prevalence of basic pI values underscores the potential functional adaptations of these proteins for operating in alkaline cellular environments or interacting with negatively charged macromolecules (Figure 2C). Additionally, 70% of SbCBL proteins were predicted to be unstable (PI ≥ 40), while 30% were stable (Figure 2D). This result establishes a foundation for the subsequent in-depth study of this family’s protein functions. Through computational predictions of subcellular localization, all members of the SbCBL protein family exhibited exclusive targeting to the plasma membrane, indicating a highly conserved localization pattern. This striking uniformity in membrane association strongly suggests that SbCOBL proteins may play specialized roles in cell wall-plasma membrane interactions, potentially regulating cellulose deposition patterns or mediating mechanical stress responses at the cell surface.
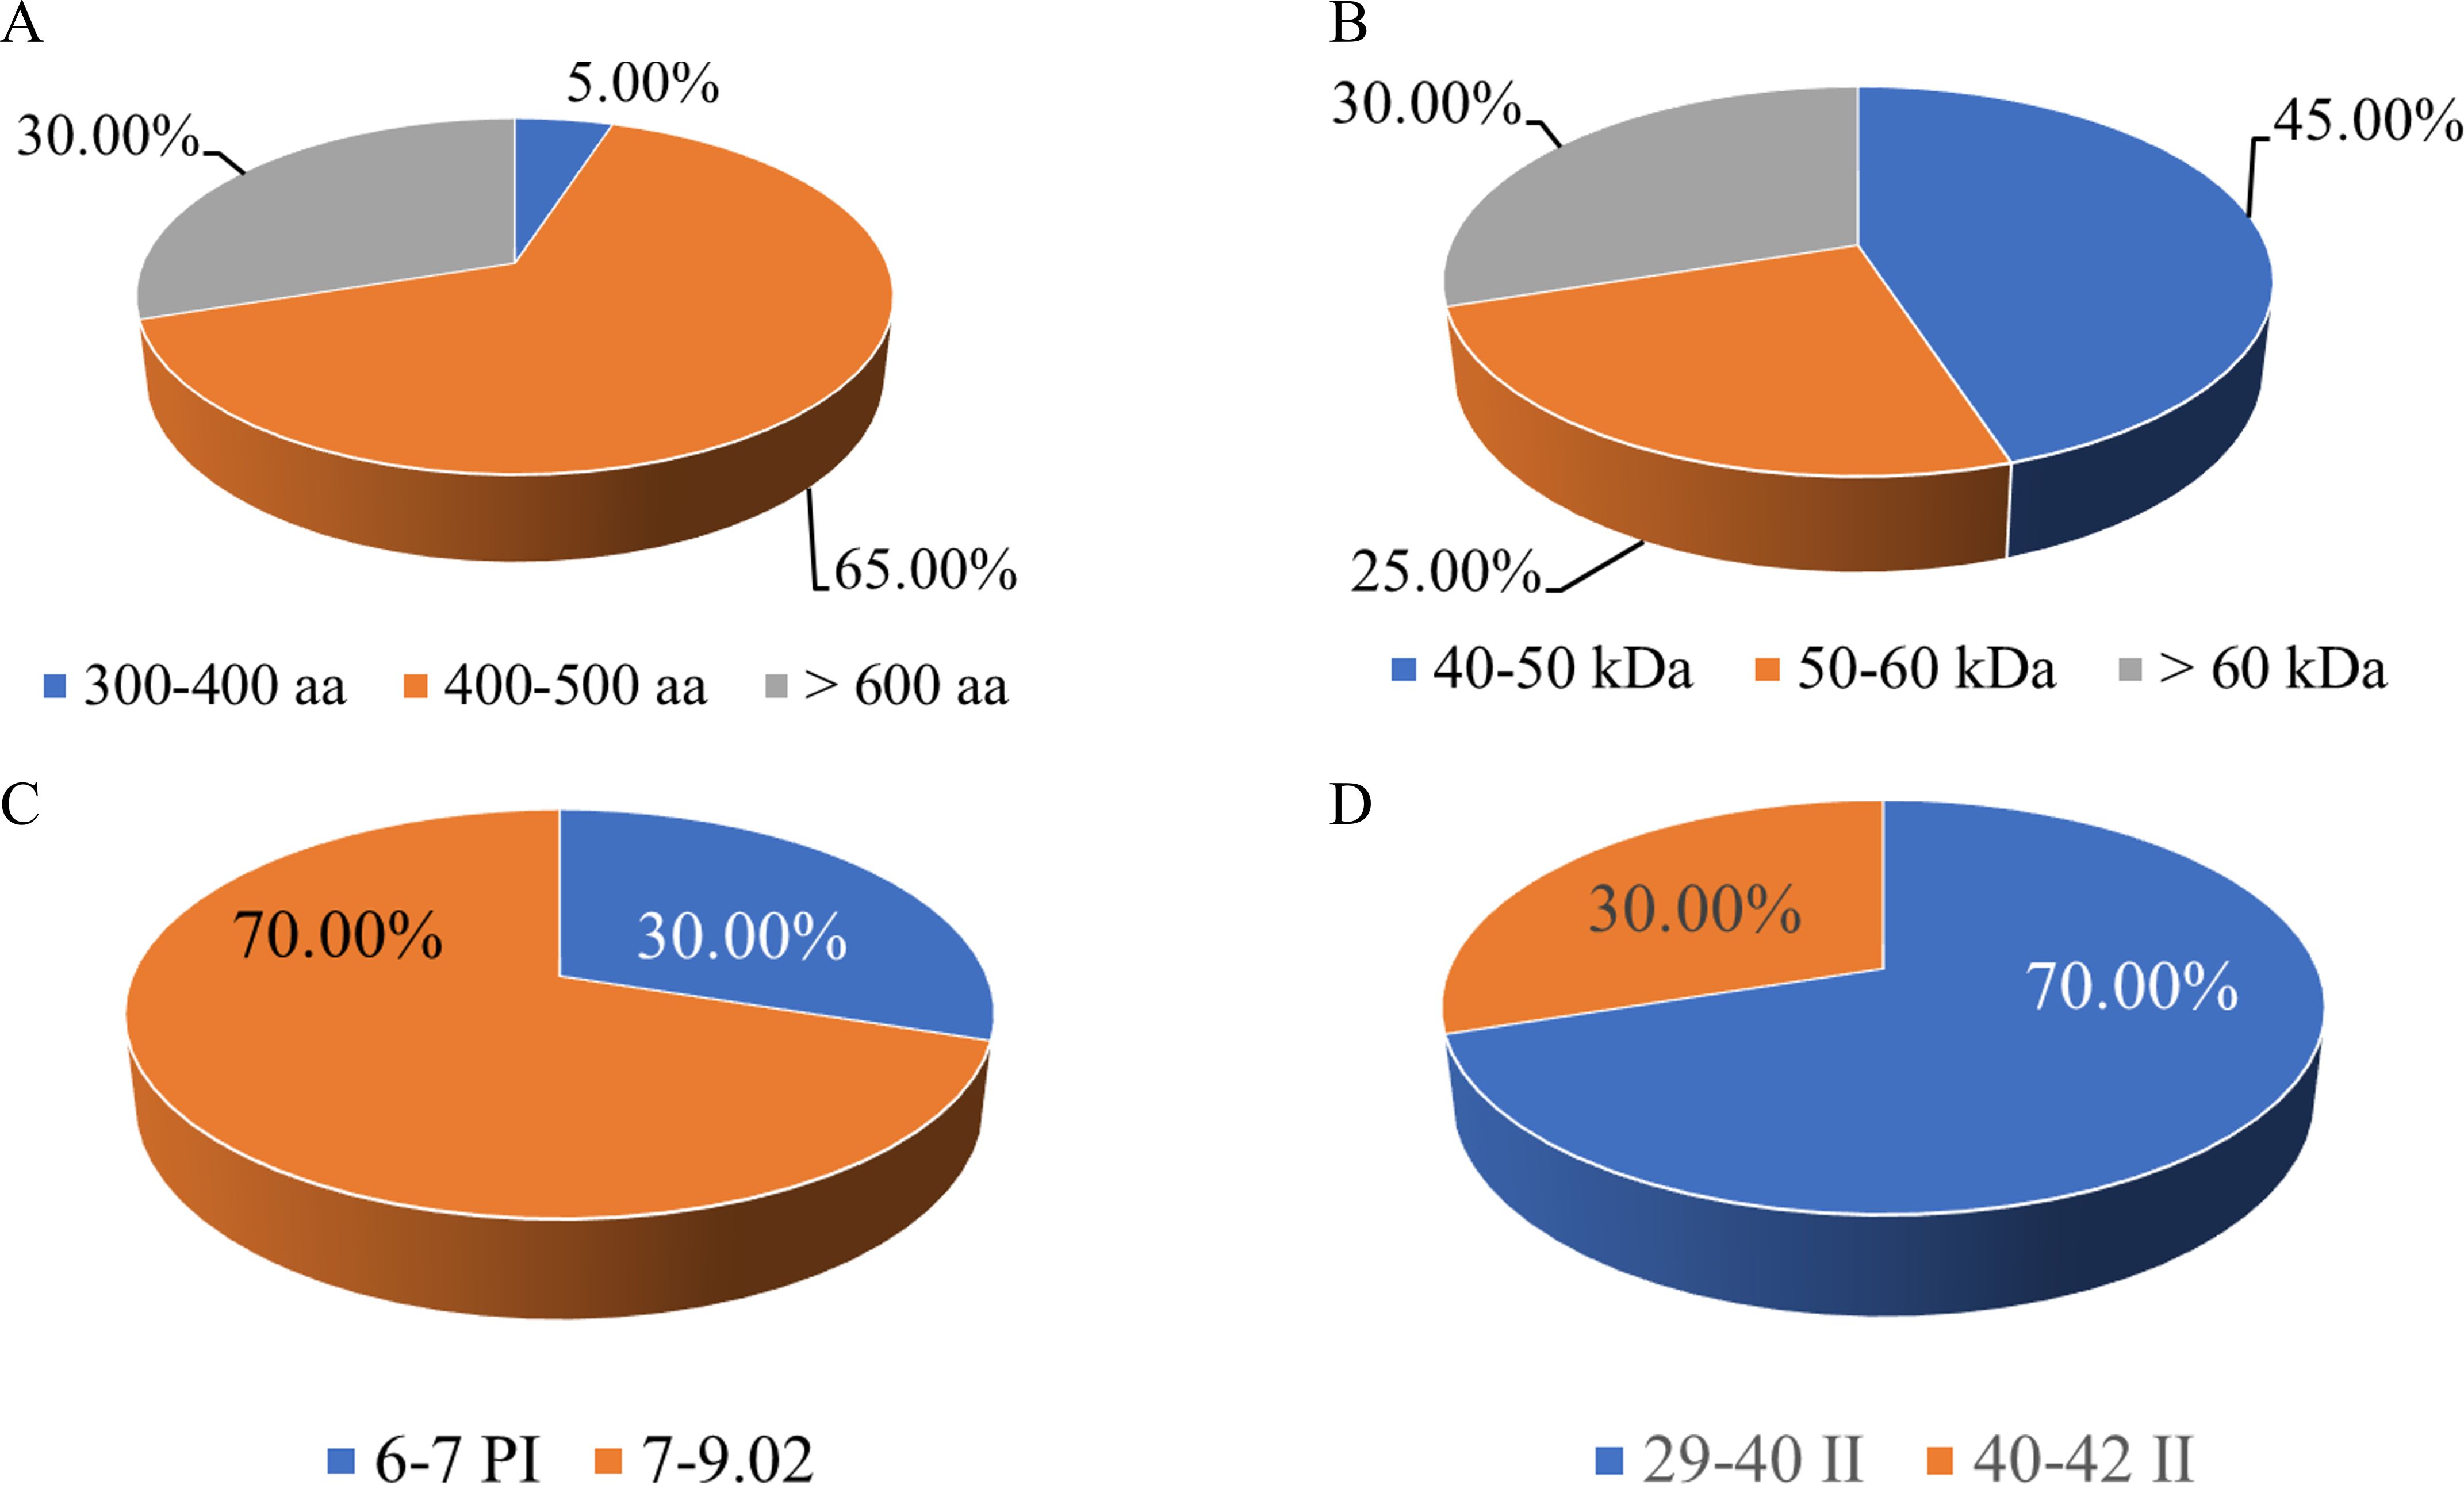
Figure 2. Analysis of physicochemical properties of S. bicolor CBL protein. (A) Statistics of amino acid length of S. bicolor CBL protein. (B) Statistics of molecular weights of S. bicolor CBL protein. (C) Statistics of Isoelectric point of S. bicolor CBL protein. (D) Statistics of Instability Index of S. bicolor CBL protein.
3.2 Systematic evolutionary analysis
To resolve the evolutionary classification of the S. bicolor CBL gene family, this study used MEGA 7.0 software to conduct a phylogenetic analysis of the amino acid sequences of 10 SbCBL and 10 SbECBL members. The results showed that the CBL proteins of the two S. bicolor varieties can be categorized into three subfamilies: Group I, Group II, and Group III (Figure 3A). Group I contains 12 members: SbCBL1, SbCBL2, SbCBL3, SbCBL4, SbCBL7, SbCBL8, SbECBL1, SbECBL2, SbECBL3, SbECBL4, SbECBL7, and SbECBL8. Group II includes SbCBL10 and SbECBL10, and Group III includes SbCBL5, SbCBL6, SbCBL9, SbECBL5, SbECBL6, and SbECBL9.
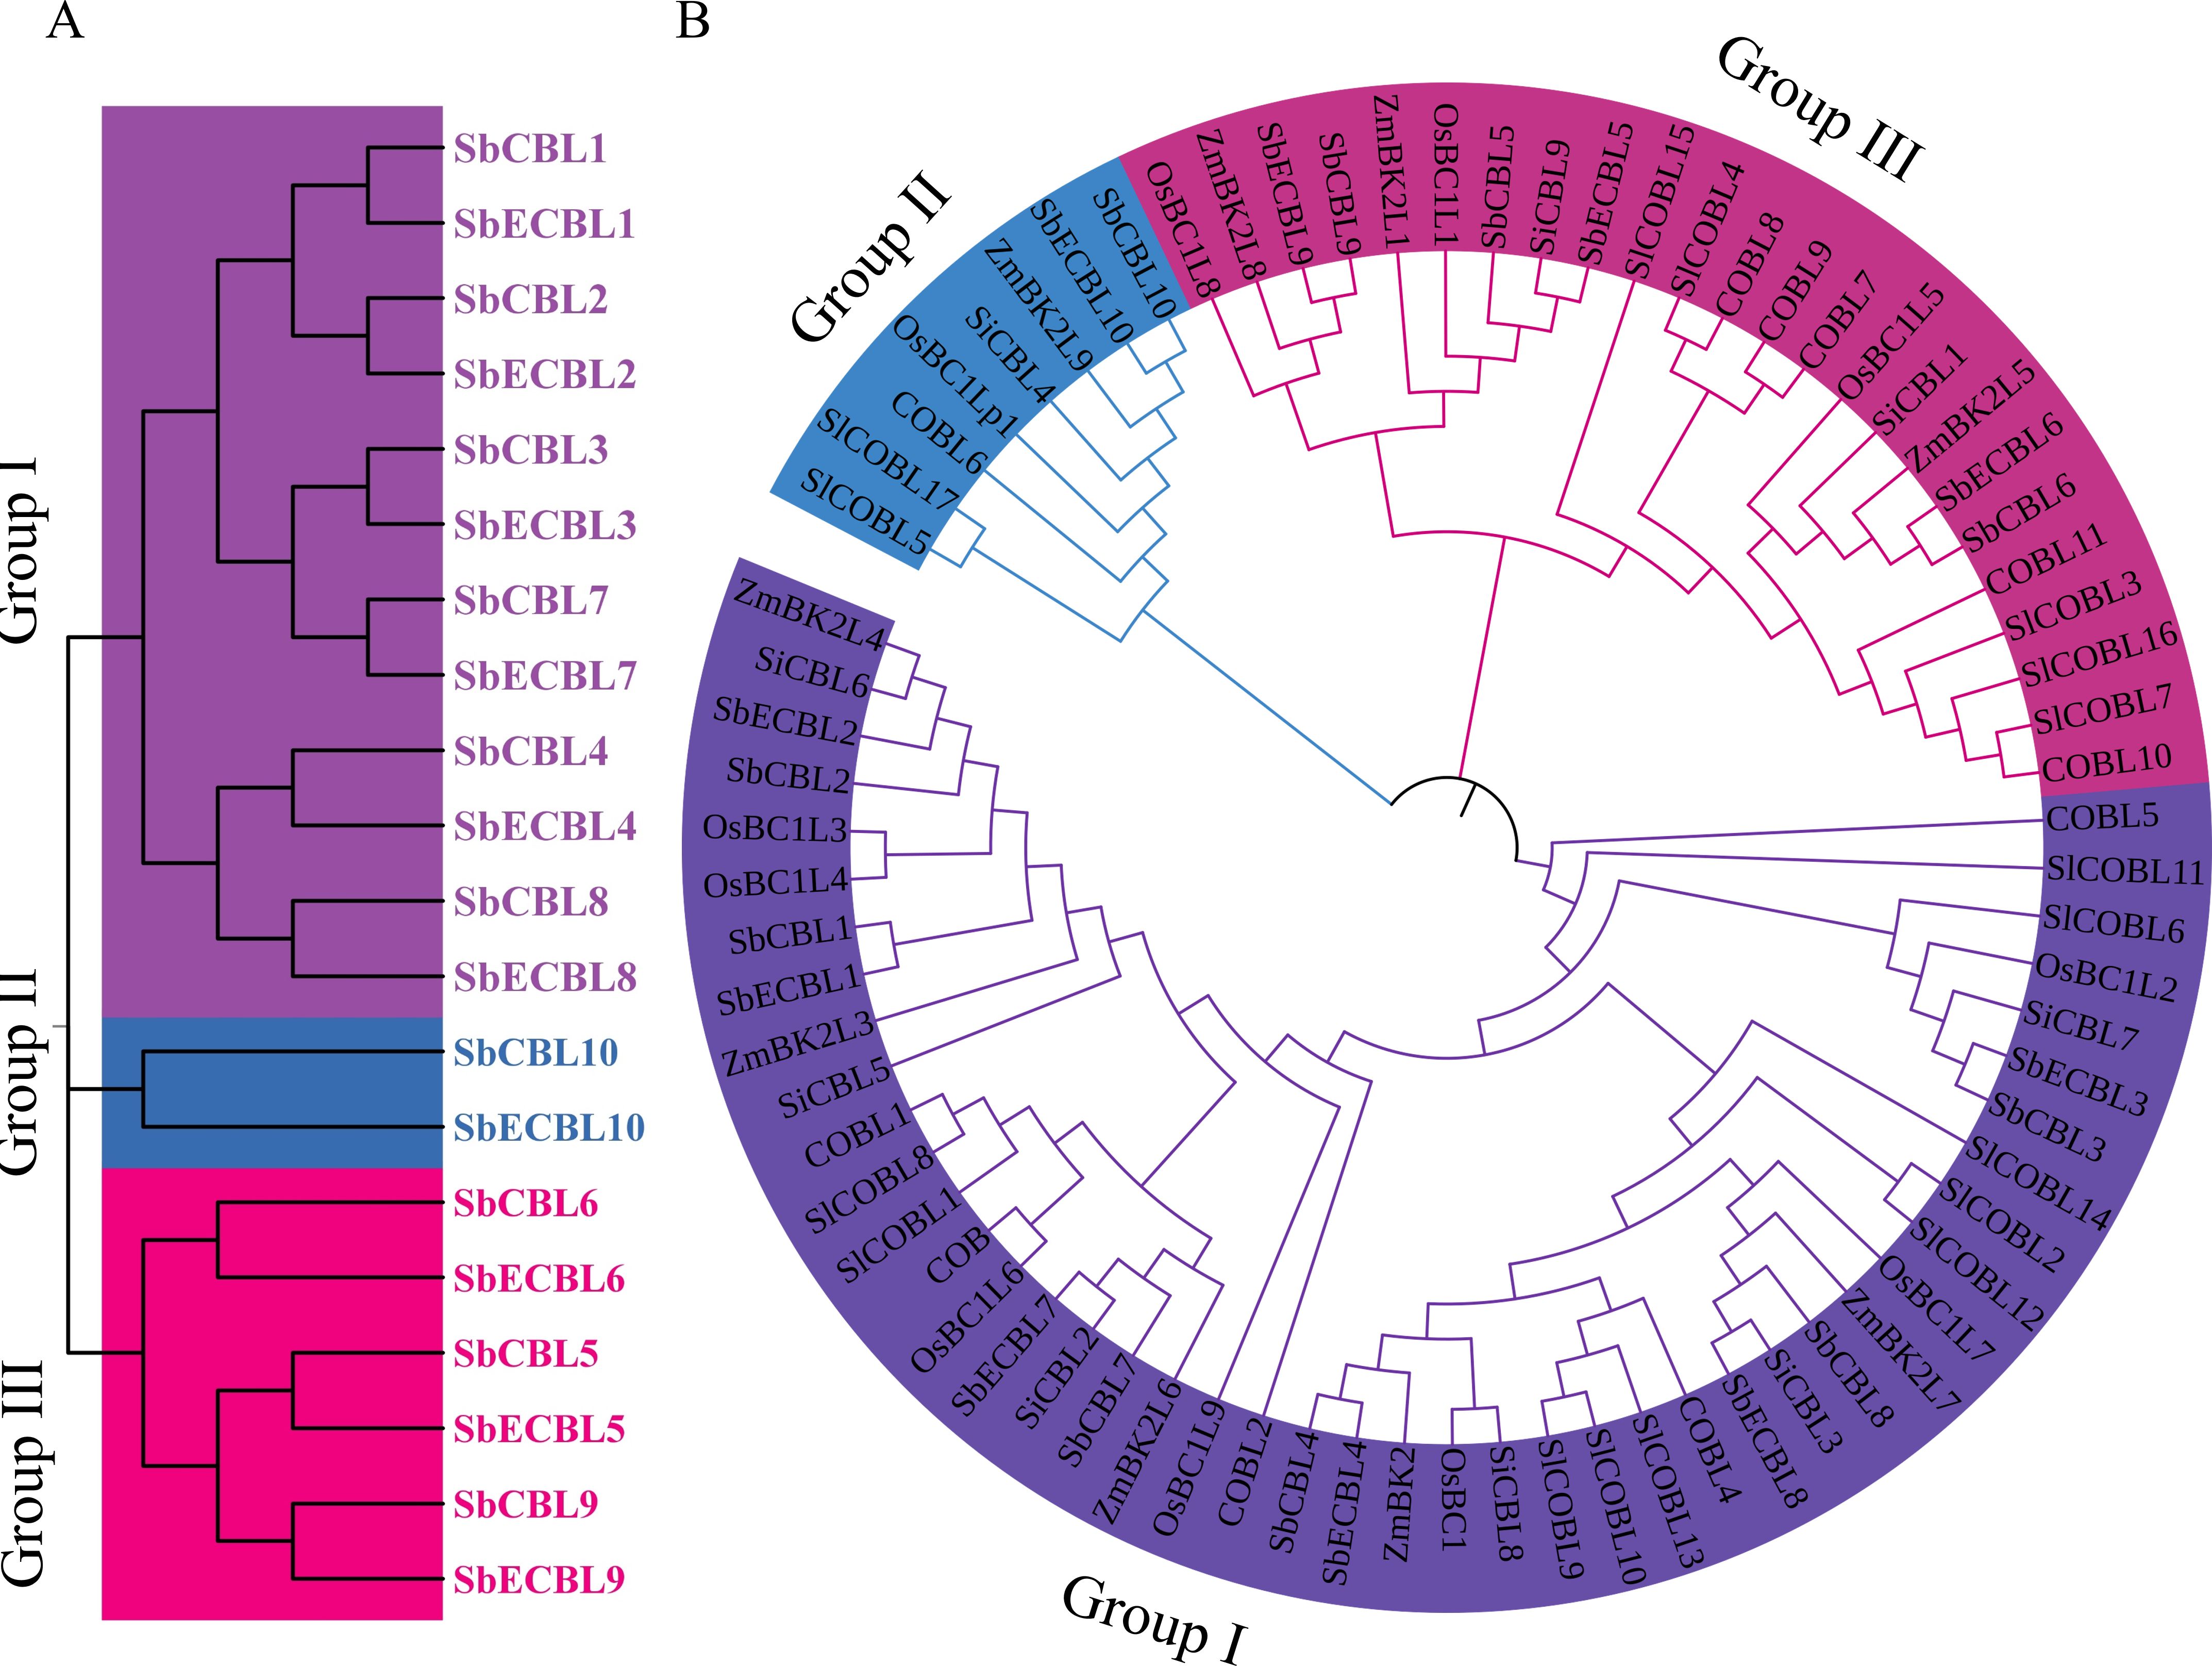
Figure 3. Phylogenetic analysis of CBL proteins. (A) Phylogenetic analysis of CBL proteins in S. bicolor. The evolutionary tree was constructed using the neighbor-joining (NJ) method with 1,000 bootstrap replicates in MEGA 7. CBL proteins were classified into three subfamilies: Group I, Group II, and Group III, represented by purple, blue and pink branches, respectively. (B) Phylogenetic analysis of CBL proteins in S. bicolor, A thaliana, S. lycopersicum, O. sativa, S. italica and Z. mays. The evolutionary tree was constructed using the neighbor-joining (NJ) method with 1,000 bootstrap replicates in MEGA 7. CBL proteins were classified into three subfamilies: Group I, Group II, and Group III, represented by purple, blue and pink branches, respectively.
To further elucidate the phylogenetic position of the S. bicolor CBL genes, this study integrated CBL protein sequences from S. bicolor, A. thaliana, S. lycopersicum, O. sativa, S. italica and Z. mays for a multiple comparison analysis (Figure 3B). Phylogenetic trees constructed using the neighbor-joining method showed that the CBL genes of all species could be divided into three significant branches (Figure 4B). Group I mainly included six SbCBLs, six SbECBLs, five AtCBLs, ten SlCBLs, seven OsCBLs, five ZmCBLs, and six SiCBLs. Group II mainly consisted of three SbCBLs, three SbECBLs, five AtCBLs, five SlCBLs, three OsCBLs, three ZmCBLs, and two SiCBLs. Group III mainly consisted of one SbCBL, one SbECBL, one AtCBL, two SlCBLs, one OsCBL, one ZmCBL, and one SiCBL. The results of the phylogenetic analysis showed that the S. bicolor CBL gene family has evolved to be related to CBL genes from other plants while maintaining its own specificity. ZmBk2L3, a COBRA family protein, functions in the regulation of cell wall dynamics and carbohydrate partitioning (Julius et al., 2021). Phylogenetic analysis revealed that its clustering with SbCBL1/2 and SbECBL1/2 suggests involvement in cell membrane-associated signaling or cell wall modification via similar mechanisms. ZmBk2 maintains the flexibility of plant organs by modulating the lignin-cellulose interaction pattern (Sindhu et al., 2007). Additionally, phylogenetic analyses revealed that ZmBk2 clusters with SbECBL4 and SbCBL4, indicating that the protein may perform similar functions via conserved molecular mechanisms.
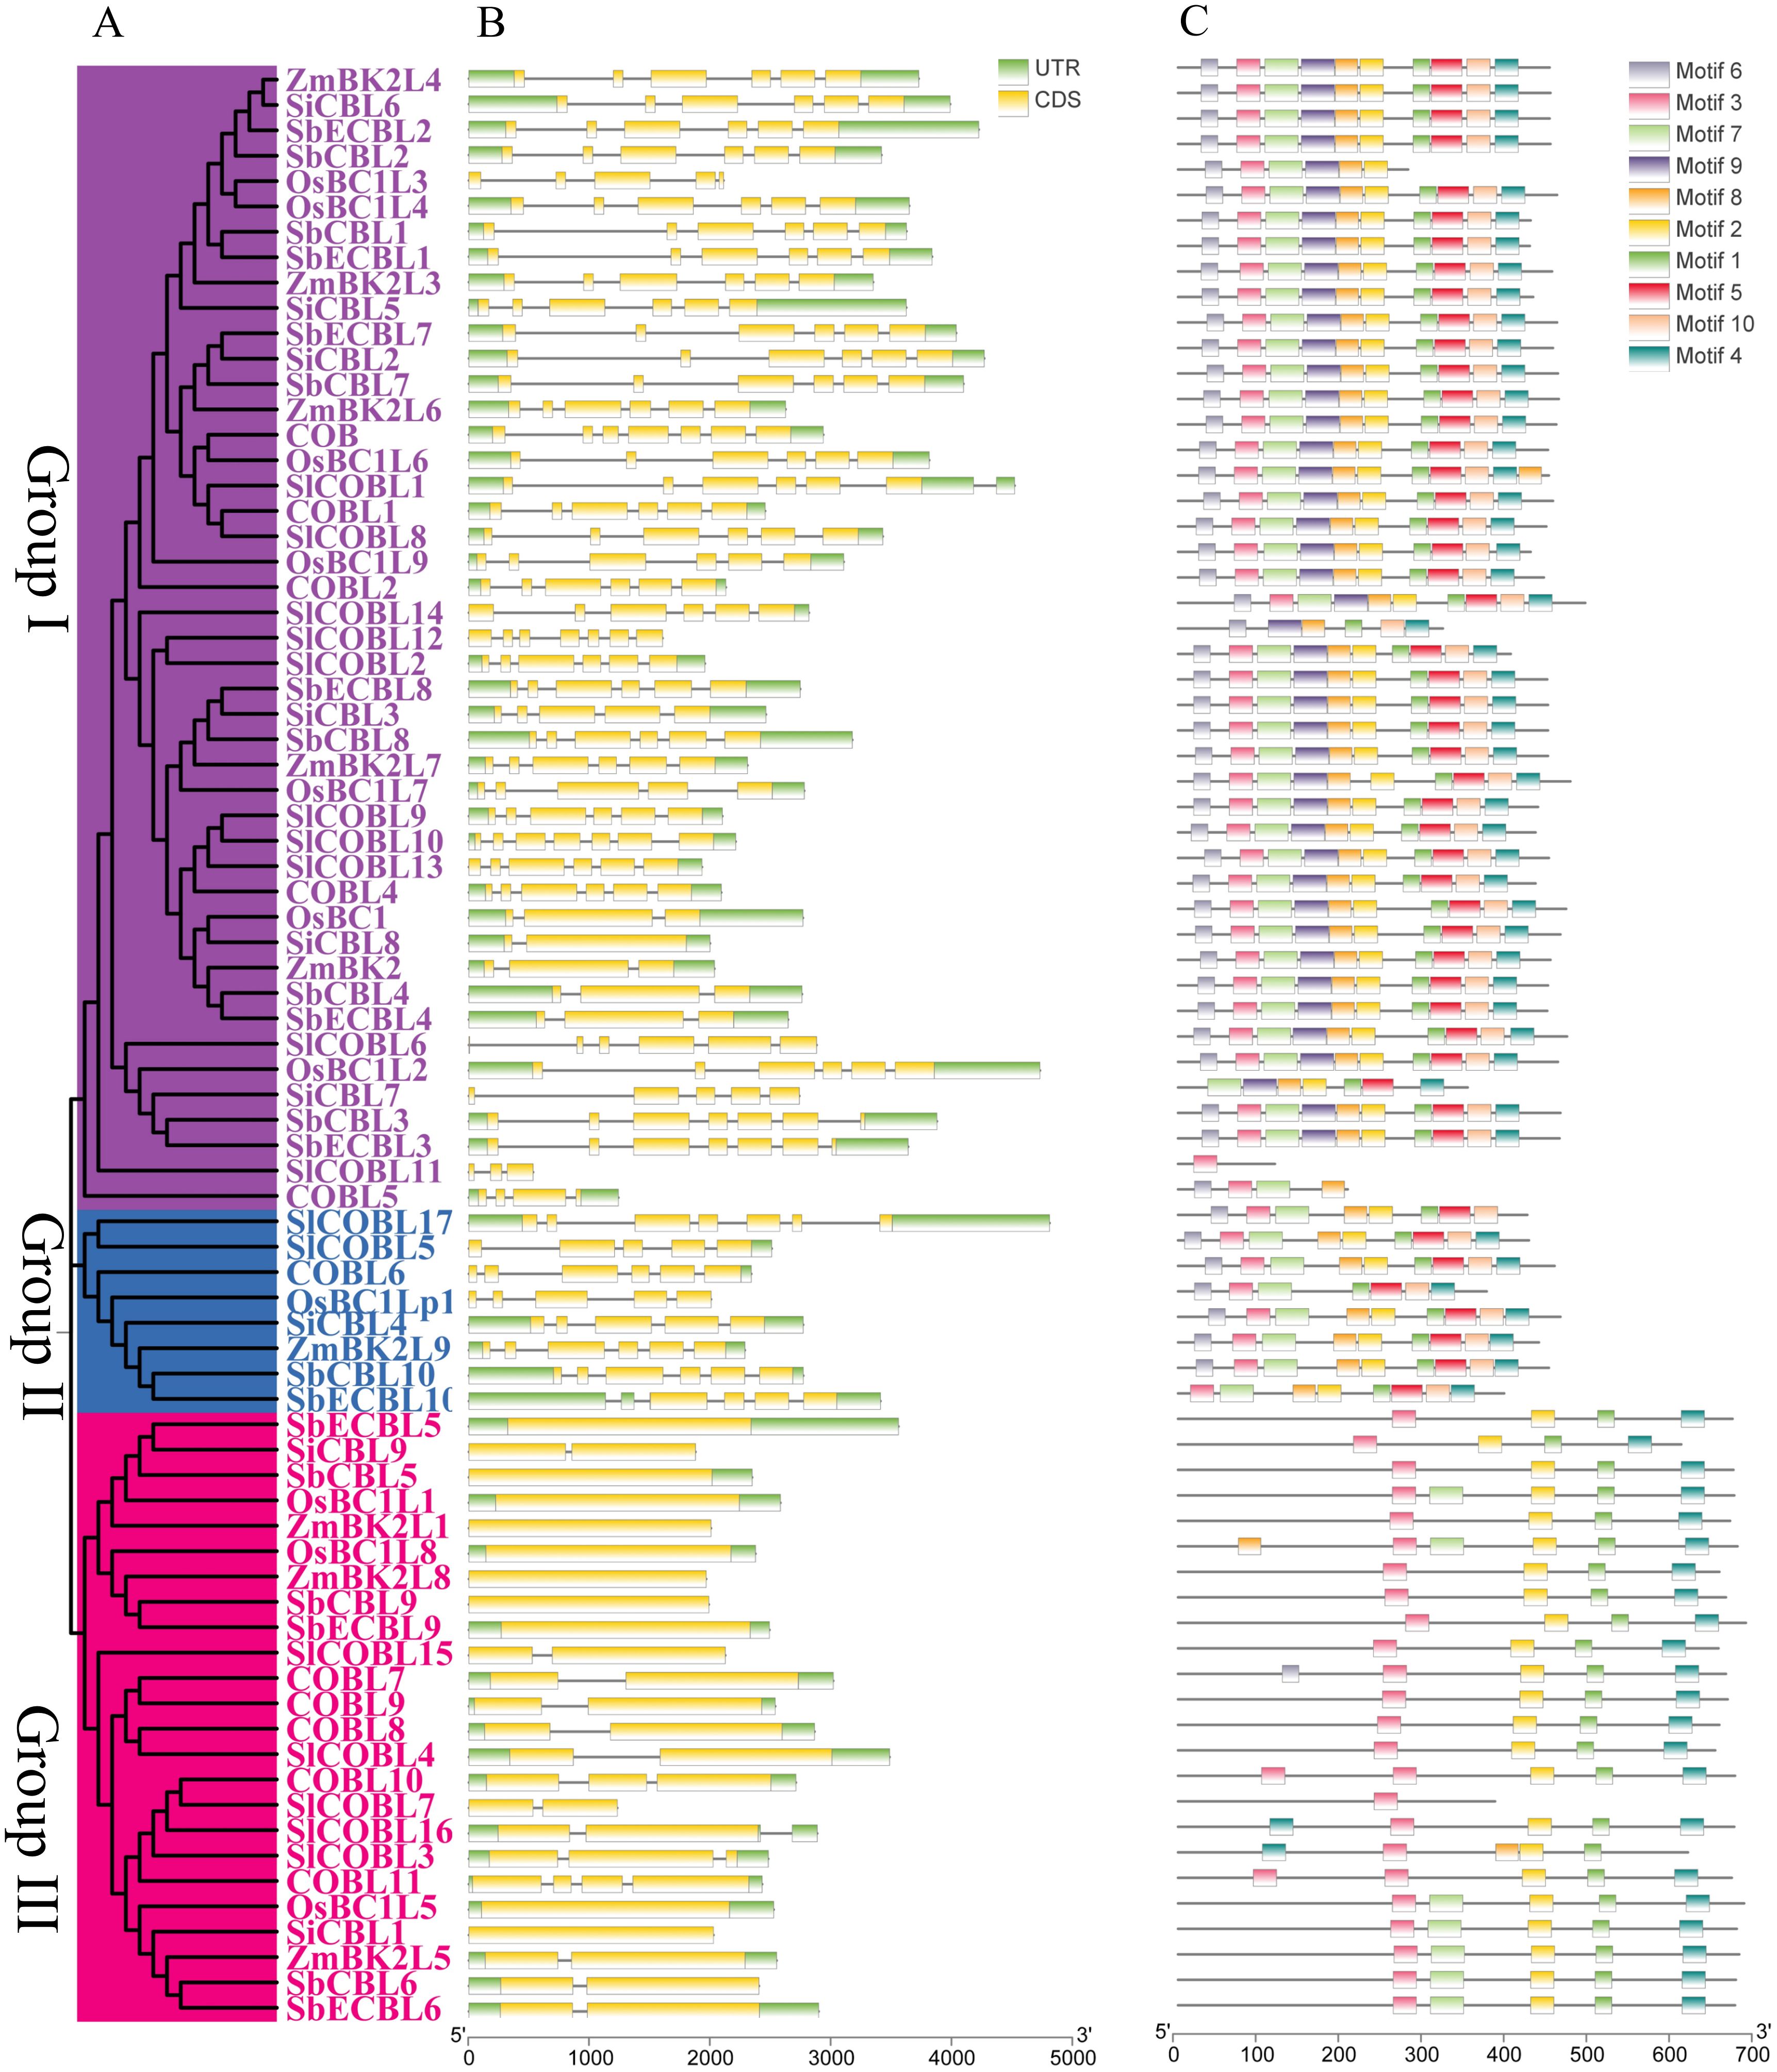
Figure 4. Phylogenetic, conserved motif, domain, and gene structure analysis of S. bicolor, A thaliana, S. lycopersicum, O. sativa, S. italica and Z. mays CBL proteins. (A) Phylogenetic analysis of S. bicolor, A thaliana, S. lycopersicum, O. sativa, S. italica and Z. mays CBL proteins. The neighbor-joining (NJ) tree was constructed using MEGA 7 with 1,000 bootstrap replicates. (B) Intron-exon structure of S. bicolor, A. thaliana, S. lycopersicum, O. sativa, S. italica and Z. mays CBL genes. Visualization was performed using TBtools. (C) Conserved motif analysis of S. bicolor, A. thaliana, S. lycopersicum, O. sativa, S. italica and Z. mays CBL proteins. Ten motifs were identified using the online tool MEME with default parameters.
3.3 Gene structure and conserved motif characterization
A gene structure and conserved Motif analysis of S. bicolor CBL genes revealed significant structural and functional differences. Gene structure revealed notable variations in exon-intron structure among different subgroups. Specifically, members of subgroup I have three to seven exons and exhibit structural diversity. Members of subgroup II, such as SbCBL10 and SbECBL10, have six and four exons, respectively. Notably, subgroup III members have a more concise gene structure with only one or two exons. This diversity in gene structure may be closely related to functional differentiation and the evolutionary history of genes (Figures 4A, B). Different exon-intron structures may lead to variations in gene transcription and translation processes, which may affect gene function and expression regulation.
Conserved motif analysis performed by MEME Suite 5.5.3 identified a total of 10 characteristic motifs (Motif1-Motif10). Systematic analysis revealed that all motifs were intact in subgroup I, suggesting that these core elements may collectively maintain the basal biological functions of CBL proteins. Subgroup II exhibited a distinct motif deletion pattern: SbCOBL10 lacked Motif9, and SbECOBL10 lacked Motifs 1 and 9 (Figure 4C). Members of the third subgroup contained only Motifs 1, 2, 3, and 4, which were distributed in a manner that may be related to the functional differentiation of gene family members. The distribution of motifs 1, 2, 3, and 4 is specific and may be related to the functional differentiation of gene family members (Figure 4C). Analysis of gene structure and conserved motifs revealed that S. bicolor CBL gene family members are structurally conserved yet diverse. These conserved structural features may ensure the gene family’s basic function, while diverse structures provide the basis for the genes’ functional differentiation and evolution, enabling different gene members to play unique roles in S. bicolor growth, development, and environmental adaptation.
3.4 Analysis of duplication events
To reveal the expansion mechanism of the S. bicolor CBL gene family and its evolutionary constraints, this study systematically analyzed the types of replication events and selection pressures that characterize its members. As shown in the Figure 5, tandem duplication (TD) events drove the clustered distribution of CBL3 and CBL4. Meanwhile, Whole Genome Duplication (WGD) events contributed to the generation of two paralogous gene pairs: CBL3/CBL7 and CBL5/CBL9.
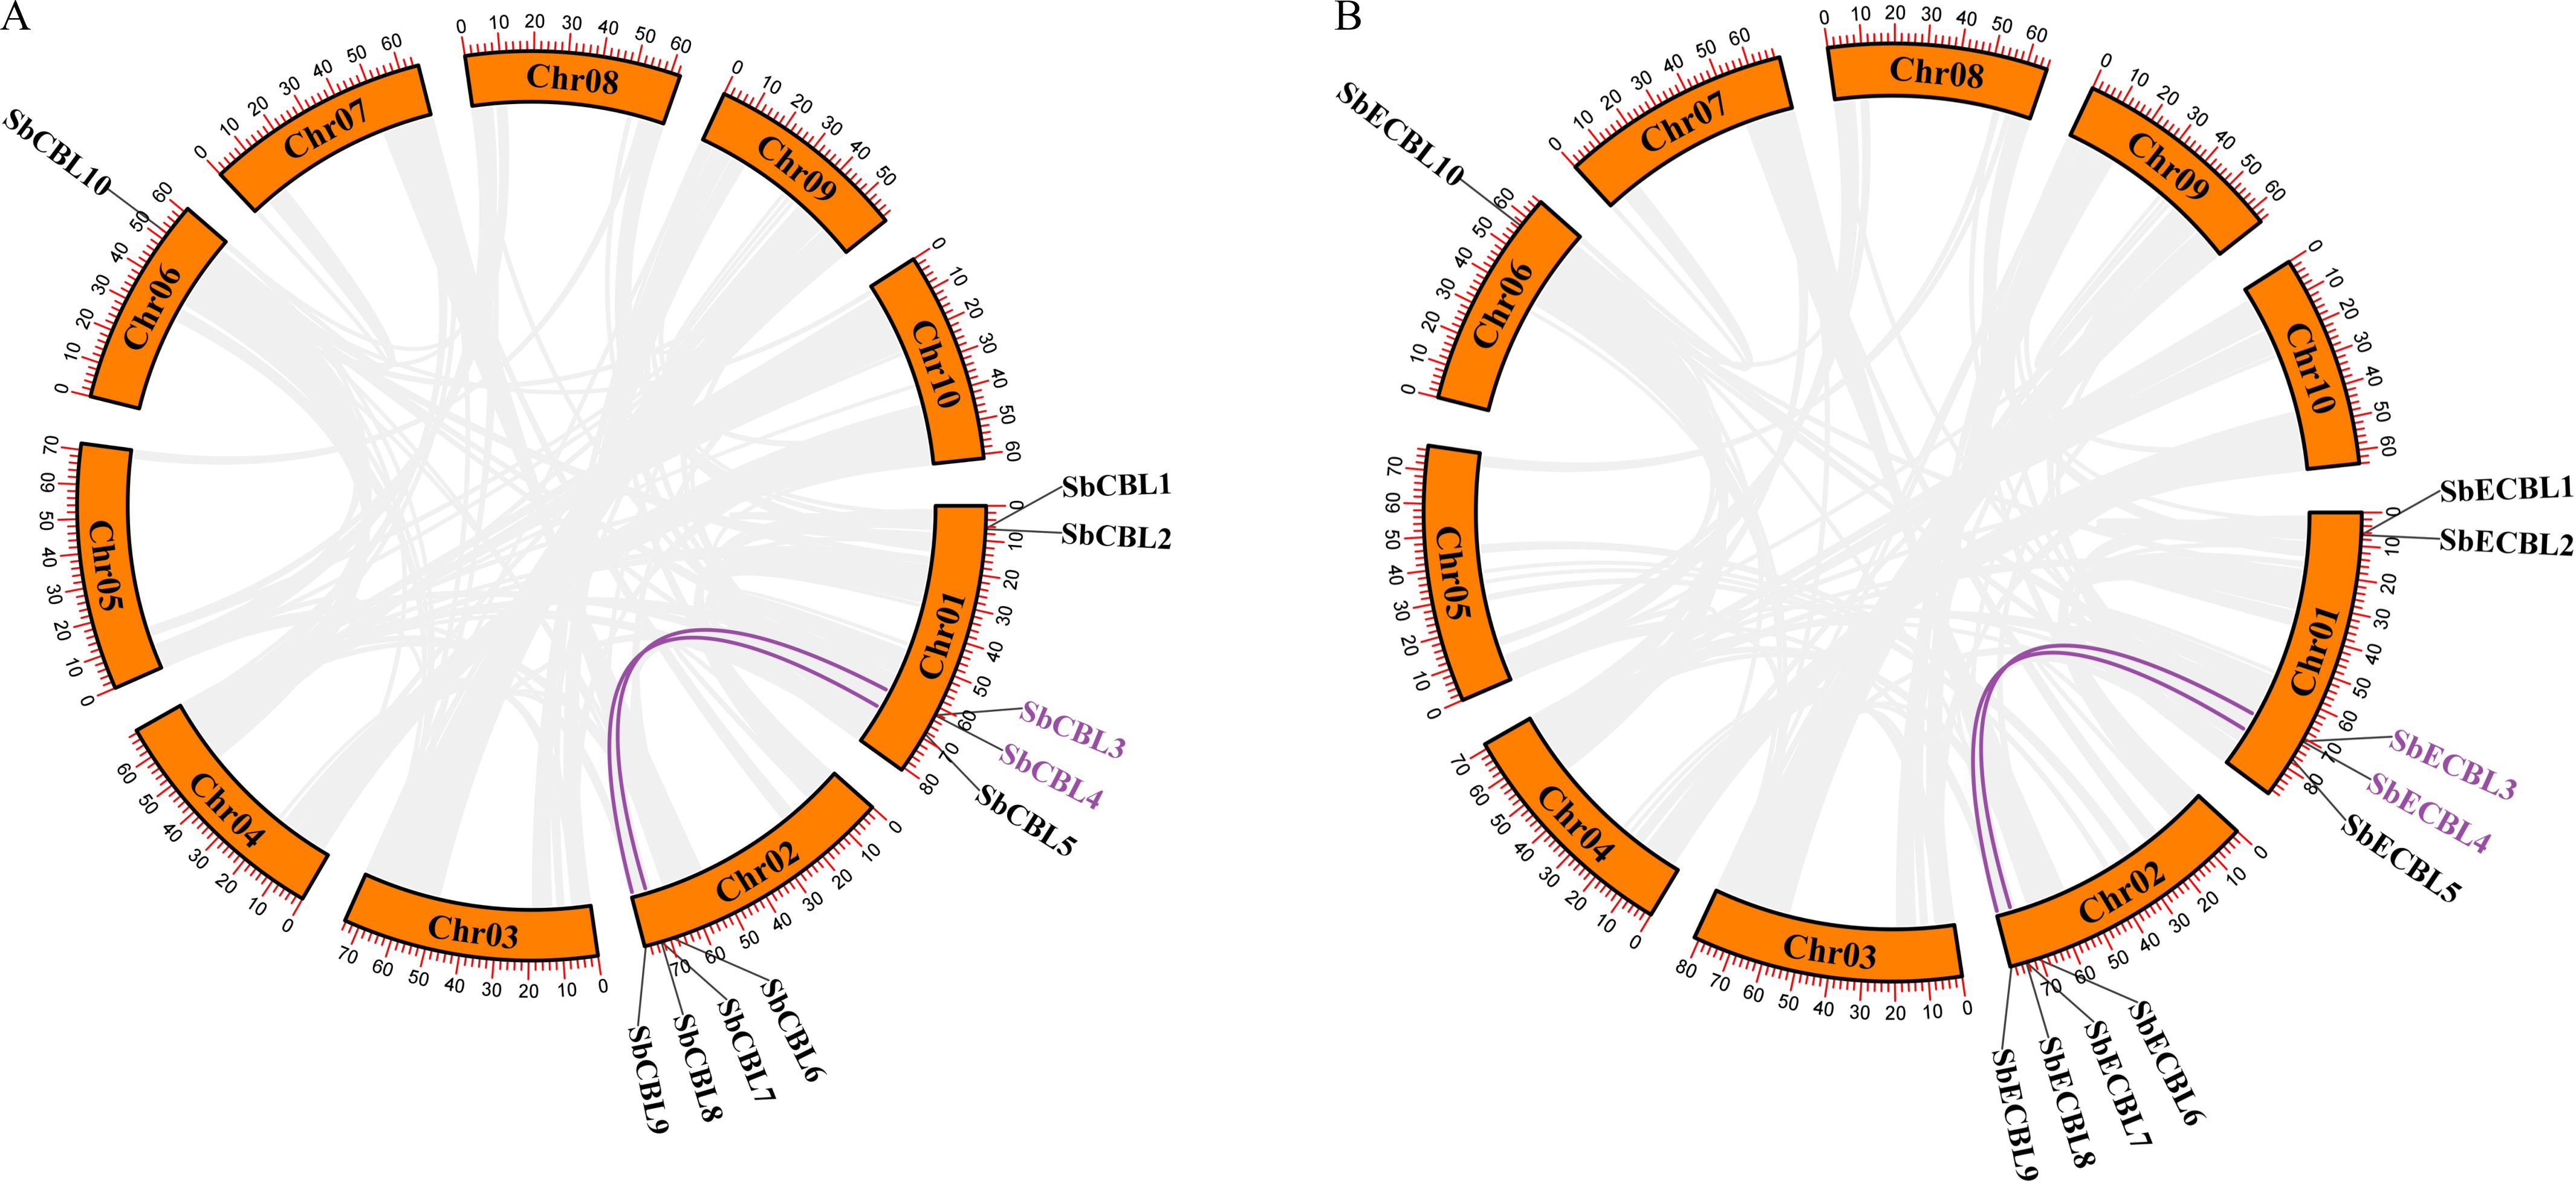
Figure 5. Analysis of gene duplication events of CBL genes in S. bicolor. (A) Gene duplication events of S. bicolor BTx623 CBL genes. Whole-genome duplication (WGD) events are indicated by purple lines, and tandem duplicated genes are labeled with purple gene IDs. (B) Gene duplication events of S. bicolor E048 CBL genes. Whole-genome duplication (WGD) events are indicated by purple lines, and tandem duplicated genes are labeled with purple gene IDs.
Further analysis of the ratio of non-synonymous to synonymous substitution rates (Ka/Ks) revealed that the Ka/Ks values of these replication events were significantly less than one (CBL3/CBL7: Ka/Ks = 0.1; CBL5/CBL9: Ka/Ks = 0.27), suggesting that these genes underwent strong purifying selection (Supplementary Table 2). This indicates that these genes experienced strong purifying selection during evolution.
3.5 Synteny analysis of S. bicolor and other species
To elucidate the evolutionary trajectory of the CBL gene family in S. bicolor, this study performed whole-genome synteny analysis using MCScan X between S. bicolor and representative species, including the dicot model plant A. thaliana, monocot crops O. sativa and S. italica, as well as the solanaceous crop S. lycopersicum. A total of 3 (S. bicolor–A. thaliana), 10 (S. bicolor–S. lycopersicum), 10 (S. bicolor–O. sativa), and 10 (S. bicolor–S. italica) CBL homologous gene pairs were identified (Figure 6). Notably, O. sativa, S. italica and S. bicolor, as closely related species within the Gramineae family, exhibited significantly more syntenic gene pairs than A. thaliana, indicating that the CBL gene family retained higher genomic structural conservation after monocot–dicot divergence. Further analysis revealed “one-to-many” homologous relationships between certain S. bicolor CBL genes and multiple species. For instance, SbCBL3 showed synteny with both SlCBL1 and SlCBL1 in S. lycopersicum. Similarly, SbCBL3 corresponded to three homologs in S. italica (SiCBL2 and SiCBL7) and two in O. sativa (OsCBL1 and OsCBL6).
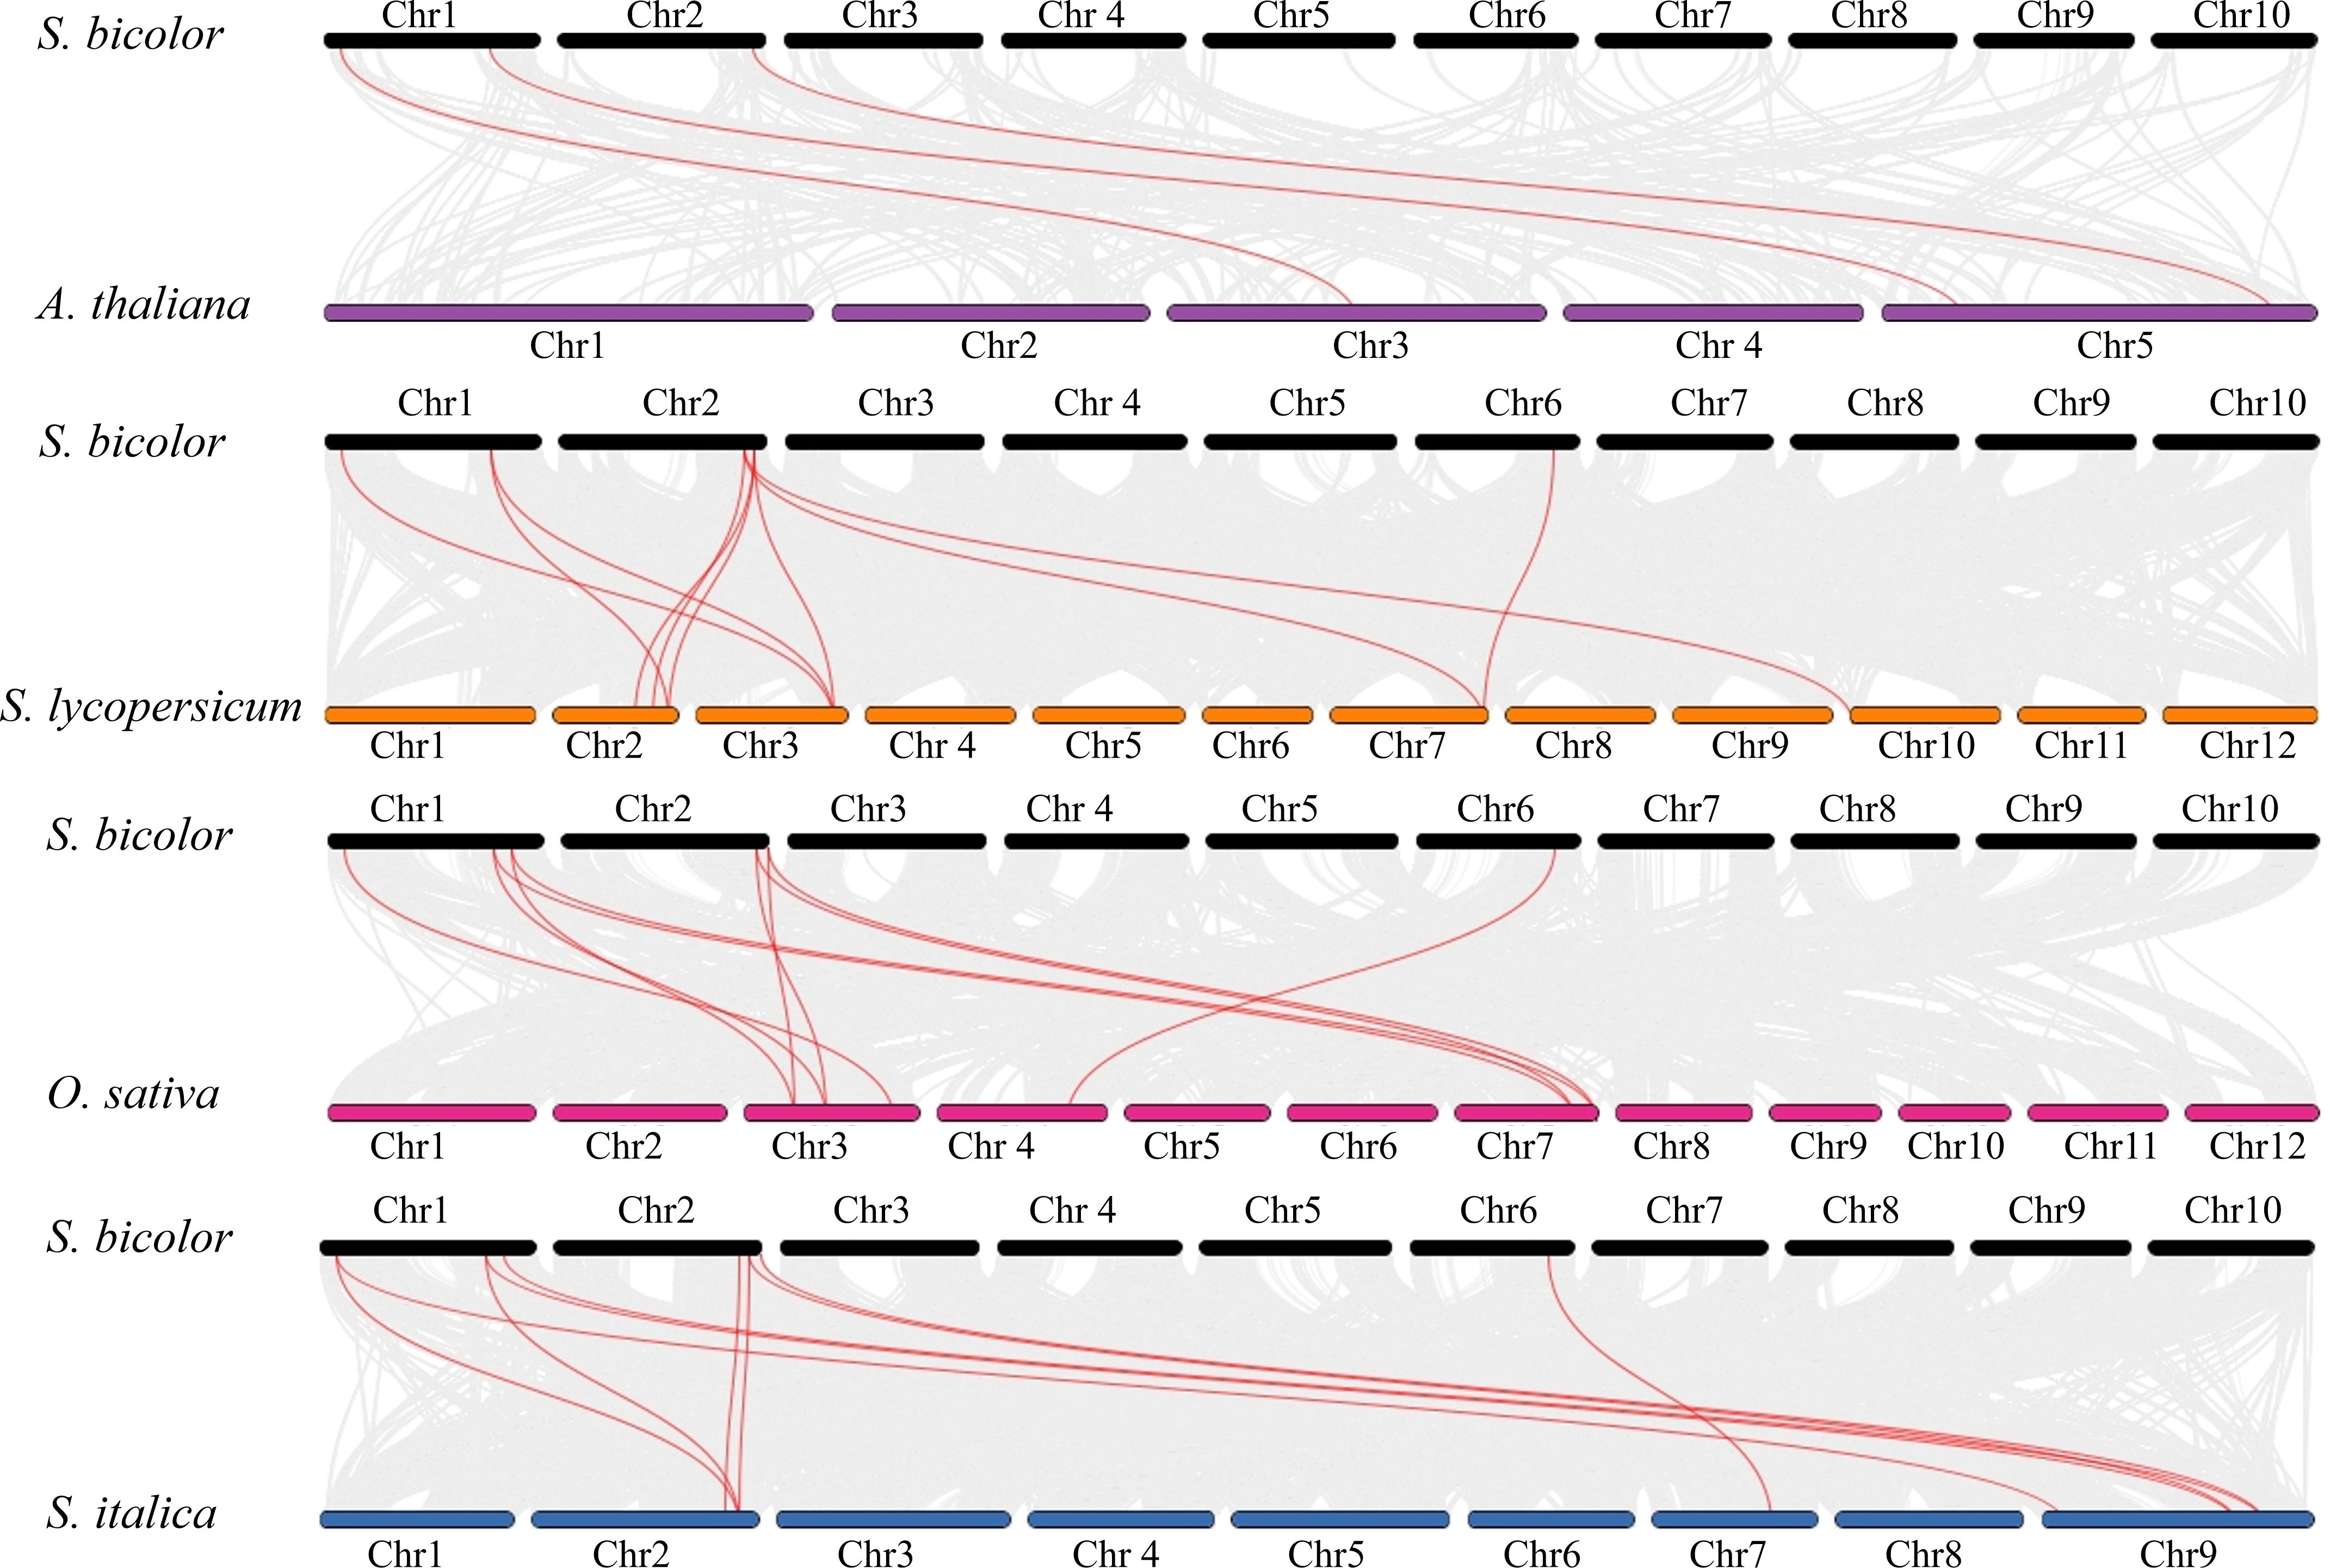
Figure 6. Synteny analysis of CBL genes with other species. Synteny between S. bicolor BTx623 and A. thaliana CBL genes. Synteny between S. bicolor and S. lycopersicum CBL genes. Synteny between S. bicolor and O. sativa CBL genes. Synteny between S. bicolor and S. italica CBL genes.
3.6 Analysis of promoter cis-acting elements of the S. bicolor CBL gene family
To analyze the transcriptional and regulatory features of the S. bicolor CBL gene family, this study systematically analyzed the cis-acting elements in the upstream promoter region (2,000 bp prior to the transcriptional start site) of the gene using the PlantCARE database. The results showed that the CBL gene promoter region contained abundant regulatory elements, mainly categorized into four groups: hormone response, abiotic stress response, light signaling regulation, and growth and development (Figure 7; Supplementary Table 3). All members carried abscisic acid (ABA) response elements (ABRE, ACGTG) and methyl jasmonate (MeJA) response elements (TGACG motif, TGACG), indicating that the S. bicolor CBL gene family may be involved in regulating adversity acclimatization through ABA and MeJA signaling pathways. Additionally, some members contained cis-regulatory elements related to growth hormones, salicylic acid, and gibberellin, implying that these members may be involved in multiple stress responses through hormone crosstalk. Abiotic stress response elements included the drought response element MBS (CAACTG), the low temperature response element LTR (CCGAAA), the anaerobic-induced element ARE (AAACCA), and the mechanical damage response element. Members of subgroup III (e.g., SbCBL7/9) showed a notably high frequency of the low-temperature response element LTR (CCGAAA) in the promoter region. This density was significantly higher than that of the other subgroups. This suggests that subgroup III may enhance cold hardiness by activating low-temperature acclimation pathways. Meanwhile, subgroups II and III specifically carried the mechanical damage response element, the WUN motif (AAATTACCT), which may respond to physical stress by regulating the cell wall.

Figure 7. Analysis of cis-regulatory elements in the promoter regions of S. bicolor CBL gene.
3.7 Analysis of gene expression patterns
We analyzed the expression patterns of 10 S. bicolor CBL gene family members based on transcriptome data of different S. bicolor tissues (e.g., roots, stems, leaves, flowers, and seeds) at different developmental stages in the SGMD database (Supplementary Table 4). The data are presented in a heatmap illustrating gene expression across various tissues, utilizing a row-scaled transcriptome atlas based on TPM (Transcripts Per Million) values. In this visualization, red boxes signify high expression levels of SbCBL genes, while blue boxes indicate low expression levels. As illustrated in Figure 8, various CBL genes exhibited significant expression variations across different S. bicolor tissues and developmental stages. In root tissues, the expression levels of SbCBL1, SbCBL5 and SbCBL9 were relatively high, suggesting that these genes play important roles in root growth and development. The normal development of roots is crucial for plant growth and survival because they are an important organ for water and nutrient uptake in plants. These genes may promote root growth and development by regulating cell wall synthesis and modification in root cells, as well as affecting cell elongation and differentiation. In stem tissues, SbCBL2, SbCBL4 and SbCBL8 exhibited high expression levels, suggesting their involvement in stem elongation and thickening processes. Stem growth and development play a key role in supporting the plant and transporting materials. These genes may regulate the arrangement and deposition of cellulose microfilaments in stems, enhancing their mechanical strength to support the plant during growth. SbCBL6, SbCBL7 and SbCBL10 are expressed at significantly higher levels in inflorescence tissues than in other tissues, suggesting that they play important roles in flower development and reproduction.
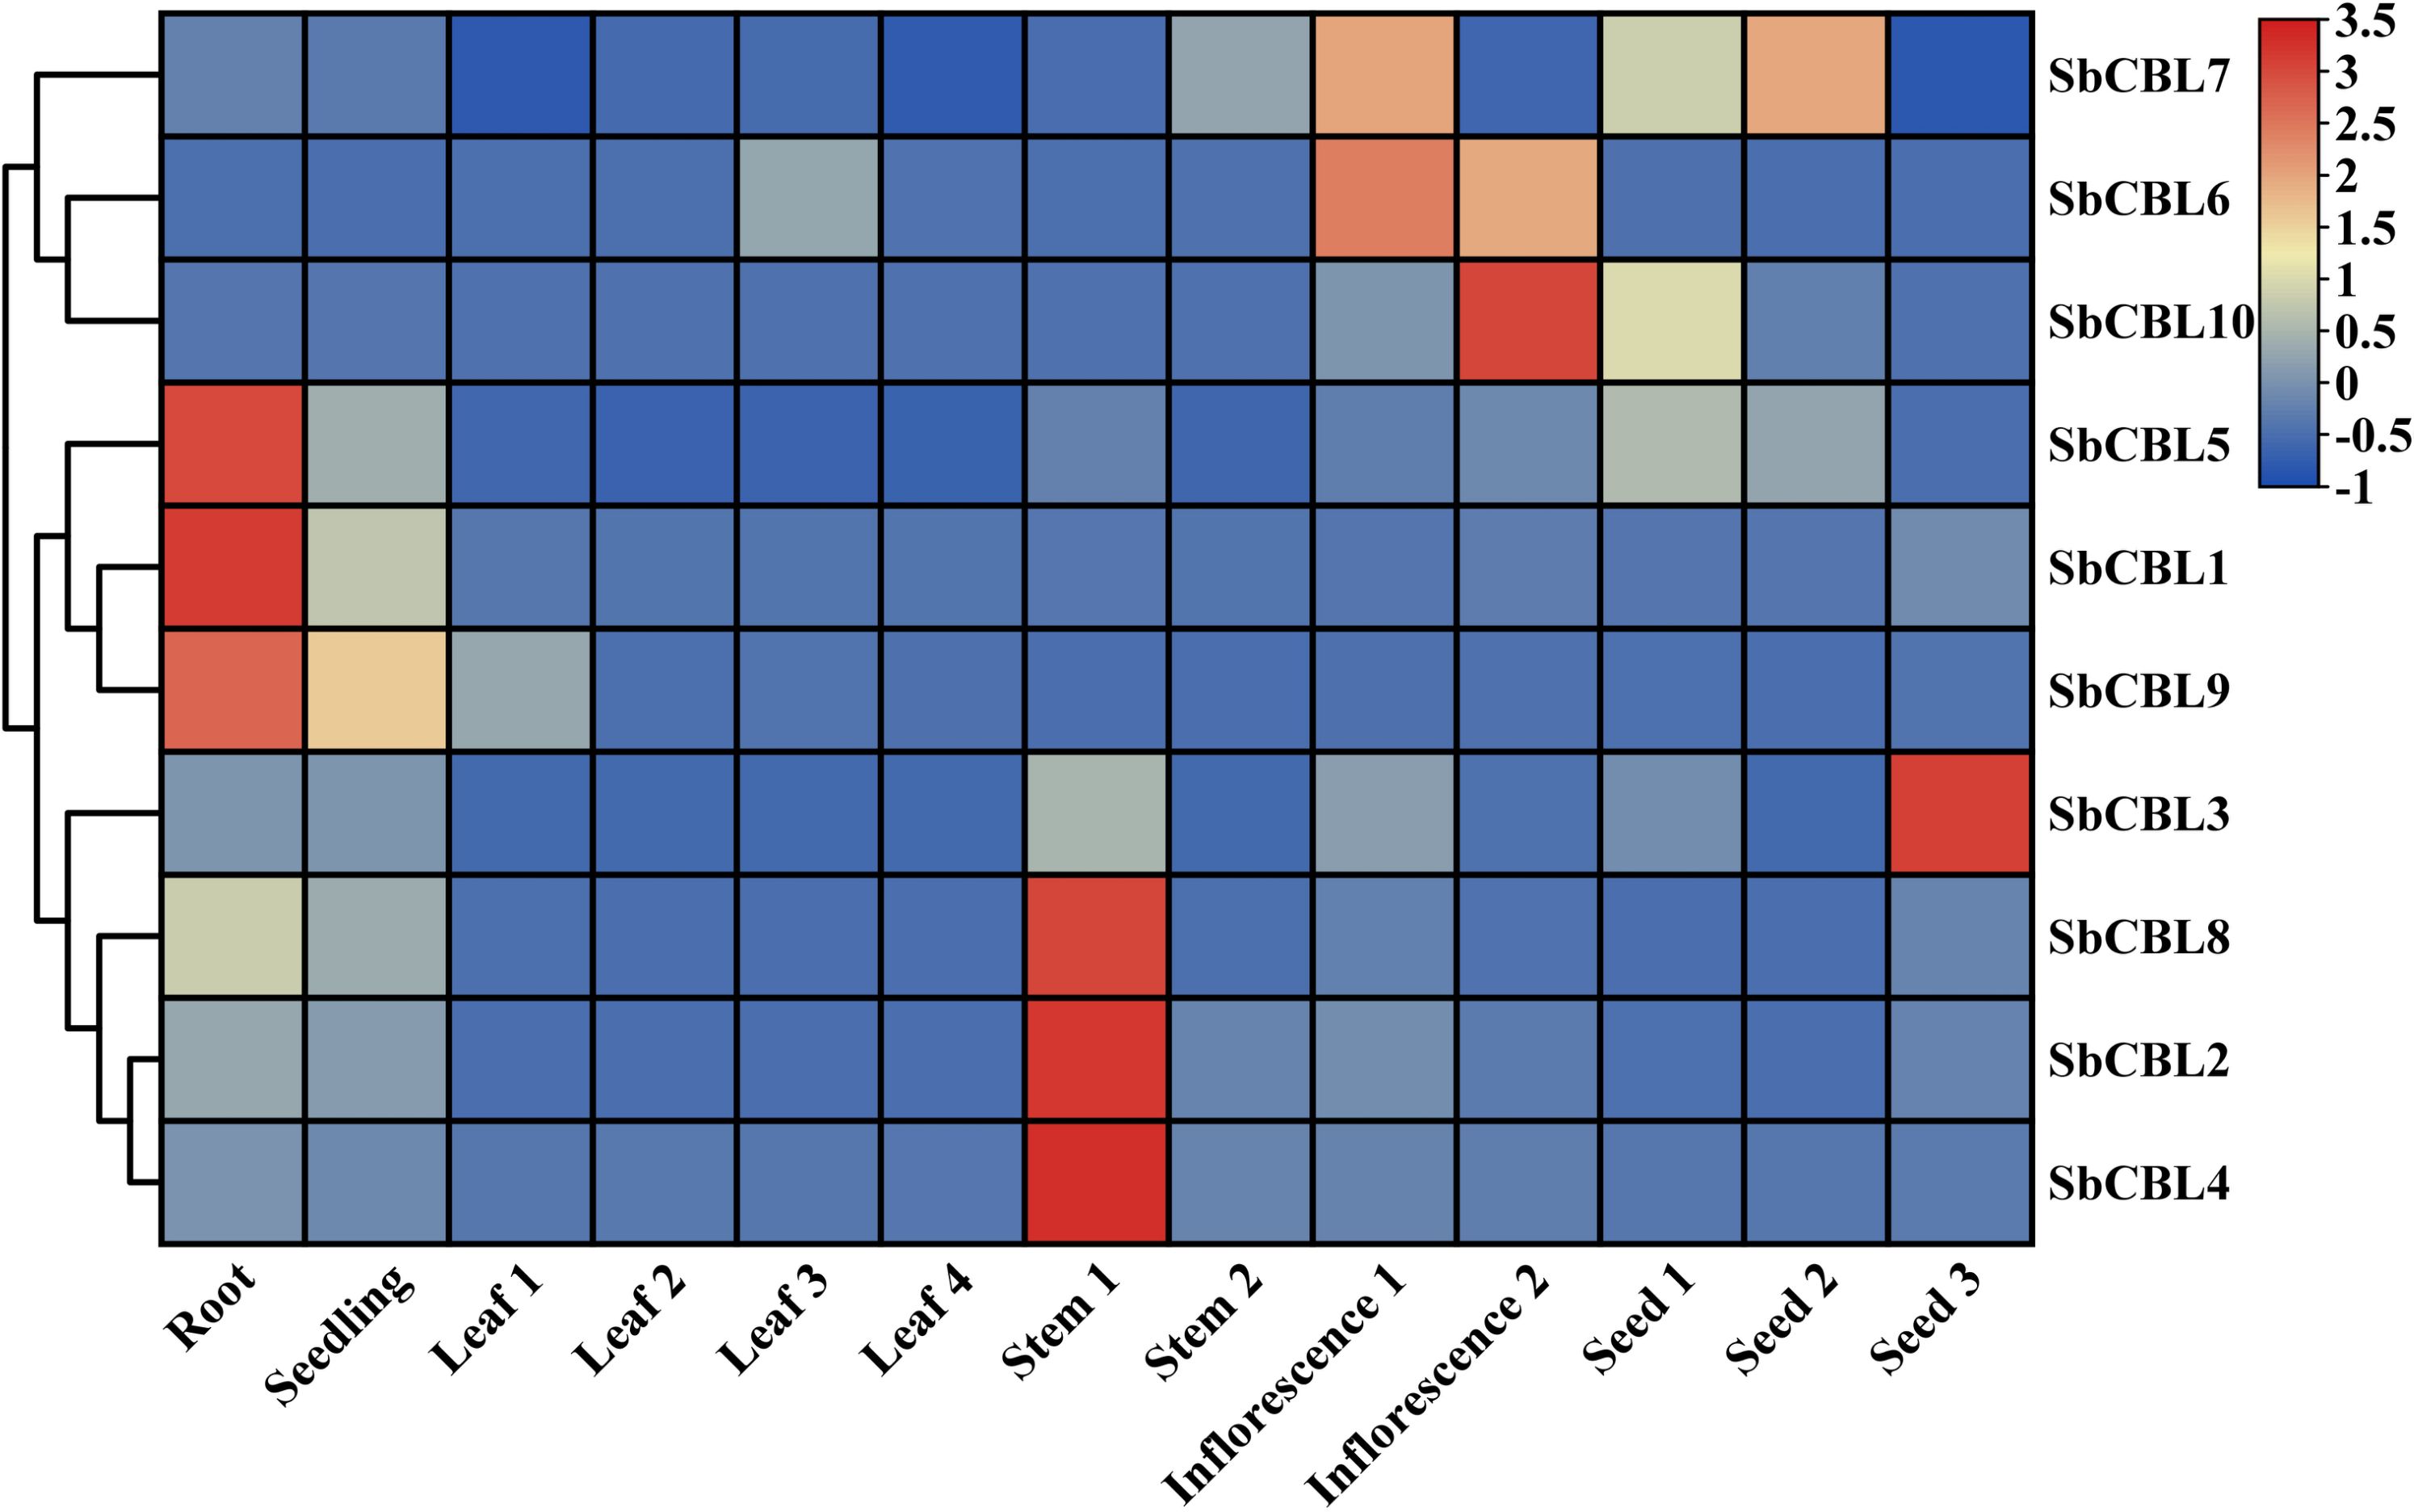
Figure 8. The heat map shows the expression level of the S. bicolor CBL gene in different tissues. Red and blue boxes indicate high and low expression levels of SbCBL genes.
The expression level of SbCBL3 was significantly higher in the seed grain than in other tissues, suggesting that this gene plays an important role in seed grain development. Because material accumulation and maturation directly affect S. bicolor yield and quality, SbCBL3 may influence seed grain size, shape, and starch accumulation by regulating cell wall synthesis and modification, ultimately affecting S. bicolor yield and quality. Gene expression pattern analysis revealed that members of the S. bicolor CBL gene family exhibit distinct expression patterns in various tissues and developmental stages. This differential expression may be closely related to the functional differentiation of these genes. These gene family members play unique roles in different stages of S. bicolor growth and development, as well as in different tissues. They are involved in plant growth, development, and reproduction by regulating cell wall synthesis and modification.
3.8 Expression profile of SbCBL in S. bicolor in response to NaCl and PEG
To explore the expression pattern of the CBL gene in S. bicolor under drought and salt stress, we selected a CBL gene with high expression levels in the roots and performed RT-qPCR analysis. As shown in Figure 9, the expression levels of several CBL genes changed significantly under NaCl and PEG treatment. Under NaCl treatment, the expression level of SbCBL4 increased, while the expression levels of SbCBL3, SbCBL5, SbCBL7, SbCBL8 and SbCBL9 decreased. Conversely, PEG treatment up-regulated the expression of genes such as SbCBL4 and SbCBL8, while down-regulating the expression of SbCBL1, SbCBL2, SbCBL3, SbCBL5 and SbCBL9. Notably, the SbCBL3, SbCBL5 and SbCBL9 genes were down-regulated following both drought and salt stress treatments. These results suggest that the CBL gene in S. bicolor plays a role in the S. bicolor response to salt and drought stress.
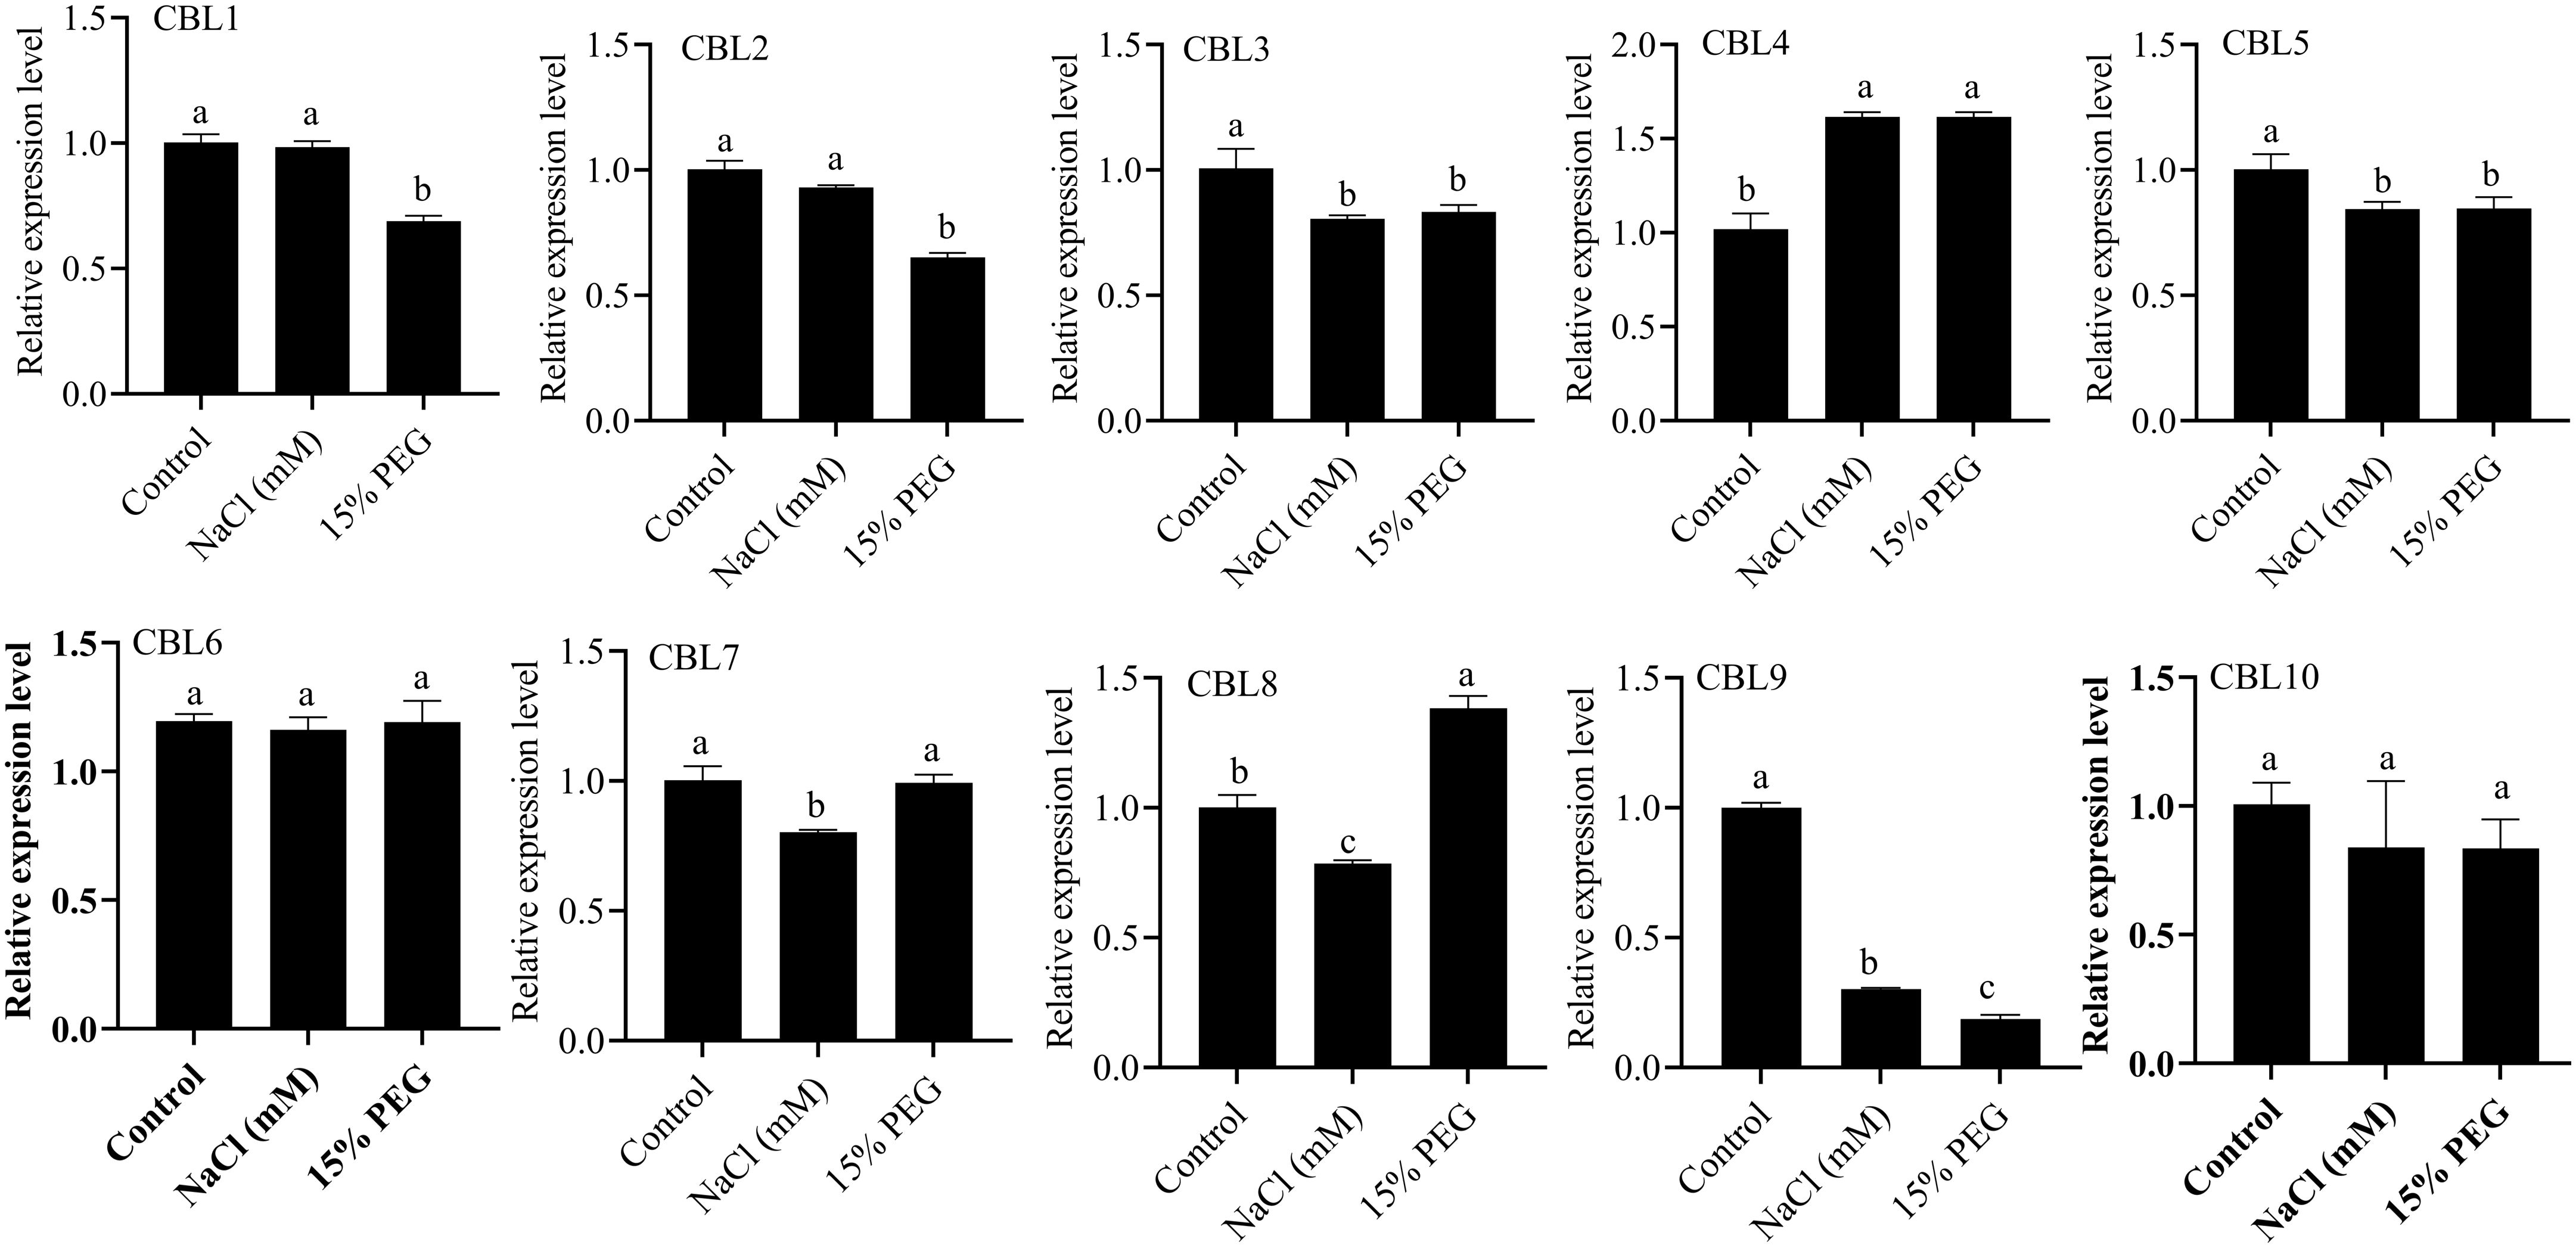
Figure 9. Analysis of the expression levels of CBL1, CBL2, CBL3, CBL4, CBL5, CBL6, CBL7, CBL8, CBL9 and CBL10 after treatment with NaCl and PEG. All data are means ± sd ( n ≥ 3). Letters a, b and c represent statistical significance, P < 0.05.
4 Discussion
4.1 Structural and functional speculation of the CBL gene family in S. bicolor
In this study, 10 members of the CBL gene family were identified from the S. bicolor BTx623 and E048 genomes, respectively (Figure 1). Gene structure analysis showed that the number of exons of these members ranged from 1-7, and there were differences in exon lengths and intron phases (Figure 3). Through conserved motif analysis, we identified 10 conserved motifs, of which Motif1, Motif2, Motif3 and Motif4 were distributed among all members, indicating that these motifs are important for maintaining the basic structure and function of CBL proteins (Figure 3). The structural features of genes are usually closely related to their functions (Sajjad et al., 2023). The diversity in exon-intron structure of S. bicolor CBL gene family members implies that they may be functionally differentiated. For example, SbCBL2, SbCBL3, SbCBL4, SbCBL7 and SbCBL8, which have a higher number of exons, may encode proteins with more complex structures and functions, which are involved in the regulation of multiple processes in S. bicolor growth and development, whereas SbCBL5, SbCBL6 and SbCBL9, which have a relatively low number of exons, may encode proteins that are simpler. This phenomenon has been observed in other species (Sajjad et al., 2023). Based on gene structure and conserved motif analyses combined with existing research reports, it is hypothesized that members of the S. bicolor CBL gene family are involved in several aspects of S. bicolor growth and development. However, these functional speculations require further experimental validation. Future studies could knock out or overexpress members of the S. bicolor CBL gene family using gene editing techniques, such as CRISPR-Cas9, to observe their effects on growth and development, cell wall structure, and related physiological processes. Simultaneously, proteomics and biochemical methods will be used to thoroughly study the interaction mechanism between CBL proteins and other molecules and clarify their specific functions and pathways of action within the cell.
4.2 Comparison with CBL gene families of other species
In this study, we identified a total of 10 CBL genes in S. bicolor, which aligns closely with the number of genes in this family reported in other monocotyledonous plants. For instance, O. sativa has 11 CBL genes (Li et al., 2003), Z. mays has 9 (Brady et al., 2007). In contrast, among dicotyledonous plants, A. thaliana possesses 12 CBL genes (Roudier et al., 2002), S. lycopersicum has 17 (Cao et al., 2012), P. trichocarpa 14 (Sajjad et al., 2023), and G. hirsutum has 39. This indicates a significant variation in the number of CBL family genes across different plant species.This suggests that the CBL gene family is highly conserved across monocotyledonous. Phylogenetic tree analysis revealed that the CBL genes of S. bicolor are interspersed with those of O. sativa and Z. mays, forming several small sub-branches (Figure 4). This indicates that S. bicolor is evolutionarily related to O. sativa and Z. mays in the CBL gene family and may share some functions with them. For instance, SbCOBL5, SbCOBL9, SbECOBL5, and SbECOBL9 clustered with OsBC1L1 and OsBC1L8, as well as ZmBK2L1 and ZmBK2L8, forming a sub-branch with some maize CBL genes (Figure 4).
By comparing the conserved motifs of CBL genes in different species, it was found that several species have Motif1, Motif2, Motif3, and Motif4 (Figure 3). These motifs are found in CBL proteins from S. bicolor, A. thaliana, O. sativa and Z. mays. This suggests that they play important roles in the basic functions of the CBL gene family. They may be involved in the interaction of CBL proteins with other molecules or in maintaining the proteins’ structural stability. A comparative analysis of the CBL gene family with CBL gene families of other species reveals the evolutionary conservation and specificity of the S. bicolor CBL gene family. This conservation is reflected in similarities with other plants in terms of gene structure, conserved motifs, and evolutionary relationships. These similarities provide important clues for a deeper understanding of the CBL gene family’s basic functions.
4.3 Relationship between gene expression patterns and S. bicolor growth and development
Gene expression pattern analysis revealed that members of the S. bicolor CBL gene family exhibit distinct expression patterns in various tissues and developmental stages (Figure 8). Root growth and development is a complex process involving cell division, elongation, and differentiation, and CBL genes may affect cell morphogenesis and physiological functions by regulating cell wall synthesis and modification in root cells (Shao et al., 2020). In A. thaliana and O. sativa, it has been shown that CBL genes regulate the initiation and growth of root hairs (Roudier et al., 2005; Ben et al., 2015; Li et al., 2022). In root tissues, the high expression of SbCBL1, SbCBL5 and SbCBL9 may regulate root growth and development (Figure 8). For instance, these genes may regulate the orientation of cellulose microfilaments, affecting root cell elongation and differentiation. The highly expressed CBL genes in S. bicolor root tissues may have similar functions and play an important role in regulating root growth and development.
SbCBL2, SbCBL4, and SbCBL8 are highly expressed in stem tissues (Figure 8). The mechanical strength of stems is crucial for upright growth and material transportation, as they are an important support structure in plants (Zhao et al., 2020; Zhang et al., 2022). SbCBL2, SbCBL4, and SbCBL8 may enhance cell wall strength and toughness by regulating cellulose microfilament arrangement and deposition in the stem, thus promoting elongation and thickening. Phylogenetic analyses confirmed this hypothesis, showing that ZmBk2 maintains plant organ flexibility by regulating the interaction between lignin and cellulose (Sindhu et al., 2007). ZmBk2 clusters with SbECBL4 and SbCBL4, suggesting that it may perform similar functions through conserved molecular mechanisms. Different SbCBL genes showed differential expression patterns under drought and salt stress conditions (Figure 9). Specifically, NaCl treatment significantly increased the expression level of SbCBL4 while decreasing the expression of SbCBL3, SbCBL5, SbCBL7, SbCBL8 and SbCBL9. Conversely PEG treatment increased the expression of SbCBL4 and SbCBL8 while decreasing the expression of SbCBL1, SbCBL2, SbCBL3, SbCBL5, and SbCBL9. Analysis of the cis-acting elements of the SbCBL promoters revealed that SbCBL5, SbCBL7, SbCBL8 and SbCBL9 contain regulatory elements related to drought response. These results suggest that the SbCBL gene family plays a critical role in sorghum’s response to drought and salt stress. This role has also been confirmed in other plants, such as rice and cotton (Sun et al., 2022; Fu et al., 2024). This finding is consistent with previous research indicating that CBL genes play important roles in drought and salt tolerance in other species. These findings provide important clues for understanding the molecular regulatory mechanisms of S. bicolor growth and development and potential gene targets for genetic improvement and molecular breeding of S. bicolor. Future studies can explore these genes’ specific mechanisms during S. bicolor growth and development through gene function validation experiments. This will provide stronger theoretical support for improving S. bicolor varieties and agricultural production.
4.4 Limitations and prospects of the study
In this study, a more comprehensive bioinformatics analysis of the CBL gene family of S. bicolor was conducted. However, certain limitations still exist. First, regarding gene function validation, this study only analyzed gene structure, evolution, and expression patterns using bioinformatics methods. Thus, experimental validation of gene functions has not yet been carried out. Although potential gene functions were hypothesized based on gene structure and expression patterns, these hypotheses must be verified using techniques such as gene editing and transgenesis. Second, due to limitations in experimental conditions and technical capabilities, this study only used transcriptomic data for gene expression analysis, lacking protein-level validation. It is important to note that gene expression ultimately reflects protein expression; however, transcriptome data only reflects changes in the transcription level of genes, which does not accurately reflect protein expression. Future research can be carried out in the following directions: 1. To verify gene function, use CRISPR-Cas9 and other gene-editing technologies to construct S. bicolor CBL gene family knockout mutants and overexpression plants. Through phenotyping and analyzing physiological and biochemical indexes, study the specific functions and mechanisms of the genes in S. bicolor growth, development, and response to adverse stress. 2. Combine proteome data with transcriptome data to study protein expression. Using proteomics technology, we will analyze protein expression in different S. bicolor tissues and developmental stages. This will allow us to verify the relationship between gene and protein expression and further clarify gene function.3. We will study the interactions between members of the CBL gene family and other genes. Then, we will construct a gene regulatory network to help us understand the molecular regulatory mechanisms of S. bicolor growth, development, and response to adversity.
5 Conclusions
A total of ten CBL genes were identified in the genomes of BTx623 and E048 S. bicolor. Phylogenetic analysis revealed that CBLs can be classified into three subfamilies: Group I, Group II, and Group III. Gene duplication events indicate that WGD was the primary driver of the expansion of the CBL gene family. The tissue-specific expression patterns of SbCBL genes suggest varying expression levels across different organs and tissues in S. bicolor, with SbCBL1, SbCBL5, and SbCBL9 showing significantly higher expression levels in roots. Furthermore, treatments with PEG and NaCl markedly affected the expression levels of SbCBL genes; specifically, SbCBL4 expression increased following PEG treatment, while SbCBL9 expression decreased after NaCl treatment. Overall, this study provides valuable insights into the role of the CBL gene family in S. bicolor.
Data availability statement
The datasets presented in this study can be found in online repositories. The names of the repository/repositories and accession number(s) can be found in the article/Supplementary Material.
Author contributions
SPL: Funding acquisition, Supervision, Visualization, Writing – original draft, Software. SL: Data curation, Formal Analysis, Validation, Writing – review & editing. TJ: Formal Analysis, Methodology, Software, Validation, Writing – original draft. XG: Data curation, Methodology, Resources, Writing – review & editing. HW: Data curation, Resources, Software, Writing – review & editing. QM: Investigation, Resources, Validation, Writing – review & editing. JW: Data curation, Investigation, Validation, Writing – review & editing. KW: Conceptualization, Data curation, Investigation, Visualization, Writing – review & editing. XH: Conceptualization, Funding acquisition, Project administration, Supervision, Writing – review & editing. HZ: Funding acquisition, Supervision, Visualization, Writing – review & editing. WJ: Conceptualization, Funding acquisition, Supervision, Visualization, Writing – review & editing. XZ: Conceptualization, Funding acquisition, Project administration, Writing – review & editing.
Funding
The author(s) declare financial support was received for the research and/or publication of this article. Shaanxi Provincial Department of Science and Technology, General Project - Agricultural Fields 2023-YBNY-061; National Natural Science Foundation of China, Regional Fund, 32160761; Yan’an University, Industry-University-Research Cooperation Cultivation Project, CXY202110; Shaanxi Provincial Department of Science and Technology, Key Industry Innovation Chain - Agriculture, 2023-ZDLNY-50.
Conflict of interest
The authors declare that the research was conducted in the absence of any commercial or financial relationships that could be construed as a potential conflict of interest.
Generative AI statement
The author(s) declare that no Generative AI was used in the creation of this manuscript.
Any alternative text (alt text) provided alongside figures in this article has been generated by Frontiers with the support of artificial intelligence and reasonable efforts have been made to ensure accuracy, including review by the authors wherever possible. If you identify any issues, please contact us.
Publisher’s note
All claims expressed in this article are solely those of the authors and do not necessarily represent those of their affiliated organizations, or those of the publisher, the editors and the reviewers. Any product that may be evaluated in this article, or claim that may be made by its manufacturer, is not guaranteed or endorsed by the publisher.
Supplementary material
The Supplementary Material for this article can be found online at: https://www.frontiersin.org/articles/10.3389/fpls.2025.1652613/full#supplementary-material
References
Aohara, T., Kotake, T., Kaneko, Y., Takatsuji, H., Tsumuraya, Y., and Kawasaki, S. (2009). Rice BRITTLE CULM 5 (BRITTLE NODE) is involved in secondary cell wall formation in the sclerenchyma tissue of nodes. Plant Cell Physiol. 50, 1886–1897. doi: 10.1093/pcp/pcp133
Bailey, T. L., Boden, M., Buske, F. A., Frith, M., Grant, C. E., Clementi, L., et al. (2009). MEME Suite: Tools for motif discovery and searching. Nucleic Acids Res. 37, W202–W208. doi: 10.1093/nar/gkp335
Ben, T. D., Abraham, Y., Stav, S., Thompson, K., Loraine, A., Elbaum, R., et al. (2015). COBRA-LIKE2, a member of the glycosylphosphatidylinositol-anchored COBRA-LIKE family, plays a role in cellulose deposition in arabidopsis seed coat mucilage secretory cells. Plant Physiol. 167, 711–724. doi: 10.1104/pp.114.240671
Benfey, P. N., Linstead, P. J., Roberts, K., Schiefelbein, J. W., Hauser, M. T., and Aeschbacher, R. A. (1993). Root development in Arabidopsis: four mutants with dramatically altered root morphogenesis. Development. 119, 57–70. doi: 10.1242/dev.119.1.57
Brady, S. M., Song, S., Dhugga, K. S., Rafalski, J. A., and Benfey, P. N. (2007). Combining expression and comparative evolutionary analysis. The COBRA gene family. Plant Physiol. 143, 172–187. doi: 10.1104/pp.106.087262
Brown, D. M., Zeef, L. A., Ellis, J., Goodacre, R., and Turner, S. R. (2005). Identification of novel genes in Arabidopsis involved in secondary cell wall formation using expression profiling and reverse genetics. Plant Cell. 17, 2281–2295. doi: 10.1105/tpc.105.031542
Cao, Y., Tang, X., Giovannoni, J., Xiao, F., and Liu, Y. (2012). Functional characterization of a tomato COBRA-like gene functioning in fruit development and ripening. BMC Plant Biol. 12, 211. doi: 10.1186/1471-2229-12-211
Chen, C., Ge, F., Du, H., Sun, Y., Sui, Y., Tang, S., et al. (2025). A comprehensive omics resource and genetic tools for functional genomics research and genetic improvement of sorghum. Mol. Plant 18, 703–719. doi: 10.1016/j.molp.2025.03.005
Chen, C., Wu, Y., Li, J., Wang, X., Zeng, Z., Xu, J., et al. (2023). Tbtools-II: A “one for all, all for one” bioinformatics platform for biological big-data mining. Mol. Plant 16, 1733–1742. doi: 10.1016/j.molp.2023.09.010
Dai, X., You, C., Chen, G., Li, X., Zhang, Q., and Wu, C. (2011). OsBC1L4 encodes a COBRA-like protein that affects cellulose synthesis in rice. Plant Mol. Biol. 75, 333–345. doi: 10.1007/s11103-011-9730-z
Dai, X., You, C., Wang, L., Chen, G., Zhang, Q., and Wu, C. (2009). Molecular characterization, expression pattern, and function analysis of the OsBC1L family in rice. Plant Mol. Biol. 71, 469–481. doi: 10.1007/s11103-009-9537-3
Fu, W. W., Wang, Z. Y., Liusui, Y. H., Zhang, X., Han, A. X., Zhong, X. Y., et al. (2024). Genome-wide analysis of the cotton COBRA-like gene family and functional characterization of GhCOBL22 in relation to drought tolerance. BMC Plant Biol. 24, 1242. doi: 10.1186/s12870-024-05965-x
Geng, E. Y., Xu, X., Xu, J., Guo, C., and Zhang, Y. (2023). Genome-wide identification of the COBRA-Like gene family in Pinus tabuliformis and the role of PtCOBL12 in the regulation of cellulose biosynthesis. Ind. Crops Prod. 203, 117189. doi: 10.1016/j.indcrop.2023.117189
Goodstein, D. M., Shu, S., Howson, R., Neupane, R., Hayes, R. D., Fazo, J., et al. (2012). Phytozome: A comparative platform for green plant genomics. Nucleic Acids Res. 40, D1178–D1186. doi: 10.1093/nar/gkr944
Hochholdinger, F., Wen, T. J., Zimmermann, R., Chimot-Marolle, P., Costa, S. O., Bruce, W., et al. (2008). The maize (Zea mays L.) roothairless3 gene encodes a putative GPI-anchored, monocot-specific, COBRA-like protein that significantly affects grain yield. Plant J. 54, 888–898. doi: 10.1111/j.1365-313X.2008.03459.x
Jones, M. A., Raymond, M. J., and Smirnoff, N. (2006). Analysis of the root-hair morphogenesis transcriptome reveals the molecular identity of six genes with roles in root-hair development in Arabidopsis. Plant J. 45, 83–100. doi: 10.1111/j.1365-313X.2005.02609.x
Julius, B. T., McCubbin, T. J., Mertz, R. A., Baert, N., Knoblauch, J., Grant, D. G., et al. (2021). Maize Brittle Stalk2-Like3, encoding a COBRA protein, functions in cell wall formation and carbohydrate partitioning. Plant Cell. 33, 3348–3366. doi: 10.1093/plcell/koab193
Ko, J. H., Kim, J. H., Jayanty, S. S., Howe, G. A., and Han, K. H. (2006). Loss of function of COBRA, a determinant of oriented cell expansion, invokes cellular defence responses in Arabidopsis thaliana. J. Exp. Bot. 57, 2923–2936. doi: 10.1093/jxb/erl052
Kotake, T., Aohara, T., Hirano, K., Sato, A., Kaneko, Y., Tsumuraya, Y., et al. (2011). Rice Brittle culm 6 encodes a dominant-negative form of CesA protein that perturbs cellulose synthesis in secondary cell walls. J. Exp. Bot. 62, 2053–2062. doi: 10.1093/jxb/erq395
Kumar, S., Stecher, G., and Tamura, K. (2016). MEGA7: molecular evolutionary genetics analysis version 7.0 for bigger datasets. Mol. Biol. Evol. 33, 1870–1874. doi: 10.1093/molbev/msw054
Li, Y., Qian, Q., Zhou, Y., Yan, M., Sun, L., Zhang, M., et al. (2003). BRITTLE CULM1, which encodes a COBRA-like protein, affects the mechanical properties of rice plants. Plant Cell. 15, 2020–2031. doi: 10.1105/tpc.011775
Li, Z., Zhou, T., Sun, P., Chen, X., Gong, L., Sun, P., et al. (2022). COBL9 and COBL7 synergistically regulate root hair tip growth via controlling apical cellulose deposition. Biochem. Biophys. Res. Commun. 596, 6–13. doi: 10.1016/j.bbrc.2022.01.096
Mistry, J., Chuguransky, S., Williams, L., Qureshi, M., Salazar, G. A., Sonnhammer, E. L. L., et al. (2021). Pfam: The protein families database in 2021. Nucleic Acids Res. 49, D412–D419. doi: 10.1093/nar/gkaa913
Paterson, A. H., Bowers, J. E., Bruggmann, R., Dubchak, I., Grimwood, J., Gundlach, H., et al. (2009). The Sorghum bicolor genome and the diversification of grasses. Nature. 457, 551–556. doi: 10.1038/nature07723
Ringli, C. (2010). Monitoring the outside: cell wall-sensing mechanisms. Plant Physiol. 153, 1445–1452. doi: 10.1104/pp.110.154518
Roudier, F., Fernandez, A. G., Fujita, M., Himmelspach, R., Borner, G. H., Schindelman, G., et al. (2005). COBRA, an Arabidopsis extracellular glycosyl-phosphatidyl inositol-anchored protein, specifically controls highly anisotropic expansion through its involvement in cellulose microfibril orientation. Plant Cell. 17, 1749–1763. doi: 10.1105/tpc.105.031732
Roudier, F., Schindelman, G., DeSalle, R., and Benfey, P. N. (2002). The COBRA family of putative GPI-anchored proteins in Arabidopsis. A new fellowship in expansion. Plant Physiol. 130, 538–548. doi: 10.1104/pp.007468
Sajjad, M., Ahmad, A., Riaz, M. W., Hussain, Q., Yasir, M., and Lu, M. Z. (2023). Recent genome resequencing paraded COBRA-Like gene family roles in abiotic stress and wood formation in Poplar. Front. Plant Sci. 14, 1242836. doi: 10.3389/fpls.2023.1242836
Schindelman, G., Morikami, A., Jung, J., Baskin, T. I., Carpita, N. C., Derbyshire, P., et al. (2001). COBRA encodes a putative GPI-anchored protein, which is polarly localized and necessary for oriented cell expansion in Arabidopsis. Genes Dev. 15, 1115–1127. doi: 10.1101/gad.879101
Shao, Y., Yu, X., Xu, X., Li, Y., Yuan, W., Xu, Y., et al. (2020). The YDA-MKK4/MKK5-MPK3/MPK6 cascade functions downstream of the RGF1-RGI ligand-receptor pair in regulating mitotic activity in root apical meristem. Mol. Plant 13, 1608–1623. doi: 10.1016/j.molp.2020.09.004
Silva, T. N., Thomas, J. B., Dahlberg, J., Rhee, S. Y., and Mortimer, J. C. (2022). Progress and challenges in sorghum biotechnology, a multipurpose feedstock for the bioeconomy. J. Exp. Bot. 73, 646–664. doi: 10.1093/jxb/erab450
Sindhu, A., Langewisch, T., Olek, A., Multani, D. S., McCann, M. C., Vermerris, W., et al. (2007). Maize Brittle stalk2 encodes a COBRA-like protein expressed in early organ development but required for tissue flexibility at maturity. Plant Physiol. 145, 1444–1459. doi: 10.1104/pp.107.102582
Sun, X., Xiong, H., Jiang, C., Zhang, D., Yang, Z., Huang, Y., et al. (2022). Natural variation of DROT1 confers drought adaptation in upland rice. Nat. Commun. 13, 4265. doi: 10.1038/s41467-022-31844-w
Wang, Y., Tang, H., DeBarry, J. D., Tan, X., Li, J., Wang, X., et al. (2012). MCScanX: A toolkit for detection and evolutionary analysis of gene synteny and collinearity. Nucleic Acids Res. 40, e49. doi: 10.1093/nar/gkr1293
Xue, B. P., Duan, W., Gong, L. P., Zhu, D., Li, X., Li, X., et al. (2024). The OsDIR55 gene increases salt tolerance by altering the root diffusion barrier. Plant J. 118, 1550–1568. doi: 10.1111/tpj.16696
Zhang, Y., Shan, X., Zhao, Q., and Shi, F. (2022). The MicroRNA397a-LACCASE17 module regulates lignin biosynthesis in Medicago ruthenica (L.). Front. Plant Sci. 13, 978515. doi: 10.3389/fpls.2022.978515
Keywords: SbCBL gene family, systematic evolution, whole genome duplication, abiotic stresses, SbCBL4/9
Citation: Liu S, Liang S, Jing T, Guo X, Wang H, Ma Q, Wang J, Wang K, He X, Zhao H, Jiang W and Zhang X (2025) Genome-wide identification of the COBRA-like gene family and expression pattern analysis under abiotic stresses of Sorghum bicolor (L.). Front. Plant Sci. 16:1652613. doi: 10.3389/fpls.2025.1652613
Received: 24 June 2025; Accepted: 19 August 2025;
Published: 09 September 2025.
Edited by:
Rajesh Kumar Pathak, Chung-Ang University, Republic of KoreaReviewed by:
Sujata Thakur, National Bureau of Plant Genetic Resources (ICAR), IndiaParva Sharma, University of Maryland, United States
Panrong Ren, Longdong University, China
Copyright © 2025 Liu, Liang, Jing, Guo, Wang, Ma, Wang, Wang, He, Zhao, Jiang and Zhang. This is an open-access article distributed under the terms of the Creative Commons Attribution License (CC BY). The use, distribution or reproduction in other forums is permitted, provided the original author(s) and the copyright owner(s) are credited and that the original publication in this journal is cited, in accordance with accepted academic practice. No use, distribution or reproduction is permitted which does not comply with these terms.
*Correspondence: Shipeng Liu, TGl1c2hpcGVuZzIwMDNAMTI2LmNvbQ==