 Huazu Li1†
 Shuhui Wang1,2†
 Zhengning Zheng1
 Yue Sun3
 Yifei Han4
 Mengyu Xing1
 Tianxu Zhang1
 Wenlong Mo1,2
 Binbin Cai1
 Jinghan Yin1,2
 Jiajie Qian1,2
 Uzair Muhammad1
 Wei Li5,6
 Daojun Yuan7,8
 Jinhong Chen2
 Shuijin Zhu1,2*
 Tianlun Zhao1,2*
- 1College of Agriculture and Biotechnology, Zhejiang University, Hangzhou, China
- 2Hainan Institute, Zhejiang University, Sanya, China
- 3Zhejiang Agricultural Technical Extension Center, Hangzhou, China
- 4Institute of Crop and Nuclear Technology Utilization, Zhejiang Academy of Agricultural Sciences, Hangzhou, China
- 5Chinese Academy of Agricultural Sciences, State Key Laboratory of Cotton Bio-breeding and Integrated Utilization, Anyang, China
- 6Zhengzhou Research Base, State Key Laboratory of Cotton Bio-breeding and Integrated Utilization, School of Agricultural Sciences, Zhengzhou University, Zhengzhou, China
- 7Engineering Research Centre of Cotton of Ministry of Education, College of Agronomy, Xinjiang Agricultural University, Urumqi, Xinjiang, China
- 8National Key Laboratory of Crop Genetic Improvement, Huazhong Agricultural University, Wuhan, Hubei, China
Introduction: As a globally important cash crop, Gossypium barbadense has the high-quality fiber for textile industry. However, it experiences substantial growth inhibition and yield decline under salt stress, rendering the elucidation of its salt tolerance mechanisms imperative for breeding initiatives.
Methods: We performed population structure analysis on 240 global G. barbadense accessions, phenotyping under salt stress at seedling-stage, genome-wide association study (GWAS), virus-induced gene silencing (VIGS) of Gbar_D02G014670 (GbXTH27), and its functional verification.
Results: Population structure analysis on 240 globally distributed G. barbadense accessions resolved four distinct subpopulations. Seedling-stage salt stress screening identified 23 highly salt-tolerant genotypes exhibiting divergent phenotypic responses. GWAS identified multiple significant single nucleotide polymorphism (SNP) loci associated with salt tolerance, with the most prominent signal localized to chromosome D02. VIGS of GbXTH27 exacerbated salt-induced wilting phenotypes and significantly decreased antioxidant enzyme activities.
Discussion: This research provides valuable molecular markers and theoretical foundations for genetic improvement and breeding of salt-tolerant G. barbadense cultivars, while also offering insights into salt stress response mechanisms applicable to other crops.
1 Introduction
Cotton (Gossypium spp.) is a globally significant cash crop, particularly in the case of G. barbadense, has garnered substantial attention from the textile industry and breeders due to its superior fiber quality and disease resistance. As the exclusive cotton cultivation region in the China, Xinjiang benefits from unique geographical and climatic conditions (Zhao et al., 2024). However, it faces severe challenges from soil salinization, which critically impairs cotton growth, yield, and fiber quality (Sharif et al., 2019; Su et al., 2020; Zhu et al., 2020). To enhance or stabilize yield and fiber quality, breeding salt-tolerant G. barbadense cultivars has emerged as a pivotal objective in cotton improvement programs.
Salt tolerance, a polygenic trait essential for plant adaptation to saline environments, involves coordinated regulation of multiple quantitative characteristics including plant height (Wang et al., 2012; Long et al., 2013), root length (Li et al., 2021; Lin et al., 2004), biomass (Seemann and Critchley, 1985), organic osmolyte accumulation (Duan et al., 2023), and ion homeostasis (Lin et al., 2004). To systematically evaluate these traits, the membership function value (MFV) methodology has been established as a quantitative framework integrating growth parameters, leaf injury indices, and ion concentrations under salt stress. For instance, MFV-based screening of 549 Brassica napus inbred lines during germination stages identified salt-tolerant genotypes using germination rate, root/shoot length, and fresh weight (Wu et al., 2019). Similarly, 300 sweet sorghums (Sorghum bicolor (L.) Moench.) accessions were classified for salt tolerance at germination using MFV indices derived from five traits including germination energy, germination rate, germination index, germination vigour index and root fresh weight (Ding et al., 2018). In sunflower (Helianthus annuus L.), MFV combined with principal component analysis (PCA) generated a Composite Stress Assessment Index (CSAI) to evaluate multi-stress responses (Ma et al., 2016).
Genome-wide association studies (GWAS) have emerged as a powerful tool for dissecting the genetic architecture of agronomic traits in crops, facilitating the identification of key loci governing yield and quality. GWAS has been effectively applied in major crops, including Oryza sativa (Zhao et al., 2011; Huang et al., 2012), Glycine max (Zhang et al., 2015; Zhao et al., 2019), Brassica napus (Schiessl et al., 2015; Lu et al., 2017), G. hirsutum (Fang et al., 2017; Huang et al., 2017). Based on these successes, GWAS has been increasingly applied to unravel the complex mechanisms underlying salt stress tolerance, with significant progress achieved in major crops. In Oryza sativa (Li et al., 2020; Wei et al., 2024), Triticum aestivum (Hu et al., 2021; Quamruzzaman et al., 2022b), Zea mays (Li et al., 2021, 2022), Glycine max (Do et al., 2019; Jin et al., 2021), and Brassica napus (Zhang et al., 2022, 2023), numerous salt-stress QTLs and candidate genes have been identified through GWAS analyses. The recent advancements in high-throughput sequencing technologies and the availability of refined genome assemblies for Gossypium species (Hu et al., 2019; Wang et al., 2019) have further expanded the application of GWAS in cotton, particularly for elucidating the genetic basis of salt tolerance mechanisms. A total of 42 salt-tolerance-associated SNPs were detected in 149 G. hirsutum accessions using the Illumina Cotton SNP70K array, and genes involved in intracellular transport, sucrose synthesis, and auxin response were revealed (Zheng et al., 2021). Eight significant SNPs linked to three salt-stress traits were identified through Cotton SNP80K chip analysis of 288 G. hirsutum accessions (Cai et al., 2017). Genotyping-by-sequencing (GBS) based GWAS of 217 G. hirsutum varieties identified GH_A13G0171 as a negative regulator of salt response (Xu et al., 2021). Resequencing of 215 G. arboreum accessions revealed nine SNP-rich regions and 40 candidate genes (Dilnur et al., 2019). Integrating RNA-seq and GWAS of 214 Chinese G. arboreum accessions, Transcriptome-wide association study (TWAS) in G. hirsutum seedlings pinpointed 19 salt-responsive genes (Han et al., 2022).
Despite these advancements, research on salt tolerance mechanisms in G. barbadense remains limited compared to G. hirsutum (Xu et al., 2023; Zhang et al., 2024). To address this gap, we constructed a high-density genetic variation map using 240 globally collected G. barbadense accessions. Through two-year seedling-stage salt stress trials and phenotypic characterization, combined with GWAS, we identified key loci associated with salt tolerance and functionally validated candidate genes. This work provides molecular markers and target genes for genetic enhancement of salt tolerance in G. barbadense, while providing methodological references for dissecting mechanism of stress tolerance in other crops.
2 Materials and methods
2.1 Experimental materials
A total of 240 G. barbadense accessions from diverse countries and regions were collected for seedling-stage salt tolerance evaluation. These included 220 mainstream cultivars from Xinjiang, China, three wild G. barbadense accessions collected from Yunnan and Hainan, China, six Pima cotton germplasm lines from the United States, six cultivated materials from Egypt, and five G. barbadense varieties from Central Asia.
2.2 Phenotypic evaluation and analysis
Sulfuric acid-delinted seeds were sown in 10 × 5 seedling trays. After 3 days of germination, seedlings were transferred to a hydroponic system containing 1/2-strength Murashige and Skoog (MS) nutrient solution (pH 5.8). The nutrient solution was replaced every 3 days, and continuous aeration was maintained using an air pump. Plants were grown under controlled environmental conditions in the greenhouse at Zhejiang University Agricultural Experiment Station. NaCl treatment (200 mmol/L) was initiated at the two true leaves and one apical bud stage, while control groups remained untreated, both the control groups and the salt-stress groups were cultured synchronously in the hydroponic system. After 7 days of salt stress, senesced cotyledons were removed. Plant height (cotyledonary node to apical meristem) and shoot fresh weight were measured. Roots and shoots were then oven-dried at 105 °C for 60 min followed by 80 °C to constant weight for dry weight determination. Three biological replicates per treatment were maintained to ensure experimental reliability. All measured parameters were converted to the Salt Tolerance Index (STI), which was calculated using Equation 1:
The traits included relative plant height (RPH), relative shoot fresh weight (RSFW), relative shoot dry weight (RSDW), and relative root dry weight (RRDW). To minimize environmental variance across years and emphasize genetic effects, best linear unbiased estimates (BLUEs) for four traits (2022–2023 data) were calculated using the lme4 R package:
In Equation 2, STI serves as the dependent variable, with Sample (genotype) designated as the fixed-effect independent variable. The term 1|Rep denotes experimental replicates modeled as random effects, 1|Year represents year-specific random effects, and 1|Year: Rep specifies the nested random effects of replicates within years.
BLUE values were analyzed for descriptive statistics and ANOVA using SPSS v26. Phenotypic frequency distributions and correlations were visualized with the Hmisc R package. Graphs were generated using GraphPad Prism.
2.3 Salt tolerance assessment
A membership function method was applied to comprehensively evaluate seedling-stage salt tolerance across traits.
In Equation 3, denotes the comprehensive index factor score of genotype i. represents the eigenvector corresponding to the j-th individual indicator in the i-th principal component. indicates the salt tolerance index of the j-th individual indicator for genotype i. In Equation 4, refers to the membership value of the comprehensive index for genotype i, where and represent the maximum and minimum values of the comprehensive index, respectively. Equation 5 defines as the weight (relative importance) of the i-th comprehensive index among all indices, calculated from its contribution rate (). In Equation 6, D quantifies the integrated salt tolerance coefficient.
Correlation analysis was performed using SPSS. Hierarchical clustering analysis was conducted in R with the hclust function, employing Euclidean distance and Ward’s minimum variance method for cluster aggregation.
2.4 Measurement of superoxide dismutase activities, malondialdehyde and proline content
Oxidative stress markers, including superoxide dismutase (SOD) activities, malondialdehyde (MDA) and proline (Pro) content were measurement using established protocols outlined (Qian et al., 2024). All assays utilized a 0.1 g fresh sample of leaves.
2.5 Variant calling and population genetics analysis
Resequencing data PRJNA728217 (Yu et al., 2021) for 240 G. barbadense accessions was downloaded from the NCBI SRA database using SRA Toolkit. Raw Illumina paired-end reads were quality-filtered using Fastp (Chen et al., 2018), with parameters “-c -n 15 -u 50 -q 15” to retain high quality sequences (Shao et al., 2022). Clean reads were aligned to the G. barbadense (AD2) ‘3-79’ reference genome HAU (Wang et al., 2019) using BWA (Li and Durbin, 2009), following index construction with the same tool. Alignment files were converted to binary BAM format using SAMtools (Li et al., 2009), sorted with sambamba (Tarasov et al., 2015), and PCR duplicates were removed.
SNPs and InDels were identified using the HaplotypeCaller module in GATK (Mckenna et al., 2010). GVCF files were merged with CombineGVCFs and converted to VCF format. Variants were filtered using VariantFiltration module in GATK (Mckenna et al., 2010), followed by additional filtering (maf > 0.05, max-missing > 0.8) to obtain GWAS-compatible SNPs (Yu et al., 2021). Functional annotation was performed using ANNOVAR. SNP/InDel densities were calculated with VCFtools (Danecek et al., 2011), and chromosomal distributions were visualized using RColorBrewer and stringr R packages.
A genetic distance matrix generated by VCF2Dis was used to construct a Neighbor-Joining (NJ) phylogenetic tree via the FastME online platform (http://www.atgc-montpellier.fr/fastme). Population structure was inferred using Admixture (Alexander et al., 2009), and PCA was conducted with GCTA (Yang et al., 2011) to resolve substructure and mitigate false positives in association studies. Genome-wide linkage disequilibrium (LD) decay was assessed with PopLDdecay (Zhang et al., 2019a).
To quantify genetic divergence and variation among subpopulations, pairwise population differentiation index (FST) and nucleotide diversity (π) were calculated genome-wide using VCFtools (Danecek et al., 2011) with 100-kb sliding windows and 20-kb steps.
2.6 Genome-wide association study
Three types of salt stress phenotypic data for the seedling stage of G. barbadense were generated based on the calculated BLUE values and the phenotypes observed in 2022 and 2023. The genome-wide efficient mixed-model association (GEMMA) software (Zhou and Stephens, 2012), was used to correct for population stratification by incorporating both PCA and kinship matrices. Manhattan plots were generated using the R package CMplot to represent the distribution of SNPs and their corresponding P-values, while quantile-quantile (QQ) plots were constructed to evaluate the model’s performance. SNP filtering was performed using Plink software based on linkage disequilibrium criteria (window size = 50, step size = 50, r² ≥ 0.2), resulting in a total of 213,990 effective SNPs. A stringent threshold of p < 4.67 × 10⁻⁶ was set to identify significant association loci (Yu et al., 2021). However, due to the risk of overly stringent thresholds excluding true trait-associated genetic loci with p-values that do not meet the strict cutoff, SNPs with p < 1.0 × 10⁻⁵ identified in at least two environments or phenotypes were also retained to capture more candidate genes (Zhao et al., 2022).
2.7 RNA-seq analysis
RNA-seq data were downloaded from NCBI under project numbers PRJNA490626 (Hu et al., 2019) (salt stress treatments at 1 h, 3 h, 6 h, 12 h, and 24 h) and PRJNA601953 (salt stress treatment at 14 days) (Dong et al., 2022). Additionally, the G. barbadense genome (version 379_HAU) was obtained from COTTONGENE (https://www.cottongen.org/species/Gossypium_barbadense/nbi-AD2_genome_v1.0) and the genome index was built using HISAT2 (Kim et al., 2019). Quality control and filtering were performed using Fastp (Chen et al., 2018) with the following criteria (Song et al., 2023): paired reads were removed if any read met the following criteria: ambiguous “N” bases exceeded 10% of the read length; >50% of bases had low quality (Q ≤ 5); or adapter sequences were detected. Reads were aligned to the reference genome using SAMtools (Li et al., 2009), and gene expression levels were quantified as FPKM values using StringTie (Pertea et al., 2015).
2.8 Gene expression analysis
Two contrasting materials, the highly salt-tolerant line H160 and the salt-sensitive line H20, were subjected to salt stress (200 mmol/L NaCl) at 0 h, 24 h, and 48 h, with three biological replicates per time point. Total RNA was extracted from leaf samples using an RNA extraction kit (TIANGEN), reverse-transcribed into cDNA using a reverse transcription kit (TOROIVD), and subjected to qRT-PCR analysis using enzymes from TOROGreen® qPCR Master Mix (TOROVID). The qPCR reactions were performed in a 20 μL reaction system containing 2 μL of cDNA, 10 μL of qPCR master mix, 4 μL of forward primer, and 4 μL of reverse primer, with each primer at a final concentration of 1–2 micromolars. The housekeeping gene UBQ7 (Ubiquitin extension protein 7) was employed as an internal control gene (Wang et al., 2013). Each template was analyzed in triplicate technical replicates. The qPCR protocol was conducted using the LightCycler 96 real-time PCR system (Roche) with the following cycling conditions: initial denaturation at 96°C for 3 minutes, followed by 40 cycles of denaturation at 95°C for 10 seconds and annealing/extension at 60°C for 30 seconds. Primers used for quantitative analysis are listed in Supplementary Table S1.
2.9 VIGS experiment
Virus-induced gene silencing (VIGS) was performed using the tobacco rattle virus (TRV)-based pTRV1/2 vector system. Target gene fragments were amplified from G. barbadense cDNA and cloned into the pTRV2 vector via homologous recombination using EcoRI and KpnI restriction sites. The constructed vectors were transformed into Escherichia coli DH5α cells and validated by plasmid sequencing. Verified vectors were introduced into Agrobacterium tumefaciens strain GV3101 via heat-shock transformation. Agrobacterial cultures harboring the vectors were grown in liquid medium supplemented with rifampicin (50 μg/mL) and kanamycin (50 μg/mL) at 28°C with 200 rpm agitation for 12 h. Bacterial cells were harvested, resuspended in infiltration buffer (10 mM MgCl2, 10 mM MES, 200 μM acetosyringone), and adjusted to OD600 = 1.0. After 2–3 h of dark incubation at 28°C, Agrobacterium suspensions carrying pTRV1 and pTRV2 (negative control), pTRV1 and pTRV2: CLA1 (positive control), or pTRV1 and pTRV2: GbXTH27 were mixed at 1:1 ratio. The mixtures were infiltrated into cotyledons of 7-day old G. barbadense 3–79 seedlings using sterile syringes. Post-infiltration, plants were maintained in darkness for 24 h, then transferred to a growth chamber at 25°C under 16 h light/8 h dark cycles. The empty pTRV2 vector served as a negative control, while pTRV2: CLA1 (essential for chloroplast development) was used as a positive control, inducing characteristic leaf whitening within two weeks due to chloroplast defects (Mandel et al., 1996). Leaves from pTRV2 and pTRV2: GbXTH27 infiltrated plants were collected at two weeks post-infiltration for RNA extraction and qPCR validation of GbXTH27 silencing efficiency. All primers used for VIGS vector construction are listed in Supplementary Table S1.
2.10 DAB staining
The DAB solution was formulated by dissolving DAB powder in distilled water to reach a concentration of 1 mg/mL, with its pH adjusted to 3.8. For the staining procedure, leaves were immersed in the prepared DAB solution and incubated at 28°C in the dark for 12 hours. Following this, the leaves underwent a 10-minute boiling treatment in 95% ethanol to remove chlorophyll.
2.11 Determination of elements
Sodium (Na) and potassium (K) contents were measured via inductively coupled plasma atomic emission spectroscopy (ICP-AES) (Zhang et al., 2019b). Roots, stems, and leaves of cotton seedlings were collected, dried, and ground to pass through a 40-mesh sieve. The homogenized samples were thoroughly mixed prior to analysis to ensure representativeness.
3 Results
3.1 Construction of the G. barbadense variation map
This study employed a population of 240 G. barbadense accessions to investigate genetic variation and construct a high-density variation map. A total of 2,983,855 high-quality SNPs were identified, which were unevenly distributed across chromosomes (Supplementary Figure S1, Supplementary Table S2). The At and Dt subgenomes contained 1,947,267 and 1,036,588 SNPs, respectively, with the At subgenome harboring approximately 1.88 times more SNPs than the Dt subgenome, which was consistent with the At subgenome being roughly twice the size of the Dt subgenome (Hu et al., 2019). The average SNP density across the genome was 1.40 SNPs/kb, with densities of 1.45 SNPs/kb and 1.32 SNPs/kb in the At and Dt subgenomes, respectively. Chromosome A07 showed the highest SNP density (4.35 SNPs/kb), followed by D10 (3.48 SNPs/kb). Conversely, A03 exhibited the lowest density (0.62 SNPs/kb), with D12 marginally higher (0.64 SNPs/kb). Annotation of SNPs using ANNOVAR revealed 29,495 non-synonymous SNPs, 16,606 synonymous SNPs, 136,073 upstream/downstream SNPs, 741 stop-gain SNPs, 112 stop-loss SNPs, and 356 splicing SNPs (Supplementary Table S3). Linkage disequilibrium (LD) decay was estimated using the r² coefficient between SNPs. LD decay distances at which r² dropped to half-maximum (0.5) were approximately 3,000 kb for the whole genome, with 5,200 kb for the At subgenome and 1,300 kb for the Dt subgenome (Supplementary Figure S2). The slower LD decay in the At subgenome compared to the Dt subgenome may reflect differential selection pressures during domestication.
3.2 Population structure analysis of G. barbadense population
To investigate the origin, genetic diversity, and differentiation among subpopulations in the G. barbadense population, phylogenetic tree construction, population structure analysis, and PCA were performed. Population structure is a major factor influencing GWAS results and can lead to false positives (Price et al., 2006). Therefore, PCA and kinship (Supplementary Figure S3) matrices were incorporated to correct for population stratification and reduce spurious associations. A neighbor-joining (NJ) phylogenetic tree divided the population into four subgroups, including G1 (20 accessions), G2 (73 accessions), G3 (36 accessions), and G4 (111 accessions) (Figure 1A, Supplementary Table S4). All G1 accessions originated from regions outside Xinjiang, China. Cross-validation (CV) results showed the lowest error at K = 8, with CV errors stabilizing from K = 4 onward (Supplementary Figure S4). PCA results were consistent with the phylogenetic tree, dividing the 240 accessions into four groups (Figure 1B). Admixture analysis at K = 4 confirmed these findings, showing that accessions from regions outside Xinjiang clustered together. Notably, G4 was distinct even at K = 2, with no admixture from other groups. This indicates low genetic diversity and limited hybridization, likely due to independent artificial selection during breeding (Figure 1C). The FST and π ratios were calculated for each subgroup using SNP data to assess the differences among groups. The FST value between G1 and G2 was the highest (0.39), while the FST value between G2 and G3 was the lowest (0.08), suggesting frequent genetic exchange between G2 and G3 during breeding process. G2 exhibited the highest nucleotide diversity (π = 4.7×10⁻⁴), indicating greater genetic resources, whereas G4 had the lowest π (1.6×10⁻⁴) (Figure 1D). These results highlight significant differences among the four subgroups, with G4 showing the lowest genetic diversity and experiencing the strongest selection pressure, which provides valuable insights into the breeding history of G. barbadense.
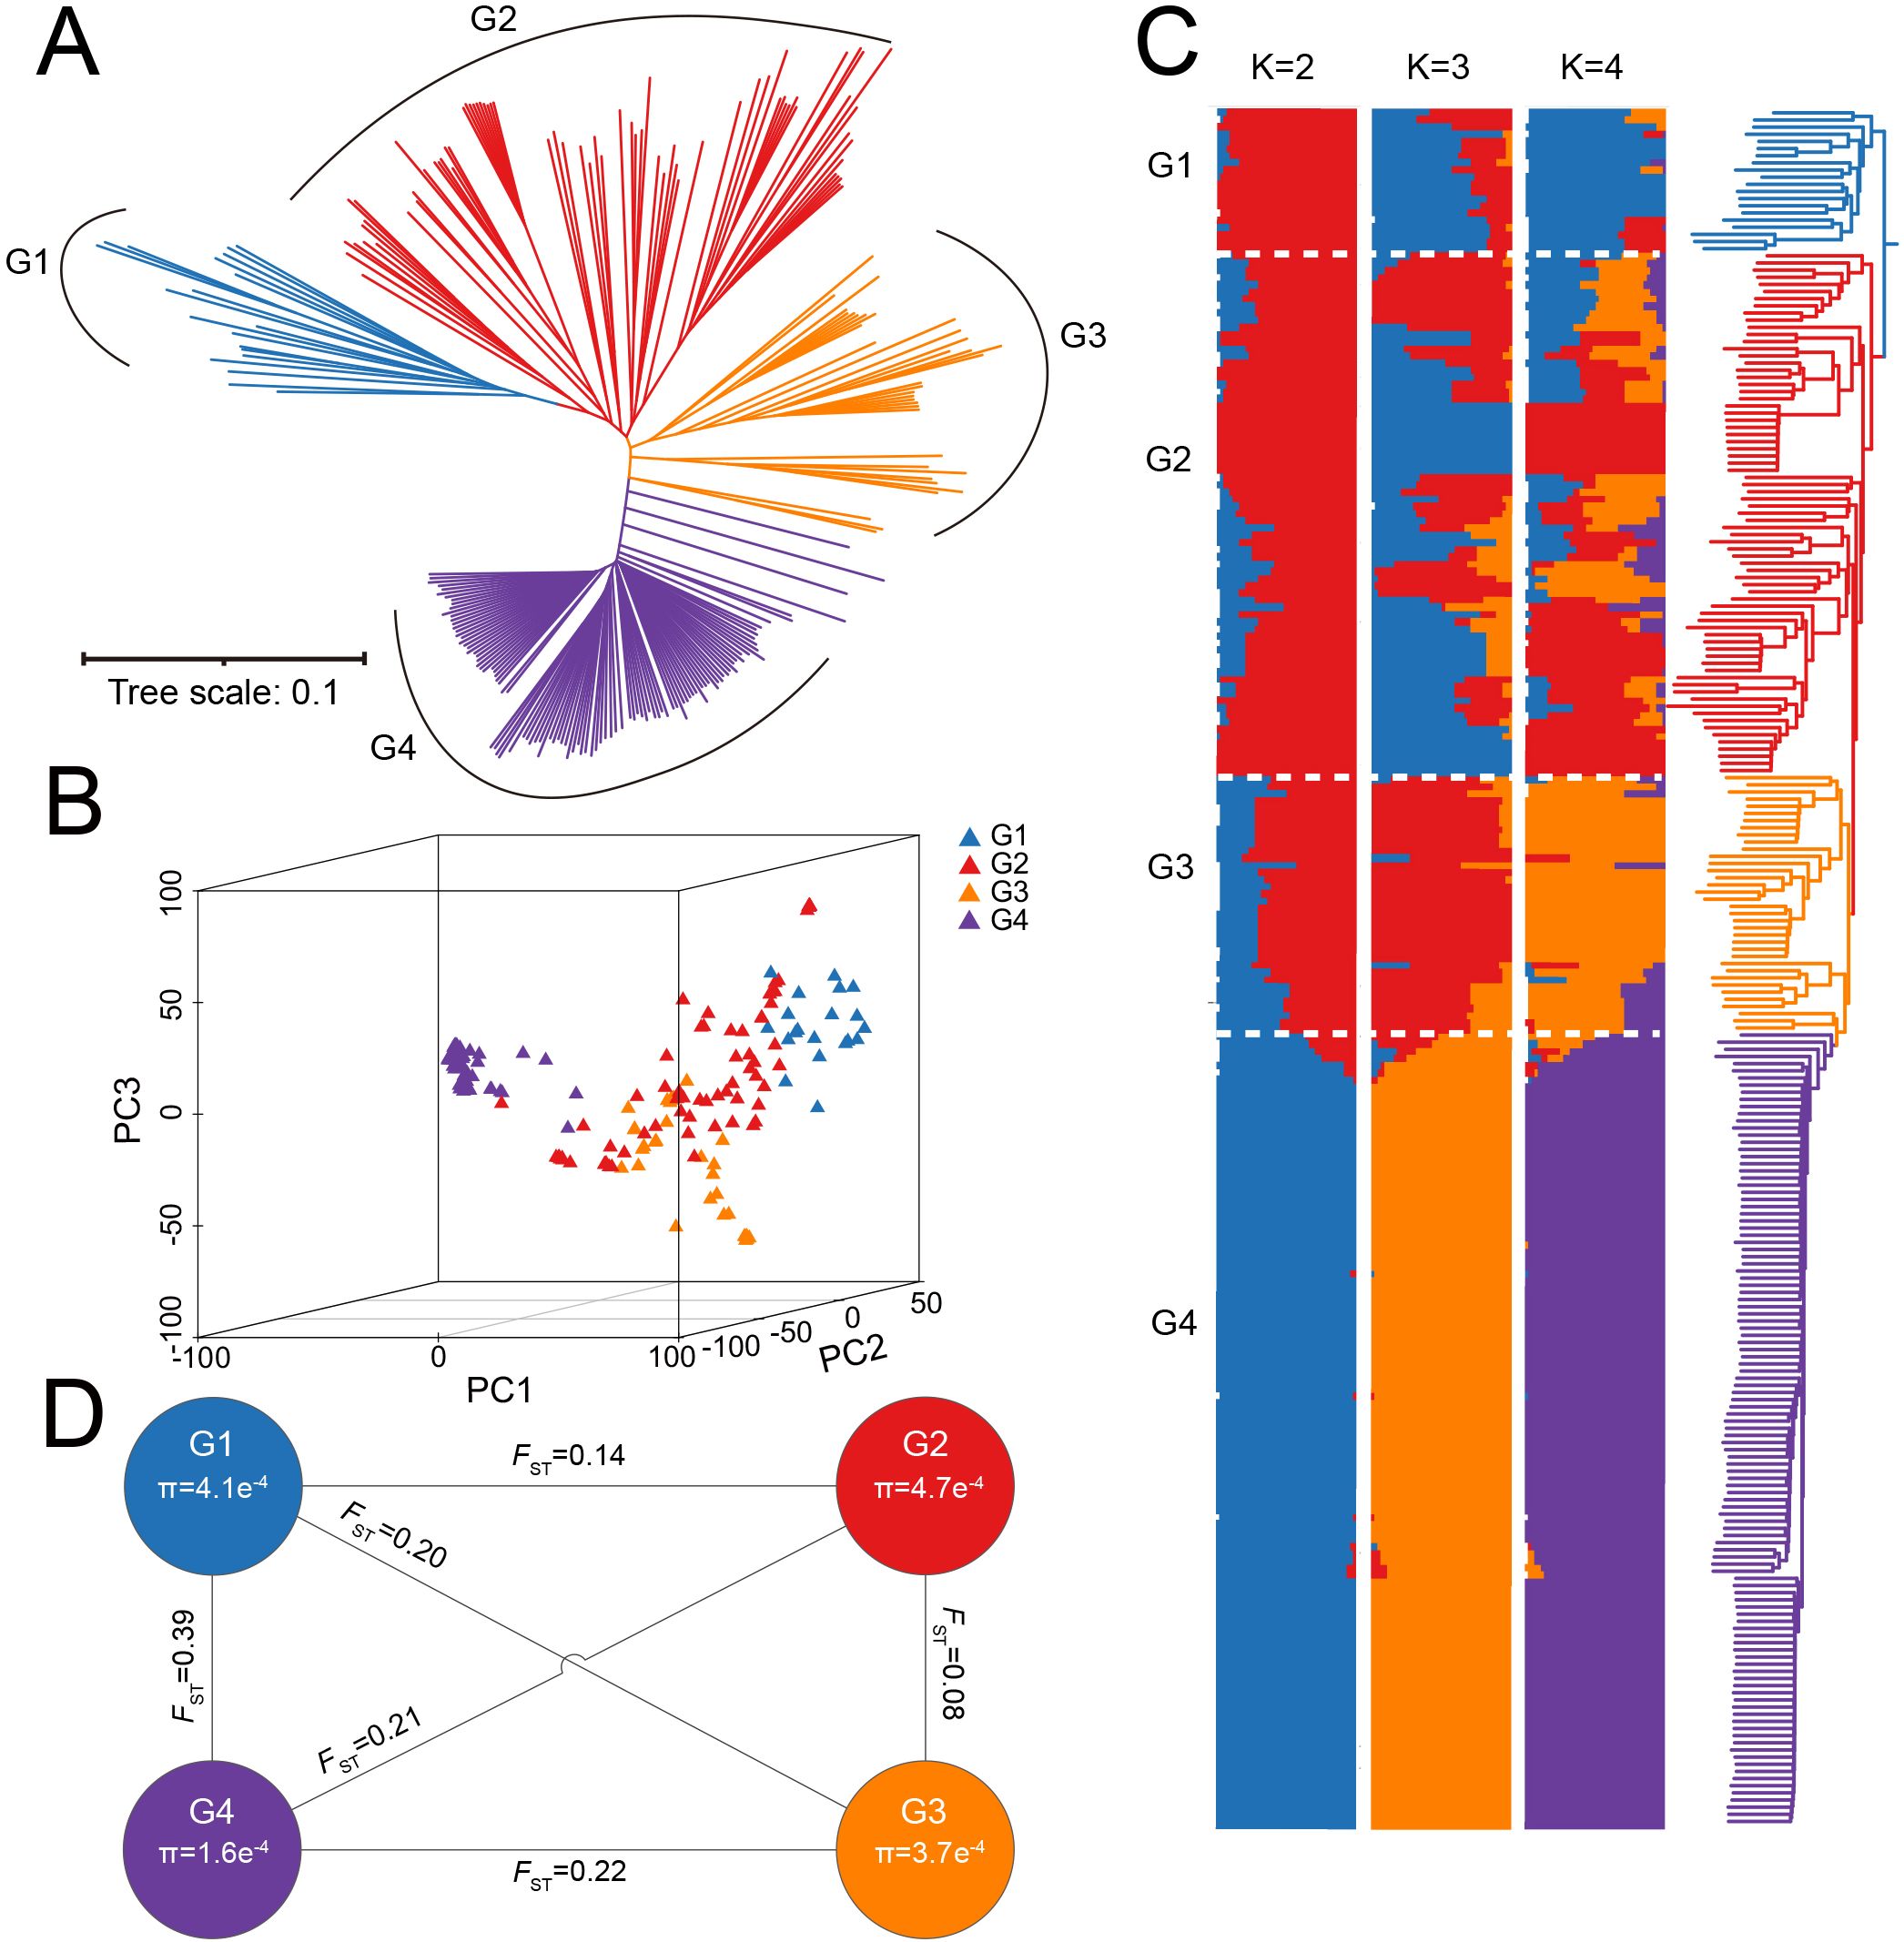
Figure 1. Population genetic structure of 240 G. barbadense. (A) Neighbor-joining phylogenetic tree of 240 G. barbadense accessions clustered into four subgroups (G1-G4). Branch colors correspond to genetic subgroups. (B) PCA of 240 accessions visualized in three dimensions. Points are colored by genetic subgroup (G1-G4). (C) Admixture ancestry proportions for K = 2-4. Vertical bars represent individual accessions, partitioned into genetic subgroups (G1-G4) at optimal K = 4. (D) FST and π across subgroups G1-G4.
3.3 Salt tolerance evaluation of G. barbadense population
Data of four traits were collected from 239 G. barbadense accessions under 200 mmol/L NaCl salt stress in both 2022 and 2023. The traits included relative plant height (RPH), relative shoot fresh weight (RSFW), relative shoot dry weight (RSDW), and relative root dry weight (RRDW). To minimize the influence of environmental and batch effects, the best linear unbiased estimates (BLUEs) for each trait were calculated (Table 1). BLUE-adjusted trait values showed differential sensitivity to salinity: RPH (0.49-0.79, mean ± SD = 0.62 ± 0.05), RSFW (0.27-0.79, 0.49 ± 0.09), RSDW (0.35-0.88, 0.58 ± 0.10), RRDW (0.35-0.85, 0.59 ± 0.08). All four metrics were less than 1, indicating that the 200 mmol/L NaCl treatment reduced plant height, shoot fresh weight, shoot dry weight, and root dry weight during the seedling stage of G. barbadense. Among the traits, the coefficient of variation (CV) of RPH was the smallest (7.99%) and RSFW was the largest (18.42%).
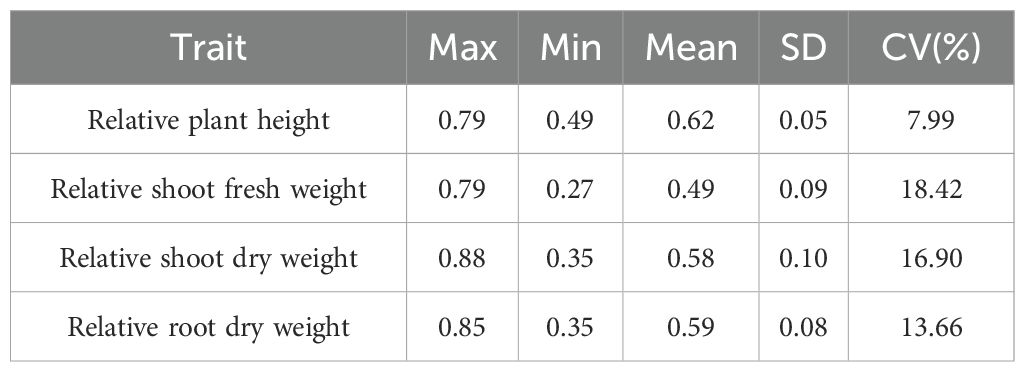
Table 1. Salt-stressed phenotypic data for 239 G. barbadense accessions.
All four traits exhibited a normal distribution across replicates under salt stress, indicating their suitability for GWAS analysis. These traits showed significant positive correlations between each other (Figure 2A). Among them, the strongest correlation was observed between RSFW and RSDW (r = 0.80), while the weakest correlation was found between RPH and RRDW (r = 0.16). In terms of RRDW, G3 showed significantly higher values than G2, and G1 performed significantly better than G2 (Figure 2B). For the other three traits, no significant differences were observed among the subgroups (Figures 2C-E). Therefore, under salt stress, the materials in subgroup G3 demonstrated better salt tolerance.
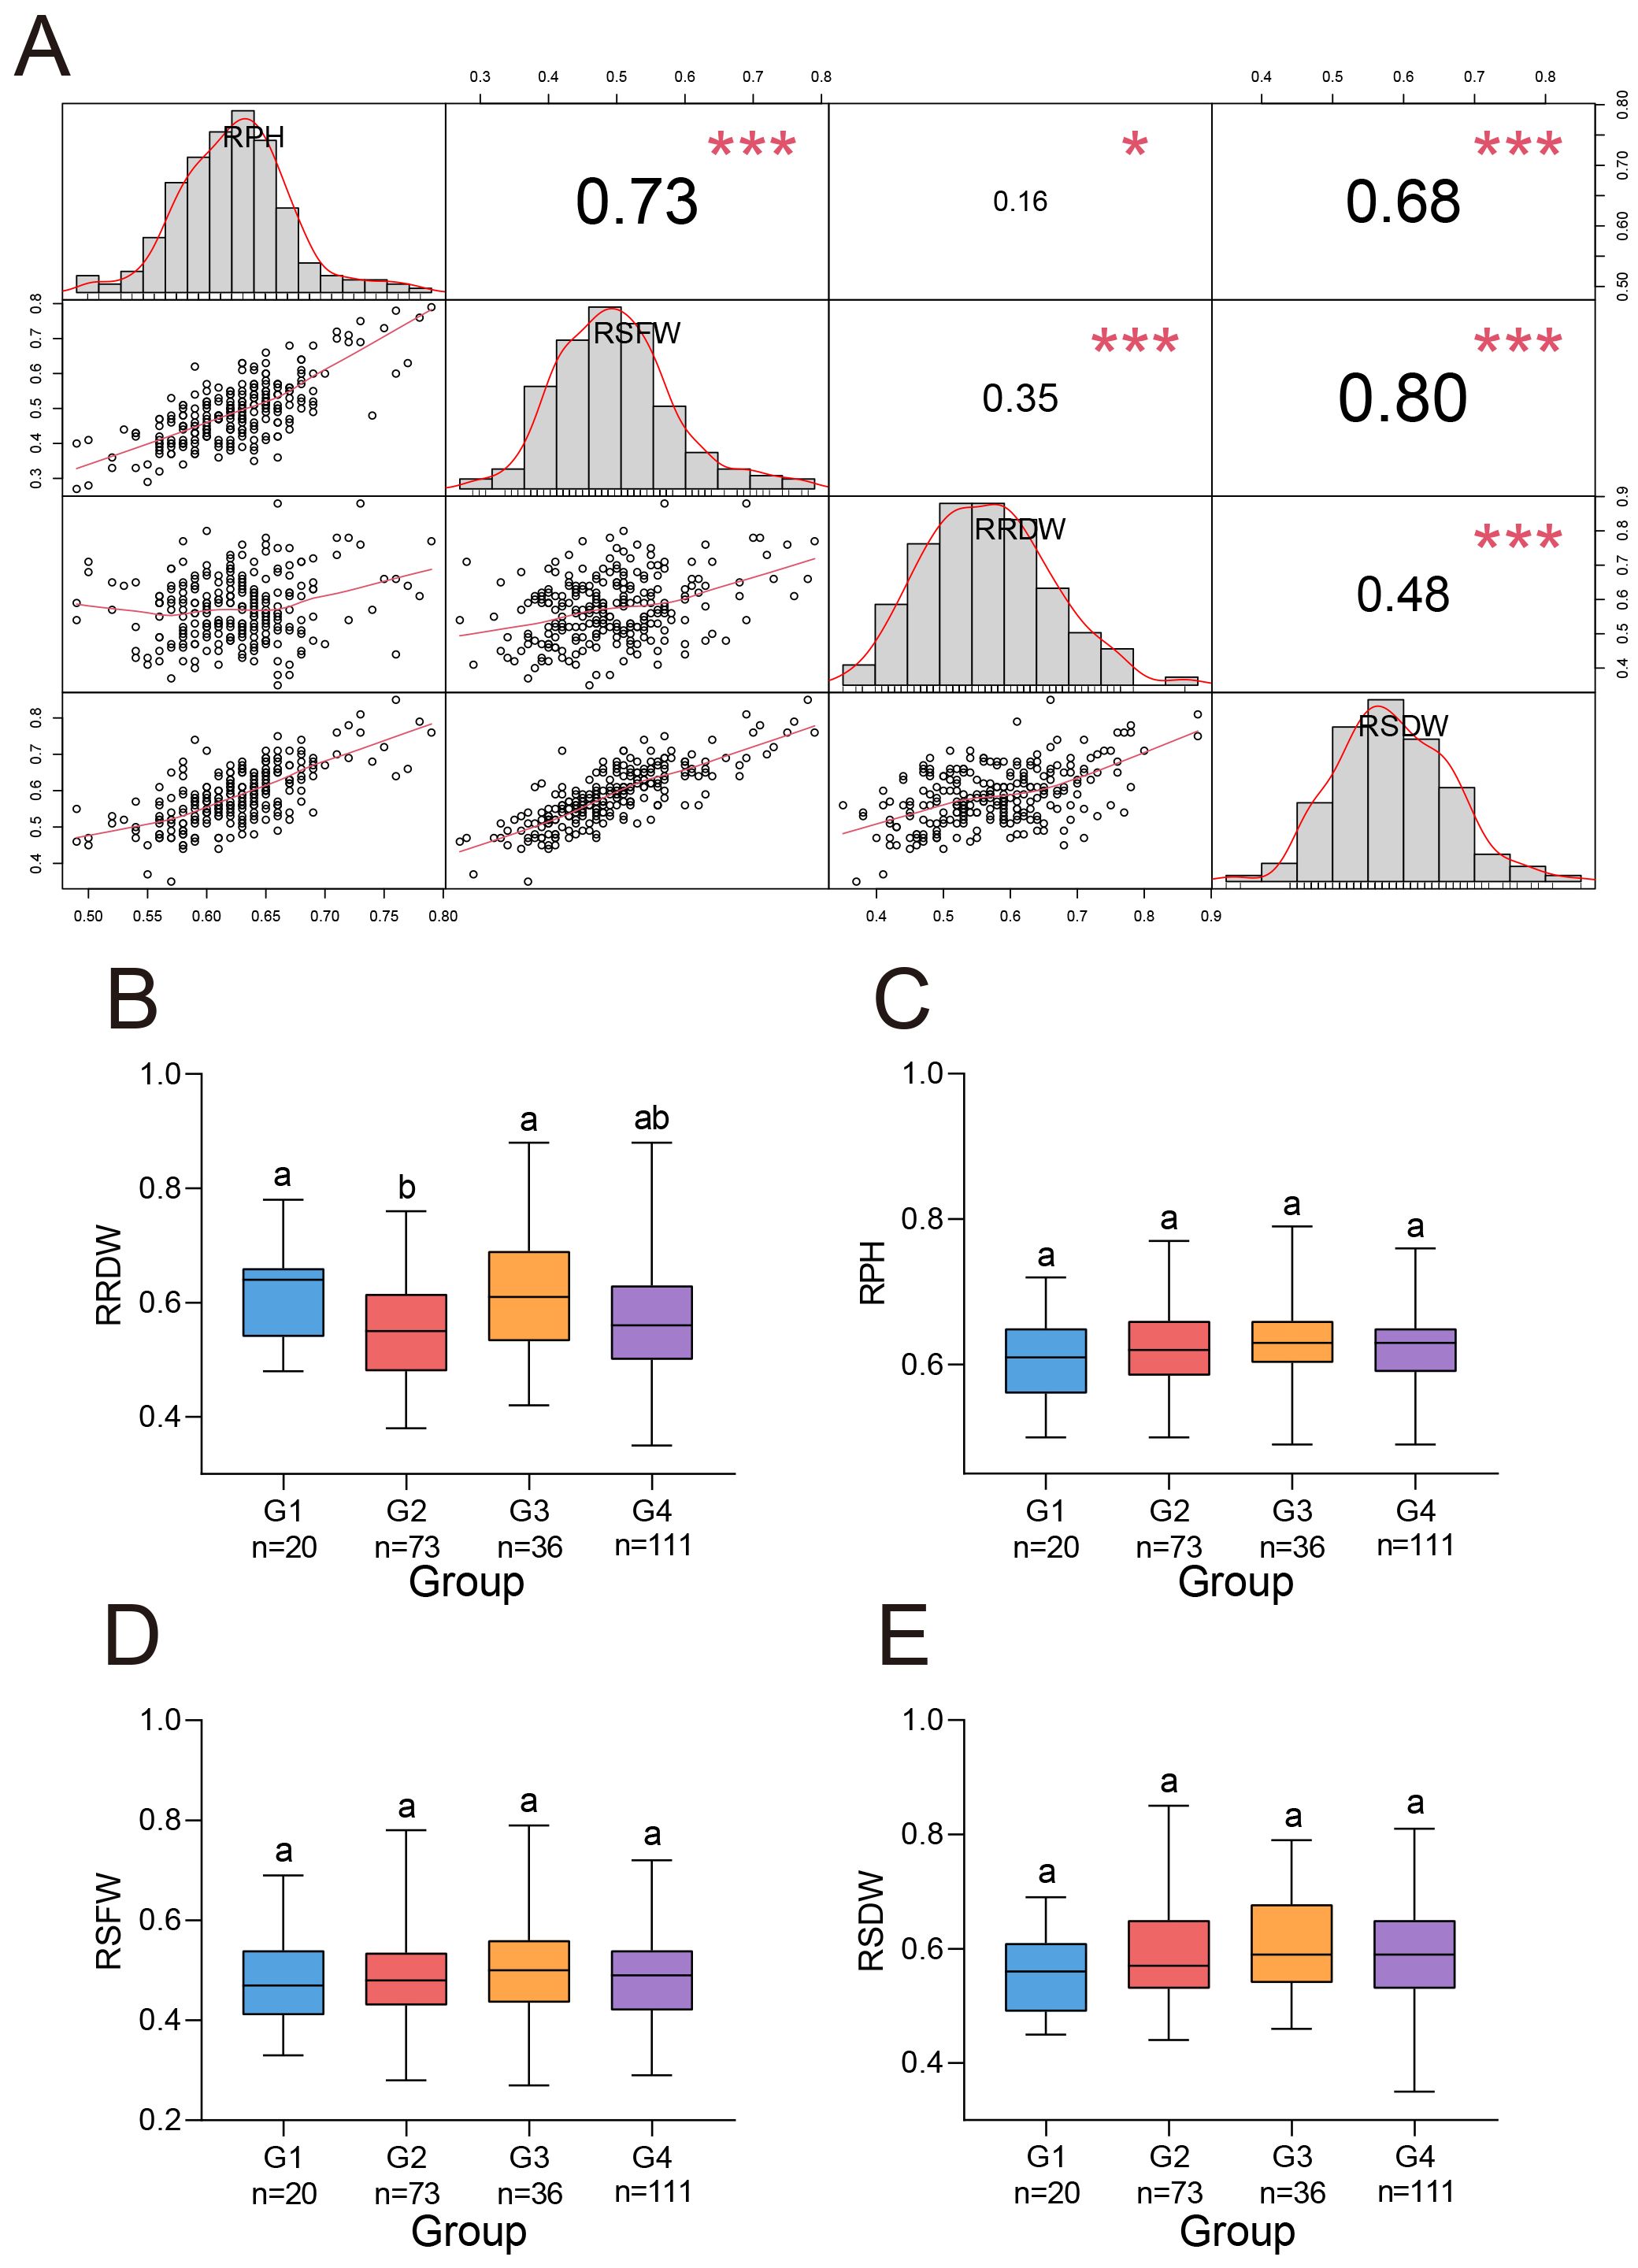
Figure 2. Four salt stress traits in G. barbadense. (A) Phenotypic correlation matrix (upper triangle) with diagonal histograms showing trait frequency distributions for 239 G. barbadense accessions. Correlation coefficients represent Pearson’s r values. Histograms display trait variance with normality distribution curves. * and *** indicated P value at the 0.05 and 0.001 levels, respectively. (B-E) Comparative analysis of normalized growth parameters across genetic subgroups (G1-G4): (B) RRDW, (C) RPH, (D) RSFW, (E) RSDW. n values: number of accessions within each subgroup. One-way analysis of variance (ANOVA) was performed to assess differences between subpopulations, significantly different (P < 0.05) groups are denoted by distinct lowercase letters.
PCA was conducted on the four relative salt-tolerance indices of the 239 G. barbadense accessions. The eigenvalues and contribution rates of each principal component are shown in Table 2. Variance partitioning showed PC1 accounted for 66.98% (λ = 2.68), PC2 21.96% (λ = 0.88), PC3 6.53% (λ = 0.26), and PC4 4.53% (λ=0.18) of total variance. The cumulative contribution rate of the first two principal components reached 88.94%, which exceeds the threshold of 85% for selecting principal components. Therefore, the first two principal components can adequately represent the information from the original four traits. PC1 (66.98% variance) showed strongest positive loading for RSDW (loading = 0.35), followed by RSFW (0.34) and RPH (0.31). PC2 (21.96% variance) was predominantly loaded by RRDW (loading = 0.94) with negative correlation to RPH (-0.47) and RSFW (-0.17).
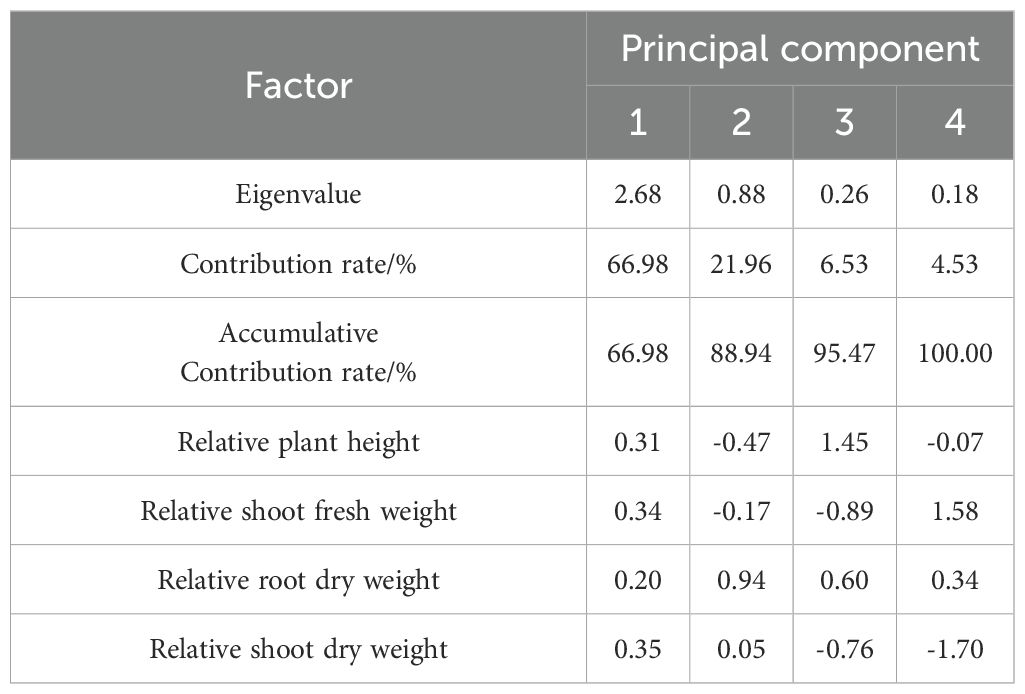
Table 2. Eigenvalues, variance contributions, and loading matrices of four PCA.
Based on the contribution rates of the PC1 and PC2, the comprehensive salt tolerance index (D value) for the 239 G. barbadense accessions was calculated using membership function analysis. Hierarchical clustering was then performed to classify the accessions into five distinct groups (Figure 3, Supplementary Table S4): 23 highly salt-tolerant, 42 moderately salt-tolerant, 110 intermediate, 39 moderately salt-sensitive, and 25 highly salt-sensitive accessions, labeled as Groups I to V, respectively. The corresponding D value ranges for the five groups: I (0.63–0.91), II (0.52–0.61), III (0.38–0.51), IV (0.28-0.37), V (0.09-0.28). Group III (intermediate tolerance) comprised 46.0% of the panel (110/239), whereas Group I (high tolerance) represented only 9.6% (23/239), reflecting the polygenic nature of salt tolerance. This classification method facilitates the screening and identification of salt-tolerant G. barbadense accessions (Group I), providing a foundation for developing salt-tolerant G. barbadense cultivars.
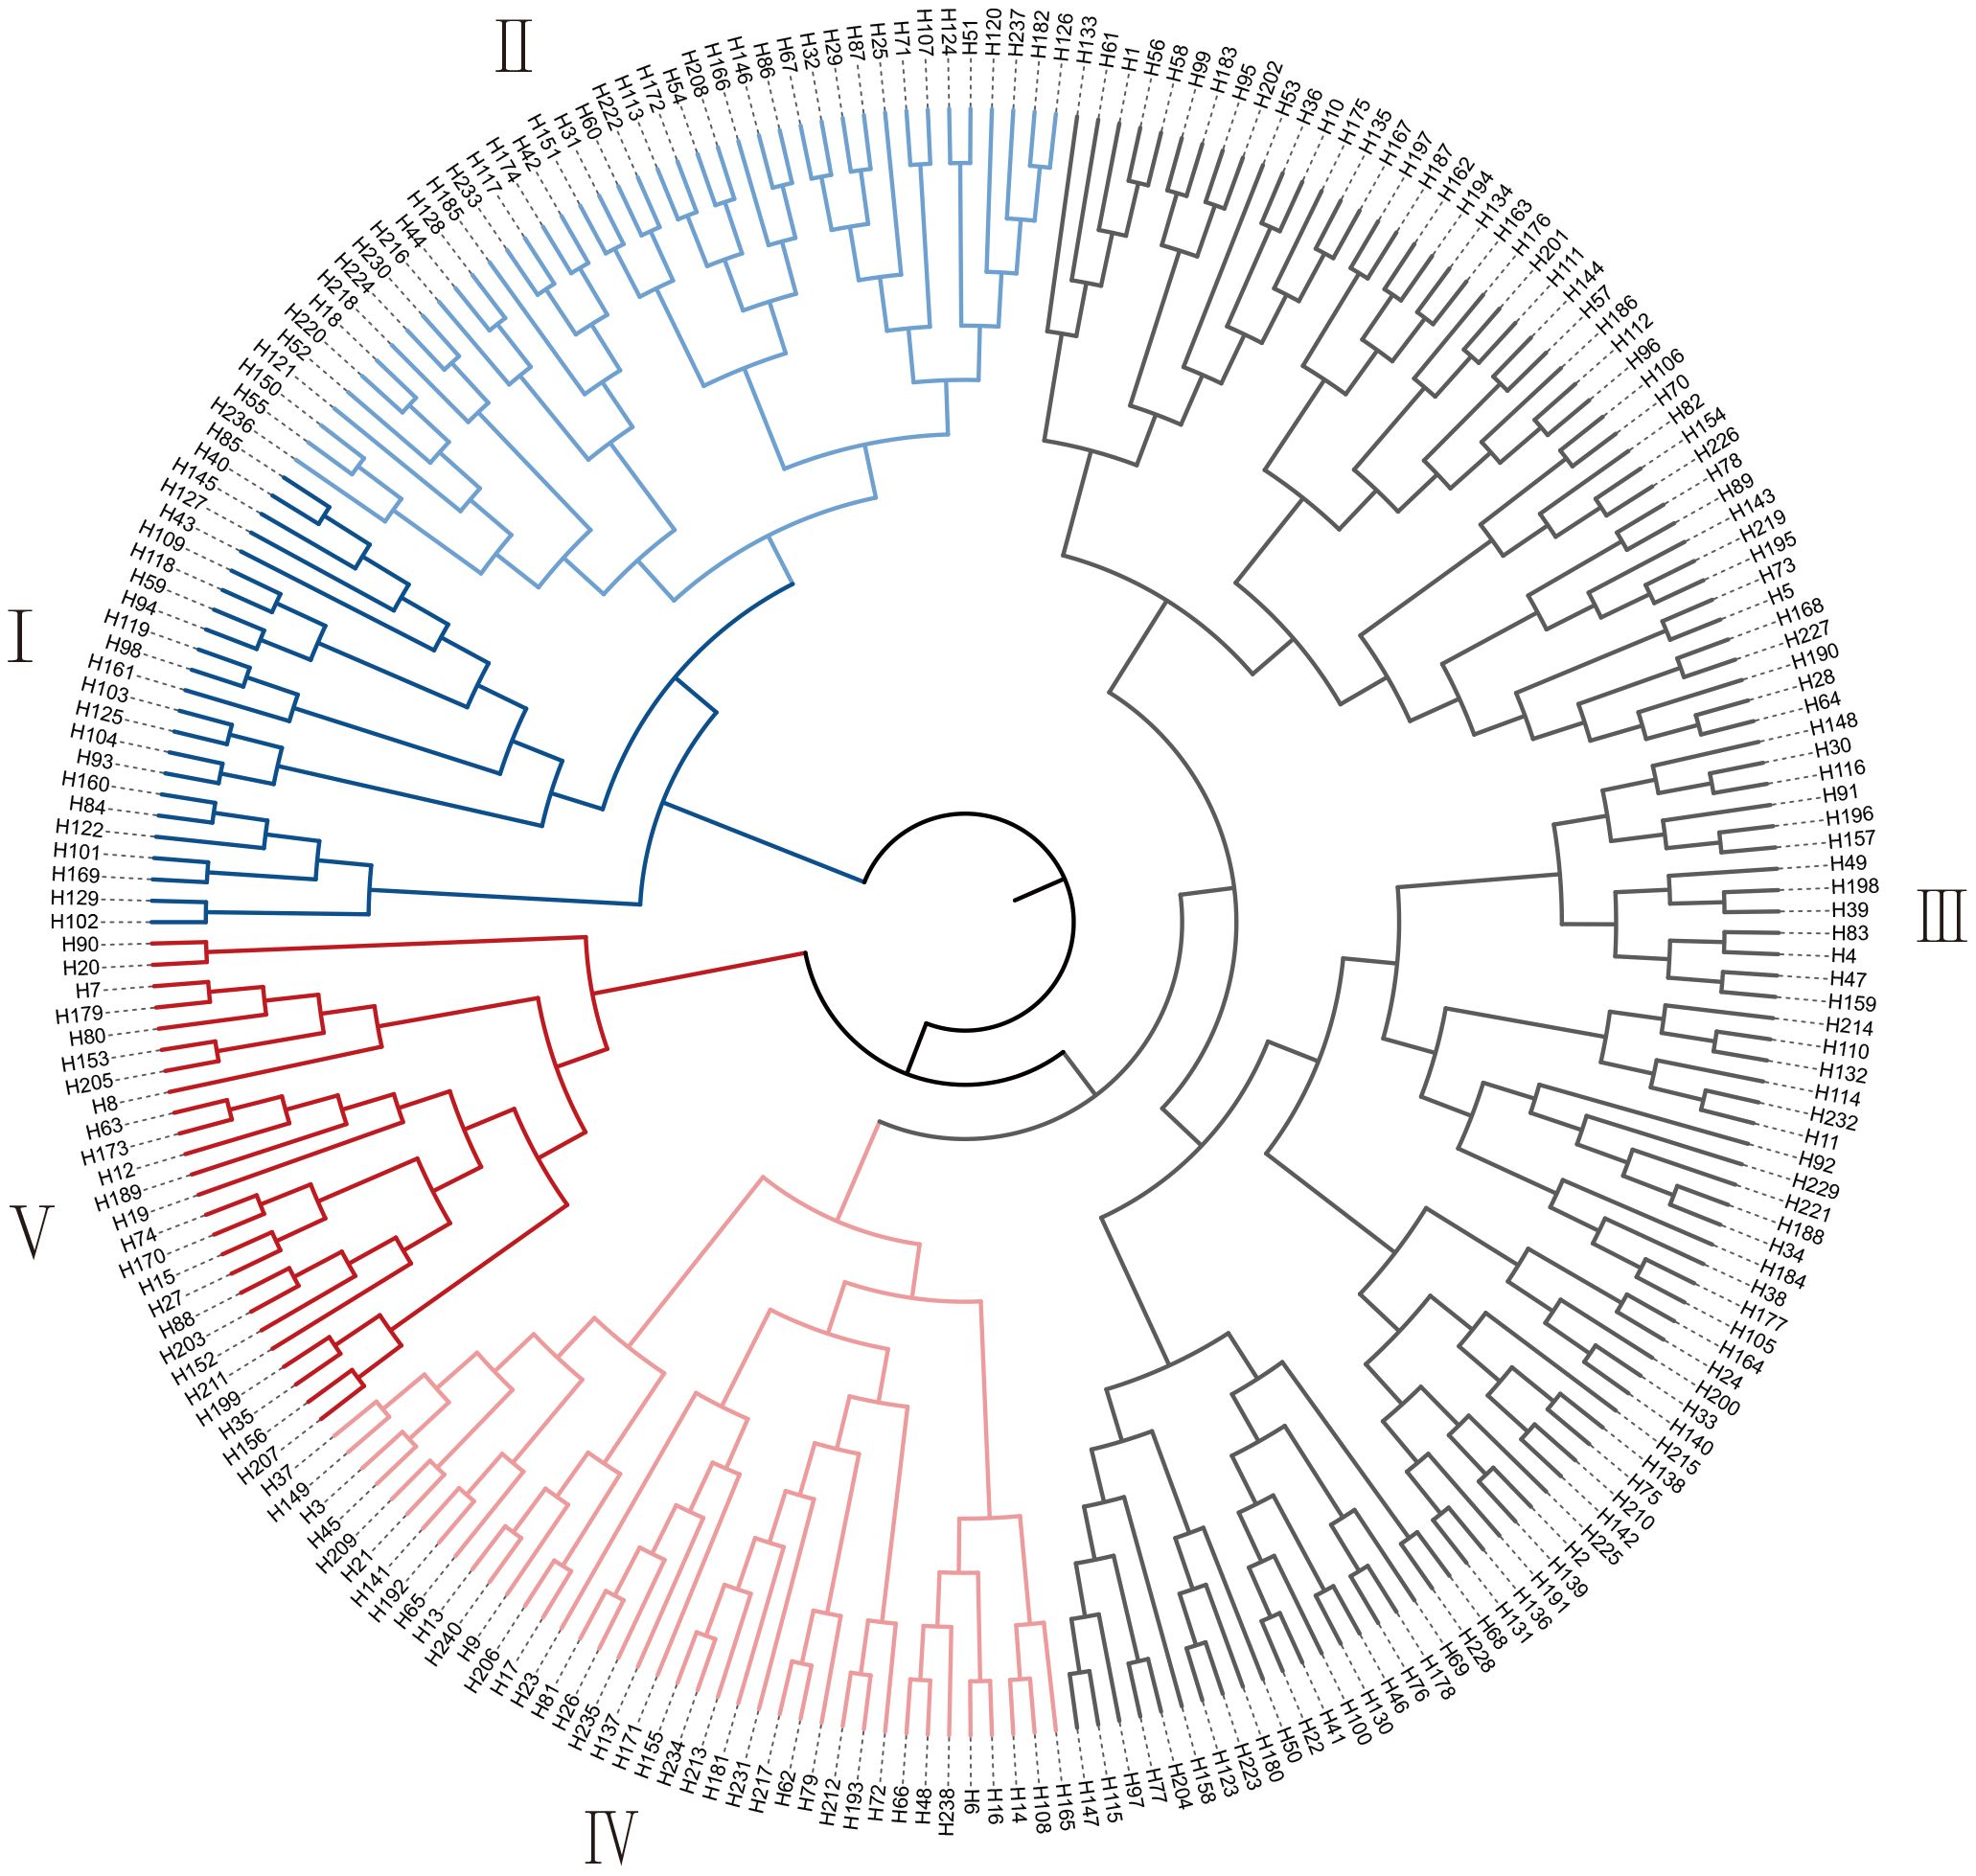
Figure 3. Clustering diagram for salt tolerance of 239 G. barbadense accessions.
3.4 Genome-wide association study of salt tolerance in G. barbadense population
Association analysis of four traits under two environments and breeding values was performed using the Mixed Linear Model (MLM). Based on the significance thresholds of p < 4.67×10⁻⁶ [1/n, where n = 213,990 effective SNPs calculated using PLINK software (Yu et al., 2021)] for SNPs detected in a single environment and p < 1×10⁻⁵ for repeatedly identifing SNPs, a total of 1,577 SNP loci were identified (Supplementary Table S5, Supplementary Figure S5). Among these, 34 SNPs were uniquely detected in single environments, while 1,543 SNPs were repeatedly identified across two or more environments or traits. Trait-specific associations showed varying genetic architectures: RPH (1,453 SNPs), RSFW (1,407), RSDW (41), RRDW (50). SNP distribution showed significant subgenome bias, with 90.8% (1,433/1,577) localized to the At subgenome versus 9.2% (144/1,577) in Dt. This disparity may be attributed to the higher linkage disequilibrium (LD) decay rate and larger LD blocks observed in the At subgenome (Supplementary Figure S2). LD decay intervals were employed to refine candidate gene selection. By defining 100-kb genomic regions upstream and downstream of significant SNPs as LD blocks (with overlapping regions merged), we identified 132 salt stress-related QTLs (Supplementary Table S6) spanning approximately 47.78 Mb collectively. The At subgenome containing 81.2% (38.80/47.78 Mb) of QTL regions versus 20.9% (9.98 Mb) in Dt. These QTL regions, representing ~2.3% of the total genome length, encompassed 811 annotated genes (Supplementary Table S7).
3.5 Identification of candidate genes
GWAS of 2022-RPH and BLUE-RPH identified a significant SNP cluster on chromosome D02 (Figure 4), delineating the QTL-SALT98 locus (Gbar_D02: 45.56-46.52 Mb; 958 kb interval) spanning approximately 958 kb. The lead SNP (Gbar_D02_45674375) marked the association peak. Within QTL-SALT98, 1,596 SNPs were subjected to linkage disequilibrium (LD) analysis using LDBlockShow, which demonstrated strong linkage disequilibrium across this genomic region (Figure 5A). Haplotype analysis partitioned accessions into two major haplotypes (Hap1 and Hap2) (Figure 5B). Notably, Hap1 exhibited significantly higher RPH values compared to Hap2 (Figure 5C), and Hap1 also showed significantly higher RSFW, RSDW, and D value than Hap2 (Supplementary Figure S6), indicating a robust association between haplotype variation and salt tolerance capacity.
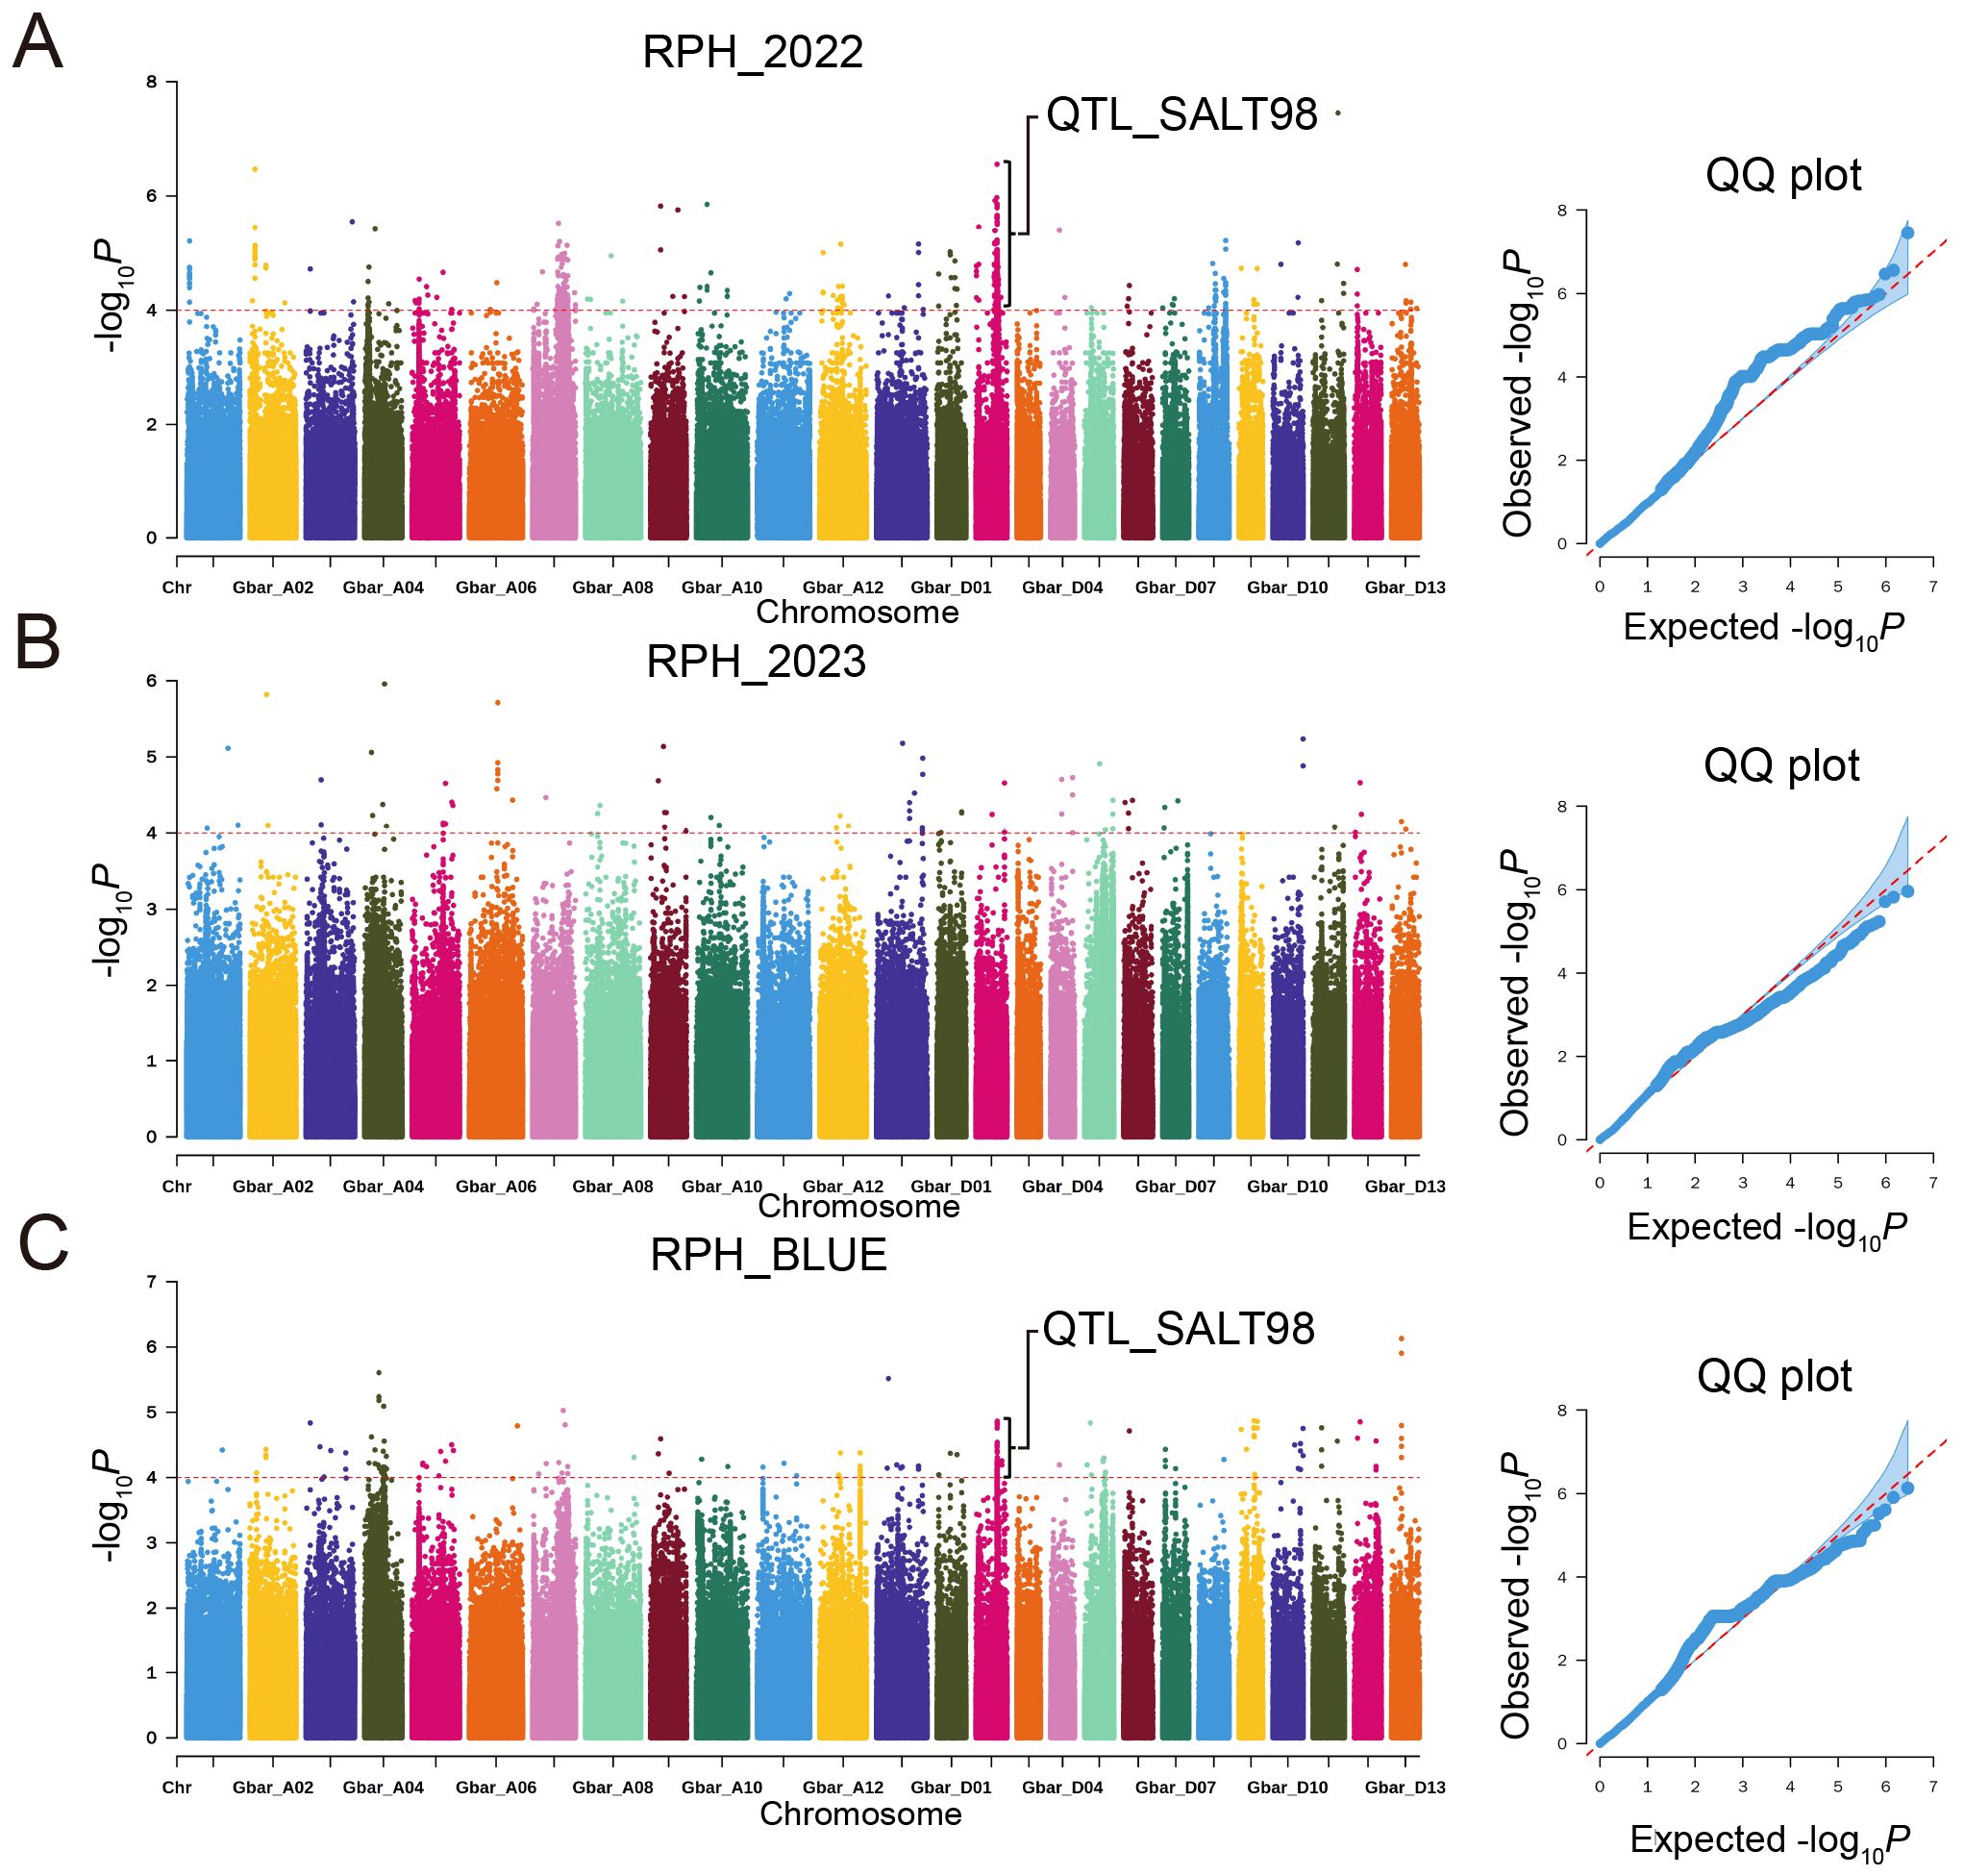
Figure 4. Manhattan and QQ plots for RPH in a GWAS of G. barbadense. (A-C) RPH: 2022 (A), 2023 (B), BLUE (C).
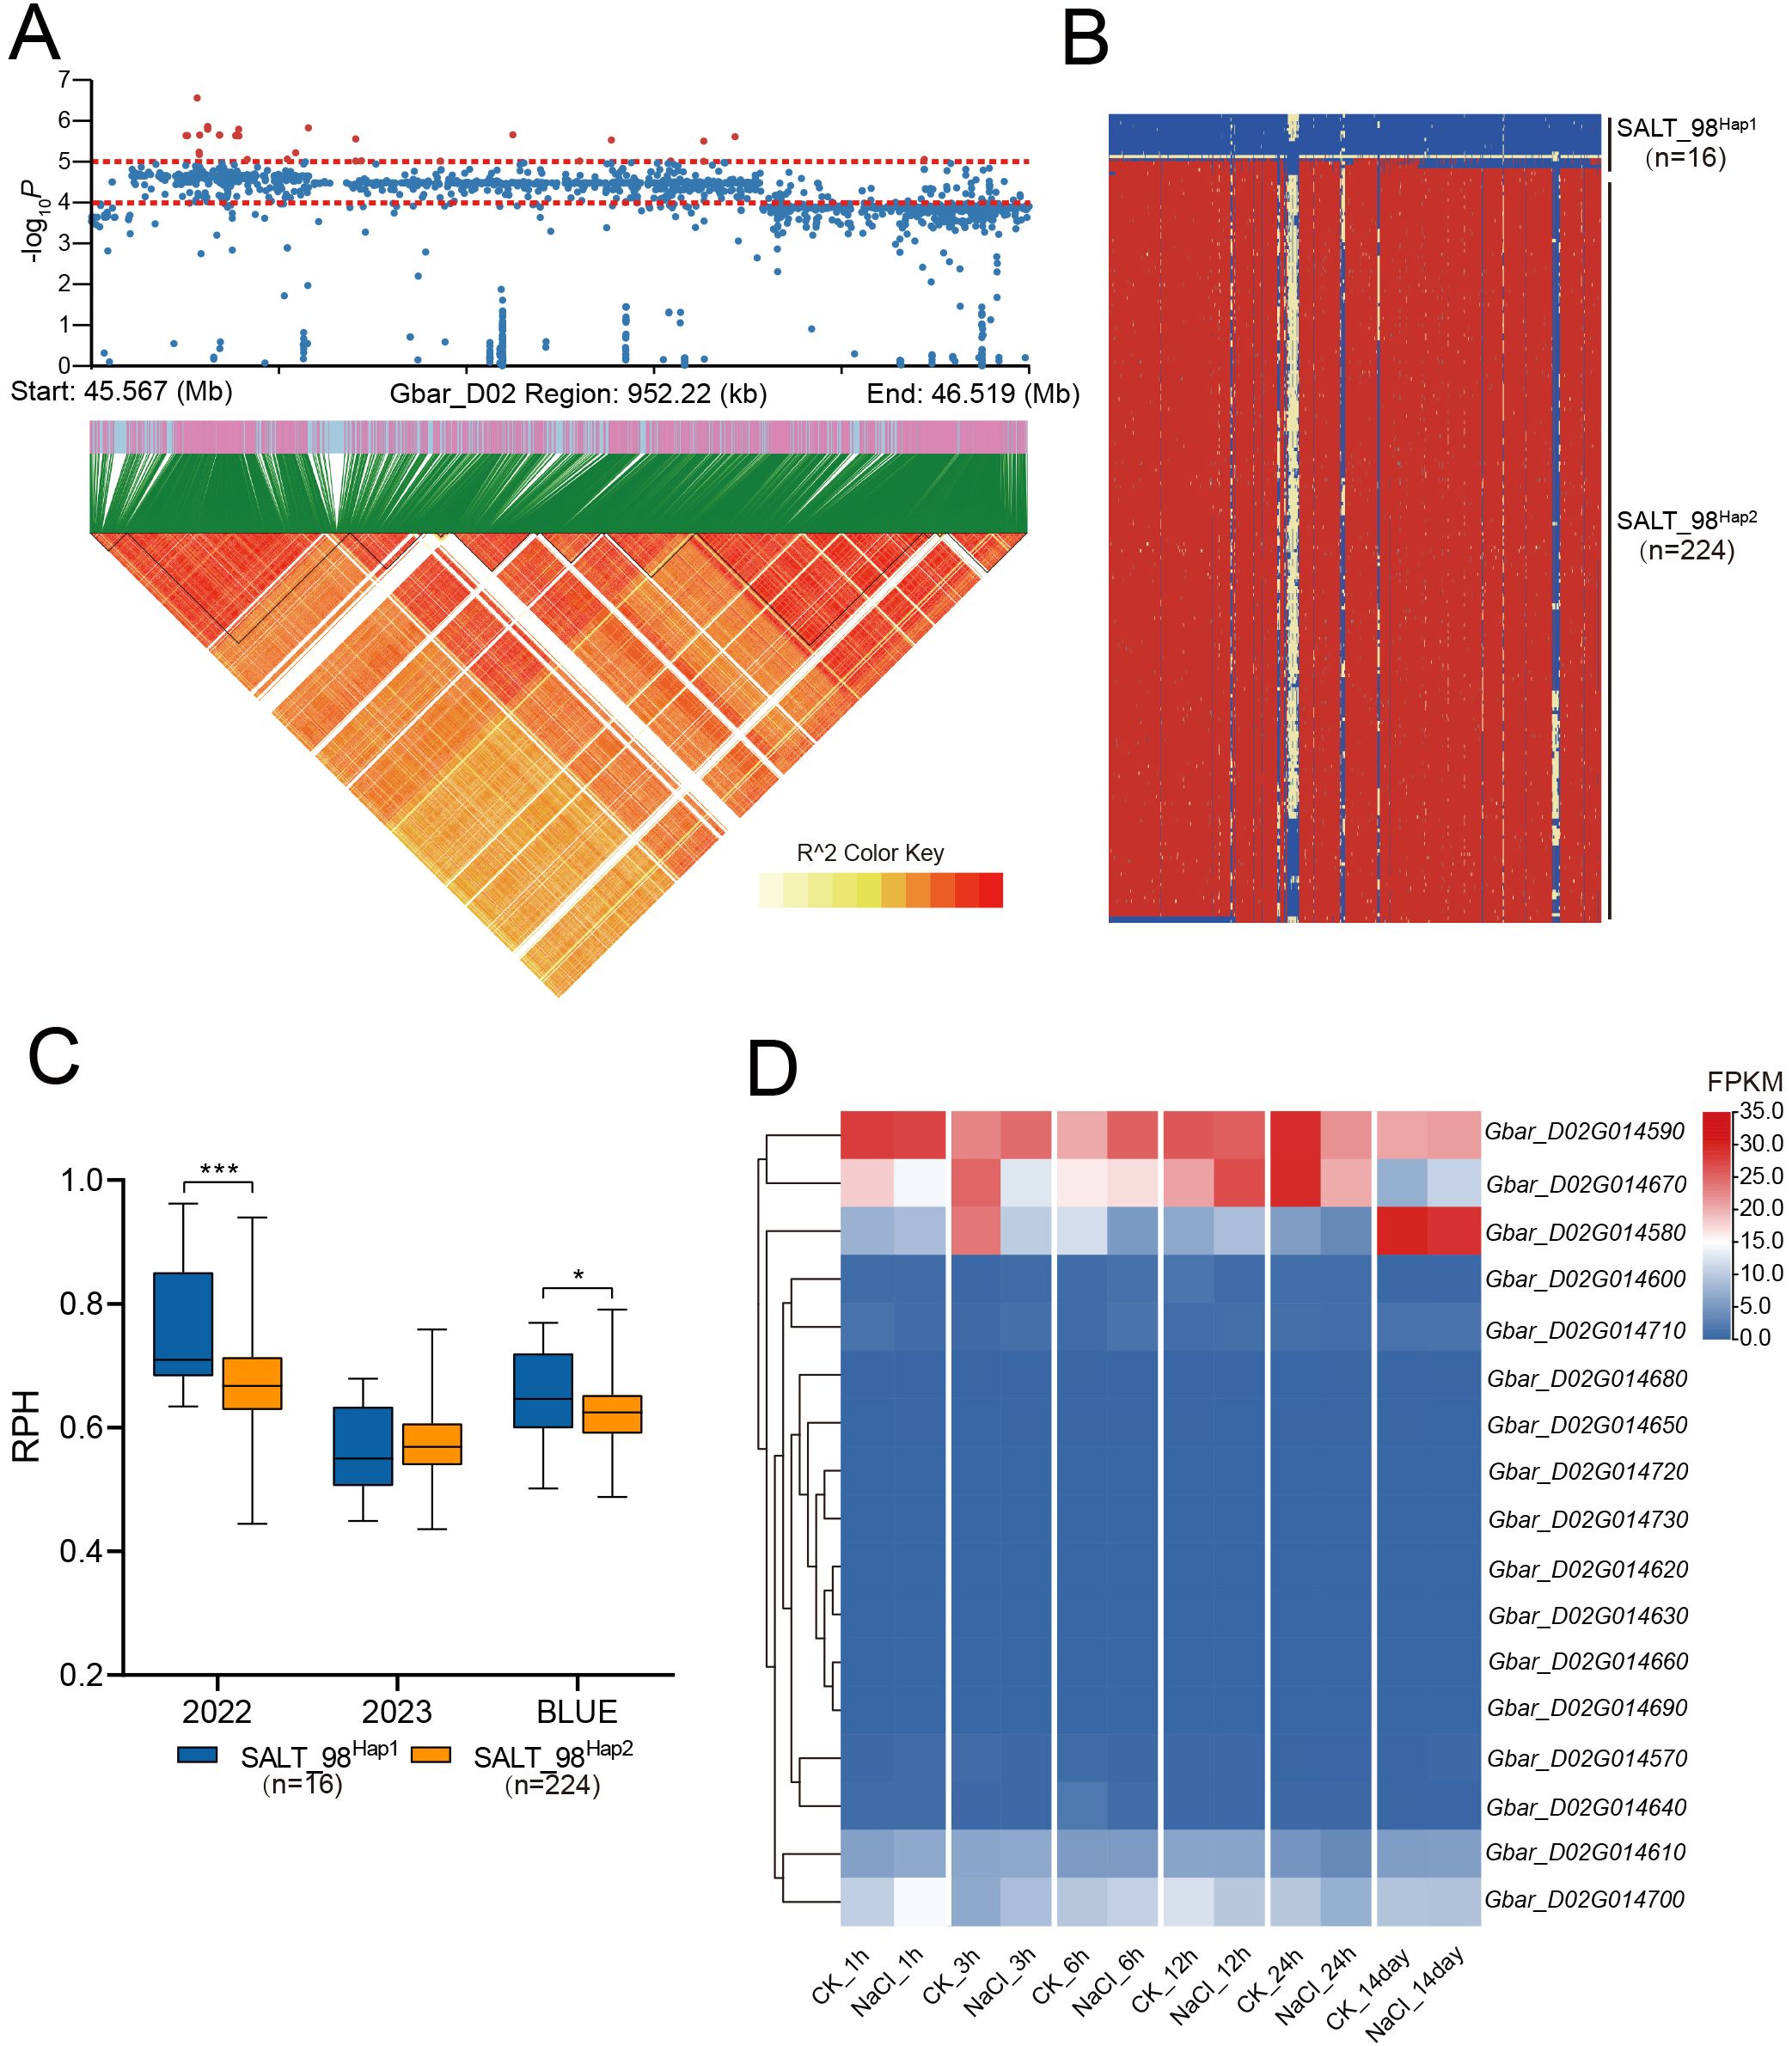
Figure 5. RPH-related loci were identified on D02. (A) Manhattan plot and LD block analysis. (B) Haplotype analysis within the CHR: D02: 45.56Mb-46.52Mb interval. (C) Box plots for RPH among different haplotypes. In the box plots, the center line denotes the median, box limits are the upper and lower quartiles, and whiskers mark the range of the data. Significance levels for inter-group differences: *P<0.05, ***P<0.001 (two-tailed Student’s t-test). (D) Heatmap of FPKM expression for genes within QTL-SALT98 under salt treatment at 1 h, 3 h, 6 h, 12 h, 24 h, and 14 day. n values, number of accessions in each haplotype.
The QTL-SALT98 interval harbors 17 candidate genes. Analysis of published RNA-seq data from salt-stressed G. barbadense revealed dynamic expression patterns of these genes across 6 time points [1 h, 3 h, 6 h, 12 h, 24 h, and 14 days post-treatment (Hu et al., 2019; Dong et al., 2022)]. Notably, only five genes: Gbar_D02G014580, Gbar_D02G014590, Gbar_D02G014610, Gbar_D02G014670, and Gbar_D02G014700 exhibited significant differential expression under salt stress (Figure 5D).
To validate candidate gene expression in extreme phenotypic materials, we selected the salt-tolerant genotype H160 and salt-sensitive genotype H20. Physiological characterization revealed contrasts in their salt tolerance. Under 7-day salt stress, H160 exhibited less structural alterations with mostly upright stems and partially turgid leaves, showing only slight wilting compared to controls, whereas H20 displayed severe wilting and pronounced stem bending (Supplementary Figures S7A, B). Growth parameters, including plant height, shoot biomass, and root dry weight, experienced moderate decreases in H160, in contrast to the significant declines observed in H20 under salinity (Supplementary Figures S7C-F). Ion profiling showed H160 roots retained 40% higher K+ content with a lower Na+/K+ ratio than H20, while its leaves maintained 40% lower Na+ accumulation and 45% reduced Na+/K+ ratio (Supplementary Figures S7 G-I), demonstrating coordinated regulation of Na+ exclusion in leaves and K+ retention in roots. These ion balance results indicate that H160 achieves salt tolerance by coordinating Na+ exclusion in leaves and K+ retention in roots, maintaining cellular ionic homeostasis critical for osmotic balance and enzyme function under salinity. In contrast, H20 failures to restrict Na+ accumulation in leaves and preserves root K+ levels, which leads to disrupted ion homeostasis and results in severe growth inhibition and wilted phenotype.
Given these physiological disparities, we performed qRT-PCR validation at 0 h, 24 h, and 48 h post-treatment. Results demonstrated that Gbar_D02G014580 and Gbar_D02G014610 showed higher expression in H20 at 48 h, while Gbar_D02G014590 exhibited elevated expression in H20 at 24 h (Figures 6A-C). Conversely, Gbar_D02G014670 expression in H160 significantly surpassed that in H20 at both 24 h and 48 h, with the most pronounced difference observed at 48 h (Figure 6D). In addition, there was no significant difference in Gbar_D02G014700 at each time (Figure 6E). These findings implicate Gbar_D02G014590, Gbar_D02G014610, Gbar_D02G014670, and Gbar_D02G014700 as salt-responsive candidate genes. Functional annotation of Arabidopsis homologs revealed that Gbar_D02G014670 (AT2G01850, GbXTH27) encodes a xyloglucan endotransglucosylase/hydrolase (XTH), which was critical for cell wall remodeling, while Gbar_D02G014590 (AT1G16020, GbCCZ1A) encodes a vacuolar fusion protein, as a component of the MON1–CCZ1 complex, CCZ1A regulates post-Golgi vesicle transport to ensure targeted transport of storage proteins to protein storage vacuoles. CCZ1A dysfunction leads to seed development defects (Pan et al., 2021). Gbar_D02G014610 (AT1G24706, GbTHO2) is a core component of the THO/TREX complex, which was essential for miRNA biogenesis. Gbar_D02G014700 (AT1G14710) encodes a hydroxyproline-rich glycoprotein family protein. Gbar_D02G014580 (AT1G68020, GbTPS6) encodes a trehalose-6-phosphatase catalyzing trehalose-6-phosphate (T6P) biosynthesis. T6P regulates sucrose biosynthesis, source-sink allocation, and developmental signaling in plants (Fichtner and Lunn, 2021).
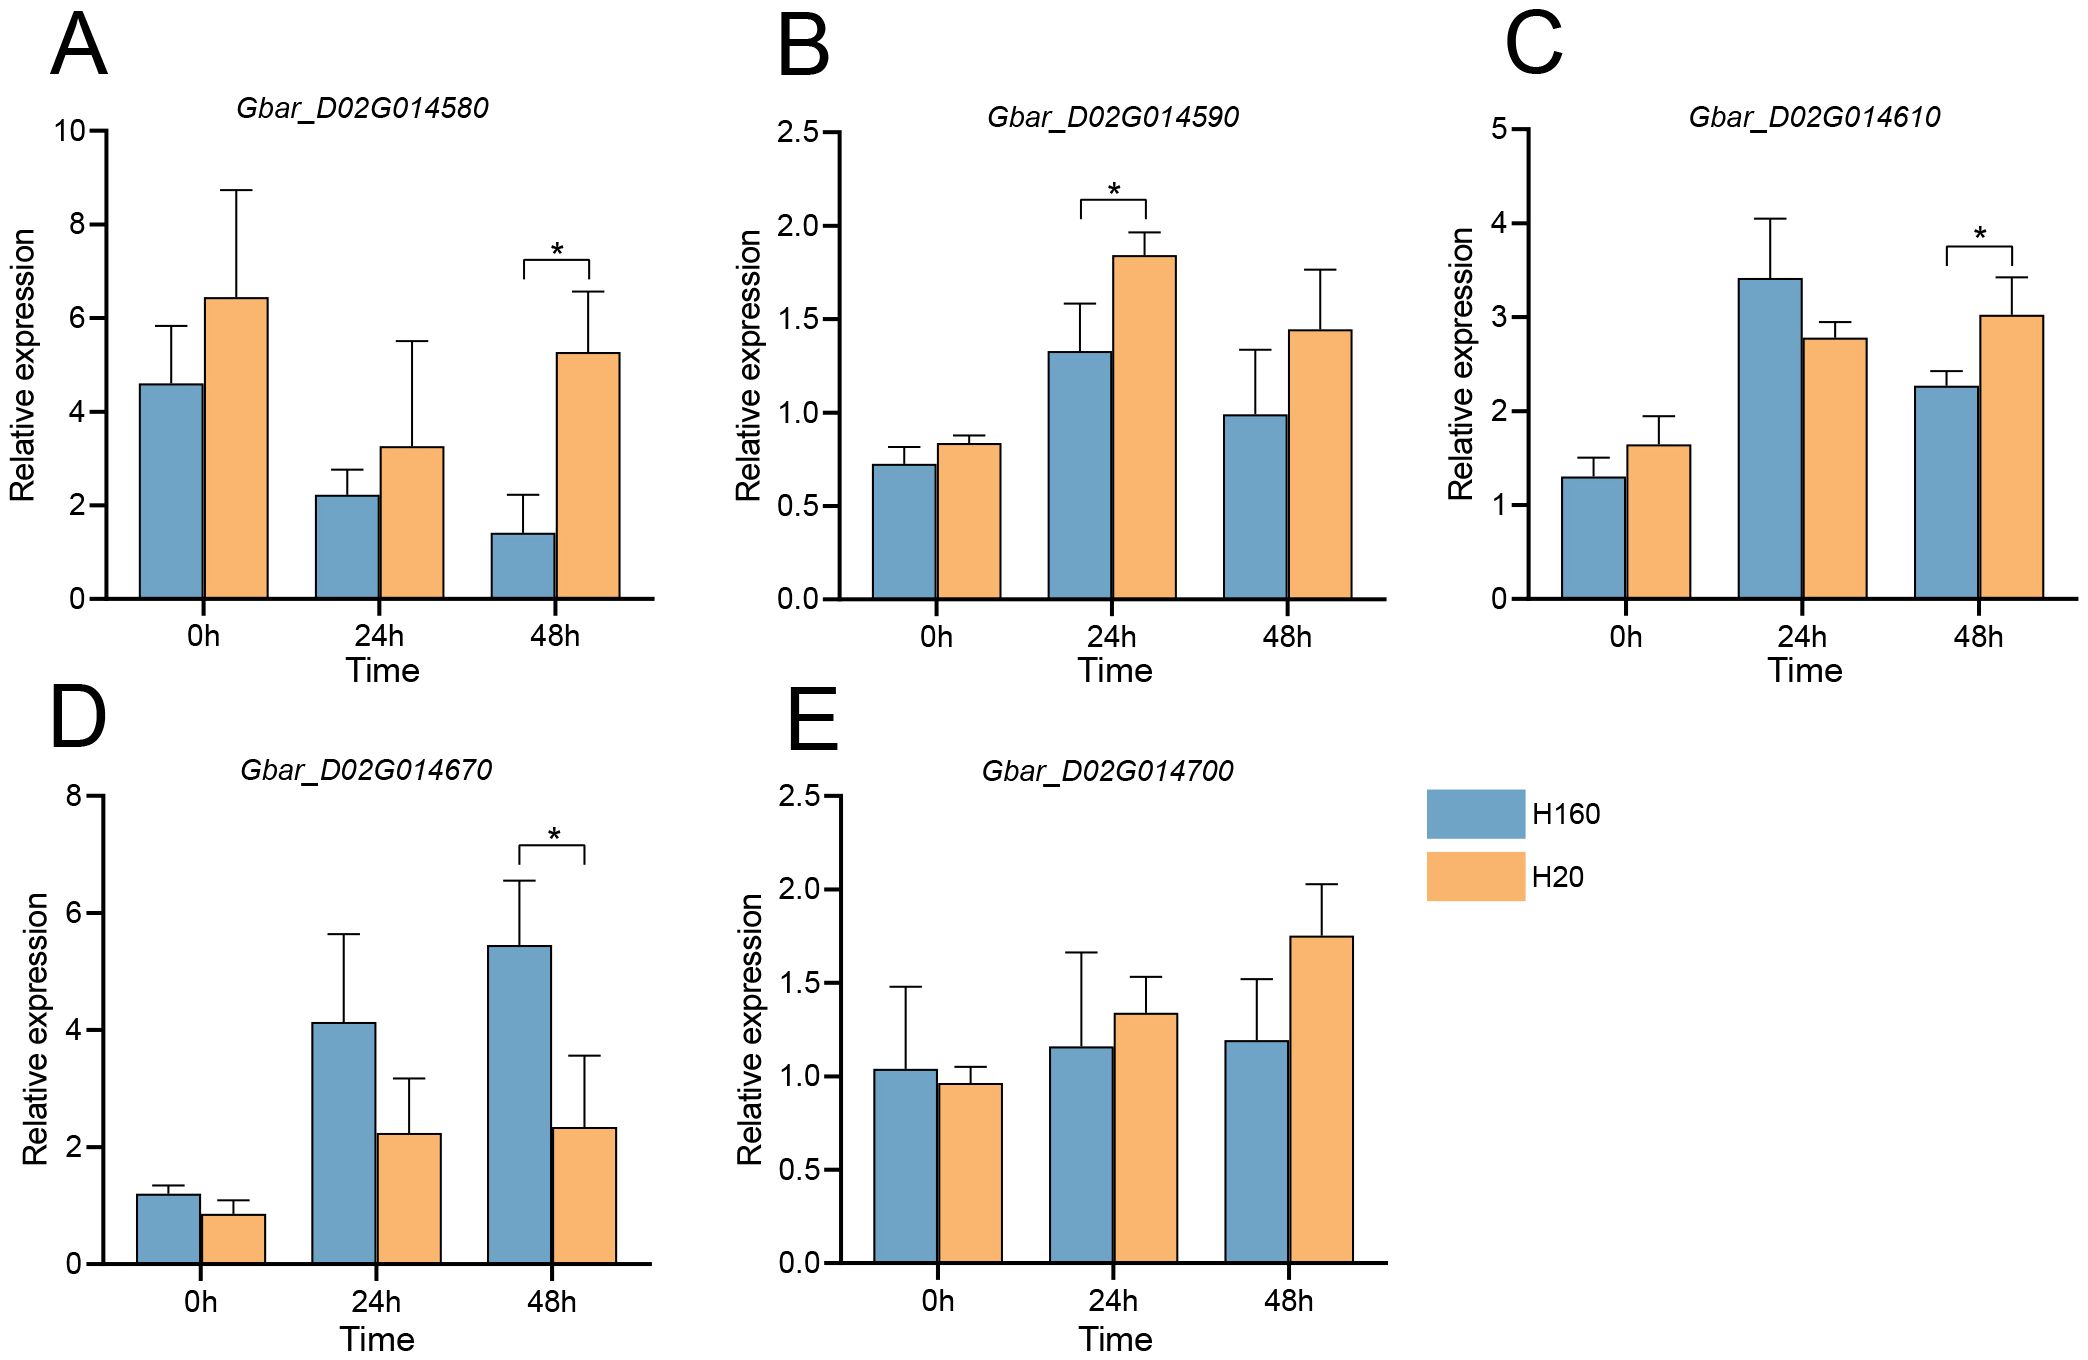
Figure 6. qRT-PCR analysis of five genes in the salt-tolerant material H160 and the salt-sensitive material H20 at 0 h, 24 h and 48 h under 200 mmol/L NaCl treatment. (A) Gbar_D02G014580. (B) Gbar_D02G014590. (C) Gbar_D02G014610. (D) Gbar_D02G014670. (E) Gbar_D02G014700. Expression levels were normalized to the housekeeping gene UBQ7. Significance levels for inter-group differences: *P<0.05 (two-tailed Student’s t-test).
3.6 Functional validation of GbXTH27 in salt tolerance
VIGS of GbXTH27 in the G. barbadense standard line 3–79 under salt stress (200 mM NaCl) were performed to verify its gene function. VIGS resulted in white-leaf phenotype (Supplementary Figure S8A) and significant transcript reduction (Supplementary Figure S8B). After 7 days of salt stress treatment, silenced plants (pTRV2: GbXTH27) displayed exacerbated wilting in cotyledons and true leaves compared to controls (TRV:00) (Figures 7A, B). Under salt stress conditions, TRV: GbXTH27 showed significantly lower values in plant height, shoot fresh weight, shoot dry weight, and root dry weight than TRV:00 controls (Supplementary Figures S9A-D). Additionally, Na+ content in the roots, shoots, and leaves of TRV: GbXTH27 was significantly higher than that in TRV:00 (Supplementary Figure S9E), while K+ content in the shoots and leaves of TRV: GbXTH27 was significantly lower than in TRV:00 (Supplementary Figure S9F). Consequently, the Na+/K+ ratio in the roots, shoots, and leaves of TRV: GbXTH27 was significantly higher than in TRV:00 (Supplementary Figure S9G), indicating that TRV: GbXTH27 experienced more severe salt stress. After 7 days of NaCl treatment, the leaf DAB staining area of TRV: GbXTH27 plants was significantly larger than that of TRV:00 controls, with deeper staining intensity in TRV: GbXTH27(Figure 7C). This indicates that silencing GbXTH27 leads to a significant increase in reactive oxygen species (ROS) accumulation in leaves, significantly reducing the salt stress resistance of cotton seedlings. Physiological assays revealed diminished SOD activity and Pro content, alongside elevated MDA levels in silenced plants (Figures 7D-F), indicating compromised antioxidant capacity, membrane integrity, and osmotic adjustment. These results confirm GbXTH27 as a key regulator of salt tolerance. The peak SNP (Gbar_D02_45674375) within QTL-SALT98 serves as a molecular marker for breeding salt-tolerant cotton cultivars.
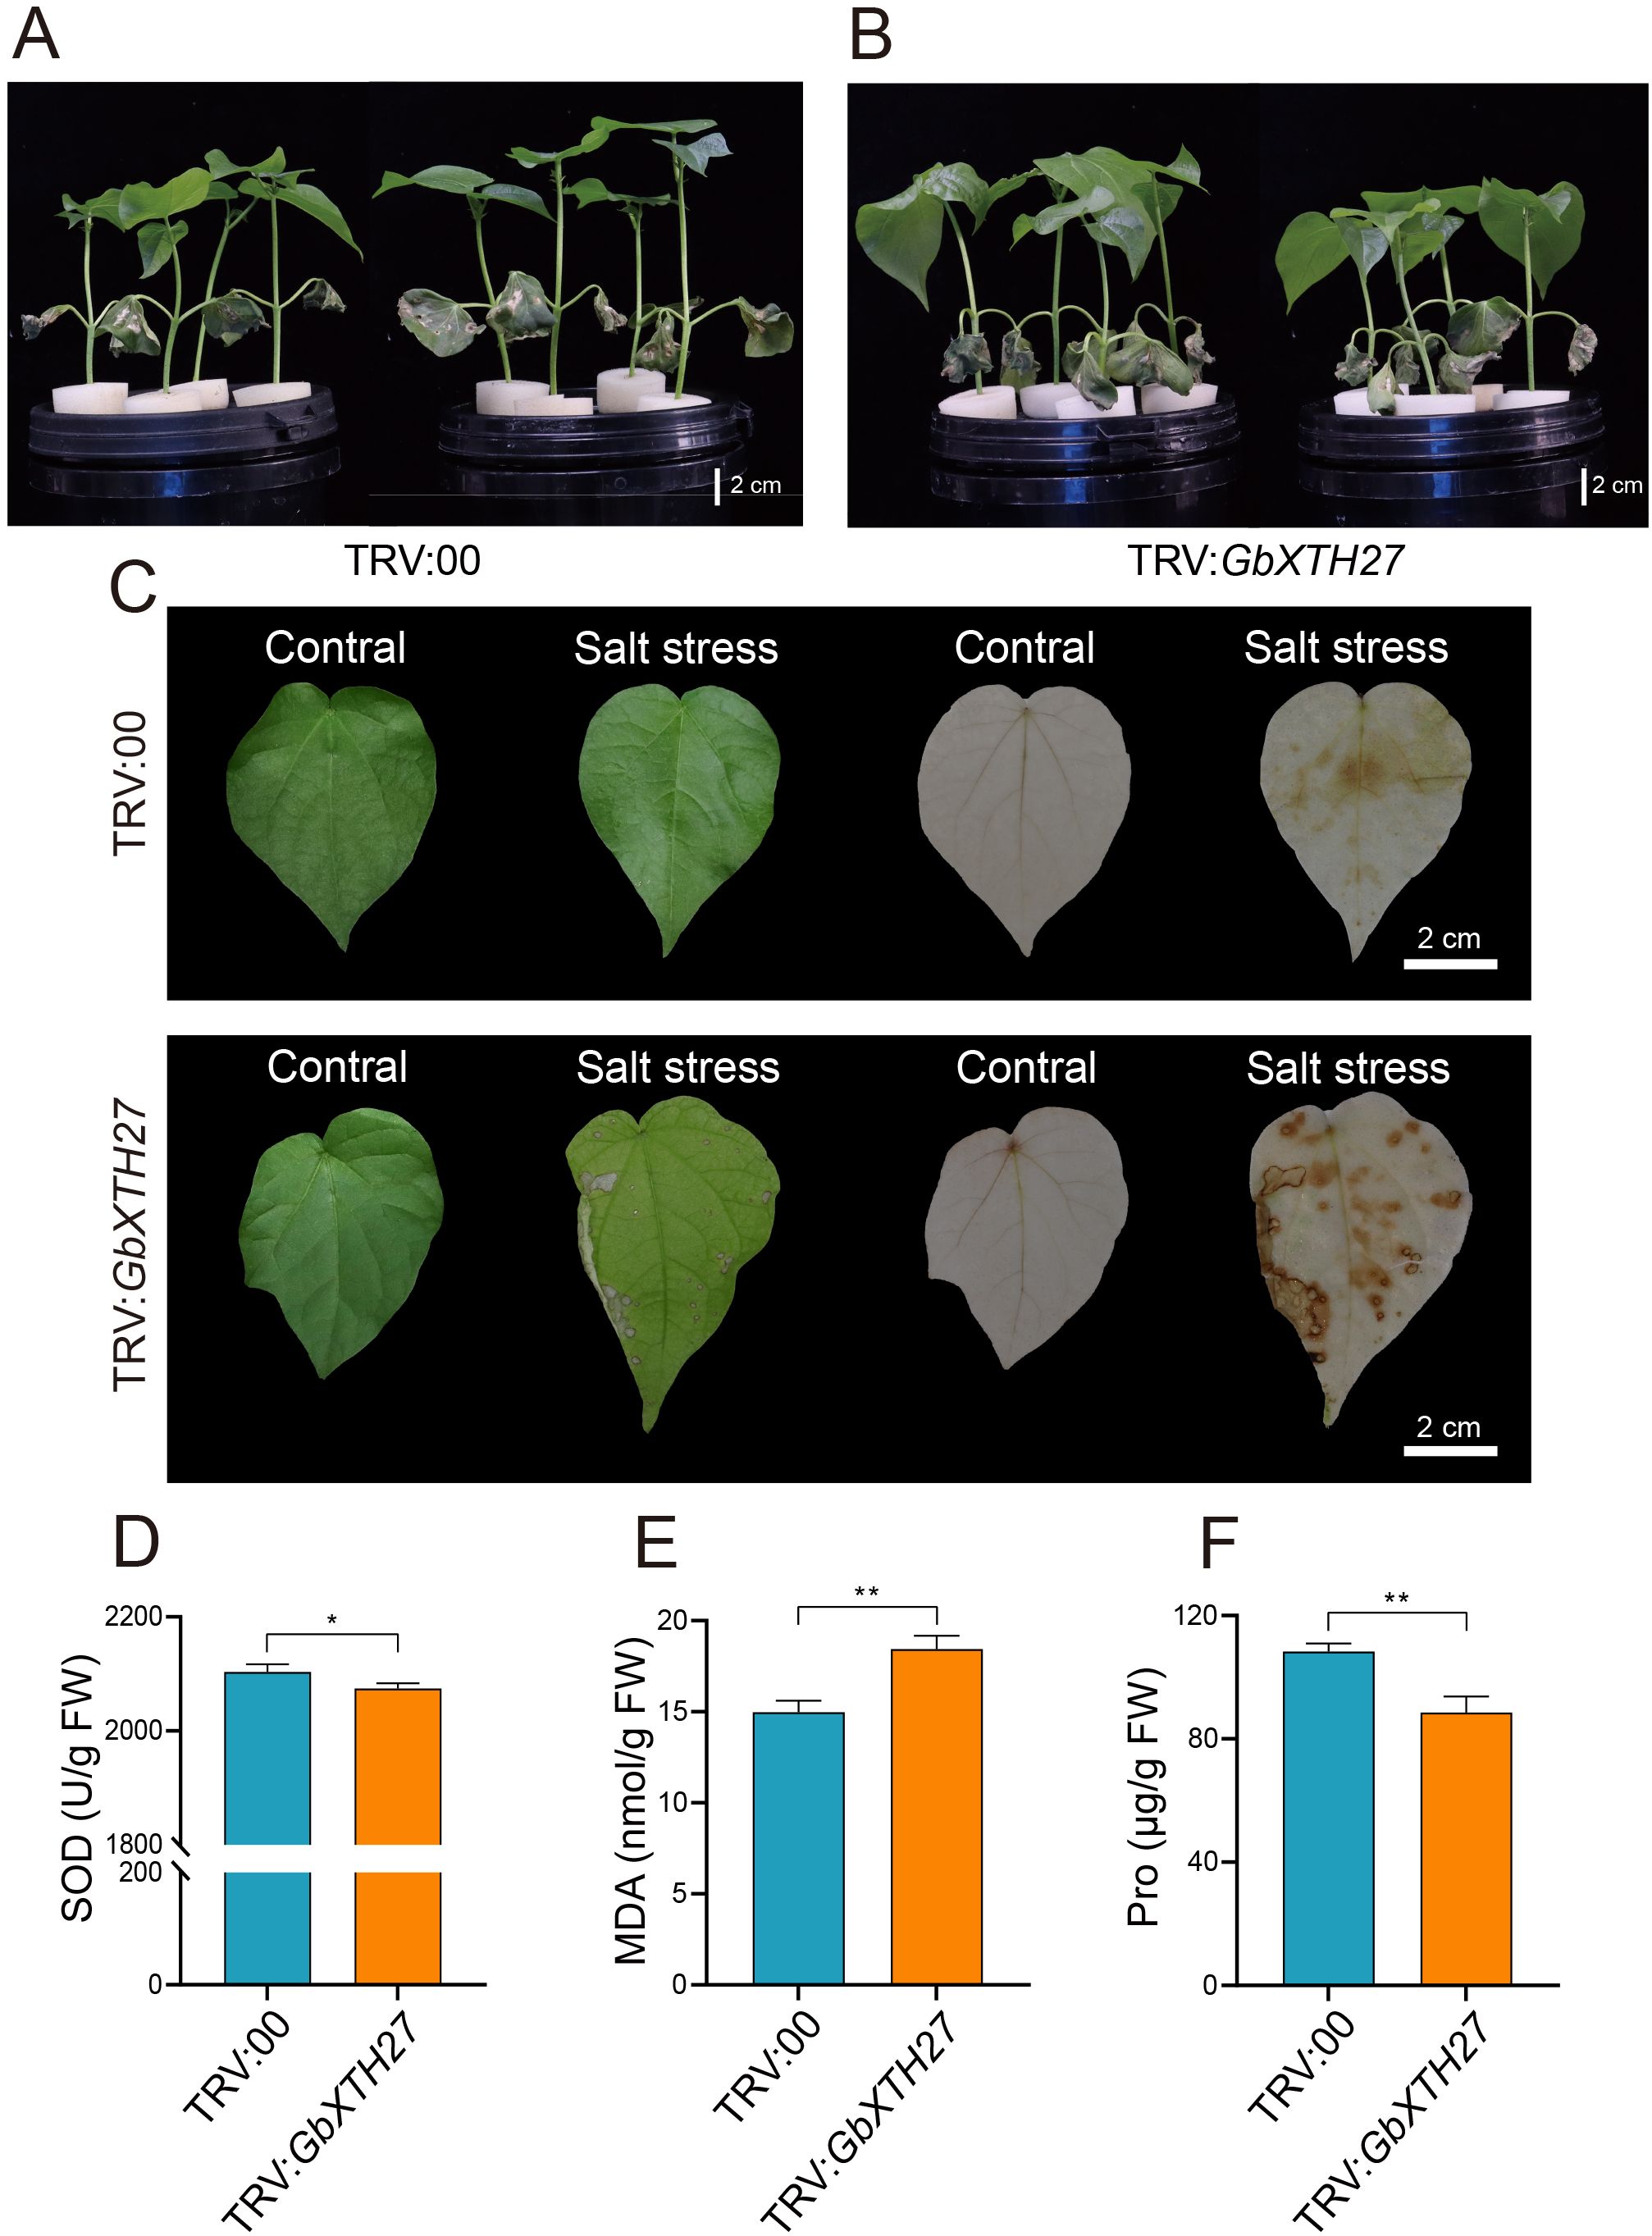
Figure 7. Gene silencing of GbXTH27 in G. barbadense. Phenotypes under salt treatment, (A) TRV:00 control, (B) GbXTH27 silenced. (C) DAB staining of TRV:00 and TRV: GbXTH27 leaves with CK and salt stress. The green leaves are the images taken before the DAB staining. (D) SOD activity. (E) MDA content. (F) Pro content. Significance levels for inter-group differences: *P<0.05, **P<0.01 (two-tailed Student’s t-test). Bar = 2 cm.
4 Discussion
In this study, we performed a genetic structure analysis on 240 G. barbadense accessions, revealing the genetic diversity within the population and its complex geographic background. High-density molecular marker-based population structure analysis classified the population into four distinct subpopulations. Consistent with previous studies (Yu et al., 2021; Jin et al., 2023), Xinjiang G. barbadense accessions formed a separate cluster in the phylogenetic tree, exhibiting significant divergence from accessions of other regions. Notably, subpopulations G1 and G4 displayed marked differences in genetic diversity (Figure 1D). The higher genetic diversity of G1 may stem from its broader geographic distribution and limited artificial selection, whereas the reduced diversity in G4 likely reflects the restricted number of founder parents during the introduction of Xinjiang cultivars. Historical records indicate that Xinjiang G. barbadense varieties primarily originated from five Central Asian founder parents: 2И3, C6022, 8763И, 5230Ф, and 9122И (Zhao et al., 2022).
Salt stress significantly impairs growth-related traits, including reduced plant height, diminished leaf area, and suppressed root development, collectively leading to decreased biomass (Munns and Tester, 2008). Given the variability in salt tolerance mechanisms among accessions, relying on single or limited indicators may inadequately reflect the true salt-tolerance capacity (Zhang et al., 2011). To address this, we employed a multi-indicator approach for comprehensive evaluation. PCA of four stress tolerance indices (STIs) across 239 G. barbadense accessions enabled the calculation of a composite salt tolerance index (D-value) using membership functions. Higher D-values correlate with enhanced salt tolerance, providing a robust framework for comparative analysis. Clustering based on multiple agronomic traits offers superior discriminatory power over traditional methods in evaluating salt tolerance (Zeng et al., 2002). For instance, prior studies classified 549 Brassica napus accessions into five categories (highly tolerant, tolerant, intermediate, sensitive, and highly sensitive) using physiological traits (Wu et al., 2019), while eight wheat cultivars were grouped into salt-tolerant, moderately tolerant, and salt-sensitive categories (Quamruzzaman et al., 2022a). Adopting similar methodology, we classified 239 G. barbadense accessions into five groups, including highly tolerant, tolerant, intermediate, sensitive, and highly sensitive-based on D-values (Figure 3). The 23 highly tolerant accessions identified here represent valuable parental resources for salt-tolerant breeding.
GWAS have become crucial in dissecting salt tolerance in cotton. Current SNP identification strategies fall into two categories: (1) chip-based sequencing, for example, the detection of eight salt-associated SNPs in 288 G. hirsutum accessions by using an 80K chip (Cai et al., 2017), 23 SNPs linked to seedling traits in 713 G. hirsutum accessions via a 63K chip (Sun et al., 2018), and 42 SNPs identified in 149 G. hirsutum accessions using a 70K chip (Zheng et al., 2021); (2) whole-genome resequencing, which captures broader genetic variation. For example, resequencing of 419 G. hirsutum accessions uncovered 17,264 salt stress-associated SNPs, with key loci prioritized via linkage disequilibrium (LD) analysis (Yasir et al., 2019). Similarly, a MAGIC population comprising 550 recombinant inbred lines (RILs) enabled the identification of 23 salt tolerance-related QTLs across ~470,000 loci (Abdelraheem et al., 2021). While GWAS in cotton has predominantly focused on G. hirsutum, studies on G. barbadense remain limited. Here, resequencing of G. barbadense identified 2.98 million SNPs, constructing a high-density variation map. A total of 1,577 significant SNPs were detected, fewer than previous reports (Yasir et al., 2019; Xu et al., 2021), which may be due to stringent thresholds (p < 4.67 × 10⁻⁶ or p < 1.0 × 10⁻⁵ across two environments/traits) for minimizing the false positives.
GWAS analysis revealed multiple SNPs strongly associated with salt tolerance (Supplementary Table S5). Notably, no overlap was observed between the QTL intervals identified here and those reported in a prior GWAS of fiber phenotypes under salt stress in 249 G. barbadense accessions (Su et al., 2020). This divergence suggests distinct salt tolerance mechanisms between seedling and full-growth stages, as cotton is particularly vulnerable during germination, emergence, and early seedling development (Sharif et al., 2019). On chromosome D13, SNP Gbar_D13_54698281, associated with traits 2022-RPH and 2022-RSDW, which resides ~42 kb upstream of Gbar_D13G020420, an ortholog of Arabidopsis AtCIPK6. GhCIPK6 regulates sugar homeostasis by interacting with GhCBL2 and GhTST2, and its overexpression enhances salt tolerance in transgenic Arabidopsis (He et al., 2013; Deng et al., 2020). These findings highlight how our GWAS results can identify genes governing seedling-stage salt tolerance in G. barbadense.
The cell wall serves as the primary barrier against environmental stress, and its structural compromise can lead to membrane damage and ion homeostasis disruption (Zhu, 2016). To investigate the molecular basis of cell wall-mediated salt tolerance, this study identified GbXTH27, encoding a xyloglucan endotransglucosylase/hydrolase (XTH) with dual xyloglucan endotransglucosylase (XET) and xyloglucan endohydrolase (XEH) activities. XTHs mediate xyloglucan crosslinking, facilitating cell wall remodeling, which is a critical process for bridging primary and secondary cell walls. XTHs play conserved yet diverse roles in plant stress adaptation. Overexpression of CaXTH3 from pepper (Capsicum annuum) in Arabidopsis and tomato enhances drought and salt tolerance by promoting stomatal closure via enhanced guard cell wall remodeling, thereby reducing transpirational water loss (Choi et al., 2011; Colin et al., 2023). Similarly, heterologous expression of PeXTH from Populus euphratica in tobacco increased palisade parenchyma cell density, reduced intercellular spaces, and enhanced leaf succulence, collectively lowering Na+ and Cl- accumulation under salt stress (Han et al., 2013). These functional studies are supported by the characterization of XTH homologs in soybean (Song et al., 2018), wheat (Han et al., 2023), rapeseed (Chen et al., 2024), and maize (Fu et al., 2024). Similarly, heterologous expression of PeXTH from Populus euphratica in tobacco increased palisade parenchyma cell density, reduced intercellular spaces, and enhanced leaf succulence, collectively lowered Na+ and Cl- accumulation under salt stress (Han et al., 2013). In this study, silencing GbXTH27 resulted in severe wilting of cotton seedlings under salt stress (Figures 7a, b), further supported by the observation that the leaf DAB staining area of TRV: GbXTH27 plants was significantly larger than that of TRV:00 controls, with deeper staining intensity in TRV: GbXTH27 (Figure 7C). These phenotypic results collectively demonstrate that the loss of XTH function impairs salt tolerance. Furthermore, qRT-PCR analysis showed that under salt stress, the expression of GbXTH27 in the salt-tolerant genotype H160 was significantly higher than that in the salt-sensitive genotype H20 (Figure 6D). This implies that GbXTH27 may play a role in maintaining antioxidant enzyme activity and osmotic potential, facilitating cellular adaptation to salinity, possibly through mechanisms related to cell wall structural changes.
Physiological characterization revealed that GbXTH27-silenced plants displayed significantly reduced superoxide dismutase (SOD) activity (p < 0.05), indicative of impaired redox homeostasis, concurrent with elevated MDA accumulation (p < 0.01) characteristic of membrane lipid peroxidation (Figures 7D, E). Furthermore, Pro content was markedly reduced (p < 0.05), consistent with compromised osmotic adjustment capacity under salt stress. We propose two potential mechanisms underlying these observations: ROS accumulation via antioxidant suppression. Silencing GbXTH27 likely suppress the activity of antioxidant enzymes such as superoxide dismutase (SOD) (p < 0.01; Figure 7F) (Figure 7F), leading to ROS accumulation and oxidative damage. On the other hand, osmotic adjustment was limited. Under salt stress, plants accumulate osmolytes like Pro to maintain turgor pressure (Szabados and Savoure, 2010). The significantly lower Pro content in GbXTH27-silenced lines (p < 0.01; Figure 7F) suggests that turgor-driven osmotic adjustment is restricted, thereby inhibiting Pro biosynthesis. These collective results demonstrate that GbXTH27 critically mediates salt adaptation through regulation of redox homeostasis, reactive oxygen species (ROS) scavenging, and osmotic adjustment.
Through integrated analyses of population genetic structure, salt tolerance phenotyping, and GWAS in G. barbadense populations, we identified GbXTH27 as a xyloglucan endotransglucosylase/hydrolase family gene whose expression positively correlates with salt tolerance levels. This study provides novel insights into the molecular mechanisms of salt stress adaptation in G. barbadense and highlights potential genetic targets for improving salt tolerance through molecular breeding.
5 Conclusion
This study integrates population genetic analysis, salt-tolerance phenotyping, and GWAS to elucidate the genetic diversity and salt adaptation mechanisms in G. barbadense. Additionally, 23 highly salt-tolerant accessions were identified through MFV. GbXTH27 was identified, encoding an XTH enzyme, as a pivotal gene positively correlated with salt tolerance. Functional validation via VIGS confirmed its crucial role in enhancing seedling tolerance. These findings deepen our understanding of salt stress adaptation and offer genetic resources for cotton improvement of salt tolerant.
Data availability statement
The datasets presented in this study can be found in online repositories. The names of the repository/repositories and accession number(s) can be found in the article/Supplementary Material.
Author contributions
HL: Formal analysis, Writing – original draft, Visualization, Investigation, Conceptualization, Validation. SW: Validation, Data curation, Methodology, Investigation, Writing – original draft. ZZ: Writing – original draft, Data curation, Validation. YS: Writing – original draft, Methodology. YH: Methodology, Writing – original draft. MX: Writing – original draft, Validation. TXZ: Writing – original draft, Formal analysis. WM: Writing – original draft, Investigation. BC: Writing – original draft, Investigation. JY: Investigation, Writing – original draft. JQ: Methodology, Writing – original draft. UM: Methodology, Formal analysis, Writing – original draft. WL: Methodology, Writing – review & editing. DY: Writing – review & editing, Methodology, Funding acquisition. JC: Methodology, Resources, Writing – review & editing, Funding acquisition. SZ: Funding acquisition, Writing – review & editing, Supervision, Methodology, Resources. TLZ: Project administration, Funding acquisition, Conceptualization, Writing – review & editing.
Funding
The author(s) declare financial support was received for the research and/or publication of this article. This work was supported by the Key Research and Development Program of the Xinjiang Uygur Autonomous Region (Project No.2024B02002), Biological Breeding of Stress Tolerant and High Yield Cotton Varieties (Project No.2023ZD04040), State Key Laboratory of Cotton Bio-breeding and Integrated Utilization Open Fund (Project No.CB2024A26), Jiangsu Collaborative Innovation Center for Modern Crop.
Conflict of interest
The authors declare that the research was conducted in the absence of any commercial or financial relationships that could be construed as a potential conflict of interest.
Generative AI statement
The author(s) declare that no Generative AI was used in the creation of this manuscript.
Any alternative text (alt text) provided alongside figures in this article has been generated by Frontiers with the support of artificial intelligence and reasonable efforts have been made to ensure accuracy, including review by the authors wherever possible. If you identify any issues, please contact us.
Publisher’s note
All claims expressed in this article are solely those of the authors and do not necessarily represent those of their affiliated organizations, or those of the publisher, the editors and the reviewers. Any product that may be evaluated in this article, or claim that may be made by its manufacturer, is not guaranteed or endorsed by the publisher.
Supplementary material
The Supplementary Material for this article can be found online at: https://www.frontiersin.org/articles/10.3389/fpls.2025.1654742/full#supplementary-material
Supplementary Figure 1 | The distribution of 2,983,855 SNPs and 369,812 InDels on the 26 chromosomes of the G. barbadense associated population.
Supplementary Figure 2 | Decay of linkage disequilibrium with physical distance in the G. barbadense population. At sub-genome (black), complete accession set (red), and Dt sub-genome (blue).
Supplementary Figure 3 | Heat map of kinship matrix of 240 G. barbadense accessions.
Supplementary Figure 4 | CV error value among different K values.
Supplementary Figure 5 | Manhattan and QQ plots for phenotypic traits in a GWAS of G. barbadense. (A-C) Relative shoot fresh weight (RSFW): 2022 (A), 2023 (B), BLUE (C). (D-F) Relative shoot dry weight (RSDW): 2022 (D), 2023 (E), BLUE (F). (G-I) Relative root dry weight (RRDW): 2022 (G), 2023 (H), BLUE (I).
Supplementary Figure 6 | Box plots for salt-relate traits among different haplotypes. (A) RSFW: relative shoot fresh weight. (B) RSDW: relative shoot dry weight. (C) RRDW: relative root dry weight. (D) D value. In the box plots, the center line denotes the median, box limits are the upper and lower quartiles, and whiskers mark the range of the data. Significance levels for inter-group differences: *P<0.05, **P<0.01 (two-tailed Student’s t-test).
Supplementary Figure 7 | Growth pattern differences in phenotypes, biomass, and ion contents between salt-tolerant and salt-sensitive genotypes. (A, B) Phenotype of salt-tolerant H160 and salt-sensitive H20 under CK (A) and salt stress (B) for 7 days. (C) Plant height, (D) Shoot fresh weight, (E) Shoot dry weight, and (F) Root dry weight of H160 and H20 under CK and salt stress. (G) Na+ content, (H) K+ content and (I) Na+/K+ ratio in root, shoot, and leaf of H160 and H20. Significance levels for inter-group differences: *P<0.05, **P<0.01 (two-tailed Student’s t-test). Bar = 2 cm.
Supplementary Figure 8 | VIGS silencing efficiency. (A) VIGS resulted in white leaf phenotype. (B) Relative expression of silenced GbXTH27. Significance levels for inter-group differences: *P<0.05 (two-tailed Student’s t-test).
Supplementary Figure 9 | Phenotypes of TRV:00 and TRV: GbXTH27 under control and salt stress treatment. (A) Plant height. (B) Shoot fresh weight. (C) Shoot dry weight. (D) Root dry weight. One-way analysis of variance (ANOVA) was performed to assess differences between subpopulations, significantly different (P < 0.05) groups are denoted by distinct lowercase letters. (E) Na+ content. (F) K+content. (G) Na+/K+ ratio. Significance levels for inter-group differences: *P<0.05, **P<0.01 (two-tailed Student’s t-test).
References
Abdelraheem, A., Thyssen, G. N., Fang, D. D., Jenkins, J. N., Mccarty, J. C., Wedegaertner, T., et al. (2021). GWAS reveals consistent QTL for drought and salt tolerance in a MAGIC population of 550 lines derived from intermating of 11 upland cotton (Gossypium hirsutum) parents. Mol. Genet. Genomics 296, 119–129. doi: 10.1007/s00438-020-01733-2
Alexander, D. H., Novembre, J., and Lange, K. (2009). Fast model-based estimation of ancestry in unrelated individuals. Genome Res. 19, 1655–1664. doi: 10.1101/gr.094052.109
Cai, C. P., Zhu, G. Z., Zhang, T. Z., and Guo, W. (2017). High-density 80 K SNP array is a powerful tool for genotyping G. hirsutum accessions and genome analysis. BMC Genomics 18, 654. doi: 10.1186/s12864-017-4062-2
Chen, J. D., Wan, H. P., Zhao, H. X., Dai, X. G., Wu, W. J., Liu, J., et al. (2024). Identification and expression analysis of the Xyloglucan transglycosylase/hydrolase (XTH) gene family under abiotic stress in oilseed (Brassica napus L.). BMC Plant Biol. 24, 400. doi: 10.1186/s12870-024-05121-5
Chen, S. F., Zhou, Y. Q., Chen, Y. R., and Gu, J. (2018). Fastp: an ultra-fast all-in-one FASTQ preprocessor. Bioinformatics 34, i884–i890. doi: 10.1093/bioinformatics/bty560
Choi, J. Y., Seo, Y. S., Kim, S. J., Kim, W. T., and Shin, J. S. (2011). Constitutive expression of CaXTH3, a hot pepper xyloglucan endotransglucosylase/hydrolase, enhanced tolerance to salt and drought stresses without phenotypic defects in tomato plants (Solanum lycopersicum cv. Dotaerang). Plant Cell Rep. 30, 867–877. doi: 10.1007/s00299-010-0989-3
Colin, L., Ruhnow, F., Zhu, J. K., Zhao, C. Z., Zhao, Y., and Persson, S. (2023). The cell biology of primary cell walls during salt stress. Plant Cell 35, 201–217. doi: 10.1093/plcell/koac292
Danecek, P., Auton, A., Abecasis, G., Albers, C. A., Banks, E., Depristo, M. A., et al. (2011). The variant call format and VCFtools. Bioinformatics 27, 2156–2158. doi: 10.1093/bioinformatics/btr330
Deng, J. W., Yang, X. Y., Sun, W. N., Miao, Y. H., He, L. R., and Zhang, X. L. (2020). The calcium sensor CBL2 and its interacting kinase CIPK6 are involved in plant sugar homeostasis via interacting with tonoplast sugar transporter TST2. Plant Physiol. 183, 236–249. doi: 10.1104/pp.19.01368
Dilnur, T., Peng, Z., Pan, Z. E., Palanga, K., Jia, Y. H., Gong, W. F., et al. (2019). Association analysis of salt tolerance in asiatic cotton (Gossypium arboretum) with SNP markers. Int. J. Mol. Sci. 20, 2168. doi: 10.3390/ijms20092168
Ding, T. L., Yang, Z., Wei, X. C., Yuan, F., Yin, S. S., and Wang, B. S. (2018). Evaluation of salt-tolerant germplasm and screening of the salt-tolerance traits of sweet sorghum in the germination stage. Funct. Plant Biol. 45, 1073–1081. doi: 10.1071/FP18009
Do, T. D., Vuong, T. D., Dunn, D., Clubb, M., Valliyodan, B., Patil, G., et al. (2019). Identification of new loci for salt tolerance in soybean by high-resolution genome-wide association mapping. BMC Genomics 20, 318. doi: 10.1186/s12864-019-5662-9
Dong, Y. T., Hu, G. J., Grover, C. E., Miller, E. R., Zhu, S. J., and Wendel, J. F. (2022). Parental legacy versus regulatory innovation in salt stress responsiveness of allopolyploid cotton (Gossypium) species. Plant J. 111, 872–887. doi: 10.1111/tpj.15863
Duan, Y. F., Lei, T., Li, W. J., Jiang, M. Y., Zhao, Z. A., Yu, X. F., et al. (2023). Enhanced Na+ and Cl- sequestration and secretion selectivity contribute to high salt tolerance in the tetraploid recretohalophyte Plumbago auriculata Lam. Planta 257, 52. doi: 10.1007/s00425-023-04082-7
Fang, L., Wang, Q., Hu, Y., Jia, Y. H., Chen, J. D., Liu, B. L., et al. (2017). Genomic analyses in cotton identify signatures of selection and loci associated with fiber quality and yield traits. Nat. Genet. 49, 1089–1098. doi: 10.1038/ng.3887
Fichtner, F. and Lunn, J. E. (2021). The role of trehalose 6-phosphate (tre6p) in plant metabolism and development. Annu. Rev. Plant Biol. 72, 737–760. doi: 10.1146/annurev-arplant-050718-095929
Fu, W. C., Fan, D. L., and Zhang, Y. (2024). Genome-wide identification and characterization of xyloglucan endotransglucosylase/hydrolase gene family in maize (Zea mays L.) and the function of ZmXTH30 in response to drought stress. Environ. Exp. Bot. 222, 105744. doi: 10.1016/j.envexpbot.2024.105744
Han, J. J., Liu, Y. C., Shen, Y. T., and Li, W. H. (2023). A surprising diversity of xyloglucan endotransglucosylase/hydrolase in wheat: new in sight to the roles in drought tolerance. Int. J. Mol. Sci. 24, 20. doi: 10.3390/ijms24129886
Han, X., Gao, C. X., Liu, L. S., Zhang, Y. H., Jin, Y. J., Yan, Q. D., et al. (2022). Integration of eQTL analysis and GWAS highlights regulation networks in cotton under stress condition. Int. J. Mol. Sci. 23, 7564. doi: 10.3390/ijms23147564
Han, Y. S., Wang, W., Sun, J., Ding, M. Q., Zhao, R., Deng, S. R., et al. (2013). Populus euphratica XTH overexpression enhances salinity tolerance by the development of leaf succulence in transgenic tobacco plants. J. Exp. Bot. 64, 4225–4238. doi: 10.1093/jxb/ert229
He, L. R., Yang, X. Y., Wang, L. C., Zhu, L. F., Zhou, T., Deng, J. W., et al. (2013). Molecular cloning and functional characterization of a novel cotton CBL-interacting protein kinase gene (GhCIPK6) reveals its involvement in multiple abiotic stress tolerance in transgenic plants. Biochem. Biophys. Res. Commun. 435, 209–215. doi: 10.1016/j.bbrc.2013.04.080
Hu, P., Zheng, Q., Luo, Q. L., Teng, W., Li, H. W., Li, B., et al. (2021). Genome-wide association study of yield and related traits in common wheat under salt-stress conditions. BMC Plant Biol. 21, 27. doi: 10.1186/s12870-020-02799-1
Hu, Y., Chen, J. D., Fang, L., Zhang, Z. Y., Ma, W., Niu, Y. C., et al. (2019). Gossypium barbadense and Gossypium hirsutum genomes provide insights into the origin and evolution of allotetraploid cotton. Nat. Genet. 51, 739–748. doi: 10.1038/s41588-019-0371-5
Huang, C., Nie, X. H., Shen, C., You, C. Y., Li, W., Zhao, W. X., et al. (2017). Population structure and genetic basis of the agronomic traits of upland cotton in China revealed by a genome-wide association study using high-density SNPs. Plant Biotechnol. J. 15, 1374–1386. doi: 10.1111/pbi.12722
Huang, X. H., Zhao, Y., Wei, X. H., Li, C. Y., Wang, A. H., Zhao, Q., et al. (2012). Genome-wide association study of flowering time and grain yield traits in a worldwide collection of rice germplasm. Nat. Genet. 44, 32–39. doi: 10.1038/ng.1018
Jin, S. K., Han, Z. G., Hu, Y., Si, Z. F., Dai, F., He, L., et al. (2023). Structural variation (SV)-based pan-genome and GWAS reveal the impacts of SVs on the speciation and diversification of allotetraploid cottons. Mol. Plant 16, 678–693. doi: 10.1016/j.molp.2023.02.004
Jin, T., Sun, Y. Y., Shan, Z., He, J. B., Wang, N., Gai, J. Y., et al. (2021). Natural variation in the promoter of GsERD15b affects salt tolerance in soybean. Plant Biotechnol. J. 19, 1155–1169. doi: 10.1111/pbi.13536
Kim, D., Paggi, J. M., Park, C., Bennett, C., and Salzberg, S. L. (2019). Graph-based genome alignment and genotyping with hisat2 and hisat-genotype. Nat. Biotechnol. 37, 907–915. doi: 10.1038/s41587-019-0201-4
Li, H. and Durbin, R. (2009). Fast and accurate short read alignment with burrows–wheeler transform. Bioinformatics 25, 1754–1760. doi: 10.1093/bioinformatics/btp324
Li, H., Handsaker, B., Wysoker, A., Fennell, T., Ruan, J., Homer, N., et al. (2009). The sequence alignment/map format and SAMtools. Bioinformatics 25, 2078–2079. doi: 10.1093/bioinformatics/btp352
Li, C. X., Jia, Y., Zhou, R. Y., Liu, L. W., Cao, M. N., Zhou, Y., et al. (2022). GWAS and RNA-seq analysis uncover candidate genes associated with alkaline stress tolerance in maize (Zea mays L.) seedlings. Front. Plant Sci. 13. doi: 10.3389/fpls.2022.963874
Li, P. C., Yang, X. Y., Wang, H. M., Pan, T., Wang, Y. Y., Xu, Y., et al. (2021). Genetic control of root plasticity in response to salt stress in maize. Theor. Appl. Genet. 134, 1475–1492. doi: 10.1007/s00122-021-03784-4
Li, X. W., Zheng, H. L., Wu, W. S., Liu, H. L., Wang, J. G., Jia, Y., et al. (2020). QTL mapping and candidate gene analysis for alkali tolerance in japonica rice at the bud stage based on linkage mapping and genome-wide association study. Rice 13, 48. doi: 10.1186/s12284-020-00412-5
Lin, H. X., Zhu, M. Z., Yano, M., Gao, J. P., Liang, Z. W., Su, W. A., et al. (2004). QTLs for Na+ and K+ uptake of the shoots and roots controlling rice salt tolerance. Theor. Appl. Genet. 108, 253–260. doi: 10.1007/s00122-003-1421-y
Long, N. V., Dolstra, O., Malosetti, M., Kilian, B., Graner, A., Visser, R. G. F., et al. (2013). Association mapping of salt tolerance in barley (Hordeum vulgare L.). Theor. Appl. Genet. 126, 2335–2351. doi: 10.1007/s00122-013-2139-0
Lu, K., Peng, L., Zhang, C., Lu, J. H., Yang, B., Xiao, Z. C., et al. (2017). Genome-wide association and transcriptome analyses reveal candidate genes underlying yield-determining traits in Brassica napus. Front. Plant Sci. 1. doi: 10.3389/fpls.2017.00206
Ma, T., Zeng, W. Z., Li, Q., Wu, J. W., and Huang, J. S. (2016). Effects of water, salt and nitrogen stress on sunflower (Helianthus annuus L.) at different growth stages. J. Soil Sci. Plant Nutr. 16, 1024–1037. doi: 10.4067/S0718-95162016005000075
Mandel, M. A., Feldmann, K. A., Herrera-Estrella, L., Rocha-Sosa, M., and Leon, P. (1996). Cla1, a novel gene required for chloroplast development, is highly conserved in evolution. Plant J. 9, 649–658. doi: 10.1046/j.1365-313x.1996.9050649.x
Mckenna, A., Hanna, M., Banks, E., Sivachenko, A., Cibulskis, K., Kernytsky, A., et al. (2010). The genome analysis toolkit: a MapReduce framework for analyzing next-generation DNA sequencing data. Genome Res. 20, 1297–1303. doi: 10.1101/gr.107524.110
Munns, R. and Tester, M. (2008). Mechanisms of salinity tolerance. Annu. Rev. Plant Biol. 59, 651–681. doi: 10.1146/annurev.arplant.59.032607.092911
Pan, T., Wang, Y. H., Jing, R. N., Wang, Y. F., Wei, Z. Y., Zhang, B. L., et al. (2021). Post-golgi trafficking of rice storage proteins requires the small gtpase rab7 activation complex mon1-ccz1. Plant Physiol. 187, 2174–2191. doi: 10.1093/plphys/kiab175
Pertea, M., Pertea, G. M., Antonescu, C. M., Chang, T. C., Mendell, J. T., and Salzberg, S. L. (2015). StringTie enables improved reconstruction of a transcriptome from RNA-seq reads. Nat. Biotechnol. 33, 290–295. doi: 10.1038/nbt.3122
Price, A. L., Patterson, N. J., Plenge, R. M., Weinblatt, M. E., Shadick, N. A., and Reich, D. (2006). Principal components analysis corrects for stratification in genome-wide association studies. Nat. Genet. 38, 904–909. doi: 10.1038/ng1847
Qian, J. J., Shan, R., Shi, Y. Q., Li, H. Z., Xue, L. S., Song, Y., et al. (2024). Zinc oxide nanoparticles alleviate salt stress in cotton (Gossypium hirsutum L.) by adjusting Na+/K+ ratio and antioxidative ability. Life 14, 595. doi: 10.3390/life14050595
Quamruzzaman, M., Manik, S. M. N., Livermore, M., Johnson, P., Zhou, M. X., and Shabala, S. (2022a). Multidimensional screening and evaluation of morpho-physiological indices for salinity stress tolerance in wheat. J. Agron. Crop Sci. 208, 454–471. doi: 10.1111/jac.12587
Quamruzzaman, M., Manik, S. M. N., Shabala, S., Cao, F., and Zhou, M. (2022b). Genome-wide association study reveals a genomic region on 5AL for salinity tolerance in wheat. Theor. Appl. Genet. 135, 709–721. doi: 10.1007/s00122-021-03996-8
Schiessl, S., Iniguez-Luy, F., Qian, W., and Snowdon, R. J. (2015). Diverse regulatory factors associate with flowering time and yield responses in winter-type Brassica napus. BMC Genomics 16, 737. doi: 10.1186/s12864-015-1950-1
Seemann, J. R. and Critchley, C. (1985). Effects of salt stress on the growth, ion content, stomatal behaviour and photosynthetic capacity of a salt-sensitive species, Phaseolus vulgaris L. Planta 164, 151–162. doi: 10.1007/BF00396077
Shao, P. X., Peng, Y. B., Wu, Y. L., Wang, J., Pan, Z. Y., Yang, Y., et al. (2022). Genome-wide association study and transcriptome analysis reveal key genes controlling fruit branch angle in cotton. Front. Plant Sci. 13. doi: 10.3389/fpls.2022.988647
Sharif, I., Aleem, S., Farooq, J., Rizwan, M., Younas, A., Sarwar, G., et al. (2019). Salinity stress in cotton: effects, mechanism of tolerance and its management strategies. Physiol. Mol. Biol. Plants 25, 807–820. doi: 10.1007/s12298-019-00676-2
Song, L., Valliyodan, B., Prince, S., Wan, J. R., and Nguyen, H. T. (2018). Characterization of the XTH gene family: new insight to the roles in soybean flooding tolerance. Int. J. Mol. Sci. 19, 2705. doi: 10.3390/ijms19092705
Song, Y., Lv, D. L., Jiang, M., E, Z. Y., Han, Y. F., Sun, Y., et al (2023). Exogenous strigolactones enhance salinity tolerance in cotton (Gossypium hirsutum l.) Seedlings. Plant Stress 10, 100235. doi: 10.1016/j.stress.2023.100235
Su, X. J., Zhu, G. Z., Song, X. H., Xu, H. J., Li, W. X., Ning, X. Z., et al. (2020). Genome-wide association analysis reveals loci and candidate genes involved in fiber quality traits in sea island cotton (Gossypium barbadense). BMC Plant Biol. 20, 289. doi: 10.1186/s12870-020-02502-4
Sun, Z. W., Li, H. L., Zhang, Y., Li, Z. K., Ke, H. F., Wu, L. Q., et al. (2018). Identification of SNPs and candidate genes associated with salt tolerance at the seedling stage in cotton (Gossypium hirsutum L.). Front. Plant Sci. 9. doi: 10.3389/fpls.2018.01011
Szabados, L. and Savoure, A. (2010). Proline: a multifunctional amino acid. Trends Plant Sci. 15, 89–97. doi: 10.1016/j.tplants.2009.11.009
Tarasov, A., Vilella, A. J., Cuppen, E., Nijman, I. J., and Prins, P. (2015). Sambamba: fast processing of NGS alignment formats. Bioinformatics 31, 2032–2034. doi: 10.1093/bioinformatics/btv098
Wang, Z. F., Cheng, J. P., Chen, Z. W., Huang, J., Bao, Y. M., Wang, J. F., et al. (2012). Identification of QTLs with main, epistatic and QTL × environment interaction effects for salt tolerance in rice seedlings under different salinity conditions. Theor. Appl. Genet. 125, 807–815. doi: 10.1007/s00122-012-1873-z
Wang, M. J., Tu, L. L., Yuan, D. J., Zhu, D., Shen, C., Li, J. Y., et al. (2019). Reference genome sequences of two cultivated allotetraploid cottons, Gossypium hirsutum and Gossypium barbadense. Nat. Genet. 51, 224–229. doi: 10.1038/s41588-018-0282-x
Wang, M., Wang, Q. L., and Zhang, B. H. (2013). Evaluation and selection of reliable reference genes for gene expression under abiotic stress in cotton (Gossypium hirsutum L.). Gene 530, 44–50. doi: 10.1016/j.gene.2013.07.084
Wei, H., Wang, X. M., Zhang, Z. P., Yang, L. B., Zhang, Q. Q., Li, Y. L., et al. (2024). Uncovering key salt-tolerant regulators through a combined eQTL and GWAS analysis using the super pan-genome in rice. Natl. Sci. Rev. 11, nwae043. doi: 10.1093/nsr/nwae043
Wu, H., Guo, J. R., Wang, C. F., Li, K. L., Zhang, X. W., Yang, Z., et al. (2019). An effective screening method and a reliable screening trait for salt tolerance of Brassica napus at the germination stage. Front. Plant Sci. 10. doi: 10.3389/fpls.2019.00530
Xu, P., Guo, Q., Meng, S., Zhang, X. G., Xu, Z. Z., Guo, W. Z., et al. (2021). Genome-wide association analysis reveals genetic variations and candidate genes associated with salt tolerance related traits in Gossypium hirsutum. BMC Genomics 22, 26. doi: 10.1186/s12864-020-07321-3
Xu, F. C., Wang, M. J., Guo, Y. W., Song, J., Gao, W., and Long, L. (2023). The Na+/H+ antiporter GbSOS1 interacts with SIP5 and regulates salt tolerance in Gossypium barbadense. Plant Sci. 330, 111658. doi: 10.1016/j.plantsci.2023.111658
Yang, J., Lee, S. H., Goddard, M. E., and Visscher, P. M. (2011). GCTA: a tool for genome-wide complex trait analysis. Am. J. Hum. Genet. 88, 76–82. doi: 10.1016/j.ajhg.2010.11.011
Yasir, M., He, S. P., Sun, G. F., Geng, X. L., Pan, Z. E., Gong, W. F., et al. (2019). A genome-wide association study revealed key SNPs/genes associated with salinity stress tolerance in upland cotton. Genes 10, 829. doi: 10.3390/genes10100829
Yu, J. W., Hui, Y. X., Chen, J. H., Yu, H. R., Gao, X. P., Zhang, Z. H., et al. (2021). Whole-genome resequencing of 240 Gossypium barbadense accessions reveals genetic variation and genes associated with fiber strength and lint percentage. Theor. Appl. Genet. 134, 3249–3261. doi: 10.1007/s00122-021-03889-w
Zeng, L., Shannon, M. C., and Grieve, C. M. (2002). Evaluation of salt tolerance in rice genotypes by multiple agronomic parameters. Euphytica 127, 235–245. doi: 10.1023/A:1020262932277
Zhang, C., Dong, S. S., Xu, J. Y., He, W. M., and Yang, T. L. (2019a). PopLDdecay: a fast and effective tool for linkage disequilibrium decay analysis based on variant call format files. Bioinformatics 35, 1786–1788. doi: 10.1093/bioinformatics/bty875
Zhang, W., Liao, X. L., Cui, Y. M., Ma, W. Y., Zhang, X. N., Du, H. Y., et al. (2019b). A cation diffusion facilitator, GmCDF1, negatively regulates salt tolerance in soybean. PloS Genet. 15, e1007798. doi: 10.1371/journal.pgen.1007798
Zhang, G. W., Lu, H. L., Zhang, L., Chen, B. L., and Zhou, Z. G. (2011). Salt tolerance evaluation of cotton (Gossypium hirsutum) at its germinating and seedling stages and selection of related indices. YingYong. ShengTai. XueBao. 22, 2045–2053. doi: 10.13287/j.1001-9332.2011.0281
Zhang, Z. Q., Ma, W. Y., Wang, H. J., Ren, Z. Y., Liu, Y. A., He, K. L., et al. (2024). Characterization of the wall-associated kinase (WAK) gene family in Gossypium barbadense reveals the positive role of GbWAK5 in salt tolerance. Plant Cell Rep. 44, 18. doi: 10.1007/s00299-024-03407-4
Zhang, J. P., Song, Q. J., Cregan, P. B., Nelson, R. L., Wang, X. Z., Wu, J. X., et al. (2015). Genome-wide association study for flowering time, maturity dates and plant height in early maturing soybean (Glycine max) germplasm. BMC Genomics 16, 217. doi: 10.1186/s12864-015-1441-4
Zhang, G. F., Zhou, J. Z., Peng, Y., Tan, Z. D., Li, L., Yu, L. Q., et al. (2022). Genome-wide association studies of salt tolerance at seed germination and seedling stages in Brassica napus. Front. Plant Sci. 12. doi: 10.3389/fpls.2021.772708
Zhang, G. F., Zhou, J. Z., Peng, Y., Tan, Z. D., Zhang, Y. T., Zhao, H., et al. (2023). High-throughput phenotyping-based quantitative trait loci mapping reveals the genetic architecture of the salt stress tolerance of Brassica napus. Plant. Cell Environ. 46, 549–566. doi: 10.1111/pce.14485
Zhao, X., Dong, H. R., Chang, H., Zhao, J. Y., Teng, W. L., Qiu, L. J., et al. (2019). Genome wide association mapping and candidate gene analysis for hundred seed weight in soybean [Glycine max (L.) Merrill. BMC Genomics 20, 648. doi: 10.1186/s12864-019-6009-2
Zhao, K. Y., Tung, C. W., Eizenga, G. C., Wright, M. H., Ali, M. L., Price, A. H., et al. (2011). Genome-wide association mapping reveals a rich genetic architecture of complex traits in Oryza sativa. Nat. Commun. 2, 467. doi: 10.1038/ncomms1467
Zhao, N., Wang, W. R., Grover, C. E., Jiang, K. Y., Pan, Z. X., Guo, B. S., et al. (2022). Genomic and GWAS analyses demonstrate phylogenomic relationships of Gossypium barbadense in China and selection for fibre length, lint percentage and fusarium wilt resistance. Plant Biotechnol. J. 20, 691–710. doi: 10.1111/pbi.13747
Zhao, Y. Y., Zhu, Y. M., Feng, S. L., Zhao, T., Wang, L. Y., Zheng, Z. H., et al. (2024). The impact of temperature on cotton yield and production in Xinjiang, China. NPJ Sustain. Agric. 2, 33. doi: 10.1038/s44264-024-00043-z
Zheng, J. Y., Zhang, Z. L., Gong, Z. L., Liang, Y. J., Sang, Z. W., Xu, Y. C., et al. (2021). Genome-wide association analysis of salt-tolerant traits in terrestrial cotton at seedling stage. Plants 11, 97. doi: 10.3390/plants11010097
Zhou, X. and Stephens, M. (2012). Genome-wide efficient mixed-model analysis for association studies. Nat. Genet. 44, 821–824. doi: 10.1038/ng.2310
Zhu, J. K. (2016). Abiotic stress signaling and responses in plants. Cell 167, 313–324. doi: 10.1016/j.cell.2016.08.029
Keywords: Gossypium barbadense, seedling stage, salt tolerance index, salt tolerance, genomewide association analysis
Citation: Li H, Wang S, Zheng Z, Sun Y, Han Y, Xing M, Zhang T, Mo W, Cai B, Yin J, Qian J, Muhammad U, Li W, Yuan D, Chen J, Zhu S and Zhao T (2025) Salt tolerance characterization and genome-wide association study of Gossypium barbadense accessions reveal salinity-adaptive variations. Front. Plant Sci. 16:1654742. doi: 10.3389/fpls.2025.1654742
Received: 26 June 2025; Accepted: 12 August 2025;
Published: 11 September 2025.
Edited by:
Wenqing Zhao, Nanjing Agricultural University, ChinaCopyright © 2025 Li, Wang, Zheng, Sun, Han, Xing, Zhang, Mo, Cai, Yin, Qian, Muhammad, Li, Yuan, Chen, Zhu and Zhao. This is an open-access article distributed under the terms of the Creative Commons Attribution License (CC BY). The use, distribution or reproduction in other forums is permitted, provided the original author(s) and the copyright owner(s) are credited and that the original publication in this journal is cited, in accordance with accepted academic practice. No use, distribution or reproduction is permitted which does not comply with these terms.
*Correspondence: Shuijin Zhu, c2hqemh1QHpqdS5lZHUuY24=; Tianlun Zhao, dGx6aGFvQHpqdS5lZHUuY24=
†These authors have contributed equally to this work