 Jeevan Adhikari1†
 Deepak Vitrakoti1
 Wiriyanat Ployaram1
 Sameer Khanal1
 Rahul Chandnani1†
 Jinesh Patel1†
 Tariq Shehzad1†
 Peng Chee2
 Andrew H. Paterson1*
- 1Plant Genome Mapping Laboratory, University of Georgia, Athens, GA, United States
- 2Department of Crop and Soil Sciences, University of Georgia, Tifton, GA, United States
In reciprocal interspecific near-isogenic lines developed by crossing elite cultivars Acala Maxxa (Gossypium hirsutum) and Pima S6 (G. barbadense) representing the two major domesticated species of cotton, we identified genomic locations underpinning an important fiber quality trait - fiber elongation (ELO). Phenotypic evaluation of these lines in three environments revealed a total of 36 QTLs, including 14 (38.89%) on the D subgenome, from a progenitor that does not produce spinnable fiber. Nearly half (16, 44.4%) of the 36 QTLs identified in the study explained less than 6% of phenotypic variation, and two (EL07.1 and EL25.1) were new, justifying the use of near-isogenic lines for analysis. Significantly larger additive effects of these QTLs in comparison to those reported using early generation backcrosses, F2 and F2 derived populations as well as recombinant inbred lines (RILs) show that NILs offer an advantage in estimating more precise QTL effects by removing background noise due to segregating genomic regions. Seven genomic regions on chromosomes 2, 6, 9, 12, 15 and 18 were consistently associated with ELO in two of the three environments tested. A total of 11 (30.56% of) QTLs had transgressive allele effects, i.e. which were opposite of what would be predicted from the parental phenotypes, indicating opportunities to breed superior interspecific lines; and three QTLs (8.33%) had heterotic alleles that may contribute to the striking fiber quality of F1 hybrids between these species. Limited reciprocity of QTLs in the two backgrounds is attributed to the combined consequences of epistasis, small phenotypic effects and imperfect coverage of donor chromatin in the recipient background. The availability of DNA markers linked to both G. barbadense and G. hirsutum QTLs identified in this and other studies promise to assist breeders in transferring and maintaining valuable traits from exotic sources during cultivar development.
1 Introduction
Cotton is an economically important crop and a key source of natural fibers for the textile industry. While consumer preferences and technological advances demand improved cotton fibers, genetic impoverishment of elite gene pools due to a series of bottlenecks imposed by polyploid formation, domestication and selection has been a hindrance to improvement (Adhikari et al., 2017; Paterson et al., 2004). Growing concerns about genetic vulnerability in many crop species including cotton has stimulated interest in utilizing secondary or tertiary gene pools as source of genetic variation in breeding programs. Closely related species often contain novel alleles, a subset of which might have potential for crop improvement. However, utilization of a close species can be difficult as the genetic variation between the species is often directly related to reproductive isolation, or to adaptation to different natural environments. Moreover, many introgressed genes prove to be difficult to use in crop improvement, particularly due to segregation distortion (Jiang et al., 2000), suppression of recombination (Paterson et al., 1990) and linkage drag (Young and Tanksley, 1989).
Cotton fiber production is dominated by two tetraploid species that are each cultivated for somewhat different characteristics. Upland cotton (G. hirsutum) is the most widely grown cotton because of its high-yield potential as well as adaptation to diverse environmental conditions and production systems. Pima, Egyptian and Sea Island cottons (all primarily G. barbadense, with introgression in specific chromosomal regions from G. hirsutum – (Wang et al., 1995) have superior fiber quality but lower yield potential and narrow environmental adaptation than Upland cotton. For example, Pima cotton’s narrow range of adaptation – primarily irrigated regions in arid zones of Arizona and California – precludes its commercial cultivation in most of the US “cotton belt”.
The superior fiber properties of G. barbadense have long been attractive for transfer to higher-yielding Upland cotton, a long-standing goal of cotton breeders and geneticists. DNA markers provide a means to detect and resolve complications such as segregation distortion or linkage drag encountered during interspecific gene introgression (Chee et al., 2005a). In particular, the advanced backcross approach facilitates the detection and integration of beneficial QTLs from secondary gene pools into elite breeding lines (Tanksley and Nelson, 1996). Elevated noise from multiple chromosomal segments segregating independently, some of which span entire chromosomes, often results in over- or underestimation of the effects of mapped QTLs and thus in lack of reproducible effects across environments and/or generations. Experimental populations developed by advanced backcross approaches consist of lines that have a few (in some cases only one) small introgressed segments segregating in the recipient background. These genetic stocks with reduced background noise and smaller size of introgressed chromatin segments facilitate estimation of the location and effects of these genomic benchmarks more precisely.
Advanced backcross lines (ABLs) with few introgressed chromosome segments from a donor and/or near-isogenic lines (NILs) with only one, are important genetic resources to estimate precise locations and accurate effects of quantitative trait loci (QTLs). The simple genomic composition of these lines serves two important purposes, both delineating the boundaries of a QTL to a small and precise genomic location and increasing the ability to detect QTLs of small phenotypic effects by reducing extraneous genetic variance at other loci and therefore reducing total phenotypic variance. Indeed, since there are few (ideally one) introgressed segment(s) in each line, phenotypes due to QTLs on the segment(s) often resemble simple Mendelian factors (Paran and Zamir, 2003). In addition, because of the fixed genotype of NILs, they can be replicated in different environments to test interaction between genetic and environmental factors (Monforte and Tanksley, 2000). By crossing NILs to the recurrent parent and obtaining recombinants in the introgressed region, fine mapping of specific QTLs toward their cloning is facilitated.
While long and fine cotton fibers were sought by the textile industry in the early years of mechanization, mostly due to their direct impact on the yarn, spinnability and end products (Perkins et al., 1984), other fiber properties eventually were found to contribute to overall textile performance, both in the textile mills as well as to the consumers. Fiber elongation, which measures the degree of extensibility or elasticity of the fibers before a break occurs, is becoming increasingly important as increases in elongation are associated with improved yarn strength (Riley, 1997). Modern textile mills are adopting sophisticated and more efficient spinning technologies that rely on high-speed and automation to achieve higher performances. Therefore, fibers with good elongation generally cause less costly disruption in the spinning process and the resulting yarn can endure more vigorous mechanical handing during fabric manufacturing.
In this study we are exploring the genetic architecture of important fiber quality parameters in a set of reciprocal interspecific advanced backcross populations (ABLs and NILs), using Acala Maxxa (G. hirsutum) and Pima S6 (G. barbadense) as parents. The respective populations tile 71.48% of the Acala Maxxa genome in Pima S6 (hereafter GB) background; and 78.72% of the Pima S6 genome in the Acala Maxxa (hereafter GH) background.
2 Materials and methods
2.1 Population development
Plant materials used in this study were developed from reciprocal crosses between Gossypium hirsutum acc. Acala Maxxa and G. barbadense acc. Pima S6 (both inbred lines). These genotypes have been extensively used to produce several molecular tools and resources including BAC libraries and Illumina genome sequences. Reciprocal advanced backcross populations were developed by first crossing the parents in a two-way cross (Acala Maxxa (♀) × Pima S6 (♂) – GH background; and Pima S6 (♀) × Acala Maxxa (♂) – GB background), then independently backcrossing F1 plants to the respective female parents to create 300 to 400 BC1 progenies for each cross. The backcrossing scheme utilized single seed descent to generate each subsequent generation (Adhikari et al., 2023).
After five generation of backcrossing, 179 BC5F1 plants from the GH background and 190 BC5F1 plants from the GB background were self-pollinated and a total of 369 BC5F2 families were grown at Iron Horse Farm (IHF), Watkinsville, Georgia in 2019 and 2021 and at Southwest Georgia Research Station, Plains, Georgia in 2021 under cultural conditions consistent with commercial irrigated cotton production. Individual BC5F2 plants that contained only one introgressed segment from the donor parent were deemed as NILs. Selfed seeds of these NILs (BC5F3 seeds) were grown at IHF and Plains in 2021 under cultural conditions consistent with commercial irrigated cotton production.
2.2 Genotyping
The genomic composition of the BC5F1 plants was inferred based on genotyping by sequencing (GBS). DNA was extracted from the parents and 369 BC5F1 plants using a scaled-down version of a published CTAB protocol (Paterson et al., 1993). A total of five multiplexed GBS libraries were constructed according to (Andolfatto et al., 2011) wherein the DNA were double digested with HinP1I-HaeIII enzymes. The libraries were sequenced on Illumina MiSeq (in-house) with 75 bp single end reads (SE75). The TASSEL5 GBSV2 pipeline was used for sequence data processing and genotype calling (Glaubitz et al., 2014). Reads were aligned to G. hirsutum acc. TM-1 (Zhang et al., 2015) using Burrow-Wheeler Alignment (bwa) and exported to variant call format (VCF). To minimize sequencing errors, only the first 64 base pairs were used to map reads to the reference genome. Filtering of the VCF was done for bi-allelic SNPs using Fisher’s exact test with a threshold P value < 0.001, considering that true variants should represent biallelic homozygous state for inbred accessions. Genotypes for lines in G. hirsutum background were called together with one another; and those for lines in G. barbadense background cross were also called together. The SNPs were filtered for MAF > 0.01, missing scores<30% and heterozygosity<10% at the population level. The retained SNPs were imputed using the Fast Inbred Line Library Imputation (FILLIN) pipeline available in TASSEL5 GBSv2 (Swarts et al., 2014).
The genomic composition of BC5F2 plants were inferred based on targeted microsatellite (SSR) genotyping of the introgressed chromosomal segments identified in their respective BC5F1 parents. At least two (and at most four) SSR markers were used to verify most of the introgressed regions while for small introgressions only one SSR marker was deployed. A total of 852 polymorphic SSR markers (Supplementary Table 1) spanning the introgressed regions were derived from several published genetic maps of crosses between G. barbadense and G. hirsutum stored in the CottonGen SSR database (https://www.cottongen.org/data/download/marker). A total of 47 candidate SSRs were monomorphic in our lines and discarded, as were 23 with ambiguous bands. Among the 8364 BC5F2 individuals planted in 2019, the remaining 782 SSR markers were used to genotype 5315 plants (from BC5F1 parents carrying 2 to 5 introgressions) for the presence (or absence) and dosage (homozygous vs heterozygous) of the respective introgression/s. Individual BC5F2 plants that were verified by SSR markers to carry only one introgression (homozygous or heterozygous) from the donor parent were deemed as NILs.
2.3 Phenotypic evaluation and data analysis
Two replications of each BC5F2 family and NIL were planted in a randomized complete block design (RCBD) in three environments (IHF-2019, IHF-2021 and Plains-2021). Six replications each of the two parents were included in all three environments. Fiber samples were collected by harvesting 25 bolls from each plot, ginned in a laboratory gin, and evaluated by HVI (Cotton Incorporated Textile Service Laboratory, Cary, NC) to extract values for fiber elongation (ELO).
All statistical analyses were conducted in R programming language. Single marker analyses were done in R/qtl (Broman and Sen, 2009). The significance threshold was set to LOD of 3, to mitigate the multiple-comparison problem. Filtration of significant markers adopts the method proposed by Szalma et al. (2007). If several markers on the same introgressed segment show significant association with phenotype, the most significant one was reported. For the co-segregation of multiple introgressions, the QTL location is examined as follows. First, if multiple families show significance for the trait and carry overlapping introgression, the introgression is considered to carry QTL. Second, if the co-segregation of introgressions is in single families, the most significant introgression is considered to carry QTL.
Phenotypic variance explained by each locus was reported by taking the most significant marker as independent variable and phenotypic value as dependent variable in R (R Core Team, 2016). Additive effects were estimated by half the difference of phenotypic values between the lines carrying the homozygous introgression and lines not carrying the introgression. Dominance effects were estimated by the difference of phenotypic values between the lines carrying the heterozygous introgression and the remaining lines that do not carry the introgression. If multiple or overlapping introgressions were present at both homozygous and heterozygous state, the estimation of additive effects utilized the lines carrying the introgression at homozygous state only and, the estimation of dominance utilized the lines carrying the introgression at heterozygous state only.
Gene actions for QTLs were determined by calculating the degree of dominance (absolute values) for every QTL that has both additive and dominance effects. The degree of dominance is the ratio of dominance effect to additive effect (d/a) of the QTL and based on this ratio, gene action of the QTLs can be categorized as (i) additive (0<d/a< 0.2) (ii) partially dominant (0.2< d/a<0.8) (iii) dominant (0.8< d/a< 1.2 and (iv) over-dominant (d/a > 1.2) (Edwards et al., 1987). QTLs with dominant and over-dominant effects are considered to have heterotic effect or heterozygous advantage.
2.4 Identification of common QTLs
‘Common QTL’ refers to cases in which the same marker is detected in two reciprocal populations, or two different markers are statistically significant for the same/overlapping QTL(s)/introgression(s) in each of two populations. The hypothesis that two sets of QTLs are randomly distributed across the entire genome can be falsified using the hypergeometric probability function (Paterson et al., 1995; Feltus et al., 2006). In the model, p is the probability of non-random correspondence of QTLs being compared; n is the number of comparable intervals which is calculated by dividing the total genome size by average introgression size in both populations; m is the number of common QTLs; l is the number of QTLs in the GH background; s is the number of QTLs in the GB background. The same model was also adopted to detect correspondence between QTLs reported in this study with those previously published. In this case, l is the total number of QTLs identified in the larger sample (study reporting higher number of QTLs) and s is the number of QTLs identified in the smaller sample.
2.5 Candidate gene identification
In silico annotation was performed on the identified QTLs to look for candidate genes related to fiber elongation in cotton. For each QTL identified in the study, the genomic region spanning 1 Mb on each side of the most significantly associated marker was used for in silico analysis. The DNA sequence from this tightly linked region was used to look for G. hirsutum genes in the CottonGen database and these genes were then analyzed for biological functions, with particular focus on fiber growth and development.
3 Results
3.1 Genomic composition of NILs and ABLs
Detailed description of the genomic composition of the reciprocal advanced backcross lines (BC5F1 populations) is published (Adhikari et al., 2023, 2025). The NIL population in the Acala Maxxa (G. hirsutum) background consisted of 397 individuals with only one chromosomal segment introgressed from the donor parent (G. barbadense ‘Pima S6’), while that in the Pima S6 background consisted of 423 individuals. In total, these lines covered 78.72% and 71.48% of the donor genome respectively in the Acala Maxxa and Pima S6 backgrounds. Single introgressed segments were identified for all chromosomes except chromosome 24 in the Acala Maxxa background and chromosome 25 in the Pima S6 background. Individual lines contained an average of 0.904% of the donor genome, ranging from 0.07% (1.37 Mb) to 2.92% (56.65 Mb) in the Acala Maxxa background while in the Pima S6 background, individual lines contained an average of 0.97% of the donor genome, ranging from 0.15% to 3.07%.
3.2 Phenotypic performance of parents and experimental populations
The phenotypic performance of the two parents, reciprocal backcross populations, and reciprocal NIL populations for fiber elongation is shown in Figure 1. The distribution of fiber elongation was approximately normal (Shapiro and Wilk test; p > 0.05) and typical of quantitative inheritance. Pima S6 outperformed Acala Maxxa in all three environments (Supplementary Tables 2, 3; Figure 1). Both advanced backcross and NIL populations in the GB background performed better than in the GH background. Transgressive segregation is seen for all populations across all environments tested. Transgressive segregants outperforming both parents were identified in both population types and both backgrounds (Figure 1).
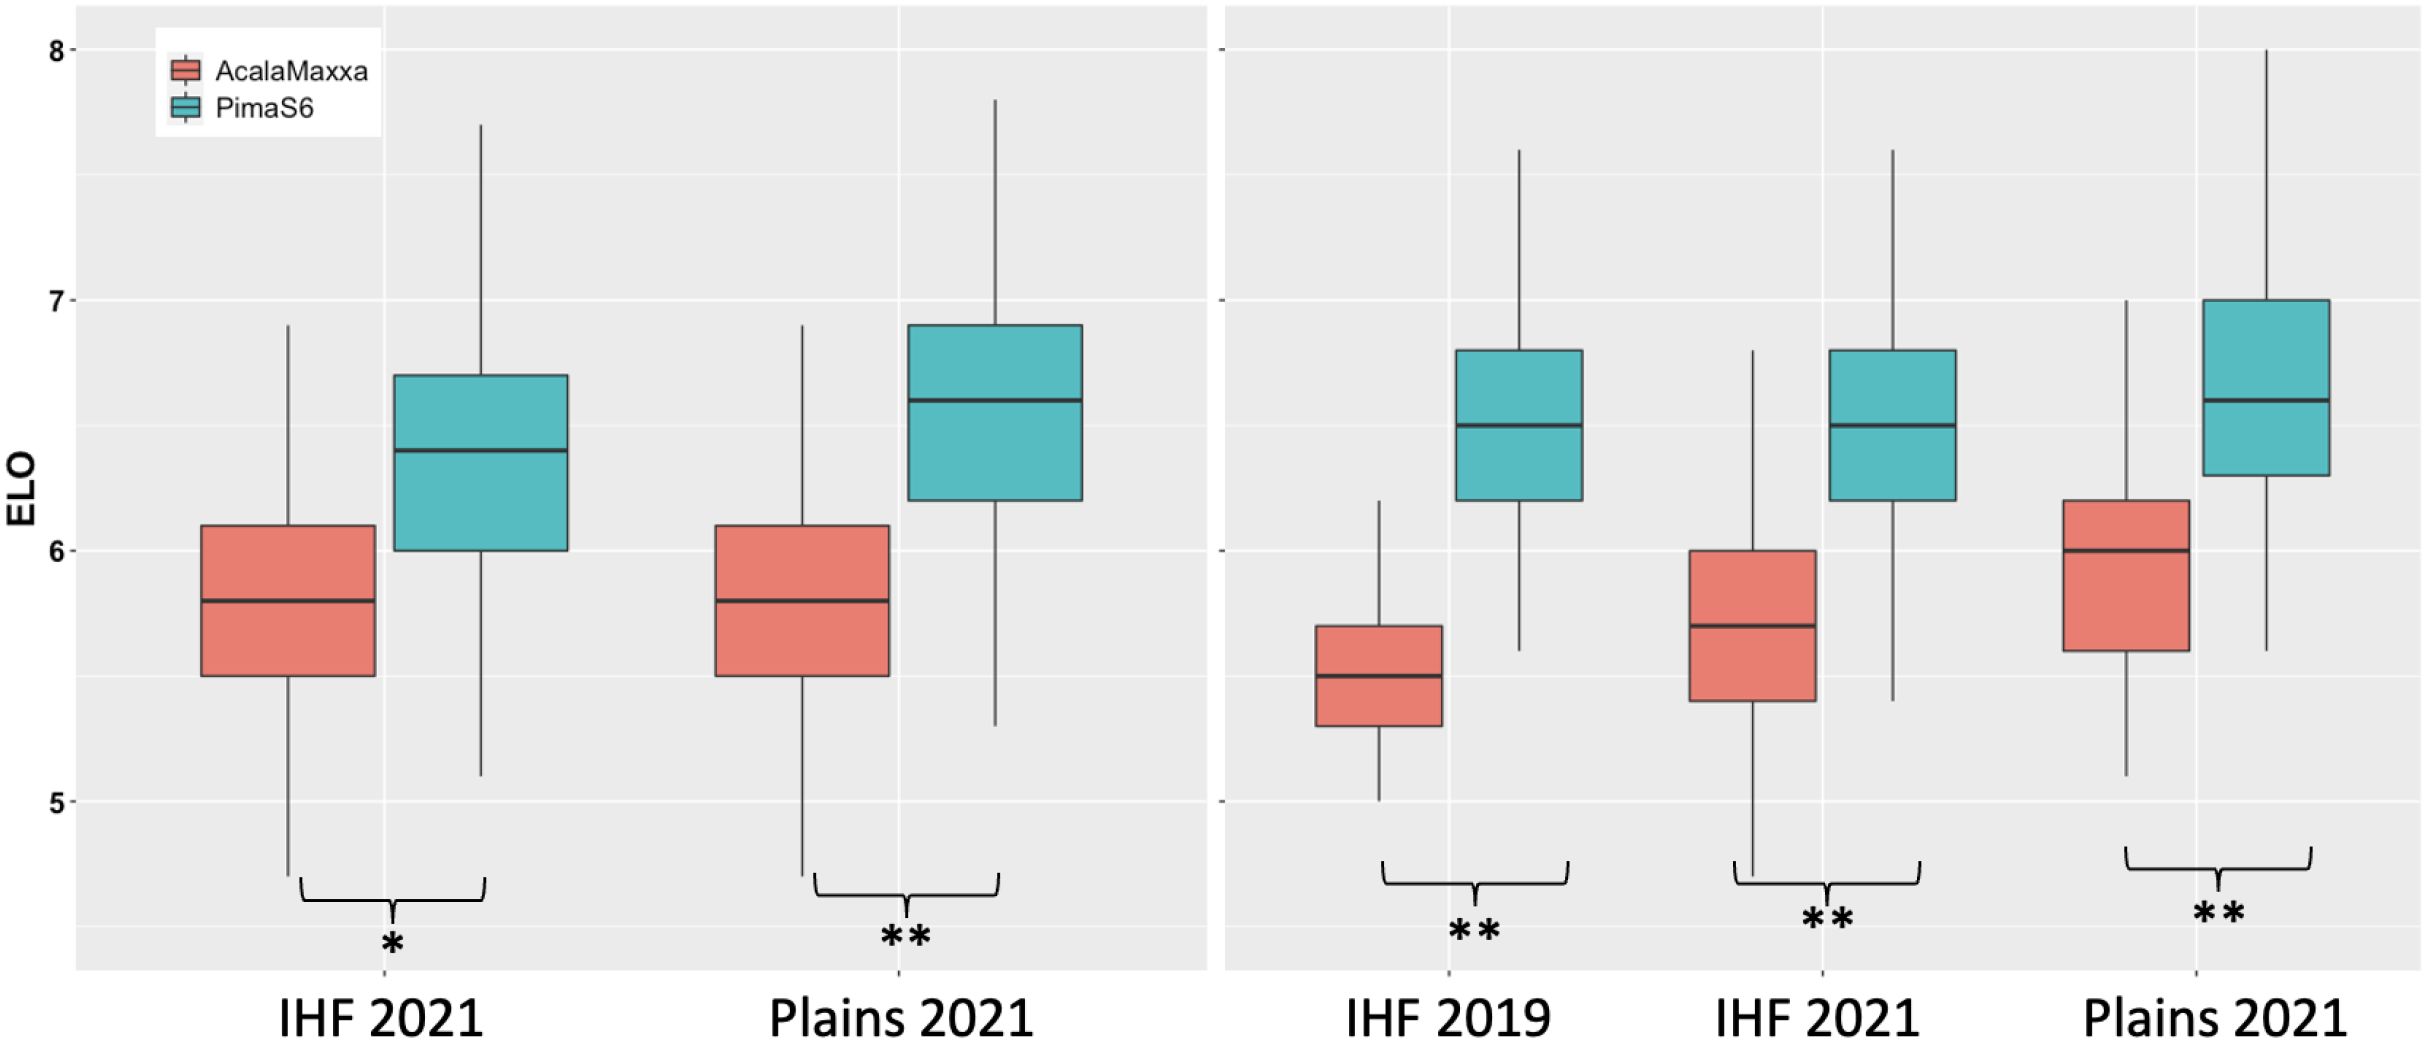
Figure 1. Distribution of fiber quality traits for the parents, reciprocal advanced backcrosses and NILs. Panels on the left show distribution of NILs for the two environments tested and panels on the right show distribution of the traits for advanced backcross populations. Significant at **0.01 and *0.05 alpha.
To identify the effect of genotypes and environment in the overall performance of the advanced backcross populations and the NILs, we conducted analysis of variance (ANOVA) treating all variables as fixed factors. Results showed significant effects of both genotype (GEN), and genotype-by-environment (GXE) (Supplementary Table 4). GEN captured the most variation in both population types and GXE also captured significant variation, precluding the use of combined phenotypic values in identification of QTLs. Thus, marker-trait association and identification of fiber elongation QTLs was performed separately for each environment tested.
3.3 Marker-trait association and overview of QTLs
A total of 36 marker-trait associations were identified for fiber elongation. Phenotypic variances explained by these QTLs ranged from 3.01% to 18.41% (Tables 1, 2). Among the 36 QTLs identified, 11 were of large effect, explaining > 10% of the total phenotypic variation while the remaining 25 were small effect QTLs (explaining<10% of total phenotypic variation).
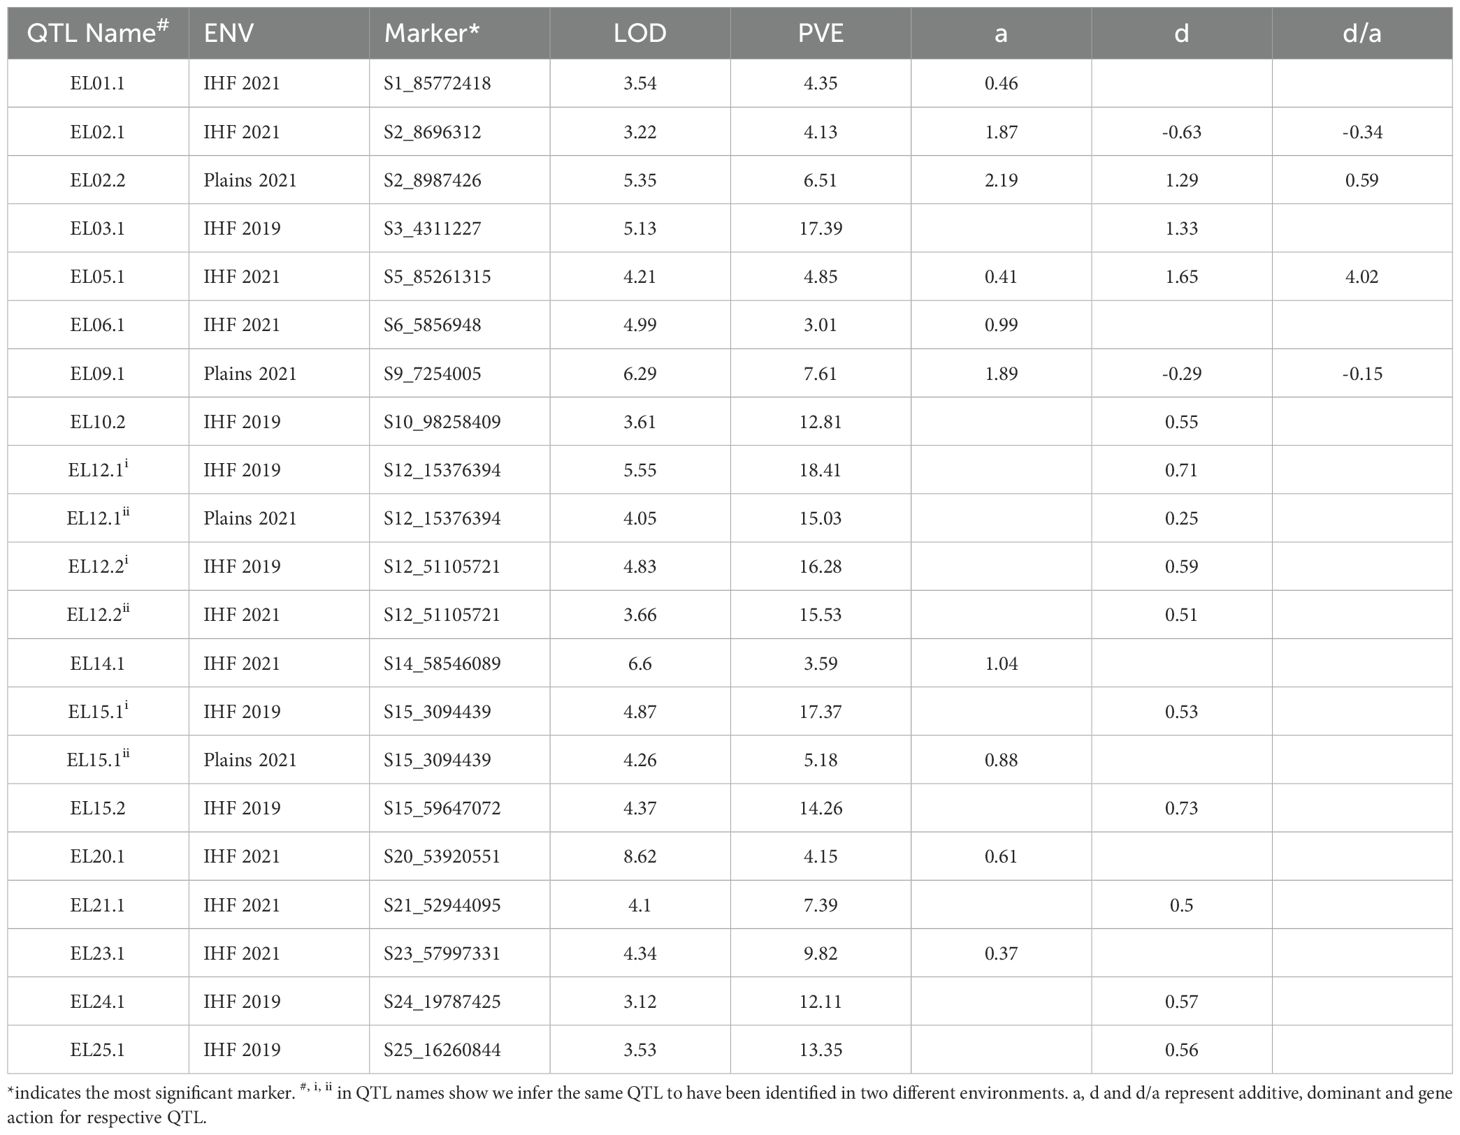
Table 1. QTLs for fiber elongation identified in the Acala Maxxa background.
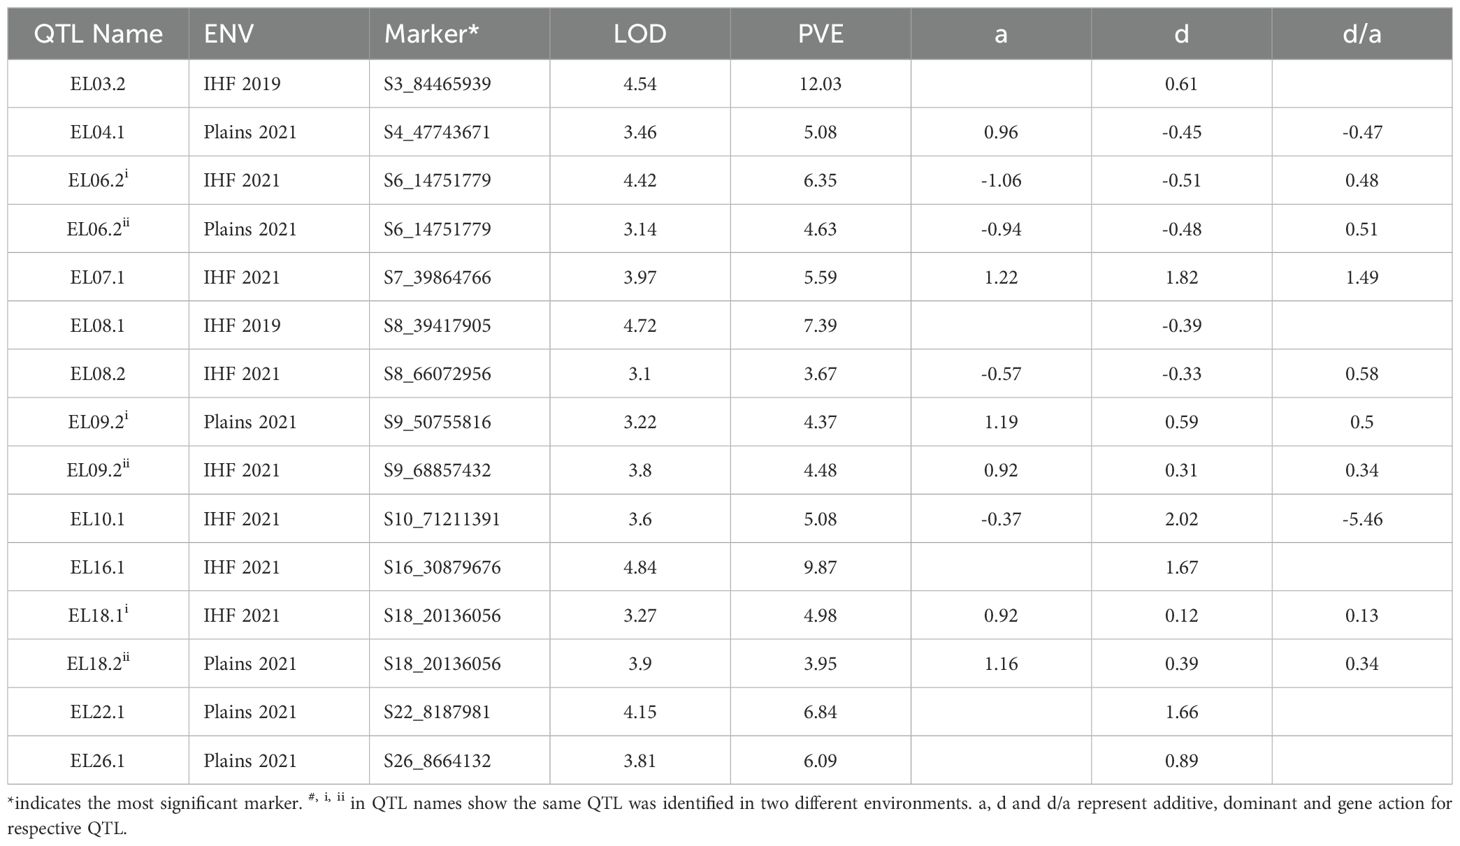
Table 2. QTLs for fiber elongation identified in the Pima S6 background.
In the GH background, a total of 21 QTLs were identified for ELO in the three environments tested, explaining 3.01% to 18.41% of total phenotypic variation (Table 1). These QTLs were distributed over 15 chromosomes, with chromosome 12 carrying the most QTLs. A total of 11 of these QTLs were small effect and the remaining 10 were large effect. Among the 21 QTLs identified, eight were identified at IHF in 2019, nine at IHF in 2021 and four at Plains in 2021. All 21 QTLs identified in the GH background increased fiber elongation consistent with the parental phenotypes. The ELO QTL on chromosome 12 was identified in all three environments tested and is a potential candidate for fine mapping and QTL identification studies. Another QTL on chromosome 15 was identified at IHF in 2019 and at Plains in 2021, making it a priority for further study of its effect on fiber elongation.
In the GB background, a total of 15 QTLs were identified for ELO, explaining 3.67% to 12.03% of the total phenotypic variation (Table 2). Among the 15 QTLs identified for ELO, two were identified at IHF in 2019, seven at IHF in 2021 and six at Plains in 2021. Of the 15 QTLs, only on chromosome 3 was a major effect QTL and the remaining 14 were small effect QTLs. Five of these QTLs decreased fiber elongation while 10 increased fiber elongation. One QTL on chromosome 6 and one on chromosome 9 were each identified in two environments (IHF 2021 and Plains 2021).
3.4 Subgenomic distribution of QTLs
Among the 36 QTLs identified for fiber elongation, 22 were identified in the At subgenome and 14 were identified in the Dt subgenome. In both backgrounds, At subgenome carried more QTLs for fiber elongation than Dt subgenome (12 vs 10 in the GH background and 9 vs 5 in the GB background). QTLs for fiber elongation were identified in all chromosomes except chromosomes 11, 13 and 19. In the GH background, fiber elongation QTLs were identified in 15 of 26 chromosomes while in the GB background, they were identified in 11 chromosomes.
3.5 Transgressive and heterotic QTLs
A total of 11 QTLs showed transgressive effects for fiber elongation, i.e. which were opposite of what would be predicted by comparison to the parental phenotypes (Table 3). Five of the 11 transgressive QTLs were identified in the Acala Maxxa background while six were identified in the Pima S6 background. Except for EL08.1 which showed fiber elongation values lower than both the parents, all other transgressive QTLs outperformed the parents in both backgrounds. Two QTLs in Acala Maxxa background and one in Pima S6 background had average fiber elongation values above 7.0, far exceeding the performance of the better parent (Pima S6), thus, indicating the potential for their use in breeding superior cultivars.
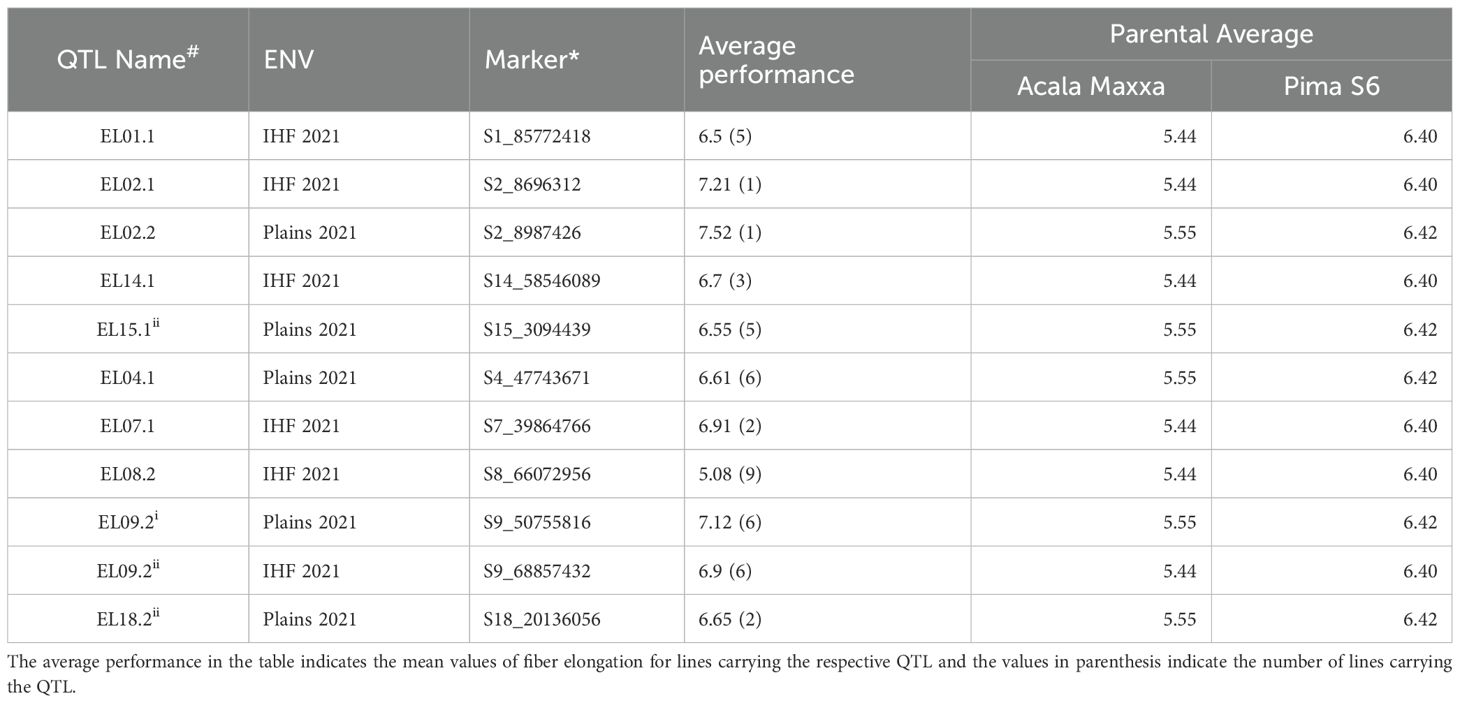
Table 3. Transgressive QTLs identified in the study.
Among the 36 QTLs identified in the study, three showed heterotic effects (d/a >|1.2|, see methods section for details). All three QTLs showed overdominant gene effects (d/a: 1.49 for EL07.1, d/a: 4.02 for EL05.1 and d/a: -5.46 for EL10.1; Tables 1, 2). It is well known that the F1 hybrids between these two species have striking fiber quality, and are directly used as cultivars in regions such as India where hybrid seed production costs are low. Further evaluation of salient lines carrying alleles such as these to validate their effects in multi-environment and multi-location trials may elucidate the genetic underpinnings of such hybrid advantages.
4 Discussion
Introgressive breeding approaches not only introduce novel allelic variation into cultivated gene pools, but interspecific populations developed using these approaches can be valuable for molecular dissection of complex fiber yield and quality parameters. Many past studies have focused on investigating the effects of GB chromatin segments introgressed into GH, however, the reverse has not been routinely studied. In the current study, we developed a reciprocal set of advanced backcross lines and NILs selected from among the selfed progenies of these advanced backcross lines and tested these populations to assess the effects of reciprocal chromatin transfer on an important fiber quality trait – ELO (fiber elongation). We identified a total of 36 marker-trait associations for fiber elongation with variable genetic effects. This study adds to the resources and observations available to study the quantitative nature of fiber quality traits reciprocally in two elite cotton backgrounds.
4.1 Performance of NILs and advanced backcross populations
NILs and advanced backcross populations in both backgrounds showed average phenotypes consistent with their recurrent parent (Figure 1). Albeit the average performance of these two populations behaved like their recurrent parents, which is expected given the exceptionally large proportion of their genome coming from the recurrent parent, a large amount of variation was observable (Adhikari et al., 2023, 2025). The presence of transgressive segregants in both directions suggests that the chromatin segments introgressed from the donor parents have effects that could significantly alter the performance of individual lines.
4.2 Effect of species background
The total number of QTLs identified for the three fiber quality traits differed little in the two backgrounds (21 in GH vs 15 in GB). While identification of similar total numbers of QTLs in the reciprocal backgrounds might suggest the involvement of similar number of genes in controlling these traits, many other findings indicate the effect of species background on effects, locations, and patterns of these QTLs. For example, all 21 QTLs identified in the GH background had positive effects, i.e. introgression from GB into GH always increased fiber elongation. While GB is known to have superior fiber elongation than GH and has the potential to transfer favorable alleles to GH background, it is an interesting observation to see that all the QTLs conferred by PimaS6 to the GH background increased fiber elongation. Observations like these, where alleles contributing favorable alleles are spread throughout the genome, would be suggestive of utilizing a comprehensive approach like genomic selection (rather than targeted selection) when breeding for such traits that have favorable alleles spread throughout the genome.
GH is usually not superior to GB in terms of fiber quality, and for this, it has rarely been used as a donor parent in trait mapping studies (Liu et al., 2023). The reciprocal nature of our populations allowed us not only to study GH as a recipient parent of favorable alleles from GB, but also to explore GH itself as potential source of novel alleles to the GB background. Our results suggest that GH can also contribute favorable alleles to GB. Of the 15 QTLs identified in the GB background, nine (more than half) had positive effects in increasing fiber elongation.
A perplexing observation, however, is the complete lack of reciprocity of QTLs identified with opposite phenotypic effects at corresponding locations in the reciprocal genetic backgrounds. In principle, one would expect the majority of QTLs to show such reciprocity if alternative alleles at a QTL show additive or dominant-recessive effects. Limited correspondence of identified QTLs in the two backgrounds could be a result of several factors. From first principles, noting that these lines covered 78.72% and 71.48% of the donor genome respectively in the Acala Maxxa and Pima S6 backgrounds, only a little more than half the genome is actually tested in both backgrounds. Further, the small phenotypic effects of most of the identified QTL, increases the likelihood that one or both members of a reciprocal pair elude detection (Broman, 2001). Another intriguing factor that could account for some failures to identify correspondence of QTLs in the reciprocal backgrounds, especially in advanced backcross lines with multiple introgressed chromosomal segments, is epistasis. Interaction between introgressed loci might result in underestimation of their effects which might have resulted in some QTLs failing to reach the biometric thresholds required to declare them as QTLs per se. The widespread observation that fiber quality parameters generally have high heritability (Fang et al., 2014) suggests a limited role of epistasis, but it could contribute to failures to identify reciprocal QTLs with relatively small effects (Chandnani et al., 2018). This might be the case here as most of the QTLs detected in this study show low genetic contribution to the total phenotypic variation explained by the phenotype.
4.3 Subgenomic distribution of fiber quality QTLs
While it is no longer controversial that an appreciable portion of variation in fiber quality derives from the D subgenome (Jiang et al., 1998) from an ancestor that does not produce spinnable fiber, the relative roles of the two cotton subgenomes vary by trait and population. With regard to the distribution of QTL in A and D subgenomes, many prior studies have concluded that more QTL for growing period, yield and fiber quality were distributed in the Dt subgenome than in the At subgenome (Rong et al., 2007; Said et al., 2013; Wang et al., 2013; Adhikari et al., 2017; Chandnani et al., 2018). However, Shen et al. (2005) and Lin et al. (2005) reported that more QTL for fiber quality were located in the At than the Dt subgenome. In the current study, we identified more QTLs in the At than the Dt subgenome. For NILs and advanced backcross populations in the GH background, the subgenomic affinities of QTLs were not significantly different (p>0.05) but nominally agreed with most previous findings, with the At subgenome harboring three more QTLs (12 vs 10) than the Dt subgenome. In the reciprocal background, however, a significantly higher (p<0.05) number of QTLs were identified in the At subgenome (9 vs 5).
4.4 Stability of fiber quality QTLs
While different loci associated with the same trait under various environments might suggest interaction between genotype and environment, QTLs being detected across environments might indicate environmental stability. Although most QTLs identified in this study were single-environment QTLs, seven genomic regions (on chromosomes 2, 6, 9, 12, 15 and 18) were consistently associated with ELO in two different environments (Tables 1, 2, Figure 2). Since NILs facilitate pinpointing genomic regions affecting phenotypes to a rather small region around the causal mutation without accumulating a lot of extraneous variation, the identification of these seven stable regions for QTL in the cotton genome warrants more indepth look into these regions for genes controlling the trait. While this investigation is not in the scope of our current study, it will certainly help the scientific community to streamline efforts in these regions to identify and verify candidate genes controlling fiber elongation.
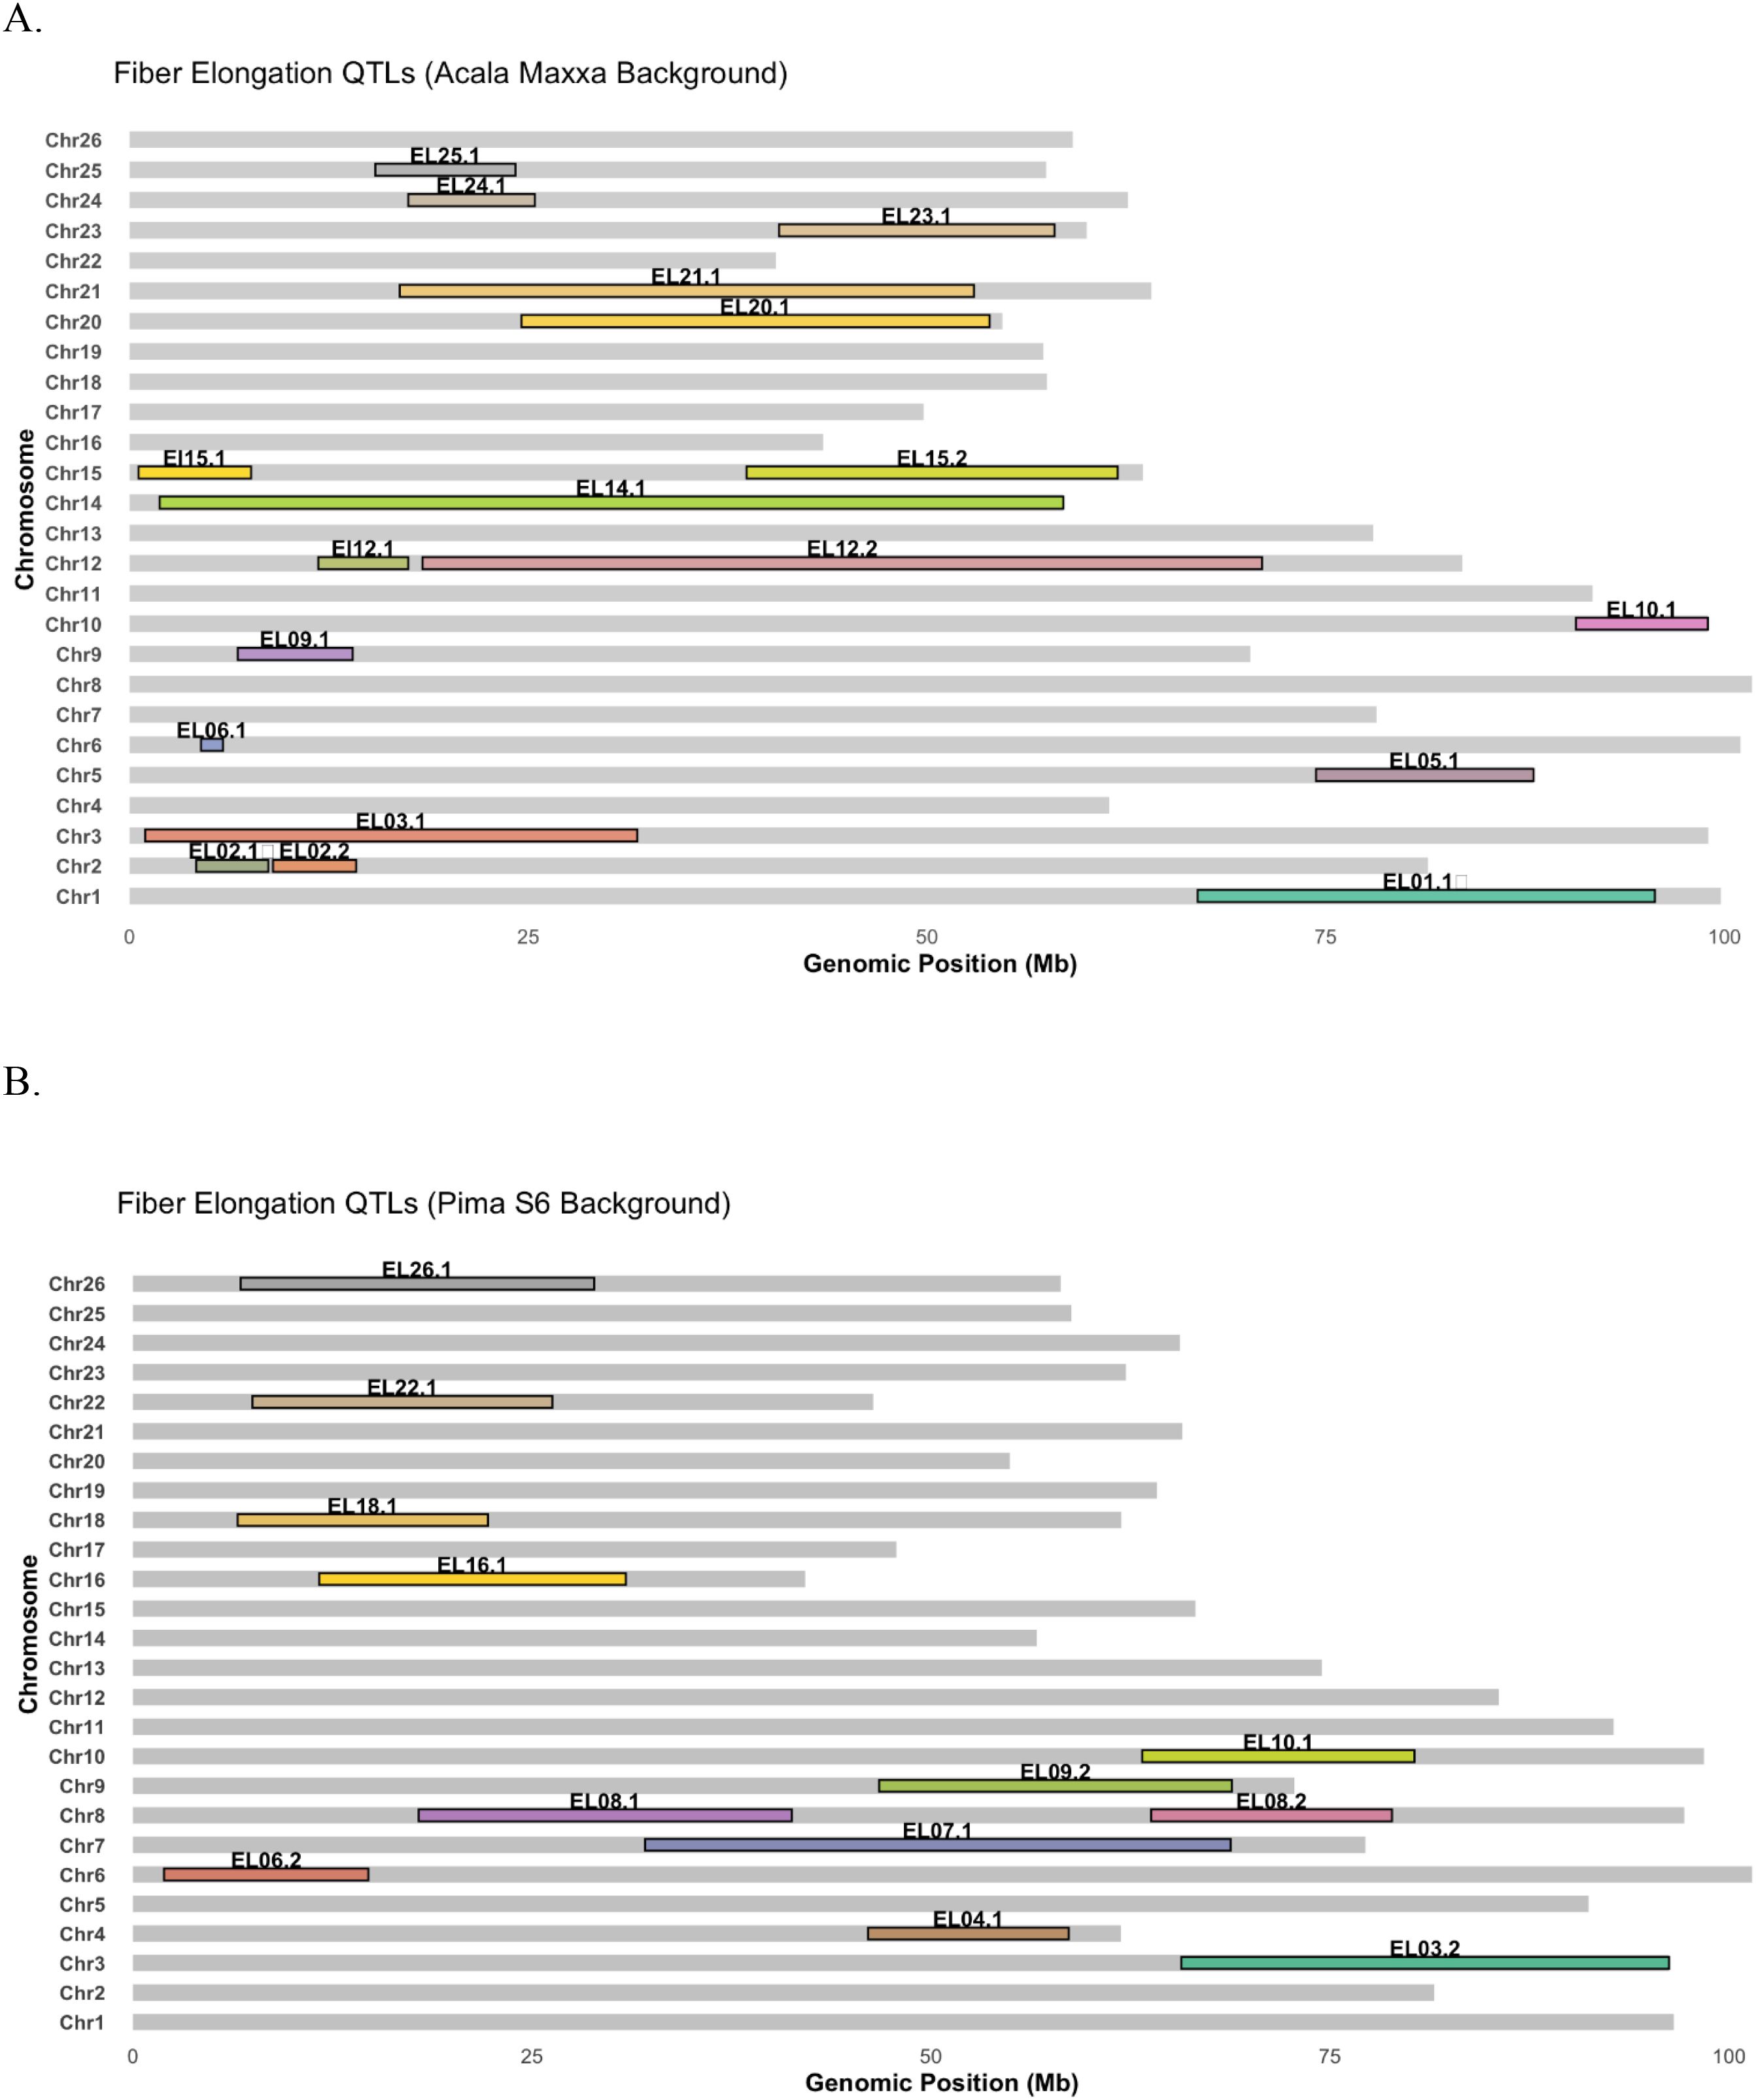
Figure 2. Distribution of QTLs associated with fiber elongation identified in (A) Acala Maxxa background (B) Pima S6 background.
4.5 Similarity with QTLs previously reported
The genetic composition of our experimental populations provides a platform to identify novel small-effect QTLs in addition to major QTLs. Since NILs serve as a resource to not only identify marker trait associations but also an important tool to verify QTLs previously identified, mostly those using early generation populations, the correspondence identified here could be used as a means of validation of previously published QTLs. Given that there are hundreds of studies reporting fiber quality QTLs and owing to the genetic structure of our experimental populations, we mostly compared our results with populations of similar genomic composition (Chee et al., 2005b; Draye et al., 2005; Yu et al., 2013; Brown et al., 2019). We also performed elaborate statistical comparisons with other previous reports on the correspondence of QTLs identified in our study.
In a comprehensive study of biometric parameters of QTLs affecting fiber elongation using a backcross-self approach, (Chee et al., 2005a, b) identified a fiber elongation QTL (EL05.1) on chromosome 5 with the nearest locus being RFLP marker pAR206b, in the same introgressed segment where we identified the most significant marker for our ELO QTL (qEL05.1) in the GH background, both GB alleles increasing fiber elongation. In the same study, another fiber elongation QTL EL23.1 was identified on chromosome 23 with the nearest marker being an RFLP marker pAR209, near which we also identified a fiber elongation QTL (EL23.1) – albeit with a different phenotypic effect. While the fiber elongation QTLs identified on this chromosome in the previous study decreased fiber elongation, the one identified in our study increased fiber elongation. In both studies, the donor parent was the same (Pima S6) while the recipient parents were different (G. hirsutum cv. Tamcot 2111 in the previous study), implicating variation among cultivars within the same species as a possible cause of this difference.
While correspondence of individual marker-trait associations may reflect, for example, a gene for which the recurrent parent, Acala Maxxa or Pima S6, has a rare allele, non-random patterns of association across an entire genome can reflect other properties such as convergent domestication (Paterson et al., 1995). To investigate such genome wide non-random patterns of association, we also conducted a comprehensive study on the correspondence of QTLs identified here, with previous reports irrespective of the population type. Information on a total of 830 QTLs related to fiber elongation in 103 previous reports were downloaded from CottonGen (https://www.cottongen.org). The hypergeometric probability distribution was used to analyze QTL correspondence, providing a means to infer statistically whether QTLs for a trait are randomly distributed between two populations or environments. Correspondence was identified for 15 of the 31 previously reported studies for the QTLs reported in Acala Maxxa background and for 10 of the 31 previously reported studies in Pima S6 background (Table 4). Common QTLs were identified in most of the 31 reports listed, however, only 15 (or 10) significant P values based on the hypergeometric distribution suggest that across the genome, this correspondence is not sufficient to infer a non-random distribution of QTLs between published studies.
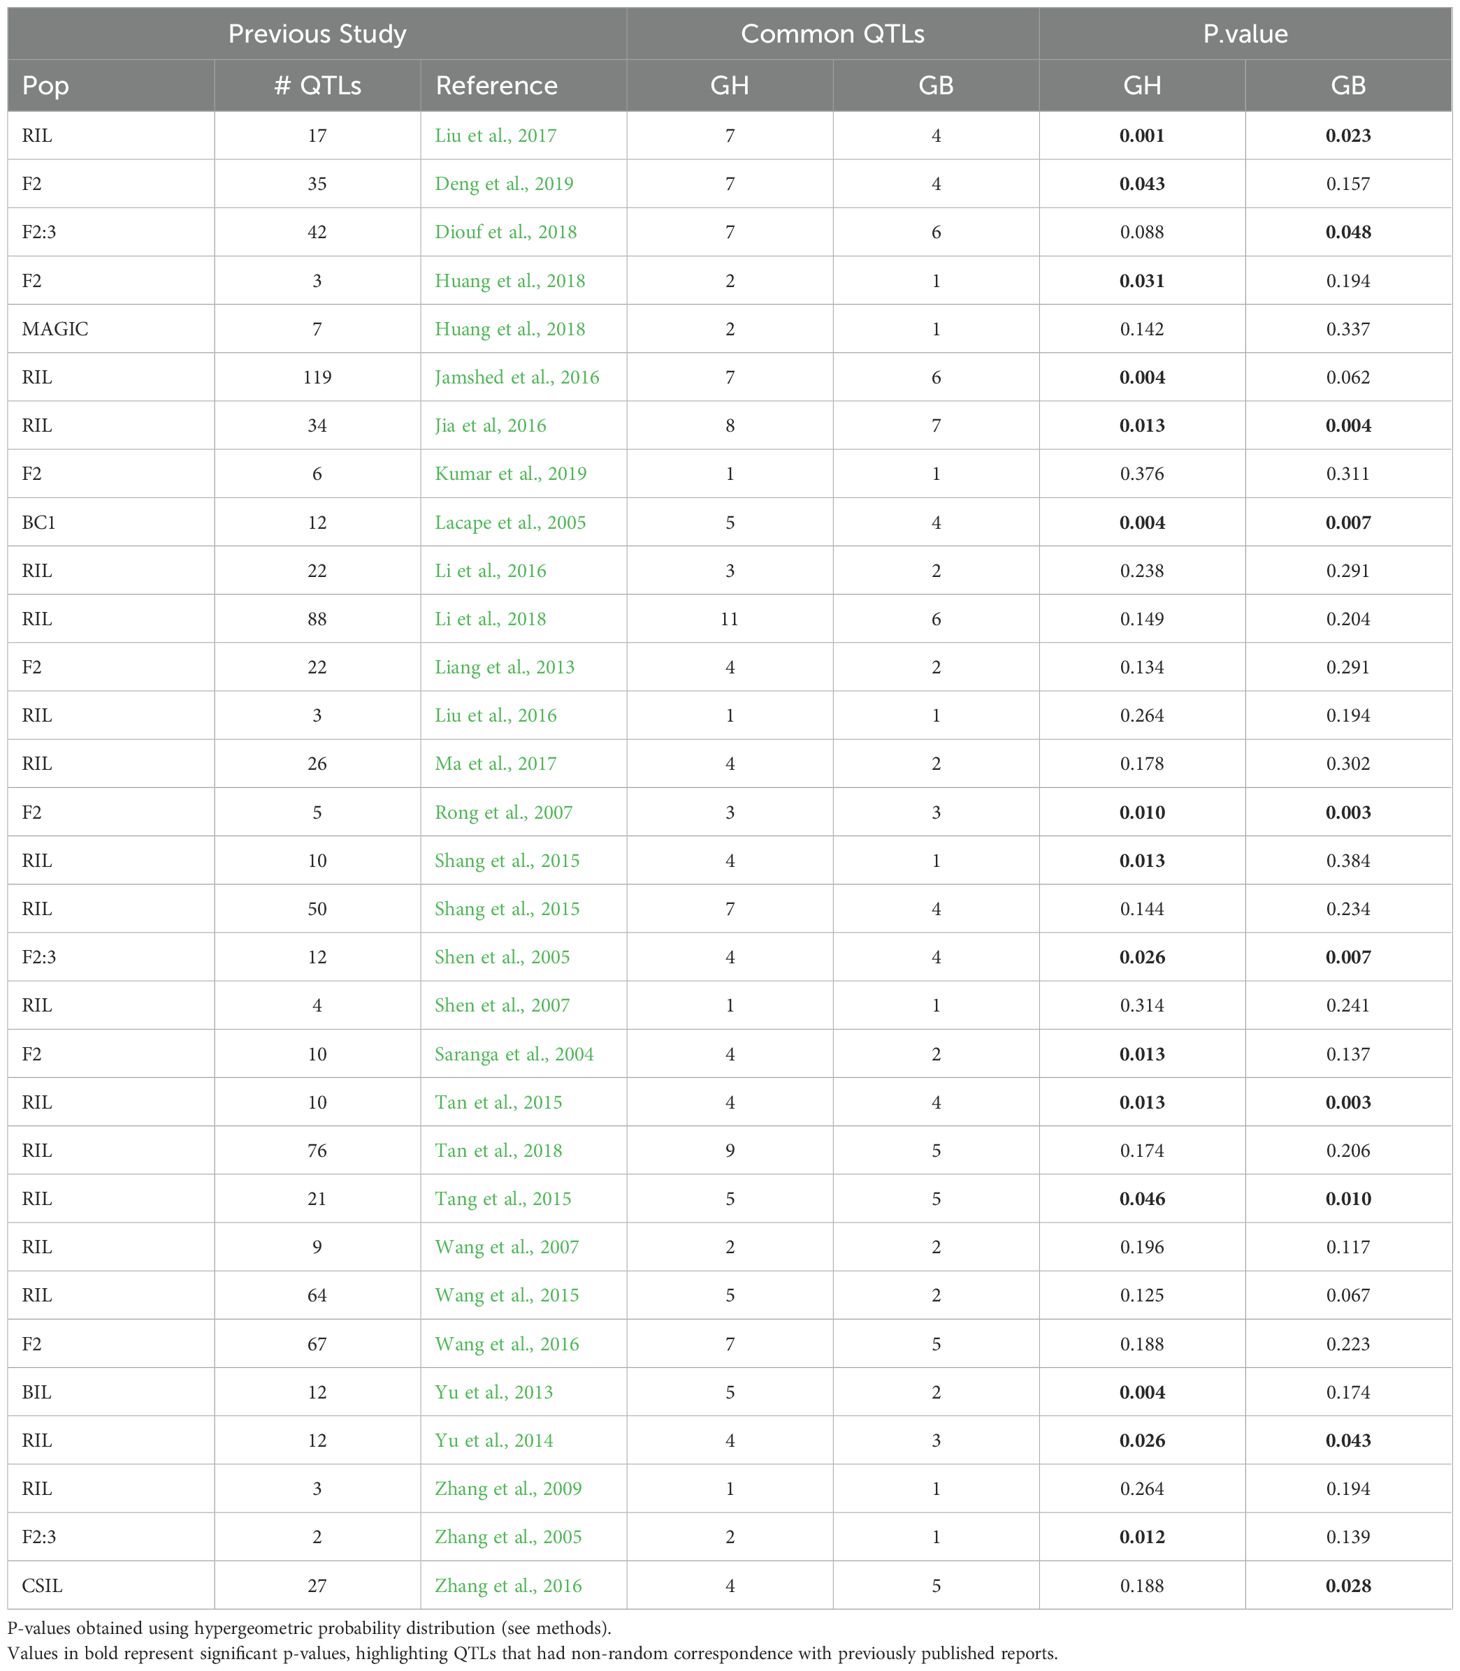
Table 4. Correspondence of fiber quality QTLs between current and previous study.
4.6 Comparison of absolute effects with early generation populations
While it is a common practice to compare and contrast QTLs mapped in different populations to verify underlying loci, it is also important to highlight the advantages of some mapping populations over others, especially in terms of the quality of the estimates that they can offer. With reduced background noise, advanced backcross populations such as NILs offer more precise estimates of the effects of underlying QTLs. While the total variations attributable to the QTLs obtained from our NIL populations (Tables 1, 2, Figure 2) are not as pronounced as those from F2, F2:3, RILs or other early generation populations reported elsewhere (which is expected given the nature of our populations), the effects of these QTLs individually were significantly larger than those reported by early generation studies of population types that carry a lot of segregating genomic regions (Table 5).
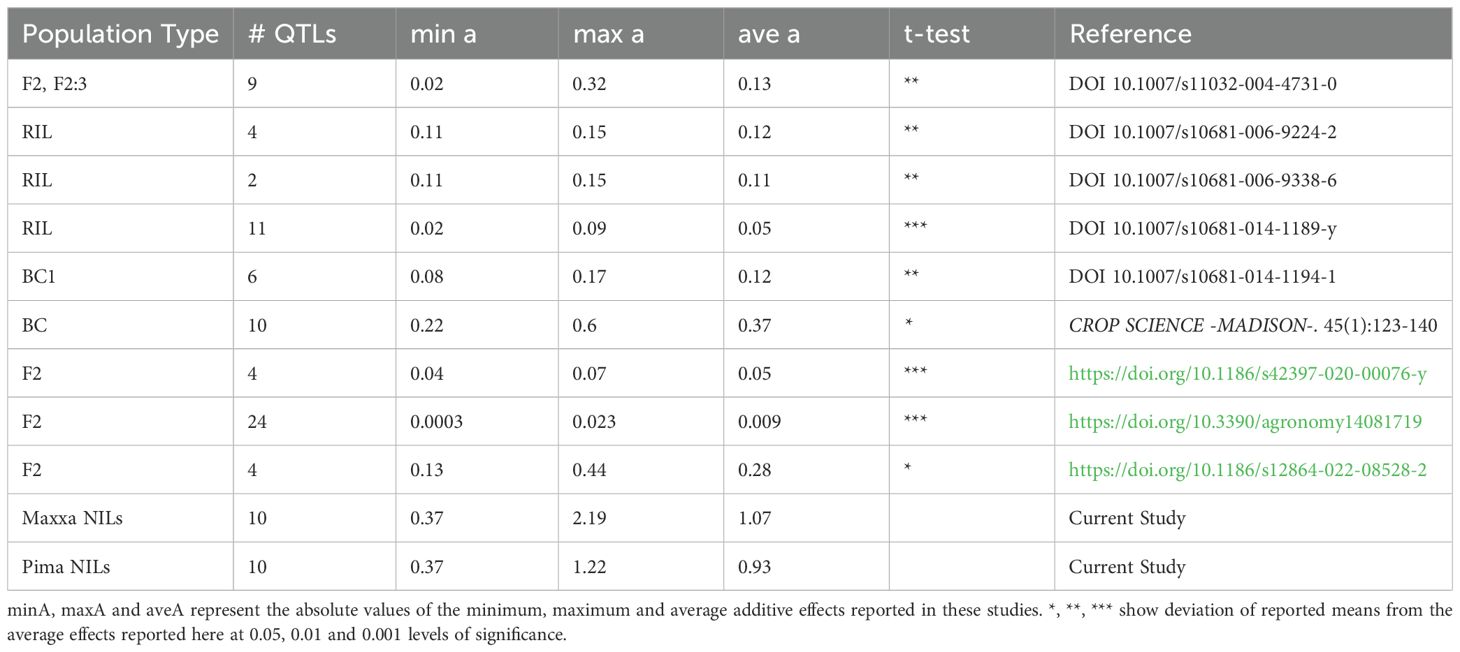
Table 5. Comparison of additive effects of fiber elongation QTLs identified using NILs (current study) versus early generation populations (published reports).
Since the parents used, type of crosses and population sizes, precision of reported location of the QTLs, and type of diagnostic markers for reporting QTLs in prior studies vary greatly, the distribution of the additive allele effects of the QTLs were compared to ours using a two-sample t-test. Absolute values of the effects were used to perform the t-test to remove/reduce cancellations of effect sizes due to the direction of the QTL source (sign convention). The QTLs reported in the current study have significantly larger average additive effects that those from other population types (Table 5). While, in general, fiber elongation QTLs from other population types contributed 0.009 to 0.37 percent additive effects with maximum observed values of 0.6 percent, the average additive effect of QTLs reported here average 1.07 percent with a maximum effect of 2.19 percent. Indeed, the minimum effect of 0.37 percent found in the NILs is greater than most averages or even maximums reported in other studies. These results suggest that NILs offer a much greater advantage in precisely identifying QTL effects, especially relatively subtle effects that might be masked by either genetic or non-genetic variation in other population structures.
4.7 In silico annotation of potential candidate genes
Availability of cotton reference genomes (Paterson et al., 2012; Zhang et al., 2015) enabled us to scrutinize physical regions surrounding the identified QTLs for genes/gene families known or suspected to affect fiber quality parameters in cotton. This investigation was limited to tightly linked regions i.e., 1 Mb on both sides of the SNP marker that is most significantly associated with the QTLs. On chromosome 5, the nearest gene of interest to an ELO QTL (EL05.1) was a C2HC zinc finger superfamily protein, a member of a gene family whose gene expression level at 11 days post-anthesis has been reported to be highly correlated with UHM and which has been implicated in secondary cell wall thickening (Al-Ghazi et al., 2009). Similarly, on chromosome 10, the nearest gene of interest to another fiber elongation QTL (EL10.2) was a glucosyltransferase like UDP-Gp gene. The enzymatic activity of this gene increases during the period of development when cotton fiber is synthesizing massive amount of cellulose (Taliercio and Kloth, 2004; Xu et al., 2022), which like protein is involved in cellulose biosynthesis during secondary cell wall formation stage. While it is premature to suggest the active roles of these genes towards fiber trait phenotypes, these genes are potential candidates for these roles given that they are so close to the most significant marker for fiber quality QTLs that have been repeatedly identified in multiple environments and studies. Improved genomic resources together with these novel populations are expected to accelerate candidate gene identification and validation for many such loci.
5 Conclusion
Breeding programs have often attempted the transfer of alleles between the two major species of cotton, with GB being the preferred donor due to its superior fiber quality parameters. A paucity of studies has been conducted on the reciprocal transfer primarily due to low fiber yield of GB and the hypothesis that GH may not contribute towards improving fiber quality of its sister species. Reciprocal experimental populations offer objective comparison of the potential of the two species not only in their contribution of favorable alleles to the recipient background but also in their permeability and/or resistance to alleles from the donor species.
By utilizing advanced reciprocal backcross lines and near-isogenic lines, we studied the impact of genetic background on chromatin transfer and their effect on a crucial fiber quality trait – fiber elongation. Not only were we able to show the effect of recipient background on this trait but we were also able to show that GH, the species with generally poorer fiber quality, nonetheless contributed favorable alleles at some loci for fiber elongation. The near-isogenic genomic composition of our population provided opportunities to estimate the effects of genomic regions more precisely, but at a cost of the ability to detect epistatic QTL interactions. With one of the major purposes of NILs being the ability to verify the location and effects of QTLs, in addition to their identification, we were able to validate important fiber quality QTLs identified in previous studies. Since the parents used in creating these populations are both elite lines representing the two major domesticated species of cotton, with their own specialties and differences, the populations we developed are not just a platform to identify genomic locations underpinning fiber quality traits, but also a good starting point from which to study divergence, domestication and evolutionary history of cotton as well as to select superior individual lines for breeding and/or commercialization.
Data availability statement
The raw SNPs data corresponding to the advanced backcross lines is available at https://doi.org/10.5061/dryad.kh189329v and the SSR marker data that have been used to validate the NILs is available as supplementary dataset (Supplementary Table 1).
Author contributions
JA: Data curation, Methodology, Software, Investigation, Formal analysis, Visualization, Writing – original draft. DV: Methodology, Writing – review & editing. WP: Writing – review & editing, Methodology. SK: Methodology, Writing – review & editing. RC: Methodology, Writing – review & editing. JP: Methodology, Writing – review & editing. TS: Methodology, Writing – review & editing. PC: Writing – review & editing, Methodology. AP: Investigation, Project administration, Conceptualization, Validation, Funding acquisition, Writing – review & editing.
Funding
The authors declare financial support was received for the research, authorship, and/or publication of this article. This work was supported by the National Science Foundation Plant Genome Research Program (0817707); Cotton Incorporated; and the Georgia Cotton Commission.
Acknowledgments
We thank all members of the Plant Genome Mapping Lab and the Molecular Cotton Breeding Lab for their contributions to this project.
Conflict of interest
The authors declare that the research was conducted in the absence of any commercial or financial relationships that could be construed as a potential conflict of interest.
The authors declared that they were an editorial board member of Frontiers, at the time of submission. This had no impact on the peer review process and the final decision.
The reviewer XL declared a past co-authorship/collaboration AHP with the author to the handling editor.
Generative AI statement
The authors declare that no Generative AI was used in the creation of this manuscript.
Any alternative text (alt text) provided alongside figures in this article has been generated by Frontiers with the support of artificial intelligence and reasonable efforts have been made to ensure accuracy, including review by the authors wherever possible. If you identify any issues, please contact us.
Publisher’s note
All claims expressed in this article are solely those of the authors and do not necessarily represent those of their affiliated organizations, or those of the publisher, the editors and the reviewers. Any product that may be evaluated in this article, or claim that may be made by its manufacturer, is not guaranteed or endorsed by the publisher.
Supplementary material
The Supplementary Material for this article can be found online at: https://www.frontiersin.org/articles/10.3389/fpls.2025.1657140/full#supplementary-material
References
Adhikari, J., Chandnani, R., Vitrakoti, D., Khanal, S., Ployaram, W., and Paterson, A. H. (2023). Comparative transmission genetics of introgressed chromatin in reciprocal advanced backcross populations in Gossypium (cotton) polyploids. Heredity 4, 209–222. doi: 10.1038/s41437-023-00594-w
Adhikari, J., Das, S., Wang, Z., Khanal, S., Chandnani, R., Patel, J. D., et al. (2017). Targeted identification of association between cotton fiber quality traits and microsatellite markers. Euphytica 213, 65. doi: 10.1007/s10681-017-1853-0
Adhikari, J., Petti, D., Vitrakoti, D., Ployaram, W., Li, C., and Paterson, A. H. (2025). Characterizing season-long floral trajectories in cotton with low-altitude remote sensing and deep learning. Plants People Planet. doi: 10.1002/ppp3.10644
Al-Ghazi, Y., Bourot, S., Arioli, T., Dennis, E. S., and Llewellyn, D. J. (2009). Transcript profiling during fiber development identifies pathways in secondary metabolism and cell wall structure that may contribute to cotton fiber quality. Plant Cell Physiol. 50, 1364–1381. doi: 10.1093/pcp/pcp084
Andolfatto, P., Davison, D., Erezyilmaz, D., Hu, T. T., Mast, J., Sunayama-Morita, T., et al. (2011). Multiplexed shotgun genotyping for rapid and efficient genetic mapping. Genome Res. 21, 610–617. doi: 10.1101/gr.115402.110
Broman, K. W. (2001). Resource review of statistical methods for QTL mapping in experimental crosses. Lab. Anim. 30, 44–52.
Brown, N., Kumar, P., Singh, R., Lubbers, E., Campbell, B. T., Myers, G. O., et al. (2019). Evaluation of a Chromosome Segment from Gossypium barbadense Harboring the Fiber Length QTL qFL-Chr.25 in Four Diverse Upland Cotton Genetic Backgrounds. Crop Sci. 59, 2621–2633. doi: 10.2135/cropsci2019.05.0321
Chandnani, R., Kim, C., Guo, H., Shehzad, T., Wallace, J. G., He, D., et al. (2018). Genetic analysis of gossypium fiber quality traits in reciprocal advanced backcross populations. Plant Genome 11, 170057. doi: 10.3835/plantgenome2017.06.0057
Chee, P., Draye, X., Jiang, C.-X., Decanini, L., Delmonte, T. A., Bredhauer, R., et al. (2005a). Molecular dissection of interspecific variation between Gossypium hirsutum and Gossypium barbadense (cotton) by a backcross-self approach: I. Fiber elongation. Theor. Appl. Genet. 111, 757–763. doi: 10.1007/s00122-005-2063-z
Chee, P. W., Draye, X., Jiang, C. X., Decanini, L., Delmonte, T. A., Bredhauer, R., et al. (2005b). Molecular dissection of phenotypic variation between Gossypium hirsutum and Gossypium barbadense (cotton) by a backcross-self approach: III. Fiber length. TAG Theor. Appl. Genet. 111, 772–781. doi: 10.1007/s00122-005-2062-0
Deng, X., Gong, J., Liu, A., Shi, Y., Gong, W., Ge, Q., et al. (2019). QTL mapping for fiber quality and yield-related traits across multiple generations in segregating population of CCRI 70. Journal of Cotton Research 2, 13. doi: 10.1186/s42397-019-0029-y
Diouf, L., Magwanga, R.O., Gong, W., He, S., Pan, Z., Jia, Y.H., et al. (2018). QTL mapping of fiber quality and yield-related traits in an intra-specific upland cotton using genotype by sequencing (GBS). International Journal of Molecular Sciences 19, 441. doi: 10.3390/ijms19020441
Draye, X., Chee, P., Jiang, C.-X., Decanini, L., Delmonte, T. A., Bredhauer, R., et al. (2005). Molecular dissection of interspecific variation between Gossypium hirsutum and G. barbadense (cotton) by a backcross-self approach: II. Fiber fineness. Theor. Appl. Genet. 111, 764–771. doi: 10.1007/s00122-005-2061-1
Edwards, M. D., Stuber, C. W., and Wendel, J. F. (1987). Molecular-marker-facilitated investigations of quantitative-trait loci in maize. I. Numbers, genomic distribution and types of gene action. Genetics 116, 113–125. doi: 10.1093/genetics/116.1.113
Fang, D. D., Jenkins, J. N., Deng, D. D., Mccarty, J. C., Li, P., and Wu, J. (2014). Quantitative trait loci analysis of fiber quality traits using a random-mated recombinant inbred population in Upland cotton (Gossypium hirsutum L.). BMC Genomics 15, 397. doi: 10.1186/1471-2164-15-397
Feltus, F. A., Hart, G. E., Schertz, K. F., Casa, A. M., Kresovich, S., Abraham, S., et al. (2006). Alignment of genetic maps and QTLs between inter- and intra-specific sorghum populations. Theor. Appl. Genet. 112, 1295–1305. doi: 10.1007/s00122-006-0232-3
Glaubitz, J. C., Casstevens, T. M., Lu, F., Harriman, J., Elshire, R. J., Sun, Q., et al. (2014). TASSEL-GBS: A high capacity genotyping by sequencing analysis pipeline. PloS One 9, 1–11. doi: 10.1371/journal.pone.0090346
Huang, C., Shen, C., Wen, T., Gao, B., Zhu, D., Li, X., et al. (2018). SSR-based association mapping of fiber quality in upland cotton using an eight-way MAGIC population. Molecular Genetics and Genomics 293, 793–805. doi: 10.1007/s00438-018-1419-4
Jamshed, M., Jia, F., Gong, J., Palanga, K.K., Shi, Y., Li, J., et al. (2016). Identification of stable quantitative trait loci (QTLs) for fiber quality traits across multiple environments in Gossypium hirsutum recombinant inbred line population. BMC Genomics 17, 197. doi: 10.1186/s12864-016-2560-2
Jia, X., Pang, C., Wei, H., Wang, H., Ma, Q., Yang, J., et al. (2016). High-density linkage map construction and QTL analysis for earliness-related traits in Gossypium hirsutum L.. BMC Genomics 17, 909. doi: 10.1186/s12864-016-3269-y
Jiang, C.-X., Chee, P. W., Draye, X., Morrell, P. L., Smith, C. W., and Paterson, A. H. (2000). Multilocus interactions restrict gene introgression in interspecific populations of polyploid gossypium (Cotton). Evolution 54, 798–814. doi: 10.1111/j.0014-3820.2000.tb00081.x
Jiang, C.-X., Wright, R. J., El-Zik, K. M., and Paterson, A. H. (1998). Polyploid formation created unique avenues for response to selection in Gossypium (cotton). Proc. Natl. Acad. Sci. 95, 4419–4424. doi: 10.1073/pnas.95.8.4419
Kumar, N.M., Katageri, I.S., Gowda, S.A., Adiger, S., Yadava, S.K., and Lachagari, V.R. (2019). 63K SNP chip based linkage mapping and QTL analysis for fibre quality and yield component traits in Gossypium barbadense L. cotton. Euphytica 215, 6. doi: 10.1007/s10681-018-2326-9
Lacape, J.M., Nguyen, T.B., Courtois, B., Belot, J.L., Giband, M., Gourlot, J.P., et al. (2005). QTL analysis of cotton fiber quality using multiple Gossypium hirsutum× Gossypium barbadense backcross generations. Crop Science 45, 123–140. doi: 10.2135/cropsci2005.0123a
Li, C., Dong, Y., Zhao, T., Li, L., Li, C., Yu, E., et al. (2016). Genome-wide SNP linkage mapping and QTL analysis for fiber quality and yield traits in the upland cotton recombinant inbred lines population. Frontiers in Plant Science 7, 1356. doi: 10.3389/fpls.2016.01356
Li, C., Yu, H., Li, C., Zhao, T., Dong, Y., Deng, X., et al. (2018). QTL mapping and heterosis analysis for fiber quality traits across multiple genetic populations and environments in upland cotton. Frontiers in Plant Science 9, 1364. doi: 10.3389/fpls.2018.01364
Liang, Q., Hu, C., Hua, H., Li, Z., and Hua, J. (2013). Construction of a linkage map and QTL mapping for fiber quality traits in upland cotton (Gossypium hirsutum L.). Chinese Science Bulletin 58, 3233–3243. doi: 10.1007/s11434-013-5807-1
Lin, Z., He, D., Zhang, X., Nie, Y., Guo, X., Feng, C., et al. (2005). Linkage map construction and mapping QTL for cotton fibre quality using SRAP, SSR and RAPD. Plant Breed. 124, 180–187. doi: 10.1111/j.1439-0523.2004.01039.x
Liu, D., Zhang, J., Liu, X., Wang, W., Liu, D., Teng, Z., et al. (2016). Fine mapping and RNA-Seq unravels candidate genes for a major QTL controlling multiple fiber quality traits at the T1 region in upland cotton. BMC Genomics 17, 295. doi: 10.1186/s12864-016-2605-6
Liu, X., Teng, Z., Wang, J., Wu, T., Zhang, Z., Deng, X., et al. (2017). Enriching an intraspecific genetic map and identifying QTL for fiber quality and yield component traits across multiple environments in Upland cotton (Gossypium hirsutum L.). Mol Genet Genomics 292, 1281–1306. doi: 10.1007/s00438-017-1347-8
Liu, Z., Sun, Z., Ke, H., Chen, B., Gu, Q., Zhang, M., et al. (2023). Transcriptome, ectopic expression and genetic population analysis identify candidate genes for fiber quality improvement in cotton. Int. J. Mol. Sci. 24, 8293. doi: 10.3390/ijms24098293
Ma, L., Zhao, Y., Wang, Y., Shang, L., and Hua, J. (2017). QTLs analysis and validation for fiber quality traits using maternal backcross population in Upland cotton. Frontiers in Plant Science 8, 2168. doi: 10.3389/fpls.2017.02168
Monforte, A. J. and Tanksley, S. D. (2000). Development of a set of near isogenic and backcross recombinant inbred lines containing most of the Lycopersicon hirsutum genome in a L. esculentum genetic background: A tool for gene mapping and gene discovery. Genome 43, 803–813. doi: 10.1139/g00-043
Paran, I. and Zamir, D. (2003). Quantitative traits in plants: beyond the QTL. Trends Genet. 19, 303–306. doi: 10.1016/S0168-9525(03)00117-3
Paterson, A. H., Brubaker, C. L., and Wendel, J. F. (1993). A rapid method for extraction of cotton (Gossypium spp.) genomic DNA suitable for RFLP or PCR analysis. Plant Mol. Biol. Rep. 11, 122–127. doi: 10.1007/BF02670470
Paterson, A. H., Deverna, J. W., Lanini, B., and Tanksley, S. D. (1990). Fine mapping of quantitative trait loci using selected overlapping recombinant chromosomes, in an interspecies cross of tomato. Genetics 124, 735–742. doi: 10.1093/genetics/124.3.735
Paterson, A. H., Lin, Y. R., Li, Z., Schertz, K. F., Doebley, J. F., Pinson, S. R., et al. (1995). Convergent domestication of cereal crops by independent mutations at corresponding genetic Loci. Science 269, 1714–1718. doi: 10.1126/science.269.5231.1714
Paterson, A.H., Boman, R.K., Brown, S.M., Chee, P.W., Gannaway, J.R., Gingle, A.R., et al. (2004). Reducing the genetic vulnerability of cotton. Crop Science 44, 1900–1901. doi: 10.2135/cropsci2004.1900
Paterson, A. H., Wendel, J. F., Gundlach, H., Guo, H., Jenkins, J., Jin, D., et al. (2012). Repeated polyploidization of Gossypium genomes and the evolution of spinnable cotton fibres. Nature 492, 423–427. doi: 10.1038/nature11798
Perkins, J. H. H., Ethridge, D. E., and Bragg, C. K. (1984). “Fiber,” in Kohel, R., Kohel, J., Lewis, C., and Lewis, F.eds. Cotton, Madison, WI: American Society of Agronomy, 437–509.
R Core Team (2016). R: A language and environment for statistical computing. R Foundation for Statistical Computing, Vienna, Austria.
Riley, C. R., Jr. (1997). Quality measurements – improved high volume instrument elongation measurements. J. Cotton Sci. 1, 61.
Rong, J., Feltus, F. A., Waghmare, V. N., Pierce, G. J., Chee, P. W., Draye, X., et al. (2007). Meta-analysis of polyploid cotton QTL shows unequal contributions of subgenomes to a complex network of genes and gene clusters implicated in lint fiber development. Genetics 176, 2577–2588. doi: 10.1534/genetics.107.074518
Swarts, K., Li, H., Romero Navarro, J. A., An, D., Romay, M. C., Hearne, S., et al. (2014). Novel methods to optimize genotypic imputation for low-coverage, next-generation sequence data in crop plants. The Plant Genome 7 (3), 1–12. doi: 10.3835/plantgenome2014.05.0023
Said, J. I., Lin, Z., Zhang, X., Song, M., and Zhang, J. (2013). A comprehensive meta QTL analysis for fiber quality, yield, yield related and morphological traits, drought tolerance, and disease resistance in tetraploid cotton. BMC Genomics 14, 776. doi: 10.1186/1471-2164-14-776
Saranga, Y., Jiang, C. X., Wright, R., Yakir, D., and Paterson, A. (2004). Genetic dissection of cotton physiological responses to arid conditions and their inter-relationships with productivity. Plant, Cell & Environment 27, 263–277. doi: 10.1111/j.1365-3040.2003.01134.x
Shang, L., Liang, Q., Wang, Y., Wang, X., Wang, K., Abduweli, A., et al. (2015). Identification of stable QTLs controlling fiber traits properties in multi-environment using recombinant inbred lines in Upland cotton (Gossypium hirsutum L.). Euphytica 205, 877–888. doi: 10.1007/s10681-015-1434-z
Shen, X., Guo, W., Zhu, X., Yuan, Y., Yu, J. Z., Kohel, R. J., et al. (2005). Molecular mapping of QTLs for fiber qualities in three diverse lines in Upland cotton using SSR markers. Mol. Breed. 15, 169–181. doi: 10.1007/s11032-004-4731-0
Shen, X., Guo, W., Lu, Q., Zhu, X., Yuan, Y., and Zhang, T.. (2007). Genetic mapping of quantitative trait loci for fiber quality and yield trait by RIL approach in upland cotton. Euphytica 155, 371–380. doi: 10.1007/s10681-006-9338-6
Szalma, S. J., Hostert, B. M., Ledeaux, J. R., Stuber, C. W., and Holland, J. B. (2007). QTL mapping with near-isogenic lines in maize. Theor. Appl. Genet. 114, 1211–1228. doi: 10.1007/s00122-007-0512-6
Taliercio, E. and Kloth, R. (2004). Expression and characterization of a UDP-glucose pyrophosphorylase gene in cotton. J. Cotton Sci. 8, 91–98.
Tan, Z., Fang, X., Tang, S., Zhang, J., Liu, D., Teng, Z., et al. (2015). Genetic map and QTL controlling fiber quality traits in upland cotton (Gossypium hirsutum L.). Euphytica 203, 615–628. doi: 10.1007/s10681-014-1288-9
Tan, Z., Zhang, Z., Sun, X., Li, Q., Sun, Y., Yang, P., et al. (2018). Genetic map construction and fiber quality QTL mapping using the CottonSNP80K array in upland cotton. Frontiers in Plant Science 9, 225. doi: 10.3389/fpls.2018.00225
Tang, S., Teng, Z., Zhai, T., Fang, X., Liu, F., Liu, D., et al. (2015). Construction of genetic map and QTL analysis of fiber quality traits for upland cotton (Gossypium hirsutum L.). Euphytica 201, 195–213. doi: 10.1007/s10681-014-1189-y
Tanksley, S. D. and Nelson, J. C. (1996). Advanced backcross QTL analysis: a method for the simultaneous discovery and transfer of valuable QTLs from unadapted germplasm into elite breeding lines. Theor. Appl. Genet. 92, 191–203. doi: 10.1007/BF00223376
Wang, G. L., Dong, J. M., and Paterson, A. H. (1995). The distribution of Gossypium hirsutum chromatin in G. barbadense germplasm: molecular analysis of introgressive plant breeding. Theor. Appl. Genet. 91, 1153–1161. doi: 10.1007/bf00223934
Wang, Z., Zhang, D., Wang, X., Tan, X., Guo, H., and Paterson, A. H. (2013). A whole-genome DNA marker map for cotton based on the D-genome sequence of Gossypium raimondii L. G3 Genes|Genomes|Genetics 3, 1759–1767. doi: 10.1534/g3.113.006890
Wang, J., Guo, W., and Zhang, T. (2007). QTL mapping for fiber quality properties in cotton cultivar Yumian 1. Acta Agronomica Sinica 33 (12), 1915.
Wang, H., Huang, C., Guo, H., Li, X., Zhao, W., Dai, B., et al (2015). QTL mapping for fiber and yield traits in upland cotton under multiple environments. PLoS One 10, e0130742. doi: 10.1371/journal.pone.0130742
Wang, F., Zhang, C., Liu, G., Chen, Y., Zhang, J., Qiao, Q., et al (2016). Phenotypic variation analysis and QTL mapping for cotton (Gossypium hirsutum L.) fiber quality grown in different cotton-producing regions. Euphytica 211, 169–183. doi: 10.1007/s10681-016-1728-9
Xu, Z., He, J., Tehseen Azhar, M., Zhang, Z., Fan, S., Jiang, X., et al. (2022). UDP-glucose pyrophosphorylase: genome-wide identification, expression and functional analyses in Gossypium hirsutum. PeerJ 10, e13460. doi: 10.7717/peerj.13460
Young, N. D. and Tanksley, S. D. (1989). RFLP analysis of the size of chromosomal segments retained around the Tm-2 locus of tomato during backcross breeding. Theor. Appl. Genet. 77, 353–359. doi: 10.1007/bf00305828
Yu, J., Zhang, K., Li, S., Yu, S., Zhai, H., Wu, M., et al. (2013). Mapping quantitative trait loci for lint yield and fiber quality across environments in a Gossypium hirsutum × Gossypium barbadense backcross inbred line population. Theor. Appl. Genet. 126, 275–287. doi: 10.1007/s00122-012-1980-x
Yu, J. Z., Ulloa, M., Hoffman, S. M., Kohel, R. J., Pepper, A. E., Fang, D. D., et al. (2014). Mapping genomic loci for cotton plant architecture, yield components, and fiber properties in an interspecific (Gossypium hirsutum L. × G. barbadense L.) RIL population. Molecular Genetics and Genomics 289, 1347–1367. doi: 10.1007/s00438-014-0930-5
Zhang, T., Hu, Y., Jiang, W., Fang, L., Guan, X., Chen, J., et al. (2015). Sequencing of allotetraploid cotton (Gossypium hirsutum L. acc. TM-1) provides a resource for fiber improvement. Nat. Biotechnol. 33, 531–537. doi: 10.1038/nbt.3207
Zhang, Z.-S., Hu, M.-C., Zhang, J., Liu, D.-J., Zheng, J., Zhang, K., et al. (2009). Construction of a comprehensive PCR-based marker linkage map and QTL mapping for fiber quality traits in upland cotton (Gossypium hirsutum L.). Molecular Breeding 24, 49–61.
Zhang, Z. S., Xiao, Y. H., Luo, M., Li, X. B., Luo, X. Y., Hou, L., et al. (2005). Construction of a genetic linkage map and QTL analysis of fiber-related traits in upland cotton (Gossypium hirsutum L.). Euphytica 144, 91–99. doi: 10.1007/s10681-005-4629-x
Keywords: near-isogenic lines (NILs), cotton, interspecific introgression, genotyping-by-sequencing (GBS), fiber quality traits
Citation: Adhikari J, Vitrakoti D, Ployaram W, Khanal S, Chandnani R, Patel J, Shehzad T, Chee P and Paterson AH (2025) Molecular dissection of quantitative variation in fiber elongation between Gossypium hirsutum and Gossypium barbadense in reciprocal near-isogenic lines. Front. Plant Sci. 16:1657140. doi: 10.3389/fpls.2025.1657140
Received: 01 July 2025; Accepted: 11 August 2025;
Published: 16 September 2025.
Edited by:
Qian-Hao Zhu, Scientific and Industrial Research Organisation (CSIRO), AustraliaReviewed by:
Youlu Yuan, Institute of Cotton Research CAAS, ChinaXueying Liu, Southwest University, China
Copyright © 2025 Adhikari, Vitrakoti, Ployaram, Khanal, Chandnani, Patel, Shehzad, Chee and Paterson. This is an open-access article distributed under the terms of the Creative Commons Attribution License (CC BY). The use, distribution or reproduction in other forums is permitted, provided the original author(s) and the copyright owner(s) are credited and that the original publication in this journal is cited, in accordance with accepted academic practice. No use, distribution or reproduction is permitted which does not comply with these terms.
*Correspondence: Andrew H. Paterson, cGF0ZXJzb25haEBnbWFpbC5jb20=
†Present addresses: Jeevan Adhikari, CoverCress Inc., St Louis, Missouri, United States Tariq Shehzad, Tai An Deng Hai Wu Yue Tai Shan Seed Industry Co., Ltd., Taishan District, Tai’an City, Shandong, China Rahul Chandnani, University of Saskatchewan, Saskatchewan, Canada Jinesh Patel, Department of Crop, Soil and Environmental Sciences, Auburn University, Auburn, AL, United States