 Weiyi Zhou
 Peirui Gu1,2,3†
 Yuanming Zhang
- 1State Key Laboratory of Ecological Safety and Sustainable Development in Arid Lands, Xinjiang Institute of Ecology and Geography, Chinese Academy of Sciences, Urumqi, China
- 2Research Center for Ecology and Environment of Central Asia, Chinese Academy of Sciences, Urumqi, China
- 3University of Chinese Academy of Sciences, Beijing, China
- 4Independent Researcher, Urumqi, China
Carbon is one of the most crucial elements within plants, with its production and supply determining growth behaviors and physiological strategies. Nonstructural carbohydrates (NSC) serve as the “currency” of plant carbon flow, playing a key role in the balance between structural growth and carbon storage. However, the response patterns of NSC pools to varying concentrations and durations of nitrogen and phosphorus enrichment remain unclear. We conducted a meta-analysis compiling 1,313 independent data points from four plant organs-leaves, branches, stems, and roots-across global experiments to evaluate the impact of N and P enrichment on NSC pools in different organs. Our findings indicate that N limitation is widespread in ecosystems, whereas P limitation is not. Both the concentration and duration of N enrichment exhibit significant threshold effects on NSCs. Low to moderate levels of N enrichment led to varied increases in soluble sugar content (0.24% to 19.14%) and decreases in starch content (1.22% to 32.35%) in the leaves and branches of woody plants. However, this trend weakened or disappeared at high N concentrations. The NSC content in herbaceous plants was more sensitive to nutrient enrichment, with N enrichment significantly reducing their NSC reserves across all organs (by up to 90.72%). By integrating global data, this study not only addresses the gaps left by individual experiments in elucidating the spatio-temporal threshold responses of NSC to nutrient enrichment but also reveals the scarcity of studies on P addition and of long-term experiments in the existing literature. It reveals the growth-carbon storage strategies of plants under different nutrient conditions, contributing to biodiversity conservation and resource utilization in the context of future nitrogen deposition.
1 Introduction
Carbon is one of the most important elements in plants, and its production and supply determine their growth behavior and physiological strategies (Fatichi et al., 2019). Non-structural carbohydrates (NSC) are the primary “currency” of carbon flow in plants (Hoch and Körner, 2003). They are produced through photosynthesis and can serve as direct metabolic substrates or be converted into other energy-rich compounds, such as proteins and fatty acids, when needed (Hartmann and Trumbore, 2016). NSC acts as a carbon reservoir, providing a buffer when respiration, growth, and other physiological demands are not synchronized with photosynthesis (Prescott et al., 2020). Therefore, the size of the NSC pool can serve as an indicator of a plant’s growth status.
The two main components of NSC have distinct functions: soluble sugars are directly involved in physiological activities, while starch serves as a crucial energy reserve for future use (Hoch and Körner, 2003). These two components are highly interconvertible. The strategic balance between these two components reflects a plant’s carbon allocation strategy (Hartmann and Trumbore, 2016; Hoch and Körner, 2003). In this study, we define a “growth-driven mode” as a physiological state characterized by the mobilization of starch reserves to increase the pool of soluble sugars, thereby prioritizing immediate metabolic activity and structural growth over long-term storage. Conversely, we define a “stress-storage mode” as a conservative strategy involving the net accumulation of the total NSC pool, particularly starch, to build resilience against future uncertainties. Understanding how plants shift between these modes in response to nutrient enrichment is an important goal of our study. Moreover, the different carbon demands of plant organs result in significant differences in NSC pools across organs (Furze et al., 2019). For instance, in herbaceous plants, the largest NSC pool is typically found in the belowground parts, whereas in some woody plants, the largest NSC pool is located in the aboveground parts (Martínez-Vilalta et al., 2016). Given the importance of NSC to plants, many studies have explored how NSC responds to changes in nutrient availability (Jiang et al., 2022; Li et al., 2018, 2020; Ouyang et al., 2023). However, the mechanisms underlying the organ-level responses of NSC and its components to variations in nitrogen and phosphorus availability remain largely unexplored.
With the rapid development of global industrialization and urbanization, atmospheric nitrogen (N) deposition has increased three- to fivefold over the past century (Davidson, 2009; Yu et al., 2019), directly impacting soil and water bodies and profoundly influencing ecosystem functioning and plant metabolic capacity (Elser et al., 2007). Generally, nitrogen deposition promotes plant photosynthesis and nutrient transport (Wang et al., 2018; Zhang et al., 2018; Zhou W. et al., 2024). As the primary product of photosynthesis, carbohydrates are inevitably affected in terms of their forms and allocation within plant tissues under changing nitrogen availability (Wiley and Helliker, 2012). The effects of nitrogen nutrient status vary among species. Enhanced nitrogen availability has been shown to stimulate both carbon assimilation rates and biomass growth in two larch species, resulting in an increase in their NSC pools (Li et al., 2016). Another study found that nitrogen fertilization reduced the NSC pools across all organs of Acer pseudoplatanus L., while having no significant effect on the NSC content of Abies alba Mill. For Picea abies L., the NSC pool in aboveground organs exhibited a trend of initially decreasing and then increasing with higher nitrogen addition levels (Zhou X. et al., 2024). Nitrogen supplementation also influences carbon allocation strategies between plant organs. A meta-analysis compiling data from 75 experiments revealed that N enrichment decreased NSC concentrations in foliage (by ~5.4%) and roots (by ~5.0%), while simultaneously increasing them in above-ground wood (by ~6.1%) (Li et al., 2020). Additionally, the concentration of nitrogen added is a critical factor in these studies. Numerous studies indicate that nitrogen addition enhances plant growth up to a certain threshold (Nasto et al., 2019; Xiao et al., 2017; Zhang H. et al., 2020). At low nitrogen concentrations, carbon supply is positively affected, leading to an increase in the NSC pool (Wiley and Helliker, 2012). However, at high nitrogen concentrations, toxicity from excess salts can induce physiological drought, ultimately reducing the NSC pool (Liu et al., 2016). Interestingly, this threshold effect may be entirely reversed in some fast-growing species. In such cases, small amounts of N addition stimulate growth more than photosynthesis, resulting in carbon consumption rates exceeding carbon supply rates, which ultimately depletes the NSC pool (Li et al., 2020; Zhang Y.-L. et al., 2020). Conversely, high nitrogen concentrations suppress growth stimulation, slow carbon consumption, and thereby expand the NSC pool (Zhou X. et al., 2024).
Phosphorus plays a crucial role in photosynthesis, intracellular energy transfer, and carbohydrate transport (Warren, 2011; Zhang et al., 2014). While nitrogen availability primarily limits plant primary productivity, phosphorus mainly constrains energy exchange and phosphate synthesis within plants (Marklein and Houlton, 2012; Mo et al., 2019). Compared to studies on nitrogen addition, research on phosphorus nutrition is relatively scarce (Feng and Zhu, 2020). In some phosphorus-limited tropical forest ecosystems, leaf NSC concentrations are regulated by soil phosphorus availability rather than nitrogen availability (Liu et al., 2019; Mo et al., 2019; Walker and Syers, 1976). Mitigating phosphorus limitation can stimulate carbon consumption through growth metabolism, significantly reducing NSC content (Mo et al., 2020). In desert ecosystems, however, soil phosphorus content is typically high (Nasto et al., 2019), and long-term phosphorus addition can increase leaf phosphorus concentrations, leading to soil acidification, suppressing plant growth (Zhou W. et al., 2024), and ultimately impacting the NSC pool. In regions without phosphorus limitation, plants generally show weaker responses to phosphorus addition compared to nitrogen addition (Li et al., 2016). In summary, the effects of nitrogen and phosphorus enrichment on plant carbon supply and allocation are complex and lack a consistent overall pattern.
Although previous studies have revealed the response patterns of carbon supply, carbon storage, or hydraulic traits at the organ level to nitrogen enrichment (Li et al., 2018, 2020; Liu et al., 2016; Zhang et al., 2018), research on the effects of phosphorus enrichment on plant carbon allocation remains scarce. Furthermore, past studies have often overlooked the influence of nutrient addition concentrations and durations, limiting our understanding of the threshold effects of nutrient addition on carbon supply and storage. To address these gaps, we compiled 1,313 individual data points from 79 species and conducted a meta-analysis to evaluate the general patterns of nitrogen and phosphorus enrichment on plant carbon storage. Our study aims to answer the following scientific questions: (1) How do different concentrations of nitrogen and phosphorus additions affect NSC content? (2) How does the duration of nutrient treatments influence NSC content? (3) What are the differences in these effects across different plant organs? Our ultimate goal is to uncover the carbon strategies of plants in response to changes in nitrogen and phosphorus availability, contributing to biodiversity conservation and resource management under future global nitrogen deposition scenarios.
2 Materials and methods
2.1 Data compilation
We conducted a literature search in the Web of Science resource for journal articles published between January 2000 and December 2023, using the following keywords: “nonstructural carbohydrate*” or “NSC” or “TNC” or “soluble sugar” and “fertiliz*” or “nutrition*” or “nitrogen*” or “ phosphorus”. This search identified a total of 13,866 articles. The selection criteria for the included studies were as follows: (1) The studies must be based on manipulation experiments with control and experimental groups, with research subjects being either woody or herbaceous plants. (2) Only field-based nutrient addition studies were included, excluding laboratory incubation studies. (3) The fertilizers must contain only nitrogen (N), phosphorus (P), or both nitrogen and phosphorus, with no other nutrients. (4) The studies must provide both means and sample sizes for the reported data. Ultimately, 30 studies were selected for inclusion in our dataset (see Supplementary File for details), with their geographic distribution shown in Figure 1. The dataset comprises 62 plant species and 1,313 independent organ-level observations of NSCs. The content of different NSC components across various plant organs are presented in Supplementary Figures S1 and S2.
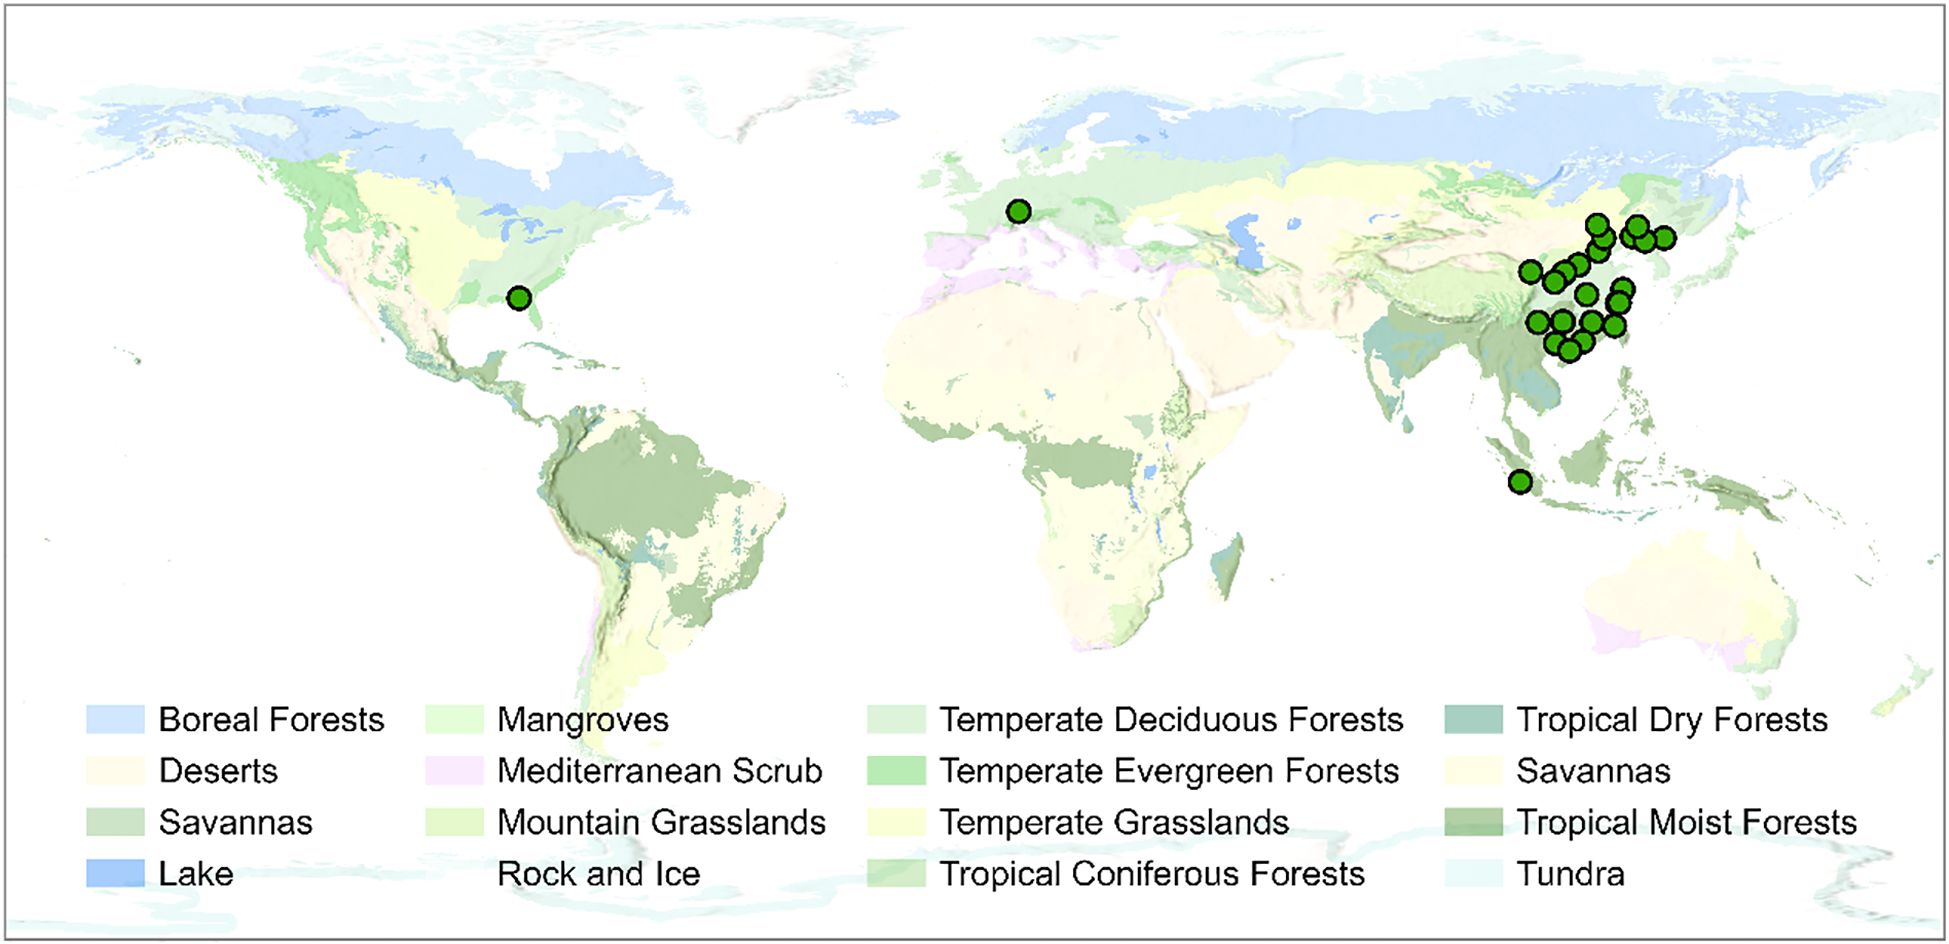
Figure 1. Global distribution of study sites used in the meta-analysis (green dots) overlaid on the terrestrial biome classification map.
From these articles, we extracted the NSC, soluble sugar, and starch contents in leaves, branches, stems, and roots, and standardized the units to mg/g. Additionally, we recorded research species, type of fertilizer, nitrogen and phosphorus addition rates, experimental duration, geographical location, leaf habit, and other relevant background information. Data were either directly retrieved from tables provided in the articles or extracted from images using WebPlotDigitizer software (He et al., 2020).
2.2 Data categorization and standardization
For each study, we prioritized the original classification of fertilization intensity if provided in the publication. If a study did not supply a classification, we standardized the fertilization amounts to grams per hectare per year (g/ha yr). Based on the overall distribution of application rates across our dataset, we defined concentrations as low (< 50 g/ha yr), medium (50–100 g/ha yr), and high (> 100 g/ha yr). While formal methods like breakpoint analysis can identify precise thresholds, they require a consistent continuous predictor, which was unavailable due to our hierarchical approach of honoring original study classifications. Therefore, our categorical analysis represents a robust strategy for identifying general patterns from diverse experimental designs, aligning with the primary goal of this synthesis.
Furthermore, we classified fertilization durations as short-term (≤ 6 months), medium-term (> 6 months to ≤ 3 years), and long-term (> 3 years). If a study reported data at multiple sampling dates, we utilized the data corresponding to the actual sampling times. Finally, due to limited data for finer classifications, we analyzed plant life forms based on two broad categories: herbaceous and woody plants, which are known to differ significantly in their carbon supply and storage strategies.
2.3 Meta analysis
The natural logarithm of the response ratio represents the effect size, assessing the relative change between the nutrient addition treatment and the control (Li et al., 2020). The formula for calculating the log response ratio is as follows (Equation 1):
where is the mean NSC value in the treatment and is that in the control (He et al., 2020; Liu et al., 2016).
The formula for calculating the variance of each effect value is as follows (Equation 2):
where and are the sample sizes for the treatment and control groups, respectively, and and denote their corresponding standard deviations. and are the mean values of the variable in the treatment and control groups, respectively.
The weighting factor () for each observation is calculated by the inverse of the variance () (Equation 3):
If a study includes multiple results for a single variable, we adjusted the weights based on the total number of observations in each study to reduce the influence of repeated measurements from the same site. The final weighting factor () and effect size () were calculated using the following formulas (Equations 4, 5):
The distributions of all effect size results are shown in Supplementary Figures S3 and S4. If the 95% confidence interval (CI) for a variable overlap with zero, it indicates that nutrient addition has no significant effect on the variable. Otherwise, the effect is considered statistically significant. The percentage change relative to the control was calculated as (Equation 6):
We conducted a meta-analysis using the “metafor” package in R 4.4.1 with the REML method. Data following a normal distribution were analyzed using one-way ANOVA followed by Tukey’s HSD method, while data not following a normal distribution were analyzed using the Kruskal-Wallis test followed by Dunn’s test.
3 Results
3.1 Effect of nitrogen enrichment on the content of NSC and its components
The effects of nitrogen addition on the NSC and soluble sugar contents in woody plant leaves were minor, with a significant increase in NSC pool observed only under low nitrogen addition. However, nitrogen addition significantly decreased starch content in leaves across all concentrations. Notably, the magnitude of this negative effect was greatest at low nitrogen levels and diminished as the concentration increased. In branches, nitrogen addition had a significant positive effect on NSC content but a significant negative effect on starch content. For woody plant stems and roots, nitrogen addition generally had a positive effect on NSC and its components, but the effects were not statistically significant (Figure 2).
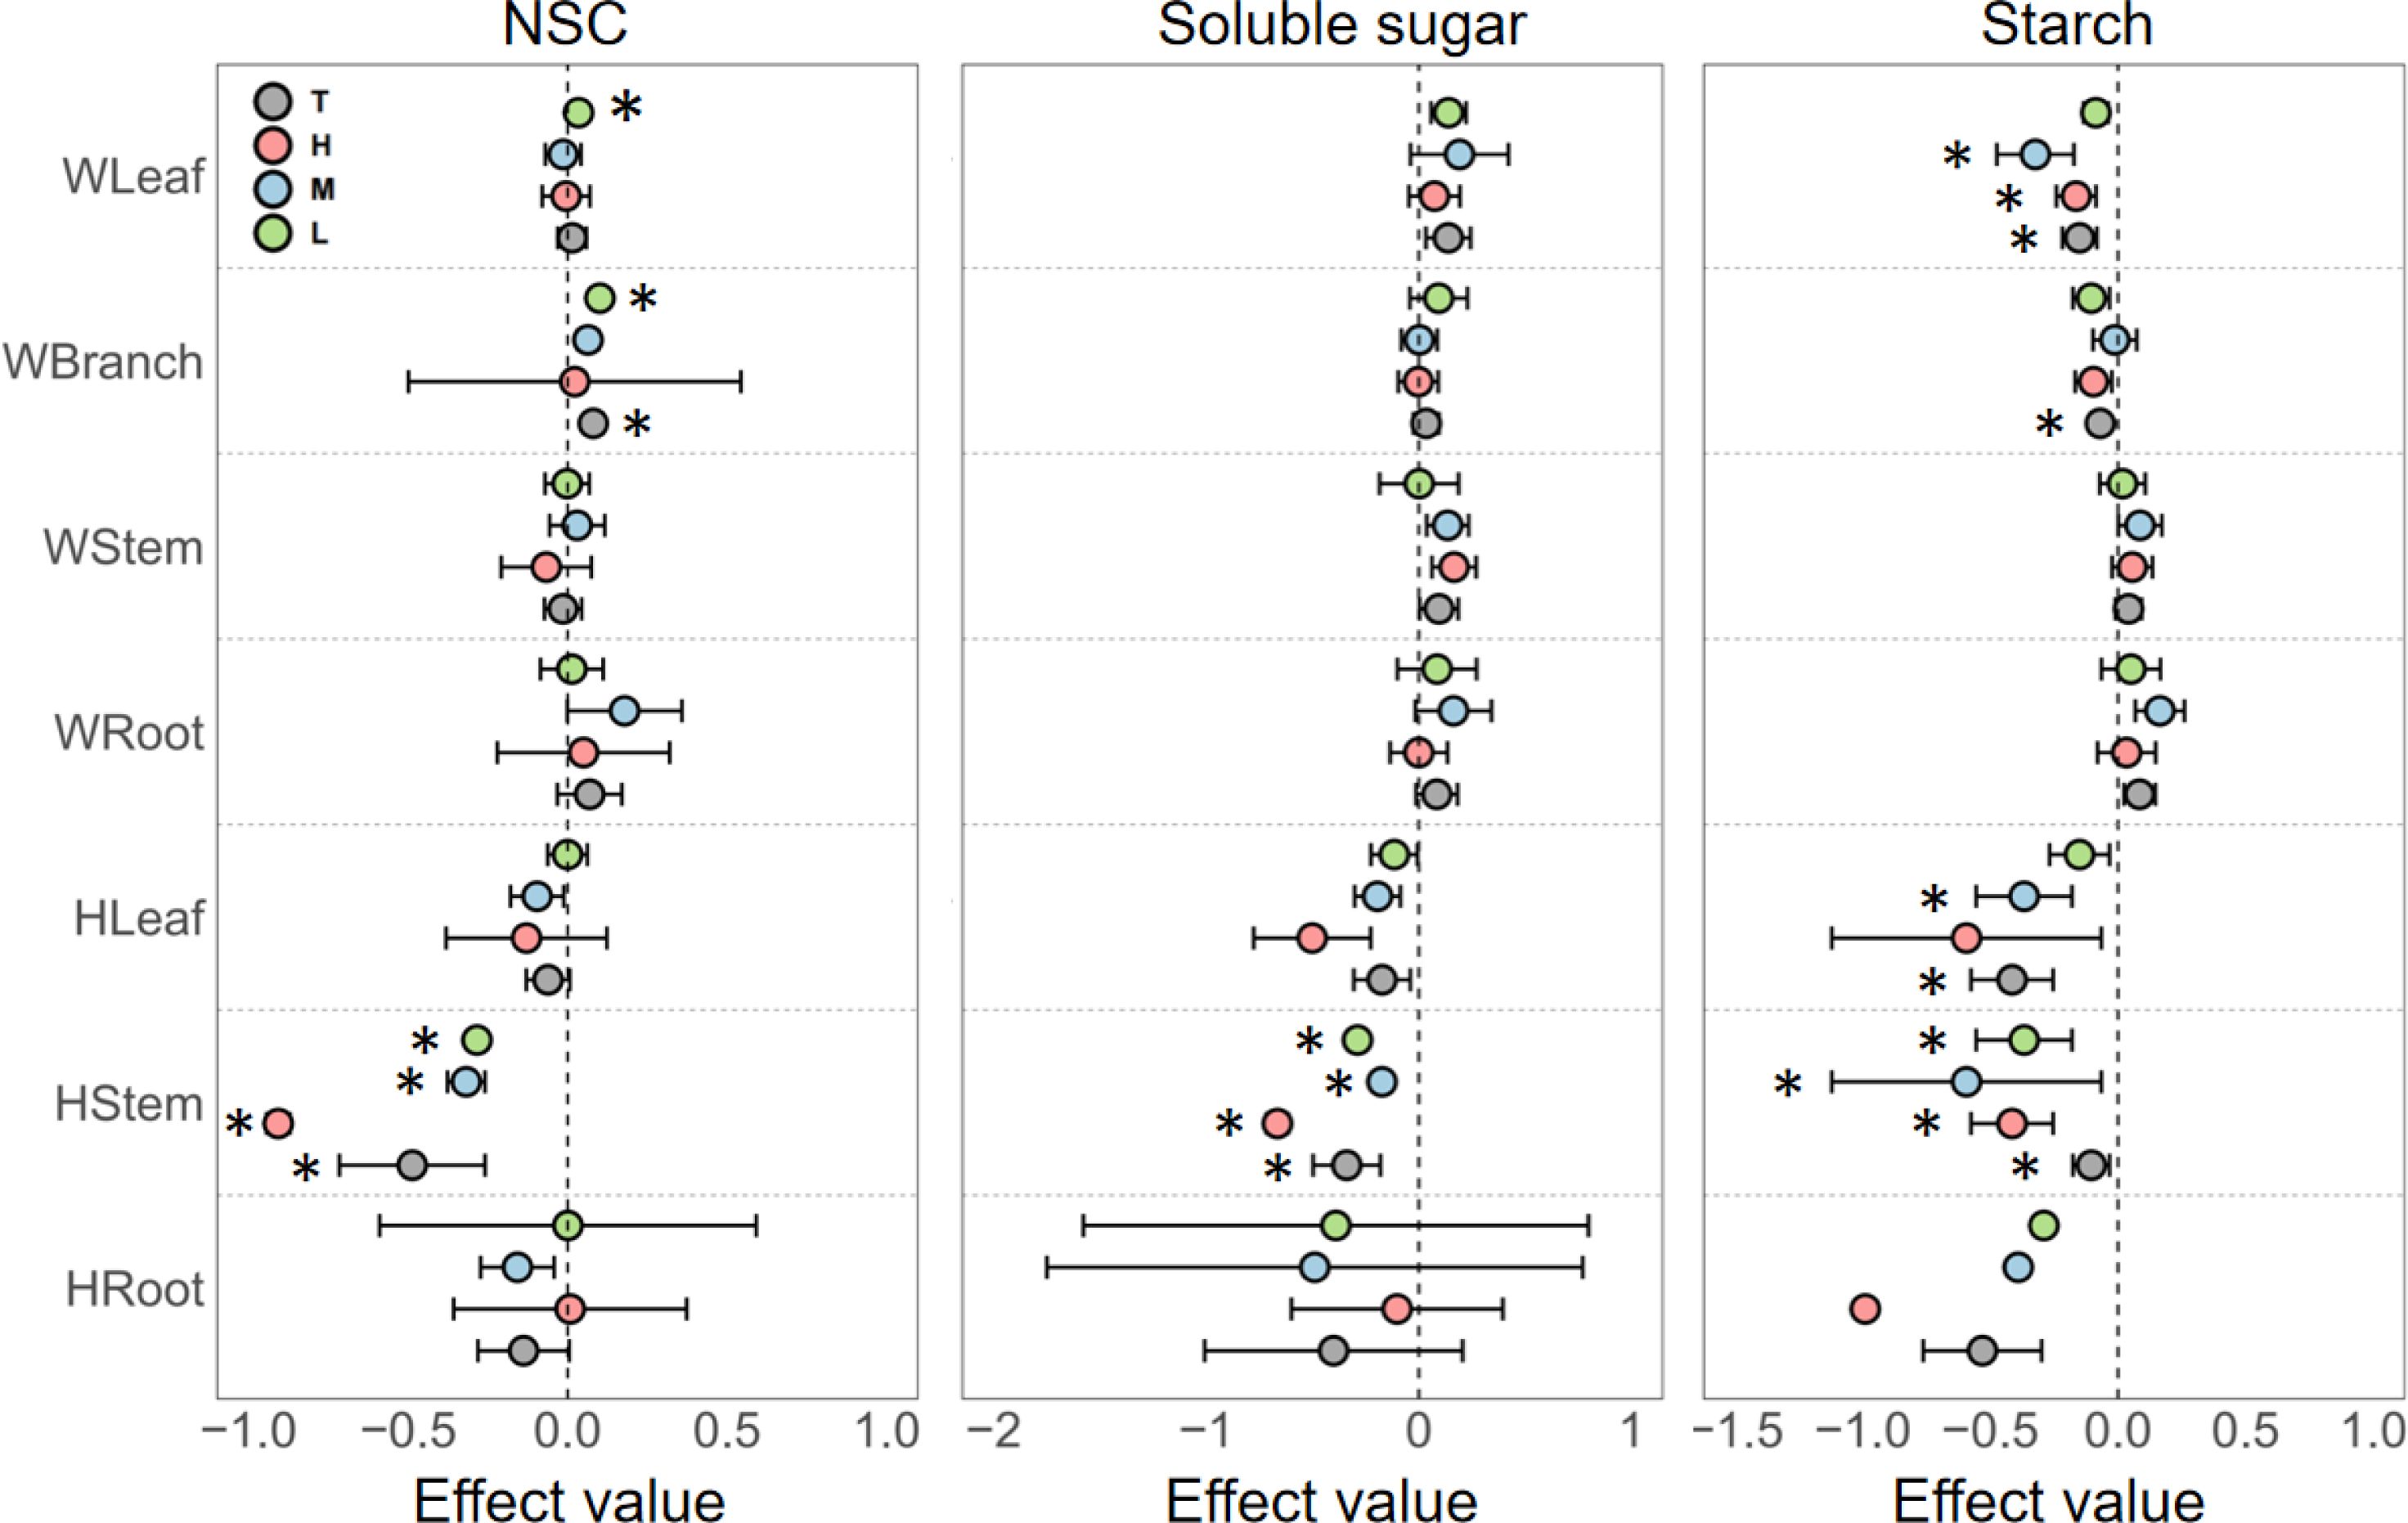
Figure 2. Responses of non-structural carbohydrates (NSC), soluble sugars, and starch in different organs of woody and herbaceous plants to various N addition levels. T, the pooled effect across all treatment levels; H, high nutrient addition; M, medium nutrient addition; L, low nutrient addition. The “W” before organ categories on the y-axis represents woody plants, and “H” represents herbaceous plants. Error bars indicate the standard error of effect sizes. See Supplementary Table S1 for quantified percentage changes and Supplementary Figure S5 for effect size distributions. *Indicates a significant difference from the control group (95% CI of the effect size does not overlap with zero).
In contrast, herbaceous plants showed a significantly stronger response to nitrogen addition, predominantly resulting in decreased NSC content. Specifically, in leaves, NSC, soluble sugar, and starch contents decreased progressively with increasing nitrogen levels. In stems, nitrogen enrichment at all concentrations significantly reduced NSC content. In roots, while NSC content generally decreased, the changes exhibited high variability and uncertainty (Figure 2).
3.2 Effect of phosphorus enrichment on the content of NSC and its components
Phosphorus enrichment had highly variable effects on the NSC content of different organs in woody plants. For leaves, phosphorus enrichment generally exerted a negative effect on NSC and its components, with the exception of medium-level phosphorus enrichment, which significantly increased starch content. In branches, phosphorus enrichment generally increased NSC content, but none of these effects were statistically significant. In stems, the effects of phosphorus enrichment on NSC content fluctuated significantly, showing a trend of promotion at low levels, suppression at medium levels, and promotion again at high levels. In roots, NSC and starch contents increased with increasing phosphorus concentrations, while soluble sugar content decreased as phosphorus concentration increased (Figure 3).
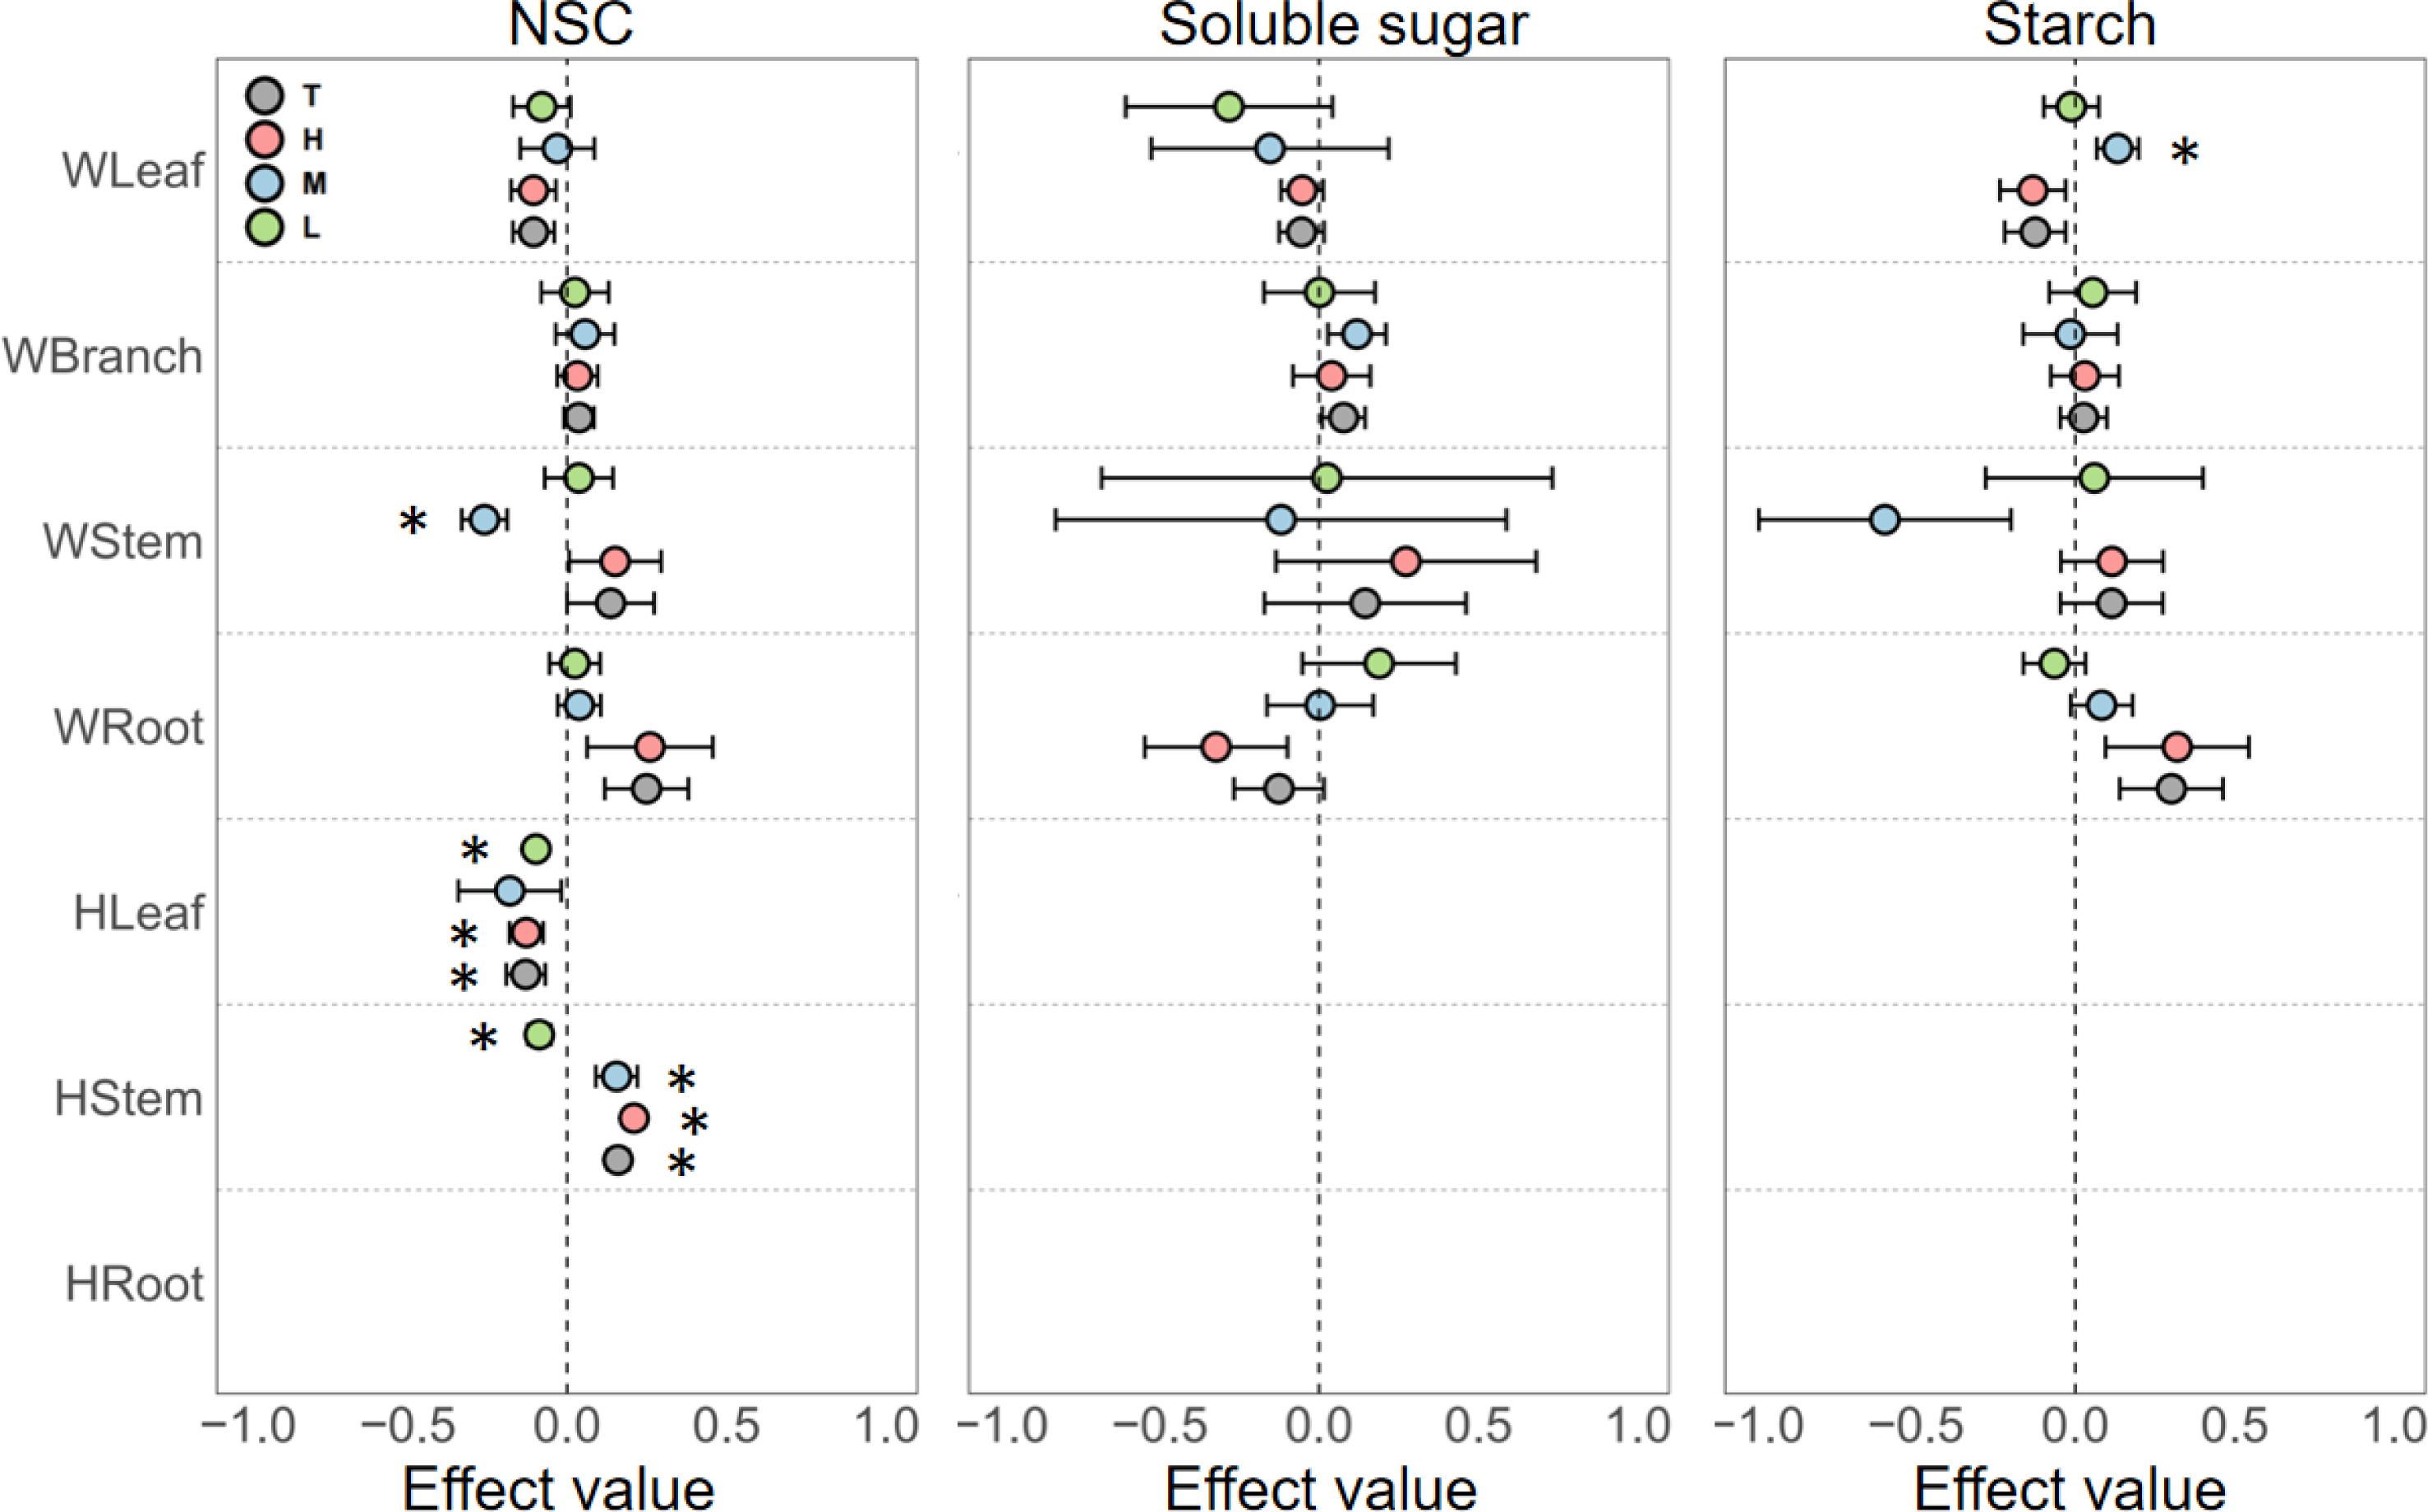
Figure 3. Responses of NSC, soluble sugars, and starch in different organs of woody and herbaceous plants to various P addition levels. T, the pooled effect across all treatment levels; H, high nutrient addition; M, medium nutrient addition; L, low nutrient addition. The “W” before organ categories on the y-axis represents woody plants, and “H” represents herbaceous plants. Error bars indicate the standard error of effect sizes. See Supplementary Table S2 for quantified percentage changes and Supplementary Figure S6 for effect size distributions. *Indicates a significant difference from the control group (95% CI of the effect size does not overlap with zero).
Due to the scarcity of experimental data on the response of herbaceous plant NSC content to phosphorus enrichment, our analysis only allowed for discussion of NSC responses in certain herbaceous plant organs. In leaves, phosphorus enrichment at all concentrations reduced NSC content. For stems, low-level phosphorus enrichment reduced NSC content, but as phosphorus concentration increased to medium or high levels, the effect shifted from suppression to promotion (Figure 3).
3.3 Trends of NSC content under different nitrogen enrichment durations
Nitrogen enrichment in woody plants generally showed a trend of initial promotion followed by suppression for NSC, soluble sugars, and starch contents in leaves, branches, and stems. Short-term nitrogen treatments significantly increased NSC content, but as the treatment duration extended to one year or more, this promotive effect diminished and even turned inhibitory. In roots, the trend differed slightly, with NSC content showing a similar initial increase and subsequent decrease, whereas soluble sugars and starch exhibited a pattern of initial decline, followed by an increase, and then another decrease (Figures 4A-D).
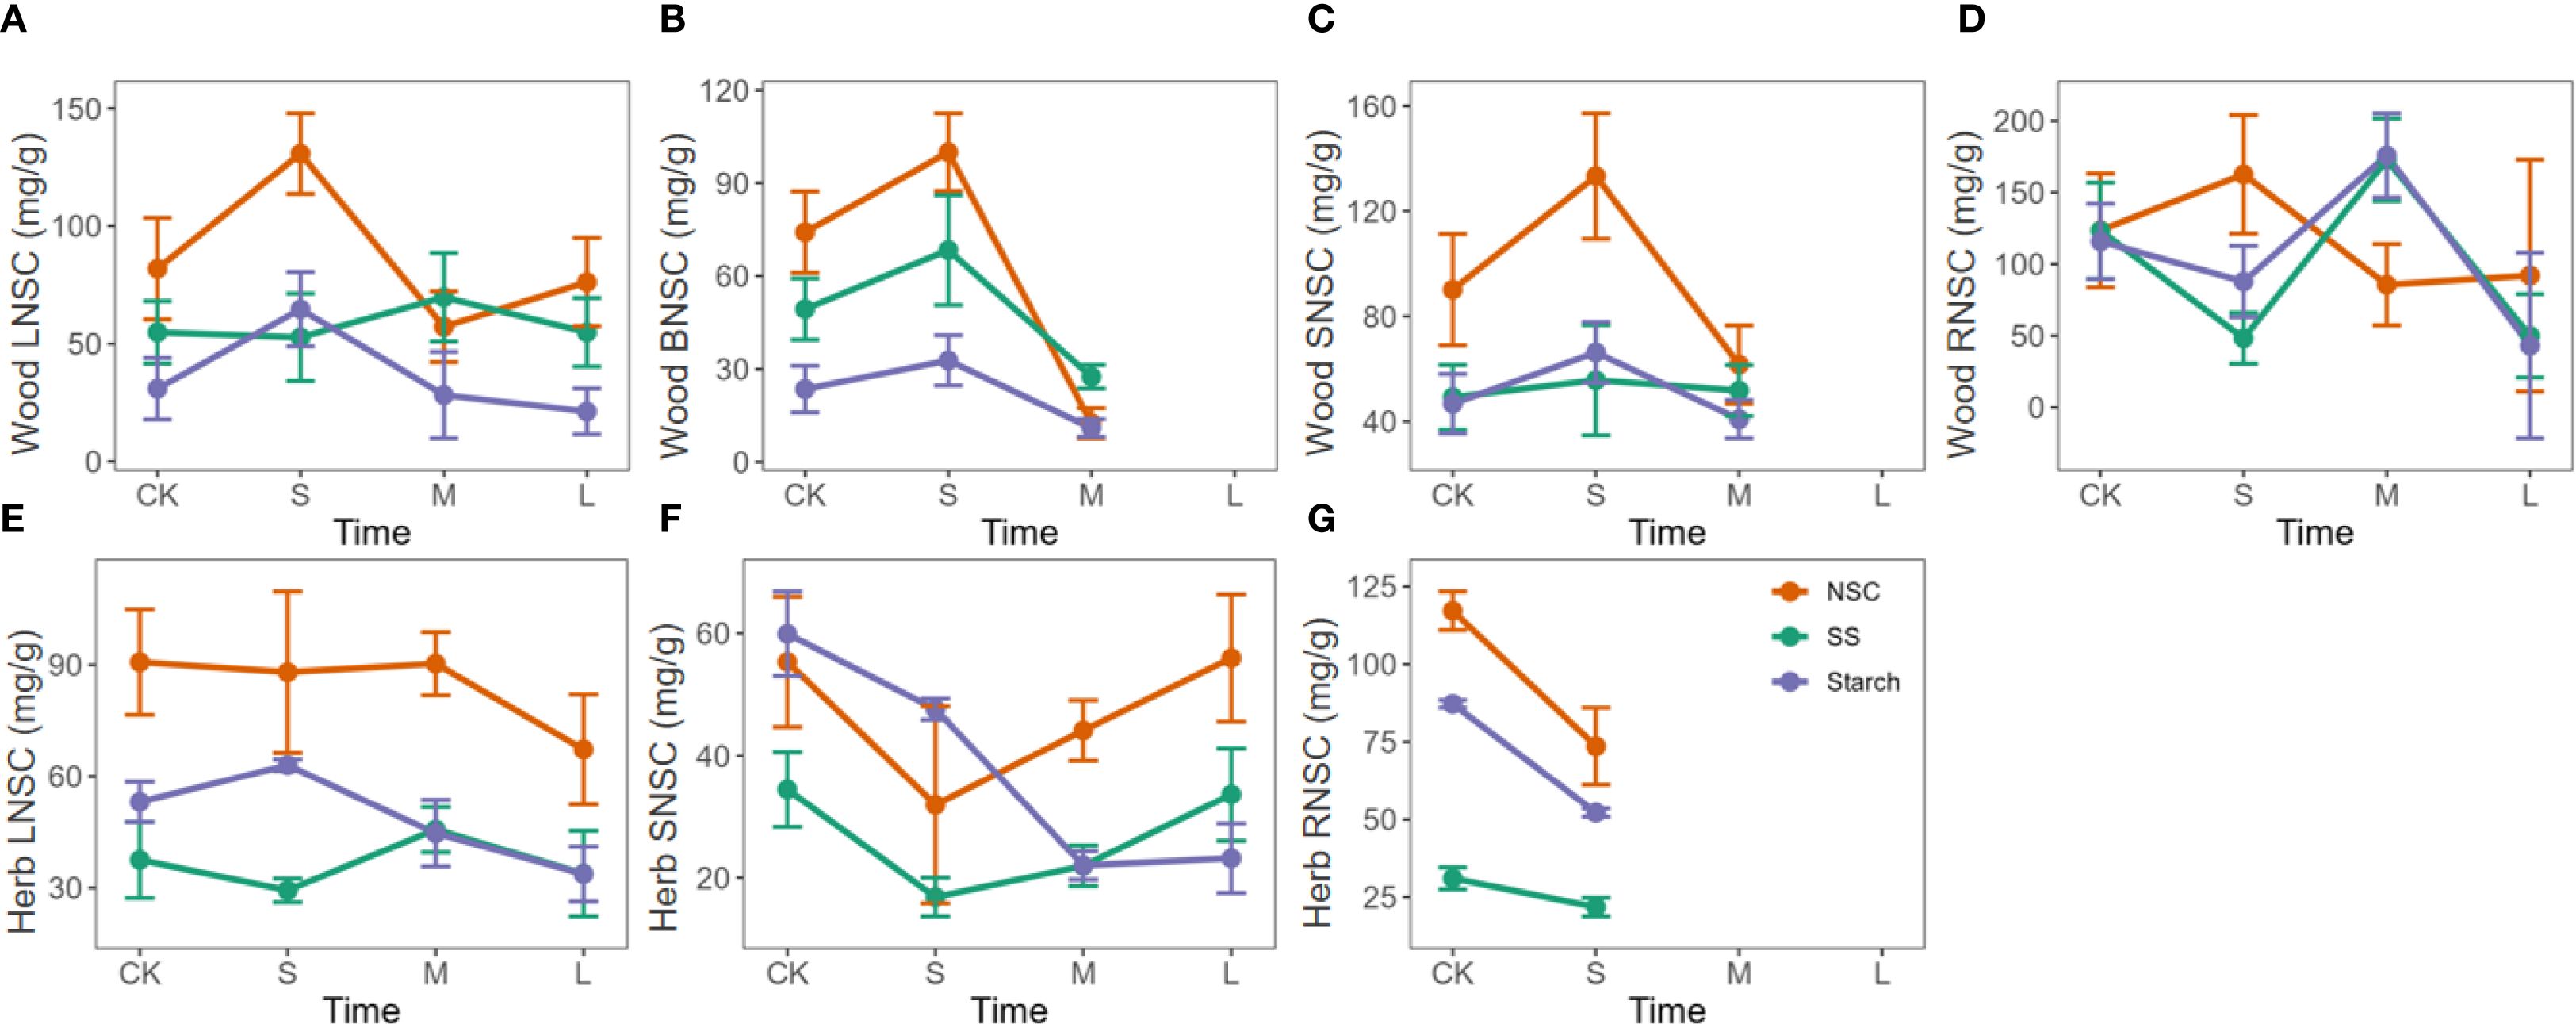
Figure 4. Response of NSC, soluble sugars, and starch to the duration of nitrogen enrichment in different organs of woody and herbaceous plants. The prefixes L, B, S, and R before NSC denote Leaf, branch, stem, and root, respectively. (A–D) Influence of N enrichment duration on NSC and its component contents in the leaves, branches, stems, and roots of woody plants. (E–G) Influence of N enrichment duration on NSC and its component contents in the leaves, branches, stems, and roots of herbaceous plants. The data for each nutrient addition duration were weighted based on sample size, with larger sample sizes contributing greater weight to the corresponding nutrient treatment duration in each organ. Fertilization duration was categorized into three levels: short-term (S,< 6 months), medium-term (M, > 6 months and ≤ 3 years), and long-term (L, > 3 years), based on standardized metadata from the original studies. The orange, green, and purple lines represent the responses of total NSC, soluble sugars (SS), and starch, respectively.
In herbaceous plants, nitrogen enrichment had little to no promotive effect on NSC accumulation. In leaves, NSC content gradually decreased with prolonged treatment. In stems, NSC content dropped significantly at first and then slowly recovered over time (Figures 4E-G).
3.4 Trends of NSC content under different phosphorus enrichment durations
Phosphorus enrichment showed an initial promotive effect followed by suppression on NSC and starch contents in the leaves and roots of woody plants, while soluble sugar content exhibited a reverse trend of initial suppression followed by promotion. However, no significant trends were observed in the NSC content of branches and stems (Figures 5A-D). In herbaceous plants, prolonged phosphorus enrichment significantly reduced NSC content in leaves, while NSC content in stems showed a trend of initial decrease followed by an increase (Figures 5E, F).
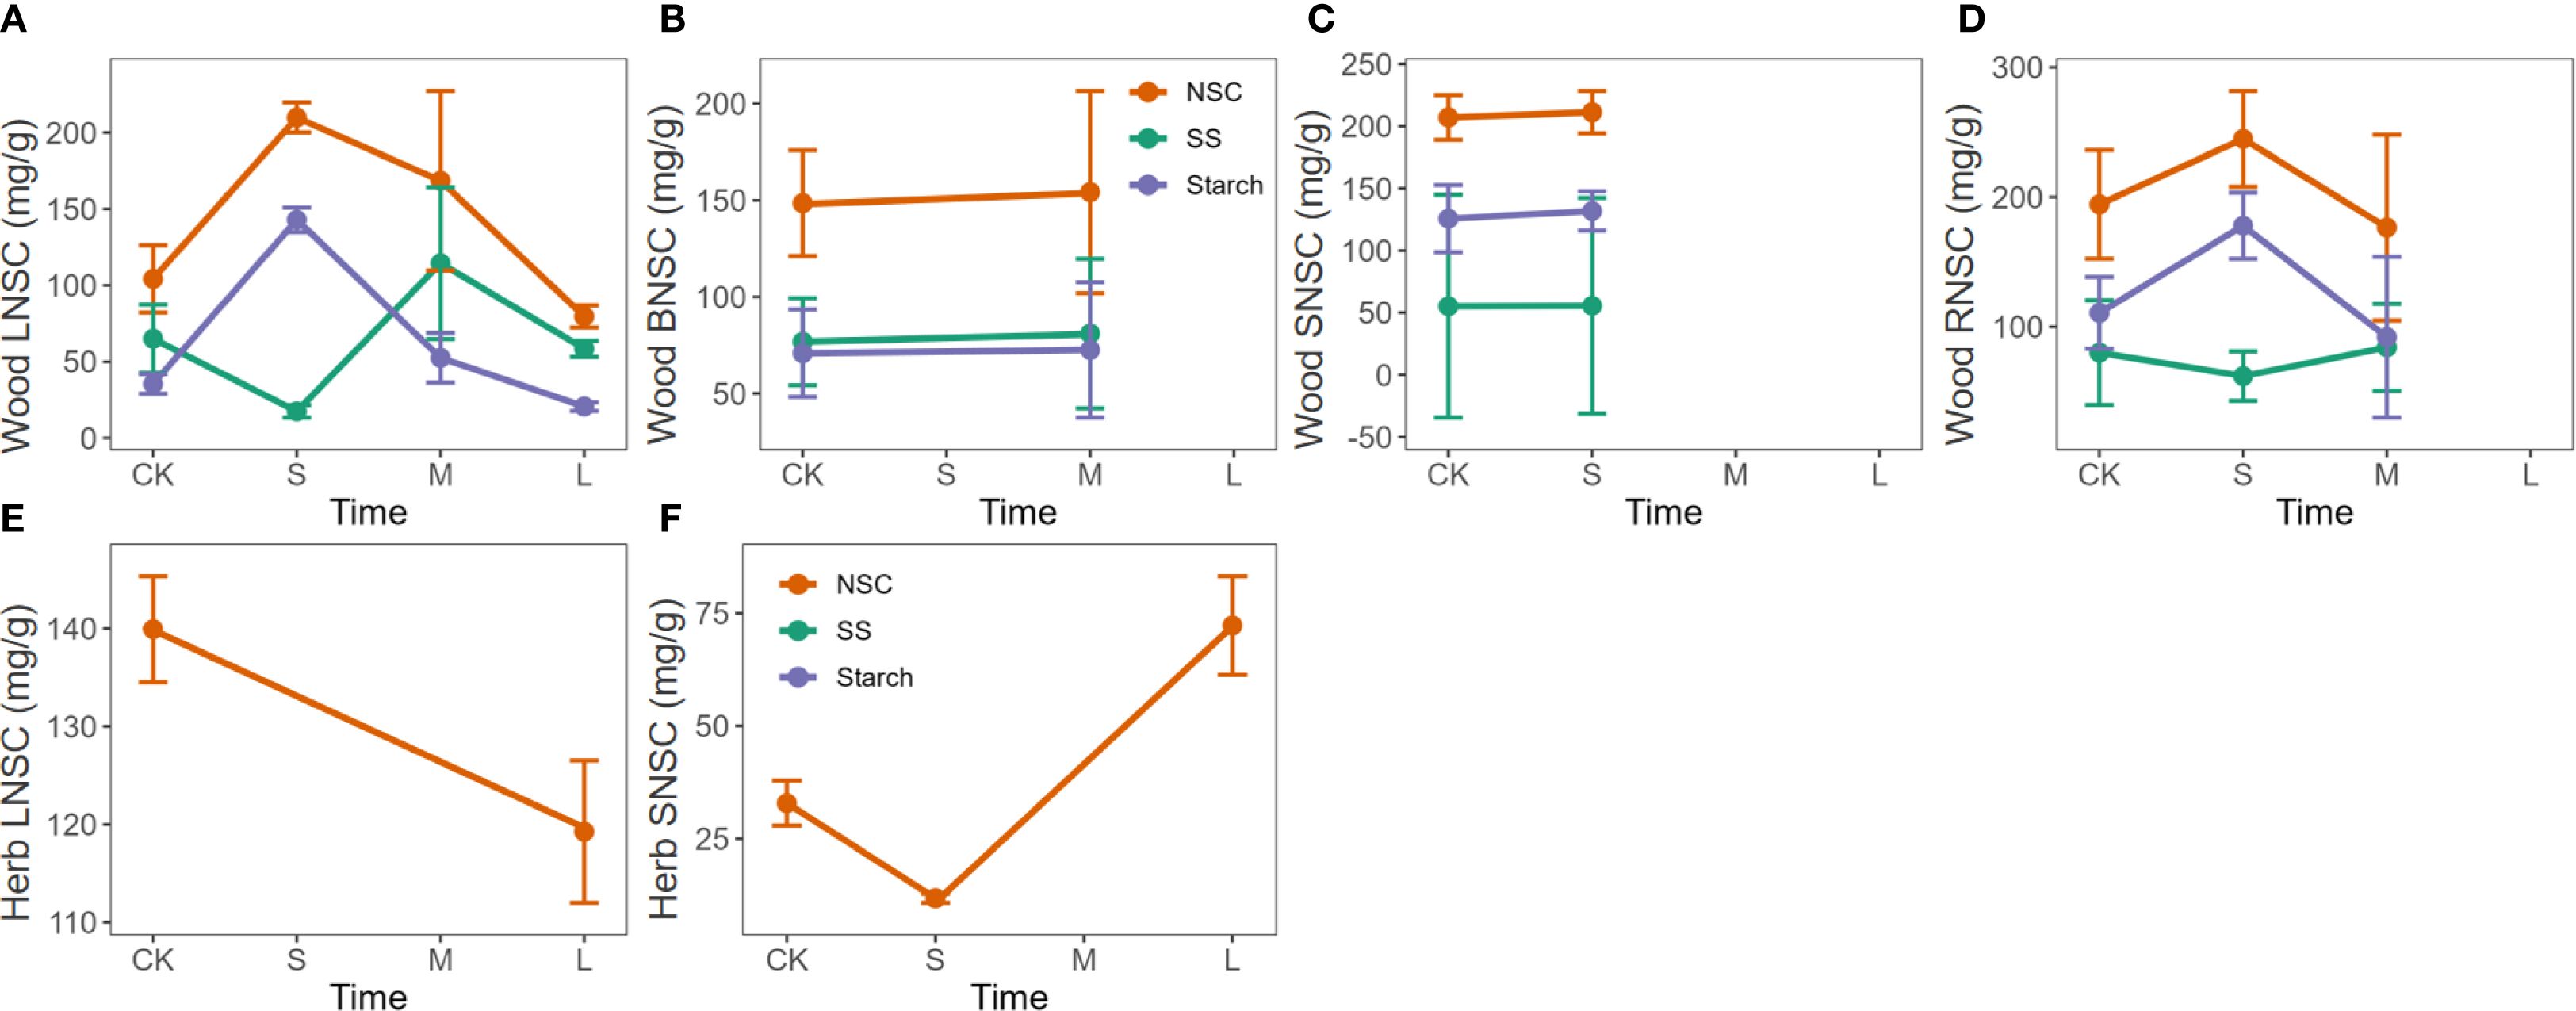
Figure 5. Response of NSC, soluble sugars, and starch to the duration of phosphorus enrichment in different organs of woody and herbaceous plants. The prefixes L, B, S, and R before NSC denote Leaf, branch, stem, and root, respectively. (A–D) Influence of P enrichment duration on NSC and its component contents in the leaves, branches, stems, and roots of woody plants. (E, F) Influence of P enrichment duration on NSC and its component contents in the leaves, branches, stems, and roots of herbaceous plants. Fertilization duration was categorized into three levels: short-term (S,< 6 months), medium-term (M, > 6 months and ≤ 3 years), and long-term (L, > 3 years), based on standardized metadata from the original studies. The orange, green, and purple lines represent the responses of total NSC, soluble sugars (SS), and starch, respectively. Data for SS and starch in herbaceous plants (panels e and f) were insufficient to perform a robust trend analysis of the duration effect and are therefore not shown.
4 Discussion
4.1 Threshold effects are prevalent in the effects of nitrogen enrichment on NSC content
As is well known, nitrogen is a critical element in the construction of chloroplasts, and nitrogen availability is a key limiting factor for photosynthesis (Yue et al., 2017). Nitrogen enrichment can alleviate nitrogen limitation in the local soil, optimize the physiological state and structural integrity of leaves, and enhance photosynthetic activity (Borghetti et al., 2017; Hacke et al., 2010; Zhang et al., 2018). Consequently, the non-structural carbohydrate (NSC) pool enters a state where supply exceeds consumption, leading to an increase in NSC content. Generally, NSC transport adheres to the principle of proximal transport, moving from the upper morphological regions to the lower ones (Dietze et al., 2014; Tixier et al., 2018). As the primary site for NSC production (Chapin et al., 1990), leaves are the most directly and significantly affected by nitrogen enrichment. Nitrogen enrichment induces plants to adopt a “growth-driven mode,” increasing carbon allocation towards respiration and structural growth. Soluble sugars, which serve as direct substrates for respiratory and other metabolic activities (Gibon et al., 2009), are rapidly consumed in this “growth-driven mode.” However, their overall content still increases due to the substantial breakdown of starch replenishing the soluble sugar pool (Hoch and Körner, 2003). Therefore, the specific pattern of NSC component changes involves the accumulation of soluble sugars in the leaves, while starch is significantly depleted (Figure 2; Supplementary Figure S3). Similar results have been observed in studies on Quercus mongolica (Zhang Y.-L. et al., 2020). However, this pattern is not constant across all growth stages. When the study subjects are seedlings, nitrogen enrichment drives them into a more pronounced “growth-driven mode,” leading to the rapid consumption of all NSC components, resulting in a reduced NSC pool and accelerated biomass growth (Li et al., 2020).
Downward in the plant, the distribution patterns of NSC and its components in branches and stems are similar to those in leaves, but the magnitude of changes gradually decreases with increasing distance from the carbon source organs (leaves). Notably, the NSC content in leaves and branches, as well as leaf starch content under medium or low nitrogen enrichment, exhibit very clear “growth-driven mode” carbon allocation strategies. However, when nitrogen enrichment concentrations reach high levels, this strategy disappears, supporting our hypothesis that the impact of nitrogen enrichment on the NSC pool exhibits a threshold effect (Du et al., 2020; Zhou X. et al., 2024; Zhu et al., 2021). In contrast, the NSC variation pattern in roots is entirely different from that in other organs. Under nitrogen enrichment, the NSC pools and their components in roots are expanded. Subterranean NSC reserves are crucial for tree recovery from stress (He et al., 2020), serving as energy sources for growth and development following adverse conditions such as drought, thereby ensuring the energy balance of the trees (Hartmann et al., 2013). Thus, under nitrogen enrichment, the aboveground parts adhere to a “growth-driven” carbon allocation model, while the underground parts follow a “stress-storage” carbon allocation model.
Recent nitrogen addition experiments on three tree species have demonstrated that, for Acer pseudoplatanus, nitrogen enrichment initially increases and subsequently decreases its NSC content (Zhou X. et al., 2024). Another study similarly found that nitrogen addition first promotes and then inhibits NSC content in Syzygium bullockii and Carallia brachiate (Chen et al., 2022). Researchers typically focus on the seasonal variations of NSC content (Martínez-Vilalta et al., 2016) and NSC dynamics under prolonged drought stress (Rowland et al., 2015), paying less attention to the temporal threshold effects of nutrient enrichment. Consequently, studies addressing these threshold effects are rare and valuable. Our meta-analysis, integrating various studies as hypothesized, revealed that the duration of nitrogen enrichment also exhibits a significant threshold effect on NSC.
4.2 Phosphorus is not a major limiting factor for NSC pools expansion
Firstly, no significant promoting effect of phosphorus enrichment on the NSC pool was observed (Figure 3; Supplementary Figure S4). Alleviating phosphorus limitation did not drive plants into a growth-driven mode as nitrogen alleviation does, indicating that phosphorus limitation is not as prevalent in ecosystems as nitrogen limitation. A long-term experiment also yielded similar results, where phosphorus addition slowed plant growth rates and prompted more conservative resource allocation strategies (Báez and Homeier, 2018). Unlike nitrogen, which directly mediates plant photosynthetic processes (Fleischer et al., 2013) and thereby influences the NSC pool (Wiley and Helliker, 2012), phosphorus affects the NSC pool indirectly. Consequently, the gradient effect from the upper to the lower parts of the plant, as seen with nitrogen enrichment, was not observed with phosphorus enrichment. Instead, fluctuations in NSC content were markedly greater in stems and roots. Phosphorus fertilization can stimulate xylem growth and reduce conduit wall thickness (Thomas et al., 2006; Yi et al., 2022). Rapidly growing xylem with thinner conduit walls and pit membranes allows small air bubbles to pass through more easily, thereby increasing the likelihood of xylem embolism (Cochard et al., 2010; Delzon et al., 2010). Stems and roots are the largest biomass organs in woody plants and have the longest water transport distances (Cochard et al., 2010). Different species exhibit significant variations in their tolerance to phosphorus effects, as well as in the conditions governing water transport efficiency and safety (Villagra et al., 2013). Therefore, the indirect effect of phosphorus variation on NSC content through the regulation of water transport is most pronounced in these two organs.
Notably, as phosphorus enrichment concentrations increase, soluble sugars in leaves exhibit a clear upward trend, whereas the opposite trend is observed in roots (Figure 2). The reason for this is twofold. With higher phosphorus enrichment concentrations, soil water potential increases, leading plants to experience physiological drought (Hasanuzzaman et al., 2018) and necessitating the accumulation of soluble sugars to regulate internal osmotic pressure (Secchi and Zwieniecki, 2011). Meanwhile, aboveground parts, especially the canopy, serve as the primary sites for carbon assimilation and fruit development, thereby possessing a higher priority for carbon allocation (Minchin and Thorpe, 1996). Soluble sugars, acting as carbon currency, are transported from underground to aboveground parts, resulting in a negative correlation between soluble sugar contents in leaves and roots. In summary, the effects of nitrogen and phosphorus enrichment exhibit significant differences in woody plants.
4.3 Differences in nutrient enrichment in woody and herbaceous plants
Herbaceous plants respond to nutrient enrichment in their NSC content in a manner that is completely different from woody plants. Herbaceous plants possess smaller biomass and are typically annual or biennial (Liu et al., 2016). Additionally, herbaceous plants are characterized by rapid growth and weaker physiological regulatory capabilities (Zhao and Dixon, 2011), making them highly sensitive to environmental changes, including nutrient enrichment. Studies have demonstrated that nitrogen addition significantly affects the richness, diversity, and stoichiometric ratios of herbaceous plants (Miao et al., 2024; Soons et al., 2017; Wu et al., 2021). In this context, the growth-promoting effects of nitrogen enrichment are more pronounced in short-lived herbaceous plants, resulting in extensive consumption of NSC for growth. This is evidenced by a substantial reduction in NSC pools and their components across almost all concentrations of nitrogen enrichment, with NSC and its component contents decreasing as nitrogen enrichment concentration increases (Figure 2).
5 Conclusion and outlook
Our results demonstrate that nitrogen limitation is widespread in ecosystems. Nitrogen enrichment affects the NSC content in the aboveground parts of woody plants in a stepwise decreasing manner from top to bottom, with both the concentration and duration of nitrogen enrichment exhibiting significant threshold effects on NSCs. Moderate to low levels of nitrogen enrichment induce a “growth-driven mode” in the aboveground parts of plants, characterized by a substantial decrease in starch content and an increase in soluble sugars. However, at high nitrogen concentrations, this mode disappears. In contrast, the underground parts of woody plants adopt a conservative carbon storage mode, with nitrogen enrichment leading to an expansion of the NSC pool. NSC content in herbaceous plants is more sensitive to nutrient enrichment; nitrogen enrichment prompts rapid growth in herbaceous plants, significantly reducing their NSC pools. Phosphorus enrichment does not promote the expansion of the NSC pool and affects NSCs indirectly through metabolic activities and water transport, etc.
However, it is noteworthy that due to the scarcity of related studies and limitations in data quantity, we were unable to discuss whether a threshold effect of phosphorus enrichment exists on the NSC pools of herbaceous plants. Additionally, in examining the duration of nutrient enrichment, we did not categorize nutrient enrichment concentrations but rather synthesized them as a whole. Precisely by integrating these past studies, we were able to identify key gaps in the field, such as the lack of research comparing the effects of high-concentration, long-duration versus low-concentration, long-duration nitrogen enrichment. Future work can now build upon our results to further disentangle the interactive effects of nutrient concentration and duration. In summary, our study not only elucidates the growth-carbon storage strategies of plants under different nutrient conditions but also provides a foundational framework that will guide the next wave of research, contributing to biodiversity conservation and resource utilization in the context of future nitrogen deposition.
Data availability statement
The original contributions presented in the study are included in the article/Supplementary Material. Further inquiries can be directed to the corresponding authors.
Author contributions
WZ: Conceptualization, Formal analysis, Methodology, Software, Supervision, Validation, Visualization, Writing – original draft, Writing – review & editing. PG: Data curation, Investigation, Validation, Visualization, Writing – original draft, Writing – review & editing. YT: Data curation, Validation, Writing – review & editing. YZ: Funding acquisition, Project administration, Resources, Supervision, Validation, Writing – review & editing.
Funding
The authors declare financial support was received for the research, and/or publication of this article. This work was supported by the Key Project of Xinjiang Uygur Autonomous Region Natural Science Foundation (2022D01D083).
Acknowledgments
This work was supported by the Key Project of Xinjiang Uygur Autonomous Region Natural Science Foundation (2022D01D083).
Conflict of interest
The authors declare that the research was conducted in the absence of any commercial or financial relationships that could be construed as a potential conflict of interest.
Generative AI statement
The author(s) declare that no Generative AI was used in the creation of this manuscript.
Any alternative text (alt text) provided alongside figures in this article has been generated by Frontiers with the support of artificial intelligence and reasonable efforts have been made to ensure accuracy, including review by the authors wherever possible. If you identify any issues, please contact us.
Publisher’s note
All claims expressed in this article are solely those of the authors and do not necessarily represent those of their affiliated organizations, or those of the publisher, the editors and the reviewers. Any product that may be evaluated in this article, or claim that may be made by its manufacturer, is not guaranteed or endorsed by the publisher.
Supplementary material
The Supplementary Material for this article can be found online at: https://www.frontiersin.org/articles/10.3389/fpls.2025.1659022/full#supplementary-material
References
Báez, S. and Homeier, J. (2018). Functional traits determine tree growth and ecosystem productivity of a tropical montane forest: Insights from a long-term nutrient manipulation experiment. Global Change Biol. 24, 399–409. doi: 10.1111/gcb.13905
Borghetti, M., Gentilesca, T., Leonardi, S., van Noije, T., Rita, A., and Mencuccini, M. (2017). Long-term temporal relationships between environmental conditions and xylem functional traits: a meta-analysis across a range of woody species along climatic and nitrogen deposition gradients. Tree Physiol. 37, 4–17. doi: 10.1093/treephys/tpw087
Chapin, F. S., Schulze, E., and Mooney, H. A. (1990). The ecology and economics of storage in plants. Annu. Rev. Ecol. Evol. Syst. 21, 423–447. doi: 10.1146/annurev.es.21.110190.002231
Chen, Y., Wang, Y., Yu, Y., Wen, Z., Peng, Z., Zhou, Q., et al. (2022). Seasonal changes of leaf non-structural carbohydrate of plants in different layers and its responses to nitrogen and phosphorus additions in a secondary tropical forest. Acta Ecol. Sin. 42, 255–265. doi: 10.5846/stxb202010232705
Cochard, H., Herbette, S., Barigah, T., Badel, E., Ennajeh, M., and Vilagrosa, A. (2010). Does sample length influence the shape of xylem embolism vulnerability curves? A test with the Cavitron spinning technique. Plant Cell Environ. 33, 1543–1552. doi: 10.1111/j.1365-3040.2010.02163.x
Davidson, E. A. (2009). The contribution of manure and fertilizer nitrogen to atmospheric nitrous oxide since 1860. Nat. Geosci. 2, 659–662. doi: 10.1038/ngeo608
Delzon, S., Douthe, C., Sala, A., and Cochard, H. (2010). Mechanism of water-stress induced cavitation in conifers: bordered pit structure and function support the hypothesis of seal capillary-seeding. Plant Cell Environ. 33, 2101–2111. doi: 10.1111/j.1365-3040.2010.02208.x
Dietze, M. C., Sala, A., Carbone, M. S., Czimczik, C. I., Mantooth, J. A., Richardson, A. D., et al. (2014). Nonstructural carbon in woody plants. Annu. Rev. Plant Biol. 65, 667–687. doi: 10.1146/annurev-arplant-050213-040054
Du, Y., Lu, R., and Xia, J. (2020). Impacts of global environmental change drivers on non-structural carbohydrates in terrestrial plants. Funct. Ecol. 34, 1525–1536. doi: 10.1111/1365-2435.13577
Elser, J. J., Bracken, M. E. S., Cleland, E. E., Gruner, D. S., Harpole, W. S., Hillebrand, H., et al. (2007). Global analysis of nitrogen and phosphorus limitation of primary producers in freshwater, marine and terrestrial ecosystems. Ecol. Lett. 10, 1135–1142. doi: 10.1111/j.1461-0248.2007.01113.x
Fatichi, S., Pappas, C., Zscheischler, J., and Leuzinger, S. (2019). Modelling carbon sources and sinks in terrestrial vegetation. New Phytol. 221, 652–668. doi: 10.1111/nph.15451
Feng, J. and Zhu, B. (2020). A review on the effects of nitrogen and phosphorus addition on tree growth and productivity in forest ecosystems. Chin. J. Plant Ecol. 44, 583–597. doi: 10.17521/cjpe.2019.0176
Fleischer, K., Rebel, K. T., van der Molen, M. K., Erisman, J. W., Wassen, M. J., van Loon, E. E., et al. (2013). The contribution of nitrogen deposition to the photosynthetic capacity of forests. Global Biogeochem. Cycles 27, 187–199. doi: 10.1002/gbc.20026
Furze, M. E., Huggett, B. A., Aubrecht, D. M., Stolz, C. D., Carbone, M. S., and Richardson, A. D. (2019). Whole-tree nonstructural carbohydrate storage and seasonal dynamics in five temperate species. New Phytol. 221, 1466–1477. doi: 10.1111/nph.15462
Gibon, Y., Pyl, E. T., Sulpice, R., Lunn, J. E., Höhne, M., Günther, M., et al. (2009). Adjustment of growth, starch turnover, protein content and central metabolism to a decrease of the carbon supply whenArabidopsis is grown in very short photoperiods. Plant Cell Environ. 32, 859–874. doi: 10.1111/j.1365-3040.2009.01965.x
Hacke, U. G., Plavcová, L., Almeida-Rodriguez, A., King-Jones, S., Zhou, W., and Cooke, J. E. K. (2010). Influence of nitrogen fertilization on xylem traits and aquaporin expression in stems of hybrid poplar. Tree Physiol. 30, 1016–1025. doi: 10.1093/treephys/tpq058
Hartmann, H. and Trumbore, S. (2016). Understanding the roles of nonstructural carbohydrates in forest trees – from what we can measure to what we want to know. New Phytol. 211, 386–403. doi: 10.1111/nph.13955
Hartmann, H., Ziegler, W., and Trumbore, S. (2013). Lethal drought leads to reduction in nonstructural carbohydrates in Norway spruce tree roots but not in the canopy. Funct. Ecol. 27, 413–427. doi: 10.1111/1365-2435.12046
Hasanuzzaman, M., Fujita, M., Oku, H., Nahar, K., and Hawrylak-Nowak, B. (2018). Plant nutrients and abiotic stress tolerance. Singapore: Springer.
He, W., Liu, H., Qi, T., Liu, F., and Zhu, X. (2020). Patterns in nonstructural carbohydrate contents at the tree organ level in response to drought duration. Global Change Biol. 26, 3627–3638. doi: 10.1111/gcb.15078
Hoch, G. and Körner, C. (2023). The carbon charging of pines at the climatic treeline: a global comparison. Oecologia 135 (1), 10–21. doi: 10.1007/s00442-002-1154-7
Jiang, X., Song, M., Qiao, Y., Liu, M., Ma, L., and Fu, S. (2022). Long-term water use efficiency and non-structural carbohydrates of dominant tree species in response to nitrogen and water additions in a warm temperate forest [Original Research. Front. Plant Sci. 13. doi: 10.3389/fpls.2022.1025162
Li, J., Guo, Q., Zhang, J., Korpelainen, H., and Li, C. (2016). Effects of nitrogen and phosphorus supply on growth and physiological traits of two Larix species. Environ. Exp. Bot. 130, 206–215. doi: 10.1016/j.envexpbot.2016.06.006
Li, W., Hartmann, H., Adams, H. D., Zhang, H., Jin, C., Zhao, C., et al. (2018). The sweet side of global change–dynamic responses of non-structural carbohydrates to drought, elevated CO2 and nitrogen fertilization in tree species. Tree Physiol. 38, 1706–1723. doi: 10.1093/treephys/tpy059
Li, W., Zhang, H., Huang, G., Liu, R., Wu, H., Zhao, C., et al. (2020). Effects of nitrogen enrichment on tree carbon allocation: A global synthesis. Global Ecol. Biogeogr. 29, 573–589. doi: 10.1111/geb.13042
Liu, H., Zhou, G., Bai, S. H., Song, J., Shang, Y., He, M., et al. (2019). Differential response of soil respiration to nitrogen and phosphorus addition in a highly phosphorus-limited subtropical forest, China. For. Ecol. Manage. 448, 499–508. doi: 10.1016/j.foreco.2019.06.020
Liu, J., Wu, N., Wang, H., Sun, J., Peng, B., Jiang, P., et al. (2016). Nitrogen addition affects chemical compositions of plant tissues, litter and soil organic matter. Ecology 97, 1796–1806. doi: 10.1890/15-1683.1
Marklein, A. R. and Houlton, B. Z. (2012). Nitrogen inputs accelerate phosphorus cycling rates across a wide variety of terrestrial ecosystems. New Phytol. 193, 696–704. doi: 10.1111/j.1469-8137.2011.03967.x
Martínez-Vilalta, J., Sala, A., Asensio, D., Galiano, L., Hoch, G., Palacio, S., et al. (2016). Dynamics of non-structural carbohydrates in terrestrial plants: a global synthesis. Ecol. Monogr. 86, 495–516. doi: 10.1002/ecm.1231
Miao, H., Qiu, K., Su, Y., Liu, W., He, Y., Xiangjun, L., et al. (2024). Effects of short-term water and nitrogen addition on herbaceous plant community in ecological restoration area of Corethrodendron fruticosum var.mongolicum in eastern Ningxia. Ecol. Sci. 43, 202–210. doi: 10.14108/j.cnki.1008-8873.2024.02.023
Minchin, P. E. H. and Thorpe, M. R. (1996). What determines carbon partitioning between competing sinks? J. Exp. Bot. 47, 1293–1296. doi: 10.1093/jxb/47.Special_Issue.1293
Mo, Q., Chen, Y., Yu, S., Fan, Y., Peng, Z., Wang, W., et al. (2020). Leaf nonstructural carbohydrate concentrations of understory woody species regulated by soil phosphorus availability in a tropical forest. Ecol. Evol. 10, 8429–8438. doi: 10.1002/ece3.6549
Mo, Q., Li, Z., Sayer, E. J., Lambers, H., Li, Y., Zou, B., et al. (2019). Foliar phosphorus fractions reveal how tropical plants maintain photosynthetic rates despite low soil phosphorus availability. Funct. Ecol. 33, 503–513. doi: 10.1111/1365-2435.13252
Nasto, M. K., Winter, K., Turner, B. L., and Cleveland, C. C. (2019). Nutrient acquisition strategies augment growth in tropical N2-fixing trees in nutrient-poor soil and under elevated CO2. Ecology 100, e02646. doi: 10.1002/ecy.2646
Ouyang, S., Tie, L., Saurer, M., Bose, A. K., Duan, H., Li, M., et al. (2023). Divergent role of nutrient availability in determining drought responses of sessile oak and Scots pine seedlings: evidence from 13C and 15N dual labeling. Tree Physiol. 44. doi: 10.1093/treephys/tpad105
Prescott, C. E., Grayston, S. J., Helmisaari, H.-S., Kaštovská, E., Körner, C., Lambers, H., et al. (2020). Surplus carbon drives allocation and plant&x2013;Soil interactions. Trends Ecol. Evol. 35, 1110–1118. doi: 10.1016/j.tree.2020.08.007
Rowland, L., da Costa, A. C. L., Galbraith, D. R., Oliveira, R. S., Binks, O. J., Oliveira, A. A. R., et al. (2015). Death from drought in tropical forests is triggered by hydraulics not carbon starvation. Nature 528, 119–122. doi: 10.1038/nature15539
Secchi, F. and Zwieniecki, M. A. (2011). Sensing embolism in xylem vessels: the role of sucrose as a trigger for refilling. Plant Cell Environ. 34, 514–524. doi: 10.1111/j.1365-3040.2010.02259.x
Soons, M. B., Hefting, M. M., Dorland, E., Lamers, L. P. M., Versteeg, C., and Bobbink, R. (2017). Nitrogen effects on plant species richness in herbaceous communities are more widespread and stronger than those of phosphorus. Biol. Conserv. 212, 390–397. doi: 10.1016/j.biocon.2016.12.006
Thomas, D. S., Montagu, K. D., and Conroy, J. P. (2006). Why does phosphorus limitation increase wood density in Eucalyptus grandis seedlings? Tree Physiol. 26, 35–42. doi: 10.1093/treephys/26.1.35
Tixier, A., Orozco, J., Roxas, A. A., Earles, J. M., and Zwieniecki, M. A. (2018). Diurnal variation in nonstructural carbohydrate storage in trees: remobilization and vertical mixing. Plant Physiol. 178, 1602–1613. doi: 10.1104/pp.18.00923
Villagra, M., Campanello, P. I., Montti, L., and Goldstein, G. (2013). Removal of nutrient limitations in forest gaps enhances growth rate and resistance to cavitation in subtropical canopy tree species differing in shade tolerance. Tree Physiol. 33, 285–296. doi: 10.1093/treephys/tpt003
Walker, T. W. and Syers, J. K. (1976). Fate of phosphorus during pedogenesis. Geoderma 15, 1–19. doi: 10.1016/0016-7061(76)90066-5
Wang, W., Wang, Y., Hoch, G., Wang, Z., and Gu, J. (2018). Linkage of root morphology to anatomy with increasing nitrogen availability in six temperate tree species. Plant Soil 425, 189–200. doi: 10.1007/s11104-018-3563-3
Warren, C. R. (2011). How does P affect photosynthesis and metabolite profiles of Eucalyptus globulus? Tree Physiol. 31, 727–739. doi: 10.1093/treephys/tpr064
Wiley, E. and Helliker, B. (2012). A re-evaluation of carbon storage in trees lends greater support for carbon limitation to growth. New Phytol. 195, 285–289. doi: 10.1111/j.1469-8137.2012.04180.x
Wu, J., Shen, F., Thompson, J., Liu, W., Duan, H., and Bardgett, R. D. (2021). Stoichiometric traits (N:P) of understory plants contribute to reductions in plant diversity following long-term nitrogen addition in subtropical forest. Ecol. Evol. 11, 4243–4251. doi: 10.1002/ece3.7319
Xiao, L., Liu, G., Li, P., and Xue, S. (2017). Nitrogen addition has a stronger effect on stoichiometries of non-structural carbohydrates, nitrogen and phosphorus in Bothriochloa ischaemum than elevated CO2. Plant Growth Regul. 83, 325–334. doi: 10.1007/s10725-017-0298-8
Yi, R., Xu, X., Huang, Y., Zhu, S., Xu, C., and Zhang, Y. (2022). Tropical plant species living under P limitation show signs of greater resistance to drought. Geophys. Res. Lett. 49, e2021GL096686. doi: 10.1029/2021GL096686
Yu, G., Jia, Y., He, N., Zhu, J., Chen, Z., Wang, Q., et al. (2019). Stabilization of atmospheric nitrogen deposition in China over the past decade. Nat. Geosci. 12, 424–429. doi: 10.1038/s41561-019-0352-4
Yue, K., Fornara, D. A., Yang, W., Peng, Y., Peng, C., Liu, Z., et al. (2017). Influence of multiple global change drivers on terrestrial carbon storage: additive effects are common. Ecol. Lett. 20, 663–672. doi: 10.1111/ele.12767
Zhang, H., Li, Q., Adams, H. D., Wang, A., Wu, J., Jin, C., et al. (2018). Responses of woody plant functional traits to nitrogen addition: A meta-analysis of leaf economics, gas exchange, and hydraulic traits [Review. Front. Plant Sci. 9. doi: 10.3389/fpls.2018.00683
Zhang, H., Yuan, F., Wu, J., Jin, C., Pivovaroff, A. L., Tian, J., et al. (2020). Responses of functional traits to seven-year nitrogen addition in two tree species: coordination of hydraulics, gas exchange and carbon reserves. Tree Physiol. 41, 190–205. doi: 10.1093/treephys/tpaa120
Zhang, S., Jiang, H., Zhao, H., Korpelainen, H., and Li, C. (2014). Sexually different physiological responses of Populus cathayana to nitrogen and phosphorus deficiencies. Tree Physiol. 34, 343–354. doi: 10.1093/treephys/tpu025
Zhang, Y.-L., Moser, B., Li, M.-H., Wohlgemuth, T., Lei, J.-P., and Bachofen, C. (2020). Contrasting leaf trait responses of conifer and broadleaved seedlings to altered resource availability are linked to resource strategies. Plants 9, 621. doi: 10.3390/plants9050621
Zhao, Q. and Dixon, R. A. (2011). Transcriptional networks for lignin biosynthesis: more complex than we thought? Trends Plant Sci. 16, 227–233. doi: 10.1016/j.tplants.2010.12.005
Zhou, X., Ouyang, S., Saurer, M., Feng, M., Bose, A. K., Duan, H., et al. (2024). Species-specific responses of C and N allocation to N addition: evidence from dual 13C and 15N labeling in three tree species. Sci. Total Environ. 927, 172164. doi: 10.1016/j.scitotenv.2024.172164
Zhou, W., Tao, Y., Peng, L., Zheng, H., Zhou, X., Yin, B., et al. (2024). Balancing the nutrient needs: Optimising growth in Malus sieversii seedlings through tailored nitrogen and phosphorus effects. Plant Cell Environ. 47, 5280–5296. doi: 10.1111/pce.15100
Keywords: nutrient enrichment, carbon storage, soluble sugar, mete-analysis, plant physiology
Citation: Zhou W, Gu P, Tang Y and Zhang Y (2025) Patterns of plant organ-level non-structural carbohydrate content in response to nitrogen and phosphorus enrichment. Front. Plant Sci. 16:1659022. doi: 10.3389/fpls.2025.1659022
Received: 03 July 2025; Accepted: 11 September 2025;
Published: 30 September 2025.
Edited by:
Daniela Farinelli, University of Perugia, ItalyReviewed by:
Thounaojam Thorny Chanu, Assam Don Bosco University, IndiaSyed Wasif Ahmed, National Research Council (CNR), Italy
Jiamei Wu, Chinese Academy of Natural Resources Economics, China
Copyright © 2025 Zhou, Gu, Tang and Zhang. This is an open-access article distributed under the terms of the Creative Commons Attribution License (CC BY). The use, distribution or reproduction in other forums is permitted, provided the original author(s) and the copyright owner(s) are credited and that the original publication in this journal is cited, in accordance with accepted academic practice. No use, distribution or reproduction is permitted which does not comply with these terms.
*Correspondence: Weiyi Zhou, d2VpeWl6aG91OTlAZm94bWFpbC5jb20=; Yuanming Zhang, emhhbmd5bUBtcy54amIuYWMuY24=
†These authors have contributed equally to this work