 Abiodun Fatai Olayinka1,2
 Daniel Kwadjo Dzidzienyo1,3*
 Edwige Gaby Nkouaya Mbanjo2
 Samuel Kwame Offei1
 Pangirayi Bernard Tongoona1
 Eric Yirenkyi Danquah1
 Chiedozie Egesi4,5
 Ismail Yusuf Rabbi2
- 1West Africa Centre for Crop Improvement (WACCI), College of Basic and Applied Sciences, University of Ghana, Accra, Ghana
- 2International Institute of Tropical Agriculture (IITA), Ibadan, Nigeria
- 3Biotechnology Centre, College of Basic and Applied Sciences, University of Ghana, Accra, Ghana
- 4Cassava Research Program, National Root Crops Research Institute (NRCRI), Umudike, Nigeria
- 5Department of Plant Breeding and Genetics, Cornell University, Ithaca, NY, United States
Cassava (Manihot esculenta Crantz) cultivars with compact plant types and moderate plant heights are required for mechanical farming to boost productivity. Plant architecture is a complex trait controlled by environmental and genetics factors. However, little is known about the genetic basis of cassava plant architecture. This research sought to bridge the knowledge gap by elucidating the genetic basis of traits related to plant architecture, yield, and productivity in cassava. A panel of 453 cassava clones developed at the International Institute of Tropical Agriculture was genotyped using two distinct genotyping platforms: low-density DArTseq and DArTag. Plant architecture, yield, and productivity-related traits were evaluated at three locations across two growing seasons in Nigeria. Following data filtering, 420 clones, 54,574 DArTSeq, and 2,527 DArTag single-nucleotide polymorphism (SNP) markers were used for genome-wide association studies (GWAS). Of the 16 SNPs identified by GWAS using DArTSeq markers, only one was detected during validation, and the remaining SNPs may be false positives. Sixteen SNPs were found to be significant using DArTag markers. Fifteen of these were associated with 21 putative candidate genes for five plant architecture traits (17 genes) and three yield traits (four genes). Six of the identified candidate genes were novel. The identified candidate genes were associated with various metabolic processes, including plant architecture, adaptation, root development, plant growth, and stress response. The limited number of significant markers identified using DArTSeq markers could be explained by the large gaps and uneven marker distribution observed across the genome with the DArTseq platform compared to DArTag. The findings of this study provide new insights into the genetic basis of plant architecture and yield in cassava. Cassava breeders could leverage this knowledge to optimize plant architecture and yield in cassava through marker-assisted selection and targeted manipulation of candidate genes.
Introduction
Cassava is Africa’s second most important food crop. Over 40% of the continent’s population relies on it to fulfil their daily caloric and nutritional needs (Alves, 2002; Nweke, 2004; FAO, 2020). Cassava starch is a versatile raw material for food, feed, and industrial applications (Li et al., 2017). Despite the huge prospects of its value chain, cassava production in Nigeria remains low at approximately 10 tons per hectare, while demand is increasing (FAO, 2021). The increasing demand for cassava-based products necessitates the drive to increase crop performance to boost productivity.
Plant architecture plays a crucial role in agriculture. It affects crop growth, yield, and stress resistance (Lauri and Lespinasse, 2001; Rymaszewski et al., 2017; Mansaray et al., 2020). Cassava cultivars with appropriate plant architecture are needed to maximize cassava yield potential, mechanize cassava farming, and boost productivity per unit area (Patiño et al., 2002; FAO, 2013). Plant architecture and yield are complex traits known to be controlled by both environmental and genetic factors (Zhang et al., 2017; Yu et al., 2020). Several studies have attempted to dissect the genetic basis of cassava plant architecture-related traits and their effects on cassava yield using biparental populations, with limited breakthroughs (OkogBenin and Fregene, 2003; Mora Moreno et al., 2016; Srisawad et al., 2023).
Genome-wide association studies (GWAS), which use a diversity panel, are gaining popularity for marker-trait associations (Dash et al., 2021; Uffelmann et al., 2021). GWAS has helped unravel the genetic architecture of important crop plant traits, including yield and quality traits, early bulking and storage root formation, and nitrogen use efficiency in cassava (Abah et al., 2024; Aghogho et al., 2024; Mbe et al., 2024), plant architecture in maize (Lu et al., 2024), and drought tolerance in wheat (Yang et al., 2024). Single-nucleotide polymorphisms (SNPs) have been the marker of choice for GWAS analyses owing to their stable inheritance patterns, low mutation rates, and compatibility with high-throughput genotyping technologies (Morgil et al., 2020; Panahi et al., 2024).
The reliability and effectiveness of GWAS could be influenced by the density and distribution of SNP markers throughout the genome (Spindel et al., 2015; Uffelmann et al., 2021; Aalborg et al., 2024). Information on the impact of marker density and distribution on GWAS output is limited. Two genotyping platforms, DArTseq and DArTag, were used to conduct GWAS analyses. This study aimed to investigate the genetics of plant architecture and yield-related traits in cassava, as well as how marker density and distribution affect GWAS effectiveness and reliability.
Materials and methods
The cassava genotypes used in this study included 453 genotypes from a preliminary yield trial (PYT) developed at the IITA and five commercial varieties used as checks. The details of the accessions, crosses, and parents are reported in Supplementary Table S1. Descriptions of the commercial check varieties are provided in Supplementary Table S2. The trial was conducted in three locations in Nigeria: Ikenne (Lat 6.8718° N, Long 3.7106° E, humid forest zone), Onne (Lat 4.7363° N, Long 7.1545° E, humid forest zone), and Mokwa (Lat 9.2934° N, Long 5.0493° E, Southern Guinea Savannah zone) across two planting seasons (2020/2021, and 2021/2022). The trial was laid out in an augmented block design with two replications per location for each season. Each plot comprised three rows with three plants planted on ridges per row. A spacing of 1m was maintained between ridges, while a spacing of 0.8m was observed within plants in a row.
Phenotypic data collection
Ten above-ground plant traits: stem diameter (STMDI9), shoot weight (SHTWT), plant height at 9 months after planting (PLTHT9), number of lodged plants per plot (LODG), branching habit at 9 months after planting (BRNHB9), angle of branching (ANGBR9), number of plants per stand (PPSTD9), height at first branch at 9 months after planting (BRNHT9), plant height at 6 months after planting (PLTHT6), top yield (TYLD), height at first branch at 6 months after planting (BRNHT6), and eight yield-related traits: fresh root yield (FYLD), dry yield (DYLD), starch content (SC), dry matter content (DM), number of harvested roots (RTNO), fresh root weight (RTWT), and harvest index (HI), were measured at specific phenological stages of the crop (3, 6, 9, and 12 months after planting). The phenological stage and method used to assess the traits were based on the parameters described by (Fukuda et al., 2010). The details of the traits evaluated and the evaluation procedures are presented in Supplementary Table S3.
SNP genotyping and marker filtering
Leaf samples were collected from a single plant per cassava clone, 4–6 leaf discs of 6mm in diameter were collected from healthy young leaves. The leaf discs were placed in the corresponding wells of the DNA plate on ice in a sampling bag. The plate was immediately transferred to the laboratory, where it was covered with Parafilm and kept at -80°C in a freezer prior to freeze-drying. The samples were freeze-dried at the IITA Bioscience Centre using a lyophilizer (LABCONCO FreeZone 18 Liter -50°C freeze-dryer) operated at -51°C and 5.0 pa for a minimum of 72 hrs. The freeze-dried leaf samples were shipped to Diversity Arrays Technology in Canberra, Australia, where genotyping was performed using low-density DArTseq and DArTag technology. Upon receipt, the raw SNP data were filtered using PLINK 1.9 software (Purcell et al., 2007; Chang et al., 2015). SNP markers with less than 5% minor allele frequency (MAF) of more than 10% missing call rate were pruned.
Statistical analyses of phenotypic data
Plant architecture and yield-related traits were analyzed using the spatial single-trial model fitted using the R package `SpATS` (Rodriguez-Alvarez et al., 2018). The mathematical formula for the adopted model is as follows:
where yijk is the phenotypic value of the ith genotype in the jth block and kth incomplete block, μ is the overall mean, gi is the random effect of the ith genotype, rj is the random effect of the jth block, bk is the random effect of the kth incomplete block, s(xijk, yijk) is the smooth bivariate function of the row and column coordinates of the plot, and eijk is the residual error. The best linear unbiased prediction (BLUP) values derived from this model were used as phenotypic values in the marker-trait association analysis.
The linear mixed model for the analysis of the pooled data (obtained from the three test environments) was fitted as follows using the lmer function from the lme4 package (Bates et al., 2015) of the R software (R Core Team, 2020).
where ηijklm is the yield value for the mth plot in the lth block of the jth replicate of the ith environment for the kth accession; μ is the overall mean; αi is the fixed effect of the ith environment; βij is the fixed effect of the interaction between the ith environment and the jth replicate; γk is the random effect of the kth accession; δik is the random effect of the interaction between the ith environment and the kth accession; ϵijl is the random effect of the interaction between the ith environment, the jth replicate, and the lth block; and eijkl is the random residual error.
The random effects γk, δik, and ϵijl are assumed to be independent and normally distributed with a mean of 0 and variance components σ2a, σ2ea, and σ2b, respectively. The residual error eijkl is also assumed to be independent and normally distributed with a mean of 0 and variance component σ2e.
The best linear unbiased prediction (BLUP) values derived from this model were used as the pooled phenotypic values across environments. The broad-sense heritability (H2) values were calculated as follows:
Where H2 is the broad-sense heritability estimate, σ2g is the genetic variance component of the accession effect, σ2e is the variance component of the residual error, and r is the number of replicates.
Genotypic correlation analysis for the plant architecture and yield-related traits was performed using the statistical software Meta-R Version 6.0 (Alvarado et al., 2020). Variance components were estimated through a mixed linear model fitted using Restricted Maximum Likelihood (REML) to obtain estimates of genotypic variance, variance due to genotype-by-environment interaction, and residual variance prior to the computation of the genotypic correlations among traits.
The formula for the mixed linear model is as follows:
yijk is the observation for the i-th genotype in the j-th block and the k-th replication
μ is the overall mean
αi is the fixed effect of the i-th genotype
βj is the random effect of the j-th block
(αβ)ij is the random interaction effect of the i-th genotype and the j-th block
γk is the random effect of the k-th replication within the block
eijk is the residual error.
The estimates of the genetic correlation coefficient values were obtained using the variance components from the mixed linear model:
y is the vector of observations
β is the vector of fixed effects
u is the vector of random effects
e is the vector of residuals
X and Z are design matrices.
The genetic correlation between the two traits was calculated as follows:
σg1g2 is the covariance between the random effects of the two traits. σ2g1 and σ2g2 are the variances of the random effects of the two traits, respectively. Data visualization was performed with the R package ‘corrplot’ version 0.92 (Wei and Simko, 2021). Path Analysis was performed using the R package ‘lavaan’ version 0.6-17 (Rosseel, 2012) and visualized using the R package ‘semPlot’ (Epskamp et al., 2019).
Marker coverage, SNP density, and linkage disequilibrium
Marker coverage and SNP density were visualized using the SRplot platform (Tang et al., 2023). Linkage Disequilibrium (LD) analysis was conducted using PLINK v1.9 (Purcell et al., 2007). Marker pairs exhibiting perfect LD scores (r2=1) were excluded before further analysis. An LD decay plot was created utilizing R software (R Core Team, 2020).
Population structure analysis
Population structure analysis was performed using ADMIXTURE (Alexander et al., 2009), which uses the maximum likelihood estimate to assign genotypes to putative populations (K). Cross-validation was performed to determine the optimal number of clusters. The results of the population structure analysis were visualized using the R package “ggplot2” (Wickham, 2016). Ward’s minimum variance method (ward.D2) was utilized for hierarchical clustering on the Q-matrix produced by ADMIXTURE. The R package “dendextend” (Galili, 2015) was used to plot the dendrogram.
Genetic association analysis
GWAS analysis was performed with the BLUP values obtained from the trials conducted in each of the three test environments as well as the pooled data across all the environments through the Mixed Linear Model (MLM) described in (Zhang et al., 2010), using the R package Genome Association and Prediction Integrated Tools (GAPIT) (Lipka et al., 2012). This model decomposes the observed phenotype (y) into fixed effects (Xβ), random genetic effects (Zu), and residual effects (e). The formula is:
where X is the design matrix for fixed effects, Z is the design matrix for random effects, β is the vector of fixed effects, u is the vector of random effects, and e is the vector of residuals.
In addition to the MLM model, the Fixed and random model Circulating Probability Unification (FarmCPU) model outlined in (Liu et al., 2016) was used for GWAS carried out using DArTseq markers. FarmCPU uses a modified MLM method, Multiple Loci Mixed Model (MLMM), and incorporates multiple markers simultaneously as covariates in a stepwise MLM to partially remove the confounding effects between testing markers and kinship. The formula is:
where X is the design matrix for fixed effects, Z1 is the design matrix for random effects from kinship, Z2 is the design matrix for random effects from multiple markers, β is the vector of fixed effects, u1 is the vector of random effects from kinship, u2 is the vector of random effects from multiple markers, and e is the vector of residuals.
These models deployed different approaches in accounting for the effects of population structure and environmental variation thereby precluding any possibility of false discovery. However, the following criteria were used in calling SNPs that share a significant correlation with the plant architecture and yield traits: Bonferroni correction, the threshold of the P-value, Manhattan plot and the QQ plot.
The Bonferroni-corrected p-value [log10(0.05/number of SNPs)] was used as a cutoff value for identifying significant SNPs. Manhattan plots were generated to visualize the results, while quantile-quantile (QQ) plots showed the distribution of observed p-values against those predicted under the null hypothesis and captured potential inflation or deflation of the test statistic. Additionally, we used the mixed linear model, which excludes (MLMe) and includes (MLMi) candidate markers in the genetic relationship matrix (GRM) via a leave-one chromosome-out analysis implemented in GCTA (Yang et al., 2011; Yang et al., 2014). The exclusion of the tested SNP from the relationship matrix (GRM) used in the random effect reduces proximal contamination or overcorrection, thereby preventing deflating associations on the same chromosome as the tested SNP. This helped verify the authenticity of the significant SNPs identified using the other two models.
Candidate gene analysis
The significant SNPs were mapped onto genes within the 5,000 bp windows using Manihot esculenta v7.1 of the Phytozome genome browser (Goodstein et al., 2014). The UniProt Consortium database (Aleksander et al., 2023) was used for gene ontology annotation.
Results
Marker coverage and SNP density
A total of 2,527 DArTag SNP markers, uniformly distributed over the 18 chromosomes, were retained after marker filtering (Figure 1). The average number of SNPs per 1MB window across the genome ranged from 1 to 26 SNPs for most of the genomic regions. Chromosome 8 had the highest number of SNPs (164), whereas chromosome 18 had the lowest (106).
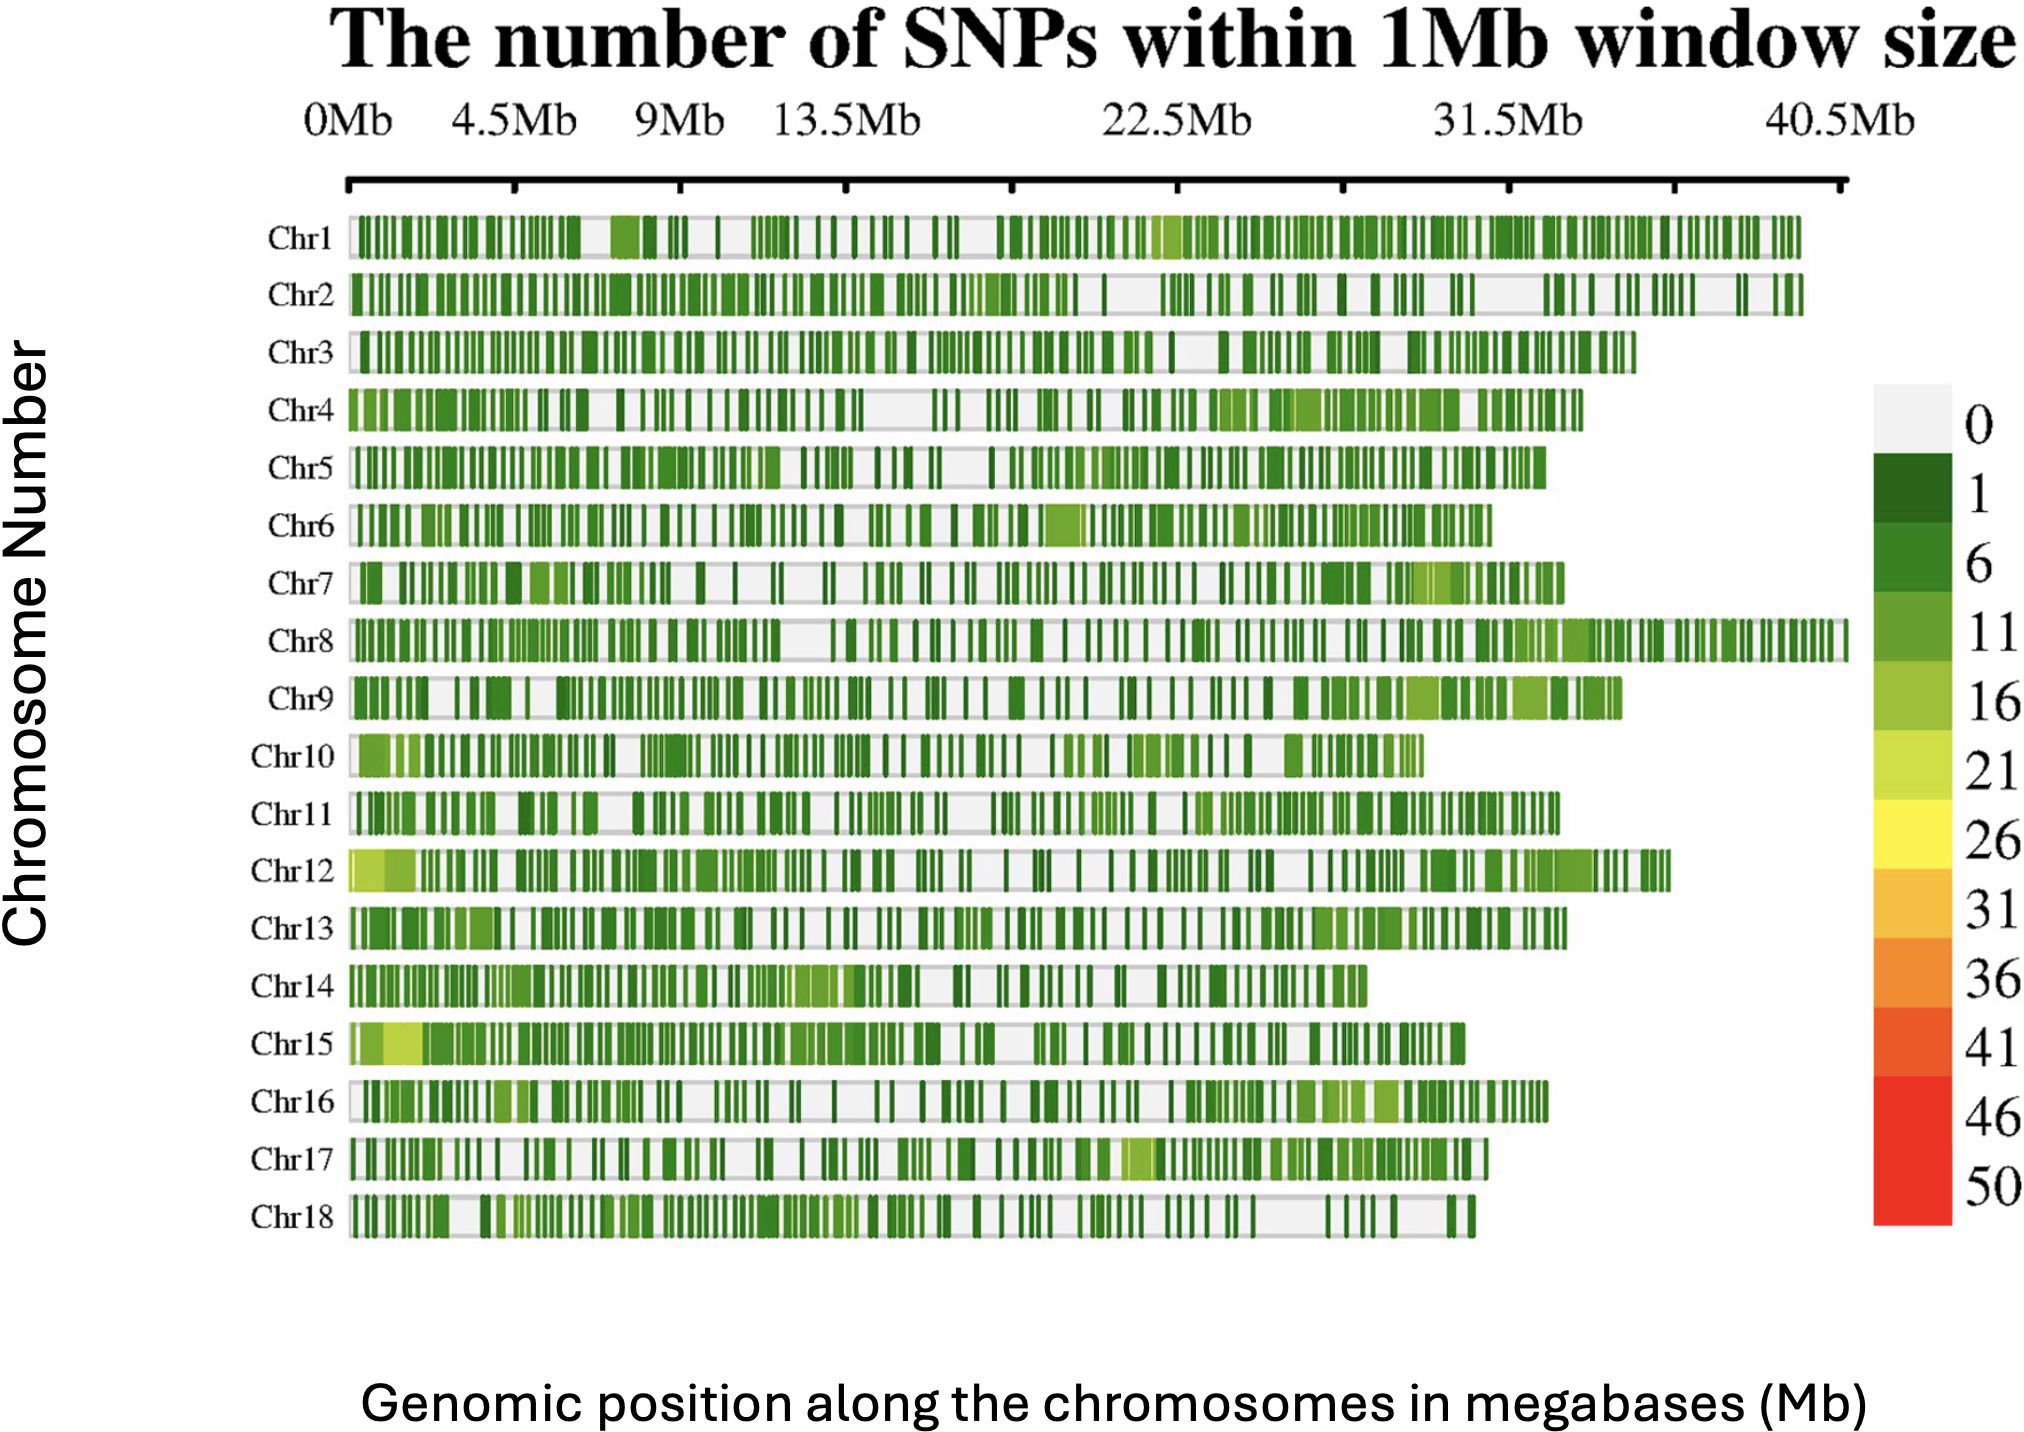
Figure 1. SNP distribution of the DArTAG markers across the 18 chromosomes of the Manihot esculenta genome.
The 54,574 filtered DArTSeq SNP markers were not evenly distributed across the 18 chromosomes (Figure 2). Some genomic regions, especially those close to the centromeric and telomeric regions, showed very low SNP densities, and in some cases, no markers, whereas other regions displayed a dense clustering of SNPs (>50 SNPs per 1 Mb window). Chromosome 1 had the highest number of SNPs (7235), with an average of 207 SNPs/Mb, whereas chromosome 7 had the fewest (1588), with approximately 59 SNPs/Mb.
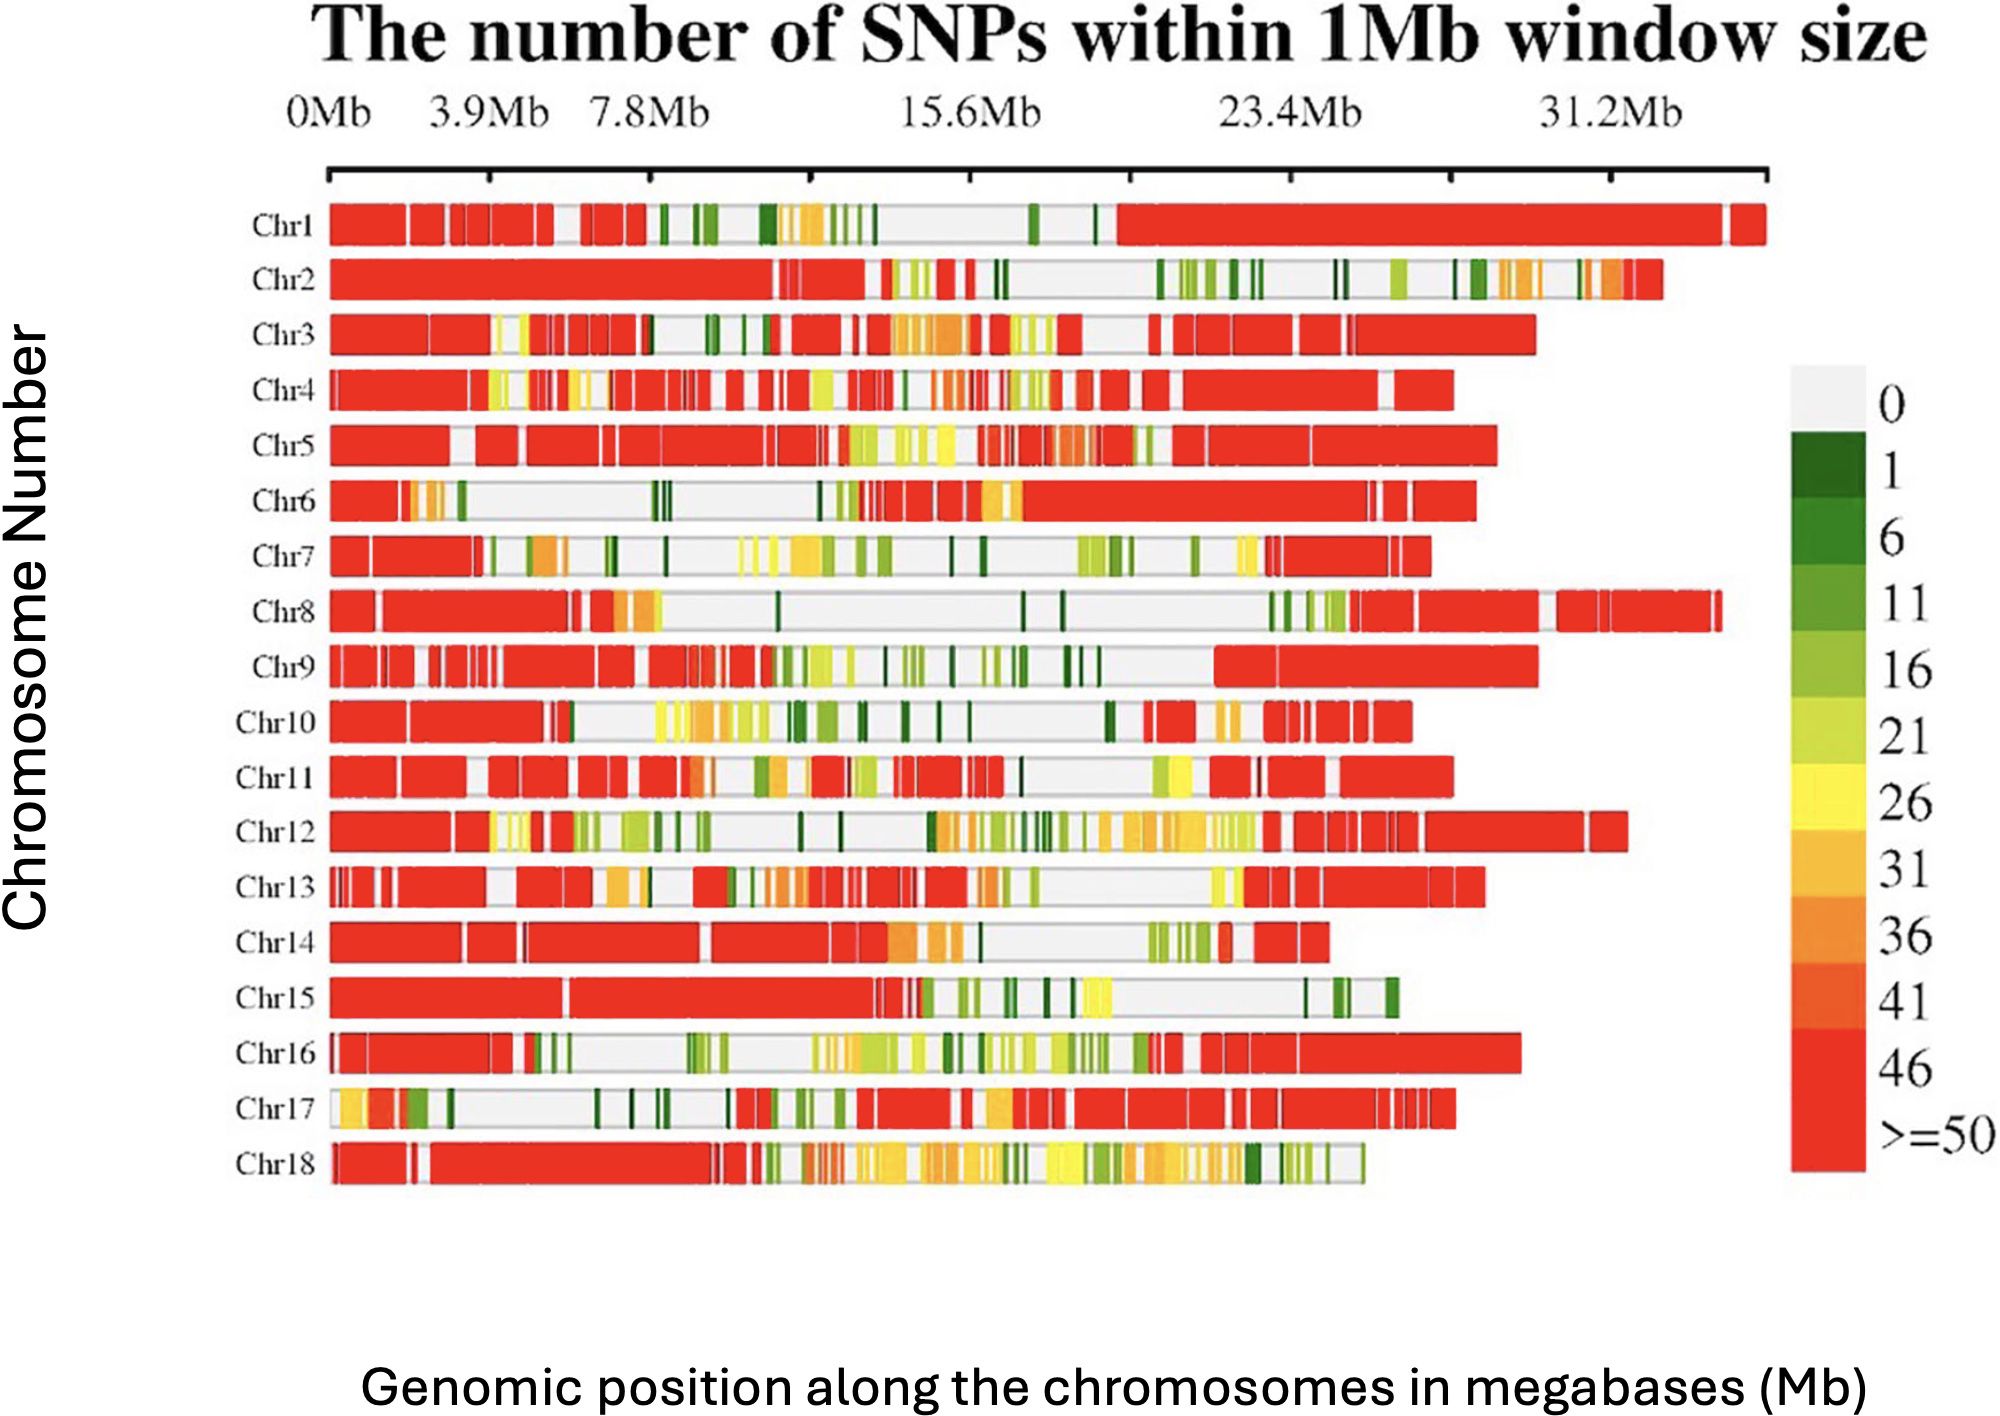
Figure 2. SNP distribution of the DArTSeq markers across the 18 chromosomes of the Manihot esculenta genome.
Linkage disequilibrium
The extent of LD decay was compared between the two marker types used (Figures 3, 4). A rapid LD decay was observed using DArTag markers. The LD between two SNPs fell to 0.2 (the standard threshold that indicates the end of LD) at a relatively more rapid rate, approximately 229 kbp (Figure 3), contrary to the output obtained with the DArTSeq markers (Figure 4), where the LD between two SNPs fell to 0.2 at a longer distance of approximately 790 kbp.
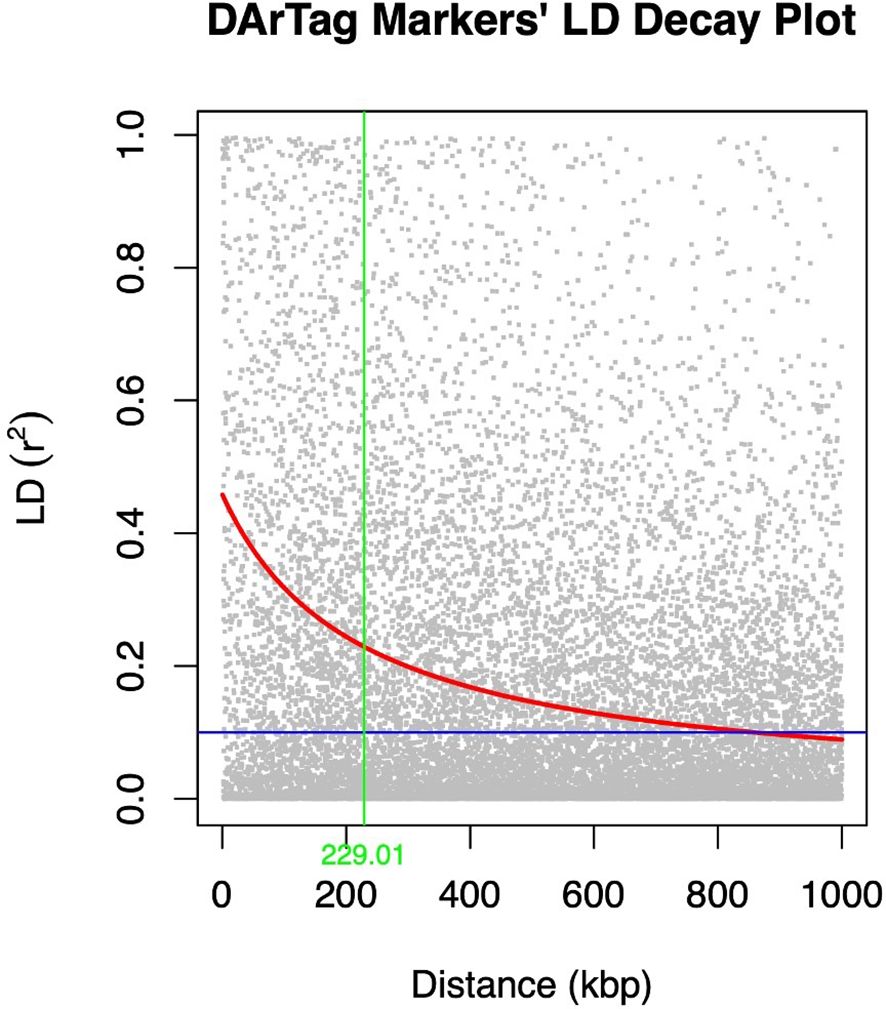
Figure 3. LD decay plot of the DArTag markers generated using PLINK and visualized in R.
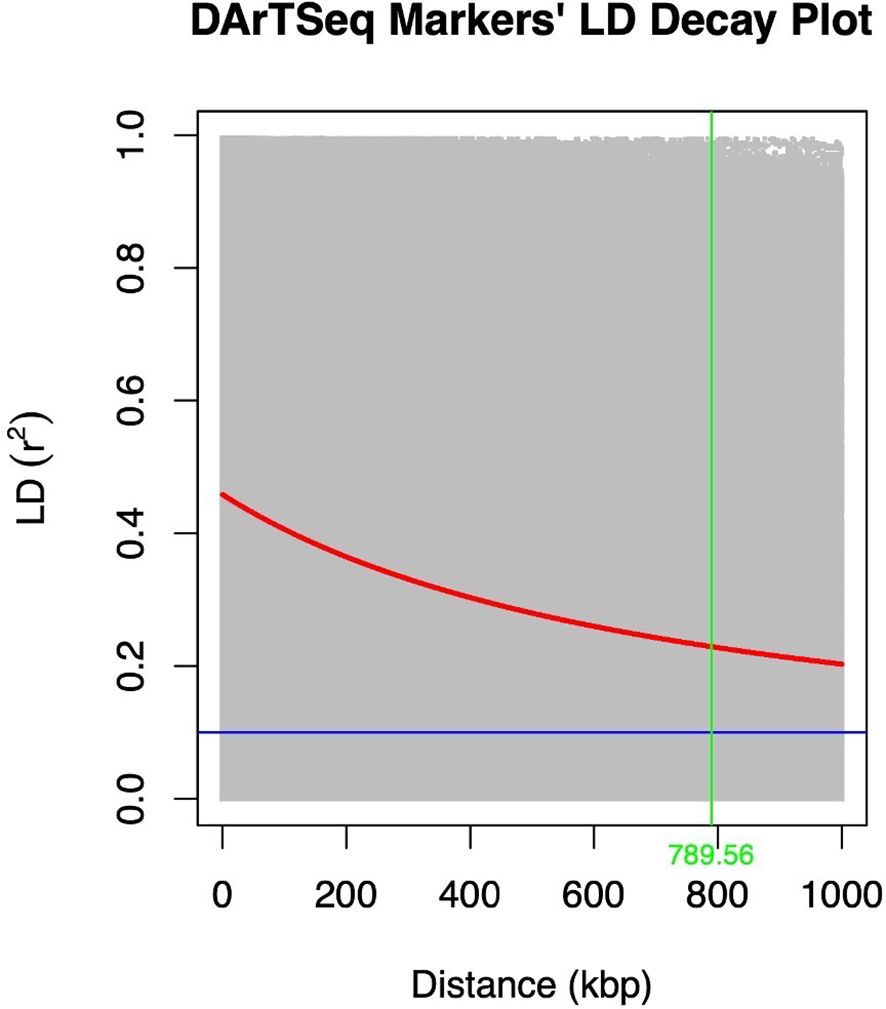
Figure 4. LD decay plot of the DArTSeq markers performed with PLINK and visualized in R.
Population structure analysis
Population structure analyses revealed five subgroups (Figure 5). The cassava accessions were developed from crosses made using parents with diverse genetic backgrounds (Supplementary Table S1). The plot also shows that there is a balance between the extent of admixture and homogeneity within the population. This shows that there exists enough genetic diversity within the population to capture the variation in the plant architecture and yield traits.

Figure 5. Population structure within the cassava accessions for DArTSeq markers and DArTag markers.
Variance Components and broad-sense heritability of plant architecture and yield-related traits
All 18 traits exhibited greater genotypic variance than both the error variance and the variance due to the interaction between genotype and environment (Table 1). Both genetic and interaction factors had a strong influence on the performance of the accessions for all measured traits (p< 0.001). The broad-sense heritability varied from moderately high (0.62; SHTWT) to high (0.88; BRNHT9). The broad-sense heritability for key plant architecture traits, viz., ANGBR9 (0.78), STMDI9 (0.73), PLTHT9 (0.80), PLTHT6 (0.83), and BRNHT6 (0.86) were found to be high, while the following yield-related traits, including DM (0.68), SC (0.70), FYLD (0.67), and HI (0.86) had relatively high broad-sense heritability values (Table 1). The phenotypic and genotypic coefficients of variation ranged from 8.30% and 6.84% (DM), respectively, to 78.28% and 65.03% (LODG) (Table 1).
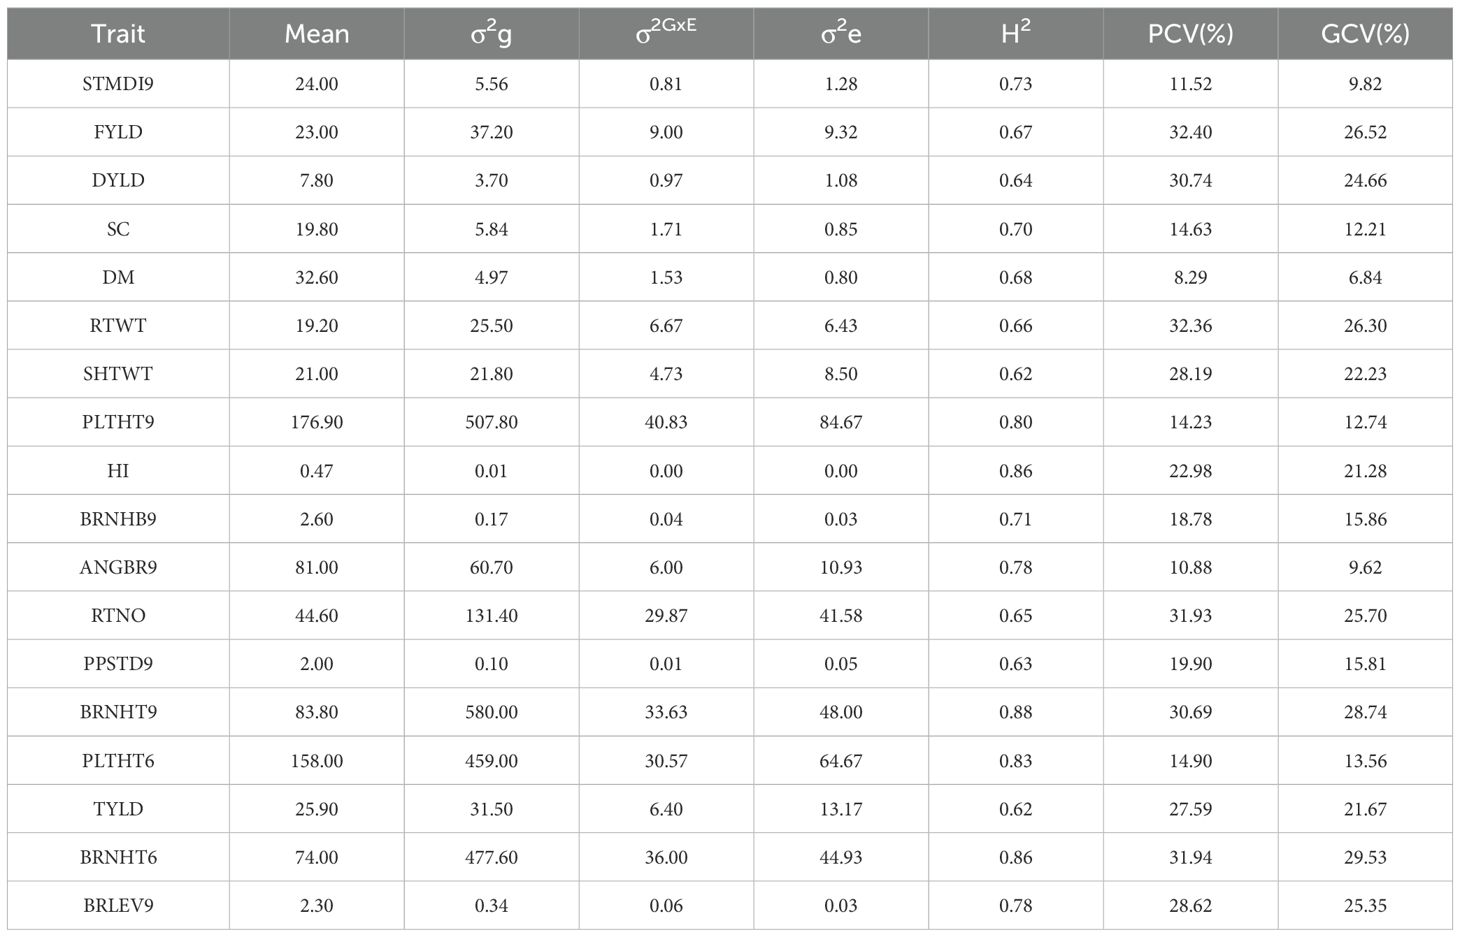
Table 1. Estimates of variance components and broad-sense heritability for plant architecture and yield-related traits in 438 cassava accessions evaluated across three locations in Nigeria.
The exploratory analysis revealed the interrelationships between plant architecture and yield-related traits. The genetic correlation coefficient matrix revealed positive and significant relationships between FYLD and DYLD (r = 0.70 – 0.89, p < 0.001), PLTHT6 and PLTHT9 (r = 0.93 – 1.00, p < 0.001), STDMI9 and PLTHT6 (r = 0.49 – 0.63, p < 0.001), and STDMI9 and PLTHT9 (r = 0.51 – 0.68, p < 0.001) (Figures 6–8). Negative and significant relationships were observed between BRNHT6 and BRNLEV9 (r = -0.03 – (-0.83), p < 0.001) and BRNHT9 and BRNLEV9 (r = -0.81 – (-0.82), p < 0.001) (Figures 6–8). In addition to these, significant negative relationships were observed between LOGD and FYLD (r = -0.18 - (-0.65), p < 0.001), RTNO (r = -0.19 – (-0.57), PPSTD9 (r = -0.04 - (-0.30), p < 0.001) and HI (r = -0.40 – (-0.73), p < 0.001) respectively. Similarly, there was a strong negative and significant correlation between HI and some crucial plant architecture traits, viz., STMDI9 (r = -0.38 – (-0.61), p < 0.001), PLTHT6 (r = -0.36 – (-0.52), p < 0.001), and PLTHT9 (r = -0.33 – (-0.42), p < 0.001) (Figures 6–8).

Figure 6. Genotypic correlation coefficient plot of plant architecture and yield traits in Ikenne trial. NOHAV, number of harvested plants per plot; RTNO, number of harvested roots per plot; SHTWT, shoot weight; SC, starch content; FYLD, fresh root yield; DYLD, dry yield; HI, harvest index; LODG, number of lodged plants per plot; PLTHT6, plant height at 6 months after planting; BRNHT6, height at first branch at 6 months after planting; PLTHT9, plant height at 9 months after planting; BRNHT9, height at first branch at 9 months after planting; BRNLEV9, level of branching at 9 months after planting; BRNHB9, branching habit at 9 months after planting; ANGBR9, angle of branching; PPSTD9, number of plants per stand, and STMDI9, stem diameter.
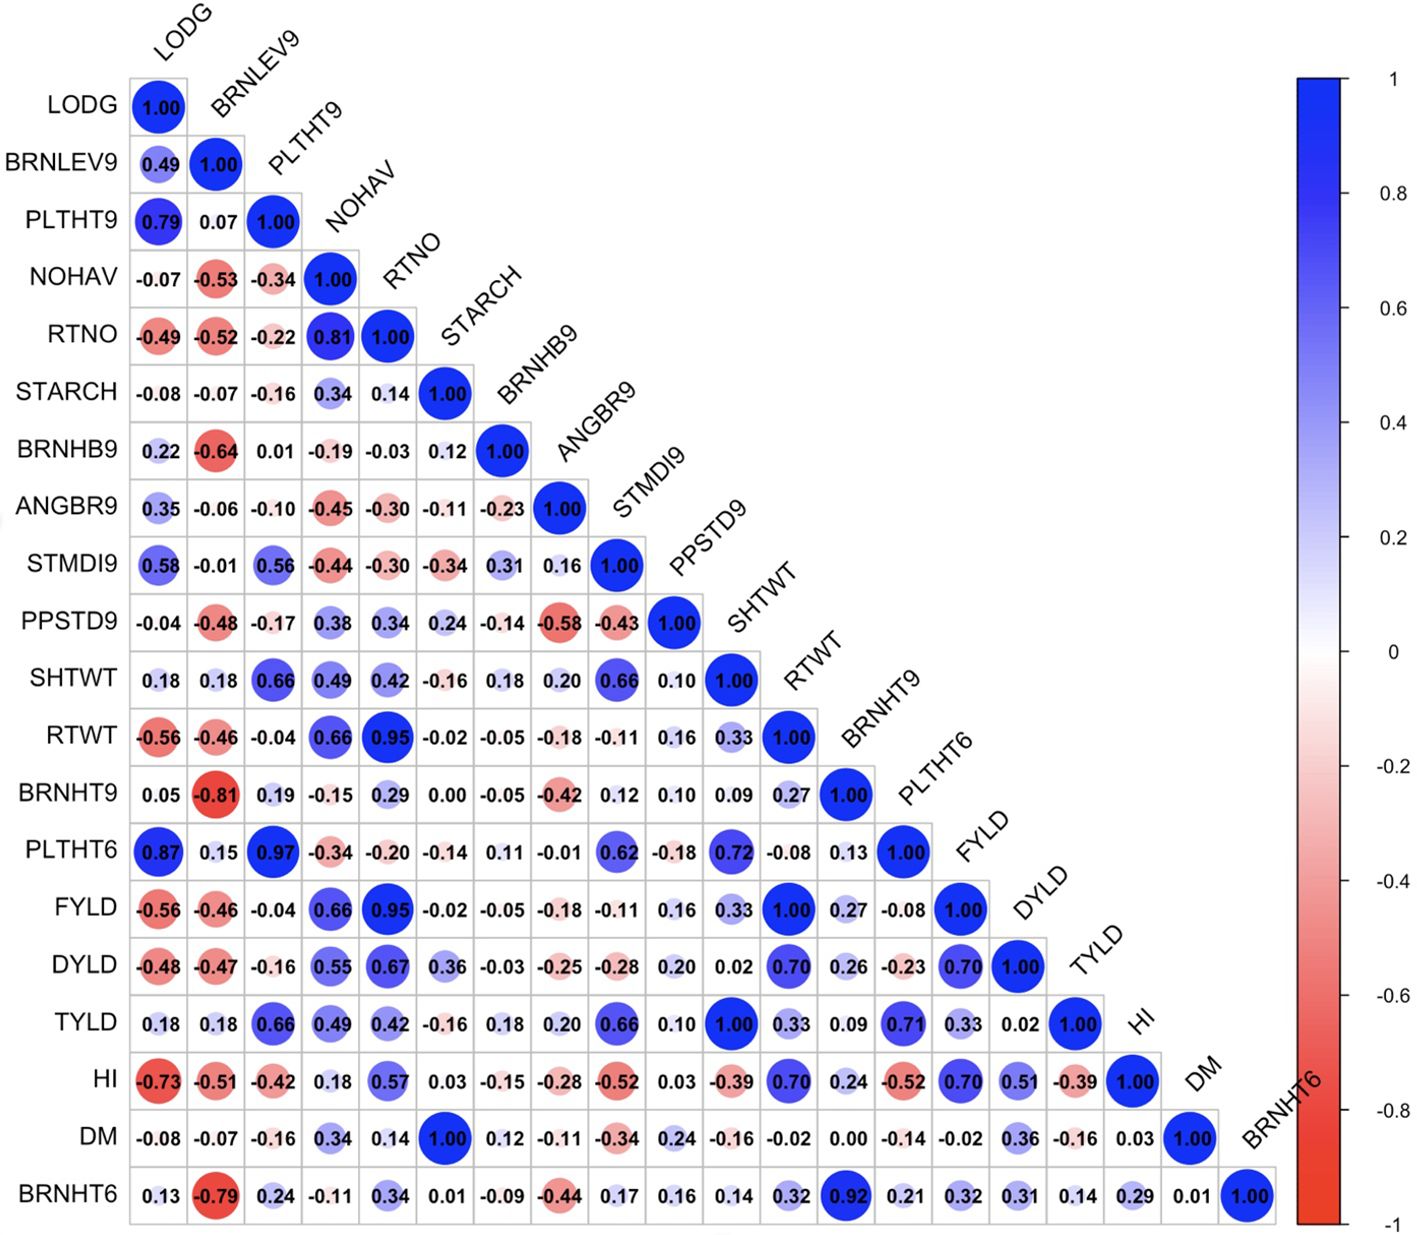
Figure 7. Genotypic correlation coefficient plot of plant architecture and yield traits in Mokwa trial. NOHAV, number of harvested plants per plot; RTNO, number of harvested roots per plot; SHTWT, shoot weight; SC, starch content; FYLD, fresh root yield; DYLD, dry yield; HI, harvest index; LODG, number of lodged plants per plot; PLTHT6, plant height at 6 months after planting; BRNHT6, height at first branch at 6 months after planting; PLTHT9, plant height at 9 months after planting; BRNHT9, height at first branch at 9 months after planting; BRNLEV9, level of branching at 9 months after planting; BRNHB9, branching habit at 9 months after planting; ANGBR9, angle of branching; PPSTD9, number of plants per stand; STMDI9, stem diameter.
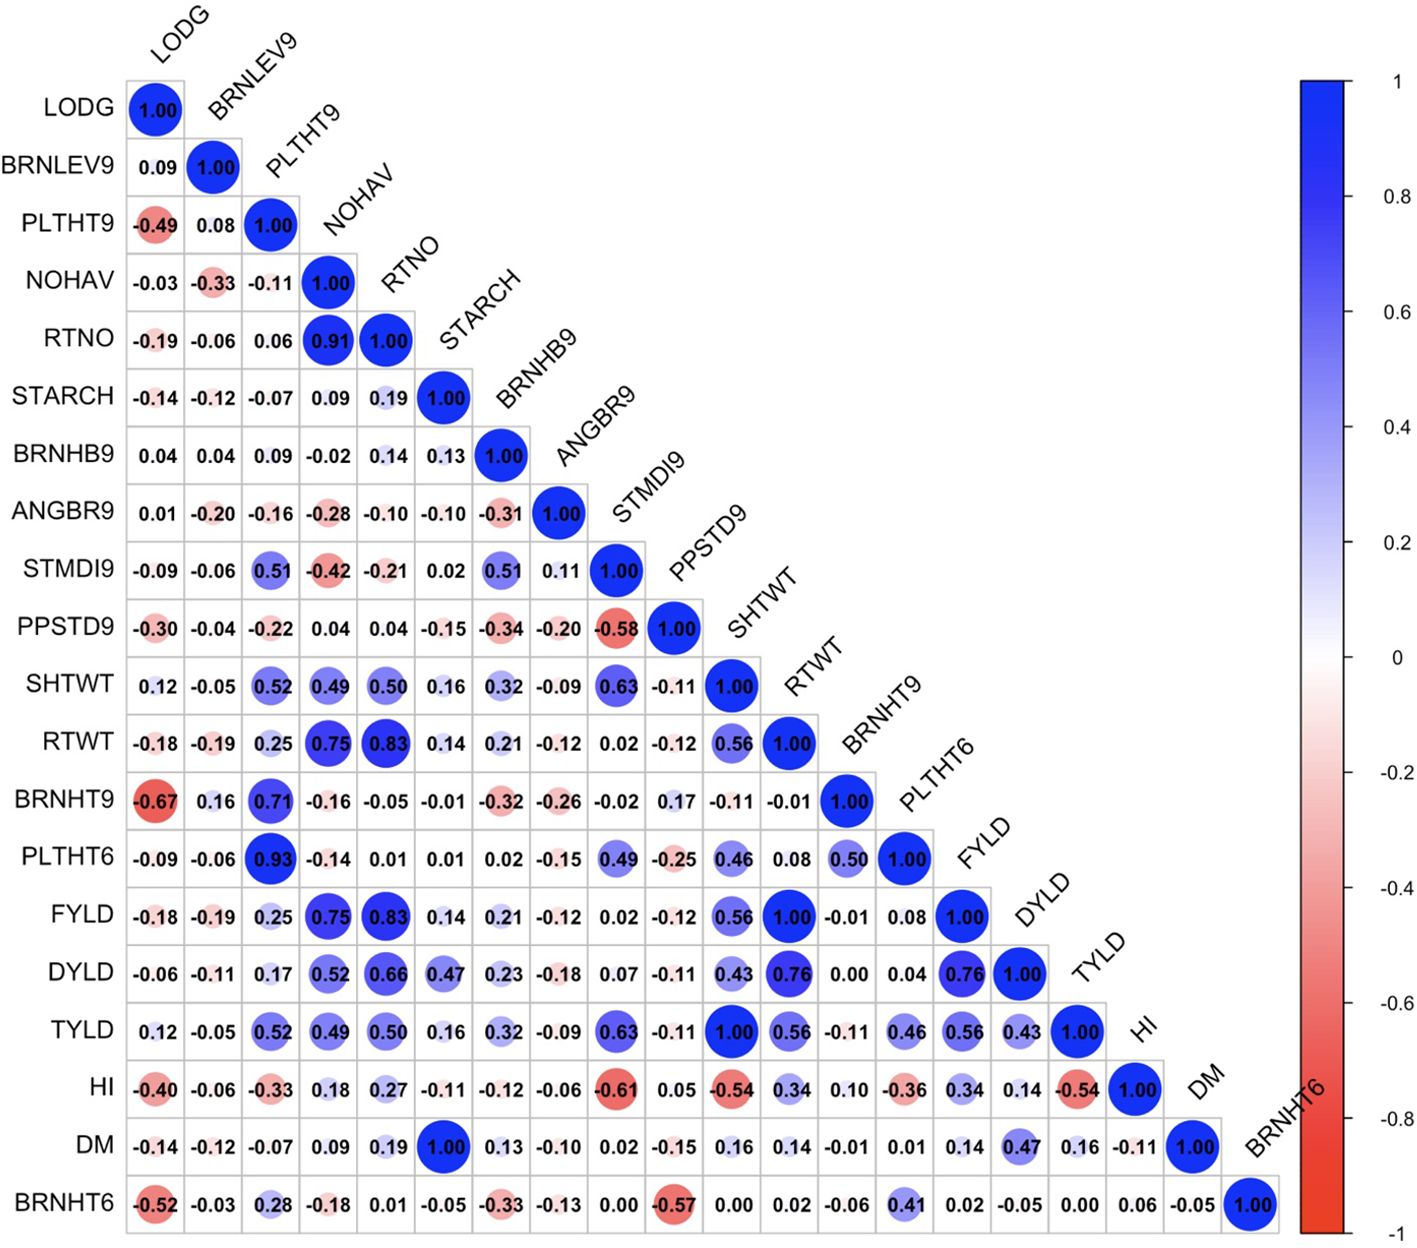
Figure 8. Genotypic correlation coefficient plot of plant architecture and yield traits in Onne trial. NOHAV, number of harvested plants per plot; RTNO, number of harvested roots per plot; SHTWT, shoot weight; SC, starch content; FYLD, fresh root yield; DYLD, dry yield; HI, harvest index; LODG, number of lodged plants per plot; PLTHT6, plant height at 6 months after planting; BRNHT6, height at first branch at 6 months after planting; PLTHT9, plant height at 9 months after planting; BRNHT9, height at first branch at 9 months after planting; BRNLEV9, level of branching at 9 months after planting; BRNHB9, branching habit at 9 months after planting; ANGBR9, angle of branching; PPSTD9, number of plants per stand; STMDI9, stem diameter.
Path coefficient analysis demonstrated that plant architectural traits had both direct and indirect effects on fresh root yield and fresh root weight in cassava. For the trials conducted in all three test environments (Figures 9–11), RTWT had an absolute (1.0) positive contribution to FYLD. However, HI had a strong positive contribution to RTWT (0.69) in the trials conducted at Ikenne and Mokwa (Figures 9, 10), whereas it had no contribution to the output of this trait in the trial conducted at Onne. The contributions of PLTHT9 to FYLD through RTWT were also positive across the three test environments, where a near absolute contribution (0.99) was recorded in the trial conducted at Onne (Figure 11). In contrast, irregular relationships were observed across the test environments for LODG and PLTHT6 with respect to their contributions to RTWT. For LODG, a negative contribution with a low magnitude (-0.14) was reported in two test environments (Figures 9, 10), whereas the contribution was positive (0.13) in the third test environment (Figure 11). Similar results were obtained for PLTHT6, which had a positive contribution (0.23) to RTWT in the Ikenne trial (Figure 9), but negative effects on this trait in the Mokwa (-0.08) and Onne (-0.35) trials (Figures 10, 11).
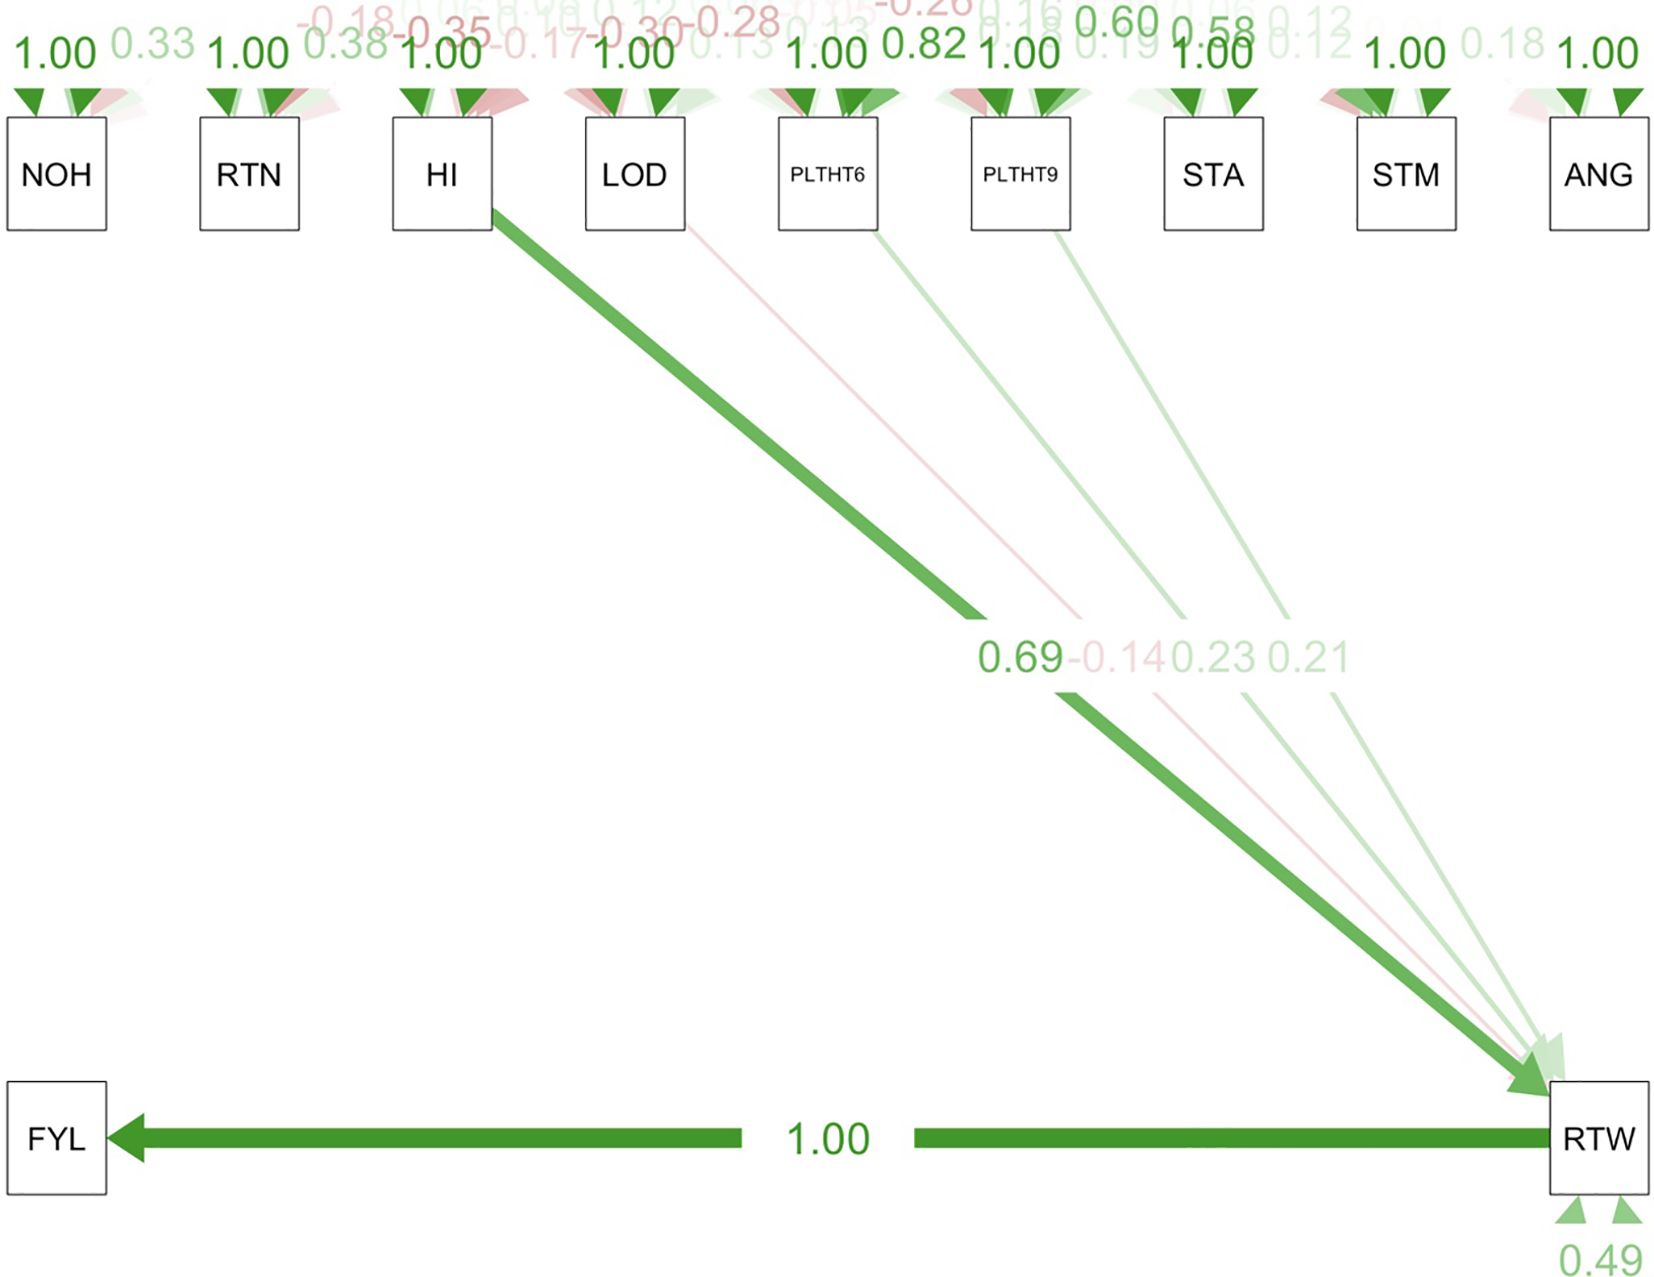
Figure 9. Path coefficient analysis plot of plant architecture and yield traits in Ikenne trial. NOH, number of harvested plants per plot; RTN, number of harvested roots per plot; RTW, root weight; SC, starch content; FYL, fresh root yield; HI, harvest index; LOD, number of lodged plants per plot; PLTHT6, plant height at 6 months after planting; PLTHT9, plant height at 9 months after planting; ANG, angle of branching; STM, stem diameter.
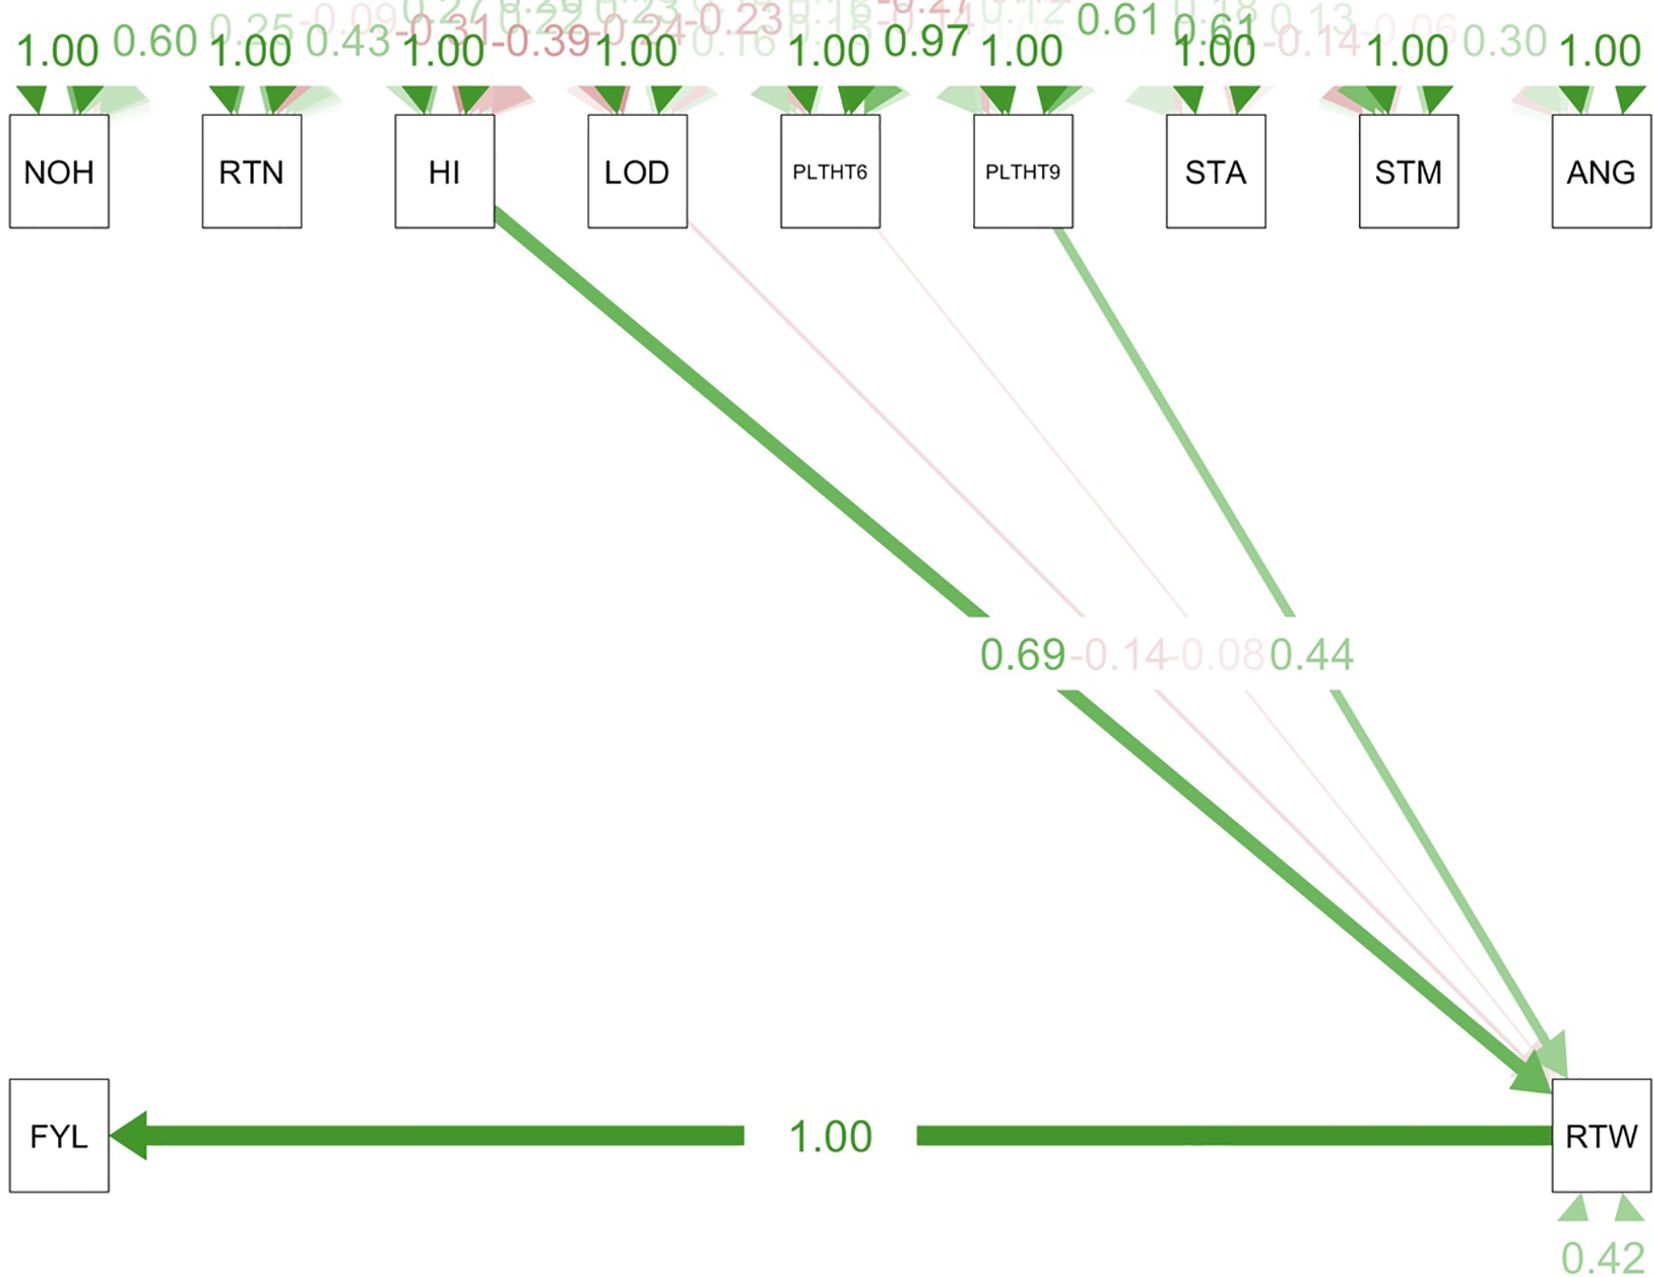
Figure 10. Path coefficient analysis plot of plant architecture and yield traits in Mokwa trial. NOH, number of harvested plants per plot; RTN, number of harvested roots per plot; RTW, root weight; SC, starch content; FYL, fresh root yield; HI, harvest index; LOD, number of lodged plants per plot; PLTHT6, plant height at 6 months after planting; PLTHT9, plant height at 9 months after planting; ANG, angle of branching, and STM, stem diameter.
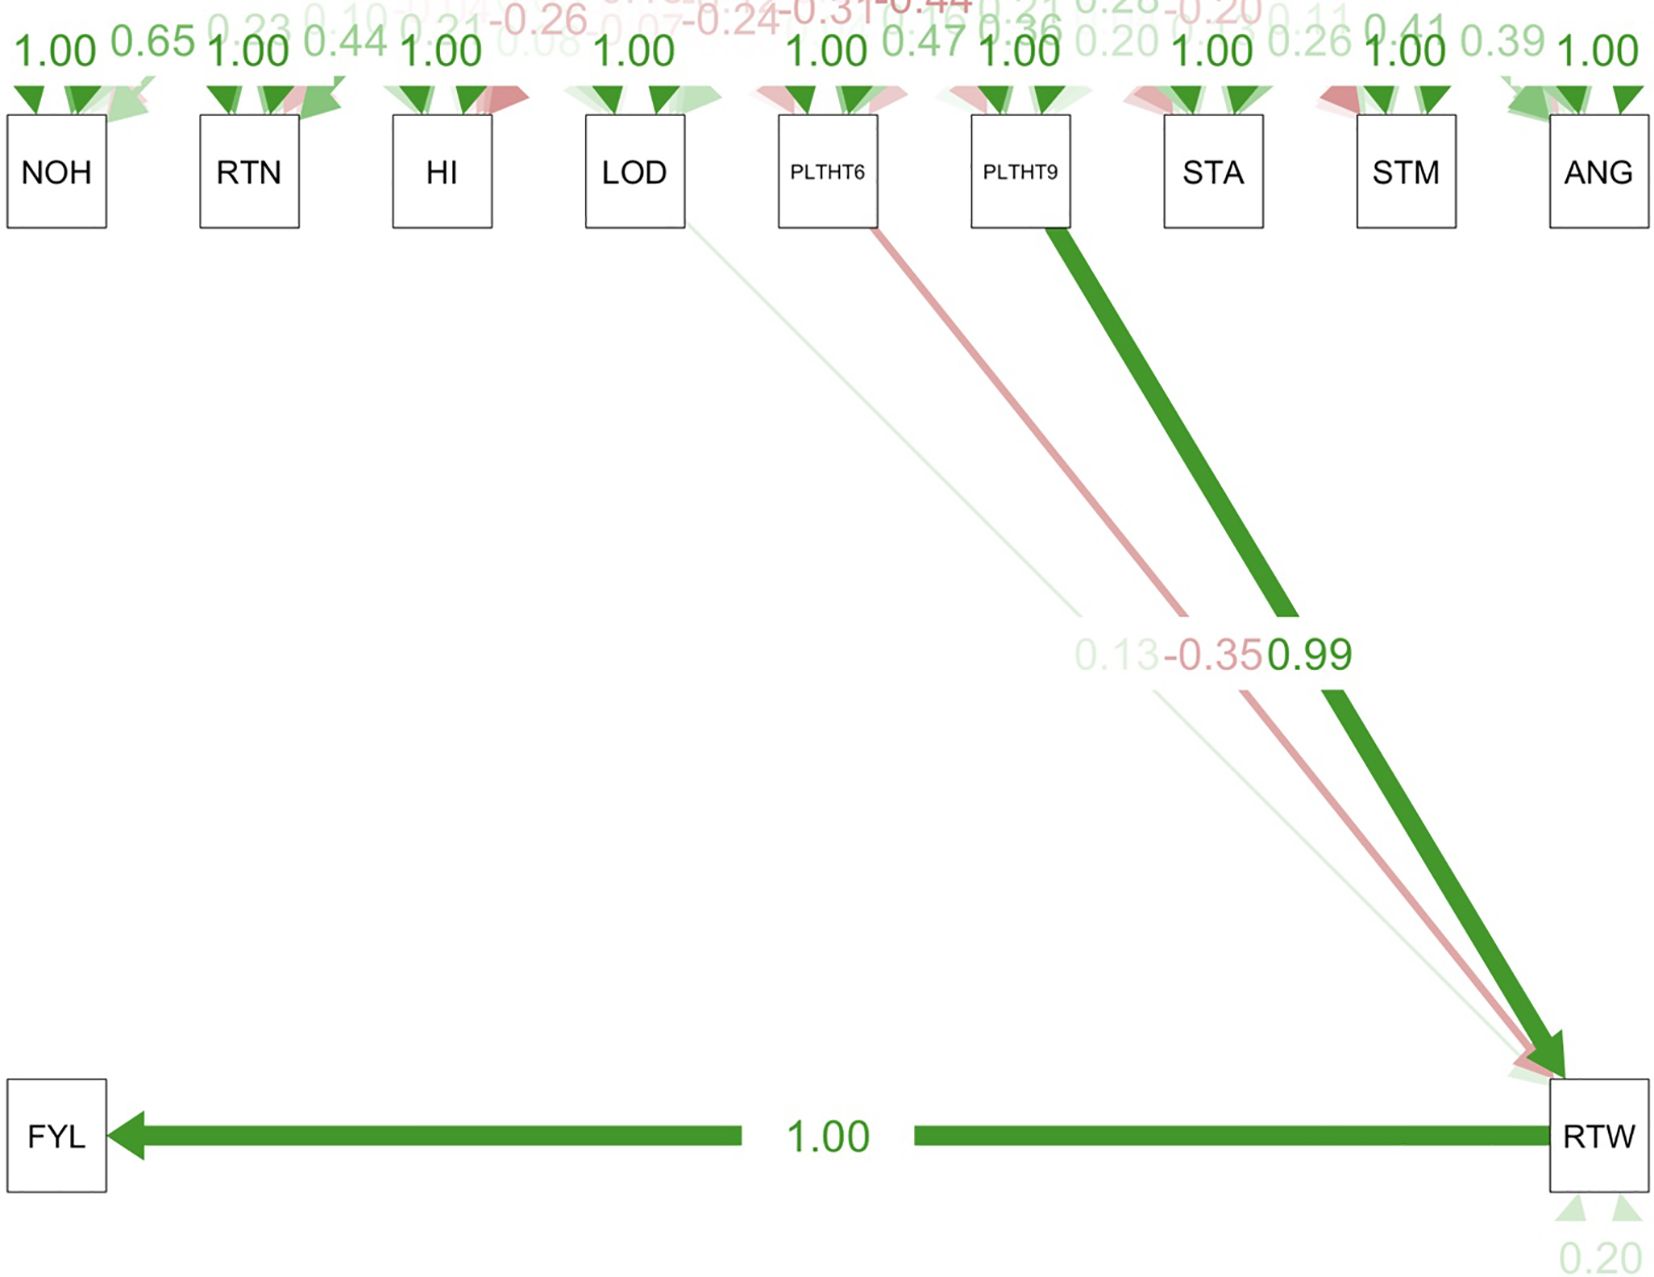
Figure 11. Path coefficient analysis plot of plant architecture and yield traits in Onne trial. NOH, number of harvested plants per plot; RTN, number of harvested roots per plot; RTW, root weight; SC, starch content; FYL, fresh root yield; HI, harvest index; LOD, number of lodged plants per plot; PLTHT6, plant height at 6 months after planting; PLTHT9, plant height at 9 months after planting; ANG, angle of branching; STM, stem diameter.
Marker-trait analysis
Four hundred and twenty (420) accessions, 2,527 DArTag, and 54,574 DArTSeq SNP markers were used in GWAS analyses. The GWAS conducted using the DArTag markers and the mixed linear model revealed 16 significant marker-trait hits for eight plant architecture traits (ANGBR9, BRNHB9, PLTHT6, PLTHT9, BRNLEV3, BRNLEV9, SHTWT, and TYLD) and three yield traits (RTWT, FYLD, and DYLD) (Table 2; Figure 12). Some of the significant SNP hits were location specific while some were detected across all the locations (Table 3). Significant SNPs were found on chromosomes 1, 2, 6, 8, 11, 12, 14, and 15. ANGBR9 had significant SNPs on chromosomes 12 and 14, while three chromosomes had significant marker-trait associations (MTAs) for more than one trait: chromosome 8 for PLTHT9, FYLD, and RTWT; chromosome 6 for SHTWT and TYLD; and chromosome 12 for ANGBR9 and BRNHB9. The remaining traits, DYLD, BRNLEV3, BRNLEV9, and BRNHB9, only had significant MTAs on chromosomes 2, 1, 15, and 12, respectively (Table 2; Figure 12). Further analyses of the 16 significant SNP hits led to the identification of 21 putative candidate genes for nine traits (Table 4). These included ANGBR9 (7), PLTHT9 (2), BRNLEV3 (1), BRNLEV9 (6), FYLD (1), RTWT (1), SHTWT (1), TYLD (1), and DYLD (3) (Table 4).
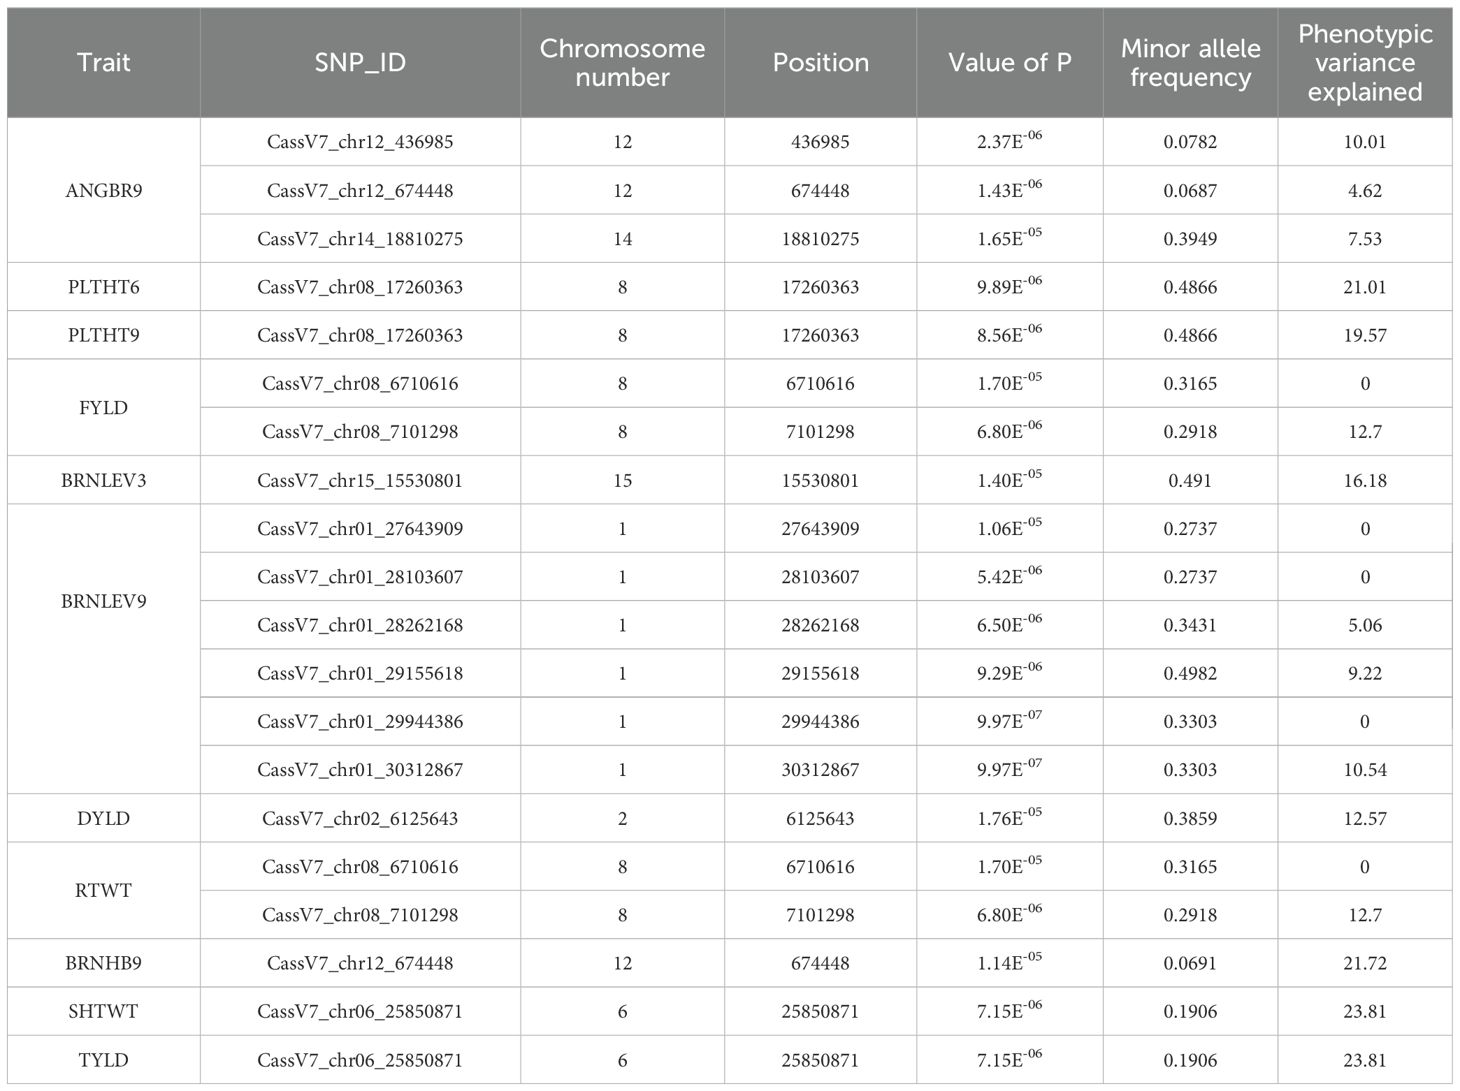
Table 2. Summary of top significant SNPs for plant architecture and yield traits of cassava.
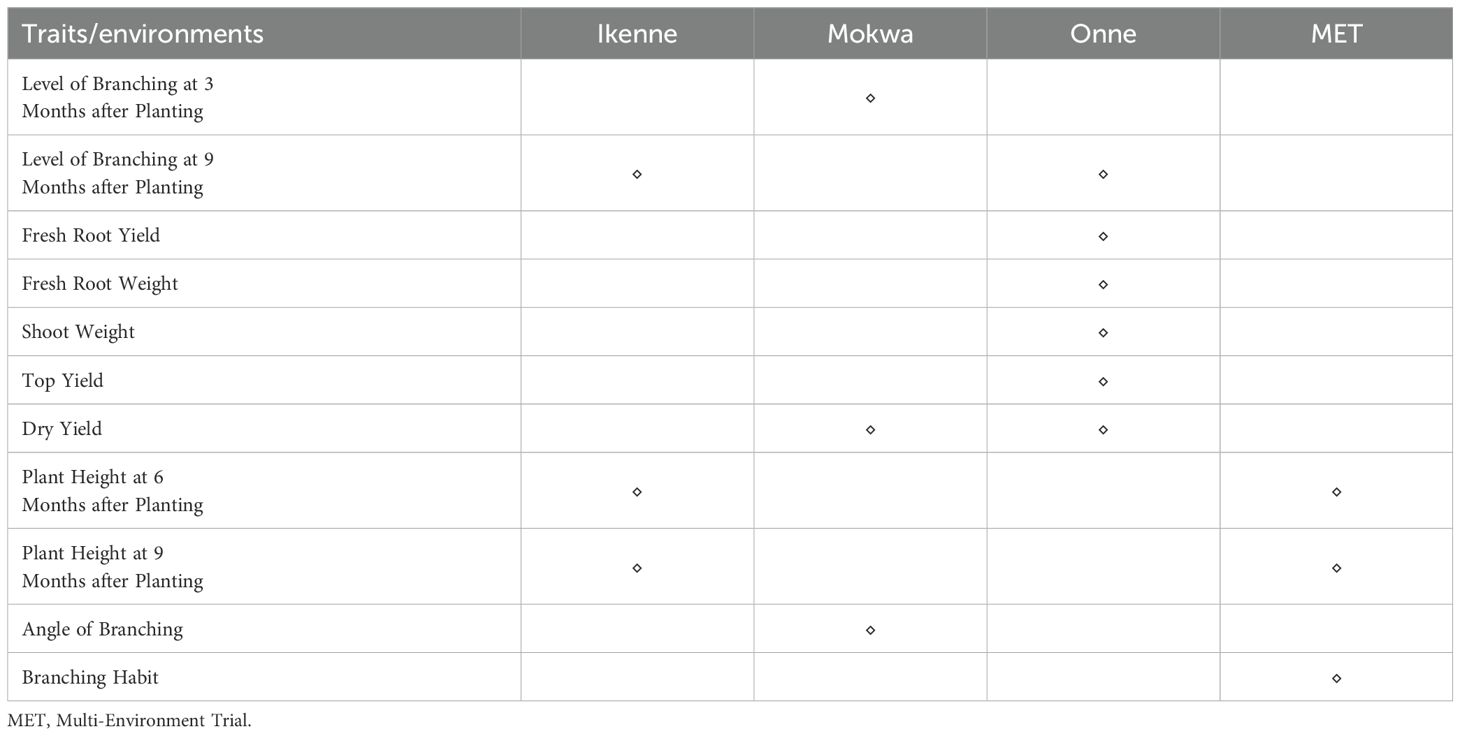
Table 3. Matrix of traits by environments of significant SNPs for plant architecture and yield traits of cassava across the test environments.
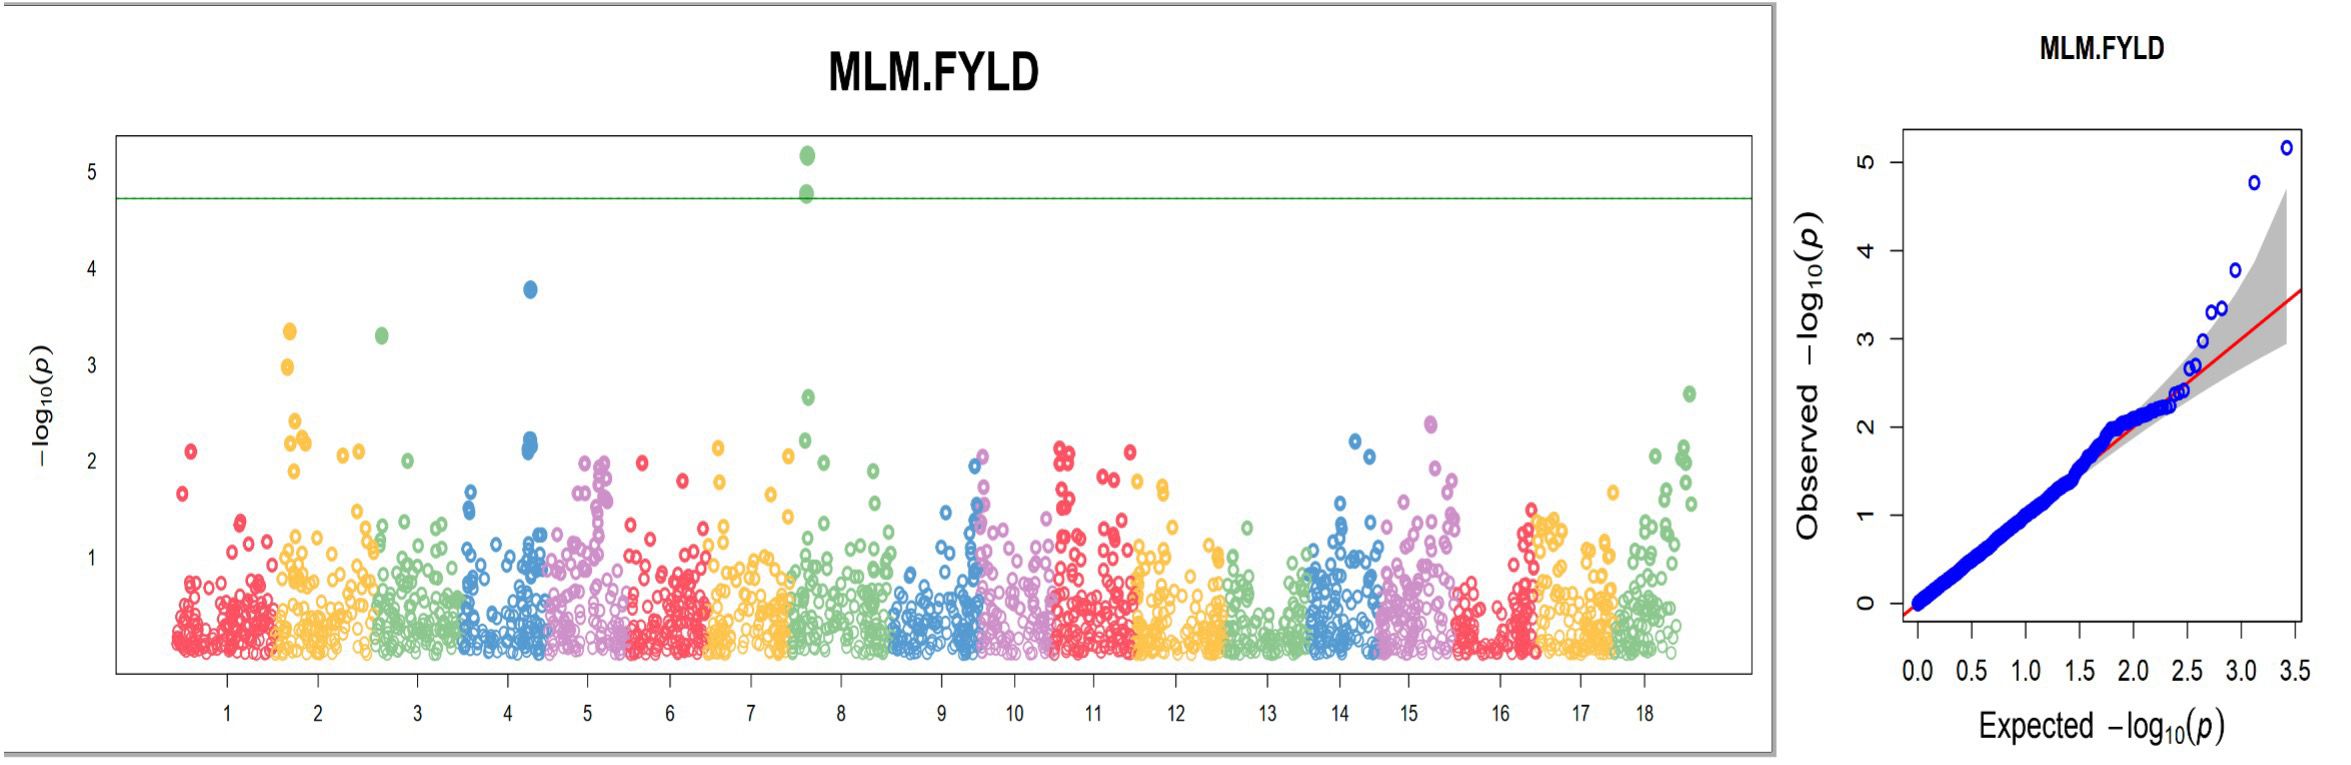
Figure 12. Manhattan and quantile–quantile (Q-Q) plots of significant MTAs for one of the nine plant architecture and yield-related traits (FYLD) from the GWAS analysis conducted on 420 cassava accessions and 2,527 SNP markers.
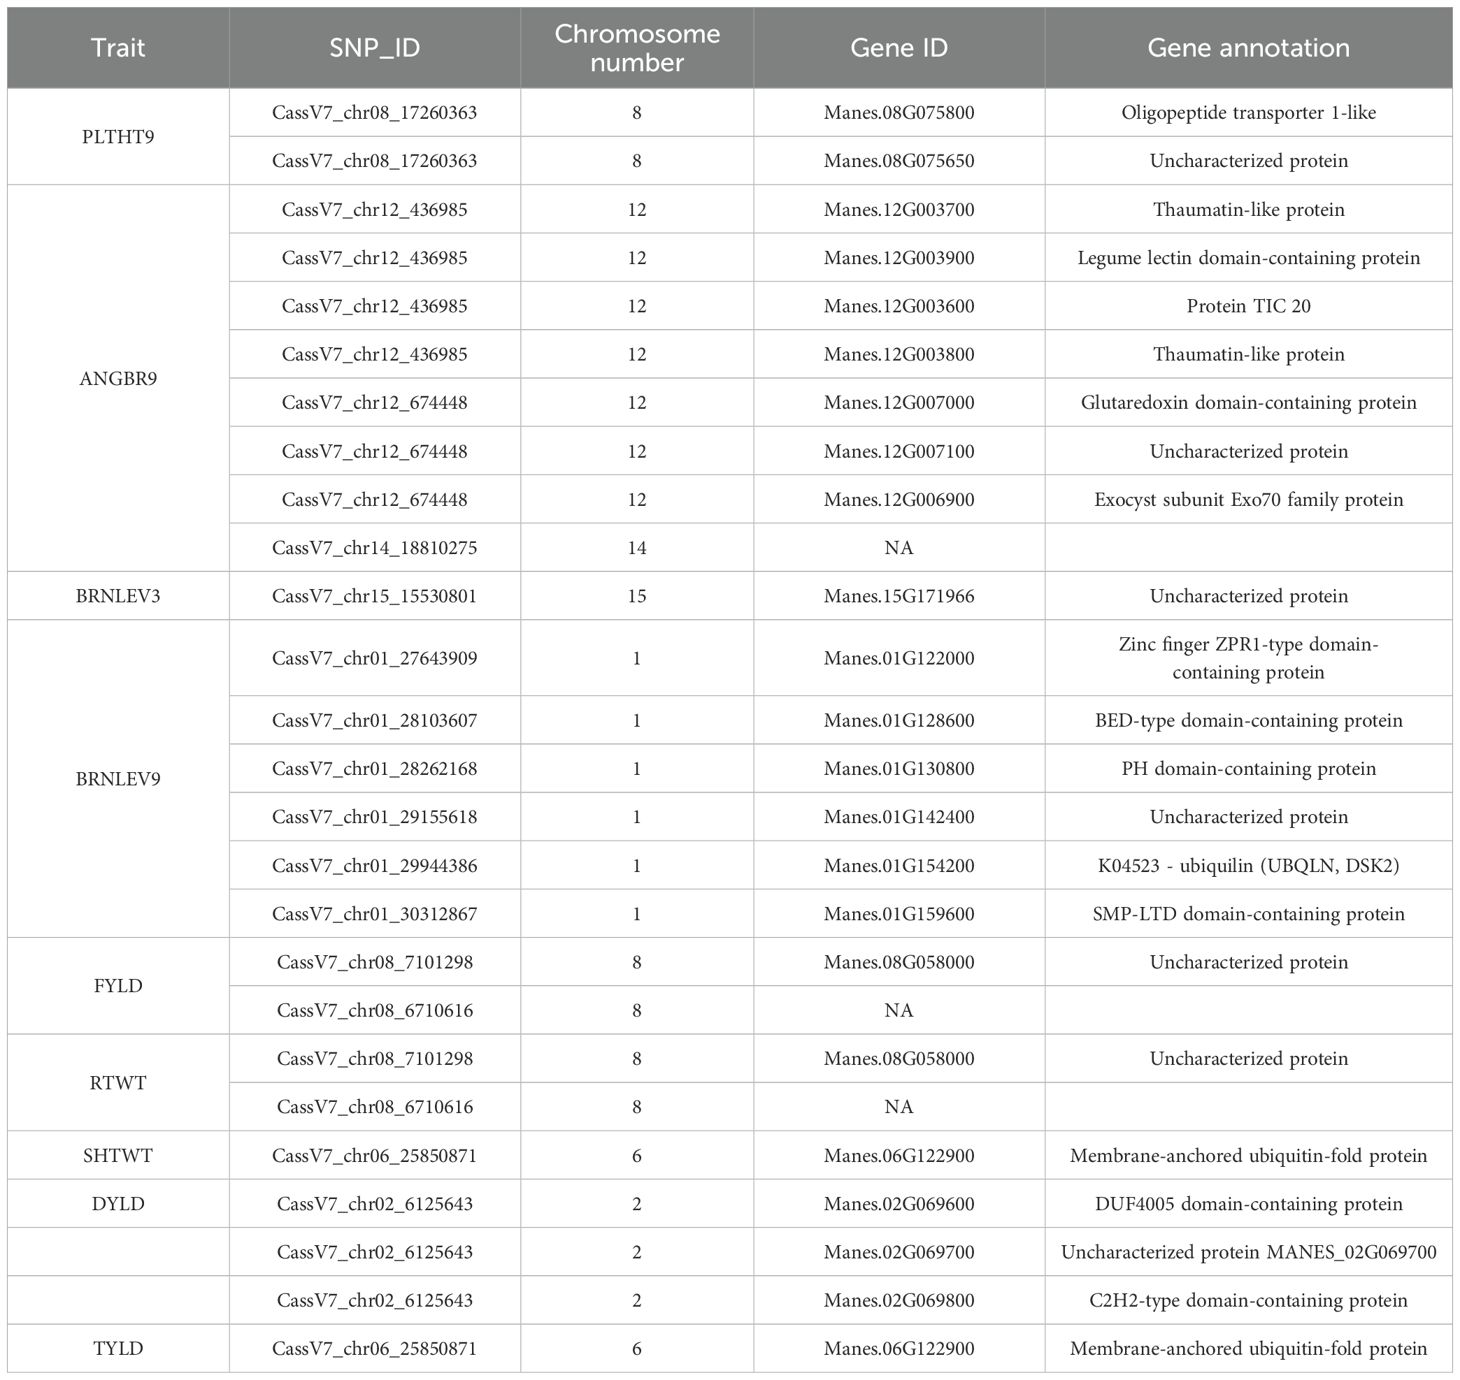
Table 4. Gene annotation of the significant SNPs for plant architecture and yield traits.
Only eight traits had significant SNP hits when DArTseq markers and the FarmCPU model were used (Table 5; Figure 13). These included six plant architecture traits (ANGBR9, PT, VR, BRNLEV6, BRNLEV9, and PPSTD9) and two yield traits (HI and DM). The 17 significant SNPs recorded for these traits were found on chromosomes 1, 3, 4, 5, 6, 8, 9, 11, 12, 15, and 16. A total of 19 putative candidate genes were identified near the significant SNPs (Table 6). Significant SNP were validated using MLMe analysis. The validation procedure confirmed the genuineness of each significant DArTag marker as a result of the mixed linear model performed in GAPIT, and the validation analyses performed in GCTA were identical. In contrast, only one of the significant SNPs on chromosome 6 detected using DArTSeq markers and the FarmCPU model (S6_21336567) was detected by the MLMe analysis conducted in GCTA. The Q-Q plots revealed a huge deflection from the observed to expected variation when DArTSeq markers and the FarmCPU model were used, whereas little or no deflection was observed when using DArTag markers and the mixed linear model. This suggests that both the SNPs and candidate genes discovered through the GWAS conducted using the DArTSeq markers and the FarmCPU model were probably artifacts.
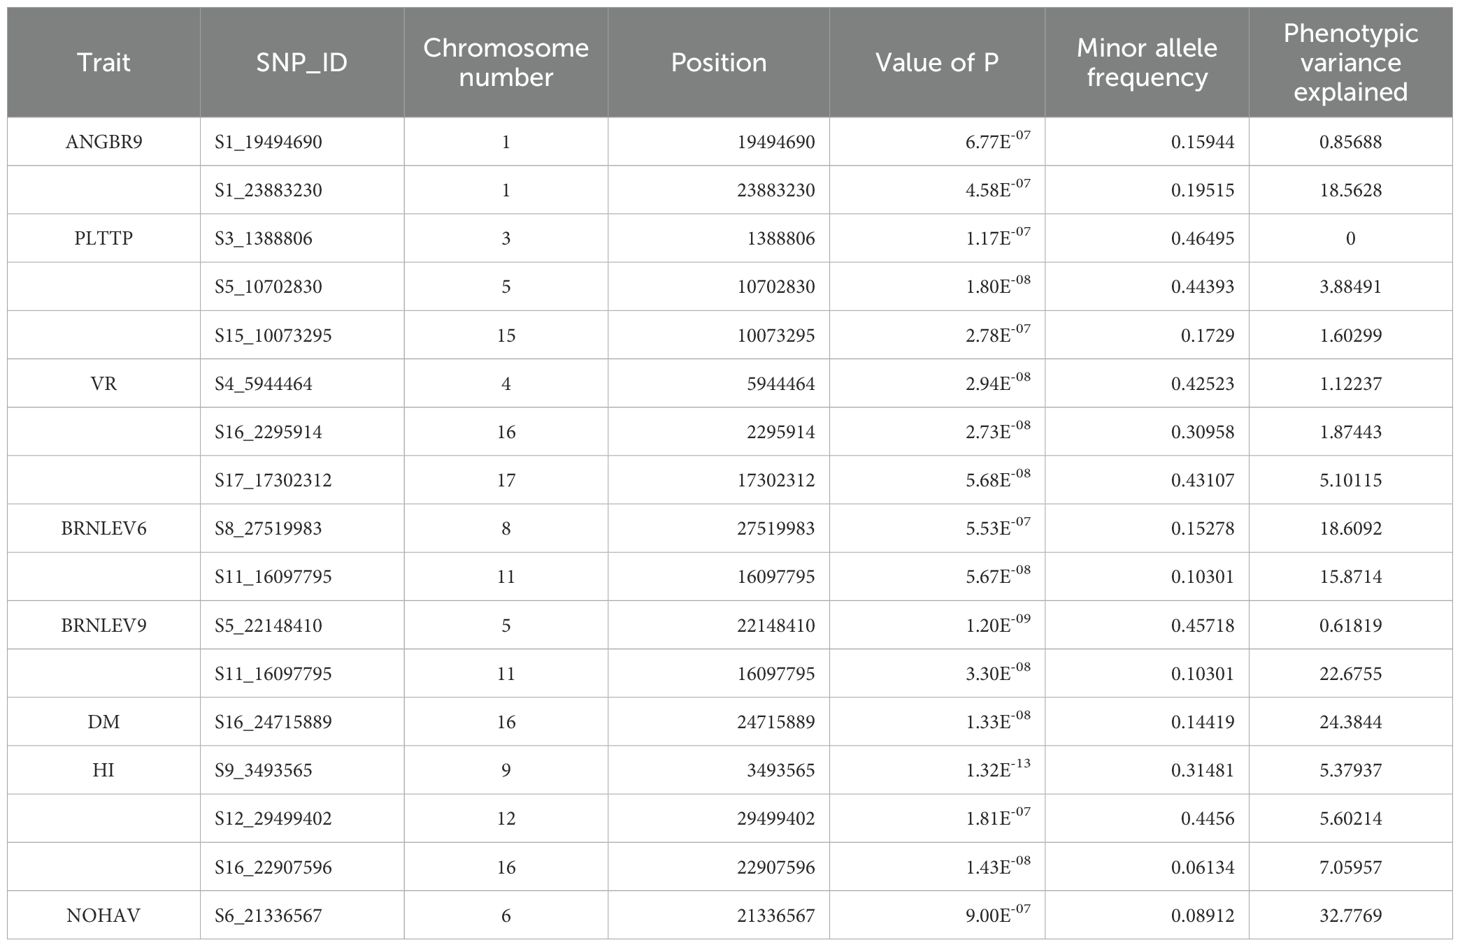
Table 5. Summary of top significant SNPs for plant architecture and yield traits of cassava.
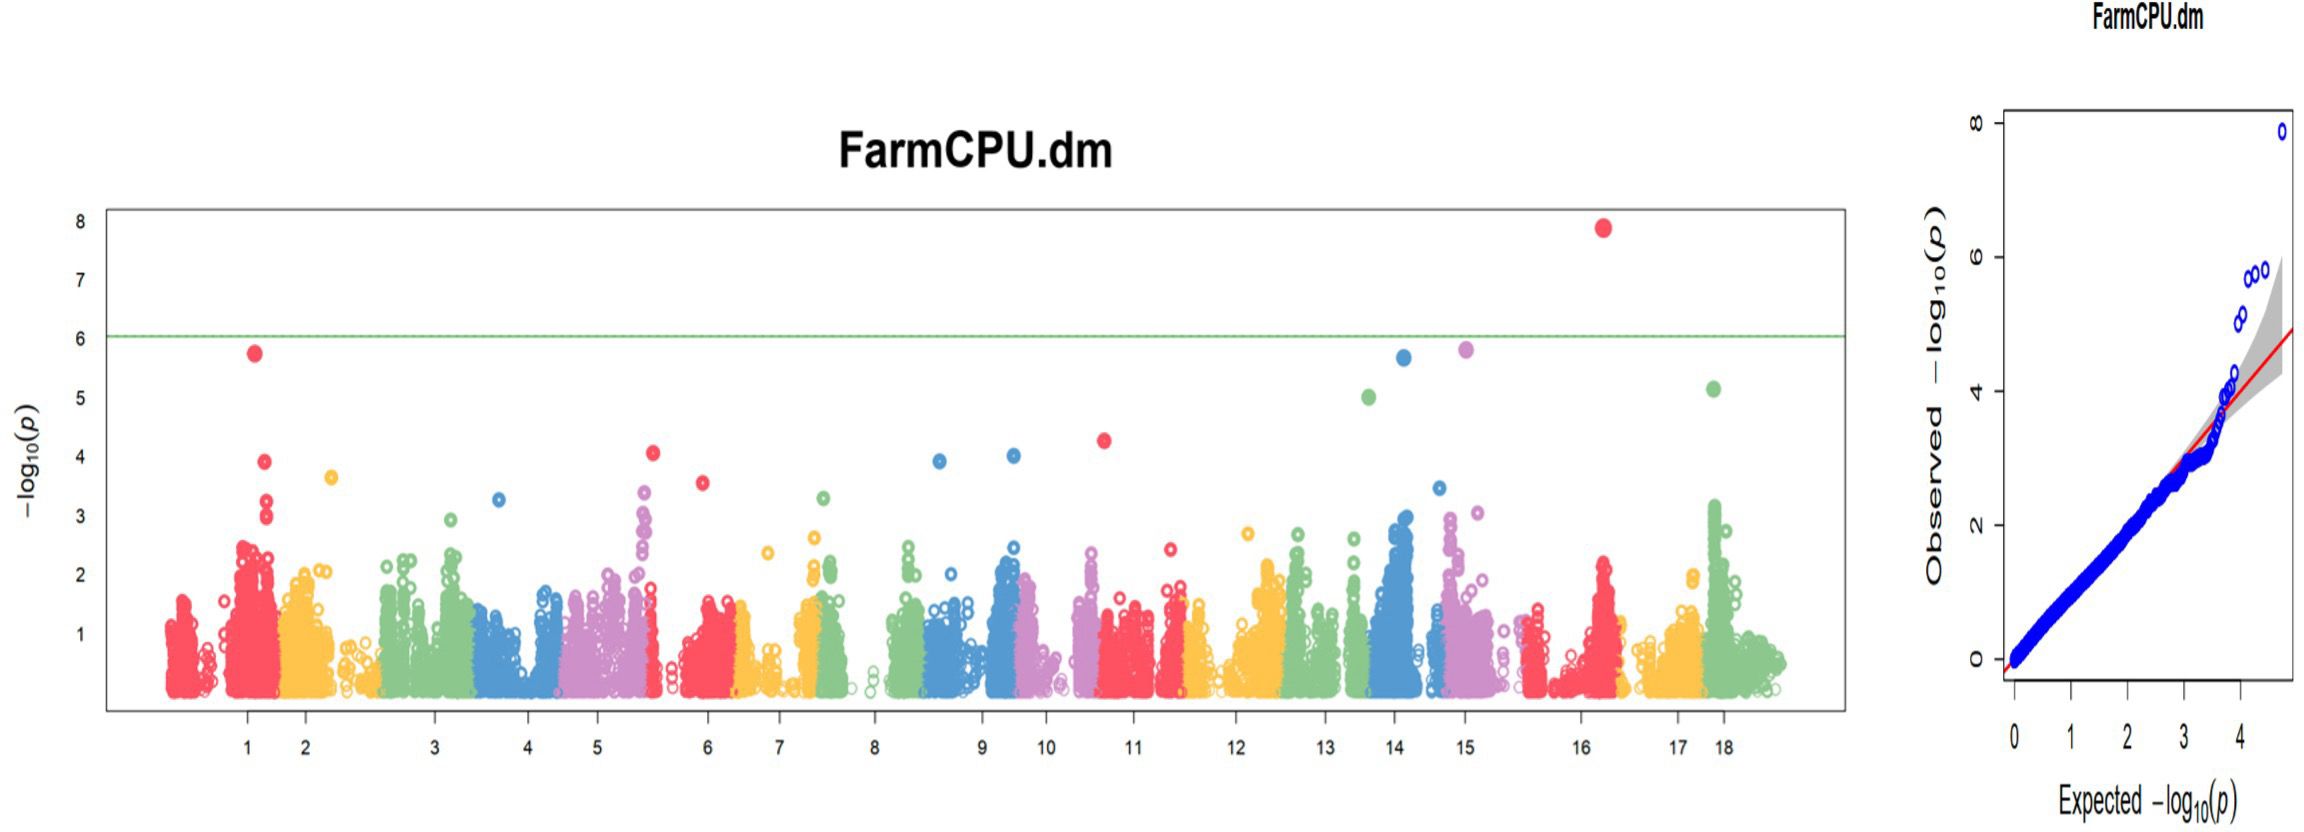
Figure 13. Manhattan and quantile–quantile (Q-Q) plots of significant MTAs for one of the nine plant architecture and yield-related traits (DM) from the GWAS analysis conducted on 420 cassava accessions and 54,574 SNP markers.
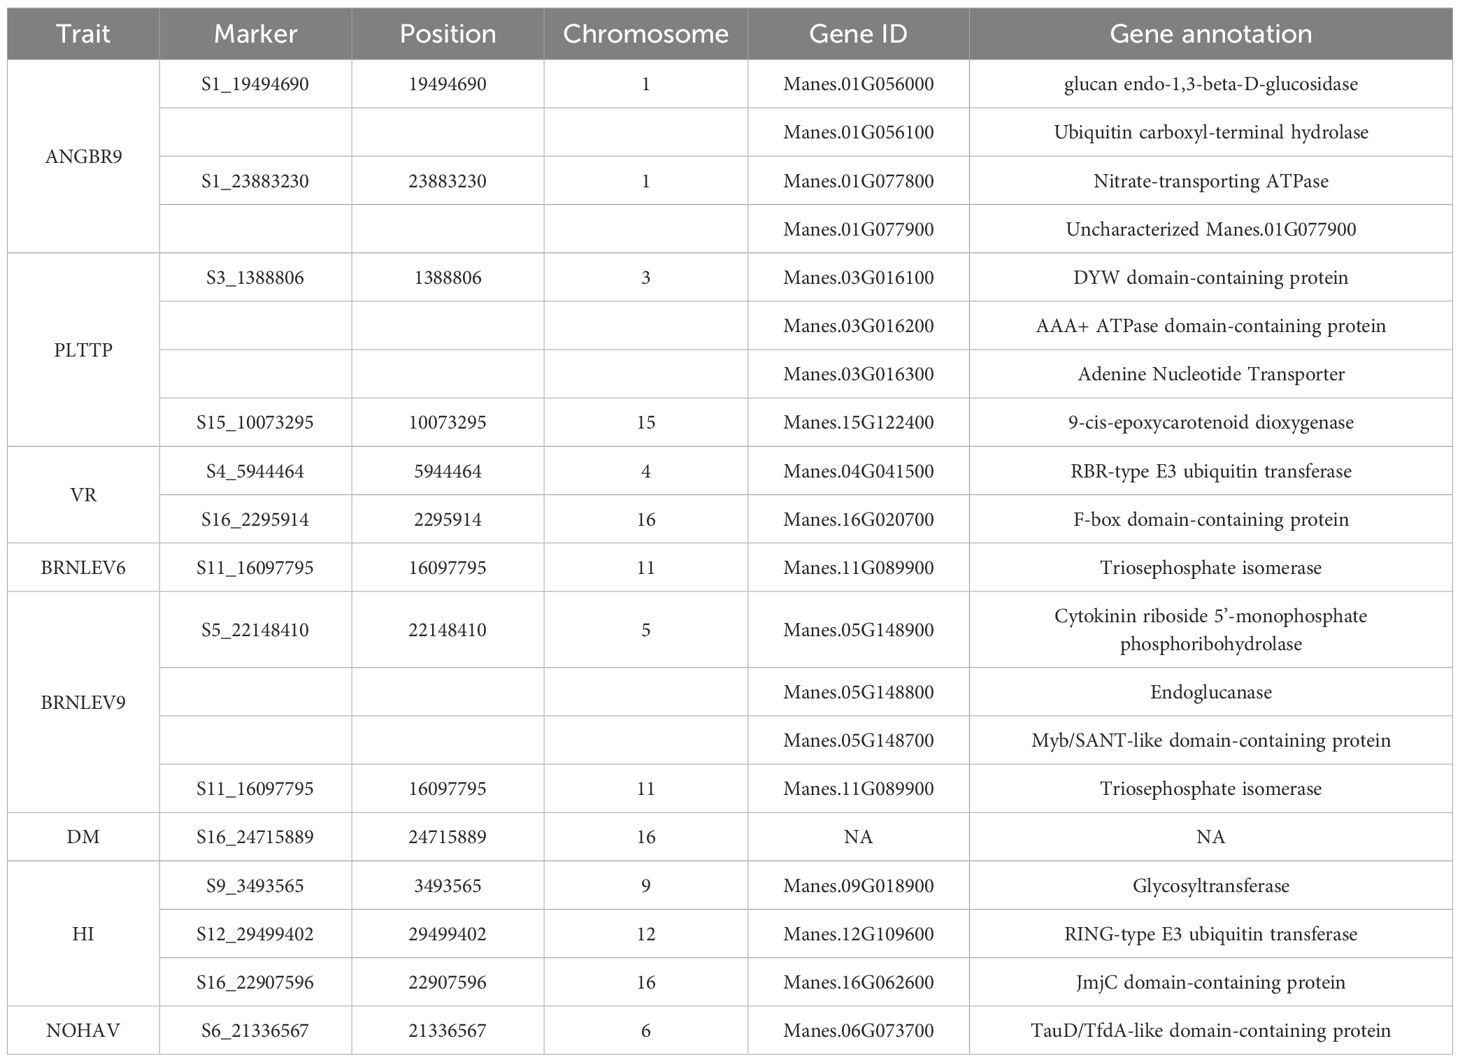
Table 6. Gene annotation of the significant SNPs for plant architecture and yield traits.
Discussion
Plant height and stem diameter are primary plant architectural traits that significantly influence the position and alignment of other plant architectural traits (Laurans et al., 2024). The negative correlation between FYLD, the primary predictor of yield, and PLTH is consistent with the conclusions of (Edet et al., 2015), who also reported a negative relationship between the two traits. This implies that sustainable improvement in FYLD productivity in cassava could be achieved by attaining a balance in the expression of these inversely related traits.
Heritability is an essential parameter in plant breeding, as it indicates the potential for the genetic improvement of a trait through selection. A couple of plant architecture and yield-related traits were reported to have moderately high to high broad-sense heritability, including FYLD (0.67), DM (0.68), HI (0.86), BRNHT6 (0.86), BRNHT9 (0.88), PLTHT9 (0.80), and SC (0.70). Similar results were reported (Santos et al., 2023) for FYLD and for DM. High SC content is one of the selling points of cassava varieties targeted for industrial use. The high value of broad-sense heritability recorded for SC in this study corroborated the findings of (Namakula and Nuwamanya, 2022), who reported a heritability value of 0.76. Given that PLTHT9, PLTHT6, STMDI9, HI, FYLD, SC, and LODG have high values of broad sense heritability (0.80), (0.83), (0.73), (0.86), (0.67), (0.7), and (0.69), respectively, there is significant potential for genetic improvement of these traits in cassava through selection, thereby making it feasible to modify these traits to develop cassava varieties with optimal architecture and increased yield.
Marker coverage and SNP density
The DArTseq marker system uses a genome complexity reduction approach, whereby restriction enzymes randomly cut at regions with high frequencies of cutting sites, resulting in an uneven SNP distribution across the genome (Kilian et al., 2012).
This results in the omission and underrepresentation of certain genomic regions, such as repetitive sequences, heterochromatic regions, and areas lacking restriction enzyme recognition sites, leading to observed gaps in genome coverage (Wenzl et al., 2004; Kilian et al., 2012; Sánchez-Sevilla et al., 2015). In contrast, DArTag employs a targeted genotyping approach, where pre-selected SNPs are evenly distributed across the genome, ensuring uniform coverage and minimizing gaps (Hardenbol et al., 2003; Hardigan et al., 2023). Large gaps, as observed with DArTseq markers, have a significant impact on GWAS results. Regions with sparse SNP coverage may not capture causal variants or nearby loci in linkage disequilibrium (LD), leading to missed associations with traits (Kilian et al., 2012; Sánchez-Sevilla et al., 2015).
Marker-trait association analysis
Subsequent to the output of the significant SNPs validation, the discussion on the GWAS would be limited to the results obtained through the GWAS conducted using the DArTag markers and the mixed linear model. GWAS is a crucial method for investigating the genetic underlining of complex plant traits (Zhu et al., 2008; Bentley et al., 2022; Susmitha et al., 2023). Of the 11 traits with significant SNPs, only ANGBR9 had significant SNPs on multiple chromosomes (chromosomes 12 and 14). This suggests that this trait is complex and influenced by multiple genes. A similar result was recorded for the angle of branching in a GWAS experiment conducted on cotton across three test environments (Shao et al., 2022) and for fresh root yield in cassava (Hohenfeld et al., 2022).
We found evidence of pleiotropy with some significant SNPs associated with multiple traits (e.g., CassV7_chr12_674448), which were recorded on chromosome 12 for both ANGBR9 and BRNHB9. This implies that the genes controlling these traits could co-segregate and be inherited together (Abah et al., 2024). reported a similar outcome for cassava, where a significant SNP (S4_8840623) was associated with the productivity of dry yield and bulking index. He also reported that these SNPs (S10_2319500, S2_1937678, and S3_3324735) independently influenced both the starch and dry matter contents.
Similarly, significant MTAs for PLTHT9, FYLD, and RTWT were found on chromosome 8, validating the results of the path coefficient analysis, where PLTHT9 had a significant positive contribution to FYLD through RTWT across the test environments with an almost absolute contribution (0.99) to FYLD in the trial at Onne (Figure 11) (Rabbi et al., 2017). also reported the colocalization of SNPs that control chromameter value, colour chart, and dry matter content in fresh cassava roots, while (Villwock et al., 2025) reported similar results for total carotenoid and dry matter contents.
Plant height is an essential component of plant architecture that influences crop productivity through its effects on planting density, amount of insolation received, and resistance to lodging (Fei et al., 2022). The efficiency of mechanical harvesting can be influenced by plant height (Yan et al., 2019). The crux of this research is based on identifying genomic regions that could be exploited to develop cassava varieties with ideal plant architecture and improved yield. The identification of these important genomic regions on chromosome 8 that control plant height (CassV7_chr08_17260363) and fresh root yield (CassV7_chr08_6710616 and CassV7_chr08_7101298) constitutes a huge leap towards the realization of the core objective of this research, aimed at unraveling the genetics of plant architecture and its effects on yield in cassava, as well as suitability for mechanized farming.
Putative candidate genes linked to marker loci for traits associated with plant architecture and yield
Of the 21 putative candidate genes identified, six were found to promote yield, plant growth, and development. These include two genes identified on the angle of branching: Manes.12G003900, which encodes a legume lectin domain-containing protein (Aleksander et al., 2023) that promotes plant growth and development and enhances plant defence mechanisms against pathogens (Katoch and Tripathi, 2021), and Manes.12G007000, which encodes a glutaredoxin domain-containing protein (Aleksander et al., 2023) that regulates gene expression and signal transduction and contributes to plant growth and development (Rouhier et al., 2006). Similarly, for plant height, we identified Manes.08G075800, which encodes an oligopeptide transporter 1-like protein (Aleksander et al., 2023). This gene is involved in plant development and adaptation to stress (Liu et al., 2012; Zhai et al., 2014). The level of branching, a measure of flowering events that the plant has undergone, is a fundamental aspect of plant architecture that influences the plant’s ability to capture light, distribute nutrients, and overall biomass production and yield potential (Pineda et al., 2020). The candidate gene associated with the level of branching, Manes.01G130800, encodes a PH (Pleckstrin Homology) domain-containing protein (Aleksander et al., 2023), which influences root development in plants through its interactions with phosphoinositides and phosphatidic acid (Lemmon, 2010). Similar to the study by (Baguma et al., 2024), on chromosome 15, we identified a genomic region linked with this trait that was approximately 3,783,500 bp apart from the one reported by (Baguma et al., 2024). The candidate gene Manes.15G171966, identified in this region in this study, is a novel candidate gene, while those reported by (Baguma et al., 2024) have well-documented functions. This novel candidate gene presents a prospect for the validation of genes involved in plant architecture and flowering in cassava breeding. Yield improvement is a critical component of all crop improvement programs. Plant breeders are continually developing new strategies and technologies to enhance crop productivity and ensure global food security. Fresh root yield and root weight are important metrics for evaluating cassava yield. The candidate gene Manes.08G058000 identified in FYLD and RTWT encodes an MYB-like (myeloblastosis) DNA-binding protein (Goodstein et al., 2014). MYB is a transcription factor that plays a crucial role in regulating various cellular processes in plants, including the cell cycle and cell morphogenesis (Ambawat et al., 2013), biotic and abiotic stress responses (Roy, 2016), secondary metabolism, such as anthocyanin biosynthesis (Roy, 2016), and plant development (Katiyar et al., 2012; Roy, 2016). Similarly, Manes.02G069600, a candidate gene identified in DYLD, encodes a C2H2-type domain-containing protein (Aleksander et al., 2023). C2H2-type domain-containing proteins affect the metabolic pathways involved in photosynthetic processes (Lakshmanan et al., 2014; Habibpourmehraban et al., 2022).
The discovered novel candidate genes Manes.12G007100 (ANGBR9), Manes.08G075650 (PLTHT9), Manes.08G058000 (FYLD and RTWT), Manes.02G069700 (DYLD), Manes.01G142400, and Manes.15G171966 (BRNLEV3 and BRNLEV9) provide insights into the genetic pathways through which these traits could be improved.
Conclusion
The genetic underpinnings of plant architecture and yield-associated traits in cassava were examined in this study through a genome-wide association study (GWAS). This investigation involved 420 cassava accessions and employed two genotyping platforms, DArTseq and DArTag, across three distinct environments. Sixteen significant, validated marker-trait associations were discovered using the DArTag markers, compared to only one reported using the DarTseq markers. This highlights the importance of maintaining a balance between the density and distribution of markers for more reliable GWAS results.
The significant marker-trait associations were linked to important genomic regions that could enhance marker-assisted selection for suitable plant architecture and increased yield in cassava breeding. These include putative candidate genes for angle of branching (7), plant height (2), level of branching (7), fresh root yield and weight (1), fresh shoot weight and top yield (1), and dry yield (3). These candidate genes exhibit various functions related to plant architecture, adaptation, yield (root development), plant growth, and stress response. Out of the 21 putative candidate genes identified in this study, six novel genes (Manes.08G075650, Manes.12G007100, Manes.15G171966, Manes.01G142400, Manes.08G058000, Manes.02G069700) were discovered. This represents a significant contribution to the existing knowledge. These findings provide a gateway for exploring the genetic control of cassava plant architecture and yield. This research output will provide cassava breeders with the genetic and molecular leverage required to fast-track cassava improvement in terms of yield, productivity, and adaptation for mechanized cultivation and industrial use.
Data availability statement
The raw data supporting the conclusions of this article will be made available by the authors, without undue reservation.
Author contributions
AO: Formal analysis, Writing – review & editing, Validation, Writing – original draft, Methodology, Investigation, Data curation, Conceptualization. DD: Conceptualization, Supervision, Methodology, Writing – review & editing. EM: Conceptualization, Formal analysis, Methodology, Writing – review & editing. SO: Writing – review & editing, Supervision. PT: Supervision, Writing – review & editing. ED: Writing – review & editing, Supervision. CE: Supervision, Funding acquisition, Writing – review & editing, Conceptualization. IR: Writing – review & editing, Funding acquisition, Formal analysis, Conceptualization, Supervision.
Funding
The author(s) declare financial support was received for the research and/or publication of this article. Abiodun Fatai Olayinka carried out this research as part of his PhD studies in Plant Breeding at WACCI, University of Ghana, Legon, Accra, Ghana. This study was funded by the NextGen Cassava Breeding Project (Grant INV-007637), which received financial support from the Bill and Melinda Gates Foundation (BMGF) and the UK Foreign, Commonwealth & Development Office (FCDO).
Acknowledgments
We appreciate the efforts and support received from the efficient and industrious members of the staff of the cassava breeding program at IITA, Ibadan during field evaluation and laboratory analysis.
Conflict of interest
The authors declare that the research was conducted in the absence of any commercial or financial relationships that could be construed as a potential conflict of interest.
Generative AI statement
The author(s) declare that no Generative AI was used in the creation of this manuscript.
Any alternative text (alt text) provided alongside figures in this article has been generated by Frontiers with the support of artificial intelligence and reasonable efforts have been made to ensure accuracy, including review by the authors wherever possible. If you identify any issues, please contact us.
Publisher’s note
All claims expressed in this article are solely those of the authors and do not necessarily represent those of their affiliated organizations, or those of the publisher, the editors and the reviewers. Any product that may be evaluated in this article, or claim that may be made by its manufacturer, is not guaranteed or endorsed by the publisher.
Supplementary material
The Supplementary Material for this article can be found online at: https://www.frontiersin.org/articles/10.3389/fpls.2025.1660789/full#supplementary-material
References
Aalborg, T., Sverrisdóttir, E., Kristensen, H. T., and Nielsen, K. L. (2024). The effect of marker types and density on genomic prediction and GWAS of key performance traits in tetraploid potato. Front. Plant Sci. 15, 1340189. doi: 10.3389/fpls.2024.1340189
Abah, S. P., Mbe, J. O., Dzidzienyo, D. K., Njoku, D., Onyeka, J., Danquah, E. Y., et al. (2024). Determination of genomic regions associated with early storage root formation and bulking in cassava. Front. Plant Sci. 15, 1391452. doi: 10.3389/fpls.2024.1391452
Aghogho, C. I., Kayondo, S. I., Eleblu, S. J., Ige, A., Asante, I., Offei, S. K., et al. (2024). Genome-wide association study for yield and quality of granulated cassava processed product. Plant Genome 17, e20469. doi: 10.1002/tpg2.20469
Aleksander, S. A., Balhoff, J., Carbon, S., Cherry, J. M., Drabkin, H. J., Ebert, D., et al. (2023). The gene ontology knowledgebase in 2023. Genetics 224, iyad031. doi: 10.1093/genetics/iyad031
Alexander, D. H., Novembre, J., and Lange, K. (2009). Fast model-based estimation of ancestry in unrelated individuals. Genome Res. 19, 1655–1664. doi: 10.1101/gr.094052.109
Alvarado, G., Rodríguez, F. M., Pacheco, A., Burgueño, J., Crossa, J., Vargas, M., et al. (2020). META-R: A software to analyze data from multi-environment plant breeding trials. Crop J. 8, 745–756. doi: 10.1016/j.cj.2020.03.010
Alves, A. A. C. (2002). “Cassava botany and physiology,” in Cassava: biology, production and utilization. Eds. Hillocks, R. J., Tresh, J. M., and Bellotti, A. C. (CABI Publishing, London), 67–89. doi: 10.1079/9780851995243.0067
Ambawat, S., Sharma, P., Yadav, N. R., and Yadav, R. C. (2013). MYB transcription factor genes as regulators for plant responses: an overview. Physiol. Mol. Biol. Plants 19, 307–321. doi: 10.1007/s12298-013-0179-1
Baguma, J. K., Mukasa, S. B., Nuwamanya, E., Alicai, T., Omongo, C. A., Ochwo-Ssemakula, M., et al. (2024). Identification of genomic regions for traits associated with flowering in cassava (Manihot esculenta Crantz). Plants 13, 796. doi: 10.3390/plants13060796
Bates, D., Mächler, M., Bolker, B., and Walker, S. (2015). Fitting linear mixed-effects models using lme4. J. Stat. Software 67, 1–48. doi: 10.18637/jss.v067.i01
Bentley, A. R., Chen, C., and D’Agostino, N. (2022). Genome wide association studies and genomic selection for crop improvement in the era of big data. Front. Genet. 13, 873060. doi: 10.3389/fgene.2022.873060
Chang, C. C., Chow, C. C., Tellier, L. C., Vattikuti, S., Purcell, S. M., and Lee, J. J. (2015). Second-generation PLINK: rising to the challenge of larger and richer datasets. Gigascience 4, s13742–s13015. doi: 10.1186/s13742-015-0047-8
Dash, G. K., Sabarinathan, S., Donde, R., Gouda, G., Gupta, M. K., Behera, L., et al. (2021). “Status and prospectives of genome-wide association studies in plants,” in Bioinformatics in rice research: theories and techniques (Springer Singapore, Singapore), 413–457.
Edet, M. A., Tijani-Eniola, H., Lagoke, S. T. O., and Tarawali, G. (2015). Relationship of cassava growth parameters with yield, yield related components and harvest time in Ibadan, Southwestern Nigeria. J. Natural Sci. Res. 5, 87–92.
Epskamp, S., Stuber, S., Nak, J., Veenman, M., and Jorgensen, T. D. (2019). semPlot: Path diagrams and visual analysis of various SEM packages’ output. R Package version 1. doi: 10.32614/CRAN.package.semPlot
FAO (2013). Cassava, a 21st century crop. Save and Grow: Cassava, a Guide to Sustainable Production Intensification. Available online at: https://www.fao.org/3/i3278e/i3278e.pdf (Accessed July 1, 2023).
FAO (2020). Food and agriculture organization of the united nations: crops (Rome, Italy: FAOSTAT). Available online at: https://www.fao.org/faostat/en/data/QCL (Accessed July 1, 2023).
FAO (2021). Food and agriculture organization of the United Nations. World’s Area Harvested and Production Quantity (Rome, Italy: FAOSTAT). Available online at: http://www.fao.org/faostat/en/ (Accessed July 1, 2023).
Fei, J., Lu, J., Jiang, Q., Liu, Z., Yao, D., Qu, J., et al. (2022). Maize plant architecture trait QTL mapping and candidate gene identification based on multiple environments and double populations. BMC Plant Biol. 22, 110. doi: 10.1186/s12870-022-03470-7
Fukuda, W. M. G., Guevara, C. L., Kawuki, R., and Ferguson, M. E. (2010). Selected morphological and agronomic descriptors for the characterization of cassava (Oyo State, Nigeria: IITA).
Galili, T. (2015). dendextend: an R package for visualizing, adjusting and comparing trees of hierarchical clustering. Bioinformatics 31, 3718–3720. doi: 10.1093/bioinformatics/btv428
Goodstein, D., Batra, S., Carlson, J., Hayes, R., Phillips, J., and Shu, S. (2014). Phytozome comparative plant genomics portal (Berkeley, California, United States: Lawrence Berkeley National Laboratory).
Habibpourmehraban, F., Atwell, B. J., and Haynes, P. A. (2022). Unique and shared proteome responses of rice plants (Oryza sativa) to individual abiotic stresses. Int. J. Mol. Sci. 23, 15552. doi: 10.3390/ijms232415552
Hardenbol, P., Banér, J., Jain, M., Nilsson, M., Namsaraev, E. A., Karlin-Neumann, G. A., et al. (2003). Multiplexed genotyping with sequence-tagged molecular inversion probes. Nat. Biotechnol. 21, 673–678. doi: 10.1038/nbt821
Hardigan, M. A., Feldmann, M. J., Carling, J., Zhu, A., Kilian, A., Famula, R. A., et al. (2023). A medium-density genotyping platform for cultivated strawberry using DArTag technology. Plant Genome 16, e20399. doi: 10.1002/tpg2.20399
Hohenfeld, C. S., Passos, A. R., de Carvalho, H. W. L., de Oliveira, S. A. S., and de Oliveira, E. J. (2022). Genome-wide association study and selection for field resistance to cassava root rot disease and productive traits. PloS One 17, e0270020. doi: 10.1371/journal.pone.0270020
Katiyar, A., Smita, S., Lenka, S. K., Rajwanshi, R., Chinnusamy, V., and Bansal, K. C. (2012). Genome-wide classification and expression analysis of MYB transcription factor families in rice and Arabidopsis. BMC Genomics 13, 544. doi: 10.1186/1471-2164-13-544
Katoch, R. and Tripathi, A. (2021). Research advances and prospects of legume lectins. J. Biosci. 46, 104. doi: 10.1007/s12038-021-00225-8
Kilian, A., Wenzl, P., Huttner, E., Carling, J., Xia, L., Blois, H., et al. (2012). “Diversity arrays technology: a generic genome profiling technology on open platforms,” in Data production and analysis in population genomics: Methods and protocols (Humana Press, Totowa, NJ), 67–89.
Lakshmanan, M., Mohanty, B., Lim, S. H., Ha, S. H., and Lee, D. Y. (2014). Metabolic and transcriptional regulatory mechanisms underlying the anoxic adaptation of rice coleoptile. AoB Plants 6, plu026. doi: 10.1093/aobpla/plu026
Laurans, M., Munoz, F., Charles-Dominique, T., Heuret, P., Fortunel, C., Isnard, S., et al. (2024). Why incorporate plant architecture into trait-based ecology? Trends Ecol. Evol. 39, 524–536. doi: 10.1016/j.tree.2023.11.011
Lauri, P.É. and Lespinasse, J. M. (2001). Genotype of apple trees affects growth and fruiting responses to shoot bending at various times of year. J. Am. Soc. Hortic. Sci. 126, 169–174. doi: 10.21273/JASHS.126.2.169
Lemmon, M. A. (2010). “Pleckstrin homology (PH) domains,” in Handbook of cell signaling (London, United Kingdom: Academic Press), 1093–1101.
Li, S., Cui, Y., Zhou, Y., Luo, Z., Liu, J., and Zhao, M. (2017). The industrial applications of cassava: current status, opportunities and prospects. J. Sci. Food Agric. 97, 2282–2290. doi: 10.1002/jsfa.8287
Lipka, A. E., Tian, F., Wang, Q., Peiffer, J., Li, M., Bradbury, P. J., et al. (2012). GAPIT: genome association and prediction integrated tool. Bioinformatics 28, 2397–2399. doi: 10.1093/bioinformatics/bts444
Liu, T., Zeng, J., Xia, K., Fan, T., Li, Y., Wang, Y., et al. (2012). Evolutionary expansion and functional diversification of oligopeptide transporter gene family in rice. Rice 5, 12. doi: 10.1186/1939-8433-5-12
Liu, X., Huang, M., Fan, B., Buckler, E. S., and Zhang, Z. (2016). Iterative usage of fixed and random effect models for powerful and efficient genome-wide association studies. PloS Genet. 12, e1005767. doi: 10.1371/journal.pgen.1005767
Lu, X., Liu, P., Tu, L., Guo, X., Wang, A., Zhu, Y., et al. (2024). Joint-GWAS, linkage mapping, and transcriptome analysis to reveal the genetic basis of plant architecture-related traits in maize. Int. J. Mol. Sci. 25, 2694. doi: 10.3390/ijms25052694
Mansaray, A., Babatunde, K. A., Yormah, T. B. H., Marie, Y., and Rahman, C. A. (2020). Effect of spatial arrangement, plant architecture and cropping system on the growth, yield and yield-related components of cassava (Maniho esculenta L.). J. Global Agric. Ecol. 10, 1–7.
Mbe, J. O., Dzidzienyo, D. K., Abah, S. P., Njoku, D. N., Onyeka, J., Tongoona, P., et al. (2024). Novel SNP markers and other stress-related genomic regions associated with nitrogen use efficiency in cassava. Front. Plant Sci. 15, 1376520. doi: 10.3389/fpls.2024.1376520
Mora Moreno, R. E., Soto, J. C., and López, C. (2016). Identification of QTLs associated to plant architecture in cassava (Manihot esculenta crantz). Acta Biológica Colombiana 21, 99–109. doi: 10.15446/abc.v21n1.49251
Morgil, H., Gercek, Y. C., Tulum, I., Morgil, H., Gercek, Y. C., and Tulum, I. (2020). “Single nucleotide polymorphisms (SNPs) in plant genetics and breeding,” in The recent topics in genetic polymorphisms (London, England, United Kingdom: IntechOpen).
Namakula, F. B. and Nuwamanya, E. (2022). Genetic variability and Heritability of starch content among white fleshed and Provitamin A cassava in Uganda. Afr. J. Rural Dev. 7, 201–208.
Nweke, F. I. (2004). “The cassava transformation in Africa,” in New challenges in the cassava transformation in Nigeria and Ghana. Ed. Nweke, F. I. (International Institute of Tropical Agriculture (IITA, Ibadan, Nigeria), 1–15.
OkogBenin, E. and Fregene, M. (2003). Genetic mapping of QTLs affecting productivity and plant architecture in a full-sib cross from non-inbred parents in Cassava (Manihot esculents Crantz). Theor. Appl. Genet. 107, 1452–1462. doi: 10.1007/s00122-003-1383-0
Panahi, B., Jalaly, H. M., and Hamid, R. (2024). Using next-generation sequencing approach for discovery and characterization of plant molecular markers. Curr. Plant Biol. 40, 100412. doi: 10.1016/j.cpb.2024.100412
Patiño, B. O., Cadavid López, L. F., García, M., and Alcalde, C. (2002). Mechanized systems for planting and harvesting cassava (Manihot esculenta crantz) Vol. 3 (Cali, Colombia: Cassava in the Third Millennium), 74–94.
Pineda, M., Yu, B., Tian, Y., Morante, N., Salazar, S., Hyde, P. T., et al. (2020). Effect of pruning young branches on fruit and seed set in cassava. Front. Plant Sci. 11, 1107. doi: 10.3389/fpls.2020.01107
Purcell, S., Neale, B., Todd-Brown, K., Thomas, L., Ferreira, M. A., Bender, D., et al. (2007). PLINK: a tool set for whole-genome association and population-based linkage analyses. Am. J. Hum. Genet. 81, 559–575. doi: 10.1086/519795
Rabbi, I. Y., Udoh, L. I., Wolfe, M., Parkes, E. Y., Gedil, M. A., Dixon, A., et al. (2017). Genome-wide association mapping of correlated traits in cassava: dry matter and total carotenoid content. Plant Genome 10, plantgenome2016–09. doi: 10.3835/plantgenome2016.09.0094
R Core Team (2020). R: A language and environment for statistical computing (Vienna, Austria: R Foundation for Statistical Computing).
Rodriguez-Alvarez, M. X., Boer, M. P., van Eeuwijk, F. A., and Eilers, P. H. (2018). Correcting for spatial heterogeneity in plant breeding experiments with P-splines. Spatial Stat 23, 52–71. doi: 10.1016/j.spasta.2017.10.003
Rosseel, Y. (2012). lavaan: An R package for structural equation modeling. J. Stat. Software 48, 1–36. doi: 10.18637/jss.v048.i02
Rouhier, N., Couturier, J., and Jacquot, J. P. (2006). Genome-wide analysis of plant glutaredoxin systems. J. Exp. Bot. 57, 1685–1696. doi: 10.1093/jxb/erl001
Roy, S. (2016). Function of MYB domain transcription factors in abiotic stress and epigenetic control of stress response in plant genome. Plant Signaling Behav. 11, e1117723. doi: 10.1080/15592324.2015.1117723
Rymaszewski, W., Vile, D., Bediee, A., Dauzat, M., Luchaire, N., Kamrowska, D., et al. (2017). Stress-related gene expression reflects morphophysiological responses to water deficit. Plant Physiol. 174, 1913–1930. doi: 10.1104/pp.17.00318
Sánchez-Sevilla, J. F., Horvath, A., Botella, M. A., Gaston, A., Folta, K., Kilian, A., et al. (2015). Diversity arrays technology (DArT) marker platforms for diversity analysis and linkage mapping in a complex crop, the octoploid cultivated strawberry (Fragaria× ananassa). PloS One 10, e0144960.
Santos, V. D. S., Fukuda, W. M. G., Oliveira, L. A. D., Pereira, M. E. C., Nuti, M. R., Carvalho, J. L. V. D., et al. (2023). Genetic parameters considering traits of importance for cassava biofortification. Crop Breed. Appl. Biotechnol. 23, e447923211. doi: 10.1590/1984-70332023v23n2a23
Shao, P., Peng, Y., Wu, Y., Wang, J., Pan, Z., Yang, Y., et al. (2022). Genome-wide association study and transcriptome analysis reveal key genes controlling fruit branch angle in cotton. Front. Plant Sci. 13, 988647. doi: 10.3389/fpls.2022.988647
Spindel, J., Begum, H., Akdemir, D., Virk, P., Collard, B., Redona, E., et al. (2015). Genomic selection and association mapping in rice (Oryza sativa): effect of trait genetic architecture, training population composition, marker number and statistical model on accuracy of rice genomic selection in elite, tropical rice breeding lines. PloS Genet. 11, e1004982. doi: 10.1371/journal.pgen.1004982
Srisawad, N., Sraphet, S., Suksee, N., Boontung, R., Smith, D. R., and Triwitayakorn, K. (2023). Use of Diversity Arrays Technology (DArT) for detection of QTL underlying plant architecture and yield-related traits in cassava. J. Crop Improvement 37, 99–18. doi: 10.1080/15427528.2022.2058668
Susmitha, P., Kumar, P., Yadav, P., Sahoo, S., Kaur, G., Pandey, M. K., et al. (2023). Genome-wide association study as a powerful tool for dissecting competitive traits in legumes. Front. Plant Sci. 14, 1123631. doi: 10.3389/fpls.2023.1123631
Tang, D., Chen, M., Huang, X., Zhang, G., Zeng, L., Zhang, G., et al. (2023). SRplot: A free online platform for data visualization and graphing. PloS One 18, e0294236. doi: 10.1371/journal.pone.0294236
Uffelmann, E., Huang, Q. Q., Munung, N. S., De Vries, J., Okada, Y., Martin, A. R., et al. (2021). Genome-wide association studies. Nat. Rev. Methods Primers 1, 59. doi: 10.1038/s43586-021-00056-9
Villwock, S. S., Parkes, E. Y., Nkouaya Mbanjo, E. G., Rabbi, I. Y., and Jannink, J. L. (2025). Bivariate genome-wide association study reveals polygenic contributions to covariance between total carotenoid and dry matter contents in yellow-fleshed cassava (Manihot esculenta). bioRxiv, 2025–2003.
Wei, T. and Simko, V. (2021). An introduction to corrplot package. R Packag. Vienna, Austria: R Foundation for Statistical Computing (via CRAN).
Wenzl, P., Carling, J., Kudrna, D., Jaccoud, D., Huttner, E., Kleinhofs, A., et al. (2004). Diversity Arrays Technology (DArT) for whole-genome profiling of barley. Proc. Natl. Acad. Sci. 101, 9915–9920. doi: 10.1073/pnas.0401076101
Wickham, H. (2016). “Programming with ggplot2,” in Ggplot2: elegant graphics for data analysis (Springer International Publishing, Cham), 241–253.
Yan, W., Du, M., Zhao, W., Li, F., Wang, X., Eneji, A. E., et al. (2019). Relationships between plant architecture traits and cotton yield within the plant height range of 80–120 cm desired for mechanical harvesting in the Yellow River Valley of China. Agronomy 9, 587. doi: 10.3390/agronomy9100587
Yang, J., Lee, S. H., Goddard, M. E., and Visscher, P. M. (2011). GCTA: a tool for genome-wide complex trait analysis. Am. J. Hum. Genet. 88, 76–82. doi: 10.1016/j.ajhg.2010.11.011
Yang, G., Pan, Y., Pan, W., Song, Q., Zhang, R., Tong, W., et al. (2024). Combined GWAS and eGWAS reveals the genetic basis underlying drought tolerance in emmer wheat (Triticum turgidum L.). New Phytol. 242, 2115–2131. doi: 10.1111/nph.19589
Yang, J., Zaitlen, N. A., Goddard, M. E., Visscher, P. M., and Price, A. L. (2014). Advantages and pitfalls in the application of mixed-model association methods. Nat. Genet. 46, 100–106. doi: 10.1038/ng.2876
Yu, M., Liu, Z. H., Yang, B., Chen, H., Zhang, H., and Hou, D. B. (2020). The contribution of photosynthesis traits and plant height components to plant height in wheat at the individual quantitative trait locus level. Sci. Rep. 10, 1–10. doi: 10.1038/s41598-020-69138-0
Zhai, Z., Gayomba, S. R., Jung, H. I., Vimalakumari, N. K., Piñeros, M., Craft, E., et al. (2014). OPT3 is a phloem-specific iron transporter that is essential for systemic iron signaling and redistribution of iron and cadmium in Arabidopsis. Plant Cell 26, 2249–2264. doi: 10.1105/tpc.114.123737
Zhang, Z., Ersoz, E., Lai, C. Q., Todhunter, R. J., Tiwari, H. K., Gore, M. A., et al. (2010). Mixed linear model approach adapted for genome-wide association studies. Nat. Genet. 42, 355–360. doi: 10.1038/ng.546
Zhang, Y., Yu, C., Lin, J., Liu, J., Liu, B., Wang, J., et al. (2017). OsMPH1 regulates plant height and improves grain yield in rice. PloS One 12, e0180825. doi: 10.1371/journal.pone.0180825
Keywords: SNP markers, Manihot esculenta Crantz, mechanical farming, DArTseq, DArTag, novel genes
Citation: Olayinka AF, Dzidzienyo DK, Mbanjo EGN, Offei SK, Tongoona PB, Danquah EY, Egesi C and Rabbi IY (2025) Genome-wide association study identifies novel genes for plant architecture and yield traits in cassava (Manihot esculenta Crantz). Front. Plant Sci. 16:1660789. doi: 10.3389/fpls.2025.1660789
Received: 06 July 2025; Accepted: 21 August 2025;
Published: 10 September 2025.
Edited by:
William Underwood, Agricultural Research Service (USDA), United StatesReviewed by:
Simon Peter Abah, National Root Crops Research Institute (NRCRI), NigeriaKenneth Fafa Egbadzor, Ho Polytechnic, Ghana
Copyright © 2025 Olayinka, Dzidzienyo, Mbanjo, Offei, Tongoona, Danquah, Egesi and Rabbi. This is an open-access article distributed under the terms of the Creative Commons Attribution License (CC BY). The use, distribution or reproduction in other forums is permitted, provided the original author(s) and the copyright owner(s) are credited and that the original publication in this journal is cited, in accordance with accepted academic practice. No use, distribution or reproduction is permitted which does not comply with these terms.
*Correspondence: Daniel Kwadjo Dzidzienyo, ZGR6aWR6aWVueW9Ad2FjY2kudWcuZWR1Lmdo