 Siqi Zhang1
 Zhongwei Tian
- 1Institute of Agricultural Information Technology, Henan Academy of Agricultural Sciences, Zhengzhou, China
- 2College of Plant Protection, Henan Agricultural University, Zhengzhou, China
- 3Key Laboratory of Crop Physiology Ecology and Production Management, Ministry of Agriculture/College of Agriculture, Nanjing Agricultural University, Nanjing, China
- 4Huanghuaihai Key Laboratory of Intelligent Agricultural Technology, Ministry of Agriculture and Rural Areas, Zhengzhou, China
Although the source-sink relationship is an intrinsic factor affecting crop photosynthesis, the response of different source-sink types to nitrogen (N) availability in photoprotection and photosynthetic efficiency is still unclear. This study investigates the physiological mechanisms underlying differences in photosynthetic capacity and photoprotection in wheat with different source-sink relationships under varying N levels. Field experiments revealed that compared to sink-limited wheat (YM1), source-limited wheat (YM25 and ZM27) maintained higher chlorophyll content, maximum net photosynthetic rate (Pnmax), and light energy utilization efficiency, and alleviated photoinhibition by reducing non-photochemical quenching (NPQ) and increasing the proportion of cyclic electron flow (CEF). Additionally, source-limited wheat flag leaves had higher carotenoid content and soluble protein content and stronger antioxidant capacity, which enabled them to scavenge reactive oxygen species, reduce membrane lipid peroxidation, and delay leaf senescence. N fertilization significantly improved wheat’s photosynthetic capacity and light energy utilization efficiency, alleviating photoinhibition. Source-limited wheat can still maintain the integrity of the photosynthetic apparatus under low N conditions by enhancing photoprotective mechanisms, showing stronger environmental adaptability. Therefore, proper N fertilization and optimization of source-sink relationships help improve wheat’s photosynthetic capacity and yield potential.
1 Introduction
Photosynthesis is a complex physiological and biochemical process that includes CO2 transport, photosynthetic pigment synthesis, photosynthetic electron transfer, light energy conversion, and the Calvin cycle, among others (Liu et al., 2023). Photosynthesis in C3 crops includes the light reaction and dark reaction. The light reaction occurs in a series of pigment-protein complexes and electron carriers on the thylakoid membrane, which have specific spatial arrangements and structural changes. Chlorophyll absorbs light energy and converts it into electrical energy, transferring electrons through the electron transport chain to NADPH+, and coupling with photophosphorylation to generate ATP for the dark reaction. The dark reaction, also known as the Calvin cycle, occurs in the stroma of the chloroplast, with the key enzyme being Rubisco, whose carboxylation ability is a limiting factor in photosynthetic capacity (Ślesak and Ślesak, 2021). Only when the processes of photosystem structure, light energy capture, electron transfer, Rubisco carboxylation, and photosynthetic product output are coordinated and interact can photosynthetic efficiency be maximized (Miri, 2009).
The source-sink structure is an intrinsic factor that affects crop photosynthesis and is also one of the main quality characteristics of high photosynthetic efficiency crop populations (Fernie et al., 2020). There are significant differences in net photosynthetic rate (Pn) among wheat cultivars with source-sink relationships. Studies have shown that large-spike cultivars with high sink strength have higher photosynthetic activity in non-leaf organs than small-spike cultivars (Wang et al., 2001). Zhang et al. (2024a) proposed that source-limited wheat is more rational than sink-limited wheat, as they have larger leaf area, longer leaf area duration, and stronger photosynthetic performance, while sink-limited wheat exhibits lower photosynthetic capacity. Studies generally suggest that when source activity is greater or sink demand decreases (usually due to insufficient sink activity), source-sink imbalance occurs, leading to the accumulation of soluble carbohydrates in source leaves, which downregulates photosynthesis-related genes and accelerates leaf senescence (Burnett et al., 2016). On the other hand, insufficient source activity can lead to early leaf senescence, hindering the accumulation of photosynthetic products in the leaves (Krahmer et al., 2018). It’s widely recognized that modern wheat cultivars’ sinks can still boost yields. However, past breeding has shifted from sink limitation to more source limitation, and the source will limit future yield growth (Zhang et al., 2016). Thus, optimizing the balance between source and sink organs is crucial for ensuring higher yield. Understanding the regulatory mechanisms of the source-sink relationship in photosynthesis provides a theoretical basis for improving the source performance of crop yield.
During photosynthesis, the photosynthetic apparatus in leaves can be damaged when the absorbed light energy exceeds its maximum light energy utilization capacity, leading to a decrease in photosynthetic efficiency and causing photoinhibition (Djanaguiraman et al., 2020). Non-photochemical quenching (NPQ) is a key photoprotective mechanism by which excess light energy is dissipated as heat, protecting the photosynthetic machinery from damage (Lu et al., 2022). However, excessive NPQ can reduce quantum efficiency, which in turn may negatively affect crop yields. Imbalances in the source-sink relationship have been shown to lead to an accumulation of sucrose in source leaves, suppressing the expression of photosynthesis-related proteins, reducing electron transfer, and increasing heat dissipation, thereby exacerbating photoinhibition (Muller et al., 2014). When excess light energy is available, the enhanced electron transport pathway using oxygen as an electron acceptor induces the production of reactive oxygen species (Zhang et al., 2024b). Reactive oxygen species can cause lipid peroxidation, damage the membrane system, and affect normal leaf metabolism (Shimakawa et al., 2022). Superoxide dismutase (SOD), catalase (CAT), and peroxidase (POD) in plants are important components of the reactive oxygen species scavenging system. They effectively prevent the accumulation of high concentrations of oxygen and protect against lipid peroxidation (Ewald, 2018; Liu et al., 2025). Some studies suggest that a higher sink-source ratio can improve leaf Pn, significantly increase SOD activity, and slow the increase in malondialdehyde content (Wada and Wada, 1991). Other studies show that changing the source-sink ratio, with a decrease in sink volume, increases leaf chlorophyll content, Pn, and leaf SOD, CAT, and POD activity (Jiang et al., 2004). These seemingly contradictory findings may arise from differences in cultivars, growth conditions, manipulation methods, or measurement techniques. Whether changing the source-sink relationship can alleviate photoinhibition and improve wheat’s antioxidant capacity still requires further investigation. Therefore, a systematic comparison of well-defined source- and sink-limited cultivars under controlled nitrogen (N) levels is necessary to clarify these physiological mechanisms.
While considerable research has been conducted to explore the physiological mechanisms of the source-sink relationship, a comprehensive understanding of its regulatory impact on photosynthesis remains incomplete. To determine the variation patterns of photosynthetic traits in wheat with different source-sink relationships, this study selected three wheat cultivars with source-sink relationships and set two N levels to explore the differences in photosynthetic capacity, light energy distribution between photosystem I (PSI) and photosystem II (PSII), and photoprotection abilities. The aim is to clarify the physiological mechanisms underlying differences in photosynthetic capacity and photoprotection in wheat cultivars with different source-sink relationships under varying N levels. Ultimately, this research seeks to contribute to the development of strategies to optimize source-sink relationships for improving wheat yield potential.
2 Material and methods
2.1 Experiment design
The experiment was conducted at the experimental base of Nanjing Agricultural University (32°24’N, 118°9’E) in Nanjing, China, during the 2020/2021 and 2021/2022 growing seasons. A field experiment was conducted, selecting three different wheat cultivars: Yangmai 1 (YM1, southern cultivar, sink-limited wheat), Yangmai 25 (YM25, southern cultivar, source-limited wheat), and Zhoumai 27 (ZM27, northern cultivar, source-limited wheat), which was studied in our previous work (Zhang et al., 2024a). According to the response of different cultivars to source and sink manipulations, YM25 and ZM27 had a higher sink–source ratio, manifesting as a source-limited cultivar. YM1 has a lower sink–source ratio, manifesting as a sink-limited cultivar. Two N fertilizer treatments were set, with N application rates of 240 kg·hm-2 and 120 kg·hm-2, referred to as N240 and N120, respectively. A completely randomized block design was used, with N fertilizer as the main factor and variety as the secondary factor. The basic seeding was 2.25×10⁶ seeds ha−1. The plot size was 3.0 m×3.0 m (9m2) with 12 rows and a spacing of 0.25 m between rows. 50% of the N fertilizer and all phosphorus (P2O5, 150 kg·hm-2) and potassium fertilizer (K2O, 150 kg·hm-2) were used as base fertilizer, with the remaining 50% of N applied at the jointing stage. Soil samples at a depth of 0 to 25 cm were found to have 20.44 g·kg–1 organic matter, 1.35 g·kg–1 total N content, 65.22 mg·kg–1 available N content, 18.49 mg·kg–1 available P2O5 content, and 109.44 mg·kg–1 rapidly available K in 2020–2021 and 26.98 g·kg–1 organic matter, 1.40 g·kg–1 total N content, 68.22 mg·kg–1 available N content, 12.37 mg·kg–1 available P2O5 content, and 93.76 mg·kg–1 rapidly available K in 2021–2022 The sowing dates were November 2 in 2020, and November 13 in 2021, and the harvesting dates were May 24, 2021, and May 26, 2022. Seedlings were thinned at the three-leaf stage, and stakes were provided to prevent lodging for lodging-prone cultivars, ensuring stable yield performance for all cultivars. Management followed local cultivation practices, with timely pest and disease control. The average temperature and cumulative precipitation meteorological conditions during wheat growth were calculated according to the meteorological data provided by the local weather station and are shown in Figure 1. The climate is humid and warm, with an annual rainfall of 476.60 mm and 568.76 mm during 2020/2021 and 2021/2022 growing seasons, respectively. The range of monthly average temperatures in the region was 4-22°C and 4-22°C during 2020/2021 and 2021/2022 growing seasons, respectively. Meteorological conditions during the wheat growing seasons were typical for the region, with no extreme events noted that would significantly impact the treatments differently.
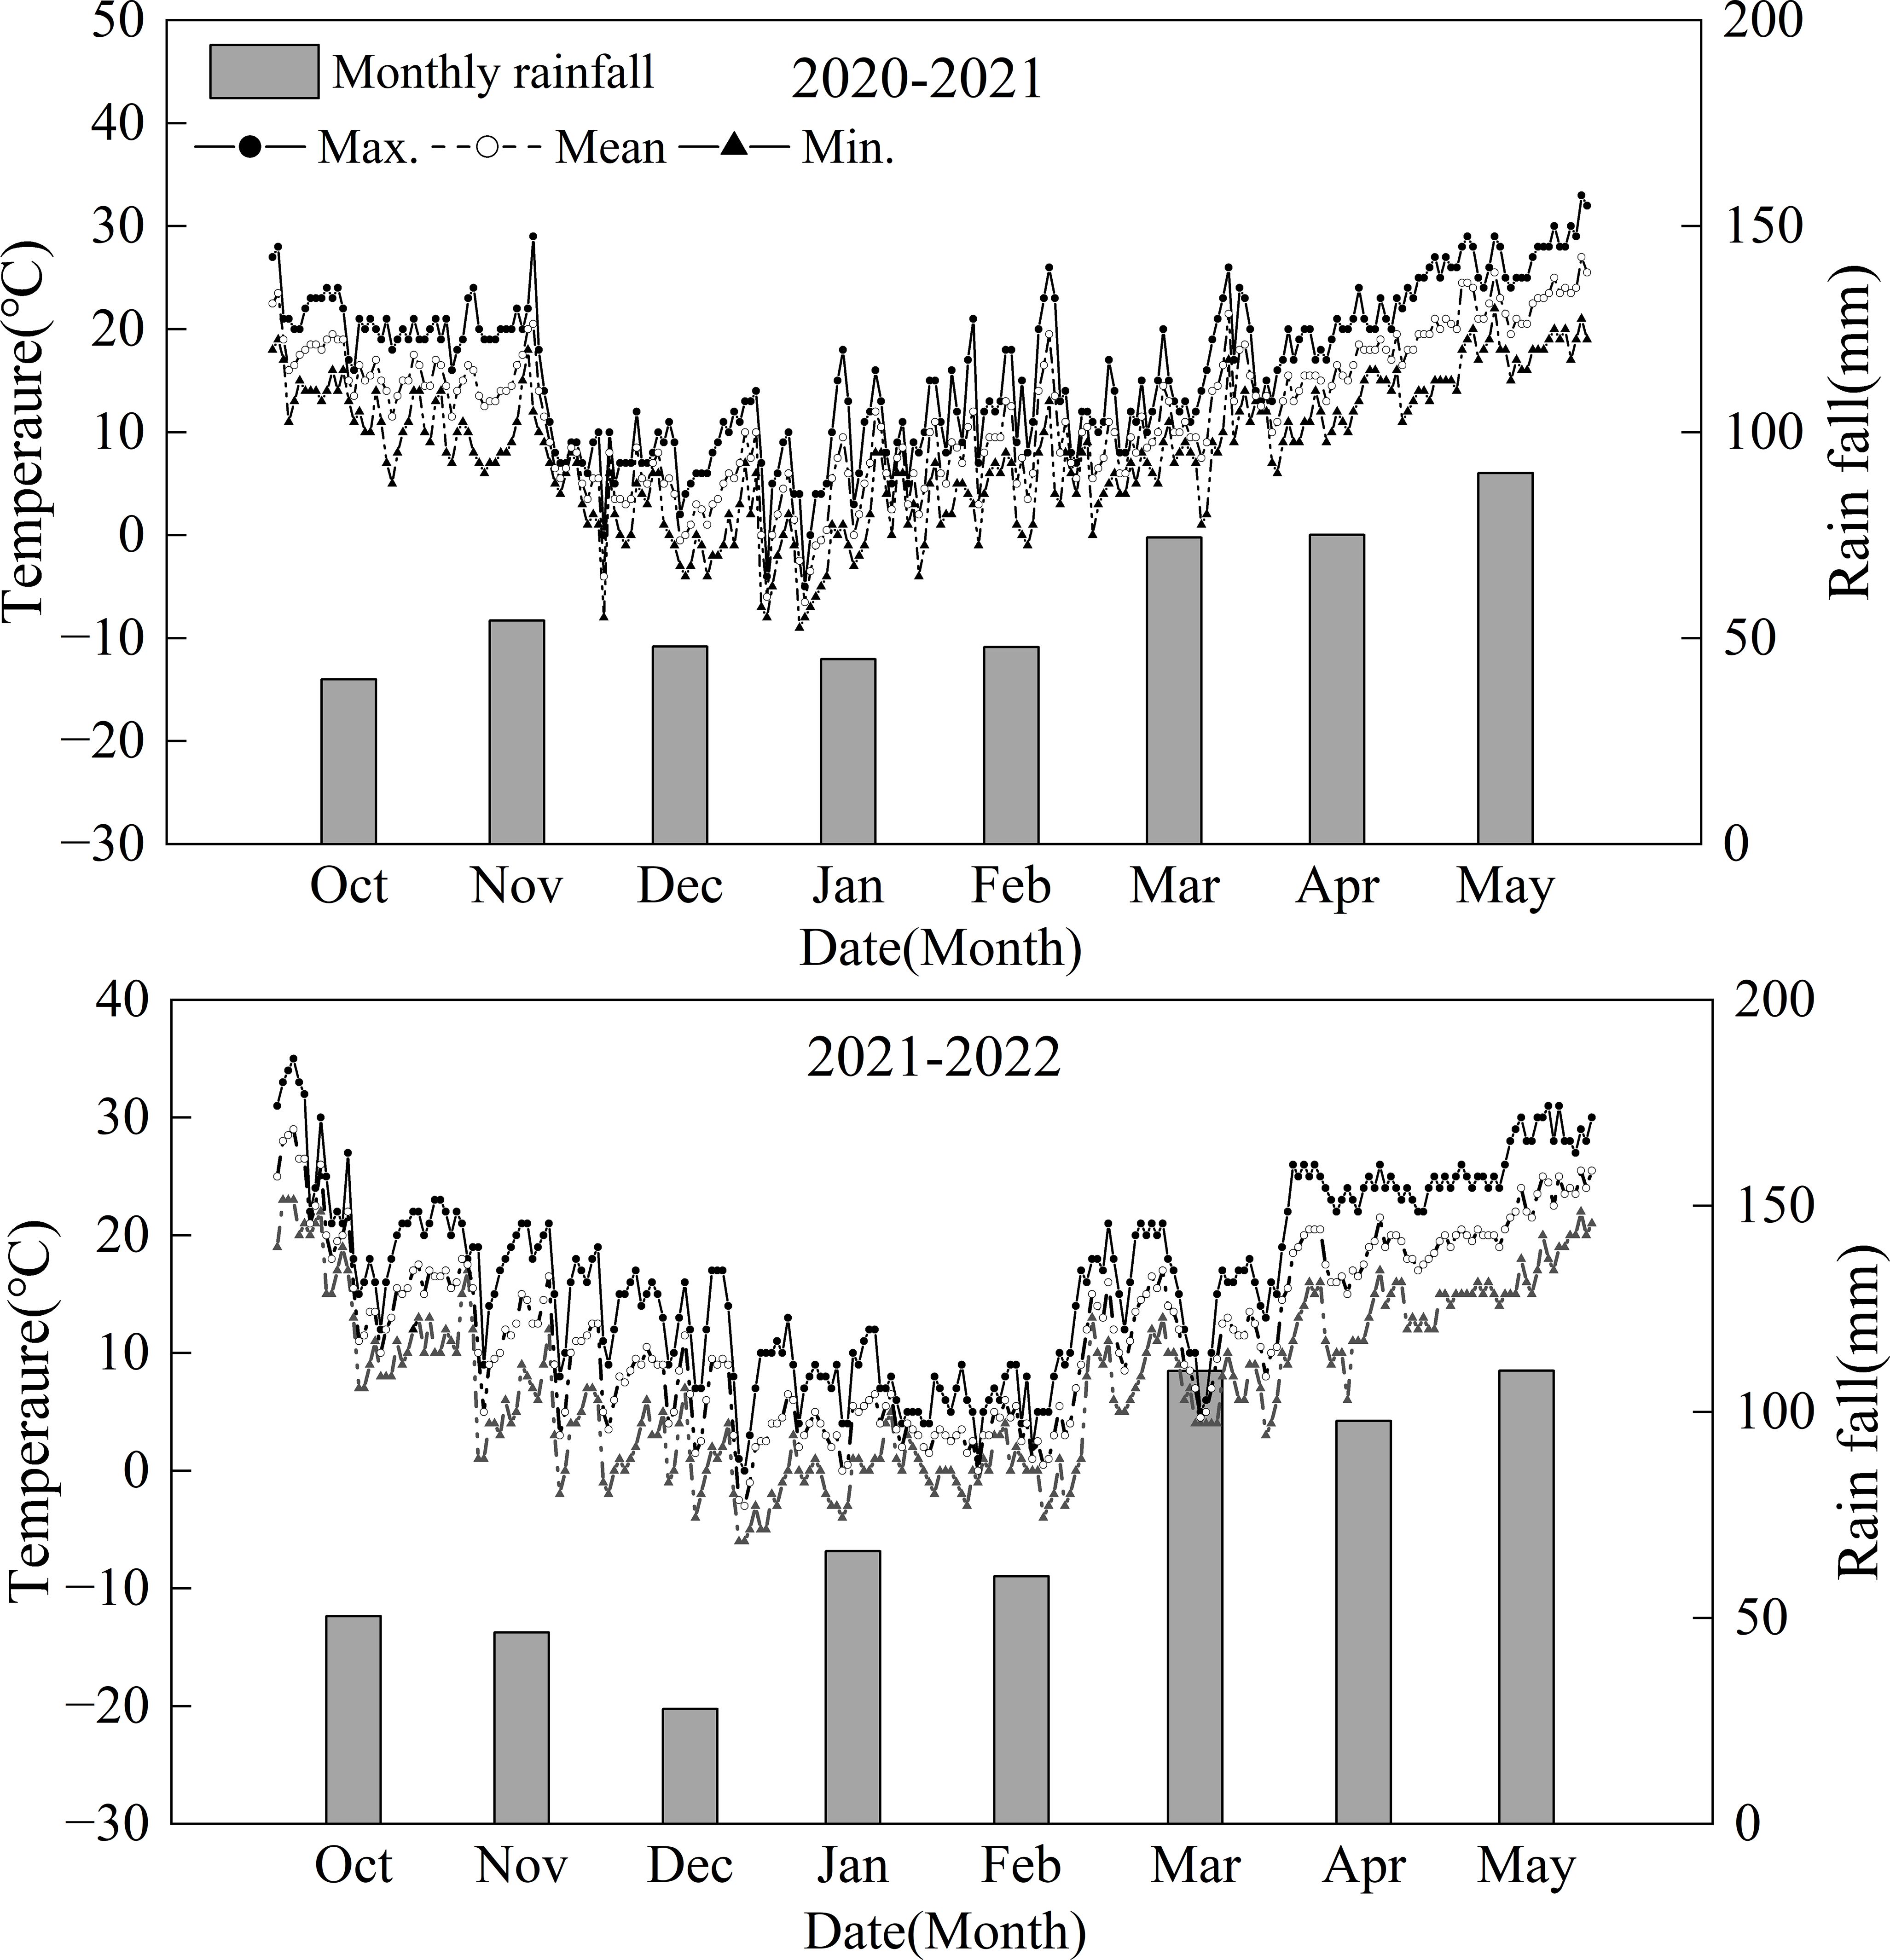
Figure 1. Daily maximum (max.) and minimum (min.) and mean temperatures and monthly rainfall for the two wheat growing seasons (2020–2021 and 2021-2022).
2.2 Determination of photosynthetic pigment content
Samples of the marked flag leaves were taken at 0, 10, 20, and 30 days after anthesis (DAA). The determination of photosynthetic pigment content was carried out using the acetone extraction method (Lichtenthaler and Buschmann, 2001). A 0.05 g fresh wheat leaf sample was taken, chopped, and mixed. Acetone and anhydrous ethanol were mixed in equal proportions, and 20 mL of the mixed extraction solution was added. The mixture was placed in a 40 °C constant temperature incubator and extracted in a glass test tube for about 24 hours in the dark. The absorbance values at 663 nm, 645 nm, and 470 nm were measured using a UV spectrophotometer. Chlorophyll a, chlorophyll b, total chlorophyll, and carotenoids in the leaves were calculated using the following Equations 1–4:
where A is the absorbance at the specified wavelength, V is the volume of extract (mL), and W is the fresh weight of the sample (g).
2.3 Measurement of light response curve
The light response curve was measured using the LI-6400 portable photosynthesis system (Li-Cor Inc., USA) at 0, 10, and 20 DAA. The photosynthetically active radiation (PAR) was set to 1200 μmol·m-2·s-1, with the CO2 concentration in the leaf chamber set to about 400 μmol·CO2·L-1, the leaf temperature set to 25.0 ± 0.5 °C, and the relative humidity in the leaf chamber set to about 65 ± 5%. Three uniform and healthy wheat flag leaves were selected from each plot, and measurements were taken simultaneously using three photosynthesis systems during 09:00-11:00 a.m. on clear days without clouds. Before measurements, the leaves were placed in the leaf chamber with PAR set to 1200 μmol·m-2·s-1 for 10 min. The PAR gradient was set to 0, 50, 100, 150, 200, 400, 600, 800, 1000, and 1200 μmol·m-2·s-1. After the measurements, a curve was plotted with Pn as the vertical axis and light intensity as the horizontal axis. The initial slope of the curve (when PPDF < 200 μmol·m-2·s-1) represented the apparent quantum yield (ΦCO2). The maximum net photosynthetic rate (Pnmax) was represented by the peak of the light response curve (Li et al., 2009), with data recorded after the system reached equilibrium (2–3 min).
2.4 Determination of photoprotective mechanism-related parameters
The measurements were conducted at 0, 10, 20, and 30 DAA using a Dual-PAM-100 dual-channel chlorophyll fluorometer (Heinz Walz, Effeltrich, Germany), controlled by the standard protocol of Dual-PAM software v1.19. Before measurements, plants were dark-adapted for 30 min to determine the minimum fluorescence (Fo) and maximum fluorescence (Fm). Actinic light at 1200 μmol·m-2·s-1 was applied for 10 min until steady-state fluorescence was reached; subsequently, a saturating pulse light intensity of 10000 μmol·m-2·s-1 was applied to measure, including steady-state fluorescence (Fs), light-adapted maximum fluorescence (Fm′), maximum PSI oxidation (Pm′), and quantum yields of energy conversion: PSI effective quantum yield (Y(I)), PSII effective quantum yield (Y(II)), quantum yield of non-photochemical quenching due to acceptor-side limitation in PSI (Y(NA)), quantum yield of non-photochemical quenching due to donor-side limitation in PSI (Y(ND)). Electron transport rates (ETR(I) and ETR(II)) and cyclic electron flow (CEF) were subsequently calculated. Additionally, thermal dissipation parameters were quantified, including NPQ, photoprotective mechanism-associated non-photochemical quenching quantum yield (ΦNPQ), and non-photochemical quenching quantum yield unrelated to photoprotection (ΦNO). The calculations followed established formulas Equations 5–10 (Trebst, 1980; Öquist and Chow, 1992).
2.5 Determination of soluble protein content
Marked flag leaves were sampled at 0, 10, 20, and 30 DAA. Soluble protein content was determined using the Coomassie Brilliant Blue G-250 method (Snyder and Desborough, 1978). A 0.1 g fresh sample was homogenized with 1 mL phosphate-buffered saline (PBS, pH 7.2). The homogenate was centrifuged at 4 °C and 4000 × g for 10 min. Then, 0.1 mL of the supernatant was mixed with 5 mL of Coomassie Brilliant Blue reagent. After thorough mixing, the absorbance was measured at 595 nm using a UV spectrophotometer. Soluble protein concentration was then calculated accordingly.
2.6 Determination of superoxide anion and malondialdehyde contents
Flag leaves were sampled at 0, 10, 20, and 30 DAA. Fresh wheat leaf samples (0.5 g) were homogenized in 3 mL of enzyme extraction buffer containing HEPES buffer (pH 7.8), 20% (v/v) glycerol, 1 mM ascorbic acid (AsA), 1 mM EDTA, 5 mM MgCl2, 1 mM reduced glutathione (GSH), and 1 mM dithiothreitol (DTT). The homogenate was centrifuged at 10,000 × g for 20 min at 4 °C, and the supernatant was collected as the crude enzyme extract.
The production rate of superoxide anion (O2-) in leaves was determined using the hydroxylamine method (Pageau et al., 2006). A 0.5 mL aliquot of crude enzyme extract was mixed with 0.5 mL HEPES buffer (pH 7.8) and 1 mL of 1 mM hydroxylamine hydrochloride, and incubated at 25 °C for 1 h. Subsequently, 1 mL of α-naphthylamine and 1 mL of p-aminobenzenesulfonic acid were added, and the mixture was left to stand for 20 min at 25 °C. Absorbance was measured at 530 nm using a UV spectrophotometer.
Malondialdehyde (MDA) content in the leaves was determined using the thiobarbituric acid (TBA) colorimetric method (Kramer et al., 2004). A 2 mL sample of crude enzyme extract was mixed with 4 mL of trichloroacetic acid-thiobarbituric acid (TCA-TBA) reagent, and then heated in a boiling water bath for 20 min. After centrifugation at 4000 × g for 10 min, the supernatant was collected and its absorbance was measured at 450 nm, 532 nm, and 600 nm using a UV spectrophotometer.
2.7 Determination of antioxidant enzyme activity
Flag leaves were sampled at 0, 10, 20, and 30 DAA. Fresh wheat leaf samples (0.5 g) were homogenized with 5 mL of enzyme extraction buffer containing 5 mM phosphate-buffered saline (PBS, pH 7.5), 1 mL of 5.0% (w/v) polyvinylpolypyrrolidone (PVPP), and 1 mL of 0.1 mM ethylenediaminetetraacetic acid (EDTA). The homogenate was centrifuged at 12,000 × g for 2 min at 4 °C, and the supernatant was collected as the crude enzyme extract.
SOD activity was determined using the nitroblue tetrazolium (NBT) method as described by Tan et al. (2008). A 0.05 mL aliquot of crude enzyme extract was added to a reaction mixture containing 0.3 mL of 100 μM EDTA-Na2, 0.3 mL of 130 mM methionine, 0.3 mL of 20 μM riboflavin, and 0.3 mL of 50 μM NBT. The mixture was exposed to 4000 lx light for 15 min. A non-illuminated sample served as the blank control. Absorbance at 560 nm was measured using a UV spectrophotometer, and SOD activity was calculated accordingly.
POD activity was determined using the guaiacol method as described by Zeng et al. (2017). A 10 μL aliquot of crude enzyme extract was added to a reaction mixture containing 0.3 mL of 0.2 M phosphate buffer (PBS, pH 6.0), 0.02 mL of 0.05 M guaiacol, and 0.03 mL of 30% hydrogen peroxide. After thorough mixing, absorbance at 470 nm was measured using a UV spectrophotometer to calculate POD activity.
CAT activity was determined using the ultraviolet absorption method, as described by Hadwan (2018). A 0.1 mL aliquot of crude enzyme extract was mixed with 1.9 mL of phosphate buffer (PBS, pH 7.0) and 1 mL of 0.075% hydrogen peroxide. After thorough mixing, the absorbance at 240 nm was measured using a UV spectrophotometer to calculate CAT activity.
The activity of ascorbate peroxidase (APX) was determined using the ascorbate method (Wu et al., 1998). A 0.1 mL aliquot of crude enzyme extract was mixed with 1 mL of 50 mM phosphate buffer (PBS, pH 7.0), 1 mL of 0.3 mM ascorbic acid, 2 mM EDTA, and 20 μL of 30% H2O2. Absorbance at 290 nm was measured using a UV spectrophotometer to calculate APX activity.
2.8 Statistical analysis
Statistical analysis was calculated using SPSS 19.0 (SPSS Inc., Chicago, USA) and included a one-way analysis of variance (ANOVA). For data presented in charts, Duncan’s test was conducted, with statistical significance accepted at P < 0.05. All graphs presented were produced using Origin 2025 (OriginLab, Northampton, MA, USA).
3 Results
3.1 Photosynthetic pigment content
The chlorophyll and carotenoid contents in flag leaves gradually declined with days after anthesis, and decreased under lower N levels (Figures 2A, B). Both YM25 and ZM27 exhibited significantly higher chlorophyll and carotenoid contents than YM1 during 0–20 DAA, regardless of N treatment. No significant differences in pigment content were observed between YM25 and ZM27. The low N treatment (N120) significantly reduced chlorophyll and carotenoid levels in the flag leaves of all cultivars, highlighting the importance of N for maintaining photosynthetic pigment stability. These findings suggest that YM25 and ZM27, which are source-limited wheat, maintain better light energy absorption and utilization efficiency, even under reduced N conditions.
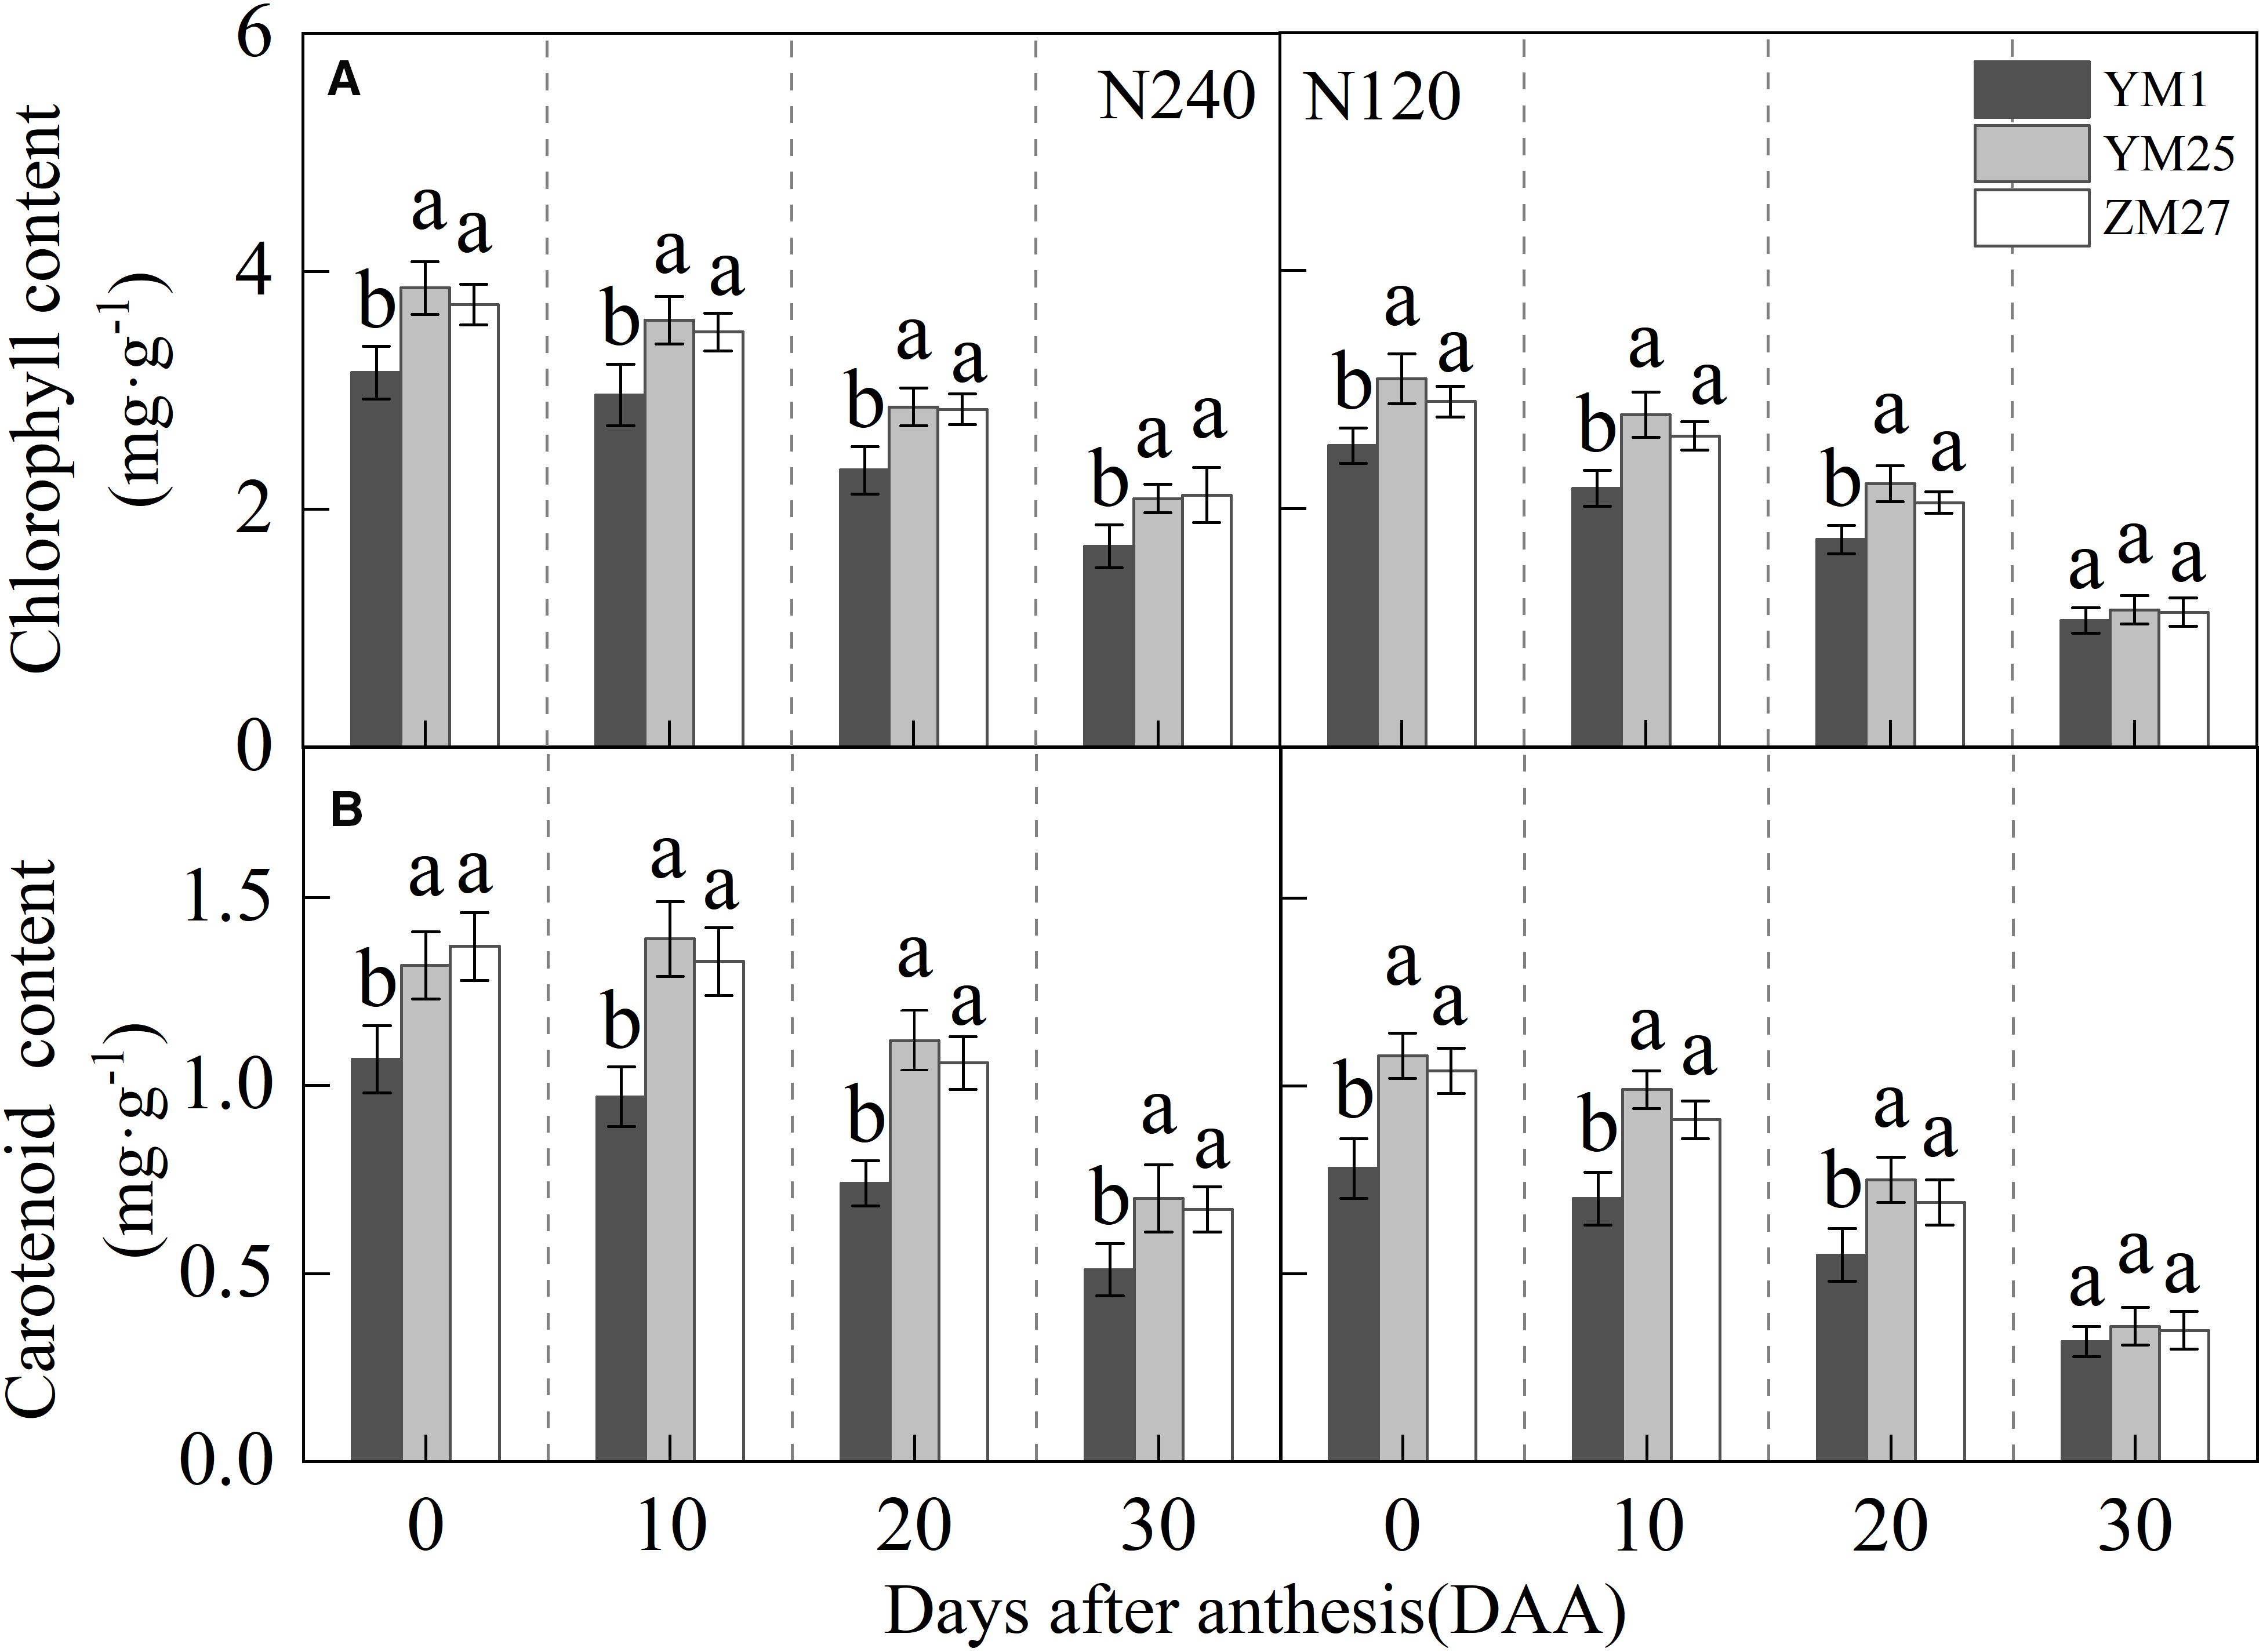
Figure 2. Differences of chlorophyll content (A) and carotenoid content (B) in flag leaves of wheat with different source-sink relationships. Notes: N240 and N120 respectively represent nitrogen application rates of 240 and 120 kg·hm-2. Each value represents the mean ± SD of three biological replicates. Different lowercase letters indicate statistically significant differences between treatments (P < 0.05) according to LSD test. Error bars indicate SD.
3.2 Maximum net photosynthetic rate and apparent quantum efficiency
The flag leaf Pnmax and ΦCO2 gradually decreased with days after anthesis and decreased under lower N levels (Figures 3A, B). Under both N240 and N120 conditions, YM25 and ZM27 flag leaf Pnmax and ΦCO2 were significantly higher than YM1 during 0–20 DAA. No significant differences were observed between YM25 and ZM27. Low N conditions significantly reduced the flag leaf Pnmax and ΦCO2 in all cultivars. These results indicate that the source-limited wheat has superior photosynthetic capacity, demonstrating enhanced ability to capture and utilize solar radiation effectively. In contrast, YM1, a sink-limited wheat, exhibited lower photosynthetic efficiency, particularly under low N conditions.
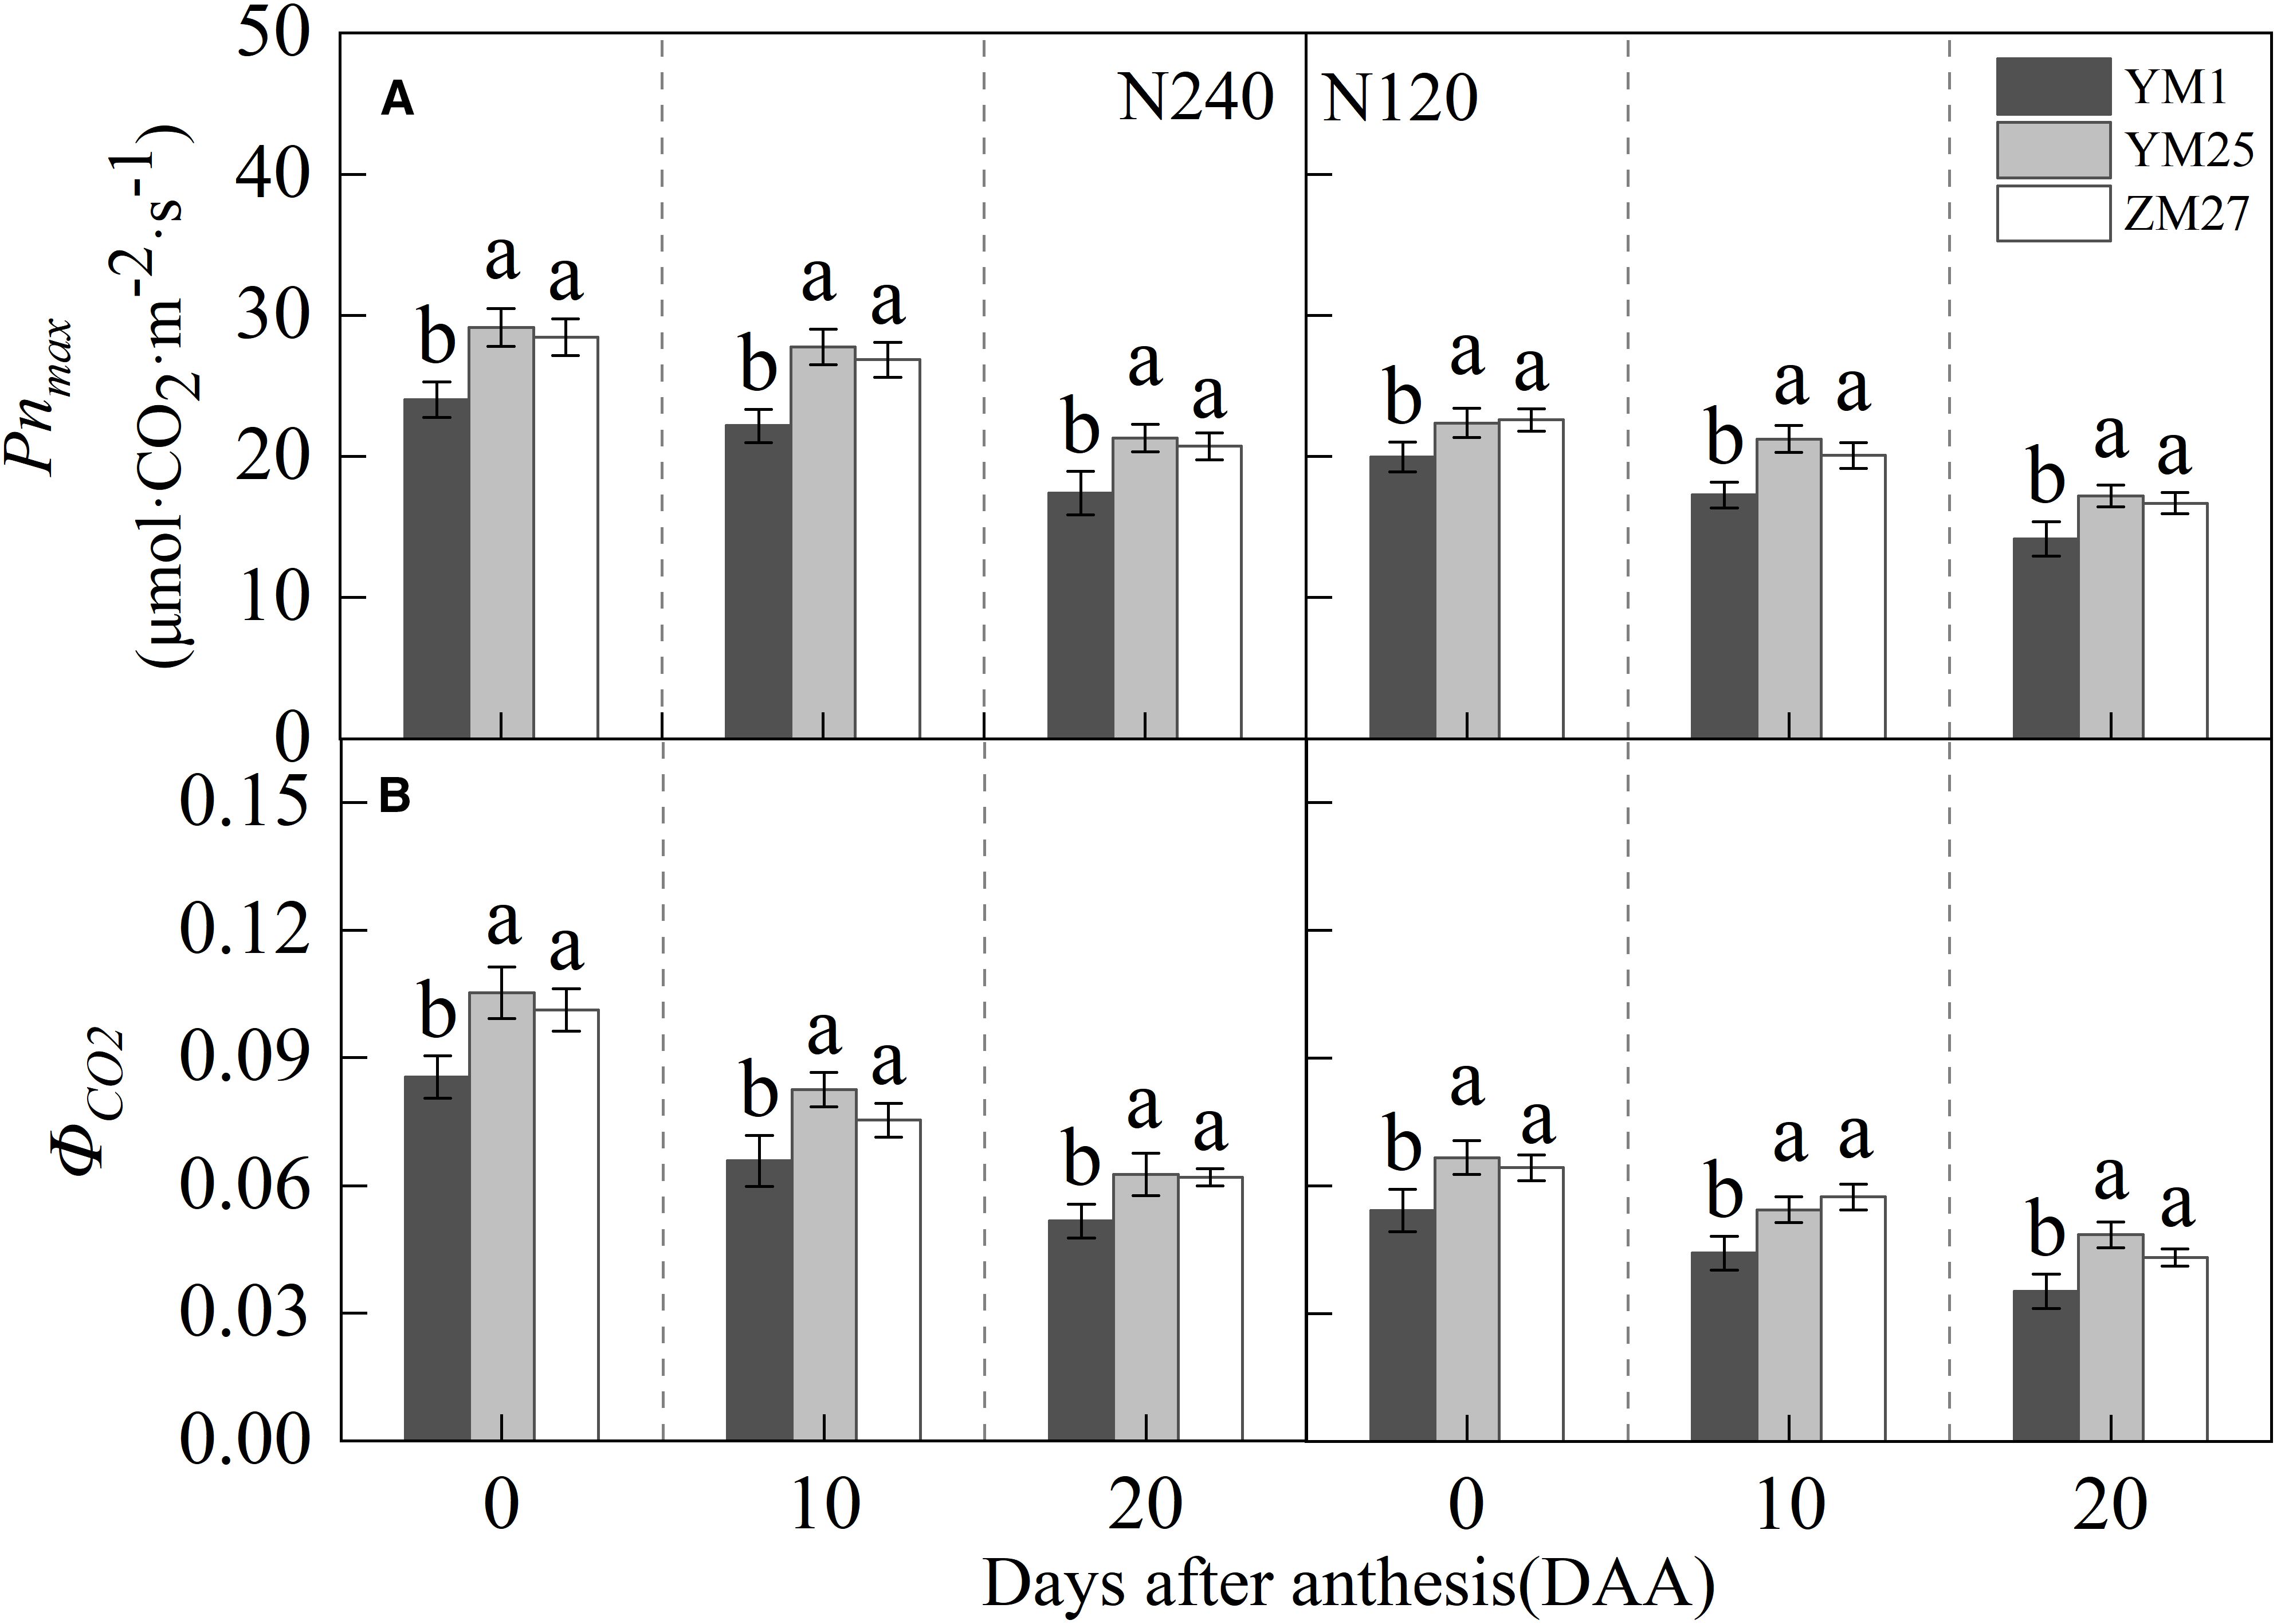
Figure 3. Differences of max net photosynthetic rate (Pnmax) (A) and apparent quantum efficiency (ΦCO2) (B) in flag leaves of wheat with different source-sink relationships. Notes: Each value represents the mean ± SD of three biological replicates. Different lowercase letters indicate statistically significant differences between treatments (P < 0.05) according to LSD test. Error bars indicate SD.
3.3 PSII heat dissipation and light protection-related/unrelated heat dissipation
NPQ, a key indicator of heat dissipation, initially increased and then decreased with days after anthesis, reaching a maximum value at 20 DAA, and increased under lower N levels (Figure 4A). ΦNPQ gradually increased with days after anthesis and decreased with reduced N application (Figure 4B). Additionally, ΦNO gradually decreased with days after anthesis and increased with decreasing N application (Figure 4C). Under both N treatments, YM25 and ZM27 NPQ and ΦNPQ were significantly lower than YM1 during 0–20 DAA, while ΦNO was significantly higher than YM1 during the same period. No significant differences were observed between YM25 and ZM27. Under low N conditions, flag leaf NPQ and ΦNPQ significantly increased, while ΦNO significantly decreased in all cultivars. These results suggest that the source-limited wheat (YM25 and ZM27) can dissipate excess light energy more efficiently, thereby protecting the photosynthetic apparatus from photoinhibition. However, under low N conditions, the degree of photoinhibition increased, resulting in enhanced heat dissipation and greater light-induced damage.
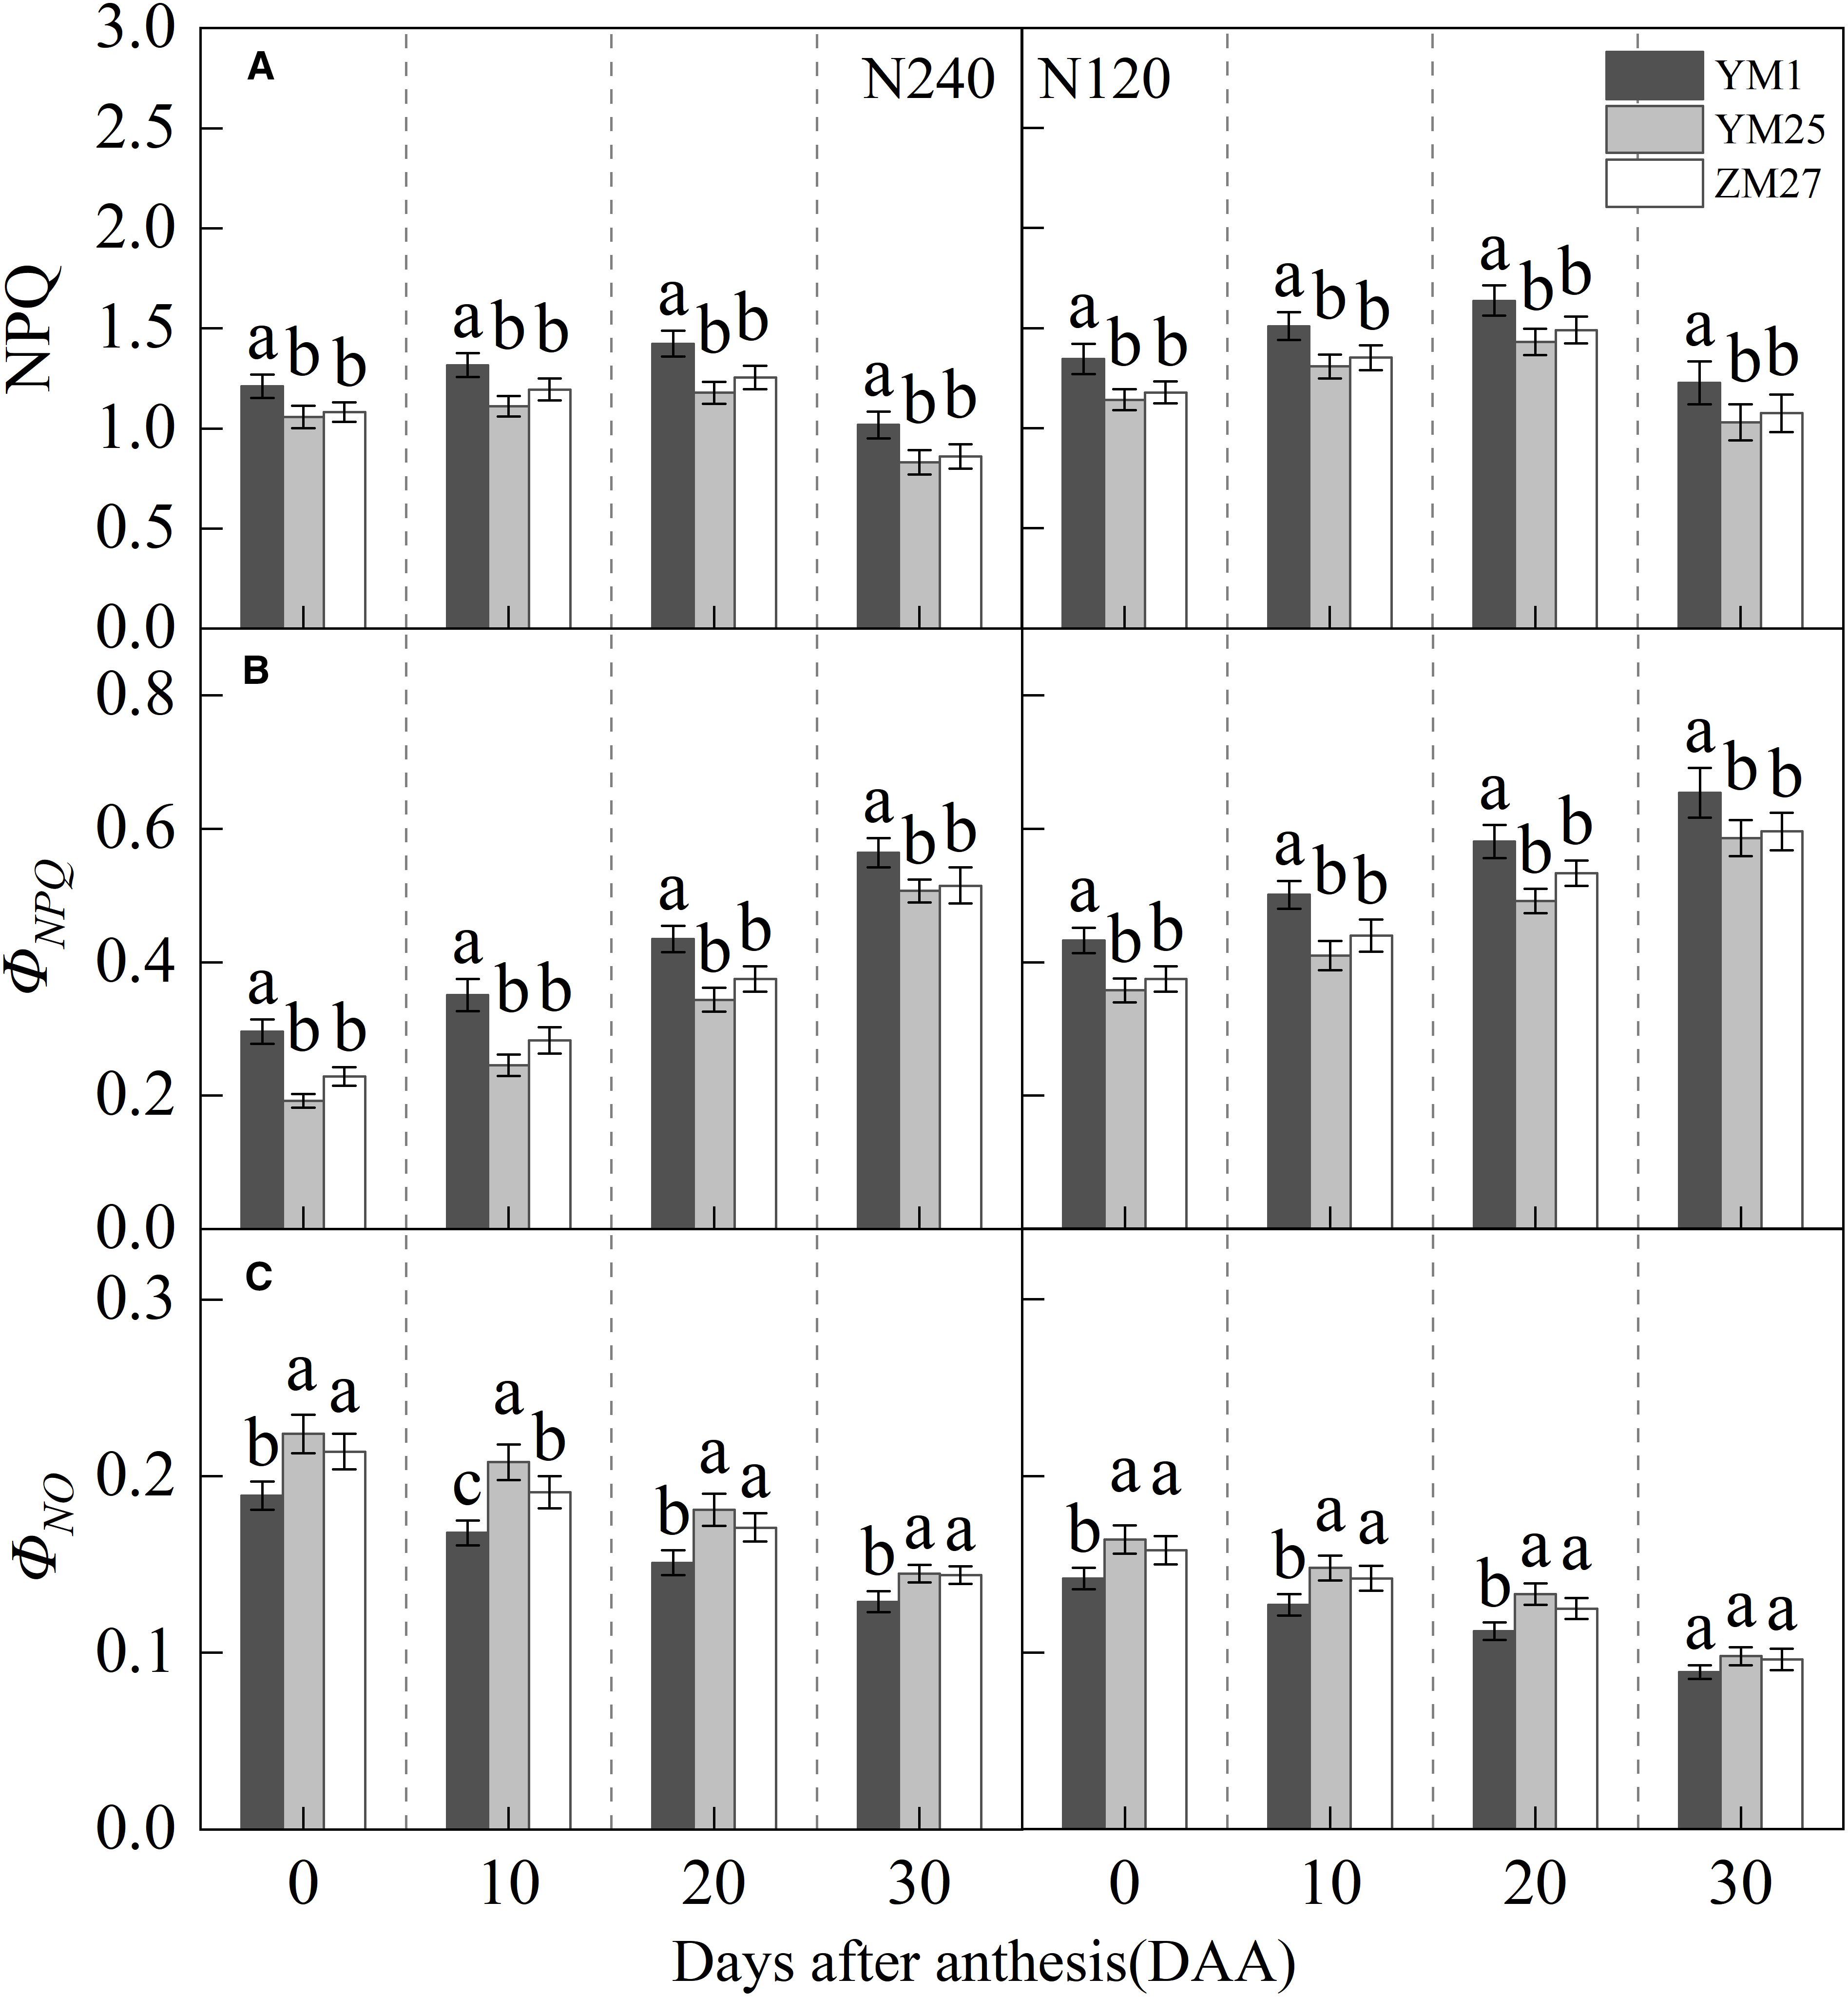
Figure 4. Differences of non-photochemical quenching (NPQ) (A), photoprotective mechanism-associated non-photochemical quenching quantum yield (ΦNPQ) (B), and non-photochemical quenching quantum yield unrelated to photoprotection (ΦNO) (C) in flag leaves of wheat with different source-sink relationships. Notes: Each value represents the mean ± SD of three biological replicates. Different lowercase letters indicate statistically significant differences between treatments (P < 0.05) according to LSD test. Error bars indicate SD.
3.4 PSI non-photochemical energy dissipation
Y(I) gradually decreased with days after anthesis and decreased under lower N levels (Figure 5A). Under both N treatments, YM25 and ZM27 exhibited significantly higher Y(I) than YM1 during 0–20 DAA. Y(NA) and Y(ND) gradually increased with days after anthesis and increased with reduced N application (Figures 5B, C). Under both N treatments, Y(NA) and Y(ND) of YM25 and ZM27 were significantly lower than YM1 during 0–20 DAA. In contrast, YM1 showed a rapid increase in Y(NA) and Y(ND), reflecting limitations on both the acceptor and donor sides of PSI. This resulted in reduced light energy utilization efficiency at PSI in YM1, particularly under low N conditions. These findings suggest that YM25 and ZM27 can maintain more efficient PSI light energy utilization, with fewer limitations on electron transport, compared to YM1. Under low N conditions, Y(NA) and Y(ND) in all cultivars significantly increased, with a greater impact on Y(NA). This indicates that PSI receptor side blockage first occurs, causing a buildup of electrons on the receptor side due to PSI damage, leading to an increase in Y(NA). The downstream electron transfer of PSI is inhibited due to the lack of receptors, ultimately leading to a decrease in PSI light energy utilization efficiency.
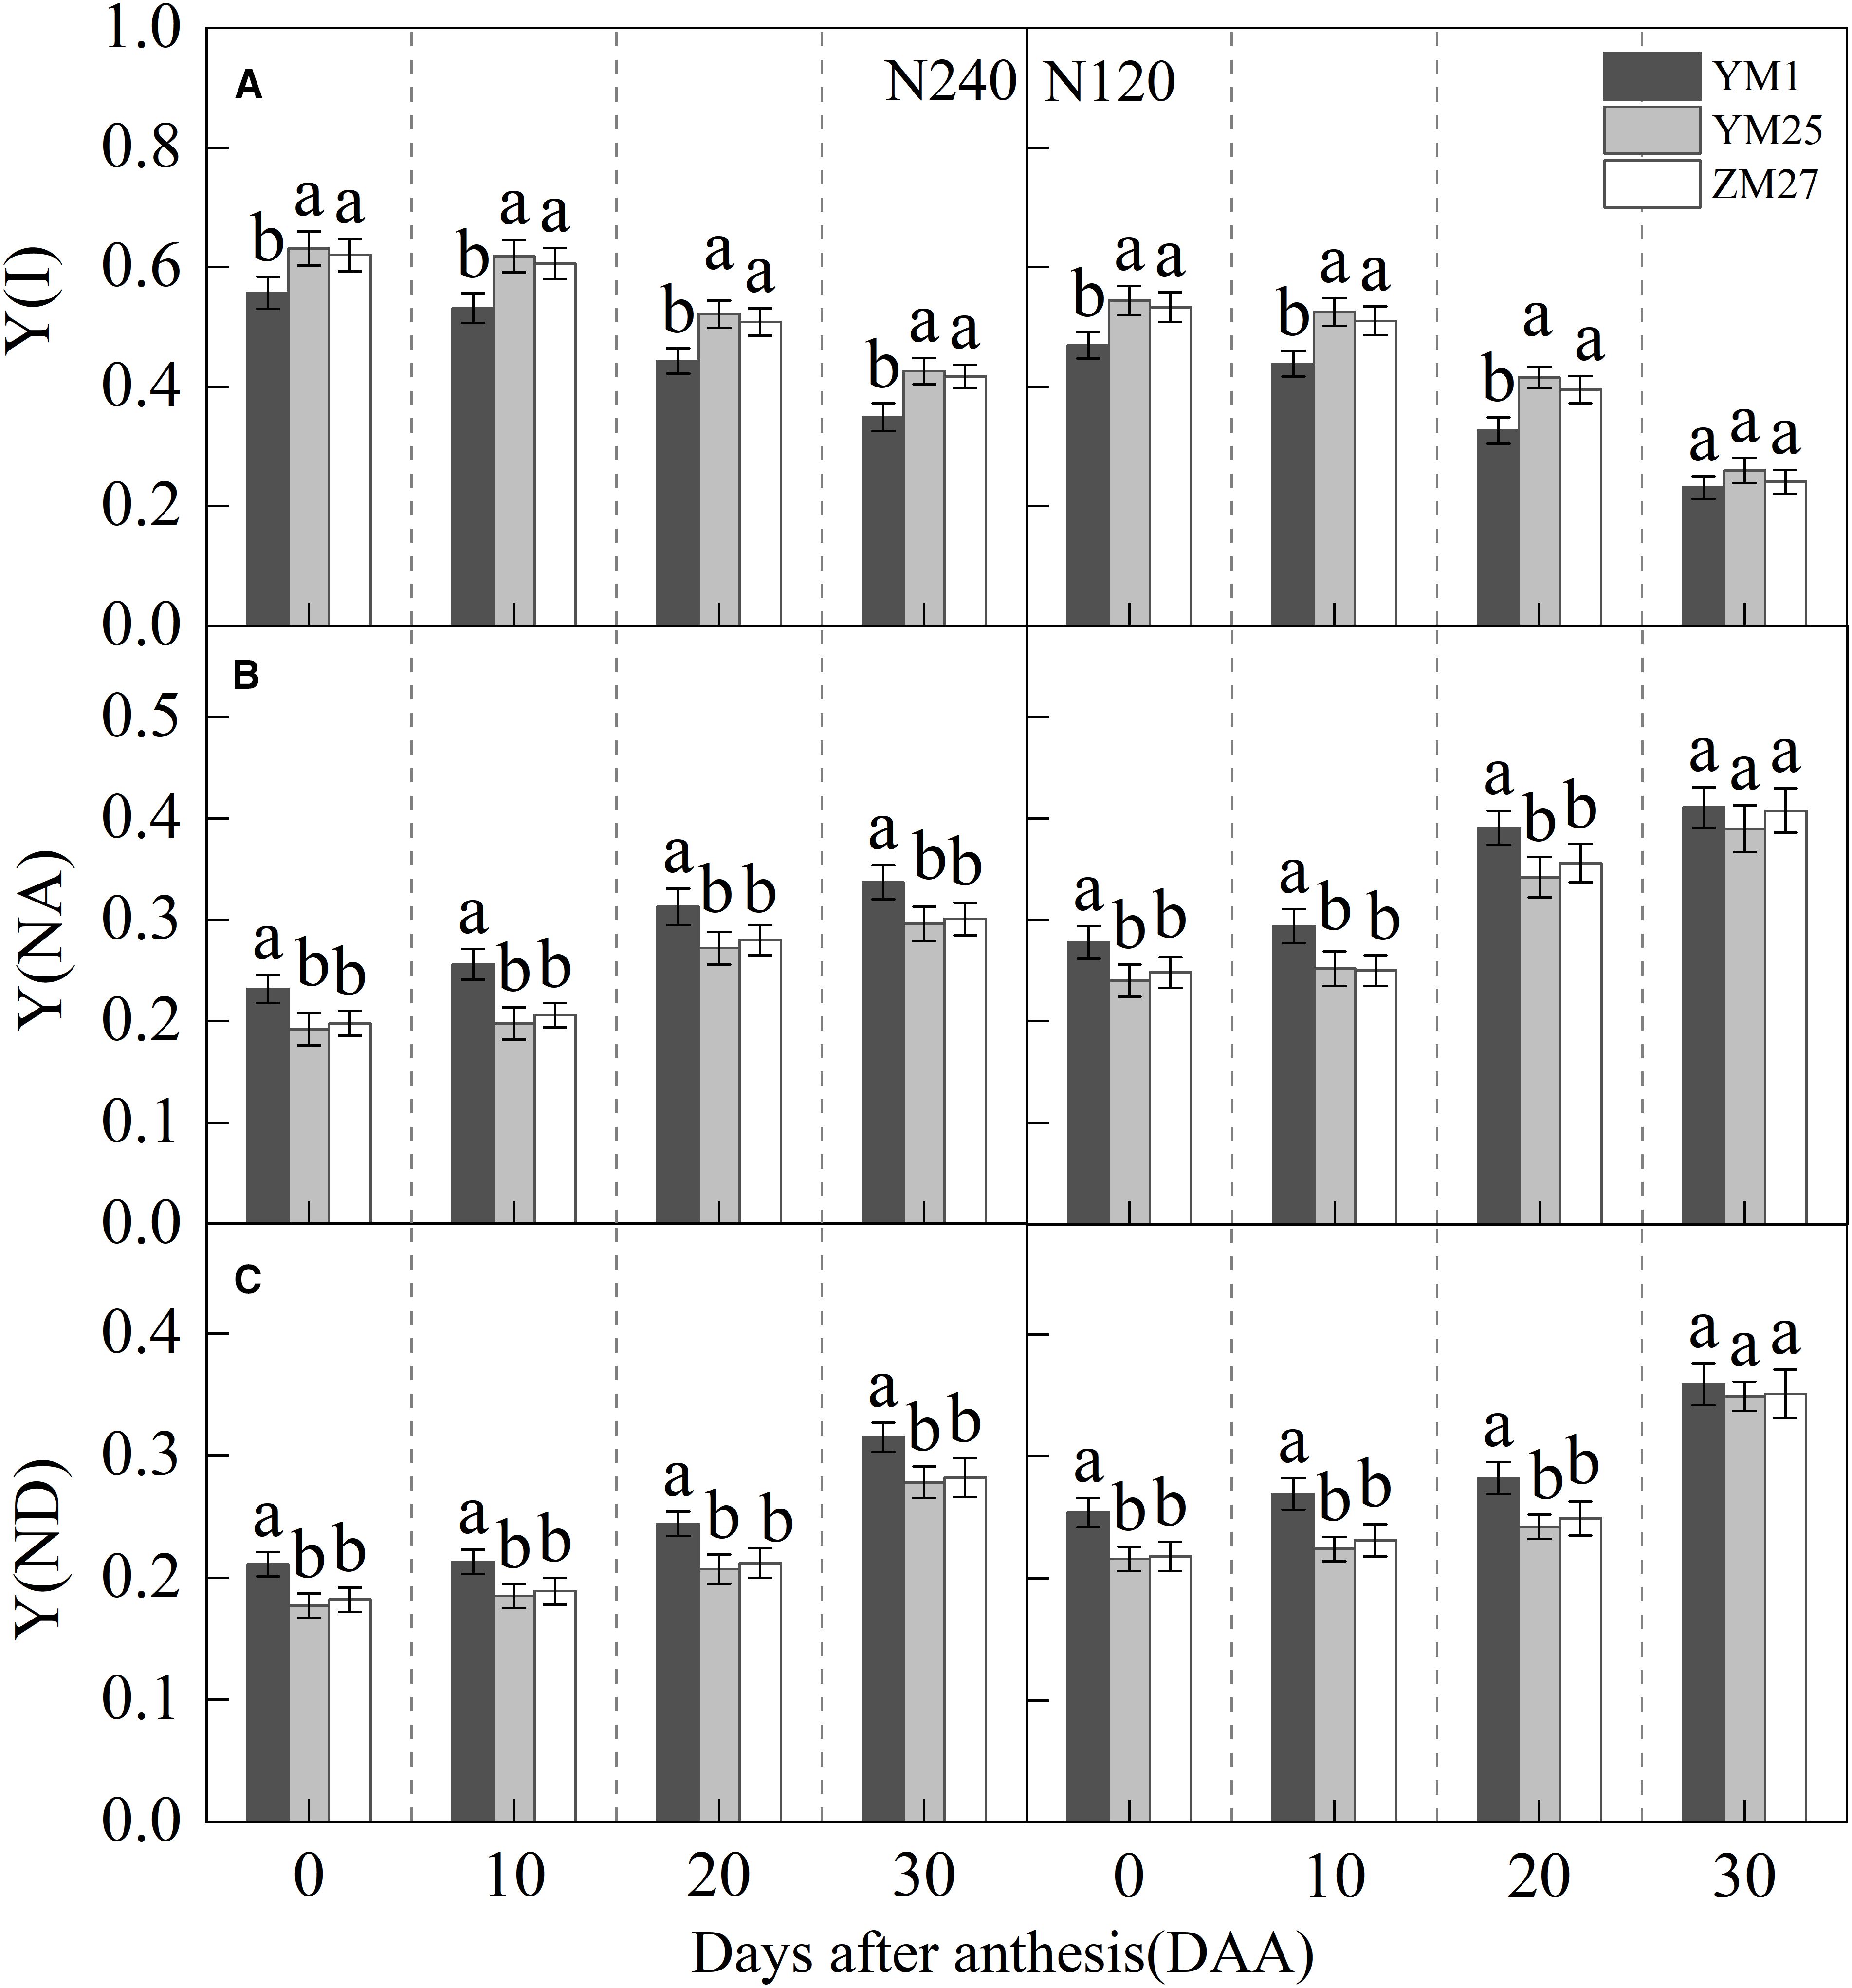
Figure 5. Differences of quantum yield of PSI effective quantum yield (Y(I)) (A), non-photochemical quenching due to acceptor-side limitation (Y(NA)) (B), non-photochemical quenching due to donor-side limitation (Y(ND)) (C) in flag leaves of wheat with different source-sink relationships. Notes: Each value represents the mean ± SD of three biological replicates. Different lowercase letters indicate statistically significant differences between treatments (P < 0.05) according to LSD test. Error bars indicate SD.
3.5 Cyclic electron flow
ETR (I) and ETR (II) represent the electron transfer rates of PSI and PSII. CEF, a critical photoprotective mechanism that helps to alleviate photoinhibition. ETR(I), ETR(II), and CEF gradually decreased with days after anthesis and were suppressed under low N conditions (Figures 6A–C). YM25 and ZM27 exhibited significantly higher ETR(I), ETR(II), and CEF than YM1 during 0–20 DAA under both N treatments. No significant differences were found between YM25 and ZM27. Under low N conditions, ETR(I), ETR(II), and CEF in all cultivars significantly decreased. These results indicate that source-limited wheat can maintain higher electron transfer rates of PSI and PSII, effectively utilizing CEF to protect the photosynthetic system from light-induced damage. However, under low N conditions, the damage to the photosynthetic system was intensified, with reduced CEF, making photoinhibition more likely.
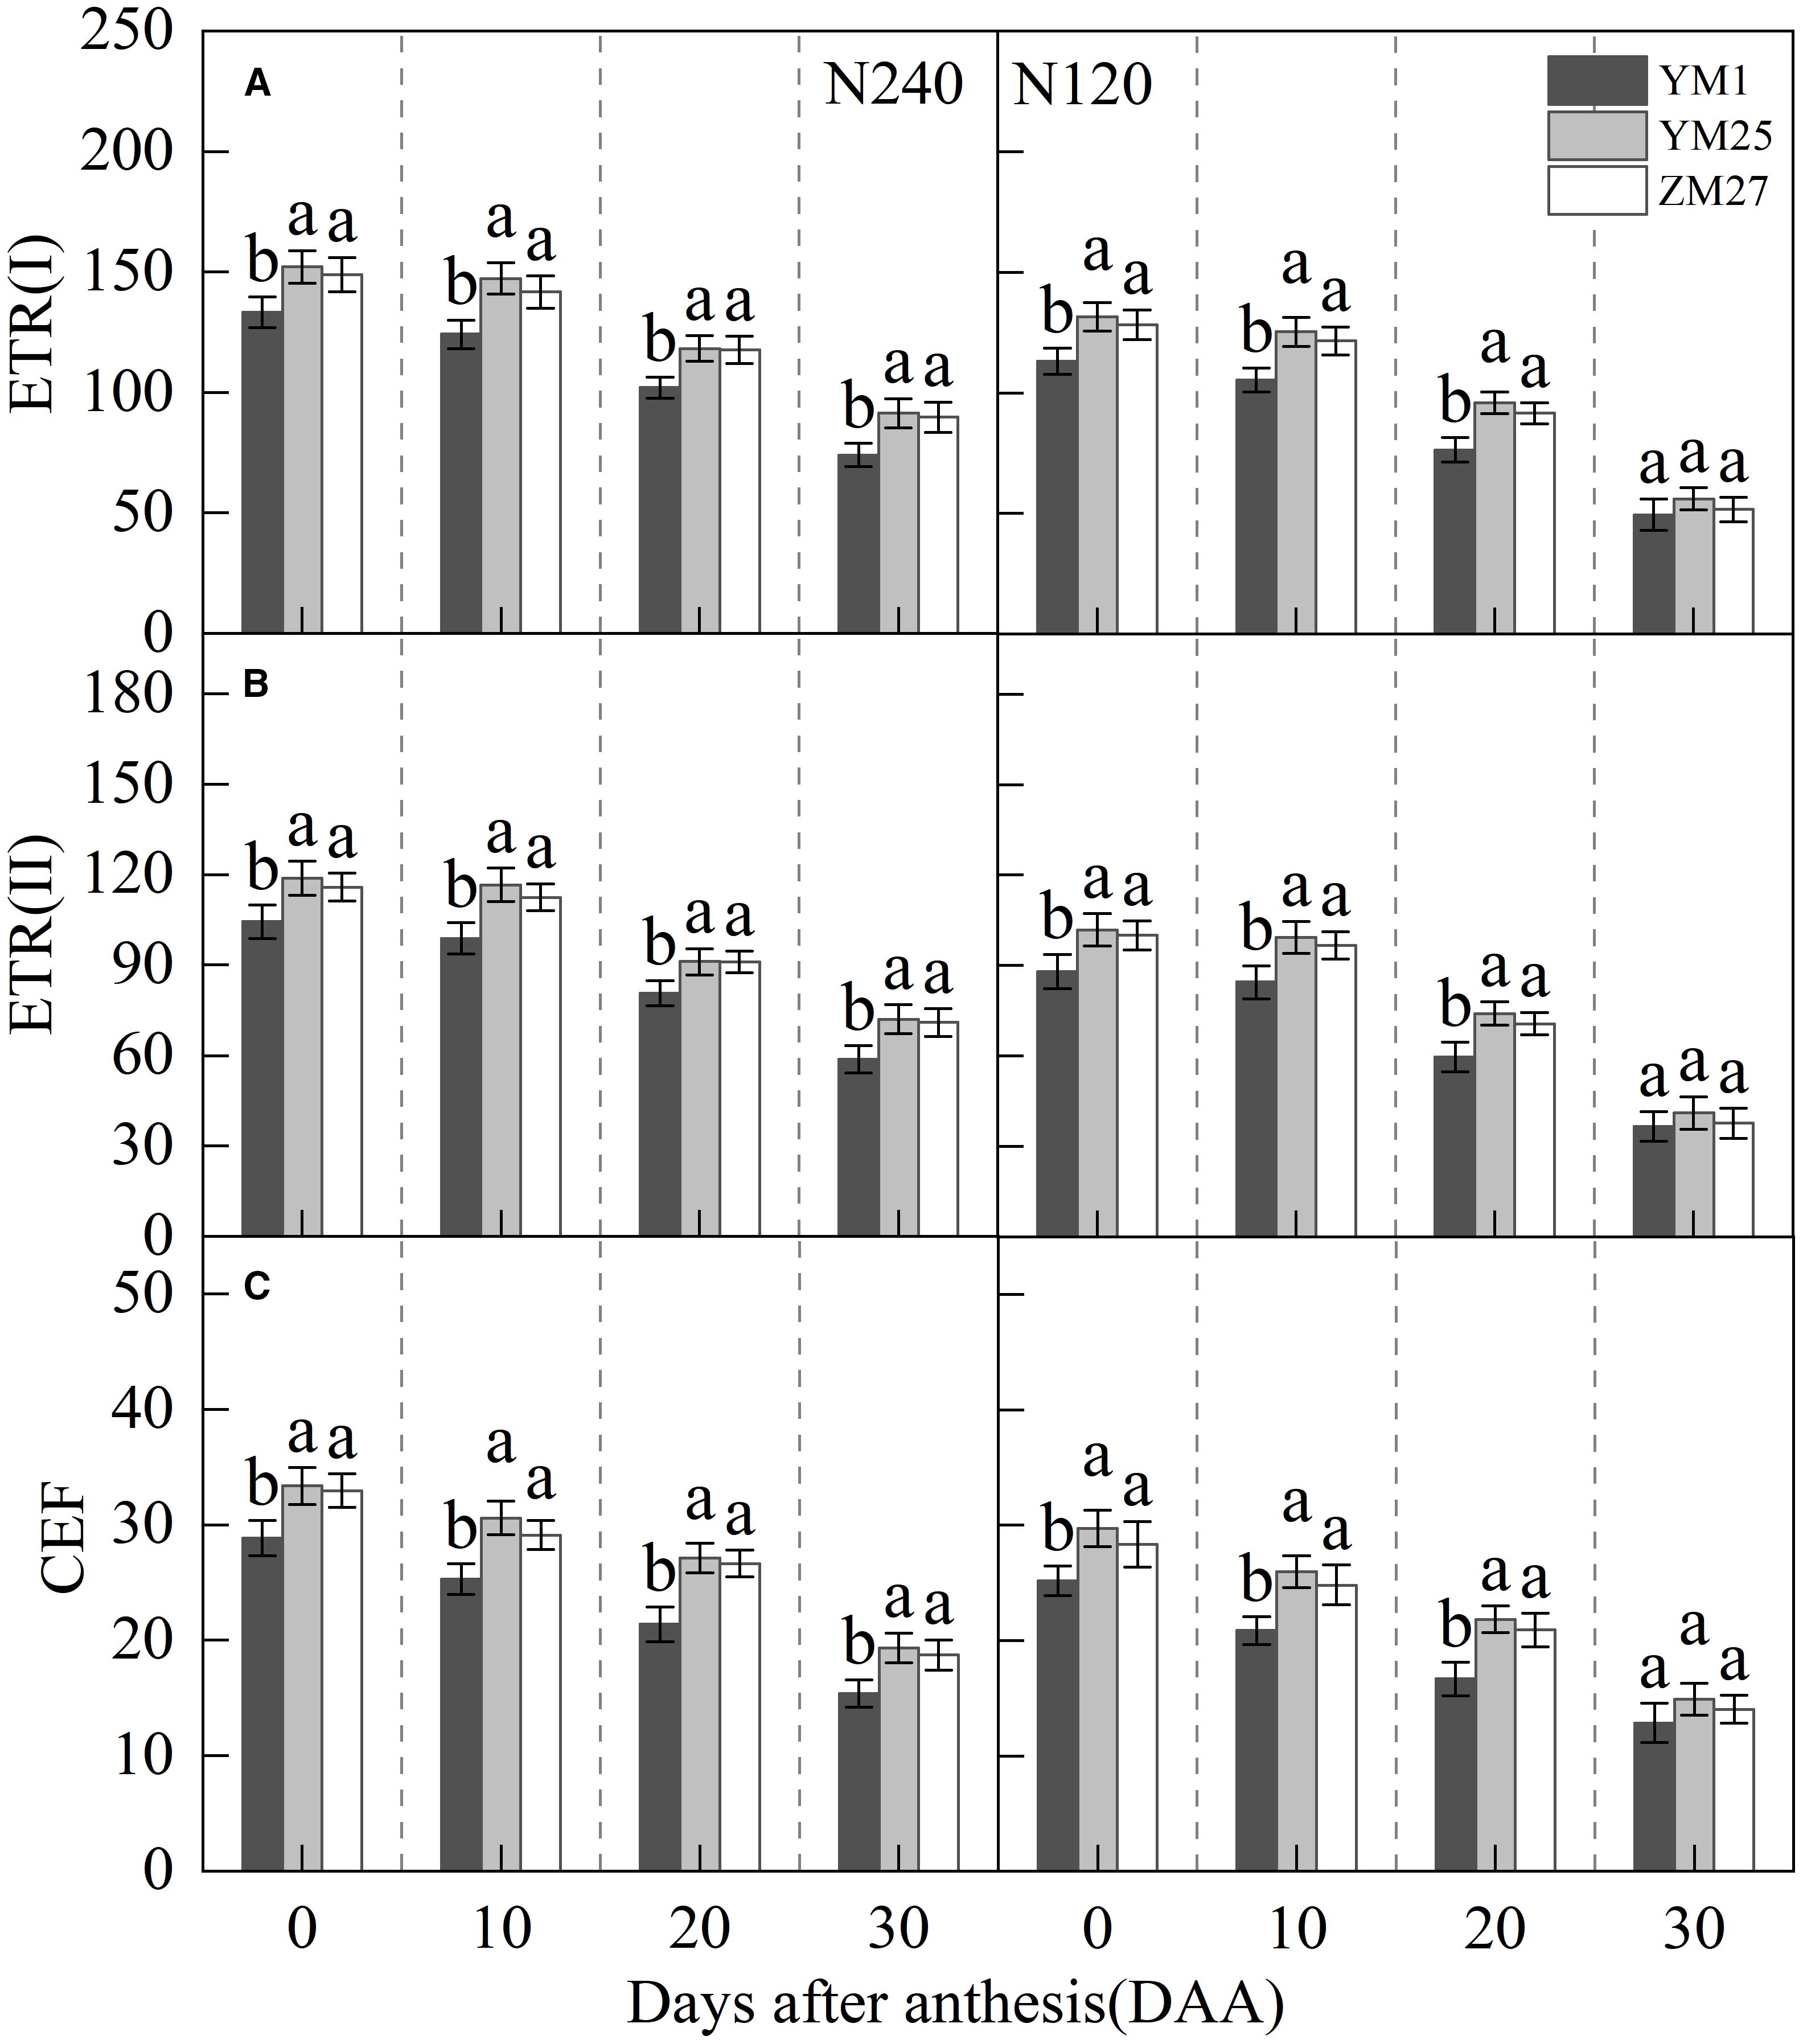
Figure 6. Differences of Electron transport rates ETR(I) (A), ETR(II) (B) and cyclic electron flow (CEF) (C) in flag leaves of wheat with different source-sink relationships. Notes: Each value represents the mean ± SD of three biological replicates. Different lowercase letters indicate statistically significant differences between treatments (P < 0.05) according to LSD test. Error bars indicate SD.
3.6 Soluble protein content
The soluble protein content in the flag leaf first increased and then decreased with days after anthesis, and decreased under lower N levels (Figure 7). YM25 and ZM27 had significantly higher soluble protein content than YM1 during 0–30 DAA under both N treatments. No significant differences were observed between YM25 and ZM27. Under low N conditions, the soluble protein content in the flag leaves of all cultivars significantly decreased. These results indicate that source-limited wheat has higher soluble protein content, which can extend the photosynthetic functional period and delay leaf senescence.
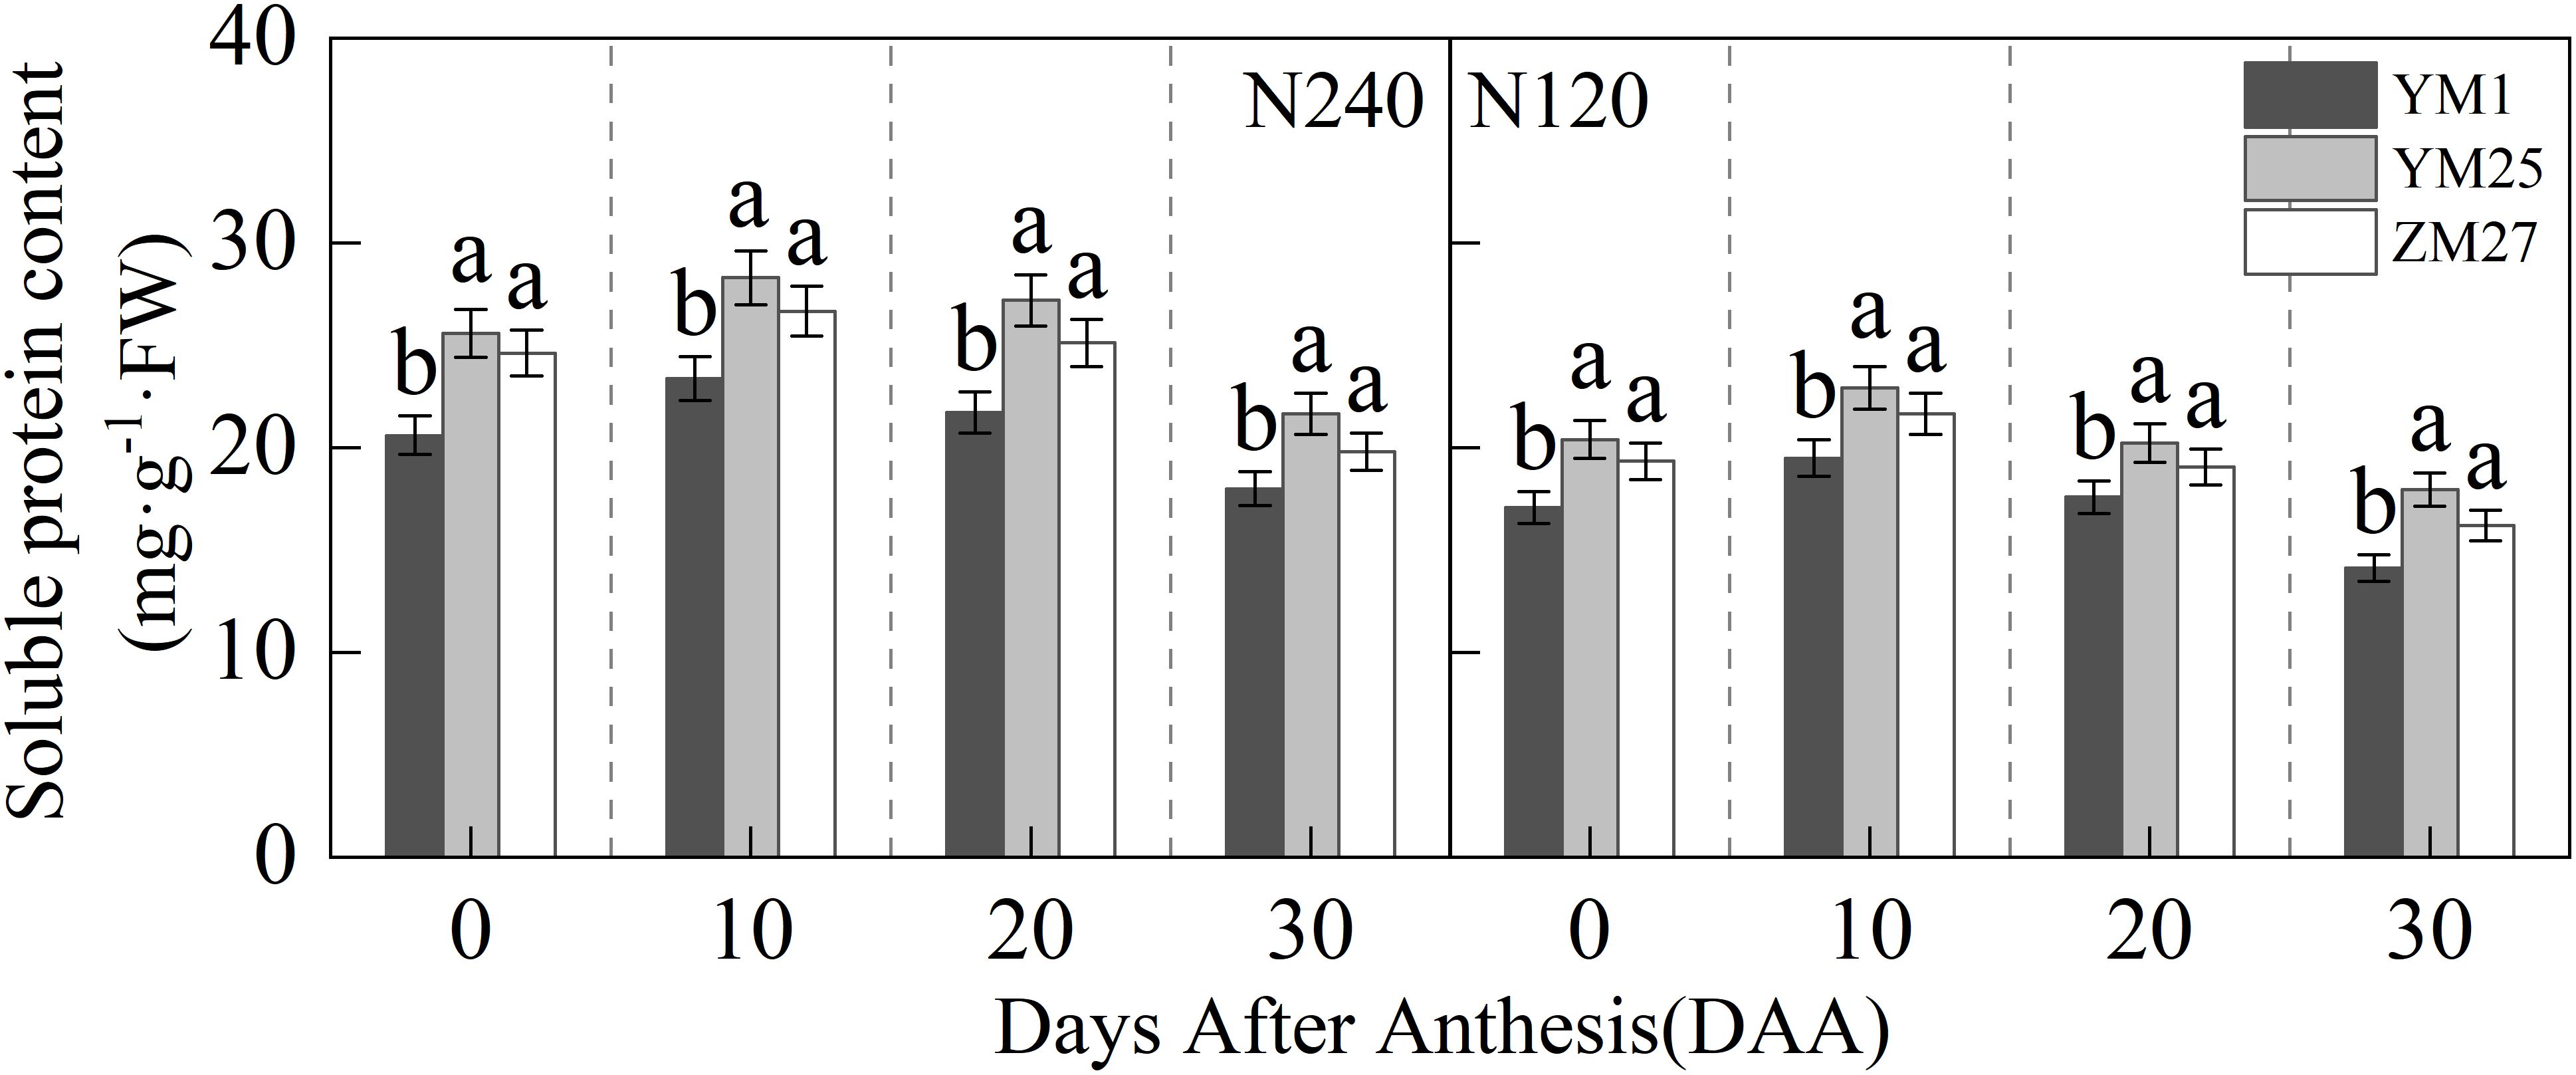
Figure 7. Differences of soluble protein content in flag leaves of wheat with different source-sink. Notes: Each value represents the mean ± SD of three biological replicates. Different lowercase letters indicate statistically significant differences between treatments (P < 0.05) according to LSD test. Error bars indicate SD.
3.7 Malondialdehyde content and O2- production rate
MDA content and the O2- production rate in the flag leaves increased with days after anthesis and were higher under low N conditions (Figures 8A, B). YM1 exhibited a faster increase in MDA content and O2- production rate compared to YM25 and ZM27. During 20–30 DAA, YM25 and ZM27 had significantly lower MDA and O2- levels than YM1, indicating less lipid peroxidation and oxidative stress. Under low N conditions, all cultivars exhibited a significant increase in ROS production, which led to greater lipid peroxidation. These findings highlight the superior oxidative stress tolerance of source-limited wheat, which helps to maintain leaf membrane stability and protect against photoinhibition.
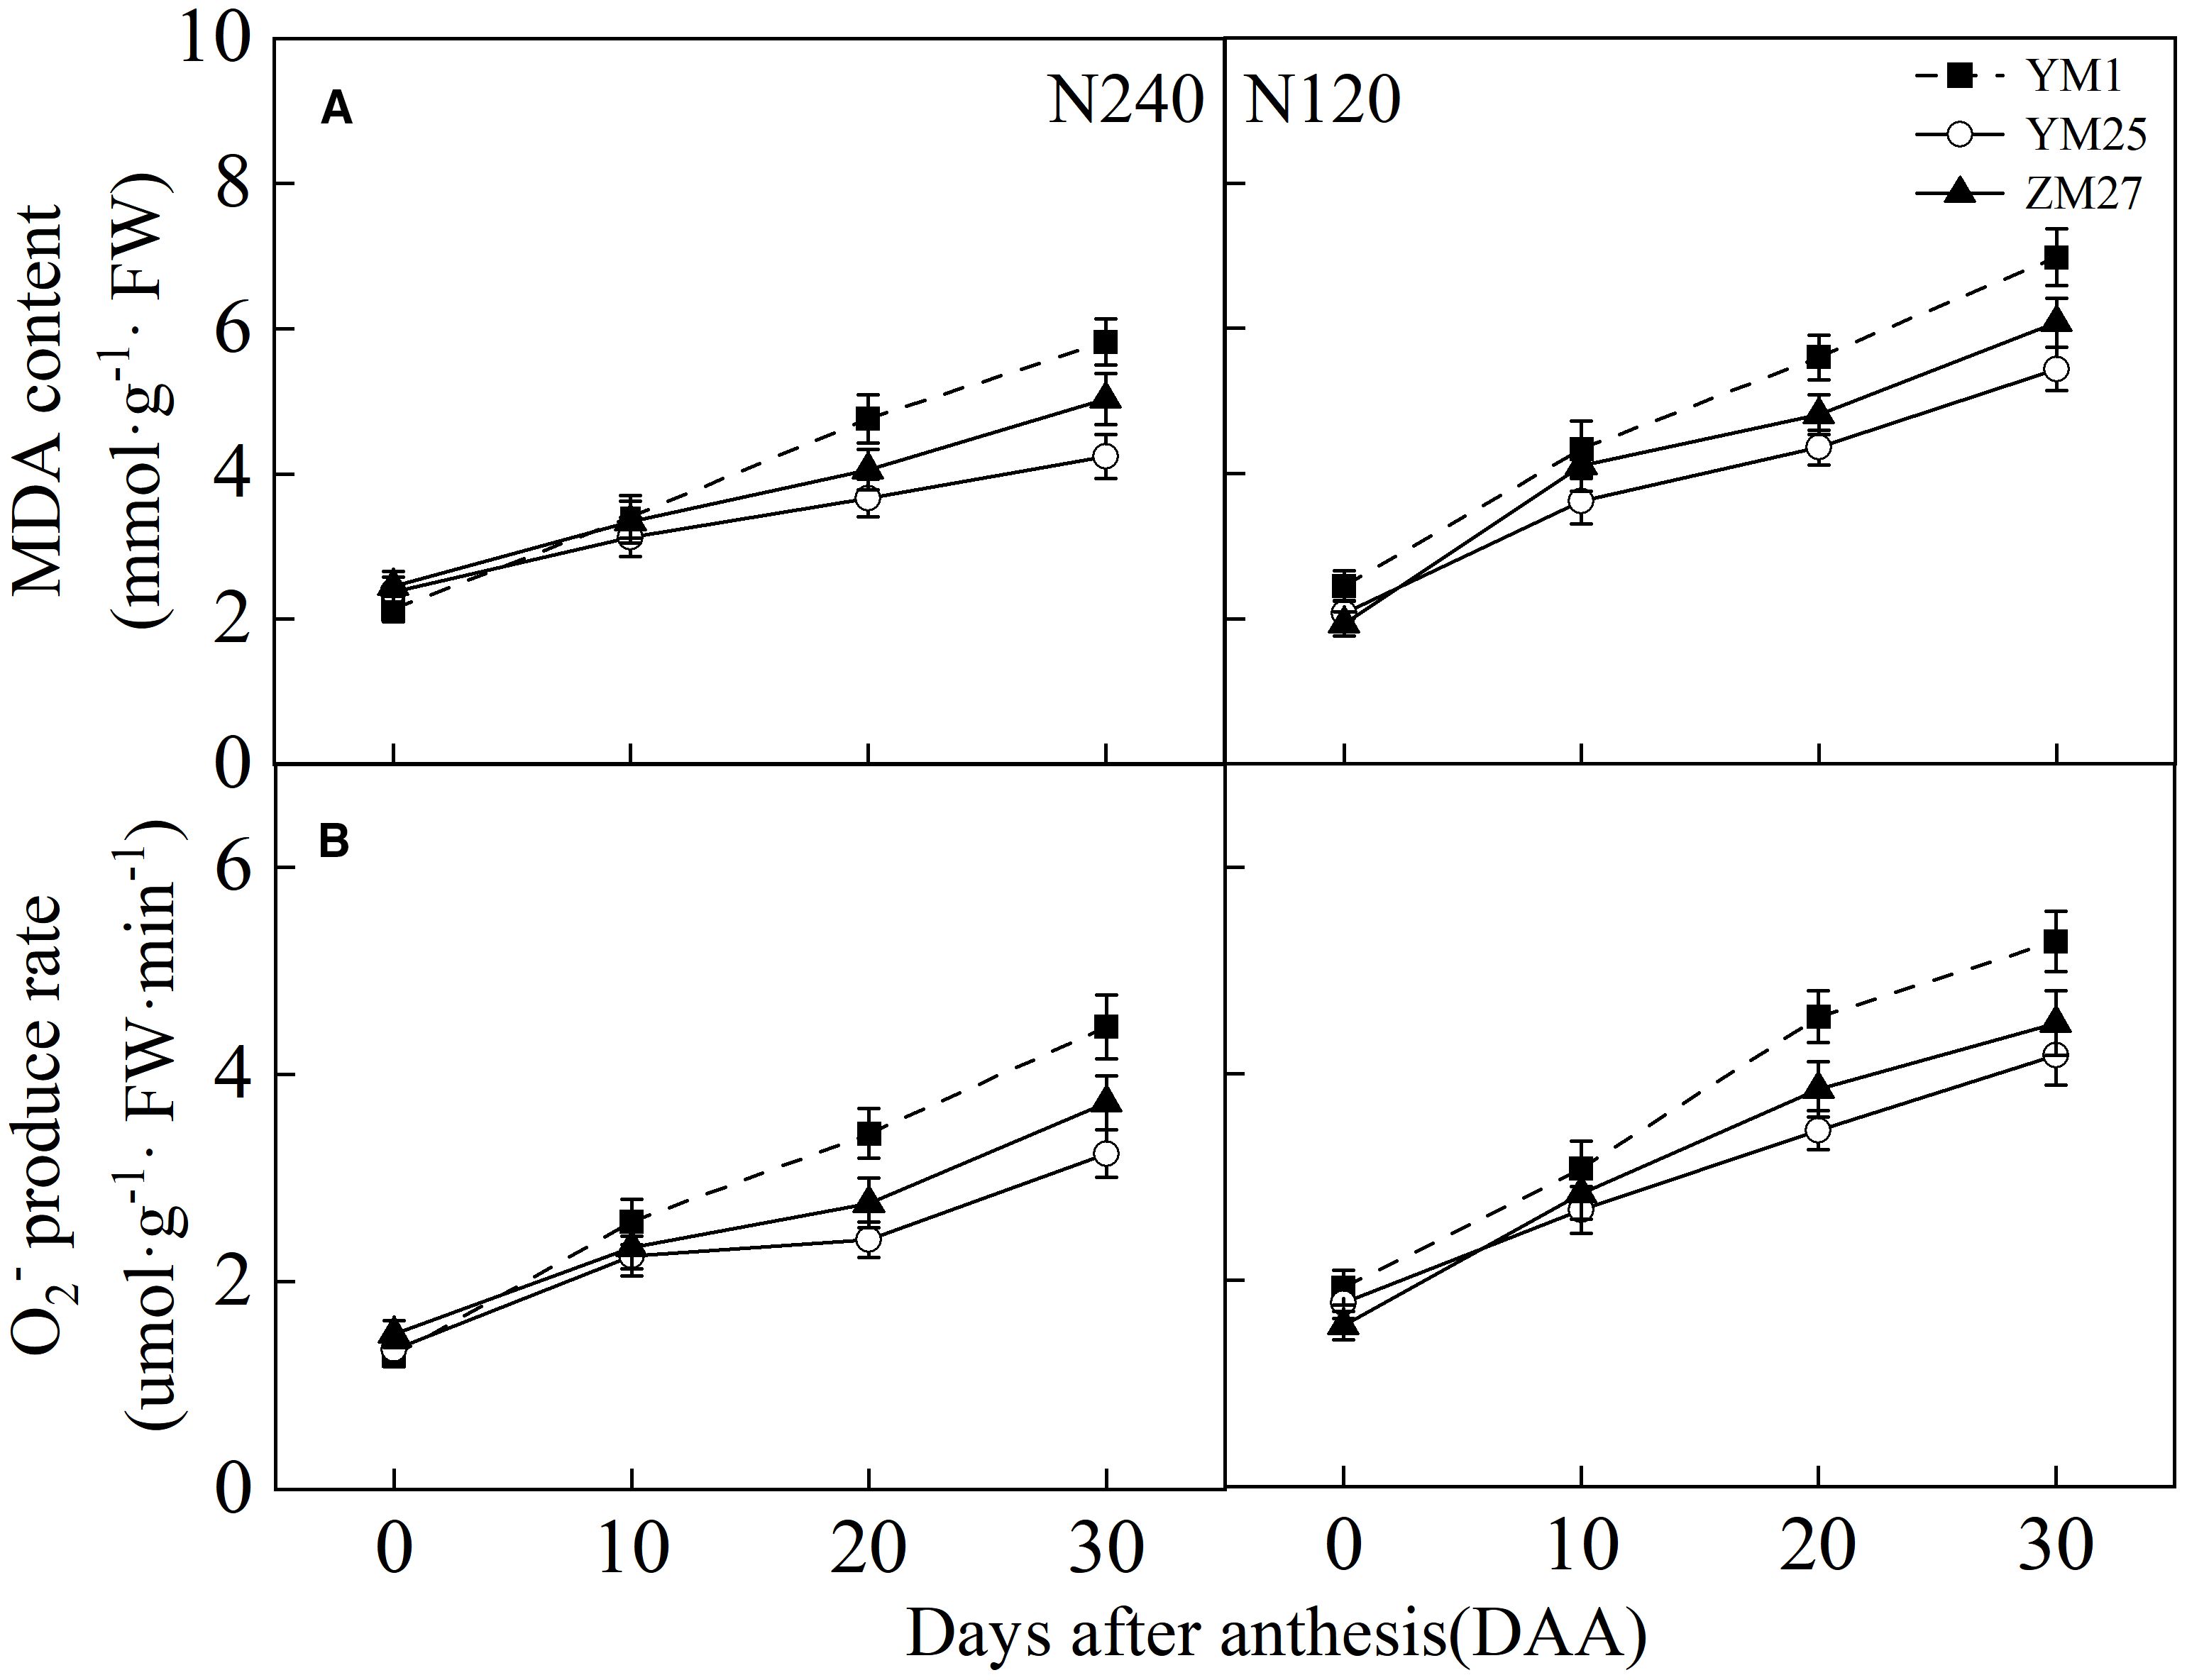
Figure 8. Differences of malondialdehyde (MDA) content (A) and O2- production rate (B) in flag leaves of wheat with different source-sink relationships. Notes: Each value represents the mean ± SD of three biological replicates. Different lowercase letters indicate statistically significant differences between treatments (P < 0.05) according to LSD test. Error bars indicate SD.
3.8 Antioxidant enzyme activity
The activity of SOD and CAT in the flag leaf gradually decreased with days after anthesis and decreased further with reduced N application (Figures 9A, B). The activities of POD and APX in the flag leaf first increased and then decreased with days after anthesis, reaching their maximum value at 10 DAA, and decreased under lower N levels (Figures 9C, D). Under N240 and N120 conditions, the activities of SOD, CAT, and APX in YM25 and ZM27 flag leaves were significantly higher than in YM1 during 0–20 DAA. The POD activity in YM25 and ZM27 flag leaves was significantly higher than in YM1 during 0–30 DAA. No significant differences were observed between YM25 and ZM27. These results suggest that source-limited wheat possesses stronger antioxidant defense systems, enabling it to scavenge reactive oxygen species more effectively and mitigate oxidative damage. Under low N conditions, antioxidant enzyme activities decreased across all cultivars, leading to increased oxidative stress and membrane damage.
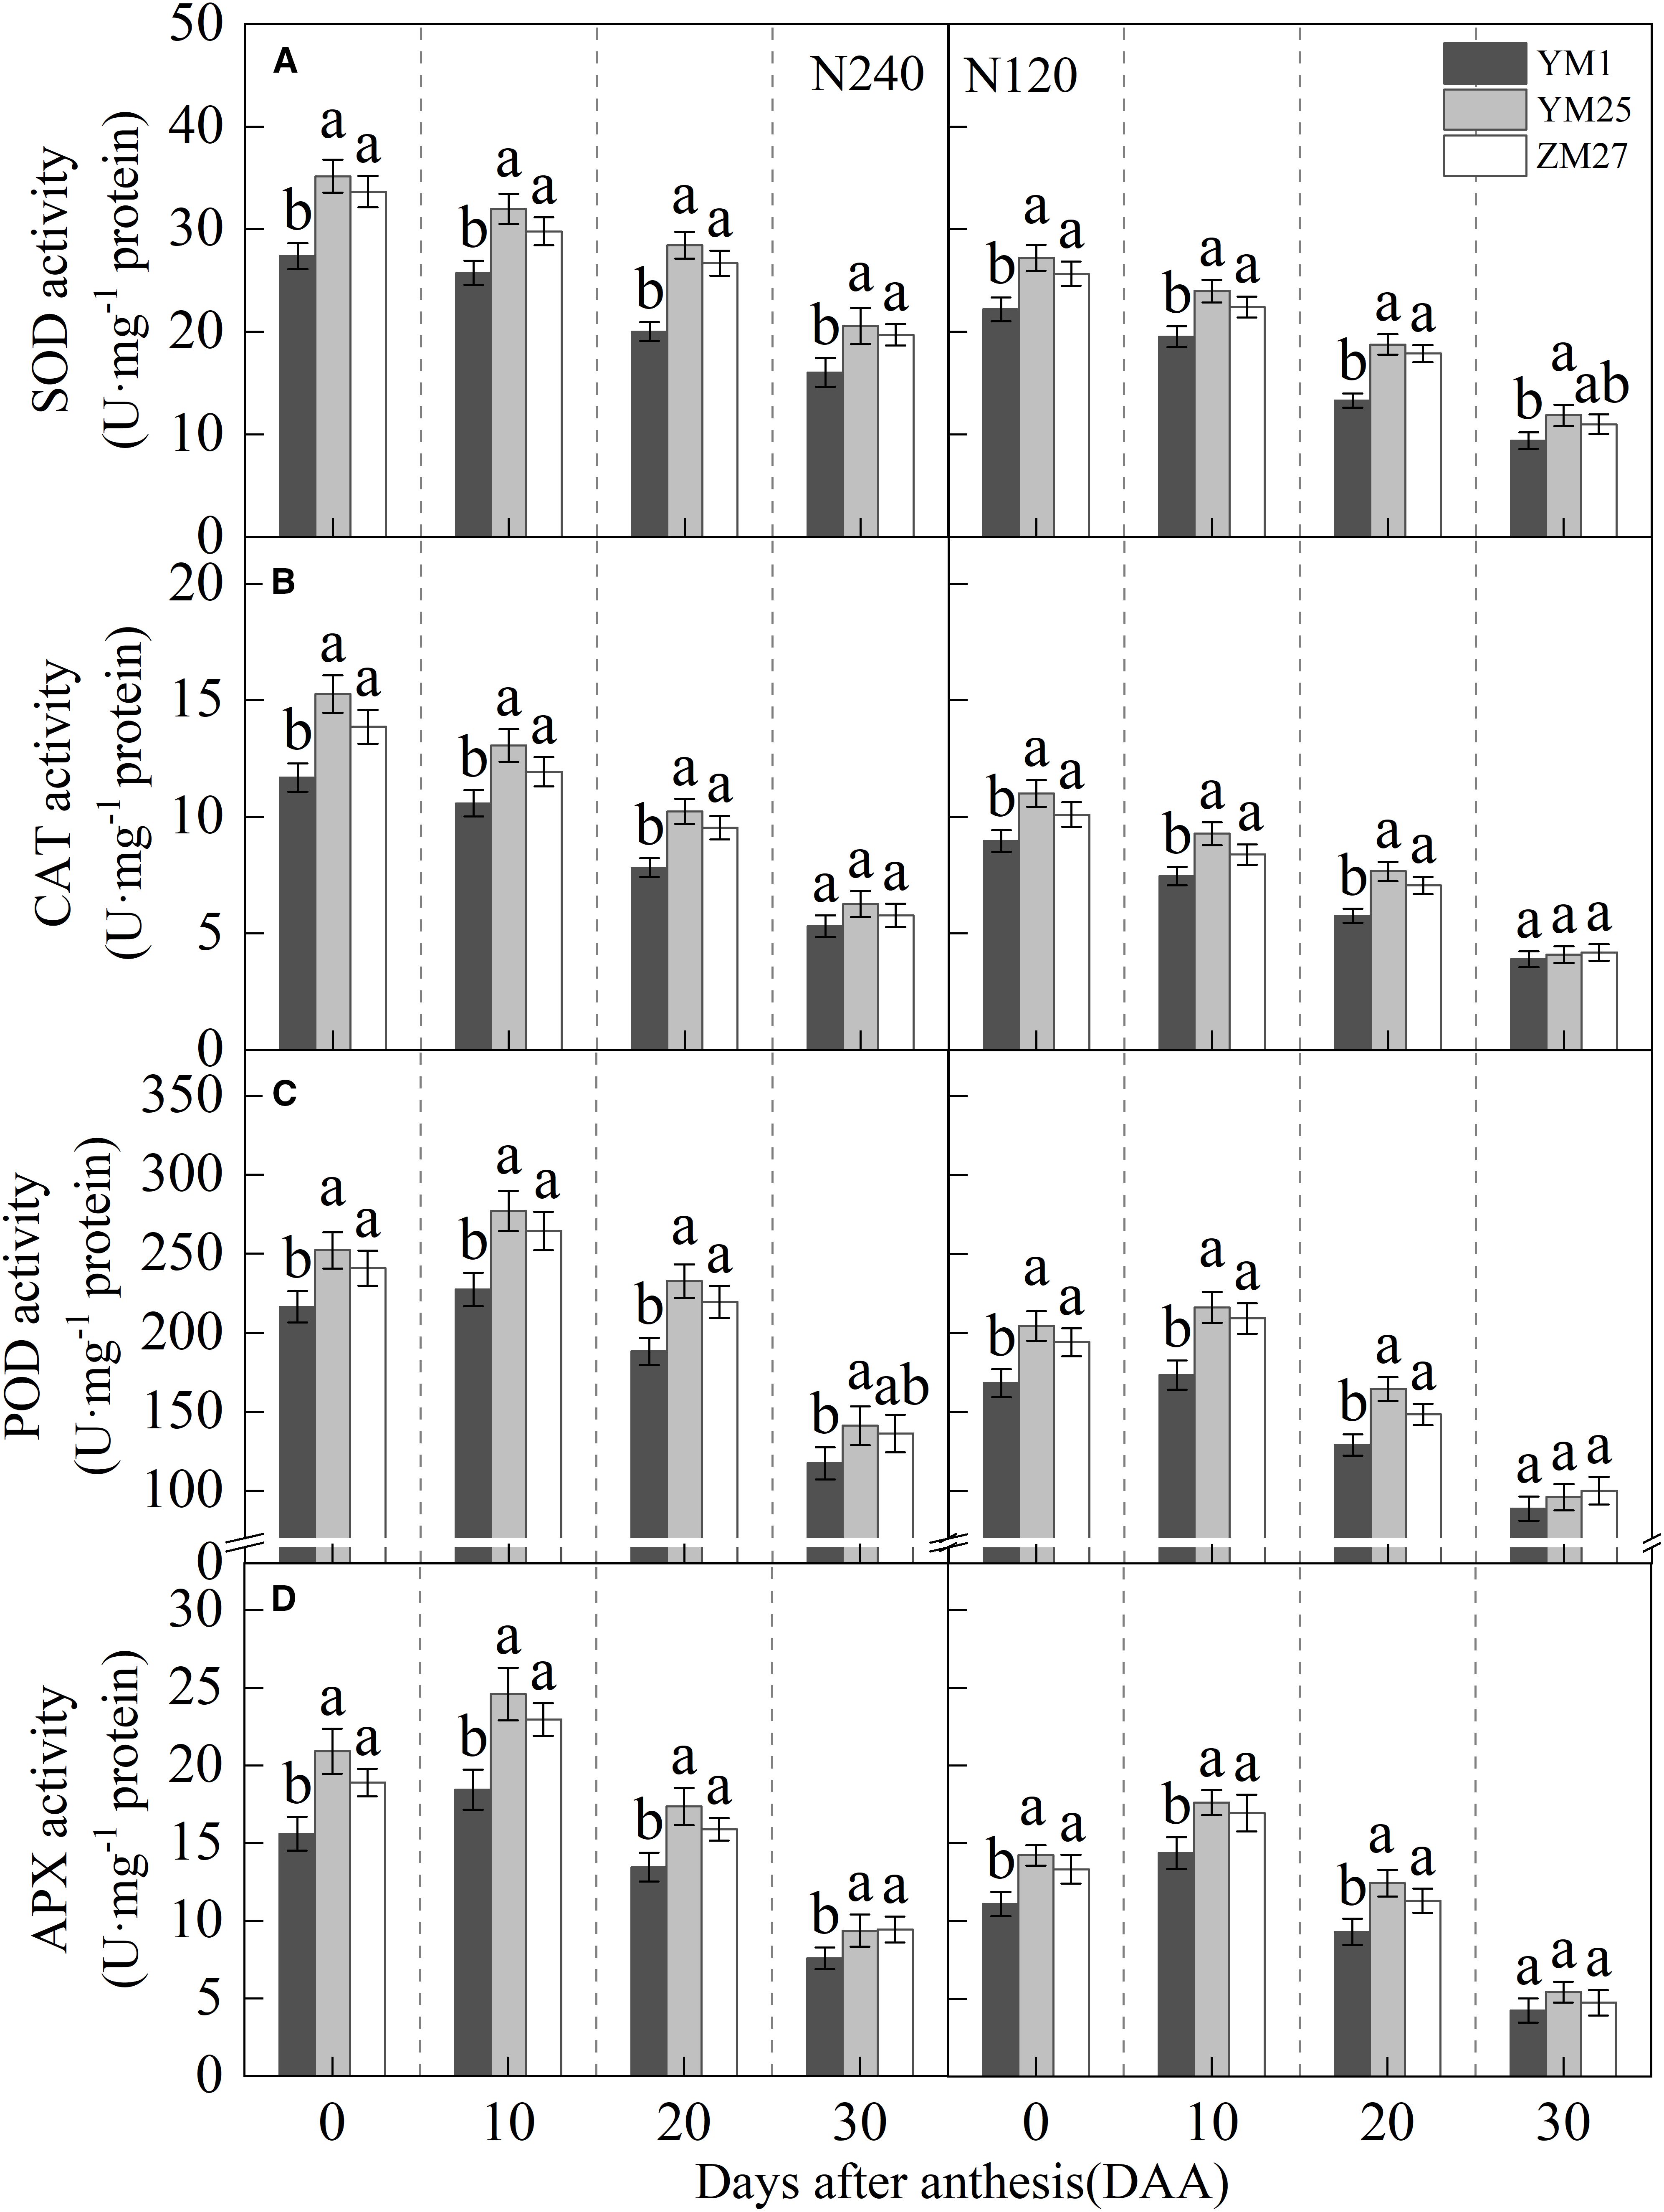
Figure 9. Differences of superoxide dismutase (SOD) activity (A), catalase (CAT) activity (B), peroxidase (POD) activity (C), and ascorbate peroxidase (APX) activity (D) of wheat with different source-sink relationships Notes: Each value represents the mean ± SD of three biological replicates. Different lowercase letters indicate statistically significant differences between treatments (P < 0.05) according to LSD test. Error bars indicate SD.
4 Discussion
4.1 Photosynthetic capacity and source-sink relationships
Our previous study (Zhang et al., 2024a, 2025) explored source-sink relationships, yield, and photosynthetic differences among wheat cultivars, suggesting that the yield, kernels per spike, and thousand-kernel weight of source-limited wheat were significantly higher than sink-limited wheat. Previous studies also suggested that Rubisco activity, as well as sucrose synthesis and transport, regulate photosynthesis in wheat cultivars with different source-sink relationships. In our study, source-limited wheat (YM25 and ZM27) demonstrated higher photosynthetic capacity than sink-limited wheat (YM1), particularly in terms of chlorophyll content, Pnmax, and light energy utilization efficiency (Figures 2A, Figures 3A, B). This finding aligns with previous research, which suggested that source-limited cultivars improved photosynthetic efficiency by enhancing light absorption and utilization (Zhang et al., 2024a, 2016). The higher chlorophyll content and Pnmax in source-limited wheat suggest that these wheat types are more efficient at capturing solar energy and converting it into chemical energy, which is vital for sustaining high yield potential.
The greater photosynthetic capacity in YM25 and ZM27, especially under low N conditions, supports the hypothesis that optimizing the source-sink balance can alleviate the negative impacts of N limitation on photosynthesis. The efficient use of light energy and the enhanced ability of these cultivars to utilize solar radiation effectively are essential for maximizing photosynthetic efficiency and overall yield potential (Foyer and Noctor, 2005). These findings emphasize the importance of considering source-sink interactions in breeding strategies that are aimed at improving wheat productivity under varying environmental conditions.
4.2 Photoprotective mechanisms and light energy dissipation
Research has shown that photoinhibition is a common phenomenon in the late stage of wheat growth (Chai et al., 2022). NPQ and CEF play crucial roles in photoprotection by dissipating excess light energy and preventing photoinhibition (Derks et al., 2015; Yamamoto and Shikanai, 2019). Although NPQ exists in plants, it is one of the reasons for the potential decrease in crop yield due to its ability to reduce the quantum efficiency of photosynthesis (Christa et al., 2018). In this study, YM25 and ZM27 exhibited significantly lower NPQ and ΦNPQ, while ΦNQ was higher than YM1, indicating that these cultivars were more efficient at dissipating excess light energy without compromising photosynthetic efficiency (Figures 4A–C). The lower NPQ in source-limited wheat suggested that these cultivars maintained a more efficient light-energy dissipation system, allowing them to optimize photosynthetic performance and minimize light-induced damage (Murchie and Ruban, 2020; Muller et al., 2014). In contrast, YM1, with its sink-limited characteristics, exhibited higher NPQ and greater heat dissipation, which may reduce photosynthetic quantum efficiency and contribute to photoinhibition under high light conditions.
Analyzing the PSI photosynthetic quantum yield, Y(ND) represents the quantum yield of non-photochemical quenching in PSI caused by donor side limitation, while Y(NA) represents the quantum yield of non-regulated energy dissipation in PSI caused by acceptor side limitation. This study suggested that, compared with the sink-limited wheat YM1, the flag leaves of source-limited wheat YM25 and ZM27 had less limitation in the Y(NA) and Y(ND) of the PSI receptor and donor sides, maintaining stable downstream electron transport of PSI, resulting in higher PSI light energy utilization efficiency and electron transport capacity (Figures 5B, C). In contrast, the Y(NA) and Y(ND) of the flag leaves of sink-limited wheat YM1 increased significantly, blocking downstream electron transport in PSI, resulting in lower PSI light energy utilization efficiency.
The higher CEF in YM25 and ZM27 further supported the notion that source-limited wheat can better protect its photosystems from light-induced stress (Figure 6C). CEF is a crucial process for maintaining PSI light energy utilization efficiency and reducing oxidative damage to the photosynthetic apparatus (Yamamoto et al., 2021; Storti et al., 2019). CEF can alleviate excessive reduction and superoxide anion generation on the PSI receptor side, as well as protect PSI from photoinhibition (Cun et al., 2022). The ability to enhance CEF in response to light stress, particularly under low N conditions, highlights the photoprotective capacity of source-limited wheat and its ability to maintain stable photosynthetic performance despite environmental challenges.
The source-limited wheat YM25 and ZM27, characterized by a stronger sink demand relative to source capacity, help maintain a higher metabolic flux and delay the onset of senescence signals in the flag leaf. This sustained metabolic activity likely preserves the integrity and functionality of the photosynthetic apparatus for longer, enabling more efficient regulation of energy dissipation (lower wasteful NPQ, and ΦNPQ, higher regulated ΦNQ), facilitates greater CEF activity for balancing ATP/NADPH ratios and protecting PSI, and supports the sustained synthesis and activity of antioxidant enzymes and compounds, collectively leading to superior photoprotection. In contrast, the sink-limited wheat YM1 may lead to earlier feedback inhibition of photosynthesis and accelerated senescence, compromising the coordination of these photoprotective pathways and resulting in higher NPQ, lower CEF, and reduced antioxidant capacity, making it more susceptible to photoinhibition and oxidative damage.
4.3 Antioxidant defense and leaf senescence
Excess light energy in photosynthesis triggers reactive oxygen species (ROS) production via oxygen-dependent electron transfer (Szarka et al., 2012). This electron overload induces oxidative damage through lipid peroxidation and membrane disruption (Zaffagnini et al., 2012). Plants counteract this with dual antioxidant systems: low-molecular-weight compounds (e.g., glutathione) and enzymatic regulators (e.g., superoxide dismutase) (Zhu et al., 2023). Our study showed that source-limited wheat (YM25 and ZM27) exhibited higher levels of carotenoids, soluble proteins, and antioxidant enzyme activities (SOD, CAT, POD, and APX) compared to sink-limited YM1 (Figure 2B, Figure 7, and Figures 9A–D). The enhanced antioxidant capacity in these cultivars likely contributes to their superior ability to scavenge ROS and mitigate oxidative damage (Figures 8A, B), which is crucial for protecting the photosynthetic apparatus from photoinhibition and delaying leaf senescence (Ewald, 2018). The higher soluble protein content in YM25 and ZM27 suggests that these cultivars can sustain prolonged photosynthetic activity, which may delay leaf senescence and improve overall plant productivity (Zivcak et al., 2013).
In contrast, YM1, with its weaker source strength, exhibited a more rapid accumulation of ROS and MDA, indicating greater lipid peroxidation and membrane damage (Figures 8A, B). This accelerated oxidative stress and leaf senescence in YM1 may explain its lower photosynthetic capacity and yield potential compared to source-limited wheat (YM25 and ZM27). The ability of source-limited wheat to maintain higher antioxidant enzyme activity and reduce ROS production may be key to its superior environmental adaptability, allowing it to better cope with both high light and N-deficient conditions.
4.4 N fertilization and photosynthetic efficiency
N fertilization significantly improved the photosynthetic capacity and light energy utilization efficiency of all wheat cultivars, as reflected in higher Pnmax, ΦCO2, and reduced photoinhibition under high N conditions (Figures 3-5). N is a critical nutrient for chlorophyll synthesis and enzyme function, and its availability directly influences photosynthetic efficiency (Mu and Chen, 2021). The results from this study confirmed that N fertilization alleviates the limitations imposed by low N levels, enabling plants to sustain higher Pn and better light energy utilization.
However, under low N stress, the leaves are more susceptible to light damage, and plants can alleviate photoinhibition by increasing heat dissipation (Pinnola and Bassi, 2018; Takahashi and Badger, 2011). Our study showed that under low N conditions, all cultivars exhibited decreased photosynthetic efficiency, increased photoinhibition, and greater oxidative stress (Figures 3-5, Figure 8). This highlights the importance of balanced N management to optimize photosynthesis and minimize yield losses due to nutrient deficiencies. While source-limited wheat (YM25 and ZM27) showed superior ability to mitigate the effects of low N through enhanced photoprotective mechanisms, N fertilization still played a crucial role in improving overall photosynthetic capacity and yield potential. Therefore, a combination of optimized N fertilization and source-sink balance management can significantly enhance wheat productivity.
4.5 Implications for wheat breeding and future research
This study provided valuable insights into the role of source-sink relationships and photoprotective mechanisms in improving wheat photosynthesis and yield potential. Source-limited wheat (YM25 and ZM27) demonstrated higher photosynthetic efficiency, greater resistance to photoinhibition, and superior antioxidant capacity compared to sink-limited wheat. These traits contribute to their better adaptability to environmental stresses, such as N limitation. The findings suggested that improving the source-sink relationship, along with optimizing N management, could significantly enhance wheat productivity, particularly in areas where N availability is limited.
Future research should focus on identifying the genetic pathways that regulate source-sink dynamics and photoprotective mechanisms in wheat. Understanding the molecular basis of these processes could provide new targets for breeding programs aimed at developing high-yielding wheat cultivars with improved photosynthetic efficiency and environmental adaptability. Additionally, investigating the interaction between source-sink relationships and other abiotic stresses, such as drought and heat, will be essential for developing wheat cultivars capable of withstanding the challenges posed by climate change.
5 Conclusion
Source-limited wheat, by enhancing the photosynthetic capacity of flag leaves, exhibited stronger light energy utilization efficiency and alleviated photoinhibition while reducing light-induced damage through decreased NPQ and increased CEF proportion. Additionally, source-limited wheat had stronger antioxidant capacity, which enabled it to scavenge reactive oxygen species, reduce membrane lipid peroxidation, and delay leaf senescence. Increased N fertilization significantly improved wheat’s photosynthetic capacity and light energy utilization efficiency, alleviating photoinhibition. Source-limited wheat maintained the integrity of the photosynthetic apparatus under low N conditions by enhancing photoprotective mechanisms, demonstrating stronger environmental adaptability. Therefore, proper N fertilization and optimization of the source-sink relationship can help improve wheat’s photosynthetic capacity and yield potential.
Data availability statement
The original contributions presented in the study are included in the article/supplementary material. Further inquiries can be directed to the corresponding author.
Author contributions
SZ: Writing – review & editing, Investigation, Supervision, Validation, Conceptualization, Software, Funding acquisition, Writing – original draft, Methodology, Project administration, Formal Analysis, Visualization, Resources, Data curation. XL: Supervision, Conceptualization, Software, Investigation, Writing – original draft, Project administration, Formal Analysis, Validation. XW: Methodology, Writing – review & editing, Supervision, Formal Analysis, Conceptualization, Data curation, Software, Investigation. JZ: Data curation, Software, Conceptualization, Methodology, Investigation, Supervision, Writing – review & editing. GL: Formal Analysis, Project administration, Conceptualization, Funding acquisition, Investigation, Writing – review & editing. ZT: Formal Analysis, Software, Conceptualization, Funding acquisition, Resources, Visualization, Investigation, Writing – review & editing, Project administration, Validation.
Funding
The author(s) declare financial support was received for the research and/or publication of this article. This study is financially supported by the National Natural Science Foundation of China (Grant No. 32272215), Henan Province Science and Technology Research Key Project (252102111082), and Open Funded Project of State Key Laboratory of Intelligent Agricultural Power Equipment (SKLIAPME2023011).
Conflict of interest
The authors/remaining authors declare that the research was conducted in the absence of any commercial or financial relationships that could be construed as a potential conflict of interest
Generative AI statement
The author(s) declare that no Generative AI was used in the creation of this manuscript.
Any alternative text (alt text) provided alongside figures in this article has been generated by Frontiers with the support of artificial intelligence and reasonable efforts have been made to ensure accuracy, including review by the authors wherever possible. If you identify any issues, please contact us.
Publisher’s note
All claims expressed in this article are solely those of the authors and do not necessarily represent those of their affiliated organizations, or those of the publisher, the editors and the reviewers. Any product that may be evaluated in this article, or claim that may be made by its manufacturer, is not guaranteed or endorsed by the publisher.
References
Ślesak, I. and Ślesak, H. (2021). The activity of Rubisco and energy demands for its biosynthesis: Comparative studies with CO2-reductases. J. Plant Physiol. 257, 153337. doi: 10.1016/j.jplph.2020.153337, PMID: 33421837
Burnett, A. C., Rogers, A., Rees, M., and Osborne, C. P. (2016). Carbon source–sink limitations differ between two species with contrasting growth strategies. Plant Cell Environ. 39, 2460–2472. doi: 10.1111/pce.12801, PMID: 27422294
Chai, Y., Zhao, Z., Lu, S., Chen, L., and Hu, Y. (2022). Field evaluation of wheat varieties using canopy temperature depression in three different climatic growing seasons. Plants. 11, 3471. doi: 10.3390/plants11243471, PMID: 36559583
Christa, G., Pütz, L., Sickinger, C., Melo Clavijo, J., Laetz, E. M., Greve, C., et al. (2018). Photoprotective non-photochemical quenching does not prevent kleptoplasts from net photoinactivation. Front. Ecol. Evol. 6. doi: 10.3389/fevo.2018.00121
Cun, Z., Wu, H. M., Zhang, J. Y., Shuang, S. P., Hong, J., and Chen, J. W. (2022). Responses of linear and cyclic electron flow to nitrogen stress in an N-sensitive species Panax notoginseng. Front. Plant Sci. 13. doi: 10.3389/fpls.2022.796931, PMID: 35242152
Derks, A., Schaven, K., and Bruce, D. (2015). Diverse mechanisms for photoprotection in photosynthesis: Dynamic regulation of photosystem II excitation in response to rapid environmental change. Biochim. Biophys. Acta Bioenerg. 1847, 468–485. doi: 10.1016/j.bbabio.2015.02.008, PMID: 25687894
Djanaguiraman, M., Narayanan, S., Erdayani, E., and Prasad, P. V. (2020). Effects of high temperature stress during anthesis and grain filling periods on photosynthesis, lipids and grain yield in wheat. BMC Plant Biol. 20, 1–12. doi: 10.21203/rs.3.rs-20749/v1, PMID: 32517754
Ewald, C. Y. (2018). Redox signaling of NADPH oxidases regulates oxidative stress responses, immunity and aging. Antioxidants. 7, 130. doi: 10.3390/antiox7100130, PMID: 30274229
Fernie, A. R., Bachem, C. W., Helariutta, Y., Neuhaus, H. E., Prat, S., Ruan, Y. L., et al. (2020). Synchronization of developmental, molecular and metabolic aspects of source-sink interactions. Nat. Plants 6, 55–66. doi: 10.1038/s41477-020-0590-x, PMID: 32042154
Foyer, C. H. and Noctor, G. (2005). Redox homeostasis and antioxidant signaling: A metabolic interface between stress perception and physiological responses. Plant Cell. 17, 1866–1875. doi: 10.1105/tpc.105.033589, PMID: 15987996
Hadwan, M. H. (2018). Simple spectrophotometric assay for measuring catalase activity in biological tissues. BMC Biochem. 19, 1–8. doi: 10.1186/s12858-018-0097-5, PMID: 30075706
Jiang, D., Dai, T., Jing, Q., Cao, W., Zhou, Q., Zhao, H., et al. (2004). Effects of long-term fertilization on leaf photosynthetic characteristics and grain yield in winter wheat. Photosynthetica. 42, 439–446. doi: 10.1023/B:PHOT.0000046164.77410.ef
Krahmer, J., Ganpudi, A., Abbas, A., Romanowski, A., and Halliday, K. J. (2018). Phytochrome, carbon sensing, metabolism, and plant growth plasticity. Plant Physiol. 176, 1039–1048. doi: 10.1104/pp.17.01437, PMID: 29254984
Kramer, D. M., Johnson, G., Kiirats, O., and Edwards, G. E. (2004). New fluorescence parameters for the determination of QA redox state and excitation energy fluxes. Photosynth. Res. 79, 209–218. doi: 10.1023/B:PRES.0000015391.99477.0d, PMID: 16228395
Li, Y., Gao, Y., Xu, X., Shen, Q., and Guo, S. (2009). Light-saturated photosynthetic rate in high-nitrogen rice (Oryza sativa L.) leaves is related to chloroplastic CO2 concentration. J. Exp. Bot. 60, 2351–2360. doi: 10.1093/jxb/erp127, PMID: 19395387
Lichtenthaler, H. K. and Buschmann, C. (2001). Chlorophylls and carotenoids: Measurement and characterization by UV-VIS spectroscopy. Curr. Protoc. Food Anal. Chem. 1, F4–F3. doi: 10.1002/0471142913.faf0403s01
Liu, Y., Chen, J. M., He, L., Wang, R., Smith, N. G., Keenan, T. F., et al. (2023). Global photosynthetic capacity of C3 biomes retrieved from solar-induced chlorophyll fluorescence and leaf chlorophyll content. Remote Sens. Environ. 287, 113457. doi: 10.1016/j.rse.2023.113457
Liu, T., Liu, L., Zhou, T., Chen, Y., Zhou, H., Lyu, J., et al. (2025). Chalcone isomerase gene (OsCHI3) increases rice drought tolerance by scavenging ROS via flavonoid and ABA metabolic pathways. Crop J. 13, 372–384. doi: 10.1016/j.cj.2025.01.019
Lu, D., Zhang, Y., Zhang, A., and Lu, C. (2022). Non-photochemical quenching: From light perception to photoprotective gene expression. Int. J. Mol. Sci. 23, 687. doi: 10.3390/ijms23020687, PMID: 35054872
Miri, H. (2009). Changes in grain yield and associated physiological traits in Iranian wheat (Triticum aestivum L.) cultivars released during 1940-2000. J. Water Soil Sci. 12, 43–62. doi: 10.22125/jstnar.2009.1445
Mu, X. and Chen, Y. (2021). The physiological response of photosynthesis to nitrogen deficiency. Plant Physiol. Biochem. 158, 76–82. doi: 10.1016/j.plaphy.2020.11.019, PMID: 33296848
Muller, O., Cohu, C. M., Stewart, J. J., Protheroe, J. A., Demmig-Adams, B., and Adams, W. W., I.I.I. (2014). Association between photosynthesis and contrasting features of minor veins in leaves of summer annuals loading phloem via symplastic versus apoplastic routes. Physiol. Plant 152, 174–183. doi: 10.1111/ppl.12155, PMID: 24450755
Murchie, E. H. and Ruban, A. V. (2020). Dynamic non-photochemical quenching in plants: From molecular mechanism to productivity. Plant J. 101, 885–896. doi: 10.1111/tpj.14601, PMID: 31686424
Öquist, G. and Chow, W. S. (1992). On the relationship between the quantum yield of Photosystem II electron transport, as determined by chlorophyll fluorescence and the quantum yield of CO2-dependent O2 evolution. Photosynth. Res. 33, 51–62. doi: 10.1007/bf00032982, PMID: 24408447
Pageau, K., Reisdorf-Cren, M., Morot-Gaudry, J. F., and Masclaux-Daubresse, C. (2006). The two senescence-related markers, GS1 (cytosolic glutamine synthetase) and GDH (glutamate dehydrogenase), involved in nitrogen mobilization, are differentially regulated during pathogen attack and by stress hormones and reactive oxygen species in Nicotiana tabacum L. leaves. J. Exp. Bot. 57, 547–557. doi: 10.1093/jxb/erj035, PMID: 16377736
Pinnola, A. and Bassi, R. (2018). Molecular mechanisms involved in plant photoprotection. Biochem. Soc Trans. 46, 467–482. doi: 10.1042/BST20170307, PMID: 29666217
Shimakawa, G., Krieger-Liszkay, A., and Roach, T. (2022). ROS-derived lipid peroxidation is prevented in barley leaves during senescence. Physiol. Plant 174, e13769. doi: 10.1111/ppl.13769, PMID: 36018559
Snyder, J. C. and Desborough, S. L. (1978). Rapid estimation of potato tuber total protein content with Coomassie Brilliant Blue G-250. Theor. Appl. Genet. 52, 135–139. doi: 10.1007/BF00264747, PMID: 24317460
Storti, M., Alboresi, A., Gerotto, C., Aro, E. M., Finazzi, G., and Morosinotto, T. (2019). Role of cyclic and pseudo-cyclic electron transport in response to dynamic light changes in Physcomitrella patens. Plant Cell Environ. 42, 1590–1602. doi: 10.1111/pce.13493, PMID: 30496624
Szarka, A., Tomasskovics, B., and Bánhegyi, G. (2012). The ascorbate-glutathione-α-tocopherol triad in abiotic stress response. Int. J. Mol. Sci. 13, 4458–4483. doi: 10.3390/ijms13044458, PMID: 22605990
Takahashi, S. and Badger, M. R. (2011). Photoprotection in plants: A new light on photosystem II damage. Trends Plant Sci. 16, 53–60. doi: 10.1016/j.tplants.2010.10.001, PMID: 21050798
Tan, W., Liu, J., Dai, T., Jing, Q., Cao, W., and Jiang, D. (2008). Alterations in photosynthesis and antioxidant enzyme activity in winter wheat subjected to post-anthesis water-logging. Photosynthetica. 46, 21–27. doi: 10.1007/s11099-008-0005-0
Trebst, A. (1980). Inhibitors in electron flow: tools for the functional and structural localization of carriers and energy conservation sites. Methods Enzymol. 69, 675–715. doi: 10.1016/S0076-6879(80)69067-3
Wada, Y. and Wada, G. (1991). Varietal difference in leaf senescence during ripening period of advanced indica rice. Jpn. J. Crop Sci. 60, 529–536. doi: 10.1626/jcs.60.529
Wang, Z. M., Wei, A. L., and Zheng, D. M. (2001). Photosynthetic characteristics of non-leaf organs of winter wheat cultivars differing in ear type and their relationship with grain mass per ear. Photosynthetica. 39, 239–244. doi: 10.1023/a:1013743523029
Wu, P., Hu, B., Liao, C. Y., Zhu, J. M., Wu, Y. R., Senadhira, D., et al. (1998). Characterization of tissue tolerance to iron by molecular markers in different lines of rice. Plant Soil. 203, 217–226. doi: 10.1023/A:1004321218387
Yamamoto, H. and Shikanai, T. (2019). PGR5-dependent cyclic electron flow protects photosystem I under fluctuating light at donor and acceptor sides. Plant Physiol. 179, 588–600. doi: 10.1104/pp.18.01343, PMID: 30464024
Yamamoto, C., Toyoshima, M., Kitamura, S., Ueno, Y., Akimoto, S., Toya, Y., et al. (2021). Estimation of linear and cyclic electron flows in photosynthesis based on 13C-metabolic flux analysis. J. Biosci. Bioeng. 131, 277–282. doi: 10.1016/j.jbiosc.2020.11.002, PMID: 33229211
Zaffagnini, M., Bedhomme, M., Lemaire, S. D., and Trost, P. (2012). The emerging roles of protein glutathionylation in chloroplasts. Plant Sci. 185, 86–96. doi: 10.1016/j.plantsci.2012.01.005, PMID: 22325869
Zeng, J., Dong, Z., Wu, H., Tian, Z., and Zhao, Z. (2017). Redox regulation of plant stem cell fate. EMBO J. 36, 2844–2855. doi: 10.15252/embj.201695955, PMID: 28838936
Zhang, S., Chai, H., Sun, J., Zhang, Y., Lu, Y., Jiang, D., et al. (2025). Regulatory effects of source–sink manipulations on photosynthesis in wheat with different source–sink relationships. Plants 14, 1456. doi: 10.3390/plants14101456, PMID: 40431020
Zhang, M., Ming, Y., Wang, H. B., and Jin, H. L. (2024b). Strategies for adaptation to high light in plants. Abiotech. 5, 381–393. doi: 10.1007/s42994-024-00164-6, PMID: 39279858
Zhang, S., Sun, J., Lu, Y., Yang, S., Zhang, Y., Chai, H., et al. (2024a). Rubisco and sucrose synthesis and translocation are involved in the regulation of photosynthesis in wheat with different source-sink relationships. Physiol. Plant 176, e14196. doi: 10.1111/ppl.14196, PMID: 38433117
Zhang, Y., Xu, W., Wang, H., Dong, H., Qi, X., Zhao, M., et al. (2016). Progress in genetic improvement of grain yield and related physiological traits of Chinese wheat in Henan Province. Field Crops Res. 199, 117–128. doi: 10.1016/j.fcr.2016.09.022
Zhu, F., Xue, Y., Ji, W., Li, X., Ma, W., Yu, P., et al. (2023). Galvanic redox potentiometry for fouling-free and stable serotonin sensing in a living animal brain. Angew. Chem. Int. Ed. 135, e202212458. doi: 10.1002/ange.202212458, PMID: 36688872
Keywords: wheat, source sink relationship, photosynthetic capacity, photoprotection, nitrogen management
Citation: Zhang S, Li X, Wang X, Zhang J, Li G and Tian Z (2025) Optimizing source-sink relationships and photoprotective mechanisms in wheat to enhance photosynthetic efficiency and nitrogen management. Front. Plant Sci. 16:1660834. doi: 10.3389/fpls.2025.1660834
Received: 07 July 2025; Accepted: 03 September 2025;
Published: 18 September 2025.
Edited by:
Hualing Mi, Center for Excellence in Molecular Plant Sciences (CAS), ChinaReviewed by:
Ferit Kocacinar, Kahramanmaras Sütçü Imam University, TürkiyeShumayla, University of Maryland, United States
Honghai Luo, Shihezi University, China
Copyright © 2025 Zhang, Li, Wang, Zhang, Li and Tian. This is an open-access article distributed under the terms of the Creative Commons Attribution License (CC BY). The use, distribution or reproduction in other forums is permitted, provided the original author(s) and the copyright owner(s) are credited and that the original publication in this journal is cited, in accordance with accepted academic practice. No use, distribution or reproduction is permitted which does not comply with these terms.
*Correspondence: Zhongwei Tian, emh3dGlhbkBuamF1LmVkdS5jbg==