 Ganesan Karunakaran1*
 Sundram Ramachandran2*Rangarajan Venugopalan3Rajendiran Selladurai4
 Manivannan Arivalagan5
 Anoop Kumar Srivastava6Kanakanahalli Gangadharappa Shilpa7Thimmarayappa Ruchitha8
- 1Division of Fruit Crops, ICAR-Indian Institute of Horticultural Research, Bengaluru, Karnataka, India
- 2Division of Natural Resource Management, ICAR-Indian Institute of Horticultural Research, Bengaluru, Karnataka, India
- 3Division of Social Science and Training, ICAR-Indian Institute of Horticultural Research, Bengaluru, Karnataka, India
- 4ICAR-IIHR-Central Horticultural Experimental Station, Chettalli, India
- 5Division of Basic Science, ICAR-Indian Institute of Horticultural Research, Bengaluru, Karnataka, India
- 6ICAR-Central Citrus Research Institute, Nagpur, Maharashtra, India
- 7ICAR-IIHR, Experimental Farm, Tumakuru, Karnataka, India
- 8Division of Fruit Crops, ICAR-Indian Institute of Horticultural Reserach, Hesaraghatta Lake Post, Bengaluru, Karnataka, India
Dragon fruit stands out all among fruits not only for its essential nutrients and antioxidant content but also for its aesthetic appeal. Its high demand in consumer preferences and marketing values makes it a sought-after fruit. However, its production is limited by poor agronomic practices, particularly suboptimal use of fertilizers. Therefore, this study aims to enhance dragon fruit production by improving fertilizer use efficiency, thereby increasing fruit yield without wastage of inorganic fertilizer. To achieve this objective, two dragon fruit pulp types, white and purple-red, were chosen as test crops, and a total of three independent variables with different graded levels of N:P:K combinations were utilized. Second-order rotatable design (SORD) particularly Box-Behnken design (BBD) was employed using response surface methodology (RSM) to fix the fertilizer treatment combinations, to study the yield response and optimization of fertilizer doses. The response outcomes of white pulp fruit yield per hectare (Y1) and purple red pulp fruit yield per hectare (Y2) of dragon fruit were predicted and verified for model adequacy. The results indicated that optimum fertilizer doses (N:P2O5:K2O) of 400:300:650 g/pillar/year and 700:400:350 g/pillar/year for white and purple red pulped dragon fruit, respectively, led to a desirable effect, resulting in maximum yields of 25.5t ha-1 and 35.6t ha-1 for white and purple red pulped dragon fruit, respectively.
1 Introduction
Dragon fruit (Hylocereus spp.), also branded as pitahaya or pitaya, has become more and more popular in recent times due to its striking appearance and nutritional value. Originally native to Central and South America, this fascinating fruit is now grown worldwide majorly in tropical and subtropical conditions, and with a rising interest among researchers in Asia (Hoa et al., 2006; Harivaindaran et al., 2008; Suguna et al., 2011). Cultivation of dragon fruit has seen a steady rise in demand, both locally and internationally. In India, for instance, dragon fruit cultivation has expanded to over 3085 hectares in 2020 and is projected to reach 50,000 hectares in the next five years (Karunakaran et al., 2019a; Wakchaure et al., 2021). Its cultivation is widespread across states such as Karnataka, Gujarat, Maharashtra, Andhra Pradesh, Tamil Nadu, Kerala, Andaman & Nicobar Islands,West Bengal, Odisha, and Telangana with recent expansions into Madhya Pradesh, Punjab, Haryana, Rajasthan, Uttar Pradesh and North Eastern States (Karunakaran et al., 2019b).
The cultivation of dragon fruit demands vigilant attention to soil quality, watering practices, and pest control measures. To attain heightened yields, it becomes imperative to provide the fruit with an array of essential nutrients (Grusak et al., 2016), which can be effectively supplied through soil amendments and inorganic fertilizers. Ensuring adequate soil fertility fosters robust plant growth, vigorous flowering, and abundant fruit yield. Nonetheless, the lack of comprehensive fertilizer management information within dragon fruit orchards has led to yield disparities ranging from 2–9 t ha-1 (Fernandes et al., 2018; Moreira et al., 2012). Furthermore, dragon fruit’s resilient nature and adaptability to diverse soil and climatic conditions necessitate balanced fertilization to meet its growth requirements and ensure satisfactory yields (Alves et al., 2021). However, the precise nutrient demands of dragon fruit remain elusive (Mizrahi, 2014). Notably, fruit yield and growth factors are considerably improved by addition of nitrogen and phosphorus fertilizers and interaction effects of N and P have increased shoot numbers, flowering, and fruit set (Hariyanto et al., 2023). Potassium, being a crucial nutrient in numerous biochemical processes, particularly influences the quality of dragon fruit (Then, 2013).
Poor soil fertility and improper fertilizer management lead to reduction in dragon fruit plant growth and development, fruit yield as well as fruit quality (IPNI, 2014; Perween, 2017; Karunakaran et al., 2021a, b; Lima et al., 2021). Gomez and Zorita (2015) have analyzed the nutrient contents in plant tissue and fruits of six different varieties of dragon fruit and reported that potassium is the nutrient most accumulated in Pitaya followed by N and P, hence inadequate and imbalance supply of these nutrients influence fruit yield and quality. Likewise, addition of potassium fertilizer boosted dragon fruits production by 20-24% and 64-70% in the first and second years, correspondingly (Fernandes et al., 2018). Omitting N, P, and K from recommended doses of fertilizers led to yield reductions in the tune of -50%, 28%, and 29%, respectively has been reported (IPNI, 2014). Moreover, cutting K fertilizer by half caused the fruit yield reduction by 9%, whereas rising K fertilizer dose by half augmented fruit yield by 2.5% when compared with optimum dose. Therefore, optimizing doses of N:P: K fertilizers are inevitable to enhance the yield of dragon fruit.
Moreover, a comprehensive understanding of fertilization techniques in crop management aids in expanding dragon fruit cultivation areas. Furthermore, nutrient requirements vary among dragon fruit species, emphasizing the importance of accurately assessing nutrient needs and understanding the species’ nutrient status in nurseries. While numerous studies have recommended various N:P:K doses through randomized combinations and statistical analyses, none have proposed an optimal N:P:K dose in India. Hence, this study aims to determine optimal N:P:K dose for white- pulped and purple-red-pulped dragon fruits to achieve higher yields, utilizing the Box-Behnken Design and Response Surface Methodology (RSM) to elucidate relationship between response and independent variables.
The RSM emerges as an extensively employed statistical tool for optimizing processes by identifying key factorial variables. It plays a pivotal role in enhancing performance of a system and in boosting efficiency of process without escalating cost and time (Sujayasree et al., 2022; Cano-Lamadrid et al., 2023). Specifically, in determining the optimal NPK nutrient dose for dragon fruit, RSM serves as a crucial tool for establishing the relationship between response and independent variables. Typically, this method is employed to delineate a response surface within a specified area of interest or under selected working conditions to meet the purpose (Box and Draper, 1965; Myers et al., 2016; Beegum et al., 2018; Pandiselvam et al., 2022). In this study, wide ranges of N (200, 450 and 700g), P (150, 275 and 400g) and K (300, 650 and 1000g) are applied to both the dragon fruit types in 13 treatment combinations adopting RSM. The objective of the current study is optimization of N:P:K doses for red-purpled and white- purpled dragon fruits under nominal soil environment conditions.
2 Materials and methods
The field experiment was carried out at ICAR-IIHR-Central Horticultural Experiment Station (CHES), Hirehalli, Tumkur District, Karnataka, India, from 2020–21 to 2022-23. The GPS coordinates of station is 13° 16’ 27.22” N and 77° 11’ 1.32” E, with an altitude of 845m form mean sea level. The annual rainfall of the station is 800mm, and the mean maximum and minimum air temperatures are 30.3°C and 20.7°C, respectively. The initial soil properties of experimental soil are portrayed in Table 1. The soil has clay loam texture and medium organic matter content with slightly acidic reaction, deficient in nitrogen and sulphur; and sufficient with respect to all other nutrients.
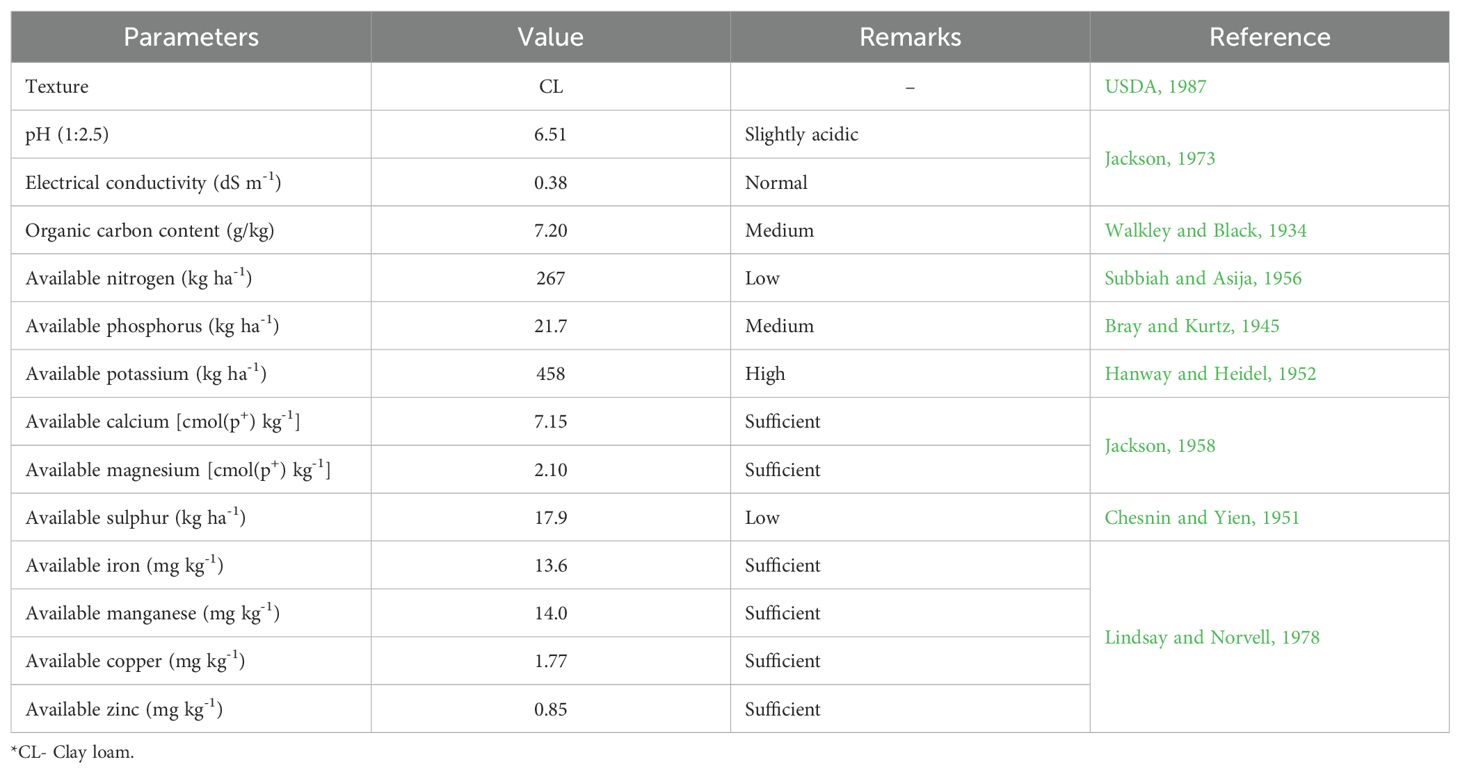
Table 1. Initial physico-chemical properties of experimental soil.
In March, 2017; four plants were planted all the four sides of a pillar, and the pillars were erected maintaining 3.0m inter row distance and 2.5m intra row distance. Over the first three years period (2017-2020), the plants were allowed to grow and progress to the fruiting stage. Subsequently, from the fourth year onwards, from 2020–21 to 2022-23, during the fruit harvesting season spanning from May to October, the fruits were harvested, and the yield of each pillar was meticulously recorded.
The experiment was conducted in white and purple-red pulped dragon fruit orchards (Figure 1), employing various levels of N:P:K doses using a second-order rotatable design (SORD) with thirteen treatment combinations (Tables 2, 3) and three replications. The treatments (N:P2O5:K2O combinations) included
T1 = 200:400:650 g/pillar,
T2 = 200:400:650 g/pillar,
T3 = 450:400:1000 g/pillar,
T4 = 700:275:1000 g/pillar,
T5 = 700:400:650 g/pillar,
T6 = 450:400:300 g/pillar,
T7 = 200:275:300 g/pillar,
T8 = 200:275:1000 g/pillar,
T9 = 700:275:300 g/pillar,
T10 = 450:150:300 g/pillar,
T11 = 450:150:1000 g/pillar,
T12 = 700:150:650 g/pillar, and
T13 = 450:275:650 g/pillar.
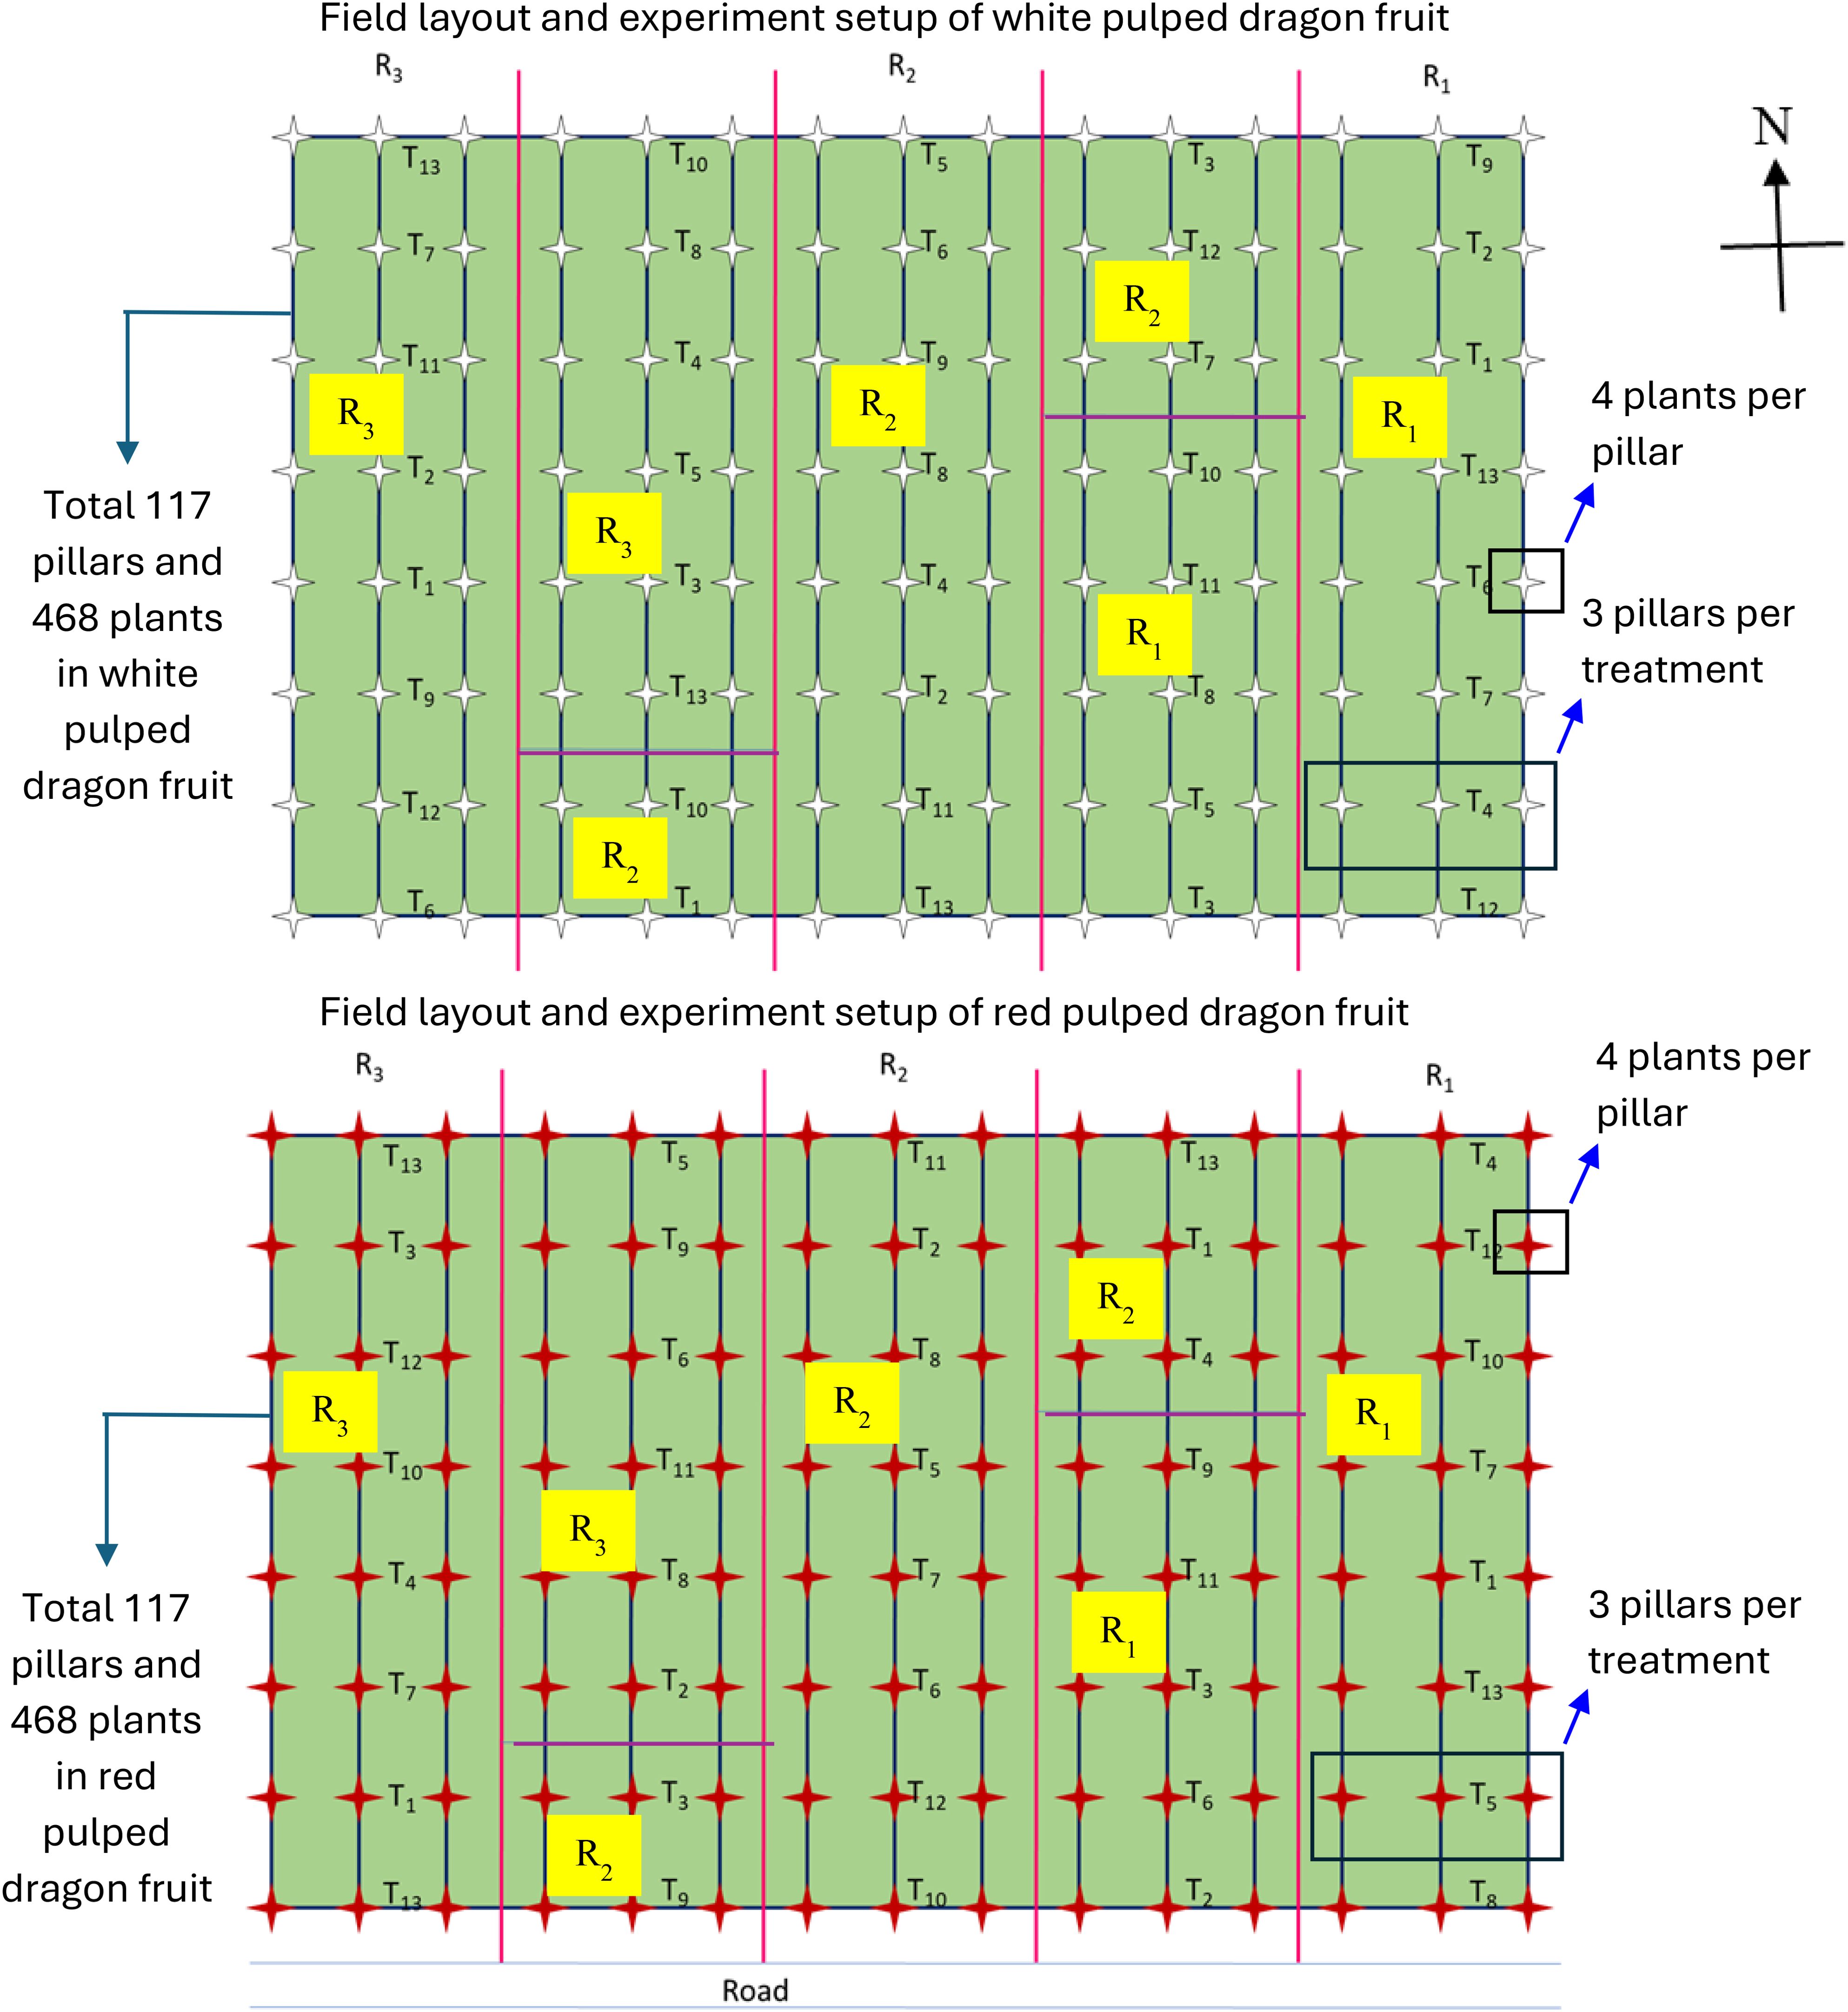
Figure 1. Field layout and experiment setup of dragon fruit nutrient management trial (15 rows; treatments 13 (T1-T13); 3 replications/blocks (R1-R3); 3 pillars per treatment, and 4 plants per pillar; in total 117 pillars and 468 plants for each dragon fruit type; red color star indicates red-pulped dragon fruit pillars and white color star indicates white pulped dragon fruit pillars; treatments are randomly allotted).
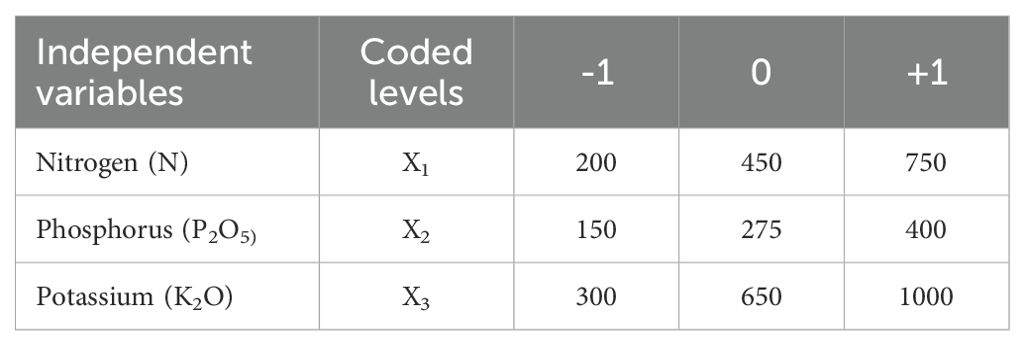
Table 2. Coded and encoded values of independent variables and their levels adopted in the experiment.
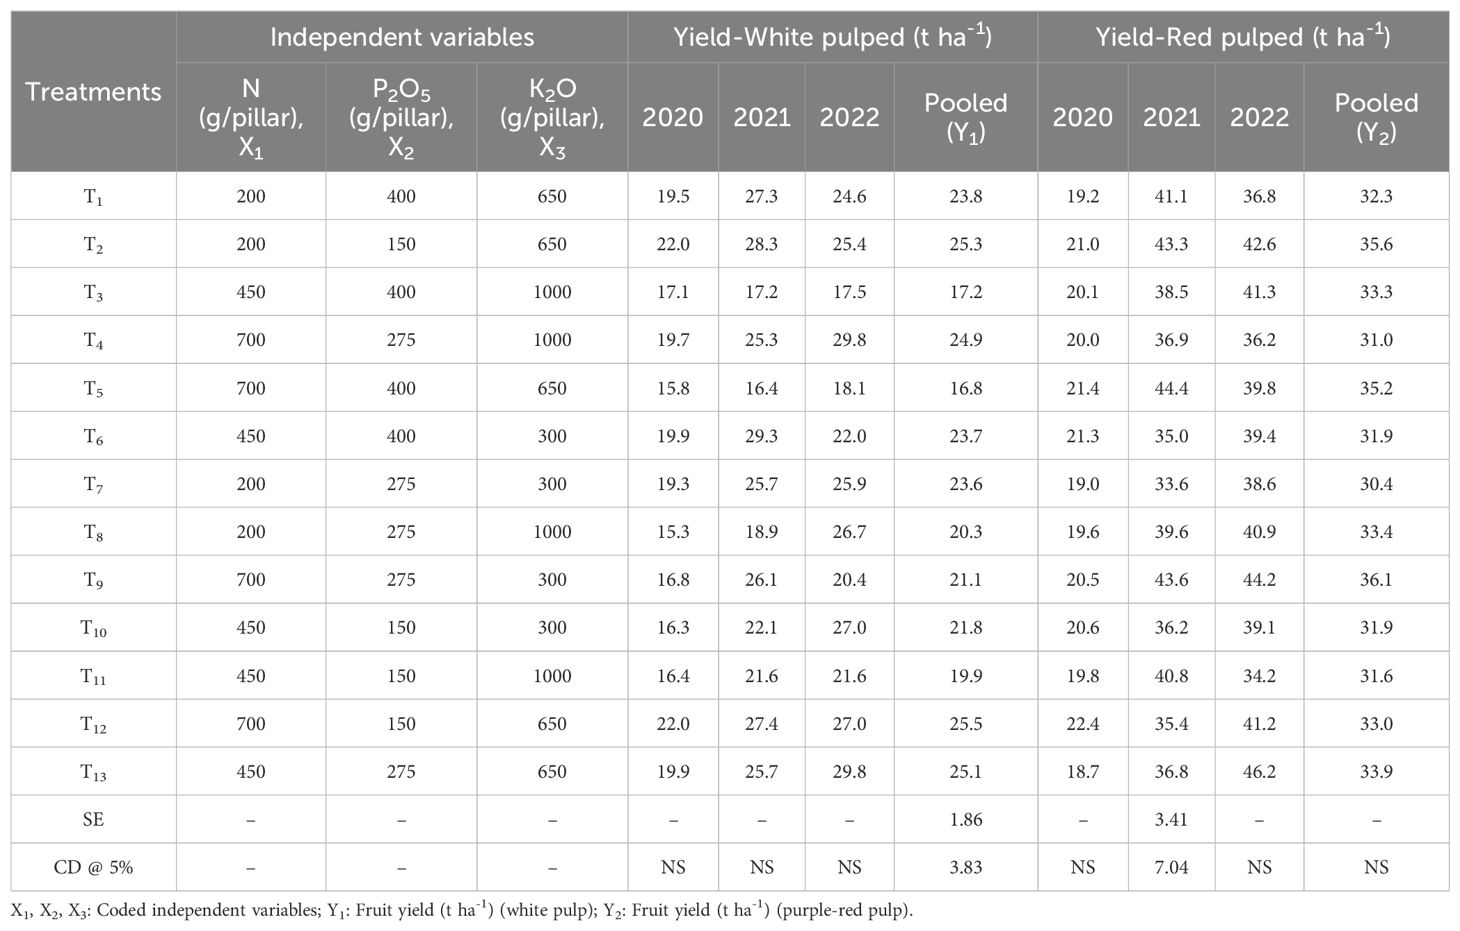
Table 3. The experiment design matrix (treatments with independent variables) and pooled yield data of dragon fruit (observed values of response variable).
In each treatment, respective nutrient doses were administered in four splits (S) with the following proportions: S1 in March (10:40:40), S2 in June (20:10:45), S3 in October (40:30:0), and S4 in January (30:20:15). For instances, 10:40:40 means 10% of total N; 40% of total P2O5 and 40% of total K2O in particular treatment, similarly for other proportions were followed in all the treatments. All the N, P and K nutrients were supplied through urea (contains 46% N), single super phosphate (contains 16% P2O5), and muriate of potash (contains 60% K2O) fertilizers, respectively. Since sulphur was deficient in the soil, sulphur requirement of production system was met through supplying single super phosphate (that contains 11% S).
Furthermore, alongside fertilizer application, each treatment received a uniform supply of farmyard manure (10kg), and neem cake (1kg) per pillar, divided equally between March and October of each year. Irrigation was administered via drip irrigation at a rate of 4 liters per pillar, twice a week. All selected plants exhibited nearly uniform growth and vigor and received consistent cultural practices. Observations on the total fruit yield per pillar per year were documented throughout the experimental duration and converted to tons per hectare per year (Table 3). The yield data were documented for the years 2020/21, 2021/22, and 2022/23 for experimental purposes, and these three-year data were amalgamated for the entire season of each harvest year, forming the basis for analysis in this experiment (Table 3).
The response surface methodology (RSM) is a statistical method to study the response and Box-Behnken design or second-order polynomial model is mathematical/statistical tool used to predict the yield and optimize the fertilizer doses based on the response obtained in the RSM. Statistical analysis was conducted using SAS V 9.3 (2012) for calculation of analysis of variance (ANOVA) (Montgomery, 2017). The same software had been used for Box-Behnken design to establish a second-order polynomial model using yield responses under various N:P:K combinations (Montgomery, 2017). The proposed second-order polynomial model for predicting response variable is depicted as below (Equation 1):
Here, Y corresponds to the dependent or response variable, and Xi (i=1-3) stands for the independent variables (X1=N, X2=P2O5, X3=K2O, Table 3) (Myers et al., 2016; Montgomery, 2017). Coefficients of this model are designated by B0 (constant), B1, B2 and B3 (linear coefficients), B11, B22 and B32 (quadratic coefficients), and B12, B13 and B23 (interactive coefficients) (Table 4). The actual second-order polynomial models obtained through this study for predicting the dragon fruit yield with different coefficients are depicted in Equation 2 and Equation 3. The effects of interaction of the independent variables are portrayed in 3-D pictorial form. The fitness of the model was further confirmed using coefficient of determination (R2), lack of fit and F test values.
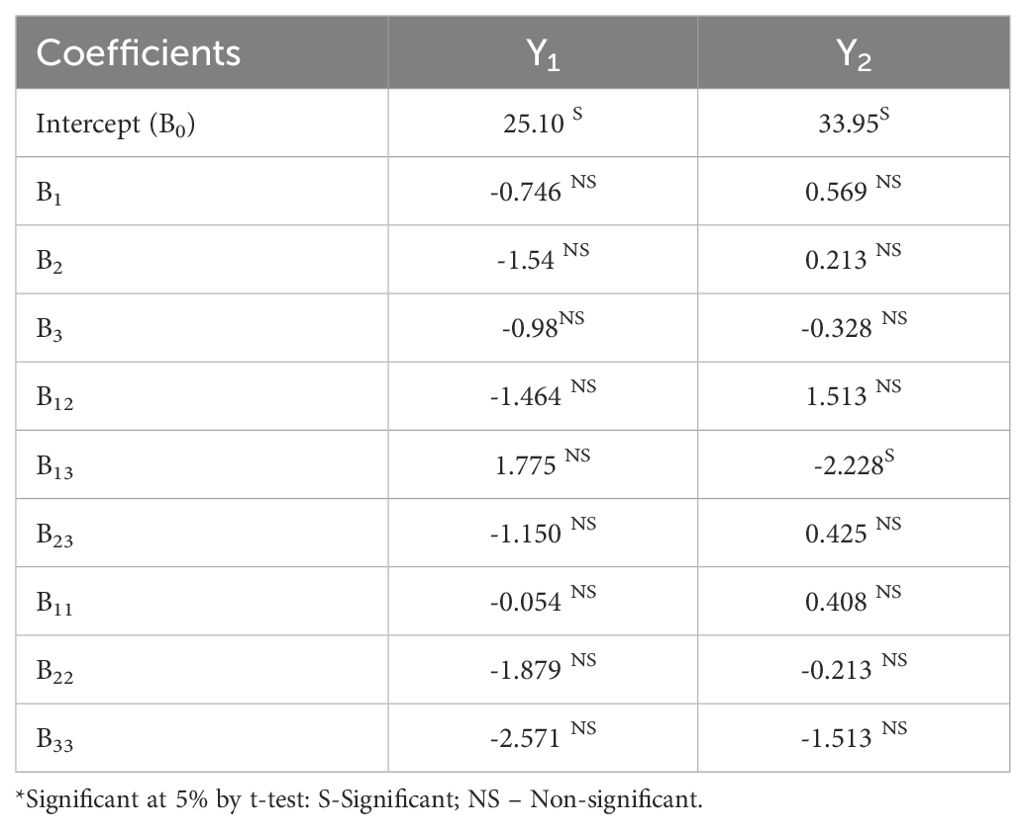
Table 4. Regression coefficients of adopted model for optimizing N:P:K doses for higher yield.
2.1 Prediction model for white pulp fruit yield (Y1)
2.2 Prediction model for purple-red pulp fruit yield (Y2)
Where, Y1: White pulp dragon fruit yield per ha; Y2: Purple red pulp dragon fruit yield per ha; X1: Nitrogen (g/pillar); X2: Phosphorus (g/pillar); X3: Potassium (g/pillar).
3 Results and discussion
The year-wise and pooled fruit yield data are summarized in Table 3. The pooled mean data of fruit yield of white-pulped dragon fruit to different treatments/fertilizer combinations showed a significant effect at 5% significance level, while the purple-red-pulped variety did not show significant results. These findings may not fully reflect the optimal nutrient requirements for maximizing yield. Therefore, a predictive model was employed to determine the precise nutrient dosage needed for dragon fruit cultivation. The data of response variables and different nutrient combinations as input variables were used to develop a generalized second-order polynomial model for predicting the yield response. This model employed multiple regression techniques to analyze the data and create a response surface model. The adequacy of the models, with or without interactions of the dependent variables, was evaluated using R² (coefficient of determination). Additionally, the obtained model was evaluated with the help of modified coefficient of determination (R² modified) and lack of fit probability (p). The adequacy of the model for fruit yield was tested using ANOVA. The non-significant F values of lack of fit (<0.05) had confirmed strength of the model. Competency was further assessed using ANOVA as detailed in Table 5.
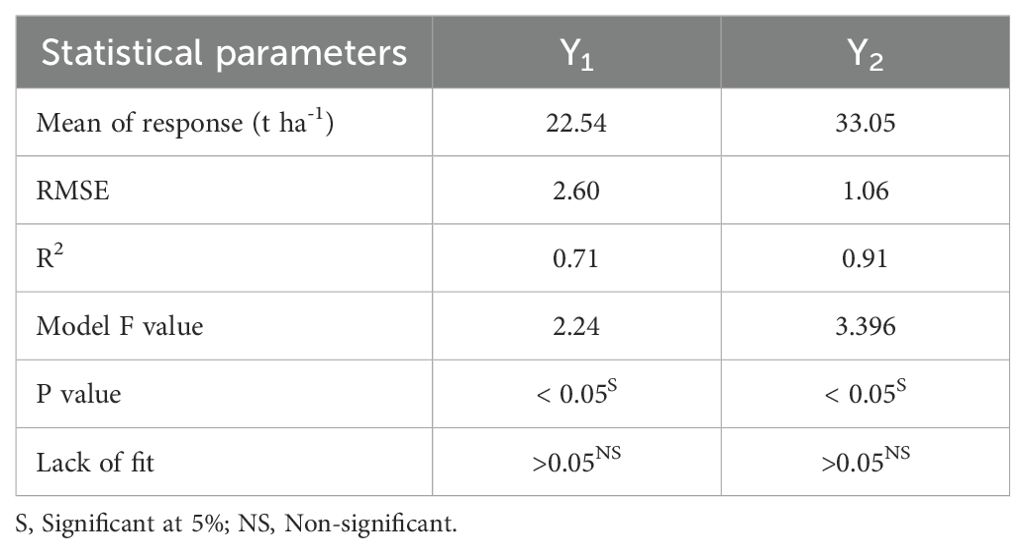
Table 5. Statistical parameters and ANOVA of the second order polynomial model for yield response in dragon fruits. .
3.1 Effect of fertilizer doses on fruit yield
Plant biological parameters are pivotal in determining the effects of applied nutrients, making it essential to optimize nutrient requirements for Dragon fruit. The pooled data in Table 3 indicates that Treatment-T12 (700g N, 150g P2O5, and 650g K2O per pillar per year) achieved the highest and significant yield of 25.5t ha-1 for white-pulped dragon fruit. Conversely, Treatment-T9 (700g N, 275g P2O5, and 300g K2O per pillar per year) yielded the highest (36.1t ha-1) for purple-red-pulped dragon fruit though no significant difference was found among treatments.
In the experimental setup, white-pulped dragon fruit yields (Y1) varied significantly, ranging from 16.8 to 25.5t ha-1 across different nutrient combinations. Similarly, purple-red-pulped dragon fruit yields (Y2) varied from 30.4 to 36.1t ha-1. This showed that purple-red pulped dragon fruit largely responded to applied fertilizers than the white pulped dragon fruit in terms of plant growth and higher yield. Moreover, these yield differences might have stem from the varying growth responses and yield potentials of the two species, influenced by the nutrient combinations used. To pinpoint optimal nutrient doses, a predictive model was developed using a three-dimensional response surface methodology (RSM) to analyze various N:P:K combinations. The multiple regression analysis identified the optimal fertilizer nutrient combinations for higher yields: 400:300:650 g N:P2O5:K2O per pillar/year for white dragon fruits and 700:400:350 g N:P2O5:K2O per pillar/year for purple-red dragon fruits. These findings highlighted that while RSM can effectively predict optimal nutrient combinations based on the yield responses from all the 13 treatment or fertilizer combinations. This method could be more appropriate than the maximum yield obtained in single nutrient combination. Among these nutrient combinations, nitrogen and potassium individually contributed most significantly towards yield, while their quadratic interactions were not statistically significant (p<0.05) (Table 4). Notably, application of N:P:K fertilizer substantially increased fruit yield compared to conditions without N:P:K fertilization, as supported by previous research (Nasreen et al., 2013; Chakma et al., 2014).
In white-pulped dragon fruit, potassium emerged as a critical nutrient, surpassing nitrogen and phosphorus requirements. A significant association between potassium and fruit development was also reported in fruit crops (Wang et al., 2017). Likewise, Gomez and Zorita (2015) and Fernandes et al. (2018) had reported that potassium is the nutrient most accumulated in dragon fruit followed by nitrogen and phosphorus. Potassium involves in maintaining ionic balance in the cytoplasm, thereby promoting cell elongation (Hu et al., 2016). Additionally, K levels have been shown to influence both dragon fruit yield and quality (Sahu et al., 2022). In specific cases, the interaction between nitrogen and potassium was found to boost strawberry fruit yield (Rangel et al., 2020). Their study highlighted that a concentration of nitrates in fruits at 12 to 15mol m-3 of NO3-, coupled with 7mol m-3 of K+, yielded the most favorable interaction, leading to increased fruit yield. However, in contrast to these results, in purple-red pulped dragon fruit nitrogen is found to be critical along with phosphorus and potassium. The similar results of increased fruit yield and growth factors by addition of nitrogen and phosphorus fertilizers and interaction effects were reported by earlier workers (Hariyanto et al., 2023; IPNI, 2014). Omission of N in fertilizer schedule caused the dragon fruit yield reductions in the tune of 50%, when compared to 28% and 29% in cases of P and K, respectively (IPNI, 2014). This showed the importance of N, P, and K on dragon fruit production.
3.2 Second-order polynomial model for yield response
The second-order polynomial regression model was established using RSM with three independent variables. The prediction models are depicted as Equation 2 and Equation 3 for white and purple-red pulped dragon fruits, respectively. The model’s significance (P<0.05) was affirmed by the response from the second-order response surface model. Linear, interactive and quadratic expressions of fruit yield exhibited significance (P < 0.05) of prediction models (R2 = 0.71 and 0.91) (Figure 2). However, the interaction among nutrient factors, as indicated by the t-test values, was estimated to be not significant (P < 0.05) (Table 4). Independent nutrient variables such as N, P, and K in the interaction process, as depicted in the plot, validated the preference of RSM with interaction effect as created. Effect of variable response is illustrated by sign and magnitudes of the coefficient. A positive and negative sign denotes an increase and a decrease in response, respectively. When the interactions are significant, interactive variables can be increased to a level to attain the constant values of the response (Draper and Hunter, 1966; Montgomery, 2004). The levels of nutrients in both linear and interaction terms exhibit a positive as well as negative correlations (Table 4). Increasing the quantity of fertilizer may be attributed to the increase in fruit yield up to certain level. This finding was in consistent with other studies (Li et al., 2014; Perween and Hasan, 2019).

Figure 2. Actual vs. Predicted plot for fruit yield of white (Y1) and purple-red pulped (Y2) dragon fruits.
3.3 Summary statistics of fit and plot analysis of actual vs. predicted
The experiment involved combinations of fertilizer doses, with the Response Surface Methodology (RSM) capturing 71.0% and 91.0% of the white and purple red pulped dragon fruit yield, respectively, as evidenced by the graphical representation. The dotted lines closely aligning with the mean line indicate the model’s significance in 71% and 91% of Y1 and Y2, respectively (Figure 2). Results from the ANOVA table indicate that the model means of response values were 22.54 and 33.05, with R² values of 0.71 and 0.91, and a RMSE (Root Mean Square Error) of 2.6 and 1.06, suggesting minimal prediction error for these nutrient levels and confirming the model’s good fit for obtaining right yield response (Table 5). Non-significant F values for lack of fit (p<0.05) hold good for the competency of model.
3.4 Optimization of fertilizer doses for fruit yield using RSM
Intention of this study was to determine optimal N:P:K levels for maximizing the dragon fruit yield. To achieve this, a selected model was utilized (Ade Omowaye et al., 2021; Romero et al., 2022). This predictive model generated information and a three-dimensional response surface plot for various N:P:K combinations, illustrating the trend of response variation within the chosen range of input variables, as depicted in Figure 3. This figure shows interrelationship between response (fruit yield) and independent (N:P:K doses) variables (Bezerra et al., 2008; Yuan et al., 2018). Further through this the range of constant variables (fruit yield) can be illustrated in the plane of the independent variables adopting a two-dimensional surface plot (Alam and Singh, 2010; Shameena et al., 2019). The response surface plot (Figure 3) demonstrates effect of N:P:K nutrients on white pulped dragon fruit yield (Y1) and purple-red pulped dragon fruit yield (Y2). The shape of the surface helps locate the optimal range with reasonable precision. The results indicated that the optimal nutrient (N:P:K) doses for maximum yield (25.5t ha-1), corresponding to 388, 283, and 638g per pillar in white pulped dragon fruit, with a desirability of 90% (Figure 4). In case of purple red pulped dragon fruit, the optimal doses of N:P:K were 750, 400 and 347g per pillar per year to achieve higher yield of 37.1t ha-1, with a desirability of 87% (Figure 5). This study demonstrates the possibility of determining the optimum settings of independent variables for maximizing the response variable (Table 6). It also suggests that applying higher doses of nitrogen and potassium, rather than phosphorus, can result in a maximum fruit yield. This finding is in consistent with the previous study of increase in fruit yield with application of N:P:K (Monga et al., 2004; Maity et al., 2006; Oloyede et al., 2013). Whereas minimum fruit yield was observed with native fertility (Sarker and Rahim, 2012; Nasreen et al., 2013). Overall, the results suggest that response surface methodology could be a cost-effective alternative for optimizing input variables before conducting field experiments to validate predicted values.
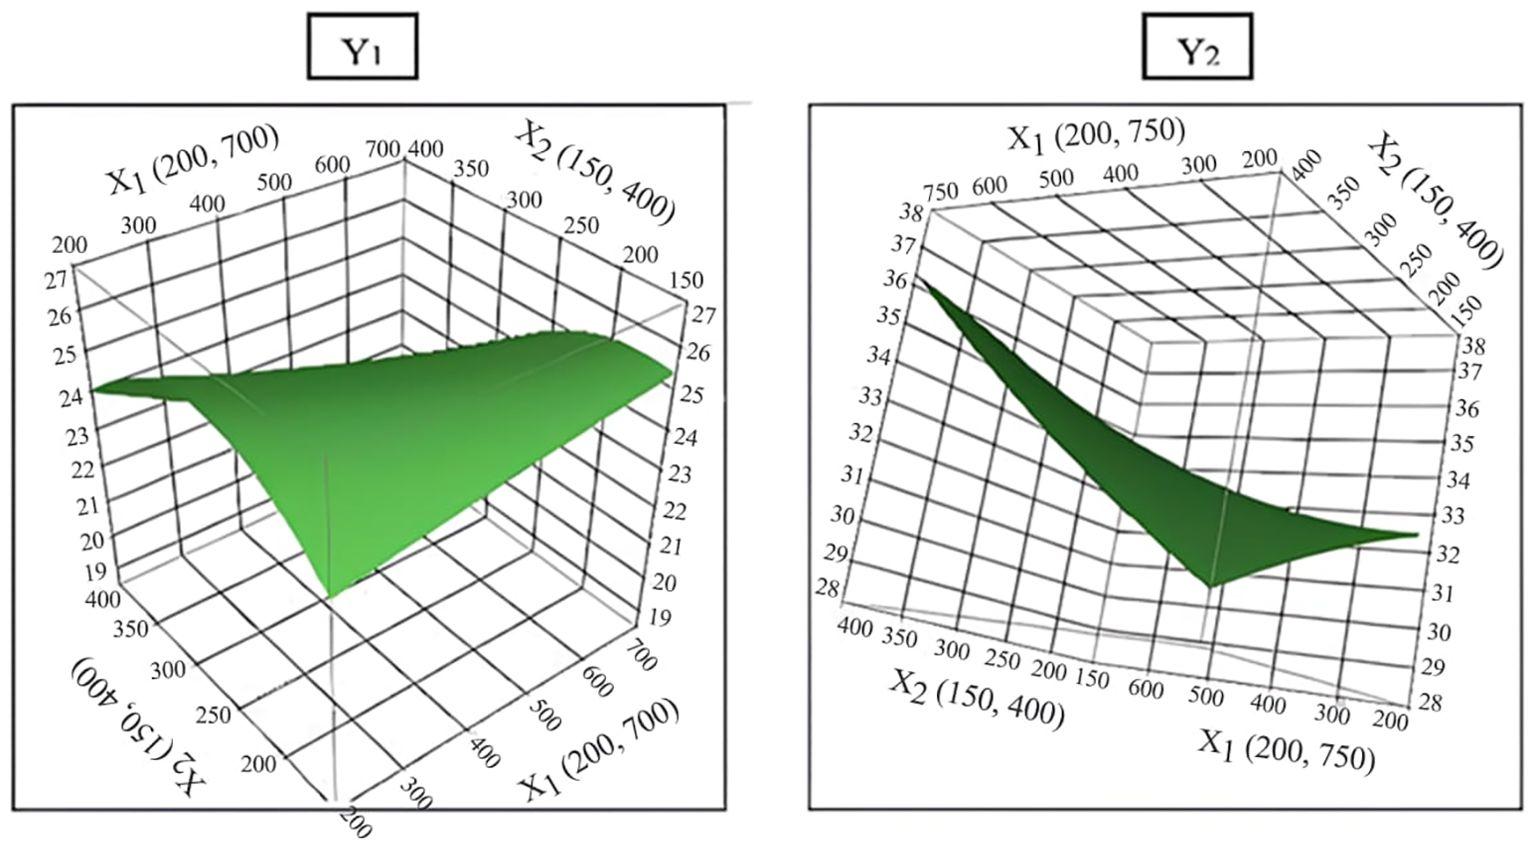
Figure 3. Optimization of three independent variables using the quadratic response surface plot for white pulp fruit yield (Y1) and purple-red pulp fruit yield (Y2).
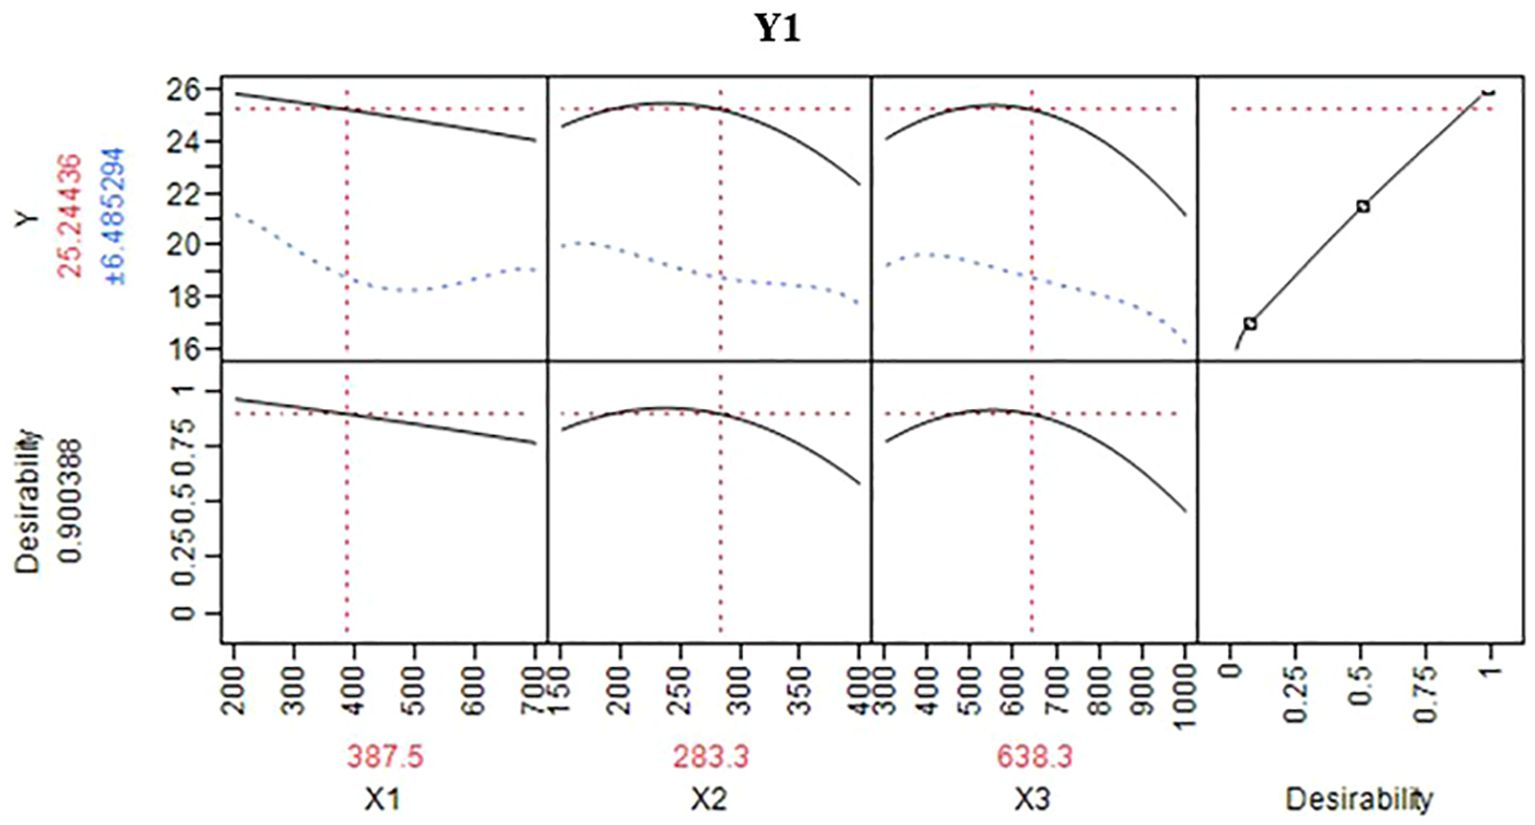
Figure 4. Prediction profiler for optimized conditions of fruit yield of white pulped dragon fruit per pillar (Y1).
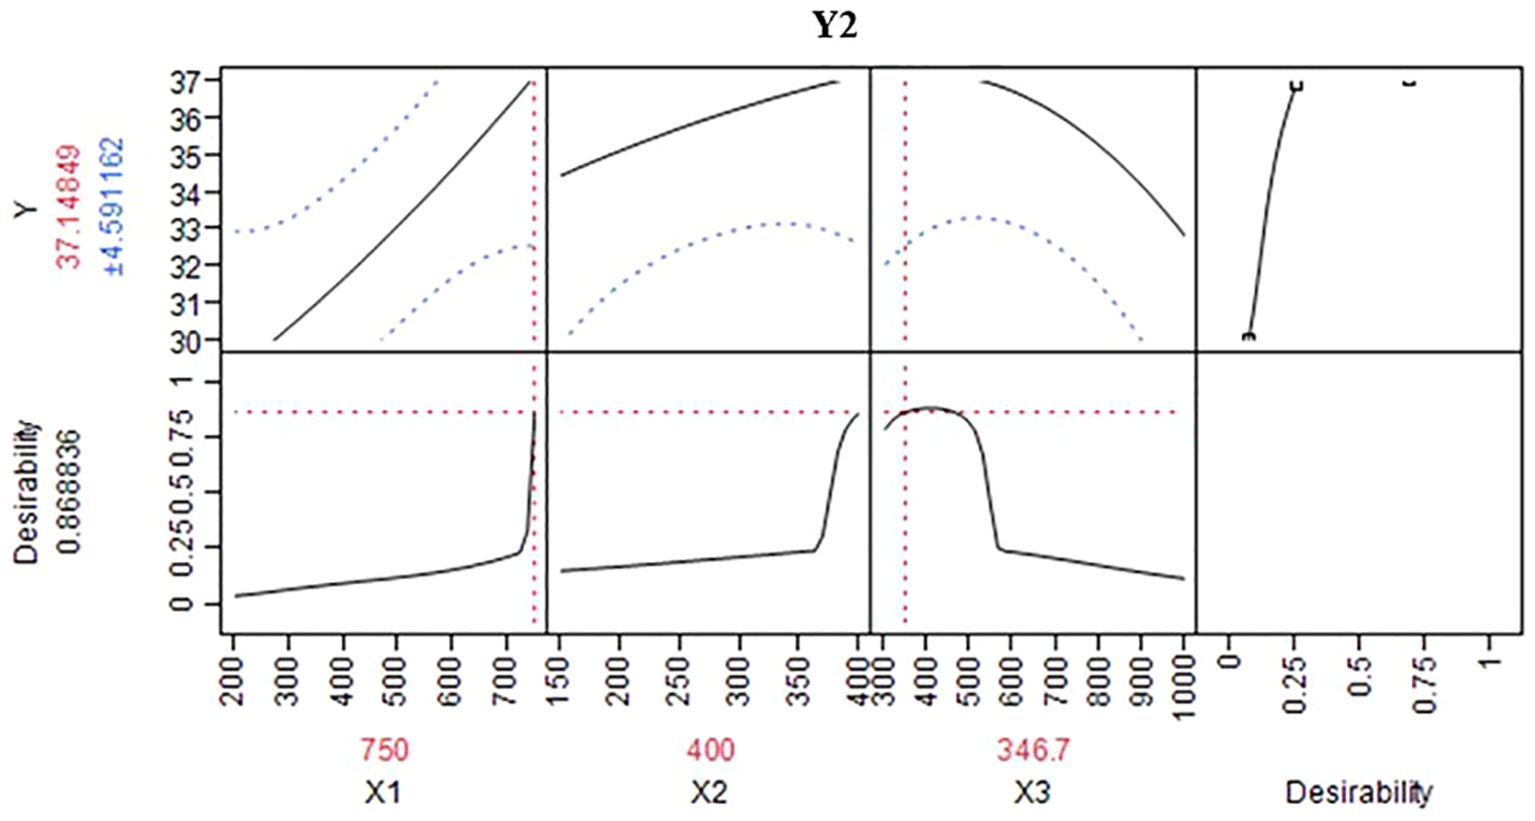
Figure 5. Prediction profiler for optimized conditions of fruit yield of purple-red pulped dragon fruit per pillar (Y2).
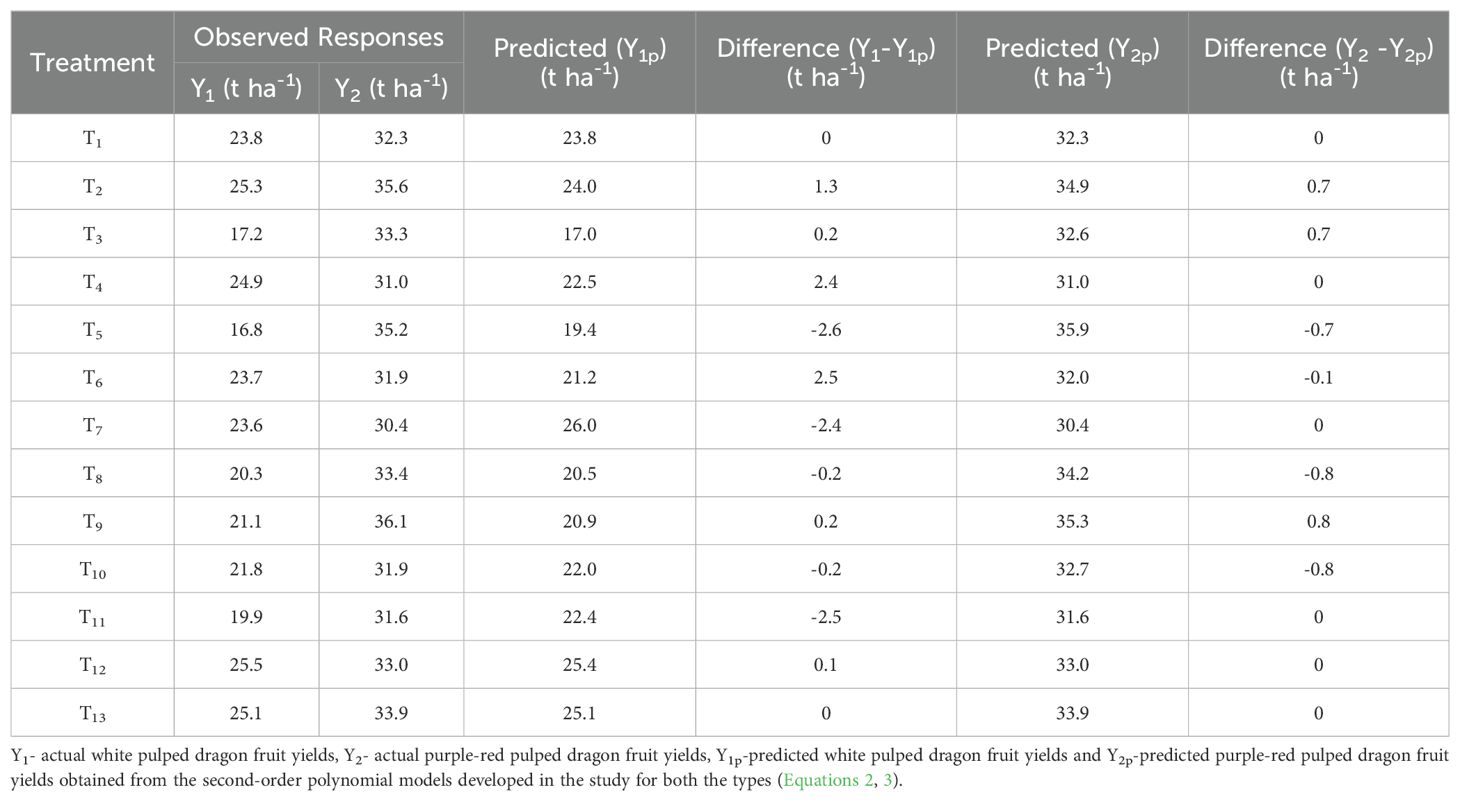
Table 6. Predicted and experimental values of response (yield) at variable N:P:K doses.
3.5 Adequacy of the models
3.5.1 Residual analysis
The non-significance of the F-values for lack of fit (p < 0.05) strongly suggests competency of the model. To confirm this, residual analysis was performed, affirming the model’s capability to sufficiently approximate the values (Table 5). Merely relying on R² and modified R² is insufficient to warrant the reproducibility of Response Surface Methodology (RSM) outcomes. Hence, a run test was executed, yielding Z-values below 1.96 (Kenney and Keeping, 1962) for both Y1 and Y2. This indicates that residual values in the model are randomly distributed. Moreover, the Shapiro-Wilk test revealed that both Y1 and Y2 response variables approximate unity, indicating normal residual distribution. These findings collectively bolster the confidence in the RSM models developed within this study.
4 Conclusion
This experiment demonstrates the successful implementation of RSM to foretell the dragon fruit yield response under variable nutrient doses using a Box-Behnken Design. A second-order polynomial models are established for the response variable (Dragon fruit yield), and the obtained equation can be utilized to determine the optimum doses of N:P:K for desirable dragon fruit yield. The findings reveal that the optimum doses of N: P2O5: K2O for achieving higher yield in white (25.5t ha-1) and purple-red (35.6t ha-1) dragon fruits are 400:300:650 and 700:400:350 g/pillar/year, respectively. Moreover, the non-significant F value for the lack of fit (P <0.05) indicates the competence of the model. Graphical methods, in conjunction with RSM, are instrumental in establishing optimal doses that can be experimentally verified and reproducible. In nutshell, this study provides invaluable assistance to farmers in effective management nutrients for increasing dragon fruit yields. As a result, cultivation area of dragon fruits can expand and ultimately boosts the production and farm income.
Data availability statement
The original contributions presented in the study are included in the article/supplementary material. Further inquiries can be directed to the corresponding authors.
Author contributions
GK: Conceptualization, Resources, Supervision, Writing – review & editing. SR: Data curation, Investigation, Methodology, Validation, Visualization, Writing – original draft. RV: Formal analysis, Software, Writing – review & editing. RS: Supervision, Visualization, Writing – review & editing. MA: Methodology, Validation, Writing – review & editing. AS: Conceptualization, Writing – review & editing. KS: Data curation, Writing – review & editing. TR: Data curation, Writing – review & editing.
Funding
The author(s) declare that no financial support was received for the research, and/or publication of this article.
Conflict of interest
The authors declare that the research was conducted in the absence of any commercial or financial relationships that could be construed as a potential conflict of interest.
The author(s) declared that they were an editorial board member of Frontiers, at the time of submission. This had no impact on the peer review process and the final decision.
Generative AI statement
The author(s) declare that no Generative AI was used in the creation of this manuscript.
Any alternative text (alt text) provided alongside figures in this article has been generated by Frontiers with the support of artificial intelligence and reasonable efforts have been made to ensure accuracy, including review by the authors wherever possible. If you identify any issues, please contact us.
Publisher’s note
All claims expressed in this article are solely those of the authors and do not necessarily represent those of their affiliated organizations, or those of the publisher, the editors and the reviewers. Any product that may be evaluated in this article, or claim that may be made by its manufacturer, is not guaranteed or endorsed by the publisher.
References
Ade Omowaye, B. I. O., Rastogi, N. K., and Angersbach, A. D. (2021). Osmotic dehydration behaviour of red paprika (Capsicum annuum L.). J. Food Sci. 67, 790–796. doi: 10.1111/j.1365-2621.2002.tb08724.x
Alam, M. S. and Singh, A. (2010). Optimization of osmotic dehydration process of aonla fruit in salt solution. Int. J. Food Eng. 6, 65–85. doi: 10.2202/1556-3758.1476
Alves, D., de, A., Cruz, M., do, C. M., Lima, J. E., Santos, N. C., et al. (2021). Productive potential and quality of pitaya with nitrogen fertilization. Pesqui. Agropecu. Bras. 56, e01882. doi: 10.1590/S1678-3921.pab2021.v56.01882
Beegum, S. N., Elyas, K. K., Laladhas, K. P., and Gopalakrishnan, A. (2018). Optimization of nutrient levels for enhancing growth and yield of dragon fruit (Hylocereus undatus) using response surface methodology. J. Plant Nutr. 41, 1395–1403.
Bezerra, M. A., Santelli, R. E., Oliveira, E. P., Villar, L. S., and Escaleira, L. A. (2008). Response surface methodology (RSM) as a tool for optimization in analytical chemistry. Talanta 76, 965–977. doi: 10.1016/j.talanta.2008.05.019
Box, G. E. P. and Draper, N. R. (1965). The Bayesian estimation of common parameters from several responses. Biometrika 52, 355–365. doi: 10.1093/biomet/52.3-4.355
Bray, R. H. and Kurtz, L. T. (1945). Determination of total organic and available forms of phosphorus in soils. Soil Sci. 59, 39–45. doi: 10.1097/00010694-194501000-00006
Cano-Lamadrid, M., Martínez-Zamora, L., Mozafari, L., Bueso, M. C., Kessler, M., and Artés-Hernández, F. (2023). Response surface methodology to optimize the extraction of carotenoids from horticultural by-products-A systematic review. Foods 12, 4456. doi: 10.3390/foods12244456
Chakma, S. P., Rashid, H. A. S. M., Roy, S., and Islam, M. (2014). Effect of NPK doses on the yield of dragon fruit [Hylocereus costaricensis(FAC Weber) Britton & Rose] in Chittagong Hill Tracts. Am. Eurasian J. Agric. Environ. Sci. 14, 521–526. doi: 10.5829/idosi.aejaes.2014.14.06.12346
Chesnin, L. and Yien, C. H. (1951). Turbidimetric determination of available sulphur. Proc. Soil Sci. Soc. America 15, 149–151. doi: 10.2136/sssaj1951.036159950015000C0032x
Draper, N. R. and Hunter, W. G. (1966). Design of experiments for parameter estimation in multi response situations. Biometrika 53, 525–533. doi: 10.1093/biomet/53.3-4.525
Fernandes, D. R., Moreira, R. A., Monteiro da Cruz, M. D. C., Rabelo, J. M., and Oliveira, J. D. (2018). Improvement of production and fruit quality of pitayas with potassium fertilization. Acta Scientiarum Agronomy. 40, e35290. doi: 10.4025/actasciagron.v40i1.35290
Gomez, J. A. and Zorita, F. (2015). “Nutritional description of Pitahaya (Dragon fruit),” in Dragon fruit/Pitahaya Seminar (UC South Coast Research and Extension Center, San Marcos, CA). 21st August, 2015.
Grusak, M. A., Della Penna, D., and Welch, R. M. (2016). Nutritional genomics: Manipulating plant micronutrients to improve human health. Science 353, 1232–1236. doi: 10.1126/science.285.5426.375
Hanway, J. J. and Heidel, H. (1952). “Soil analysis methods as used in Iowa State College,” in Soil Testing Laboratory, vol. 57. (Ames, Iowa: Iowa State College Bulletin), 1–131.
Harivaindaran, K. V., Ow, P. S. R., and Chandran, S. (2008). Study of Optimal Temperature, pH and Stability of Dragon Fruit (Hylocereus polyrhizus) Peel for Use as Potential Natural Colorant. Pak. J. Biol. Sci. 11, 2259–2263. doi: 10.3923/pjbs.2008.2259.2263
Hariyanto, B., Mayura, E., Muas, I., Jumjunidang, and Octriana, L. (2023). Effects of nitrogen and phosphorus fertilizer on growth and yield of dragon fruit (Hylocereus polyrhizus). J. Appl. Agric. Sci. Technol. 7, 172–185. doi: 10.55043/jaast.v7i2.136
Hoa, F. T., Clark, C. J., Waddell, B. C., and Woolf, A. B. (2006). Postharvest quality of Dragon fruit (Hylocereus undatus) following disinfesting hot air treatments. Postharvest Biol. Technol. 41, 62–69. doi: 10.1016/j.postharvbio.2006.02.010
Hu, W. N., Jiang, J., Yang, Y., Meng, Y., Wang, B., Chen, W., et al. (2016). (Gossypium hirsutum L.) cultivars with different K sensitivities. Field Crops Res. 196, 51–63. doi: 10.1016/j.fcr.2016.06.005
IPNI [International Plant Nutrition Institute] (2014). “Nutrient management on dragon fruit,” in IPNI Interpretive Summaries- 2013 Crop Year (International Plant Nutrition Institute, Georgia, USA), 96. Available online at: http://www.ipni.net/ipniweb/portal.nsf/0/79BCFC6AD97721BB85257CE70073F65A/$FILE/IPNI%20Interpretive%20Summaries%202014.pdf (Accessed February 13, 2024).
Karunakaran, G., Arivalagan, M., and Sriram, S. (2019a). Dragon fruit country report from India (Taiwan: FFTC Agricultural Policy Platform (FFTC-AP), 1–8.
Karunakaran, G., Arivalagan, M., and Sriram, S. (2021a). “Cultivation and characterization of dragon fruits in India,” in Dragon fruit-From Production to Market. Eds. Fullerton, R. A. and Lee, W. L. (Food and Fertilizers Technology Centre, Taiwan), 131–150.
Karunakaran, G., Tripathi, P. C., Sankar, V., Sakthivel, T., and Senthilkumar, R. (2019b). “Dragon Fruit: A new introduction crop to India: A potential market with promising future,” in proceeding: National Seminar on Strategies for conservation, Improvement and utilization of underutilized fruits, Karnataka, India, 1-3rd December. (Bengaluruu Karnataka India: Indian Institute of horticultural Research) 138–139.
Karunakaran, G., Tripathi, P. C., Singh, P., Arivalagan, M., and Sriram, S. (2021b). “Smart fruits for 21stCentury,” in Current Horticulture: Improvement, Production, Plant Health Management and Value-addition, vol. 1 . Eds. Singh, B., Singh, A. K., Tomar, B. S., Ranjan, J. K., and Dutt, S. (Brillion Publishing, New Delhi), 193–207.
Kenney, J. F. and Keeping, E. S. (1962). “Confidence interval charts,” in Mathematics of Statistics, 3rd ed, vol. Pt. 1. (Van Nostrand, Princeton, NJ), 167–169.
Li, J. H., Yang, Y. J., Li, B. W., Li, W. J., Wang, G., Knops, J. M. H., et al. (2014). Effects of nitrogen and phosphorus fertilization on soil carbon in alpine meadows on the Qinghai-Tibetan plateau. Plos One, 9, 11. doi: 10.1371/journal.pone.0103266
Lima, D. C., Mendes, N. V. B., Diógenes, M. F. S., Corrêa, M. C., Natale, W., and Taniguchi, C. A. K. (2021). Initial growth and nutrient accumulation in Pitaya plants at different phenological stages. Rev. Caatinga. 34, 720–727. doi: 10.1590/1983-21252021v34n324rc
Lindsay, W. L. and Norvell, W. A. (1978). Development of a DTPA soil test for zinc, iron, manganese, and copper. Soil Sci. Soc Am. J. 42, 421–428. doi: 10.2136/sssaj1978.03615995004200030009x
Maity, P. K., Das, B. C., and Kundu, S. (2006). Effect of different sources of nutrients on yield and quality of guava cv. L-49. Crop Weed. 2, 17–19.
Mizrahi, Y. (2014). Vine-cacti pitayas: the new crops of the world. Rev. Bras. Frutic. 36, 124–138. doi: 10.1590/0100-2945-452/13
Monga, P. K., Vij, V. K., and Sharma, J. N. (2004). Effect of N, P and K on the yield and fruit quality of Kinnow mandarin. Indian J. Hortic. 61, 302–304.
Montgomery, D. C. (2017). Design and analysis of experiments (Hoboken, New Jersey: John wiley & sons).
Moreira, R. A., Ramos, J. D., Araujo, N. A., and de Marques, V. B. (2012). Produtividade e teores de nutrientes em cladódios de pitaia vermelha utilizando-se adubação orgânica e granulado bioclástico, Rev. Bras. Cienc. Agrar. 7, 714–719. doi: 10.5039/agraria.v7isa1551
Myers, R. H., Montgomery, D. C., and Anderson-Cook, C. M. (2016). Response surface methodology: process and product optimization using designed experiments (New York: John Wiley & Sons).
Nasreen, N., Ahmed, R., Ullah, M. A., and Hoque, M. A. (2013). Effect of N, P, K and Mg application on yield and fruit quality of mandarin (Citrus reticulata). Bangladesh J. Agric. Res. 38, 425–433. doi: 10.3329/bjar.v38i3.16969
Oloyede, F. M., Agbaje, G. O., and Obisesan, I. O. (2013). Effect of NPK fertilizer on fruit yield and yield components of pumpkin (Cucurbita pepo Linn.). Afr. J. Food Agric. Nutr. Dev. 13, 7755–7771. doi: 10.18697/ajfand.58.12260
Pandiselvam, R., Prithviraj, V., Manikantan, M. R., Beegum, P. S., Ramesh, S. V., Padmanabhan, S., et al. (2022). Central composite design, Pareto analysis, and artificial neural network for modelling of microwave processing parameters for tender coconut water measurement. Food 5, 100015. doi: 10.1016/j.meafoo.2021.100015
Perween, T. (2017). Studies on the effect of nutrient application in vegetative and reproductive phenology of dragon fruit. Thesis. Bidhan Chandra Krishi Viswavidyalaya, Mohanpur, West Bengal, India.
Perween, T. and Hasan, M. A. (2019). Growth, yield and quality of dragon fruit as influenced by NPK fertilization. Ind. J. Hortic. 76, 180–183.
Rangel, P. P., Diéguez, E. T., Valdez-Aguilar, L. A., García-Hernández, J. L., and Luna-Ortega, J. G. (2020). Interactive effects of the potassium and nitrogen relationship on yield and quality of strawberry grown under soilless conditions. Plant 9, 1–10. doi: 10.3390/plants9040441
Romero, I. P., Gomez, M. J. R., Iniguez, F. M. S., and Magro, P. C. (2022). Optimization of the osmotic dehydration process of plums (Prunus salicina L.) In solutions enriched with inulin, using response surface methodology, LWT. Food Sci. Technol. 157, 113092. doi: 10.1016/j.lwt.2022.113092
Sahu, A., Kishore, K., Nayak, R. K., Dash, S. N., Sahoo, S. C., and Barik, S. (2022). Influence of potassium on mineral content, yield and quality attributes of dragon fruit (Selenicereus monacanthus) in acidic soil of Eastern tropical region of India. J. Plant Nutr. 46, 1–16. doi: 10.1080/01904167.2022.2160744
Sarker, B. C. and Rahim, M. A. (2012). Effects of doses and splits of fertilizer application on harvesting time, yield and quality of mango cv. Amrapali. Bangladesh J. Agric. Res. 37, 279–293. doi: 10.3329/bjar.v37i2.11231
Shameena, B. P. P., Manikantan, M. R., Sharma, M., Pandiselvam, R., Gupta, R. K., and Hebbar, K. B. (2019). Optimization of processing variables for the development of virgin coconut oil cake based extruded snacks. J. Food Process Eng. 42, 13048. doi: 10.1111/jfpe.13048
Subbiah, B. V. and Asija, G. L. (1956). A rapid procedure for estimation of available nitrogen in soils. Curr. Sci. 25, 259–260.
Suguna, K., Koushik, C., Sujitha, T. P., and Gopinath, K. (2011). Effect of potassium on flowering, yield and quality of dragon fruit (Hylocereus undatus). Int. J. Environ. Agric. Biotech. 4, 435–441.
Sujayasree, O. J., Tiwari, R. B., Venugopalan, R., Narayana, C. K., Bhuvaneswari, S., Ranjitha, K., et al. (2022). Optimization of factors influencing osmotic dehydration of aonla (Phyllanthus emblica L.) segments in salt solution using response surface methodology. J. Hortic. Sci. 17, 397–410. doi: 10.24154/jhs.v17i2.1404
Then, T. H. (2013). The effects of foliar fertilizers on the red pitaya (Hylocerus polyrhizus) fruit weight. Acta Hortic. 984, 227–230. doi: 10.17660/ActaHortic.2013.984.25
USDA (1987). United States Department of Agriculture Soil Mechanics Level 1 Module 3 USDA Soil Textural Classification Study Guide (Washington, DC: USDA Soil Conservation Service).
Wakchaure, G. C., Kumar, S., Meena, K. K., Rane, J., and Pathak, H. (2021). Dragon Fruit Cultivation in India: Scope, Constraints and Policy Issues, Technical Bulletin No. 27 Vol. 47 (Baramati, Pune, Maharashtra, India: ICAR–National Institute of Abiotic Stress Management).
Walkley, A. J. and Black, I. A. (1934). Estimation of soil organic carbon by the chromic acid titration method. Soil Sci. 37, 29–38. doi: 10.1097/00010694-193401000-00003
Wang, Y. Z., Zhang, H. P., Huang, X. S., Wang, J. Z., Cheng, R., and Chen, G. D. (2017). Effect of potassium supply on plant potassium distribution and growth and leaf photosynthetic capacity of Pyrus pyrifolia. J. Nanjing Agric. Univ. 40, 60–67.
Keywords: dragon fruit, optimization of fertilizer, plant growth, nutrient acquisition, fruit yield
Citation: Karunakaran G, Ramachandran S, Venugopalan R, Selladurai R, Arivalagan M, Srivastava AK, Shilpa KG and Ruchitha T (2025) Optimization of fertilizer doses for increased fruit yield of dragon fruit adopting response surface methodology and Box-Behnken design. Front. Plant Sci. 16:1661974. doi: 10.3389/fpls.2025.1661974
Received: 08 July 2025; Accepted: 25 August 2025;
Published: 17 September 2025.
Edited by:
Nitin Kumar, Central Pulp & Paper Research Institute (CPPRI), IndiaReviewed by:
Kulasekaran Ramesh, Indian Institute of Oilseeds Research (ICAR), IndiaRui Chen, Xinjiang Agricultural University, China
Sukirti Mohanty, Siksha O Anusandhan, India
Copyright © 2025 Karunakaran, Ramachandran, Venugopalan, Selladurai, Arivalagan, Srivastava, Shilpa and Ruchitha. This is an open-access article distributed under the terms of the Creative Commons Attribution License (CC BY). The use, distribution or reproduction in other forums is permitted, provided the original author(s) and the copyright owner(s) are credited and that the original publication in this journal is cited, in accordance with accepted academic practice. No use, distribution or reproduction is permitted which does not comply with these terms.
*Correspondence: Ganesan Karunakaran, YXZvamFjazIwMjNAZ21haWwuY29t; Sundram Ramachandran, cmFtYTAwN3ZhQGdtYWlsLmNvbQ==