 Jun Liu1*
 Tingting Cheng1Lili Wang1Conglong Lian1
 Rui Ma1
 Weimeng Feng1Jinxun Lan1Bao Zhang1Qingxin Du2Jiefeng Kou3,4*Suiqing Chen1,5*
- 1School of Pharmacy, Henan University of Chinese Medicine, Zhengzhou, Henan, China
- 2Research Institute of Non-Timber Forestry, Chinese Academy of Forestry, Zhengzhou, China
- 3International Center for Bamboo and Rattan/Key Laboratory of Bamboo and Rattan Science and Technology, National Forestry and Grassland Administration, Beijing, China
- 4Changjiang Basin Ecology and Environment Monitoring and Scientific Research Center, Changjiang Basin Ecology and Environment Administration, Ministry of Ecology and Environment, Wuhan, China
- 5China Collaborative Innovation Center of Research and Development on the Whole Industry Chain of Yu-Yao, Zhengzhou, Henan, China
Flavonoids with great medicinal value play an important role in plant individual growth and stress resistance. Flavonol synthase (FLS) is one of the key enzymes to synthesize flavonoids. However, there is no information available about FLS family in Eucommia ulmoides, an ancient and precious plant with great economic value. In this study, twelve EuFLS genes were identified and classified into two distinct subgroups based on their phylogenetic trees, these genes were unevenly distributed across eight chromosomes. Gene structure analysis revealed that EuFLS genes contained between two and four introns. The number of introns within members of the same evolutionary branch was generally consistent. The EuFLS promoters region contained a substantial number of hormone-responsive, stress-responsive, and light-responsive. RNA-seq data revealed tissue-specific expression patterns, EuFLS2 and EuFLS9 displayed the highest expression levels in leaves, whereas EuFLS4 the peak expression level in the xylem. The majority of EuFLS genes showed higher expression levels in red leaves and male flowers; furthermore, these genes contributed to leaf development and rubber biosynthesis. qRT-PCR analysis showed that most EuFLS genes downregulation under ABA and SA treatments. EuFLSs displayed divergent expression trends under MeJA treatment. While drought stress significantly induced the expression of most EuFLSs, especially, EuFLS9 was induced 50-fold at 3 h, suggesting that FLS genes in E. ulmoides regulate plant growth and respond to different stresses by following different hormone signaling pathways, which laid a valuable foundation for further understanding the function of FLS genes in multiple stress responses and phytohormone crosstalk in E. ulmoides.
1 Introduction
Eucommia ulmoides, a member of the genus Eucommia within the family Eucommiaceae, is a deciduous tree characterized by its gray-brown bark and is a dioecious plant with unisexual flowers occurring on separate individuals (Editorial Committee of Flora of China and Chinese Academy of Sciences, 1979). E. ulmoides demonstrates remarkable adaptability and is primarily distributed across Guizhou, northern Sichuan, southern Shaanxi, western Henan, western Hubei, and western Hunan. Recognized as a rare and endangered medicinal plant endemic to China, E. ulmoides has been extensively utilized in traditional Chinese medicine for centuries. It is listed as a superior-grade herb in the “Shennong Bencao Jing”. Flavonoids are one of the main active ingredients in E. ulmoides, and they possess various pharmacological properties, such as lowering blood sugar, blood pressure, blood lipids, antioxidation, and enhancing immunity (Gong et al., 2022; Li et al., 2022; Li et al., 2024).
Flavonoids, important secondary metabolites, are extensively distributed in the plant kingdom and can be divided into six categories including flavones, isoflavones, flavanones, flavonols, flavanols, and anthocyanins (Harborne and Williams, 2000; Winkel-Shirley, 2002; Martens et al., 2010; Wang et al., 2021b). These compounds are characterized by their low molecular weight and wide distribution. They contribute to the formation of plant leaf color, flower color, fruit color, and seed color and also play significant roles in plant growth and development, mediating responses to abiotic stresses and enhancing resistance against pathogen infections. Moreover, flavonoids are actively involved in the complex signaling networks that govern plant-microbe interactions, facilitating the transmission of relevant biochemical signals (Schijlen et al., 2004). Additionally, they serve as a protective barrier, shielding plant tissues from the detrimental effects of ultraviolet (UV) radiation (Stracke et al., 2010). In E. ulmoides, the accumulation of most flavonoids peak in growing leaves, follow by old leaves, and the expression levels of most F3’H, FLS, CHI and CHS isoforms are relatively high in growing leaves, indicating that isoforms in the flavonoid biosynthetic pathway and flavonoid metabolic pathway are highly expressed in growing leaves and old leaves (Li et al., 2019).
Flavonol synthase (FLS) is a key enzyme in synthesis of flavonols, which can control the flux of flavonoids into the branch pathway of flavonols synthesis to form various flavonol compounds which are present mainly in the form of quercetin and kaempferol (Winkel-Shirley, 2002; Falcone Ferreyra et al., 2012). FLS belongs to the 2-oxoglutarate-dependent dioxygenase (2-ODD) family of non-heme iron enzymes characterized by two conserved functional domains: The N-terminal dioxygenase domain (DIOX_N) and the C-terminal 2-oxoglutarate/Fe(II)-dependent oxygenase domain (2OG-Fe II_Oxy) (Huang and Cai, 2014; Shi et al., 2019). The enzymatic activity of FLS was first identified in petunias (Forkmann et al., 1986). FLS genes have been then identified in various organisms. The tobacco genome contains nine NtFLS genes, with NtFLS1 and NtFLS2 significantly regulated by various hormones and abiotic stressors (Shi et al., 2017). In Brassica napus, 13 FLS genes have been characterized, among which BnaFLS1–1 and BnaFLS1–2 are associated with flavonol accumulation (Schilbert et al., 2021). Furthermore, the overexpression of the AvFLS gene increases the total flavonoid content of tobacco and enhances antioxidant enzyme activity (Wang et al., 2021a). In Brassica vegetables, the silencing of BrFLS1 reduces plant resistance to low temperatures (Yue et al., 2024). In alfalfa, cold stress triggers the expression of the MsFLS gene family, with MsFLS7, MsFLS9, MsFLS10, MsFLS11, MsFLS13, MsFLS16, MsFLS17 and MsFLS18 showing significant upregulation, and the overexpression of MsFLS13 significantly improve cold stress tolerance and antioxidant capacity and reduced membrane oxidative damage (Zhang et al., 2025). In safflower, the expression level of CtFLS1 show a positive correlation with the accumulation level of total flavonoid content, CtFLS1-overexpression Arabidopsis plants significantly induce the expression levels of key genes involved in flavonol pathway, promoted seed germination, as well as resistance to osmotic pressure and drought, and reduced sensitivity to ABA compared to mutant and wild-type plants (Ma et al., 2024). In Juglans sigillata, JsFLS5 overexpression in calli effectively mitigates the oxidative damage induced by osmotic stress and reduces Na+ toxicity by enhancing flavonoid synthesis under salt stress conditions (Wei et al., 2023). In apples, overexpression of dihydroflavonol 4-reductase (DFR) or the silencing of the FLS gene results in a significant increase in anthocyanin accumulation in leaves, leading to the formation of red-leaf phenotypes (Tian et al., 2015). Similarly, during the ripening of jujube fruits, the deepening of fruit peel coloration is associated with FLS downregulation and a concomitant DFR upregulation (Wang, 2021). This regulatory dynamic is further supported by studies in tobacco, where FLS-silenced lines exhibit a marked reduction in flavonol content and a corresponding increase in anthocyanin levels (Mahajan et al., 2012). In addition to their role in pigmentation, flavonols synthesized by the action of FLS exert protective effects against ultraviolet (UV) radiation damage in both apple (Solovchenko and Schmitz-Eiberger, 2003) and maize (Falcone Ferreyra et al., 2010). Notably, under reduced UV irradiation and prolonged transcriptional activity of key regulatory factors, such as HYPOCOTYL5 (HY5), MYB10, and MYB22, FLS is downregulated in apple throughout the fruit development process (Henry-Kirk et al., 2018).
Research has shown that heterologous expression of Apocynum venetum FLS in Arabidopsis thaliana significantly enhanced flavonoid accumulation and photosynthetic efficiency while simultaneously reducing malondialdehyde (MDA) content. These changes collectively contribute to a marked improvement in the salt stress tolerance of transgenic Arabidopsis (Cai, 2022). Furthermore, studies have demonstrated that various environmental and chemical stimuli, including ultraviolet (UV) radiation, sodium chloride (NaCl) stress, and exogenous application of abscisic acid (ABA) and salicylic acid (SA), can upregulate the expression of Ginkgo biloba FLS. This upregulation leads to increase flavonol biosynthesis, thereby enhancing the plant’s ability to withstand abiotic stresses (Xu et al., 2011). Similarly, in tobacco, the heterologous expression of Muscari armeniacum MaFLS result in a notable decrease in anthocyanin content in the corolla of transgenic tobacco, accompanied by a significant increase in total flavonol levels. Quantitative real-time-polymerase chain reaction (qRT-PCR) analysis reveal that the expression levels of key anthocyanin biosynthesis-related genes, including NtCHS, NtF3H, NtDFR, NtANS, and the R2R3MYB transcription factor (NtAN2), are significantly downregulated in transgenic tobacco. Conversely, the NtFLS gene is significantly upregulated, leading to corolla coloration ranging from light pink to nearly white (Liu, 2019). Since the discovery of the FLS gene in Petunia in 1993 (Kim et al., 2014), FLSs have been successfully cloned and characterized in a wide range of species, including Populus deltoides (Kim et al., 2010), Zea mays (Cai, 2022), G. biloba (Xu et al., 2011), Musa nana (Xiao et al., 2024), Dioscorea esculenta (Kou et al., 2023), and Medicago sativa (Zhang et al., 2023). These findings highlight the conserved yet versatile role of FLSs in regulating flavonoid metabolism across diverse plant species.
Although FLSs have been extensively studied in a wide range of plant species, the FLS gene family in E. ulmoides remains unexplored. Based on the genomic data of E. ulmoides, this study employed comprehensive bioinformatics approaches to systematically identify and characterize members of its FLS gene family. Furthermore, the transcriptomic data was utilized to investigate the potential roles of EuFLS genes during different developmental stages, in the context of leaf color variations, and in the regulation of rubber biosynthesis in E. ulmoides. The expression characteristics of EuFLSs in various tissues and developmental stages, as well as their expression responses to different hormonal treatments and drought stress were analyzed using qRT-PCR. Collectively, the research provides a robust theoretical foundation for elucidating the functional roles of EuFLSs in E. ulmoides.
2 Materials and methods
2.1 Identification of EuFLS genes in E. ulmoides
The FLS protein sequences of Arabidopsis and rice were obtained from The Arabidopsis Information Resource (https://www.arabidopsis.org/) and Rice Data (http://www.ricedata.cn/gene/), respectively. The protein sequence of E. ulmoides was obtained from the its genome database with the accession number PRJNA599775; GCA_016647705.1 in the NCBI database (https://www.ncbi.nlm.nih.gov/). To identify non-redundant FLS genes in the E. ulmoides genome, we employed the Hidden Markov Model (HMM) profile of the 2OG-FeII_Oxy (PF03171) and DIOX_N (PF14226) with an e-value threshold of 10-5. Redundant sequences were excluded from subsequent analyses based on sequences alignment results unsing Cluster W (Tompson et al., 1994). To confirm the FLS domain in identified proteins, domain analysis was performed using InterProScan tool (http://www.ebi.ac.uk/Tools/pfa/iprscan5/) (Quevillon et al., 2005). The candidate sequences were further validated using three online tools: NCBI Conserved Domain Search Service (CD Search; http://forestry.fafu.edu.cn/db/PhePacBio/blast/blast_cs.php), Pfam (http://pfam.sanger.ac.uk/), and SMART (http://smart.embl-heidelberg.de/) (Letunic et al., 2009), to confirm the presence of the DIOX_N domain, which is unique to the FLS gene family. Physicochemical parameters, including molecular weight (MW) and isoelectric point (pI), of each EuFLS protein were predicted using the pI/Mw tool from ExPASy (http://www.expasy.org/tools/) with the resolution parameter set to “average” (Gasteiger et al., 2003). Three-dimensional (3D) structures of EuFLS proteins were modeled using SWISS-MODEL (https://swissmodel.expasy.org/) (Waterhouse et al., 2018).
2.2 Phylogenetic analysis, gene structural, and conserved motif of FLS in E. ulmoides
A total of 12 FLS protein sequences from E. ulmoides were aligned using Clustal W with default parameters, An unrooted phylogenetic tree was subsequently constructed using MEGA6.0 software via the Neighbor-joining (NJ) algorithm, and the support of the tree topology was assessed by bootstrap analysis with 1000 replicates (Tamura et al., 2013). For comparative phylogenetic analysis, a neighbor-joining phylogenetic tree was constructed using FLS protein sequences from multiple species, including Arabidopsis, Arabidopsis lyrata, Arabidopsis halleri, Antirrhinum majus, Arabis nemorensis, Allium cepa, Camellia nitidissima, Cyclamen purpurascens, Camellia sinensis, Capsella rubella, Citrus unshiu, Capsella grandiflora, Brassica oleracea, Brassica napus, Brassica rapa, Brassica cretica, Boechera stricta, Eustoma russellianum, Eutrema salsugineum, Zea mays, Fagopyrum dibotrys, Fagopyrum esculentum, Fagopyrum tataricum, Fragaria x ananassa, Petroselinum crispum, Ginkgo biloba, Gentiana triflora, Glycine max, Muscari aucheri, Malus domestica, Rosa rugosa, Microthlaspi erraticum, Narcissus tazetta, Vaccinium corymbosum, Prunus persica, Vitis vinifera, Petunia x hybrida.
To analyze the exon-intron organization of the EuFLS genes, the complete E. ulmoides genome and coding sequences were obtained from the Genome Warehouse Database. The Gene Structure Display Server (GSDS) was employed to visualize the exon-intron structures of individual EuFLS genes by aligning their cDNAs sequences with the corresponding genomic DNA sequences (Guo et al., 2007). To identify conserved motifs within EuFLS proteins, the online MEME (Multiple Expectation Maximization for Motif Elicitation) program (http://memesuite.org/tools/meme) was used with the following parameters: number of repetitions = any, maximum number of motifs = 20, minimum width ≥ 6, maximum width ≤ 200. Only motifs with an E-value < 1e-20 were retained for further analysis (Bailey et al., 2006).
2.3 Chromosomal distribution, and cis-regulatory element analysis in the promoter regions of FLS genes in E. ulmoides
The chromosomal locations of EuFLS genes were determined using TBtools (Chen et al., 2023) based on the genomic data of E. ulmoides. To identify the cis-elements in the promoter region of each FLS gene in E. ulmoides, the 2000 bp upstream sequences of the FLS-encoding DNA sequences were extracted from the available E. ulmoides genome data using the TBtools program, and possible cis-acting elements were analyzed using the PlantCARE database (http://bioinformatics.psb.ugent.be/webtools/plantcare/index.html). The cis-element distributions were visualized using TBtools.
To investigate the association between EuFLS genes and genes involved in the E. ulmoides rubber biosynthesis pathway, we constructed a co-expression network using the values of these target genes. Pearson’s correlation analysis was conducted to support the network construction, utilizing OmicStudio tools (https://www.omicstudio.cn/tool/62).
2.4 Expression patterns of EuFLSs in different tissues and different developmental stages based on the public RNA-seq data sets
Transcriptome data of E. ulmoides across different leaf developmental stages (leaf buds, growing leaves, young leaves and mature leaves) were obtained from the NCBI Sequence Read Archive (SRA) database was SRP218063 (Li et al., 2019). Different tissues (leaves, seeds, marginal pericarp, central pericarp, and xylem) with SRA accessions SRX7525252-54, SRX7532003-05, SRX7531725-27, and SRX7533248-50, leaves of different colors (green leaves and purple leaves) under accession SRP327902. Different developmental stages of floral with accessions SRR2170964 and SRR2170970) (Qing et al., 2021). In addition, RNA-seq data from two E. ulmoides cultivars, ‘Xiaoye’ and ‘Qinzhong 2’ under accessions SRP158357 (Ye, 2019). these datasets were used to investigate the expression patterns of EuFLS genes during E. ulmoides rubber biosynthesis. The expression abundance of EuFLS genes was determined using their Fragments Per Kilobase of transcript per Million mapped reads (FPKM) values. Notably, some EuFLS genes exhibited an FPKM value of 0, which likely reflects expression levels below the detection limit of the current transcriptomic sequencing technology rather than absolute absence of expression. A heatmap of EuFLSs expression was generated using TBtools, with expression values represented as log2(FPKM) to standardize the data.
2.5 Plant materials and stress treatments
The E. ulmoides seedling were cultured in a growth chamber with a 16-h light/8-h dark cycle at 22°C/18°C, 80% humidity, and watered with Hoagland nutrient solution every week. In the drought stress treatment, a 20% PEG6000 solution was poured into the medium vermiculite with E. ulmoides seedlings. To examine the effect of hormones on the expression of EuFLS genes, 2-month-old seedling leaves of E. ulmoides were sprayed with 200 mM Gibberellic acid (GA3), ABA, Methyl Jasmonate (MeJA) and SA, until there was liquid dripping. Untreated samples were used as the control treatment. The leaves were sampled at 0, 6, 12, 24, 36, 48, and 72 h after hormone treatments, frozen in liquid nitrogen, and finally stored at -80°C for RNA extraction. There were three independent replicates for each treatment.
2.6 RNA extraction, cDNA synthesis, and qRT-PCR gene expression analysis
The RNA extraction kit (TIANGEN Biotechnologies, DP441, China) was used to extract total RNA according to the manufacturer’s instructions. A NanoDrop ND-2000 (Thermo Scientific, USA) spectrophotometer and 1% agarose gel electrophoresis were used to detect the RNA quality of all samples. For qRT-PCR, Primer 3 web (http://primer3.ut.ee/) was used to design the specific primers based on the coding sequence of EuFLS genes. The primers of all the EuFLS genes were listed in Supplementary Table S1. The Ubiquitin-conjugating enzyme S (UBC) was used as the internal reference gene (Li et al., 2020b). The qRT-PCR reactions were conducted on a Quant Studio 5 (ABI, USA) using the 2×Universal SYBR Green Fast qPCP Mix. The PCR reaction mixture (20 µL) contained 7.2 µL of cDNA, 10 µL of SYBR Advantage Premix, 0.4 µL of each primer (10 nmol mL-1). The following amplification reactions were performed for qRT-PCR: 95° C for 5 s, 60°C for 30 s, 40 cycles. The ΔCT and ΔΔCT values were calculated using the 2-ΔΔCT method. To ensure the accuracy of the data, we performed 3 biological replicates and 3 technical replicates.
3 Results
3.1 Identification and characterization of EuFLS gene family members
Using the AtFLS sequence as a reference and performing comparative analyses with the NCBI and Pfam databases, a total of 12 EuFLSs were identified in the E. ulmoides genome, designated as EuFLS1 to EuFLS12. The physicochemical properties of the EuFLSs were analyzed using the ExPASy tool. The results showed that the polypeptides encoded by the 12 EuFLSs comprised 328–420 amino acids (aa) (Table 1), with the longest being EuFLS9 (420 aa) and the shortest being EuFLS7 (328 aa). The molecular weight (MW) of the proteins varied from 36297.19 Da (EuFLS7) to 46513.98 Da (EuFLS9), and the isoelectric point (pI) ranged from 5.46 (EuFLS1) to 8.72 (EuFLS10). Notably, only EuFLS8 and EuFLS10 exhibited pI values >7, classifying them as basic proteins. The remaining EuFLSs had pI values <7, indicating that they were acidic in nature. Regarding protein stability, the instability indices of the EuFLSs ranged from 32.70 (EuFLS4 and EuFLS5) to 51.45 (EuFLS8). The instability indices of EuFLS3, EuFLS4, EuFLS5, and EuFLS7 below 40, categorizing them as stable proteins. The remaining EuFLSs were classified as unstable.
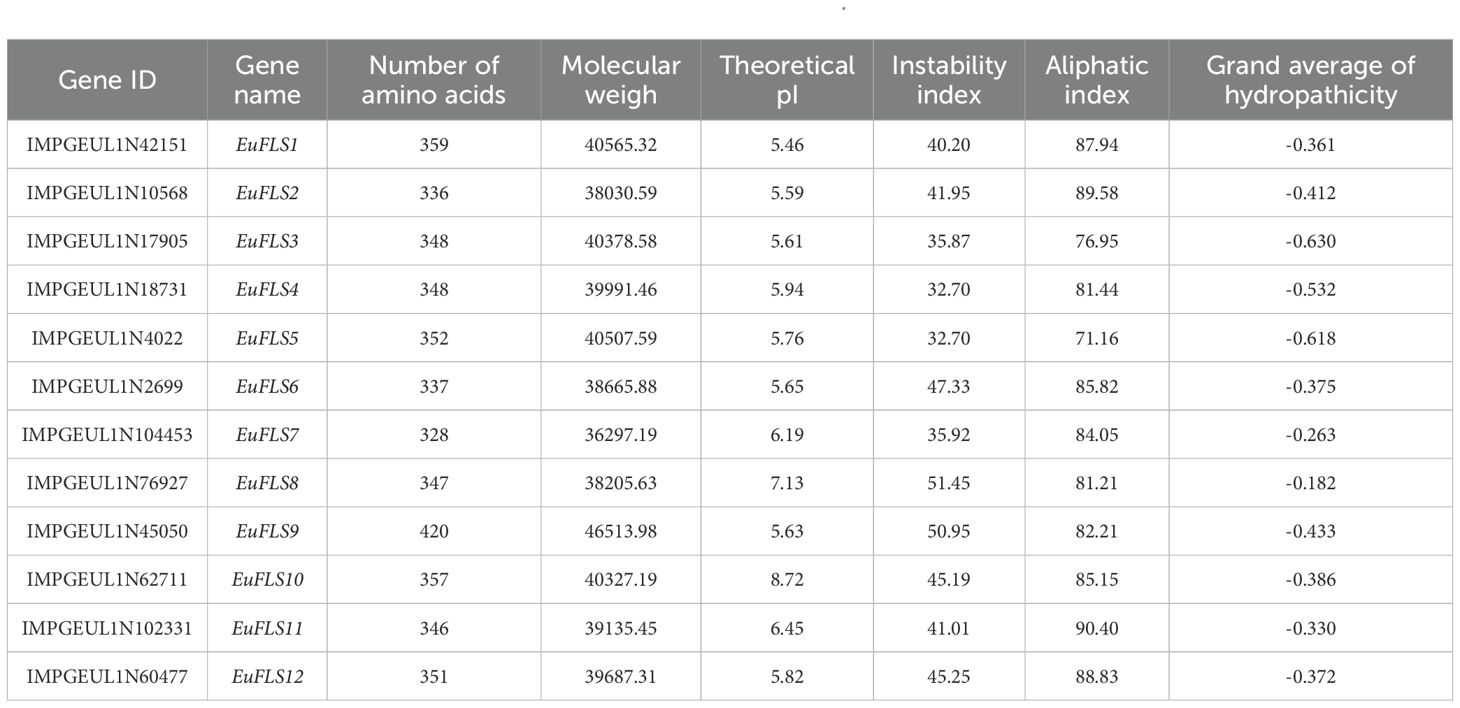
Table 1. Analysis of physical and chemical properties of FLS proteins from E. ulmoides.
The aliphatic indices of EuFLSs ranged from 87.40 (EuFLS5) to 131.81 (EuFLS7), while the grand average of hydropathicity (GRAVY) values varied between −0.412 (EuFLS2) and 0.263 (EuFLS7). Among the 12 EuFLSs, six proteins exhibited GRAVY values of <0, indicating that they were hydrophilic in nature, while the remaining proteins were classified as lipophilic. A secondary structure analysis demonstrated that all proteins contained α-helices, extended chains, and random coils; however, no β-turns were detected (Supplementary Table S2). Specifically, the proportions of α-helices and random coils ranged from 32.12% to 41.71% and 49.86% and 59.59%, corresponding to aa counts ranging from 62 to 320 aa and 104 to 406 aa, respectively. Overall, the secondary structure composition of the 12 EuFLSs was in the following order based on abundance: random coils > α-helices > extended chains > β-turns. Furthermore, to obtain more structural insights, the 3D structures of EuFLS proteins were also modeled. All these 3D structures had an almost similar structural composition with secondary structures (Figure 1).
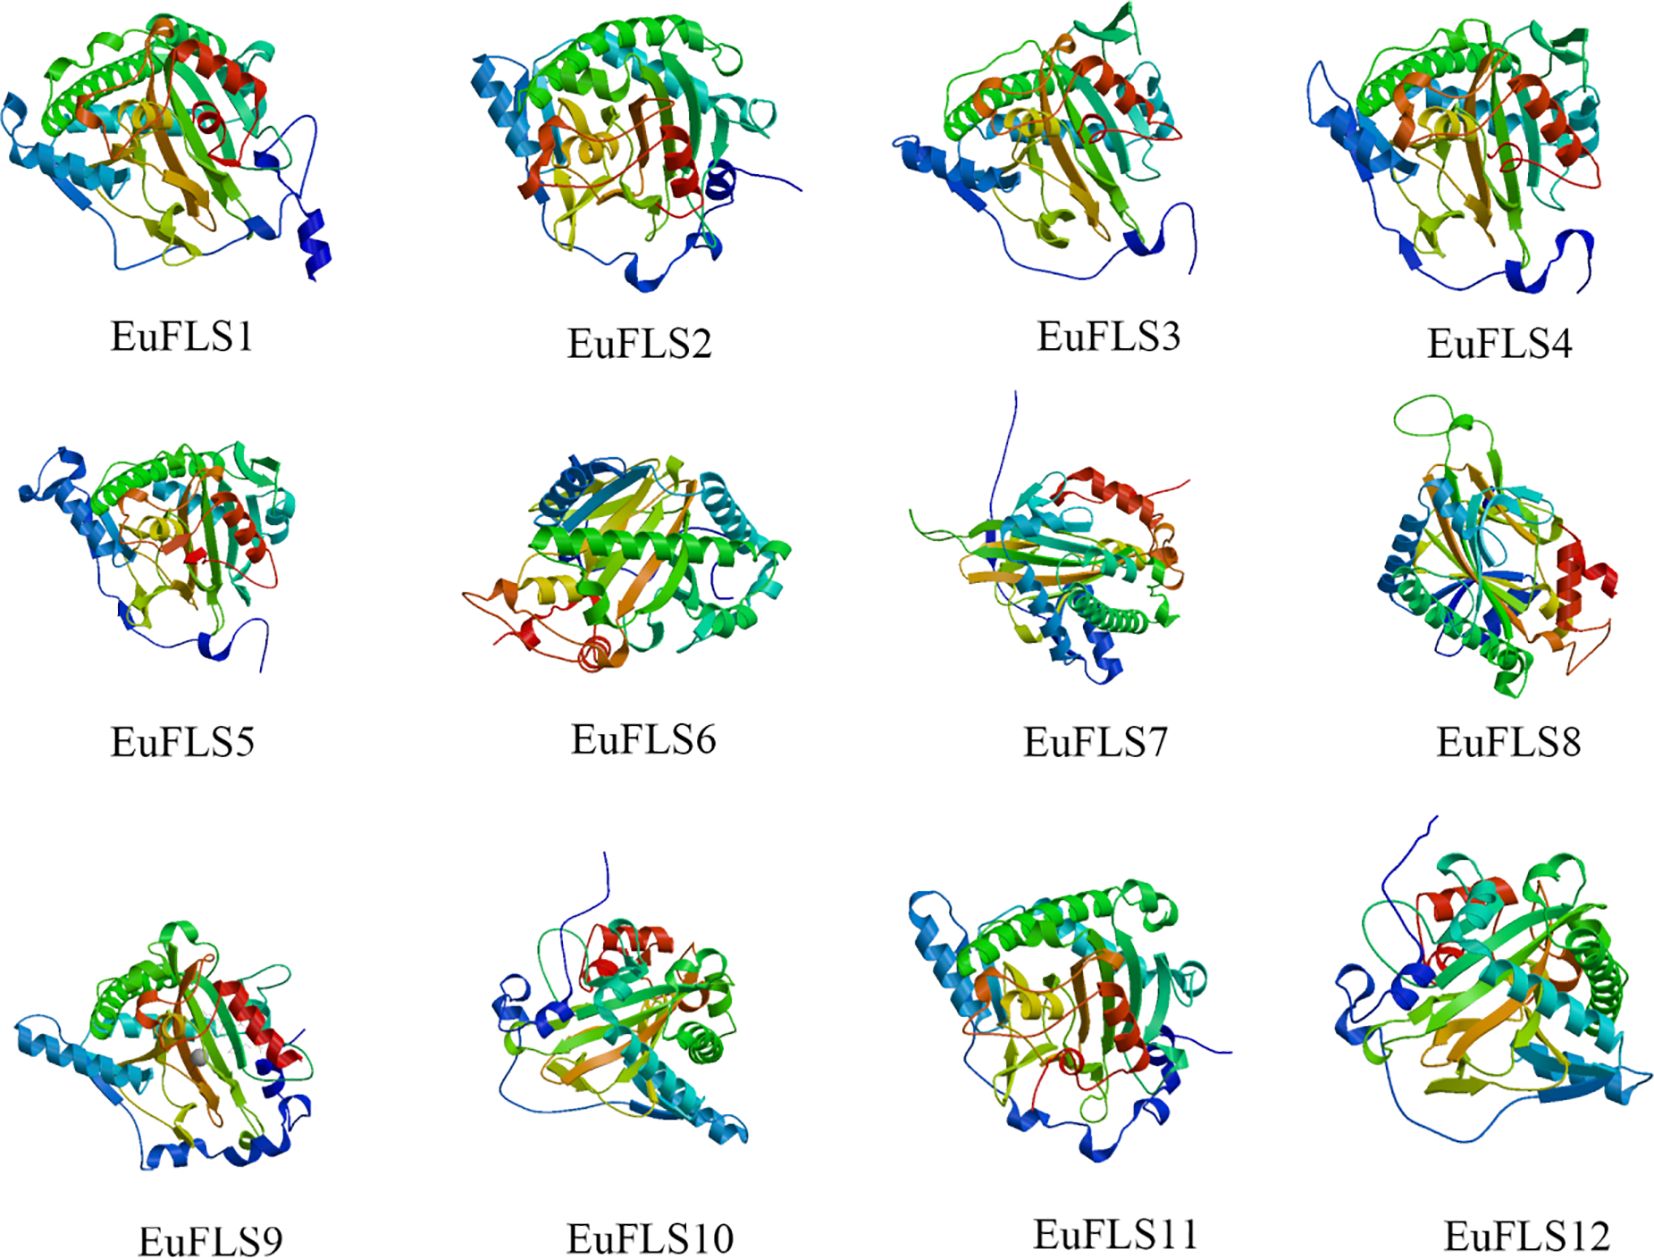
Figure 1. The tertiary structure prediction of EuFLS proteins in E. ulmoides.
3.2 Phylogeny and classification of EuFLSs
To elucidate the evolutionary relationships among EuFLSs, a neighbor-joining phylogenetic tree was constructed using 139 FLS protein sequences from 38 plant species. The EuFLS candidates were further classified within the FLS gene family based on their phylogenetic relationship to their most likely Arabidopsis orthologs. The result showed that 139 FLSs were classified into seven distinct subfamilies: FLS, FLS1-FLS6 (Figure 2). Among these, Group FLS was the largest, with 43 FLSs, while Group FLS5 comprised 10 FLSs, which was the smallest subfamilies. EuFLSs were distributed across Groups FLS and FLS3. Specifically, Group FLS comprised the majority of EuFLSs (n = 11, 91.67%), while Group FLS3 contained only one EuFLS (EuFLS9).
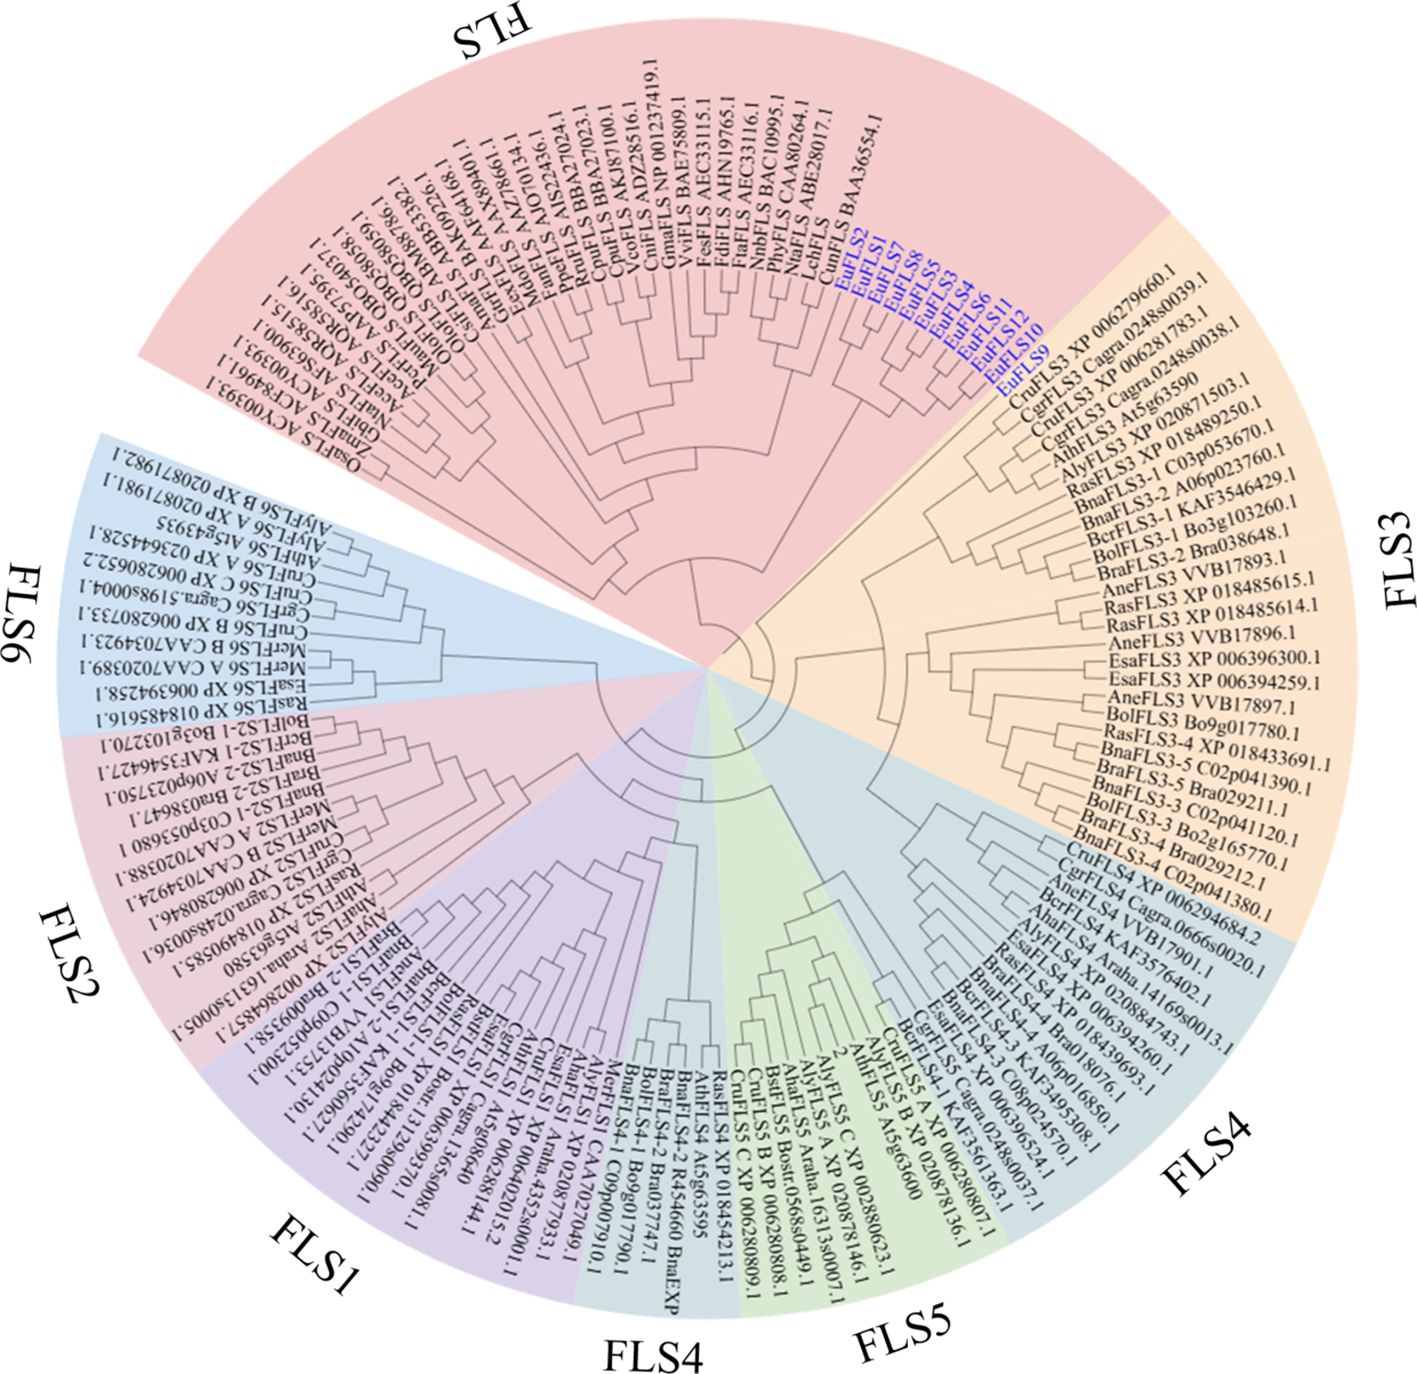
Figure 2. Phylogenetic tree of FLS protein from E. ulmoides, Arabidopsis (AthFLS), Arabidopsis lyrata (AlyFLS), Arabidopsis halleri (AhaFLS), Antirrhinum majus (AmaFLS), Arabis nemorensis (AneFLS), Allium cepa (AceFLS), Camellia nitidissima (CniFLS), Cyclamen purpurascens (CpuFLS), Camellia sinensis (CsiFLS), Capsella rubella (CruFLS), Citrus unshiu (CunFLS), Capsella grandiflora (CgrFLS), Brassica oleracea (BolFLS), Brassica napus (BnaFLS), Brassica rapa (BraFLS), Brassica cretica (BcrFLS), Boechera stricta (BstFLS), Eustoma russellianum (EexFLS), Eutrema salsugineum (EsaFLS), Zea mays (ZmaFLS), Fagopyrum dibotrys (FdiFLS), Fagopyrum esculentum (FesFLS), Fagopyrum tataricum (FtaFLS), Fragaria x ananassa (FanFLS), Petroselinum crispum (PcrFLS), Ginkgo biloba (OsaFLS), Gentiana triflora (GtrFLS), Glycine max (GmaFLS), Muscari aucheri (MauFLS), Malus domestica (MdoFLS), Rosa rugosa (RruFLS), Microthlaspi erraticum (MerFLS), Narcissus tazetta (NtaFLS), Vaccinium corymbosum (VcoFLS), Prunus persica (PpeFLS), Vitis vinifera (VviFLS), Petunia x hybrida (PhyFLS), EuFLS proteins were marked in blue.
3.3 Gene structures, protein conserved domain, and motif analysis of EuFLSs
To gain deeper insights into the structural characteristics of the EuFLS gene family in E. ulmoides, we conducted a comprehensive analysis of the conserved motifs and intron-exon structures in these genes. A total of ten conserved motifs were identified and designated as Motifs 1-10. The results showed that with the exception of EuFLS8, all other EuFLSs contained Motifs 1-5 (Figure 3A). Notably, Motif 6, Motif 8 and Motif 10 domain were exclusively present in EuFLS3, EuFLS4 and EuFLS5, however these proteins did not contain Motif 9. Furthermore, Motif 7 domain was exclusively present in (EuFLS2/6/9/10/11/12), suggesting that the functional divergence of EuFLSs might be closely associated with their motif compositions.
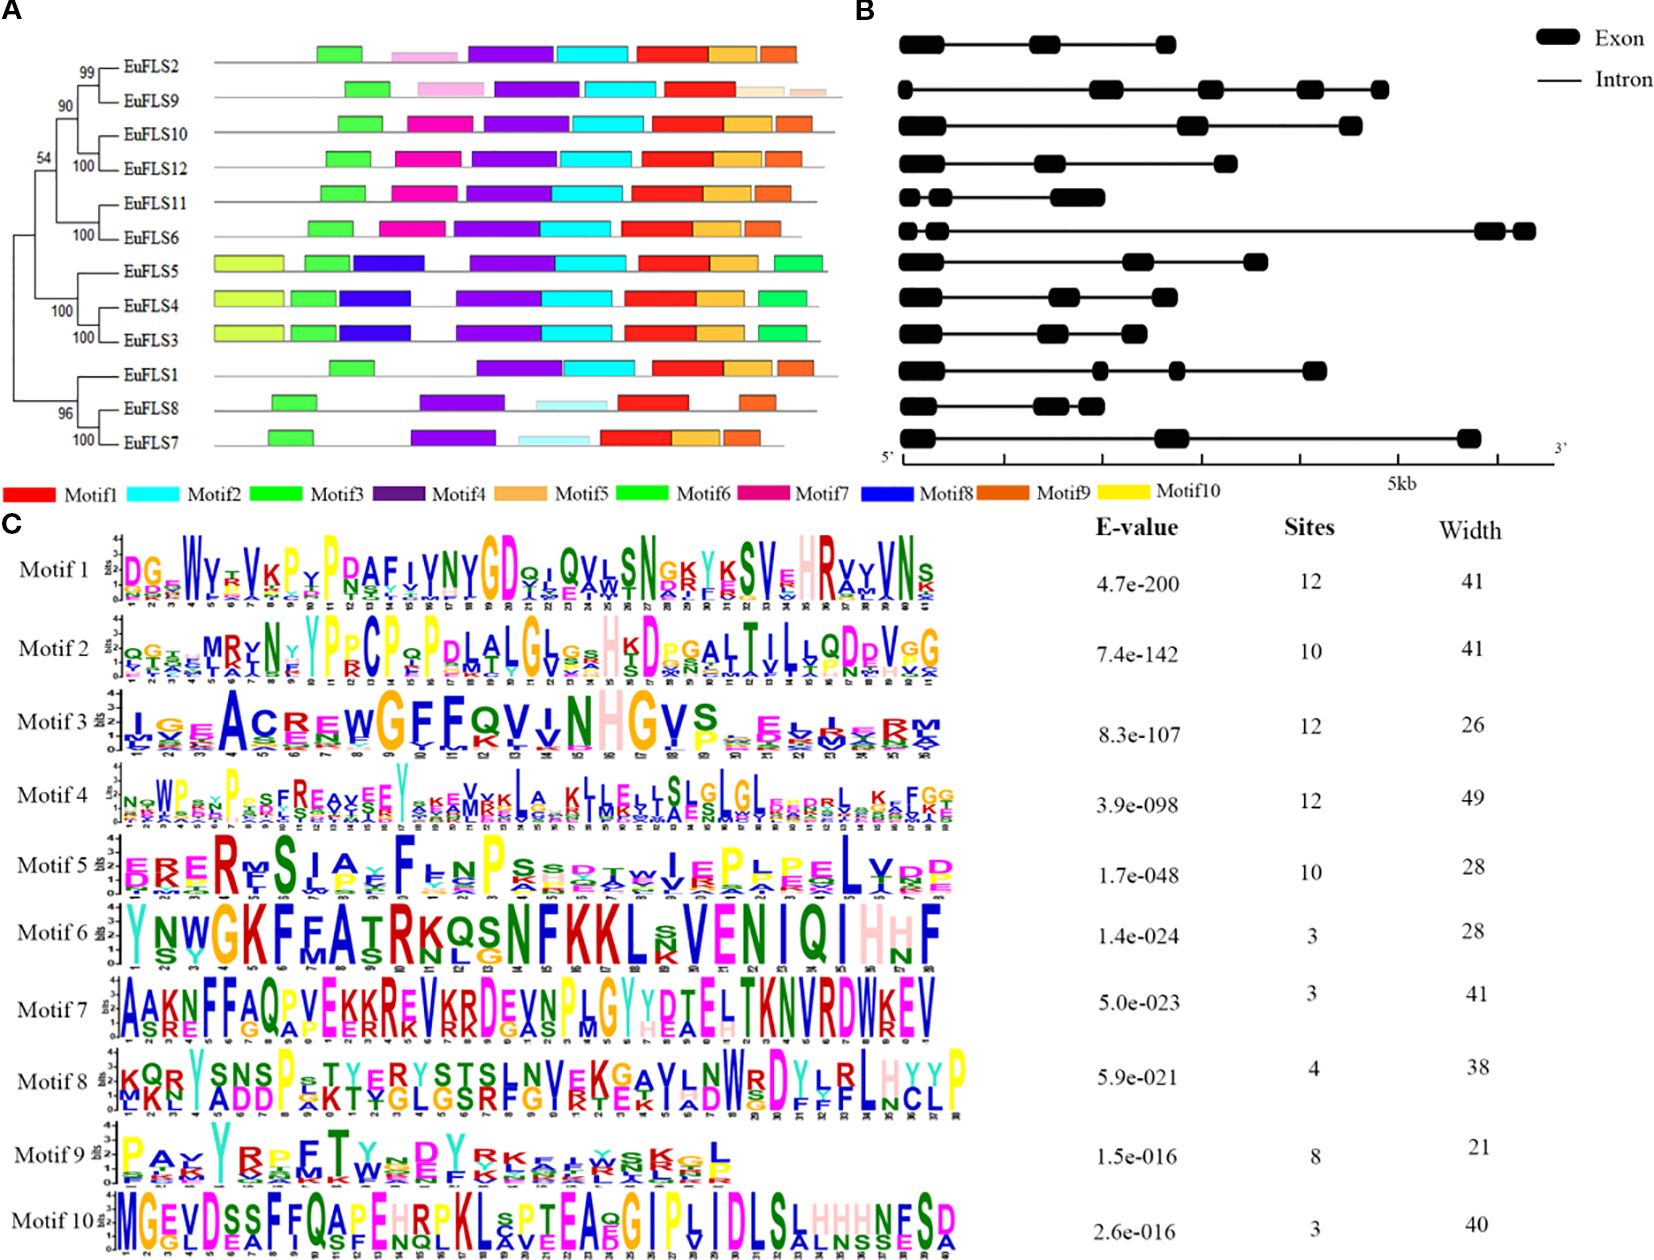
Figure 3. Analysis of conserved motifs and gene structures of EuFLS proteins. (A) Motif distribution of EuFLSs members. (B) Exon-intron structure analysis of EuFLSs. Black boxes, and black lines represent exons and introns, respectively. (C) Conserved motif amino acid sequence of EuFLSs members.
Gene structure analysis showed that the number of exons in the EuFLSs ranged from 3 to 5 (Figure 3B), EuFLS1, and EuFLS6 contained four exons each, only EuFLS9 comprised five exons. The protein evolutionary tree of the EuFLSs indicated that the structures of the proteins in the same subgroup were similar (Figure 3B). Overall, the EuFLSs structures were relatively simple, and most of them had 2–3 exons. We speculated that the EuFLSs may have been produced or differentiated relatively late, and that their functions are relatively specific. The proteins that were encoded by genes with similar exon and intron structures also had high homology in the phylogenetic tree, indicating that closely related genes shared similar exon/intron structures in their evolution. The lengths of EuFLSs intron and exon locations and numbers were different among the different members of the EuFLSs gene family, indicating that the EuFLSs family had undergone strong differentiation during their evolution. The diversity of the intron/exon structure of the EuFLSs and the relative consistency within each subgroup indicated the EuFLSs structures were conserved within a subgroup and the diversity in evolution.
3.4 Chromosomal distribution, and cis-regulatory element analysis in the promoter regions of FLS genes in E. ulmoides
Based on the annotated genome information of E. ulmoides, the chromosomal localization of EuFLSs was determined. Our results revealed that the 12 EuFLSs were unevenly distributed across eight E. ulmoides chromosomes (Figure 4). Notably, chromosome 3/7/8/17 harbored two members. Each of the remaining chromosomes carried only a single EuFLS. This uneven distribution pattern suggested potential functional or evolutionary significance associated with the clustering of EuFLSs on specific chromosomes.
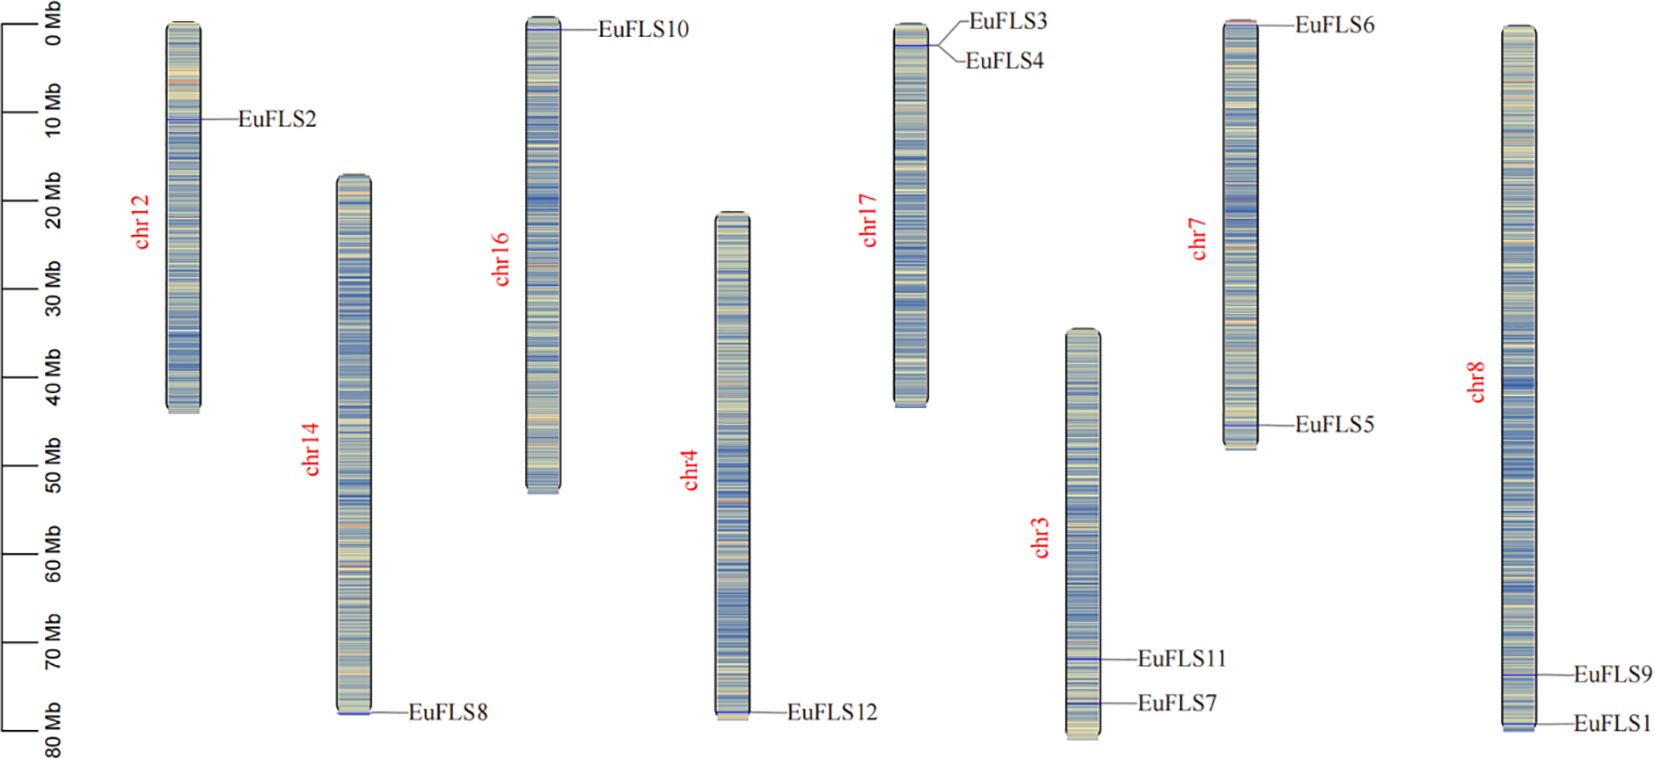
Figure 4. Chromosomal distribution of FLF genes in E. ulmoides. The scale is in megabases (Mb), with chromosome lengths indicated on the left side.
The 2000-bp upstream promoter regions of the 12 EuFLSs were analyzed for cis-acting elements (Figure 5). A total of 270 cis-acting elements were identified, which were categorized into three functional groups: Hormone- (ABRE, CGTCA-motif, TGACG-motif, TCA-element, TGA-element, P-box, GARE-motif, etc.), light- (GT1-motif, Box4, AE-box, TCT-motif, GATA-motif, G-box, I-box, MRE, etc.), and abiotic stress-responsive elements (ARE, CAT-box, LTR, MBS, 02-site, TC-rich repeats, etc.). Among these, 91, 137, and 42 elements were hormone-, light-, and abiotic stress-responsive elements. Among the light-responsive elements, the Box 4 element was the most abundant (46 elements, 33.58%), followed by G-box (42 elements, 30.66%), and GT1-motif (22 elements, 16.66%). ABRE element was highly abundant (39 elements, 42.68%) among the hormone-responsive elements, while TGACG-motif and CGTCA-motif were equally abundant (both 16 elements, 17.58%). Among abiotic stress-responsive elements, the ARE element was the most prevalent, accounting for 17elements (40.48%) in the abiotic stress-responsive elements. This was followed by the LTR element (8 elements, 19.05%), MBS element (7 elements, 16.67%) and the TC-rich repeats element (5 elements, 11.90%). These findings suggested that EuFLSs are involved in various biological processes in E. ulmoides, including growth and development, gibberellin signaling, photoperiod regulation, and responses to ABA, SA, anaerobic, and low-temperature stresses.
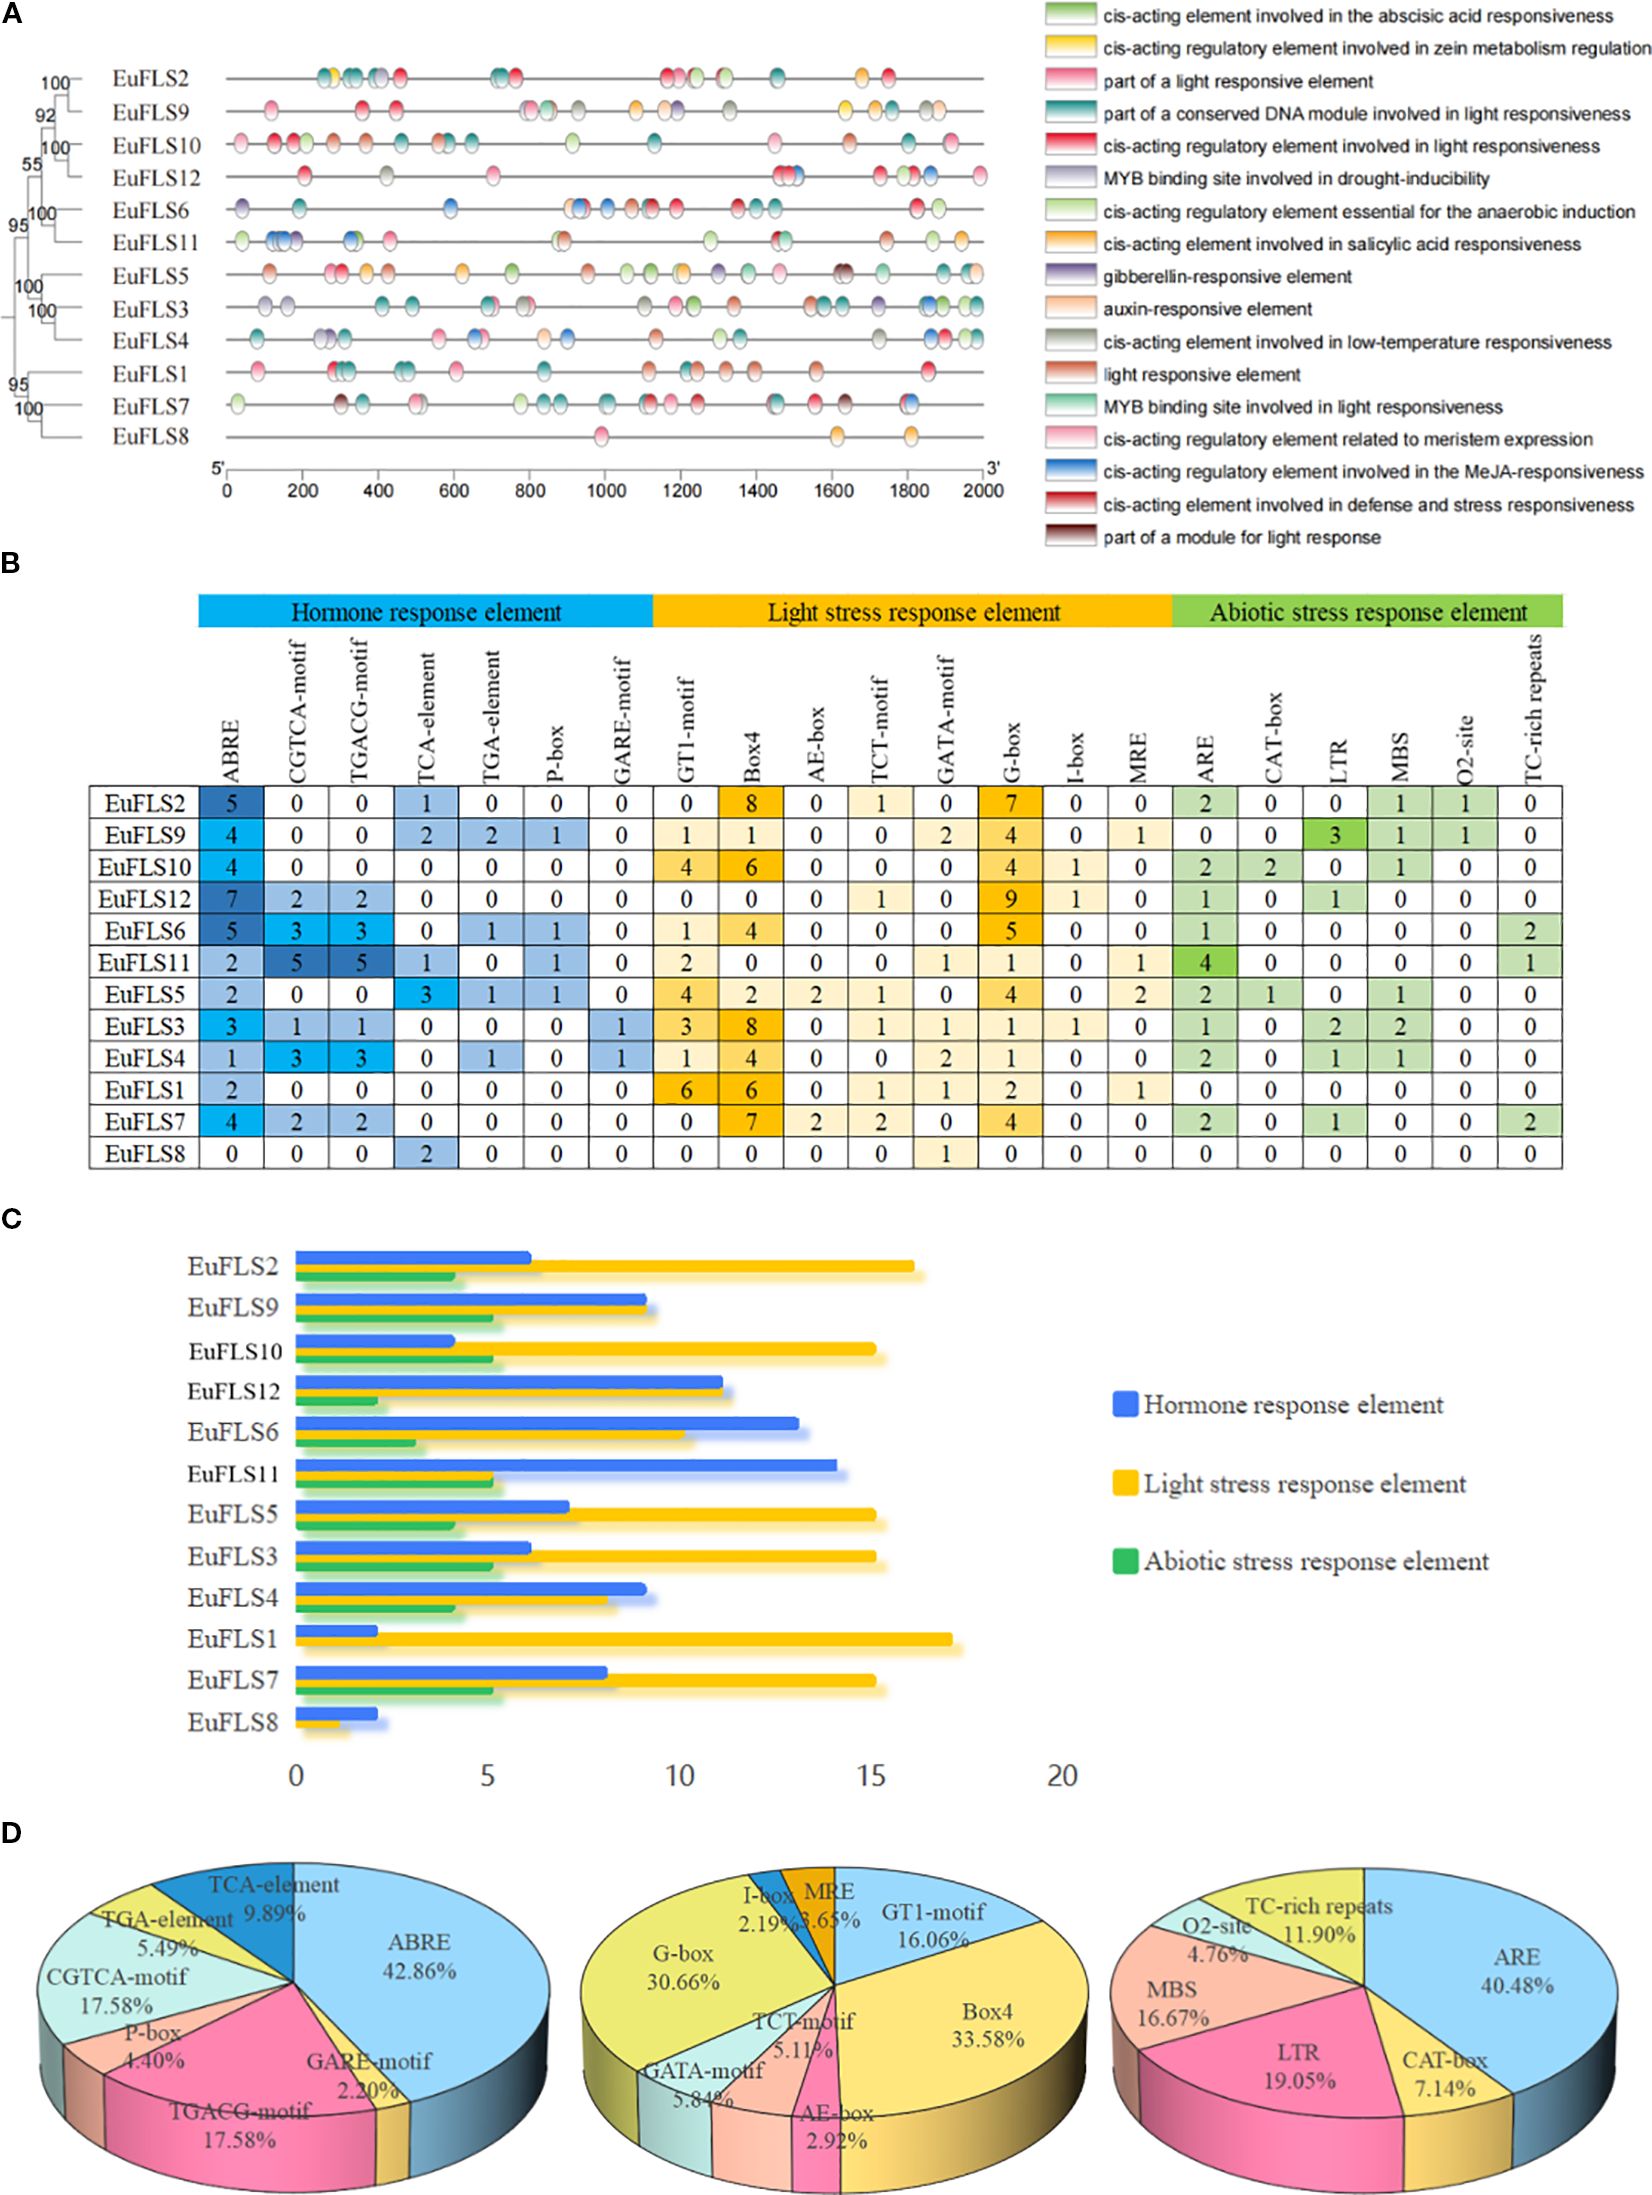
Figure 5. Analysis of promoter elements of EuFLS genes. (A) location map of promoter elements of EuFLSs genes. (B) number map of each elements in EuFLSs genes, the gradient colors in the grid correspond to the quantity of cis-acting elements in EuFLSs. (C) total number map of each type of elements in EuFLSs genes. The multicolored histogram indicates the cis-elements in each category. These elements are divided into three categories in terms of the functional notes: plant hormone response element, light stress response element, and abiotic stress response element. (D) proportion map of each element in three categories of elements (from left to right are hormone response element, light stress response element, abiotic stress response element).
3.5 Analysis of expression patterns of EuFLSs at different developmental stages and with respect to E.ulmoides rubber content in leaves
Transcriptomic data from the leaves of E. ulmoides at different developmental stages (leaf buds: rudimentary stems with many spires; growing leaves: 3 cm in length; young leaves: new, fully expanded leaves; and mature leaves: 60 days after full expansion) were utilized to investigate the expression patterns of EuFLSs. As depicted in Figure 6, the FPKM values of EuFLS7, EuFLS8, and EuFLS9 were consistently zero across all four-leaf developmental stages, indicating that these genes are not involved in leaf growth and development. Similarly, the FPKM value of EuFLS4 was zero during the growing leaves, suggesting its lack of involvement at this stage. In contrast, EuFLS2 exhibited the highest expression level in primary leaves, implying that it is mainly involved in this developmental stage. On the other hand, EuFLS6 and EuFLS10 exhibited the lowest transcription levels in leaf buds, with their expression levels gradually increasing as leaves matured. Their expression levels peaked in mature leaves, suggesting that EuFLS6 and EuFLS10 may play significant roles in the later stages of leaf development. These findings underscored the stage-specific functional roles of EuFLSs during leaf development in E. ulmoides, providing insights into their regulatory contributions at different developmental phases, laying the theoretical foundation for the subsequent functional studies of EuFLSs in the development of E. ulmoides leaves.
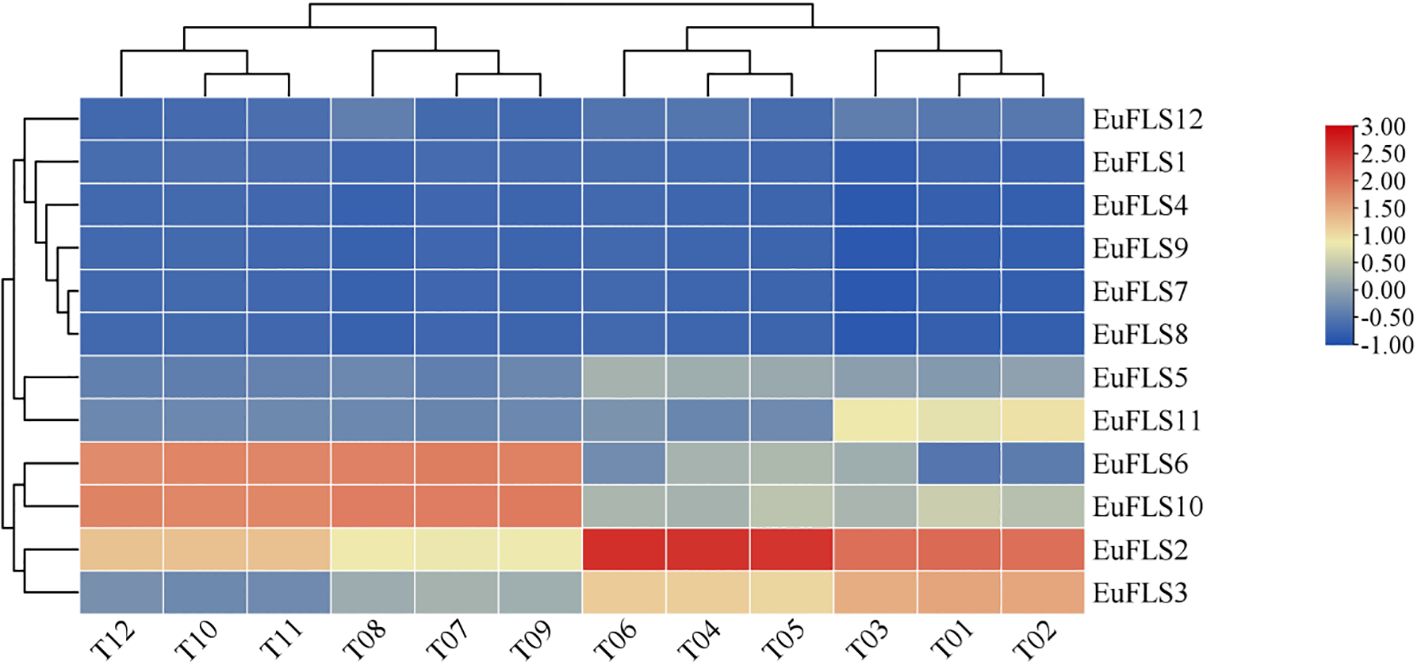
Figure 6. Expression patterns of E. ulmoides FLS gene family in different developmental stages of leaves. T01~T03: leaf buds; T04~T06: growing leaves; T07~T09: young leaves; T10~T12: mature leaves. The color key on the right represents the relative expression level in FPKM values, the res and blue bars (FPKM) indicate high and low expression, respectively.
Previous studies have identified at least 52 genes in E. ulmoides involved in the biosynthesis of E. ulmoides rubber (Holton et al., 1993). To explore the potential roles of EuFLS genes in E. ulmoides rubber biosynthesis, we analyzed their expression patterns using the transcriptomic data from leaves of two E. ulmoides cultivars: ‘Qinzhong 2’ (high E. ulmoides rubber content) and ‘Xiaoye’ (low E. ulmoides rubber content). The results are shown in Figure 7. The FPKM values of EuFLS7, EuFLS8, and EuFLS9 were zero in both cultivars, indicating that these genes were not expressed in the leaves of either variety. In addition, the expression levels of eight EuFLSs were relatively low, with FPKM values < 10. In the ‘Xiaoye’ cultivar, the expression level of EuFLS2 was relatively high, suggesting EuFLS2 might play a negative regulatory role in the formation of E. ulmoides rubber. Conversely, in the ‘Qinzhong 2’ cultivar, the expression levels of EuFLS6 and EuFLS10 were significantly high, indicating that the two genes potentially play a positive regulatory role in the formation of E. ulmoides rubber.
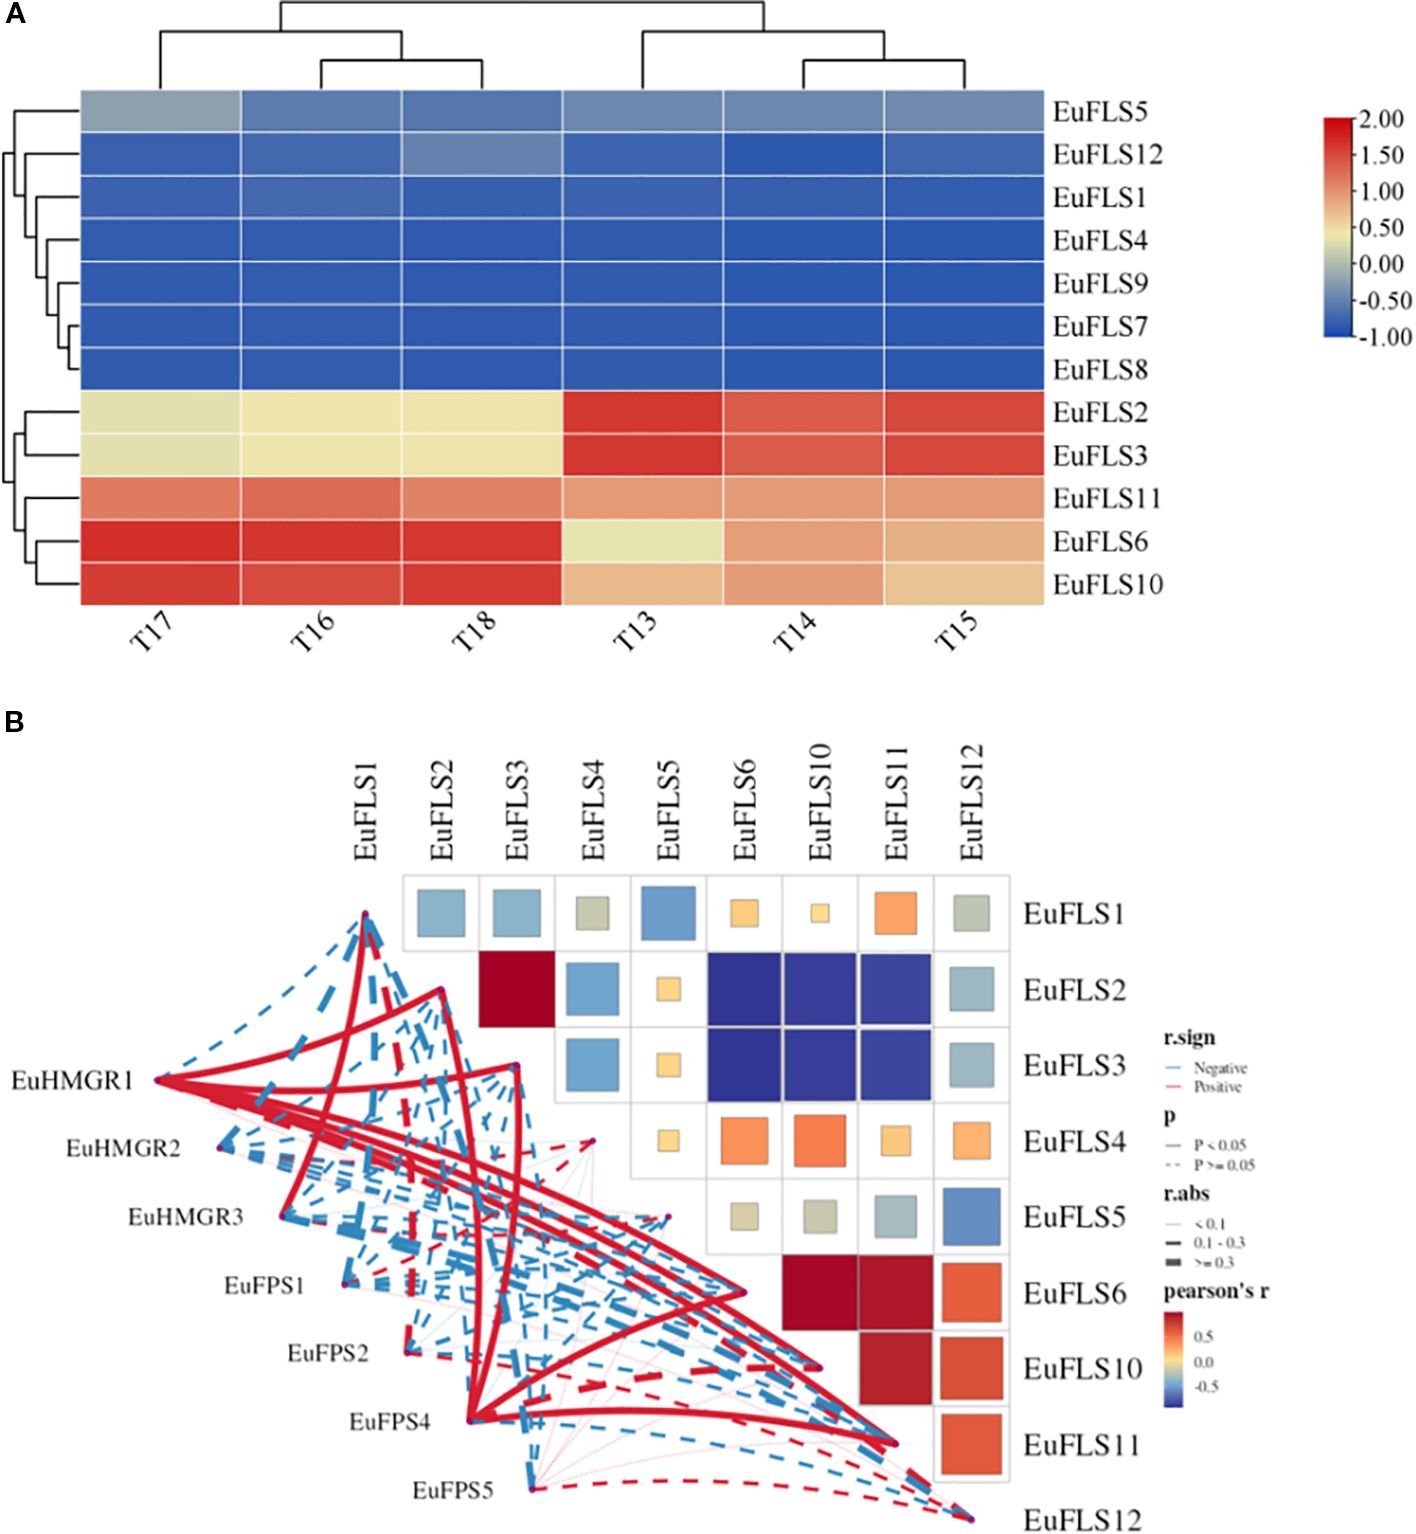
Figure 7. Expression patterns of EuFLSs in leaves with different E. ulmoides rubber content (A) and correlation analyses between EuFLS genes and E. ulmoides rubber biosynthesis genes (B). T13~T15: The leaf of ‘Xiaoye’; T16~T18: The leaf of ‘Qinzhong 2’. The color scale on the right represents the relative expression level based on FPKM values, where red and blue bars indicate high and low expression, respectively. Blue represents negative correlation, while red represents positive correlation. The solid line indicates that the correlation results reached a statistically significant level; the dashed line indicates that the correlation results did not reach a significant level.
To clarify the potential association between EuFLS genes and genes involved in the E. ulmoides rubber biosynthesis pathway in E. ulmoides, we constructed a co-expression network encompassing 12 EuFLS genes and two key E. ulmoides rubber biosynthesis genes—EuHMGR (3-hydroxy-3-methylglutaryl-CoA reductase) and EuFPS (farnesyl pyrophosphate synthase) (Figure 7B). The screening thresholds were |r| ≥0.60 and p < 0.05. The analysis results showed that there was a highly significant positive correlation between EuFLSs and these core E. ulmoides rubber biosynthesis genes. In the positive regulatory co-expression network, we identified 10 pairs correlated between 3 E. ulmoides rubber structural genes and 6 EuFLS genes. Statistical analysis showed that four EuFLS genes (EuFLS2, EuFLS3, EuFLS6 and EuFLS10) had a degree of connection 2, suggesting that these four genes may play crucial positive regulatory roles in E. ulmoides rubber biosynthesis, though their specific functions require further experimental validation.
3.6 Analysis of the roles of EuFLSs in leaf color formation
FLSs play an important role in the formation of leaf color, flower color, and fruit color. To analyze the function of FLSs in the formation of leaf color in E. ulmoides, we assessed their expression patterns using transcriptomic data from young and old leaves of both green-leaf and purple-leaf E. ulmoides varieties. The results were shown in Figure 8. The FPKM value of EuFLS7 was zero in both varieties, indicating that it was not expressed in either variety. Among the 12 EuFLS genes, 10 EuFLSs were highly expressed in the red-leaf E. ulmoides, while only EuFLS8 showed a slightly higher expression level in the green-leaf E. ulmoides than in the red-leaf. This was consistent with the expression patterns in other species, indicating that EuFLS is involved in flavonoid synthesis in E. ulmoides, and the specific functions need to be further verified.
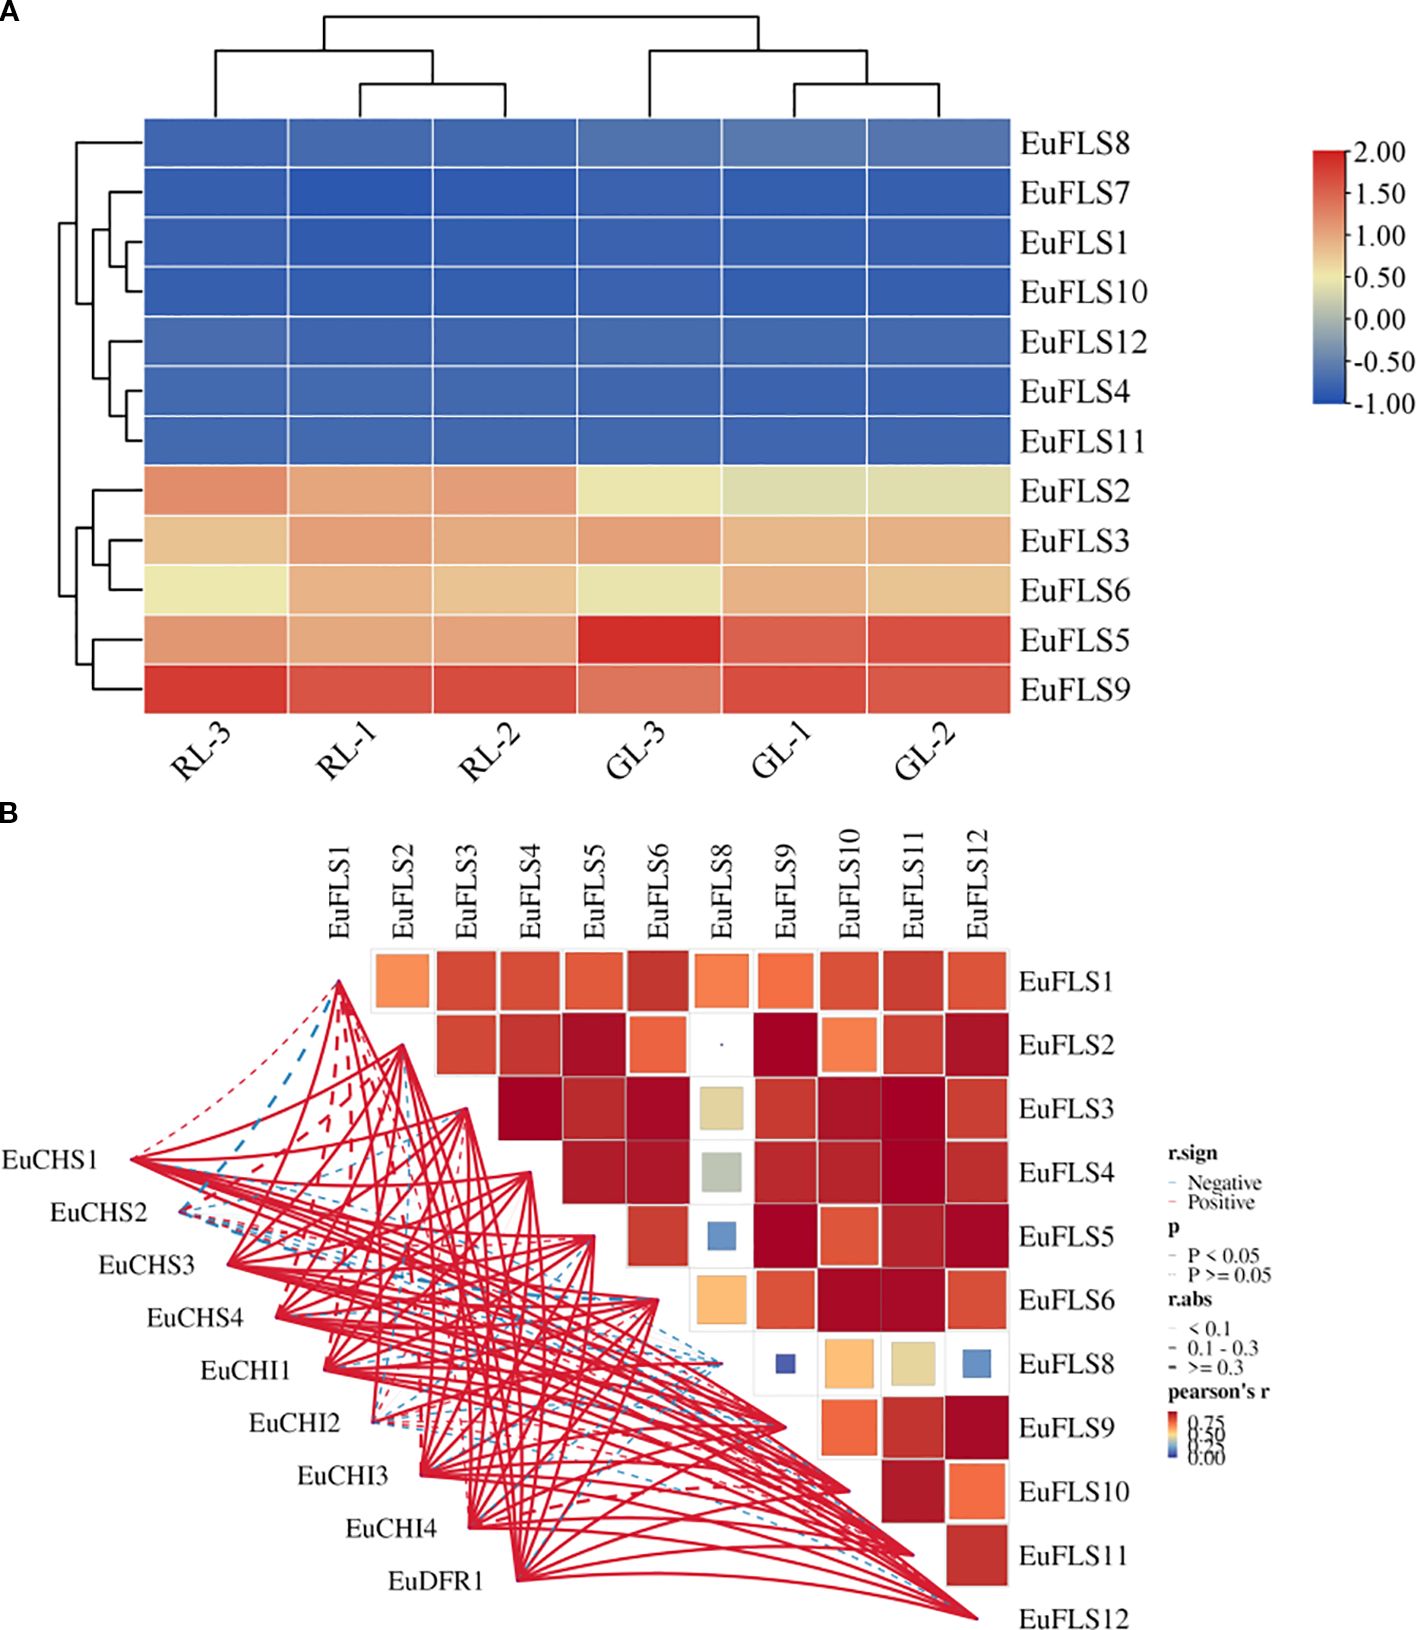
Figure 8. Expression patterns of EuFLS genes in different colored leaves of E. ulmoides (A). and correlation analyses between EuFLS genes and EuCHS, EuCHI, EuDFR genes (B). RL1~RL3: Red-leaf E. ulmoides; GL1~GL3: Green leaves E. ulmoides. The color key on the right represents the relative expression level in FPKM values, the red and blue bars (FPKM) indicate high and low expression, respectively. Blue represents negative correlation, while red represents positive correlation. The solid line indicates that the correlation results reached a statistically significant level; the dashed line indicates that the correlation results did not reach a significant level.
To clarify the potential association between EuFLS genes and those involved in the flavonoid synthesis pathway in E. ulmoides, we constructed a co-expression network encompassing 12 EuFLS genes and three key flavonoid synthesis genes—EuCHI (Chalcone isomerase), EuCHS (Chalcone synthase), and EuDFR (Dihydroflavone 4-reductase) (Figure 8B). The screening thresholds were set at |r| ≥ 0.80 and p < 0.01. Analysis results revealed a highly significant positive correlation between EuFLSs and these core flavonoid synthesis genes. Within the positive regulatory co-expression network, 39 correlated pairs were identified between the 3 flavonoid synthesis structural genes and 9 EuFLS genes. Statistical analysis showed that EuFLS11 had a correlation degree of 4, while five EuFLS genes (EuFLS2, EuFLS4, EuFLS5, EuFLS9, and EuFLS12) each had a connection degree of 6. These findings suggest that these five genes may play crucial roles in positively regulating flavonoid biosynthesis, though their specific functions require further experimental validation.
3.7 Analysis of expression patterns of EuFLSs in different tissues and flower development periods
To comprehensively investigate the expressions of EuFLSs across different tissues, a heatmap was constructed based on transcriptomic data from various tissues of E. ulmoides, including leaves, seeds, marginal pericarp, central pericarp, and xylem. As illustrated in Figure 9, the FPKM values of EuFLS3, EuFLS7, and EuFLS10 were zero in the leaves, indicating that these genes are not functionally active in this tissue. The transcription levels of EuFLS2 and EuFLS9 exhibited a distinct pattern, reaching their highest in the leaves and lowest in the xylem. This finding suggested that these genes primarily function in the leaves, with minimal activity in the xylem. Moreover, EuFLS4 levels were the highest in the xylem. EuFLS1 and EuFLS7 were hardly expressed in all tissues. Additionally, EuFLS2, EuFLS6, EuFLS9 and EuFLS12 levels were the lowest in xylem. Collectively, these results demonstrated that EuFLSs exhibit tissue-specific expression patterns and play distinct functional roles in the development of different tissues in E. ulmoides.
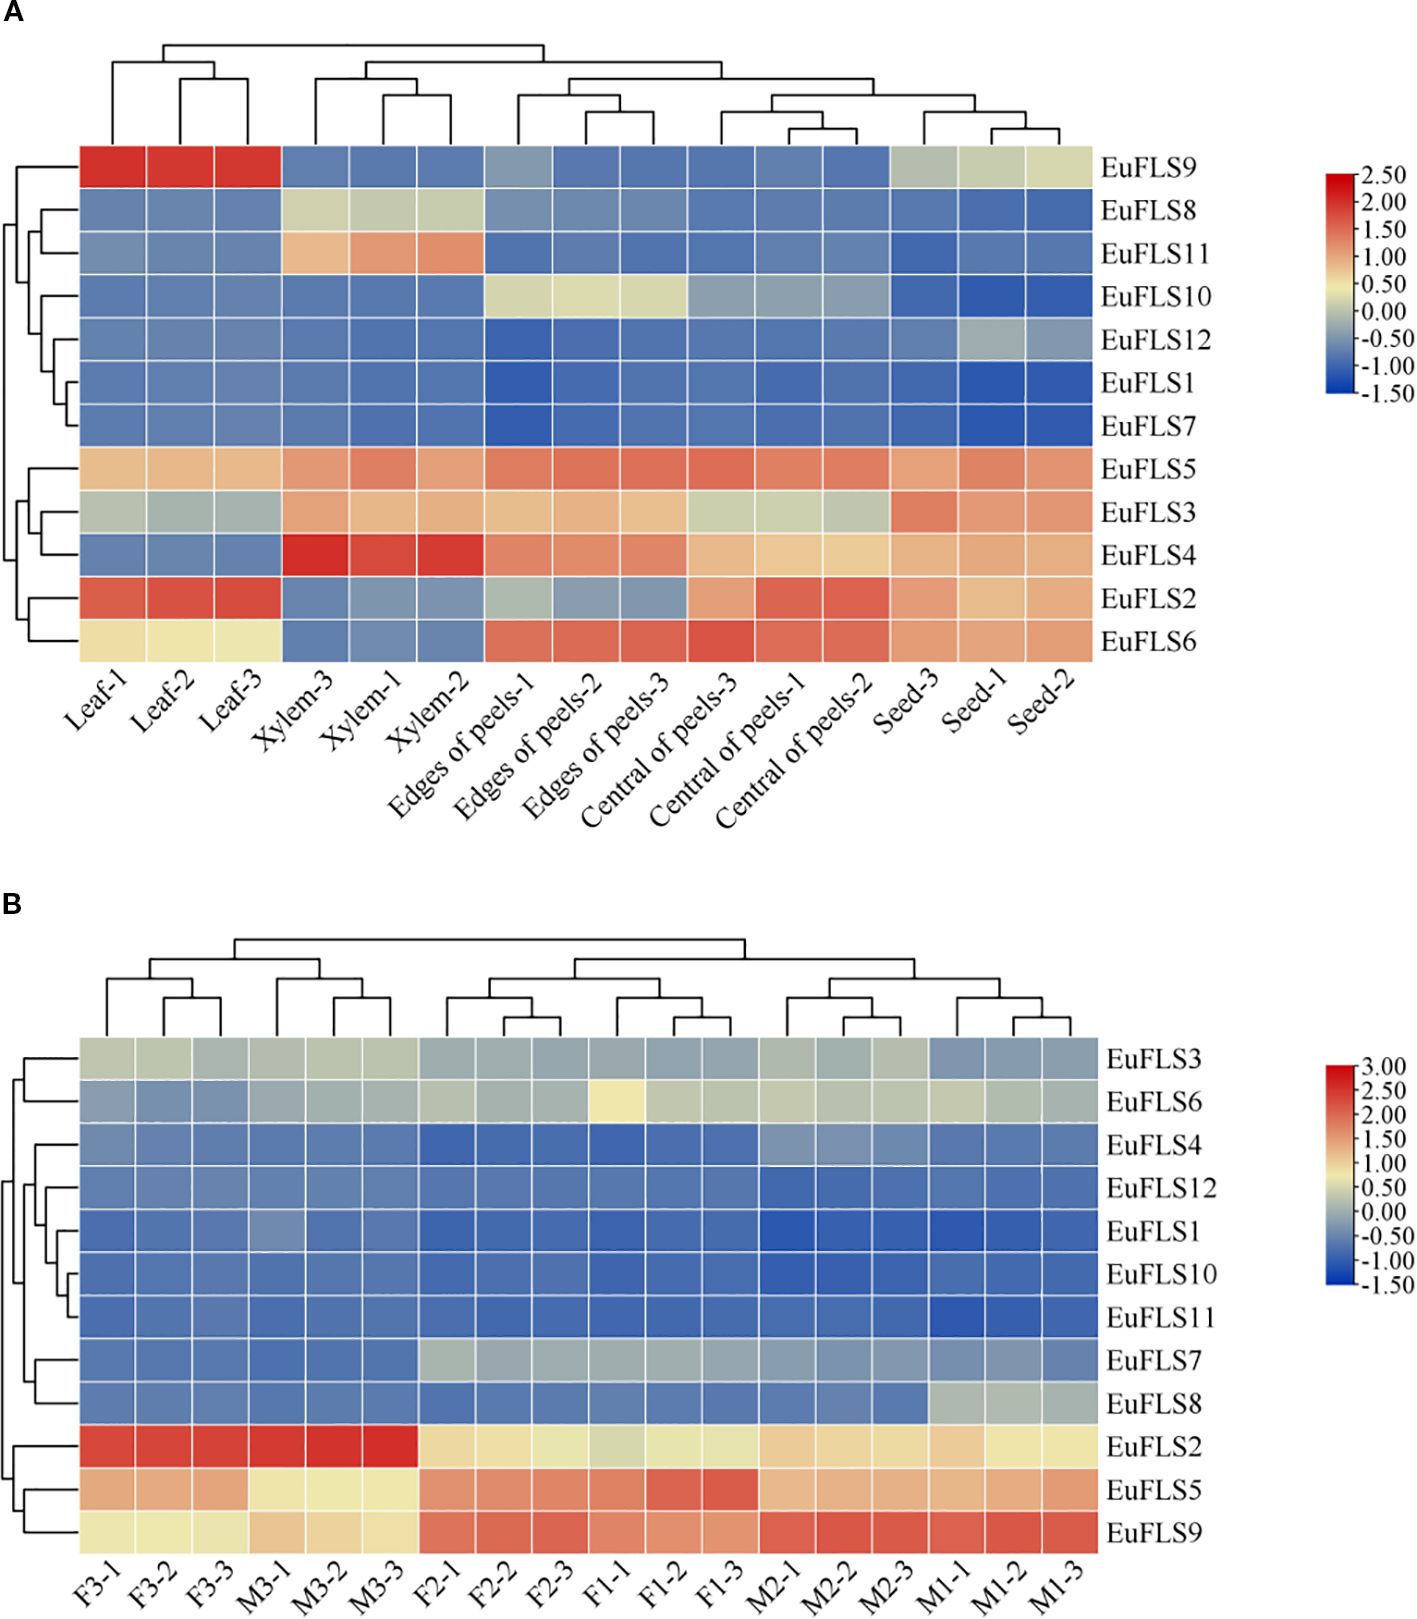
Figure 9. Expression patterns of EuFLS genes in different tissues (A) and flower development (B). The color key on the right represents the relative expression level in FPKM values, the red and blue bars (FPKM) indicate high and low expression, respectively.
To comprehensively analyze the functions of EuFLSs in the flowers of E. ulmoides, which is a dioecious plant, we examined their expression patterns using transcriptomic data from different flower developmental stages. These stages included the initial stage of female floral organ morphological differentiation (F1), female floral organ induction stage (F2), female flower organ maturity stage (F3), the initial stage of male floral organ morphological differentiation (M1), male floral organ induction stage (M2), and male flower organ maturity stage (M3). Our results revealed that EuFLS10 was minimally expressed across all stages of flower development. Similarly, EuFLS11 was not expressed in flower maturity stage. As the floral organs developed, EuFLS2 levels gradually increased, reaching its peak during the M3 and F3, and the average value of FPKM was 82.7, with significantly higher levels in male flowers than in female flowers. In contrast, the expression levels of EuFLS8 gradually declined during floral development, with male flowers exhibiting significantly lower than female flowers, the transcriptional level was the lowest in the M3 with the average value of FPKM was 1.8. In male flowers, EuFLS5 levels decreased progressively as floral development. The transcription levels of EuFLS5 and EuFLS7 peaked during F2, however EuFLS8, and EuFLS12 peaked during M2. EuFLS16 level was the highest during F1. On the contrary, the levels of EuFLS2 was the lowest in F1 with the average value of FPKM was 11.86. Collectively, these findings demonstrated that EuFLSs exhibited functional differentiation during the flower development process of E. ulmoides.
3.8 qRT-PCR detection of the expression patterns of EuFLSs in different tissues
To thoroughly investigate the functional roles of EuFLSs in various tissues of E. ulmoides, we selected roots, stems, and leaves from 2-month-old seedlings as experimental material and quantified the expression levels of EuFLSs in these tissues using qRT-PCR. The results revealed that the expression levels of EuFLS2/3/4/5/6/7/10 were the highest in the stem (Figure 10). EuFLS1/8/9/11/12 were highly expressed in the leaves. Notably, the levels of all EuFLSs were lowest in the roots. These findings demonstrated that EuFLSs exhibited remarkable tissue specificity, with distinct expression patterns across different tissue types.
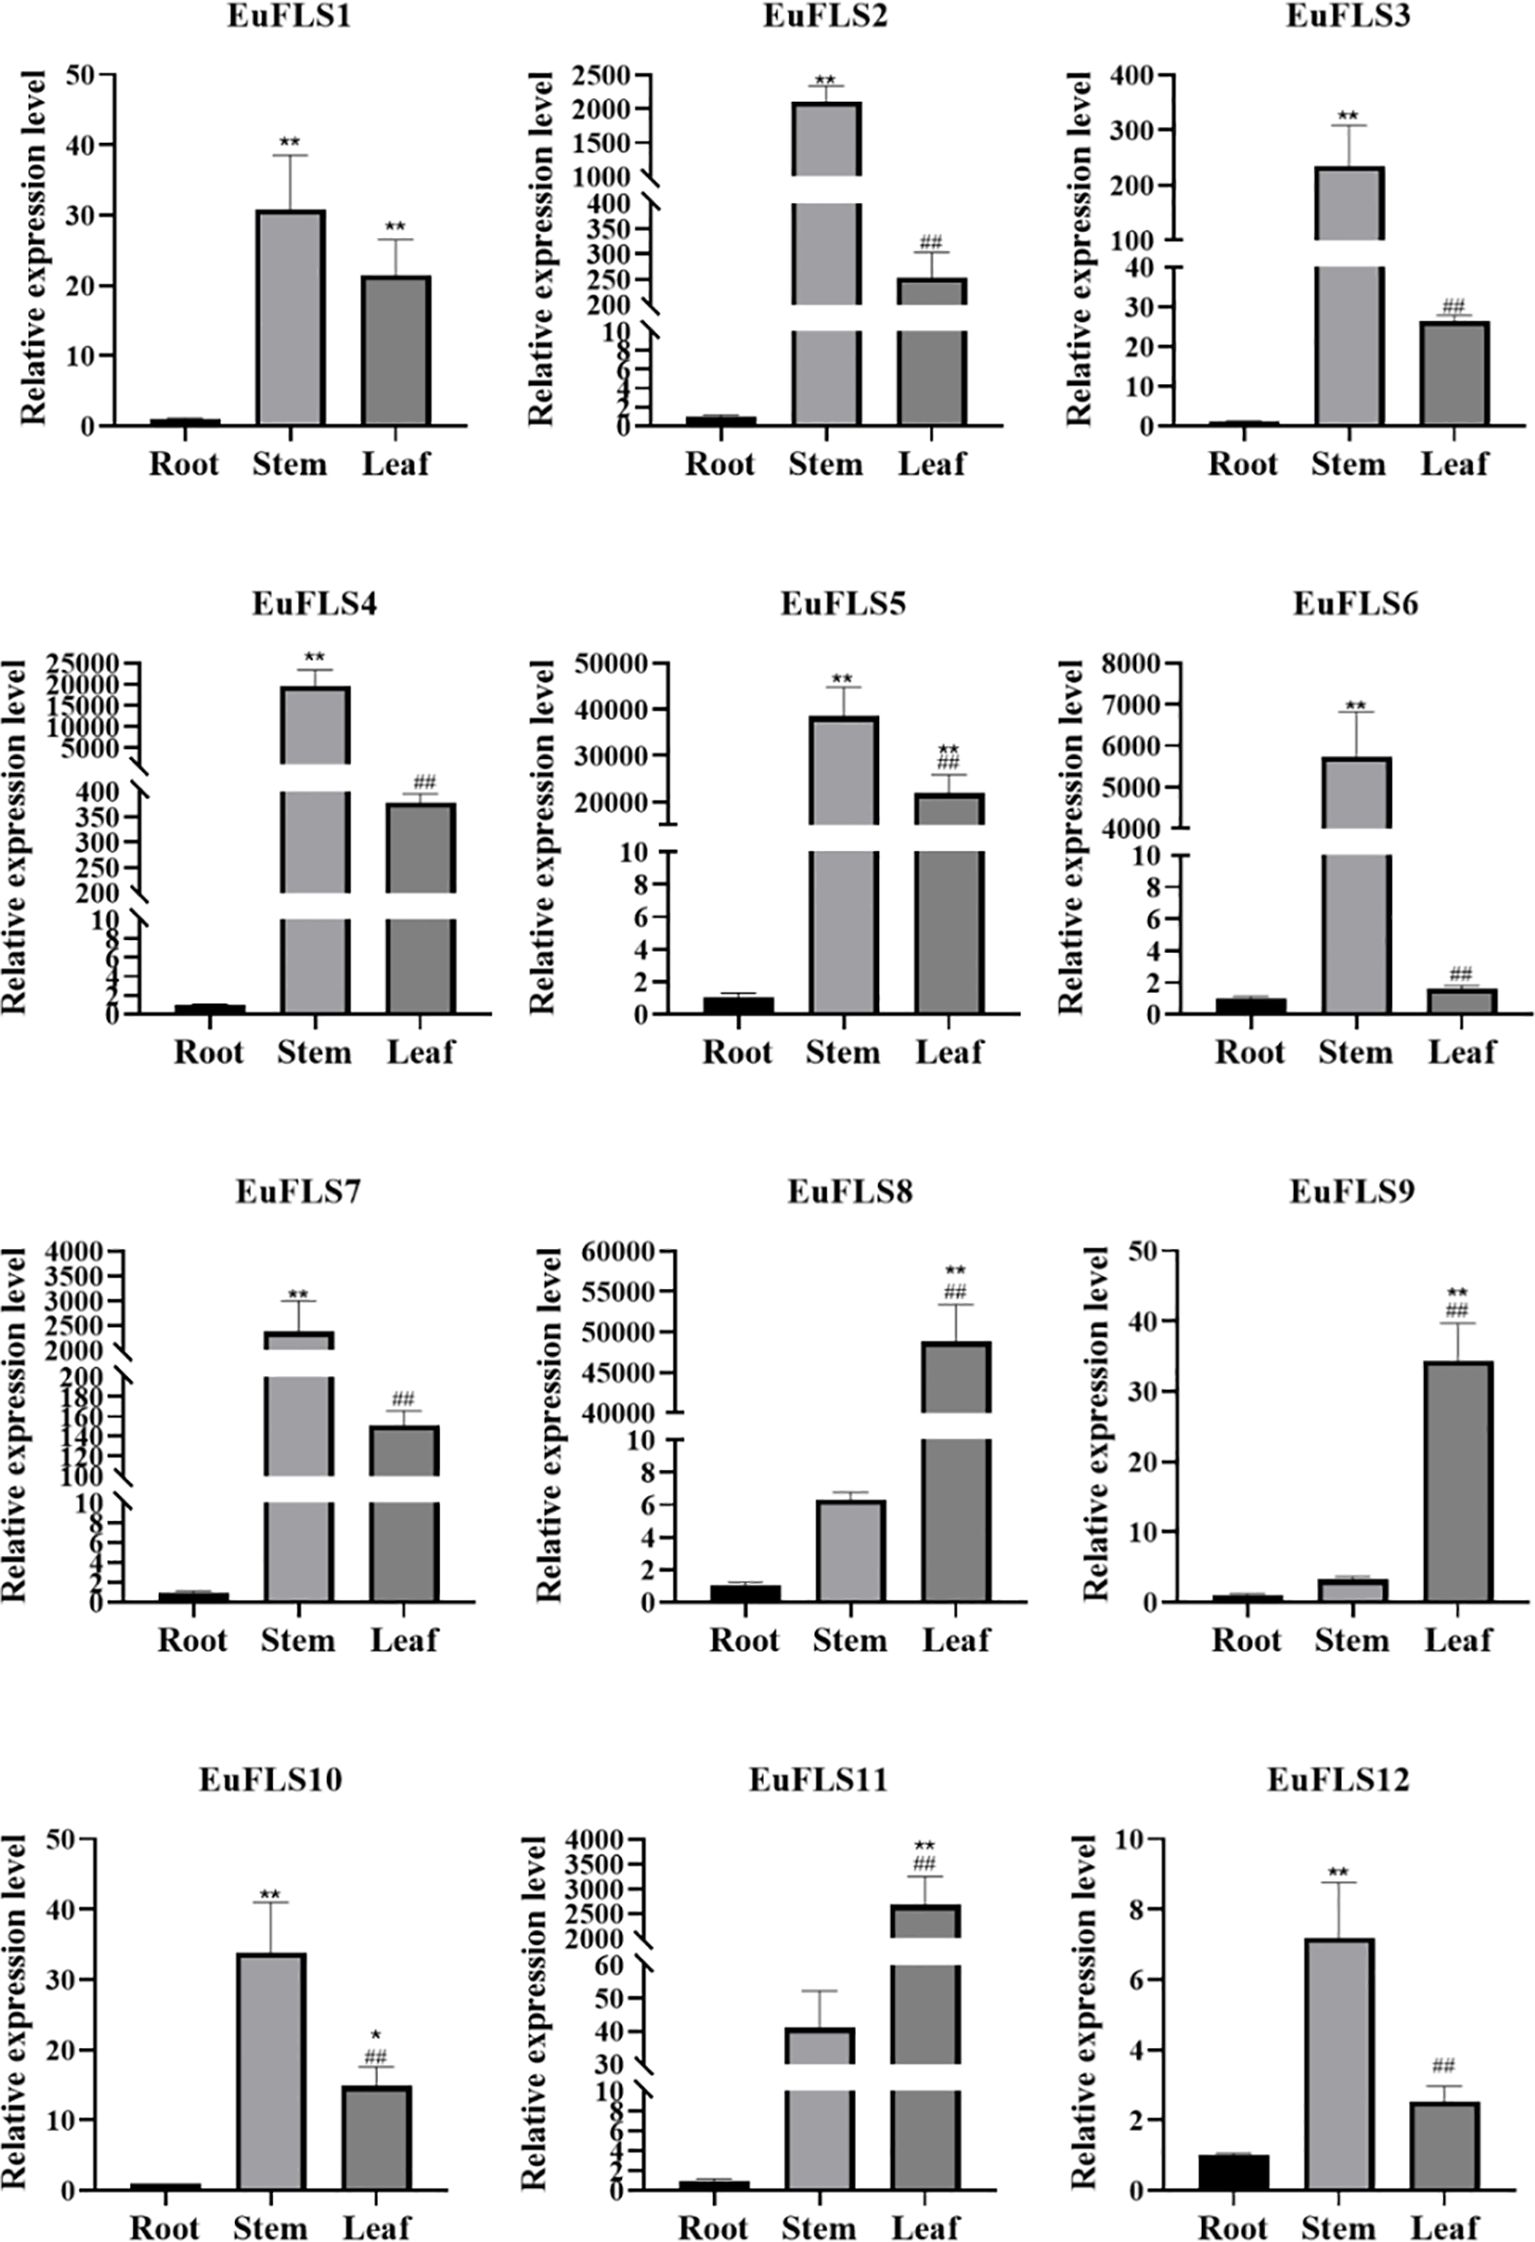
Figure 10. Expression pattern of EuFLS genes in different tissues by qRT-PCR. qRT-PCR data were normalized using UBC as the reference gene and were displayed relative to 0 h. Results were expressed as mean ± standard deviation (SD). Error bars represented the standard error of the mean of three independent replicates. The * indicated significant differences compared to the roots, as determined by t-test (*p<0.05, **p<0.01), the # indicated significant differences compared to the stems, as determined by t-test (#p<0.05, ##p<0.01).
3.9 Analysis of the expression patterns of the EuFLSs under hormone treatments
To explore the potential functions of EuFLSs in abiotic stress responses, we subjected E. ulmoides seedlings to hormone treatments with exogenous ABA, GA3, SA, and MeJA treatments, and systematically analyzed the expression patterns of EuFLSs using qRT-PCR. Under ABA treatment, EuFLSs exhibited significantly distinct expression trends, indicating that they might play varying regulatory roles in the ABA signaling pathway (Figure 11). More specifically, EuFLS1/4/8/10/11//12 consistently downregulated under ABA stress, exhibiting the lowest levels at 24 h post-treatment. Among them, EuFLS10 exhibited the most significant sustained inhibitory effect, with its expression in the treated group being only 1/66 times its expression in the control group. In addition, the levels of EuFLS8 and EuFLS11 decreased to 1/33 times the levels in the control group, while EuFLS1 levels decreased to 1/25 times the levels in the control group. In contrast, EuFLS4 and EuFLS12 displayed biphasic expression patterns, characterized by an initial decline followed by a significant upregulation, peaking at 72 h post-treatment. Notably, EuFLS5 and EuFLS6 exhibited a transient induction response, with their transcript levels rapidly peaking at 6 h post-treatment, reaching 2.6 and 1.7 times their levels in the control group, respectively, before gradually declining to baseline levels. Furthermore, EuFLS3 and EuFLS9 exhibited oscillatory expression patterns. EuFLS3 displayed an early-phase induction, reaching its first peak (2.3-fold higher levels than in control) at 6 h post-treatment. In contrast, EuFLS9 showed delayed upregulation, achieving maximum expression (7.3-fold higher levels than in control) at 72 h post-treatment. Of particular significance was the expression dynamics of EuFLS2, which showed a polyphasic trend. Its expression peaked at 36 h post-treatment (6.7-fold higher levels than in control) and then fluctuated subsequently. These differential expression patterns suggested that EuFLSs might participate in ABA-mediated stress responses.
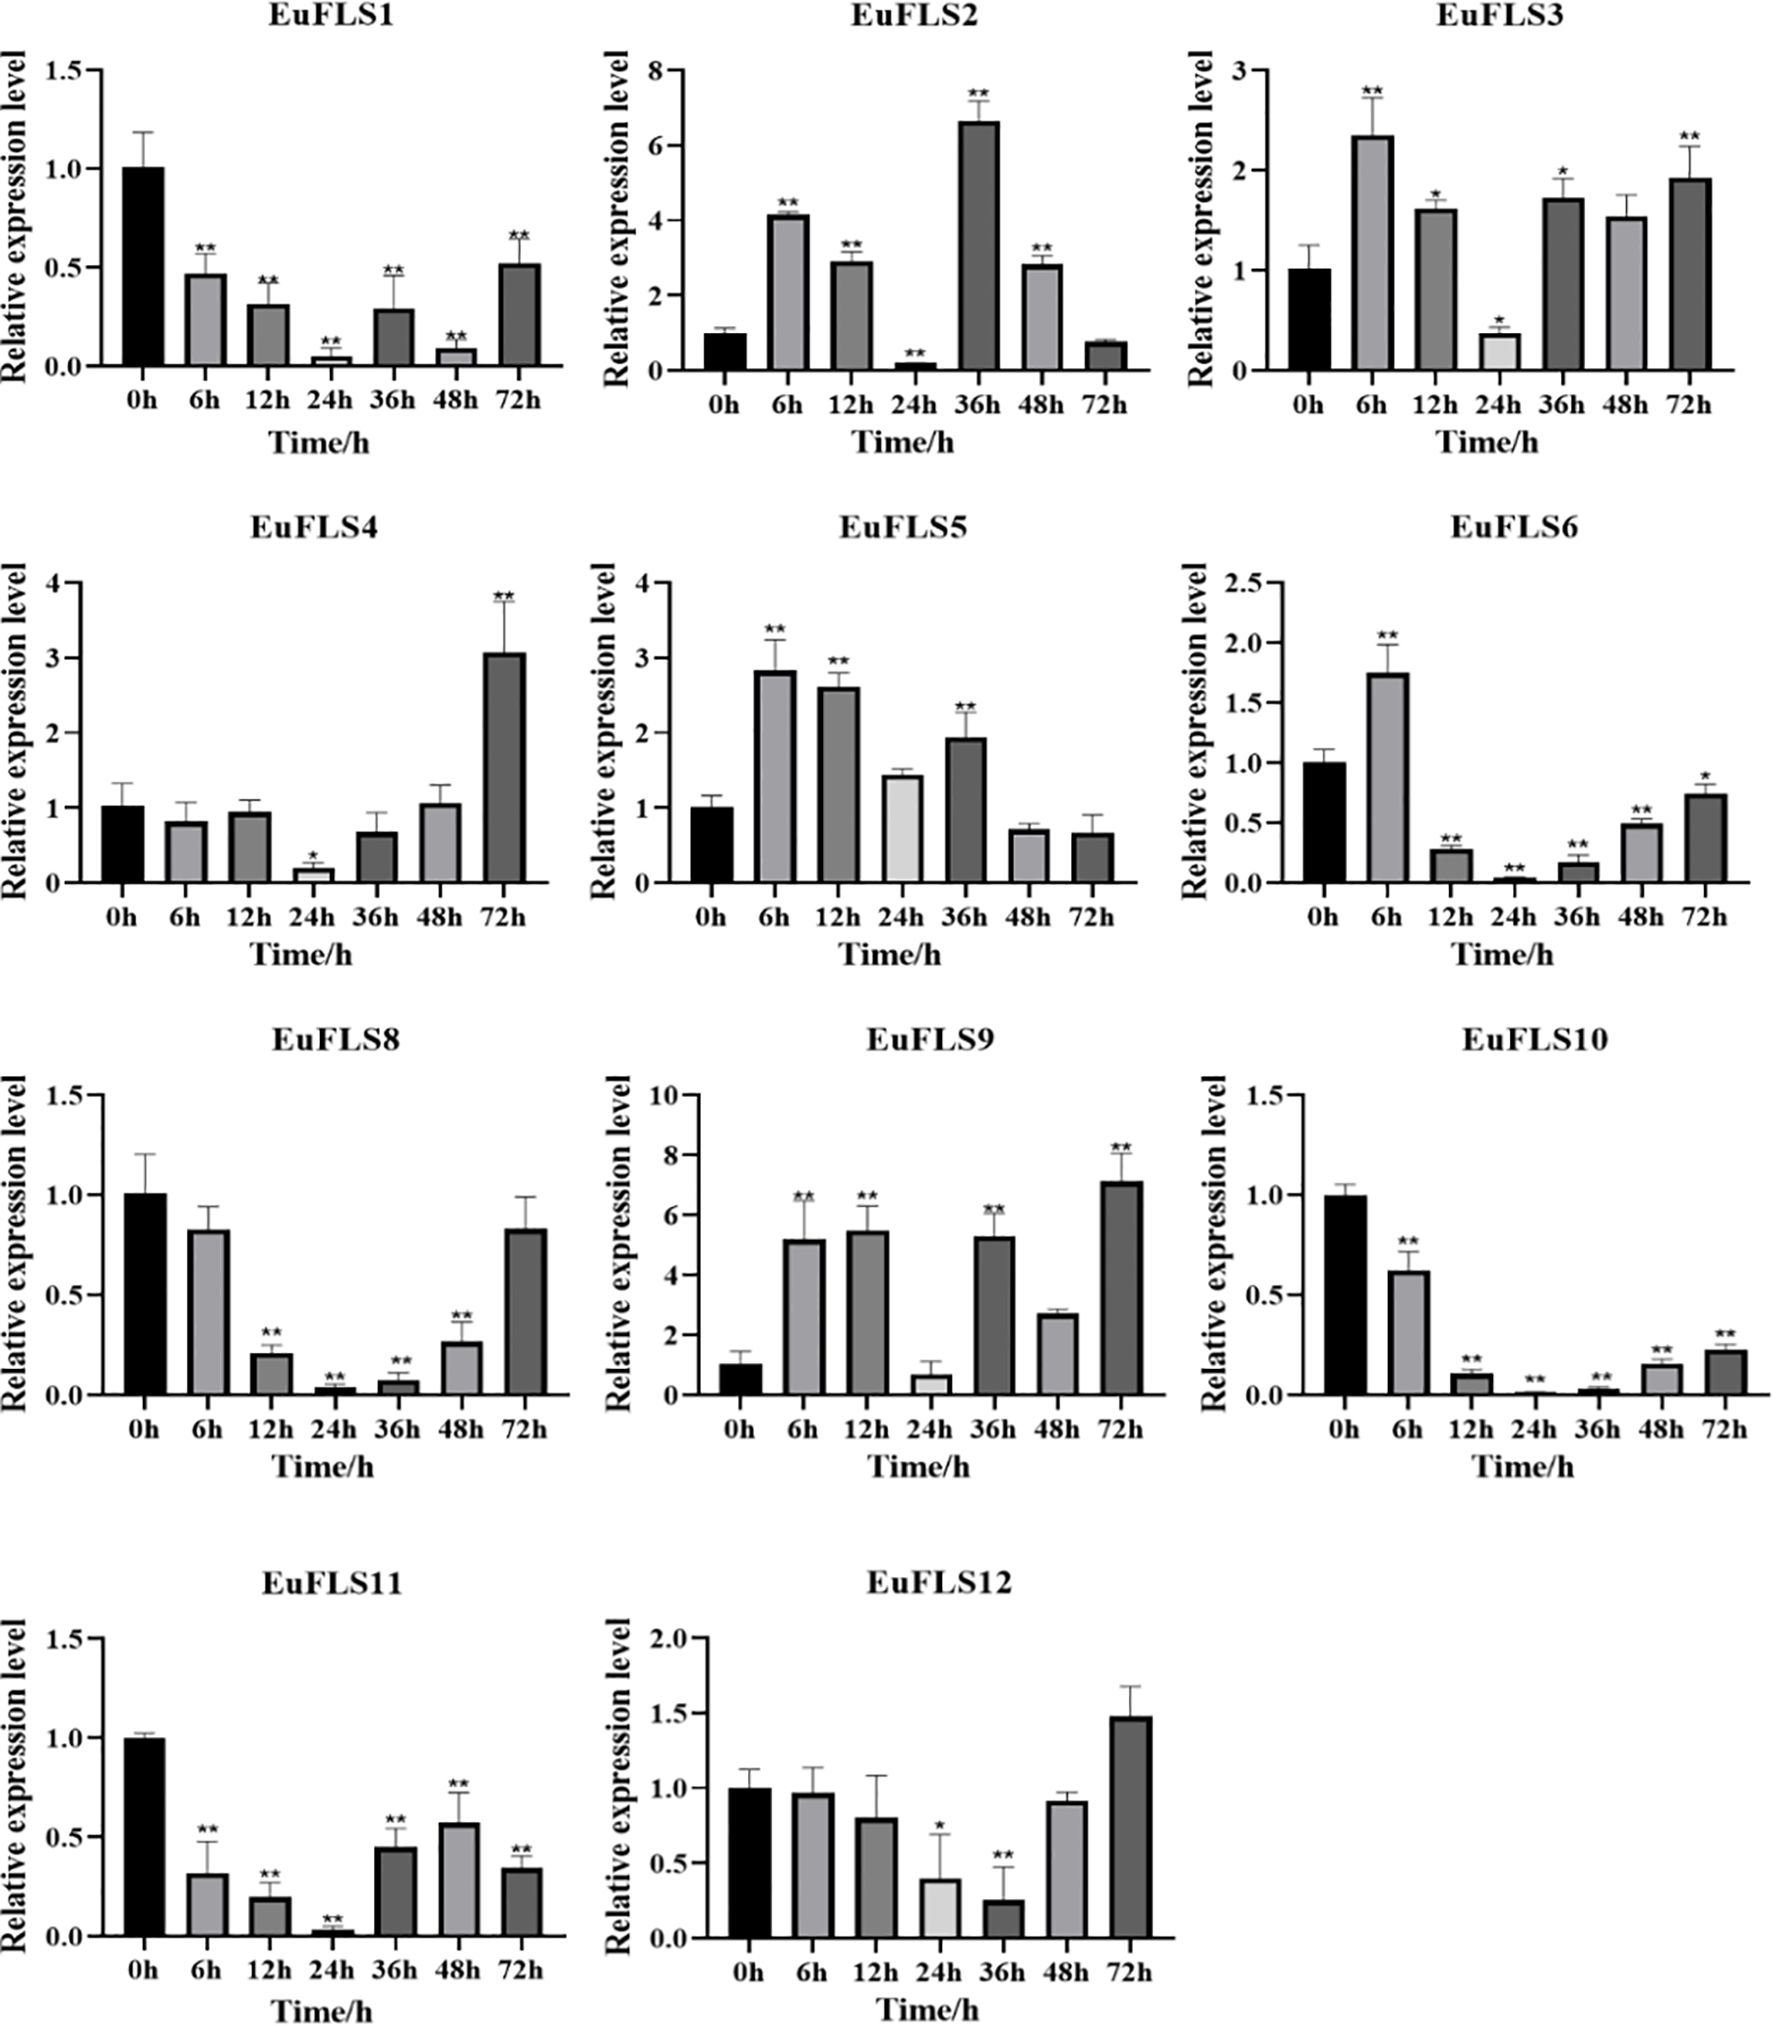
Figure 11. Expression patterns of EuFLS genes under ABA treatment. The horizontal axis represented ABA treatments, and the vertical axis represented relative gene expression levels. qRT-PCR data were normalized using UBC as the reference gene and were displayed relative to 0 h. Results were expressed as mean ± standard deviation (SD). Error bars represented the standard error of the mean of three independent replicates, the * indicated significant differences by t-test (*p<0.05, **p<0.01).
Under GA3 treatment, EuFLSs exhibited diverse dynamic expression patterns (Figure 12). The levels of EuFLS1/3/4/6/10/11 first decreased, then increased, and finally decreased. Among them, the expression level of EuFLS1/3/4/11 peaked at 36 h post-treatment, with the most prominent upregulation observed for EuFLS3 (2-fold higher expression than in control). In contrast, the expression levels of EuFLS6 and EuFLS10 reached their maximum at 48 h after treatment, with the treated group showing a significantly higher (1.9-fold increase) EuFLS6 expression compared to the control group. EuFLS5 and EuFLS9 displayed rapidly responsive upward expression trends. EuFLS5 peaked at 12 h (3.7-fold higher expression than in control) and then declined rapidly. Although EuFLS9 showed a delayed response (36 h), it exhibited a strong induction effect, with the treated group exhibiting 20-fold higher EuFLS9 levels than the control group. However, EuFLS8 exhibited consistently downward expression, suggesting that the GA3 stress inhibits its expression. EuFLS12 displayed a biphasic trend characterized by an initial suppression followed by activation and peaking at 48 h, with a 1.9-fold increase in expression levels. EuFLS2 displayed the most complex expression dynamics, presenting a wavy pattern. Its expression level is particularly high at 12 h (10-fold higher expression than in control). This finding implied that EuFLS genes might play multiple regulatory roles at different stages of GA3 signal transduction.
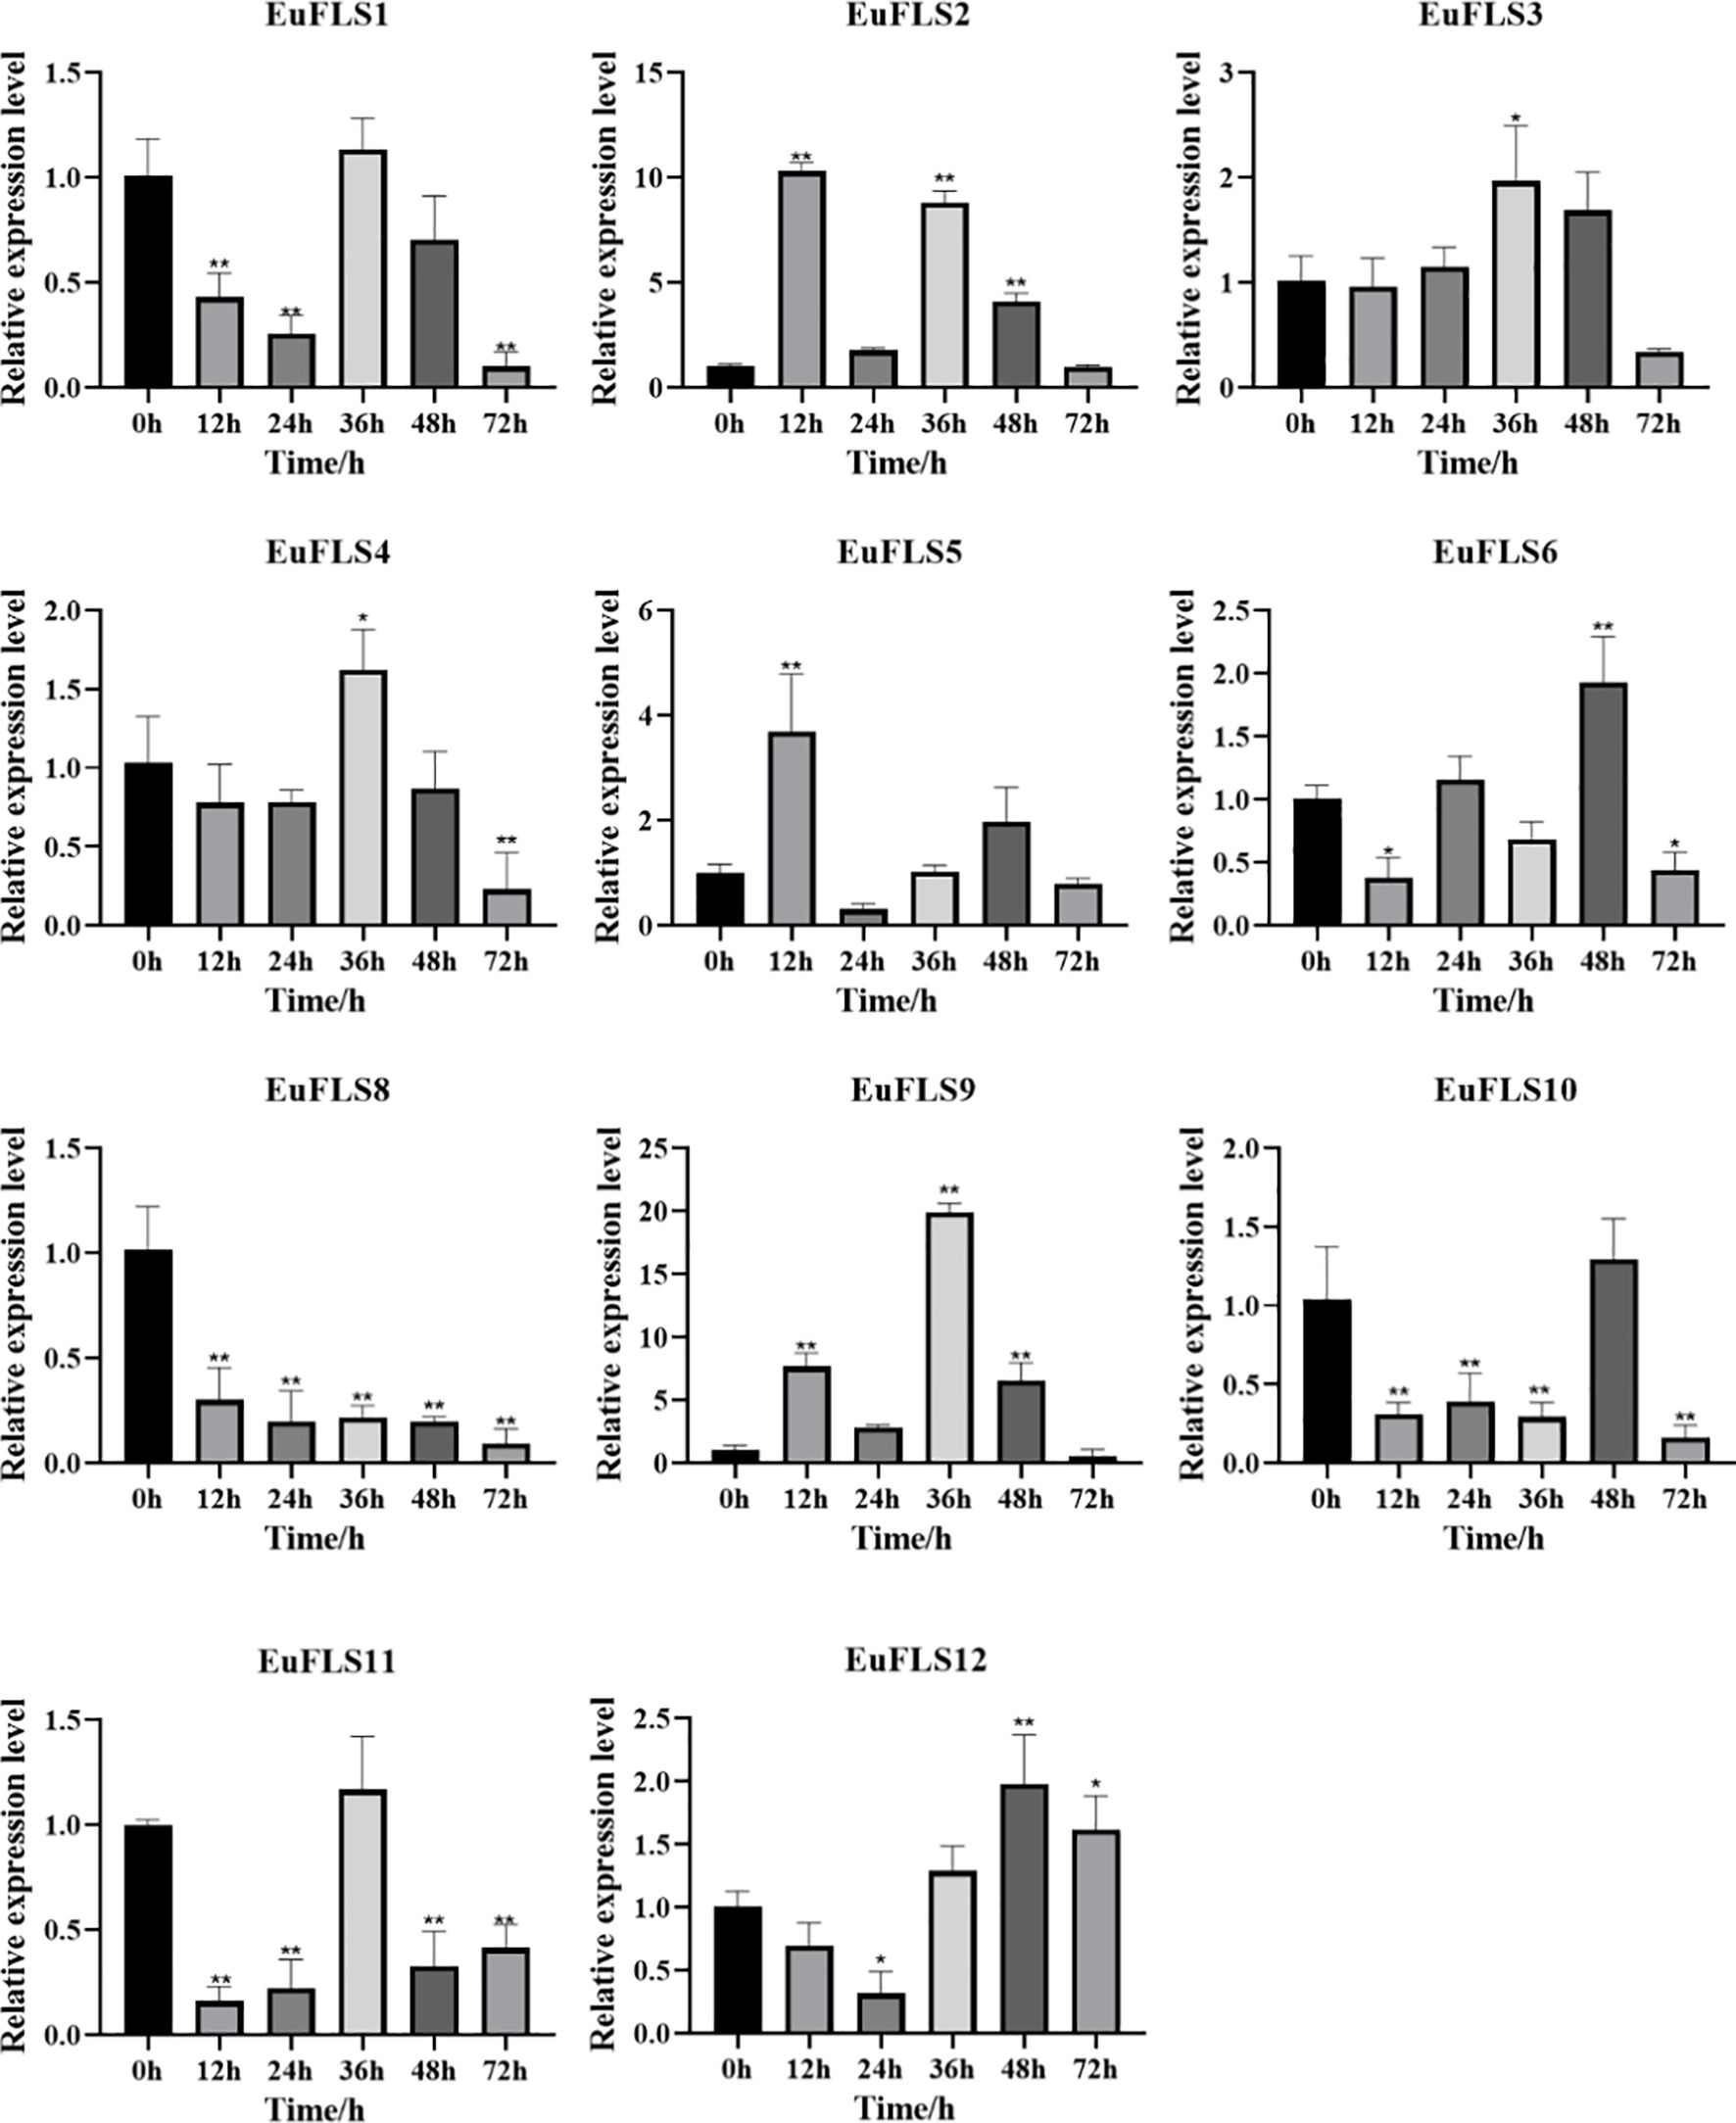
Figure 12. Expression patterns of EuFLS genes under GA3 treatment. The horizontal axis represented GA3 treatments, and the vertical axis represented relative gene expression levels. 0 h was selected as the control group. qRT-PCR data were normalized using UBC as the reference gene and were displayed relative to 0 h. Results were expressed as mean ± standard deviation (SD). Error bars represented the standard error of the mean of three independent replicates, the * indicated significant differences by t-test (*p<0.05, **p<0.01).
Similarly, under SA treatment, EuFLSs exhibited significantly differential expression patterns (Figure 13), specifically manifested as EuFLS6/10/11 displayed similar expression dynamics, characterized by an initial downregulation, followed by upregulation, all peaking at 72 h post-treatment with 2.7-, 3-, and 1.4-fold increases in expression, respectively. On the contrary, EuFLS2/3/8 exhibited sustained downregulation throughout the treatment. EuFLS4 exhibited more complex regulatory characteristics. Its expression showed a fluctuating trend by first increasing, then decreasing, and then increasing again. Finally, its levels peaked at 72 h post-treatment, being 7-fold higher than those in control. However, EuFLS5 exhibited an oscillating expression pattern by first decreasing, then increasing, and then decreasing again. Its levels peaked at 24 h post-treatment, being 1.5-fold higher than those in control. Furthermore, both EuFLS9 and EuFLS12 were consistently upregulated, peaking at 72 and 6 h post-treatment, respectively (6- and 6.2-fold higher expressions than in control, respectively). These varied expression patterns suggested that during SA-mediated stress, EuFLSs might play critical physiological roles via temporal regulation.
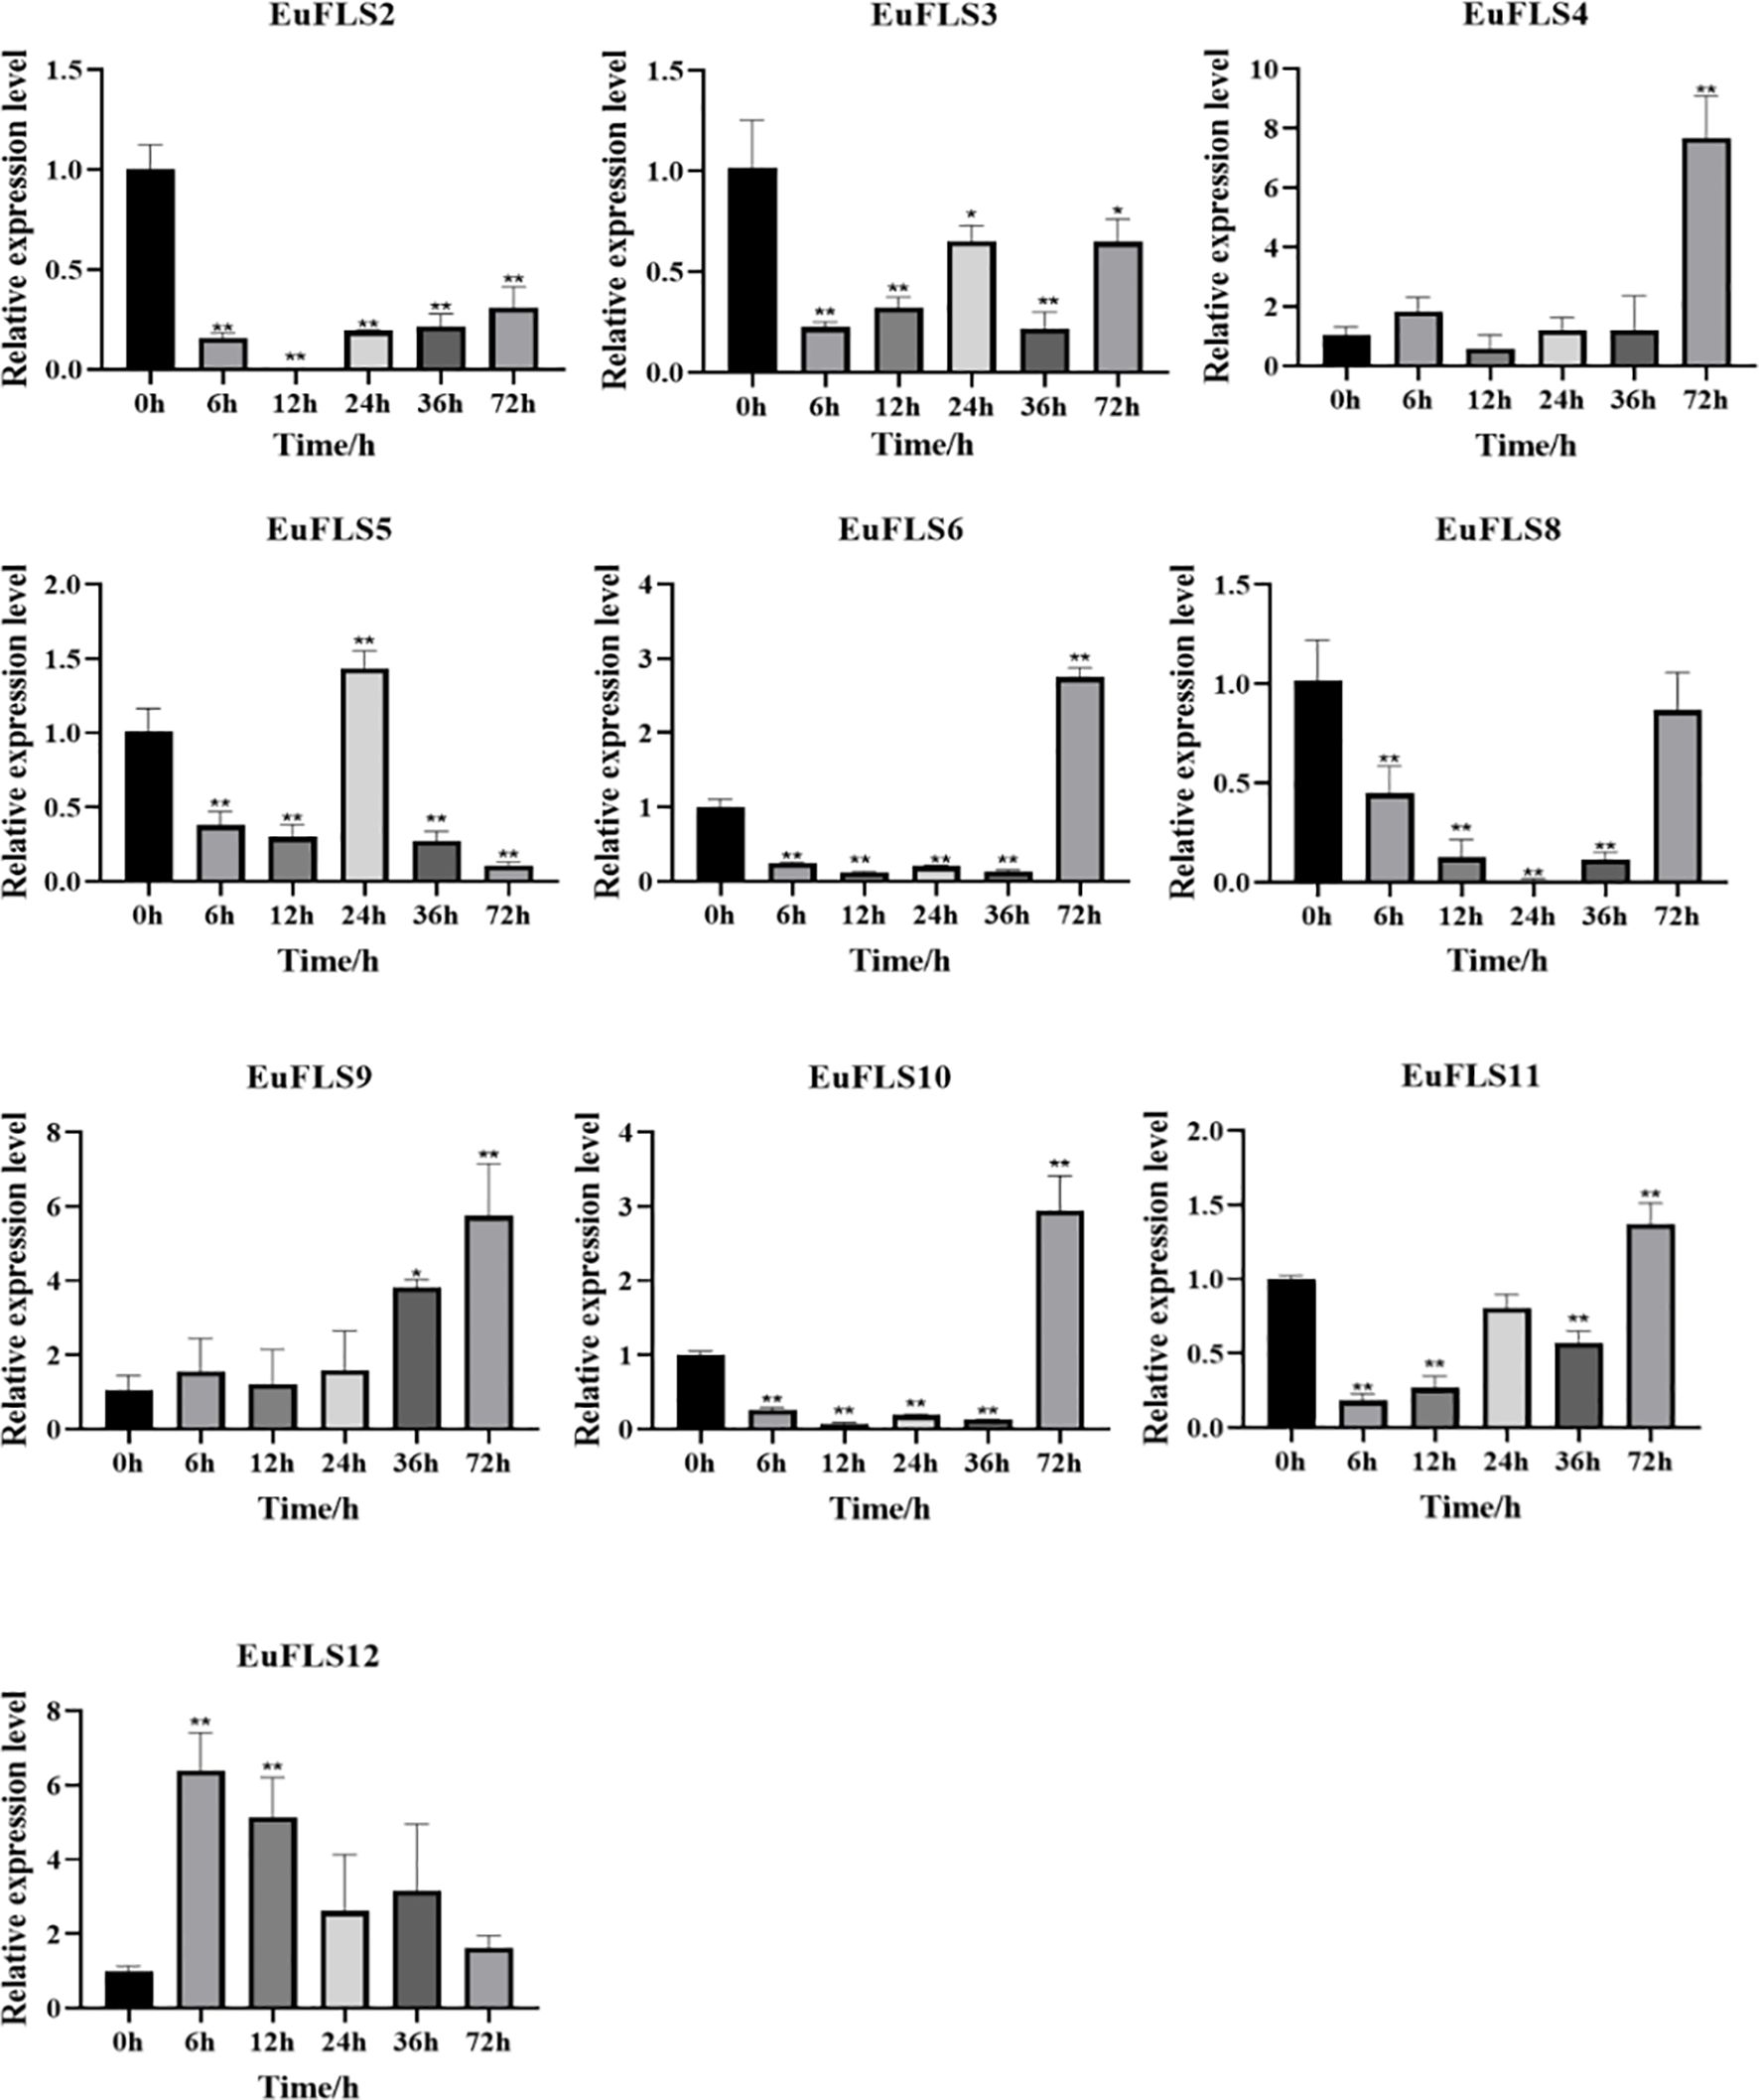
Figure 13. The expression profile of EuFLS genes under SA treatment. The horizontal axis represented SA treatments, and the vertical axis represented relative gene expression levels. 0 h was selected as the control group. qRT-PCR data were normalized using UBC as the reference gene and were displayed relative to 0 h. Results were expressed as mean ± standard deviation (SD). Error bars represented the standard error of the mean of three independent replicates, the * indicated significant differences by t-test (*p<0.05, **p<0.01).
Under MeJA treatment (Figure 14), both EuFLS2 and EuFLS5 showed fluctuating expressions by first decreasing, then increasing, and then decreasing again. Among them, EuFLS5 levels peaked at 36 h post-treatment, reaching 1.5 times the levels in the control group. However, EuFLS9 and EuFLS12 exhibited a consistent upregulation, both peaking at 12 h post-treatment, with levels increasing by 150- and 8.3-fold than the levels in the control group, respectively. This finding indicated that these two genes might be involved in the early defense response against MeJA. EuFLS3 levels initially decreased and then increased, peaking at 24 h post-treatment (11-fold higher expression than in control). Notably, EuFLS4 and EuFLS11 exhibited more complex regulatory patterns. EuFLS4 levels first increased, then decreased, and then increased again, peaking at 12 h post-treatment (28-fold higher expression than in control). The expression level of EuFLS11 exhibited a multiphase change pattern by first decreasing, then increasing, then decreasing, and finally increasing again. Its levels also peaked at 12 h post-treatment (10-fold higher expression than in control). In contrast, EuFLS6 and EuFLS10 were consistently downregulated, indicating that they were negatively regulated under MeJA stress.
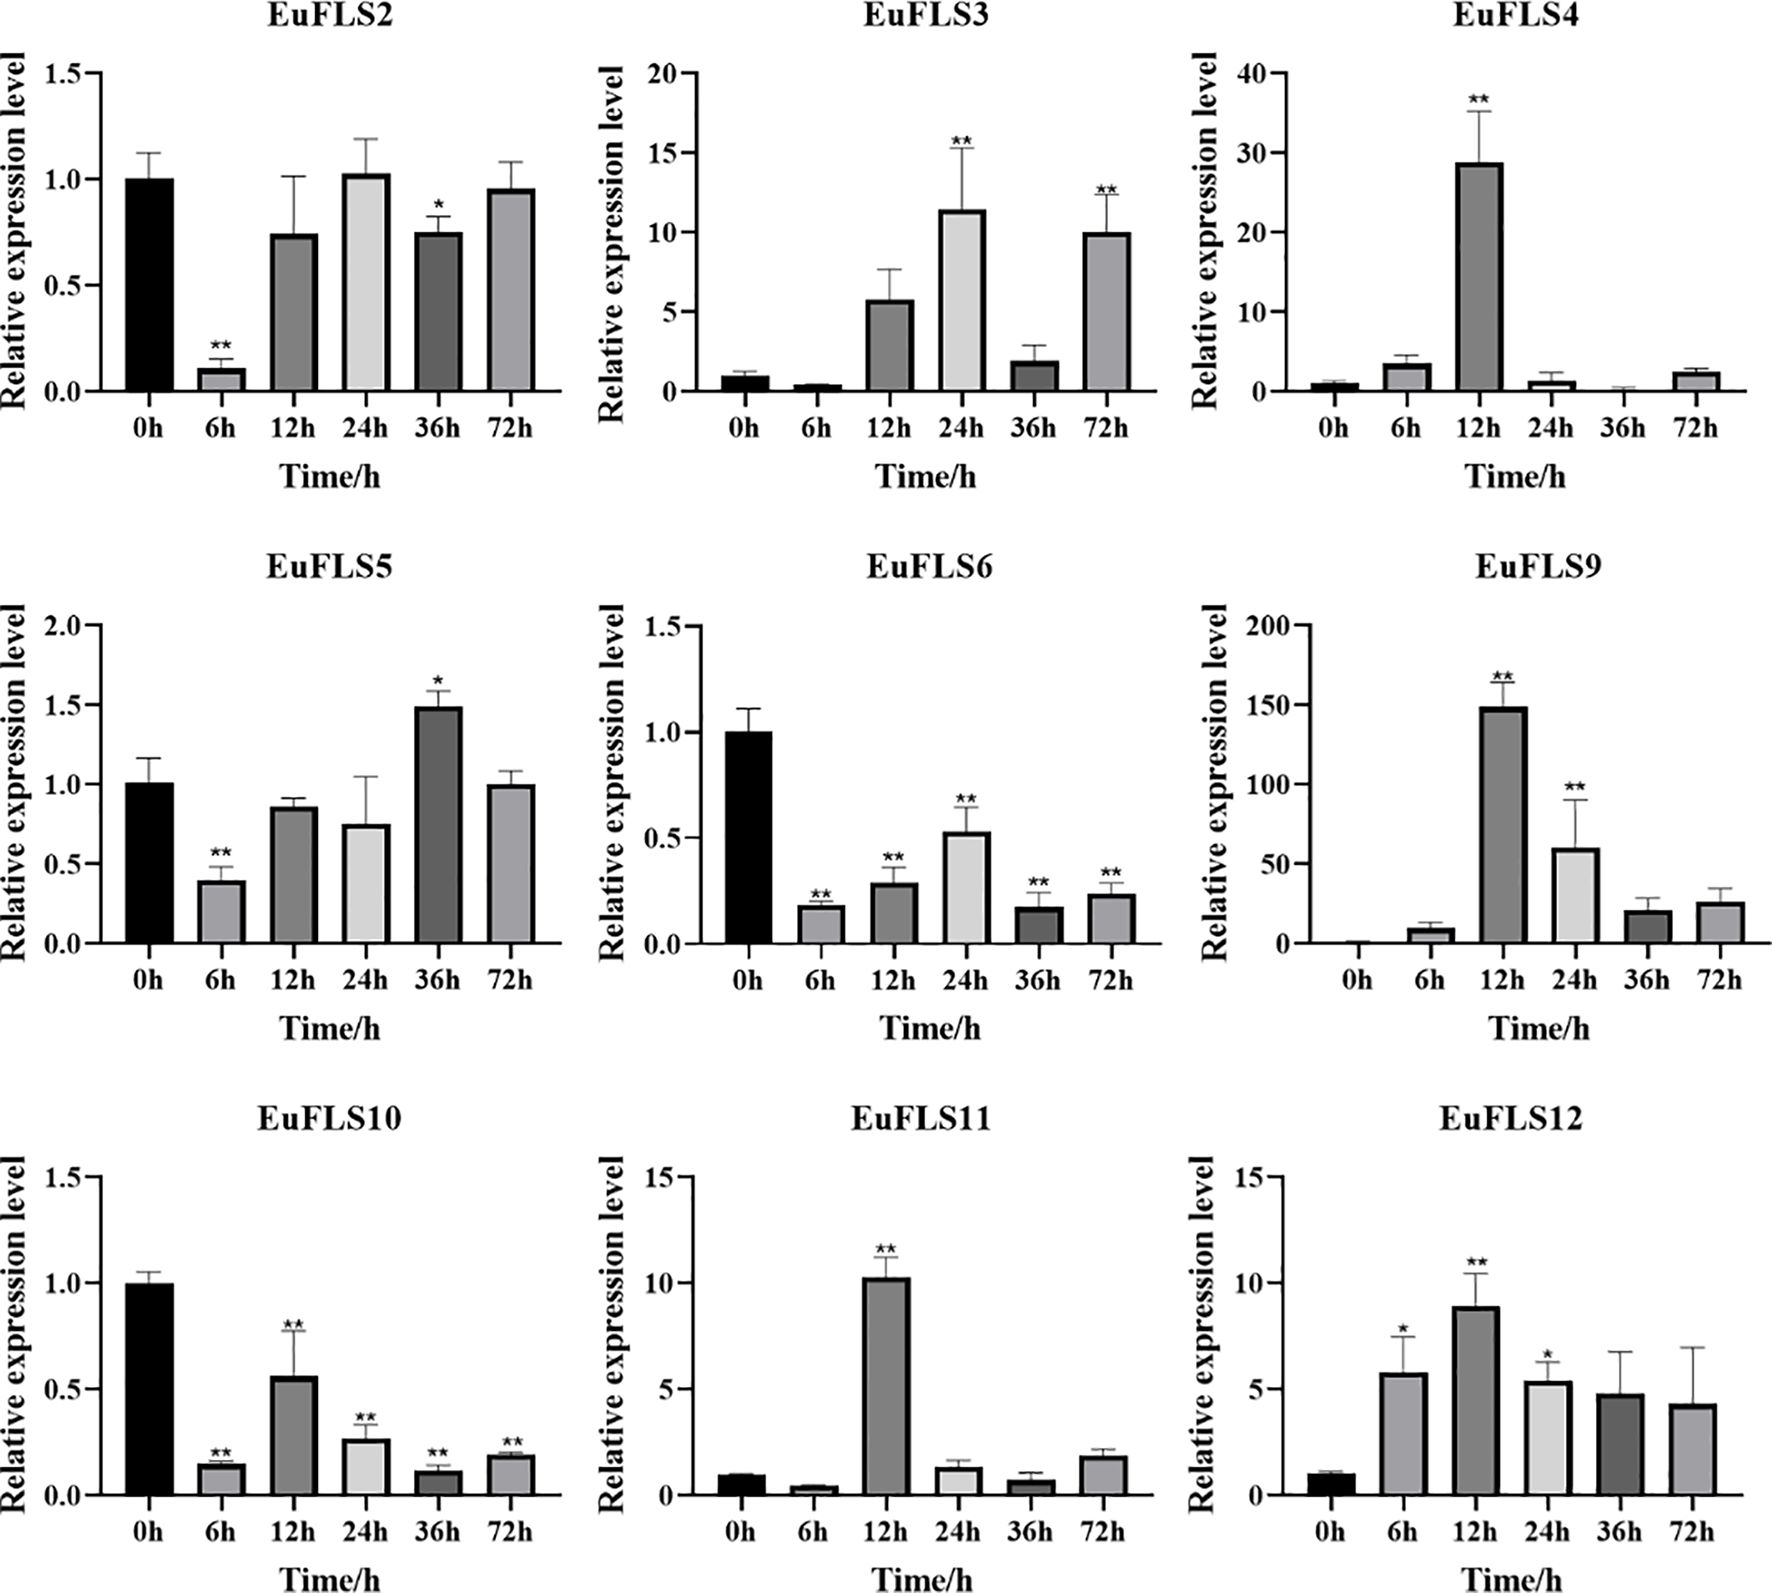
Figure 14. Expression patterns of EuFLS genes during the treatment with MeJA. The horizontal axis represented MeJA treatments, and the vertical axis represented relative gene expression levels. 0 h was selected as the control group. qRT-PCR data were normalized using UBC as the reference gene and were displayed relative to 0 h. Results were expressed as mean ± standard deviation (SD). Error bars represented the standard error of the mean of three independent replicates, the * indicated significant differences by t-test (*p<0.05, **p<0.01).
3.10 The expression patterns of EuFLSs under drought stress
Under drought stress, EuFLSs exhibited significantly divergent spatiotemporal expression patterns, which could be classified into four types based on their expression characteristics (Figure 15). First was the sustained downregulation type. EuFLS6 and EuFLS10 levels consistently decreased throughout the drought stress, indicating that these genes might be inhibited by drought stress. Second was the biphasic oscillation type. EuFLS5 exhibited a unique “inhibition-induction-fallback” expression pattern, suggesting that this gene might be involved in the regulation of stage-specific responses to drought stress. Third was the multimodal response type. EuFLS1/2/3/4/9/11/12 showed complex “induction-inhibition-reinduction” expression patterns. Among them, EuFLS9 exhibited the fastest response, with the highest expression level at 3 h post-treatment (50-fold higher than in control). Furthermore, EuFLS12 and EuFLS3 levels peaked at 24 and 72 h, respectively (22- and 30-fold higher expressions than in control, respectively). Such differential expression patterns implied functional divergence among EuFLSs under drought stress responses. The pronounced upregulation of these specific EuFLS genes indicates that they were key components of the E. ulmoides molecular response to drought stress. Their potential role in drought tolerance remains to be functionally characterized, but their expression patterns make them interesting candidates for further investigation.
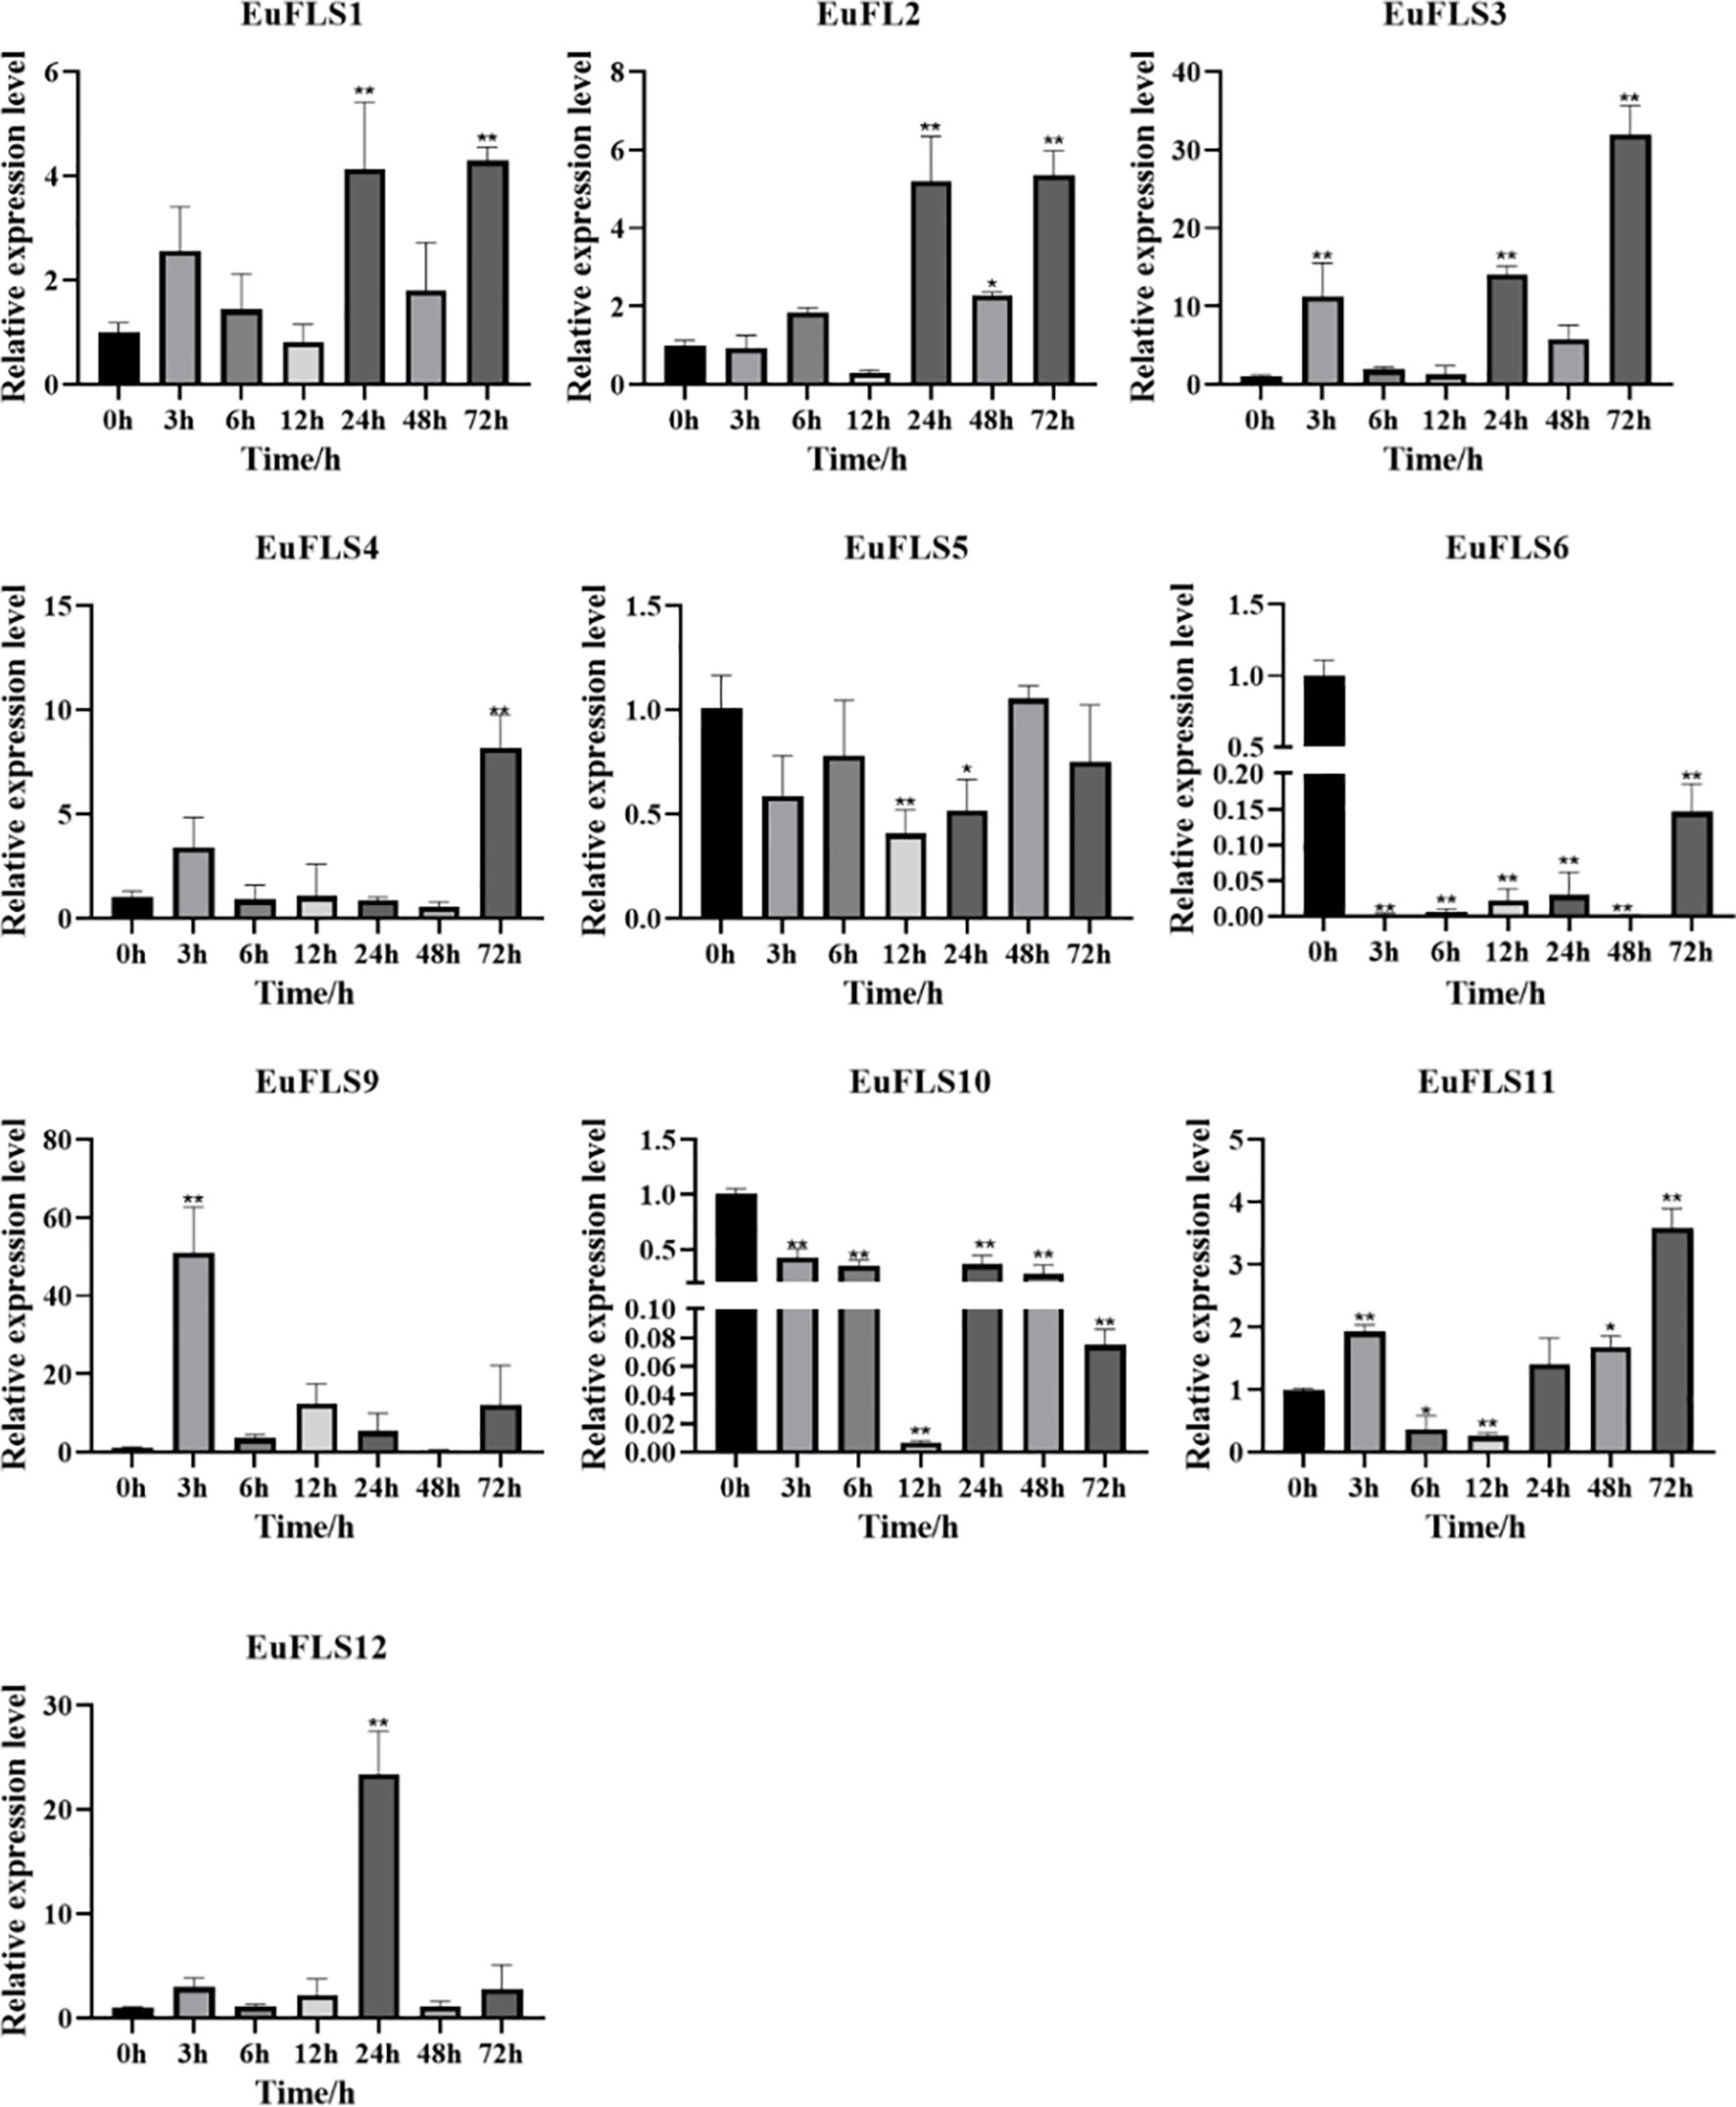
Figure 15. Expression patterns of EuFLS genes under the treatment with PEG6000. The horizontal axis represented PEG6000 treatments, and the vertical axis represented relative gene expression levels. 0 h was selected as the control group. qRT-PCR data were normalized using UBC as the reference gene and were displayed relative to 0 h. Results were expressed as mean ± standard deviation (SD). Error bars represented the standard error of the mean of three independent replicates, the * indicated significant differences by t-test (*p<0.05, **p<0.01).
4 Discussion
E. ulmoides is an ancient and precious plant that has been used as medicine in China for more than 2000 years. Because its bark, leaves, seeds, and male flowers can be used in medicine, it plays an important role in medicine, food, chemical industry, and other fields, so it is also called “plant gold” (Bao et al., 2024). Flavonoids, one of the major bioactive constituents of E. ulmoides, are widely distributed and abundant in this species. FLS, a key enzyme in the flavonoid biosynthesis pathway, specifically catalyzes the 3-hydroxylation of dihydroflavonols to produce flavonols. To date, FLSs have been identified and extensively studied in various plant species, including petunia (Holton et al., 1993), Arabidopsis (Owens et al., 2008), tobacco (Huang et al., 2006), M. armeniacum (Xu et al., 2011), Fagopyrum tataricum (Sun, 2012), tea plant (Ma and Chen, 2009), Malus domestica (Liu et al., 2018), Myrica rubra (Xing, 2021), and Triticum aestivum (Qi, 2016). However, FLSs in E. ulmoides remain uncharacterized, highlighting the need for further research on their functional roles in flavonoid biosynthesis in this species. In this study, twelve members of the EuFLS gene family (designated EuFLS1-EuFLS12) were identified in E. ulmoides. The analysis of physicochemical properties reveals a high variation among the different members. The variation range of the amino acid sequence of EuFLSs was 328 aa to 420 aa, with molecular weights ranging from 36297.19 Da to 46513.98 Da, and the expected the oretical isoelectric point ranging from 5.46 to 8.72. In terms of gene structure, the range of variation in EuFLS genes exons ranged from 3 to 5, and all EuFLS genes harbored introns. Among other species, intron variation in maize flavonoid-related gene synthesis ranged from 0 to 11, with 9.71% lacking introns (Ge et al., 2021). In rice, the number of introns in FLS genes ranged from 0 to 10, with 5.88% of these genes being intron-free (Park et al., 2019). On the contrary, intron counts in tomato FLS genes varied from 1 to 11, and nearly all tomato FLS genes contained introns (Wei et al., 2021). Based on the gene structure analysis of alfalfa, the intron number in MsFLS genes spanned from 2 to 6, and all MsFLS genes harbored introns (Yue et al., 2024). Given that differences in gene structure exert a significant impact on gene function, we speculate that the FLS gene family in E. ulmoides has fewer introns and low genetic diversity. This characteristic may help reduce gene redundancy and enhance functional specificity of EuFLS genes. A total of 12 EuFLS genes were unevenly distributed across eight chromosomes (Figure 4), which differs from the AthFLS gene family in Arabidopsis—a family primarily localized near chromosome 5 (Owens et al., 2008). Phylogenetic tree analysis revealed that most EuFLS genes within the same clade shared similar exon-intron organization patterns and conserved motifs, despite variations in intron length among some members (Figure 3). This phenomenon suggests that the intron organization of homologous genes tends to be conserved during evolution, which is consistent with findings reported in alfalfa (Yue et al., 2024). Collectively, these differences not only provide a basis for the classification of the FLS gene family but also indicate that FLS family members may have undergone functional differentiation.
The distribution pattern of cis-acting elements within promoters can offer insights into their functional roles in plant signal transduction pathways and the regulation of complex biological processes. In this study, a total of 270 cis-acting elements were identified, harboring a wide variety of cis-regulatory elements related to hormone signaling and stress adaptation. The main types of these elements are those involved in auxins, jasmonic acid, SA, ABA, and drought response (Figure 5). Among these, light-responsive elements were the most abundant (n=137), followed by hormone- (n=91) and abiotic stress-responsive elements (n=72). This distribution suggested that EuFLSs are involved in hormone signaling, abiotic stress and photoperiod regulation in E. ulmoides. Previous studies show that ABA induces the expression of flavonoid synthesis-related genes, enhancing stress resistance in pigeon peas (Yang et al., 2021). In tobacco, GA3, ABA, jasmonic acid (JA), MeJA, and SA treatments induced NtFLS1 expression, while drought and high-temperature stresses significantly upregulated both NtFLS1 and NtFLS2 in tobacco roots (He et al., 2024). In alfalfa, MsFLSs respond to cold stress to varying degrees, overexpression of MsFLS13 increases flavonoid levels and reduces accumulation of ROS, Malondialdehyde (MDA), CO2, and H2O2 under cold stress (Yue et al., 2024). In cotton, promoters of GhFLS mainly contain plant hormone response elements and abiotic stress-responsive elements, notably, GhFLS genes expression is induced by salt, drought, low temperature, and heat stress, while heterologous expression of GhFLS1 reduces salt stress tolerance (Han et al., 2023). These findings further confirm that EuFLSs may play a significant role in both hormonal responses and abiotic stress responses. However, the specific function of individual EuFLSs genes still need to be verified through functional validation approaches, such as gene overexpression and gene knockout.
The expression of FLS genes exhibits distinct tissue-specific and developmental stage-specific patterns across plant species. For example, in Solanum sisymbriifolium, SsFLS2 shows the highest expression level in roots, followed by leaves and stems (Sun et al., 2024). In M. domestica, MdFLS2 is expressed in multiple tissues including roots, stems, leaves, flowers, and young fruits, with its expression peaking in leaves (Qi et al., 2018). In Allium cepa, FLS genes are highly expressed in leaf sheaths, moderately expressed in leaves, and nearly undetectable in roots (Wang et al., 2022). Aligning with the aforementioned results, EuFLS genes also display distinct tissue- and stage-specific expression. EuFLS8/9/11 were highly expressed in leaves, while EuFLS1/2/3/4/5/6/7/10 and EuFLS12 were mainly expressed in stems, Interestingly, the expression of all EuFLS genes was lowest in roots. For comparison, in other plant species: In Juglans regia, JrFLS1/4/5/7 exhibited high expression in vegetative buds, pistils, and mature leaves, and JrFLS1 and JrFLS5 were primarily expressed at the early stage of female flower bud differentiation (Zhang et al., 2025). In Vitis vinifera, five VvFLSs were expressed in flower buds and flowers, VvFLS4 and VvFLS5 were detectable in mature fruits, and VvFLS4 expression was dependent on light (Fujita et al., 2006). In Citrus unshiu, CitFLS was more highly expressed in immature fruits compared to mature fruits (Moriguchi et al., 2002). In Eriobotrya japonica, during fruit ripening, FLS expression has been shown to be positively correlated with flavonol accumulation while negatively correlated with dihydroflavonol levels (Zheng, 2019). Previous studies show that the accumulation of most flavonoids peaks in growing leaves, follow by old leaves of E. ulmoides by metabolic analysis, concurrently, the expression levels of most isoforms of F3’H, FLS, CHI and CHS are relatively high in growing leaves, resulting in high concentrations of naringenin chalcone, aromadendrin, kaempferol and quercetin in the growing leaves stage (Li et al., 2019). Consistent with these previous findings, the result of the present study show that EuFLS2/3/5/6/10 are highly expressed in both growing leaves and old leaves, further supporting the notion that these genes play a significant role in flavonoid synthesis.
In the flavonoid biosynthesis pathway, FLS competes with DFR for substrates, forming a key regulatory node that directs metabolic flux toward either anthocyanin or flavonol production, thereby influencing plant pigmentation and leaf coloration (Luo et al., 2016). For Chrysanthemum morifolium, studies have demonstrated that overexpression CmFLS in tobacco results in elevated flavone/flavonol content and reduced anthocyanin levels, with expression levels of CmFLS being positively associated with flower color intensity (Wang et al., 2021). In Ipomoea batatas, IbFLS1 exhibits expression in young green leaves. When IbFLS1 was silenced, the plant developed a purple phenotype; concurrently, the genes DFR, ANS, and UFGT were upregulated, ultimately causing an increase in anthocyanin accumulation and a decrease in flavonol accumulation (Xiao et al., 2024). In this study, expression profiling of EuFLSs in differently colored leaves revealed distinct expression patterns. Only EuFLS8 was highly expressed in green-leafed, whereas the remaining EuFLS genes all showed the higher expression level in purple leaves, suggesting that EuFLS is involved in E. ulmoides leaf color formation. In Camellia nitidissima, CnFLS1 expression has been found to positively correlate with flavonol accumulation. Heterologous overexpression of CnFLS1 in tobacco resulted in flower color transition to white or pale yellow, demonstrating that CnFLS1 negatively regulates yellow pigment deposition (Zhou et al., 2013). In Petunia hybrida, antisense suppression of FLS expression led to inhibition of flavonol biosynthesis in petals, causing a phenotypic shift from light pink to red coloration (Holton et al., 1993; Nielsen et al., 2002). In sweet potato, silencing of the FLS gene leads to purple leaf coloration, along with the up-regulated expression of DFR, ANS and UFGT. This genetic modification also results in a significant increase in total anthocyanin content, while total flavonol content decreases remarkably (Xiao et al., 2024). Based on this evidence, we speculate that EuFLSs not only contribute to flavonol synthesis but also serve as potential candidate genes involved in leaf color formation in E. ulmoides.
Flavonols are known to be involved in the development of floral organs and flower fertility (Mo et al., 1992; Napoli et al., 1999). For instance, knockout of CHS gene in petunias and silencing of FLS gene in tobacco can both inhibit anther whitening, induce male sterility, and influence other related traits (Napoli et al., 1999; Mahajan et al., 2011). In Camellia sinensis, the content of flavonols correlates with stamen growth, most flavonol glycosides are primarily accumulated in petals and anthers, and CsFLSb exhibits high expression in anthers in fertile flowers while being expressed at extremely low levels in sterile flowers (Shi et al., 2021). Additionally, in tobacco, adding low-concentration flavonols to the germination medium can restore pollen germination and pollen tube elongation (Ylstra et al., 1992). In our study, EuFLS9 showed the highest expression level during the induction stage of both female and male flowers of E. ulmoides and was also highly expressed in purple leaves. These results imply that EuFLS9 may play an important role in mediating the involvement of flavonols in the formation and development of E. ulmoides floral organs, though further in-depth mechanistic research is needed to confirm this.
Plant hormones are widely recognized to play pivotal roles in regulating plant growth, development, and responses to diverse environmental stresses. Furthermore, these phytohormones intricately regulate the biosynthesis of secondary metabolites, notably flavonols, within plants. Previous studies have shown that the FLS family plays an important role in the regulating various stresses, such as ABA, SA, MeJA, and drought stress. In tartary buckwheat, the expression of FtFLS1 is suppressed by SA and ABA, whereas FtFLS2 is unaffected by ABA but induced by SA (Li et al., 2013). In Camellia vietnamensis Huang, FLS genes—potential regulators of flavonoid formation—exhibited elevated expression 2 h following MeJA treatment (Yan et al., 2022). In this study, the expression levels of EuFLS2/3/5/6/9 genes were enhanced during the early stage of ABA treatment. The induction effect of GA3 treatment on EuFLSs was even more pronounced, upregulating eight EuFLS genes. EuFLS2 levels increased by 10-fold at 12 h post-treatment, and EuFLS9 levels increased by 20-fold at 36 h. Following SA treatment, six EuFLSs were significantly upregulated, with EuFLS4 being the most responsive, showing a 7-fold increase at 72 h post-treatment compared to the control. These findings were consistent with the expression patterns of tobacco FLSs (NtFLSs), ABA and SA have been found to markedly upregulate NtFLS1 and NtFLS2, additionally, NtFLS1 is also upregulated by GA3, with its levels increasing by 2.07-fold (He et al., 2024). In Dendrobium officinale, SA treatment significantly upregulated DoFLS1 expression at 2 h post-treatment, with 4.66-fold higher levels than in control (Yu et al., 2021). Previous studies have revealed that FLS gene in leaves exhibits peak expression levels in plants treated with MeJA and SA during the vegetative growth stage (Sun et al., 2012; Pandey et al., 2016). In Euphorbia kansui, EkFLS expression peaked its maximum at 12–36 h post-MeJA treatment, and this induction was associated with increased flavonoid accumulation in both leaves and roots. Additionally, when EkFLS was expressed in Arabidopsis, it improved the plant’s tolerance to drought and salt stress while increasing the contents of total flavonoids and flavonols (Zhang, 2020). In the study, six EuFLSs showed significant upregulation under MeJA treatment, with the expression level of EuFLS9 increasing by 150-fold at 12 h post-treatment. Notably, EuFLS9 was also induced to express under the treatments of ABA, GA3 and MeJA, therefore, we assumed that EuFLS9 directly participate in the ABA -GA3-MeJA crosstalk in E. ulmoides.
Studies have shown that under salt, drought stress and MeJA treatments, plant flavonoid content increases significantly, which helps enhance tolerance to abiotic stresses (Azhar et al., 2011; Li et al., 2020a). In Arabidopsis, overexpression of EkFLS increased the content of total flavonoid, quercetin and kaempferol under the stresses of MeJA, NaCl and PEG, which can inhibit ABA-induced stomatal closure, improving tolerance to drought and salt stress (Wang et al., 2021b). In Castanea mollissima, drought stress upregulated the expression of CmFLS; when CmFLS was heterologously overexpressed in tobacco, it enhanced the plant’s drought tolerance by increasing antioxidant enzyme activity and promoting flavonol accumulation (Zeng, 2024). In M. domestica, MdFLS1 expression has been found to be induced by high salinity, drought, low temperature, and ABA treatment. Additionally, overexpression of MdFLS1 improved salt and drought tolerance in apple callus (Liu, 2018). Similarly, in Carthamus tinctorius, the expression of CtFLS1 showed a positive correlation with flavonoid content, CtFLS1 overexpression in Arabidopsis not only promoted seed germination, improve osmotic and drought stress tolerance, and reduced ABA sensitivity, furthermore, it also upregulated key flavonol biosynthetic genes while downregulating anthocyanin synthesis genes. These results suggest that CtFLS1 alleviates drought sensitivity by stimulating flavonol and anthocyanin accumulation (Zhang et al., 2025). In the study, the expression of most EuFLS genes was also regulated to varying degrees under drought treatment. Notably, EuFLS3 was significantly upregulated, with its expression level increasing by 30-fold at 72 h post-treatment; EuFLS9, by contrast, responded a strong early response to drought, peaking at 3 h post-treatment with an expression level 50-fold higher than that of the control. These results suggest that EuFLS3 and EuFLS9 may play crucial roles in promoting flavonoids biosynthesis, thereby enhancing the drought stress tolerance of E. ulmoides. Future research using transgenic approaches will be essential to validate whether the manipulation EuFLS3 and EuFLS9 genes can indeed confer enhanced drought tolerance, thus confirming their potential as breeding targets. Concurrently EuFLS3 and EuFLS9 can be used as a candidate marker to accelerate the selection of drought-tolerant seedlings, reducing the time cost associated with traditional breeding. Furthermore, science flavonoids act as antioxidants to alleviate drought-induced oxidative damage, targeted overexpression of stress-responsive EuFLS genes may simultaneously enhance drought tolerance and maintain stable rubber yield—providing a new strategy for biotechnological improvement of E. ulmoides.
Above all, EuFLSs genes were induced by multiple treatments such as ABA, GA3, SA, MeJA, as well as by drought stress. Previous studies have shown that phytohormone crosstalk is universally present in plants, constituting a very complex signaling regulatory network that plays a critical role in the regulation of growth and development in plants (Lian et al., 2024). In our study, we postulate that FLS genes in E. ulmoides respond to various stresses through different hormone signaling pathways, such as ABA-GA3 stress crosstalk, SA-MeJA crosstalk, or drought stress crosstalk, regulating the growth and development of E. ulmoides. For future research, investigating the functional of EuFLS genes in regulating growth and development, adversity stress response, and hormone crosstalk regulation must include transgenic assays. These assays will be essential to definitively validate the proposed connections between EuFLS function, flavonoid metabolism, and rubber biosynthesis in E. ulmoides.
5 Conclusion
In this study, we conducted a comprehensive and systematic characterization of the flavonol synthase (FLS) gene family in E. ulmoides. A total of 12 EuFLS genes were identified, and their physicochemical properties, chromosomal localization, conserved domain, gene structures, promoter cis-elements, and phylogenetic relationships were analyzed. The results showed that 12 EuFLSs genes could be classified into three main subgroups of I and III, and members within the same subgroup had similar motif compositions and gene structures. Additionally, we analyzed the expression profiles of EuFLSs genes in different tissues, distinct leaf developmental stages, E. ulmoides cultivars with varying rubber contents, different leaf colors, and different developmental stages of male and female flowers, as well as their expression responses to drought stress and various hormonal treatments. Collectively, the extensive bioinformatics and expression analysis of EuFLSs genes contributes to our understanding of the functions of these genes in multiple stress responses and phytohormone crosstalk.
Data availability statement
The datasets presented in this study can be found in online repositories. The names of the repository/repositories and accession number(s) can be found in the article/Supplementary Material.
Author contributions
JuL: Supervision, Methodology, Writing – original draft, Software, Conceptualization, Investigation, Visualization, Data curation, Validation, Funding acquisition, Writing – review & editing, Resources, Project administration, Formal Analysis. TC: Software, Writing – review & editing. LW: Software, Writing – review & editing. CL: Software, Writing – review & editing. RM: Writing – review & editing, Formal Analysis. WF: Formal Analysis, Writing – review & editing. JiL: Writing – review & editing, Formal Analysis. BZ: Writing – review & editing, Formal Analysis. QD: Writing – review & editing, Formal Analysis. JK: Writing – review & editing. SC: Writing – review & editing.
Funding
The author(s) declare financial support was received for the research and/or publication of this article. This project was supported by Joint Fund for Science and Technology Research of Henan Province (No. 222301420074) and Henan Province Forestry and Grassland Special Fund Project in 2024 (Yucai Huanzi (2024) No. 47).
Conflict of interest
The authors declare that the research was conducted in the absence of any commercial or financial relationships that could be construed as a potential conflict of interest.
Generative AI statement
The author(s) declare that no Generative AI was used in the creation of this manuscript.
Any alternative text (alt text) provided alongside figures in this article has been generated by Frontiers with the support of artificial intelligence and reasonable efforts have been made to ensure accuracy, including review by the authors wherever possible. If you identify any issues, please contact us.
Publisher’s note
All claims expressed in this article are solely those of the authors and do not necessarily represent those of their affiliated organizations, or those of the publisher, the editors and the reviewers. Any product that may be evaluated in this article, or claim that may be made by its manufacturer, is not guaranteed or endorsed by the publisher.
Supplementary material
The Supplementary Material for this article can be found online at: https://www.frontiersin.org/articles/10.3389/fpls.2025.1662635/full#supplementary-material
References
Azhar, N., Hussain, B., Ashraf, M., and Abbasi, K. ,. Y. (2011). Water stress mediated changes in growth, physiology and secondary metabolites of desi ajwain (Trachyspermum ammi). Pakistan J. Botany. 43, 15–19.
Bailey, T. L., Williams, N., Misleh, C., and Li, W. W. (2006). MEME: discovering and analyzing DNA and protein sequence motifs. Nucleic Acids Res. 34, W369–W373. doi: 10.1093/nar/gkl198
Bao, L., Sun, Y., Wang, J., Li, W., Liu, J., Li, T., et al. (2024). A review of “plant gold” Eucommia ulmoides Oliv.: A medicinal and food homologous plant with economic value and prospect. Heliyon. 10, e24851. doi: 10.1016/j.heliyon.2024.e24851
Cai, D. Y. (2022). Transcriptome metabolome association analysis and Flavonol Synthase Gene (AvFLS) function of Apocynum venetum L. under salt stress (Lanzhou: Northwest Minzu University). doi: 10.27408/d.cnki.gxmzc
Chen, C., Wu, Y., Li, J., Wang, X., Zeng, Z., Xu, J., et al. (2023). TBtools-II: a “one for all, all for one” bioinformatics platform for biological big-data mining. Mol. Plant 16, 1733–1742. doi: 10.1016/j.molp.2023.09.010
Editorial Committee of Flora of China and Chinese Academy of Sciences (1979). Flora of China Vol. 35 (Beijing: Chemical Industry Press).
Falcone Ferreyra, M. L., Rius, S. P., and Casati, P. (2012). Flavonoids: biosynthesis, biological functions, and biotechnological applications. Front. Plant Sci. 3. doi: 10.3389/fpls.2012.00222
Falcone Ferreyra, M. ,. L., Rius, S., Emiliani, J., Pourcel, L., Feller, A., Morohashi, K., et al. (2010). Cloning and characterization of a UV-B-inducible maize flavonol synthase. Plant J. 62, 77–91. doi: 10.1111/j.1365-313X.2010.04133.x
Forkmann, G., Vlaming, P. D., Spribille, R., Wiering, H., and Schram, A. W. (1986). Genetic and biochemical studies on the conversion of dihydroflavonols to flavonols in flowers of Petunia hybrida. Theor. Appl. Genet. 41, 179–186. doi: 10.1007/BF00305991
Fujita, A., Goto-Yamamoto, N., Aramaki, I., and Hashizume, K. (2006). Organ-specific transcription of putative flavonol synthase genes of grapevine and effects of plant hormones and shading on flavonol biosynthesis in grape berry skins. Biosci. Biotechnol. Biochem. 70, 632–638. doi: 10.1271/bbb.70.632
Gasteiger, E., Gattiker, A., Hoogland, C., Ivanyi, I., Appel, R., and Bairoch, A. (2003). ExPASy: The proteomics server for in-depth protein knowledge and analysis. Nucleic Acids Res. 31, 3784–3788. doi: 10.1093/nar/gkg563
Ge, C. X., Tang, C. X., Zhu, Y. X., and Wang, G. F. (2021). Genome-wide identification of the maize 2OGD superfamily genes and their response to Fusarium verticillioides and Fusarium graminearum. Gene 764, 145078. doi: 10.1016/j.gene.2020.145078
Gong, M., Su, C. F., Fan, M. Z., Wang, P., Cui, B. D., Guo, Z. Y., et al. (2022). Mechanism by which Eucommia ulmoides leaves regulate nonalcoholic fatty liver disease based on system pharmacology. J. Ethnopharmacol. 282, 114603. doi: 10.1016/j.jep.2021.114603
Guo, A. Y., Zhu, Q. H., Chen, X., and Luo, J. C. (2007). GSDS: a gene structure display server. Yi Chuan 29, 1023–1026. doi: 10.16288/j.yczz.2007.08.004
Han, M., Cui, R., Cui, Y. P., Wang, J., Wang, S., Jiang, T., et al. (2023). A flavonol synthase (FLS) gene, GhFLS1, was screened out increasing salt resistance in cotton. Environ. Sci. Europe. 35, 37. doi: 10.1186/s12302-023-00743-2
Harborne, J. B. and Williams, C. A. (2000). Advances in flavonoid research since 1992. Phytochemistry 55, 481–504. doi: 10.1016/s0031-9422(00)00235-1
He, S., Su, H., Li, B., Liu, J., Xu, X., and Luo, C. (2024). Bioinformatics and expression pattern of flavonol synthase gene (NtFLS) in tobacco. Tobacco Sci. Technology. 57, 33–47. doi: 10.16135/j.issn1002-0861.2023.0838
Henry-Kirk, R. A., Plunkett, B., Hall, M., McGhie, T., Allan, A. C., Wargent, J. J., et al. (2018). Solar UV light regulates flavonoid metabolism in apple (Malus x domestica). Plant Cell Environ. 41, 675–688. doi: 10.1111/pce.13125
Holton, T. A., Brugliera, F., and Tanaka, Y. (1993). Cloning and expression of flavonol synthase from Petunia hybrida. Plant J. 4, 1003–1010. doi: 10.1046/j.1365-313x.1993.04061003.x
Huang, Q. L. and Cai, C. (2014). Bioinformatics analysis of flavonol synthase from various plants. Guangdong Agric. Sci. 41, 140–143. doi: 10.16768/j.issn.1004-874x.2014.13.002
Huang, W. W., Yang, X., Zhang, C. E., Fang, B., Ma, L., Chang, J. L., et al. (2006). Cloning and sequence analysis of flavonol synthase gene from tobacco. Plant Physiol. J. 06), 1059–1062. doi: 10.13592/j.cnki.ppj.2006.06.010
Kim, B. G., Joe, E. J., and Ahn, J. H. (2010). Molecular characterization of flavonol synthase from poplar and its application to the synthesis of 3-O-methylkaempferol. Biotechnol. Lett. 32, 579–584. doi: 10.1007/s10529-009-0188-x
Kim, Y. B., Kim, K., Kim, Y., Tuan, P. A., Kim, H. H., Cho, J. W., et al. (2014). Cloning and characterization of a flavonol synthase gene from Scutellaria baicalensis. Sci. World J. 2014, 980740. doi: 10.1155/2014/980740
Kou, M., Li, C., Song, W., Shen, Y., Tang, W., Zhang, Y., et al. (2023). Identification and functional characterization of a flavonol synthase gene from sweet potato [Ipomoea batatas (L.) Lam. Front. Plant Sci. 14. doi: 10.3389/fpls.2023.1181173
Letunic, I., Doerks, T., and Bork., P. (2009). SMART 6: recent updates and new developments. Nucleic Acids Res. 37, 229–232. doi: 10.1093/nar/gkn808
Li, X., Kim, Y. B., Kim, Y., Zhao, S., Kim, H. H., Chung, E., et al. (2013). Differential stress-response expression of two flavonol synthase genes and accumulation of flavonols in tartary buckwheat. J. Plant Physiol. 170, 1630–1636. doi: 10.1016/j.jplph.2013.06.010
Li, Y., Kong, D., Fu, Y., Sussman, M. ,. R., and Wu, H. (2020a). The effect of developmental and environmental factors on secondary metabolites in medicinal plants. Plant Physiol. Biochem. 148, 80–89. doi: 10.1016/j.plaphy.2020.01.006
Li, L., Liu, M., Shi, K., Yu, Z., Zhou, Y., Fan, R., et al. (2019). Dynamic changes in metabolite accumulation and the transcriptome during leaf growth and development in Eucommia ulmoides. Int. J. Mol. Sci. 20, 4030. doi: 10.3390/ijms20164030
Li, R., Nie, L. L., Wang, Q., Ouyang, D., Zhang, L., Yuan, Y., et al. (2022). Phytochemical constituents, chemotaxonomic significance and anti-arthritic effect of Eucommia ulmoides Oliver staminate flowers. Nat. Prod Res. 36, 3455–3459. doi: 10.1080/14786419.2020.1858411
Li, R., Tan, B., Jiang, Q., Chen, F. M., Li, K., and Liao, P. (2024). Eucommia ulmoides flavonoids alleviate intestinal oxidative stress damage in weaned piglets by regulating the Nrf2/Keap1 signaling pathway. Ecotoxicol Environ. Saf. 288, 117373. doi: 10.1016/j.ecoenv.2024.117373
Li, Y., Wei, H., Yang, J., Du, K., Li, J., Zhang, Y., et al. (2020b). High-quality de novo assembly of the Eucommia ulmoides haploid genome provides new insights into evolution and rubber biosynthesis. Hortic. Res. 7, 183. doi: 10.1038/s41438-020-00406-w
Lian, C. L., Zhang, B., Li, J. J., Yang, H., Liu, X. Y., Ma, R., et al. (2024). Genome-wide identification, characterization and expression pattern analysis of TIFY family members in Artemisia argyi. BMC Genomics 25, 925. doi: 10.1186/s12864-024-10856-4
Liu, X. (2018). Functional identifacation of flavonol synthase gene MdFLS1 in apple (Taian: Shandong Agricultural University). doi: 10.7666/d.D01436807
Liu, H. L. (2019). Characterization of DFR and FLS genes regulating of the anthocyanin accumulation in blue grape hyacinth (Yangling: Northwest A & F University). doi: 10.27409/d.cnki.gxbnu.2019.000032
Liu, X., Lu, J., Hao, Y. J., and You, C. X. (2018). Cloning, bioinformatics analysis and catalytic activity identification of MdFLS1 gene in apple. J. Fruit Sci. 35, 905–916. doi: 10.13925/j.cnki.gsxb.20180073
Luo, P., Ning, G., Wang, Z., Shen, Y., Jin, H., Li, P., et al. (2016). Disequilibrium of flavonol synthase and dihydroflavonol-4-reductase expression associated tightly to white vs. red color flower formation in plants. Front. Plant Sci. 6. doi: 10.3389/fpls.2015.01257
Ma, C. L. and Chen, L. (2009). Cloning and prokaryotic expression of flavonol synthase gene from tea plants. Genomics Appl. Biol. 28, 433–438. doi: 10.3969/gab.028.000433
Ma, X., Hou, Y., Umar, A. W., Wang, Y., Yu, L., Ahmad, N., et al. (2024). Safflower CtFLS1-induced drought tolerance by stimulating the accumulation of flavonols and anthocyanins in Arabidopsis thaliana. Int. J. Mol. Sci. 25, 5546. doi: 10.3390/ijms25105546
Mahajan, M., Ahuja, P. S., and Yadav, S. K. (2011). Post-transcriptional silencing of flavonol synthase mRNA in tobacco leads to fruits with arrested seed set. PloS One 6, e28315. doi: 10.1371/journal.pone.0028315
Mahajan, M., Joshi, R., Gulati, A., and Yadav, S. K. (2012). Increase in flavan-3-ols by silencing flavonol synthase mRNA affects the transcript expression and activity levels of antioxidant enzymes in tobacco. Plant Biol. (Stuttg). 14, 725–733. doi: 10.1111/j.1438-8677.2011.00550.x
Martens, S., Preuss, A., and Matern, U. (2010). Multifunctional flavonoid dioxygenases: flavonol and anthocyanin biosynthesis in Arabidopsis thaliana L. Phytochemistry. 71, 1040–1049. doi: 10.1016/j.phytochem.2010.04.016
Mo, Y., Nagel, C., and Taylor, L. P. (1992). Biochemical complementation of chalcone synthase mutants defines a role for flavonols in functional pollen. Proc. Natl. Acad. Sci. United States America. 89, 7213–7217. doi: 10.1073/pnas.89.15.7213
Moriguchi, T., Kita, M., Ogawa, K., Tomono, Y., Endo, T., and Omura, M. (2002). Flavonol synthase gene expression during citrus fruit development. Physiol. Plant 114, 251–258. doi: 10.1034/j.1399-3054.2002.1140211.x
Napoli, C. A., Fahy, D., Wang, H. Y., and Taylor, L. P. (1999). white anther: A petunia mutant that abolishes pollen flavonol accumulation, induces male sterility, and is complemented by a chalcone synthase transgene. Plant Physiol. 120, 615–622. doi: 10.1104/pp.120.2.615
Nielsen, K., Deroles, S. C., Markham, K. R., Bradley, M. J., Podivinsky, E., and Manson, D. (2002). Antisense flavonol synthase alters copigmentation and flower color in lisianthus. Mol. Breeding. 9, 217–229. doi: 10.1023/A:1020320809654
Owens, D. K., Alerding, A. B., Crosby, K. C., Bandara, A. B., Westwood, J. H., and Winkel, B. S. (2008). Functional analysis of a predicted flavonol synthase gene family in Arabidopsis. Plant Physiol. 147, 1046–1061. doi: 10.1104/pp.108.117457
Pandey, A., Alok, A., Lakhwani, D., Singh, J., Asif, M. ,. H., and Trivedi, P. ,. K. (2016). Genome-wide expression analysis and metabolite profiling elucidate transcriptional regulation of flavonoid biosynthesis and modulation under abiotic stresses in banana. Sci. Rep. 6, 31361. doi: 10.1038/srep31361
Park, S., Kim, D. H., Park, B. R., Lee, J. Y., and Lim, S. H. (2019). Molecular and functional characterization of Oryza sativa flavonol synthase (OsFLS), a bifunctional dioxygenase. J. Agric. Food Chem. 67, 7399–7409. doi: 10.1021/acs.jafc.9b02142
Qi, Y. Y. (2016). The role of wheat flavonol synthase gene TaFLS2 in drought resistance and development (Jinan: Shandong University). doi: 10.7666/d.Y3036630
Qi, C. H., Zhao, X. Y., Jiang, H., Liu, H. T., Wang, Y. X., Hu, D. G., et al. (2018). Molecular cloning and functional identification of an apple flagellinceptor MdFLS2 gene. J. Integr. Agric. 17, 2694–2703. doi: 10.1016/S2095-3119(18)62009-X
Qing, J., Du, Q., Meng, Y. D., Liu, P. F., Du, H. H., and Wang, L. (2021). Genome-wide identification and expression pattern analysis of the ribonuclease T2 family in Eucommia ulmoides. Sci. Rep. 11, 6900. doi: 10.1038/s41598-021-86337-5
Quevillon, E., Silventoinen, V., Pillai, S., Harte, N., Mulder, N., Apweiler, R., et al. (2005). InterProScan: protein domains identifer. Nucleic Acids Res. 33, W116–W120. doi: 10.1093/nar/gki442
Schijlen, E., G, W, M., Ric de Vos, C. H., van Tunen, A. J., and Bovy, A. G. (2004). Modification of flavonoid biosynthesis in crop plants. Phytochemistry. 65, 2631–2648. doi: 10.1016/j.phytochem.2004.07.028
Schilbert, H. M., Schone, M., Baier, T., Busche, M., Viehover, P., Weisshaar, B., et al. (2021). Characterization of the Brassica napus flavonol synthase gene family reveals bifunctional flavonol synthases. Front. Plant Sci. 12. doi: 10.3389/fpls.2021.733762
Shi, Y., Jiang, X., Chen, L., Li, W. W., Lai, S., Fu, Z., et al. (2021). Functional analyses of flavonol synthase genes from Camellia sinensis reveal their roles in anther development. Front. Plant Sci. 12. doi: 10.3389/fpls.2021.753131
Shi, J., Li, W., Gao, Y., Wang, B., Li, Y., and Song, Z. (2017). Enhanced rutin accumulation in tobacco leaves by overexpressing the NtFLS2 gene. Biosci. Biotechnol. Biochem. 81, 1721–1725. doi: 10.1080/09168451.2017.1353401
Shi, S., Li, W., Li, K., and Lv, L. (2019). Advances of FLS in plant. Mol. Plant Breeding. 17, 100–105. doi: 10.13271/j.mpb.017.005980
Solovchenko, A. and Schmitz-Eiberger, M. (2003). Significance of skin flavonoids for UV-B-protection in apple fruits. J. Exp. Bot. 54, 1977–1984. doi: 10.1093/jxb/erg199
Stracke, R., Favory, J., Gruber, H., Bartelniewoehner, L., Bartels, S., Binkert, M., et al. (2010). The Arabidopsis bZIP transcription factor HY5 regulates expression of the PFG1/MYB12 gene in response to light and ultraviolet-B radiation. Plant Cell Environ. 33, 88–103. doi: 10.1111/j.1365-3040.2009.02061.x
Sun, J. Y. (2012). Gene cloning and optimal substrate analysis of flavonase synthase homologous proteins FLS2 and FLS3 from Fagopyrum tataricum (Yaan: Sichuan Agricultural University).
Sun, Z., Hou, S., Yang, W., and Han, Y. (2012). Exogenous application of salicylic acid enhanced the rutin accumulation and influenced the expression patterns of rutin biosynthesis related genes in Fagopyrum tartaricum Gaertn leaves. Plant Growth Regul. 68, 9–15. doi: 10.1007/s10725-012-9688-0
Sun, M., Wu, L., Gong, Y., Bao, R., Gui, M., Li, Z., et al. (2024). Cloning and expression analysis of SsFLS2 gene in Solanum sisymbriifolium Lam. Southwest China J. Agric. Sci. 37, 5591–5600. doi: 10.16213/j.cnki.scjas.2024.8.003
Tamura, K., Stecher, G., Peterson, D., Filipski, A., and Kumar, S. (2013). MEGA6: molecular evolutionary genetics analysis version 6.0. Mol. Biol. Evol. 30, 2725–2729. doi: 10.1093/molbev/mst197
Tian, J., Han, Z. ,. Y., Zhang, J., Hu, Y., Song, T., and Yao, Y. (2015). The balance of expression of dihydroflavonol 4-reductase and flavonol synthase regulates flavonoid biosynthesis and red foliage coloration in crabapples. Sci. Rep. 5, 12228. doi: 10.1038/srep12228
Tompson, J. D., Higgins, D. G., and Gibson, T. J. (1994). CLUSTAL W: improving the sensitivity of progressive multiple sequence alignment through sequence weighting, positionspecifc gap penalties and weight matrix choice. Nucleic Acids Res. 22, (22) 4673–4680. doi: 10.1093/nar/22.22.4673
Wang, W. Q. (2021). Studies on key genes involved in biosynthesis of walnut (Juglans regia L.) lipids and jujube (Ziziphus jujuba Mill.) proanthocyanindins based on transcriptome analysis (Hangzhou: Zhejiang University). doi: 10.27461/d.cnki.gzjdx.2021.001481
Wang, M., Ren, T., Huang, R., Li, Y., Zhang, C., and Xu, Z. (2021a). Overexpression of an Apocynum venetum flavonols synthetase gene confers salinity stress tolerance to transgenic tobacco plants. Plant Physiol. Biochem. 162, 667–676. doi: 10.1016/j.plaphy.2021.03.034
Wang, Z., Yang, Y., Liu, B., Huo, Y. M., Li, Y., Sun, Y., et al. (2022). Cloning and expression analysis of flavonol synthase gene in onion. Shandong Agric. Sci. 54, 18–24. doi: 10.14083/j.issn.1001-4942.2022.12.003
Wang, M., Zhang, Y., Zhu, C. Y., Yao, X. Y., Zheng, Z., Tian, Z. N., et al. (2021b). EkFLS overexpression promotes flavonoid accumulation and abiotic stress tolerance in plant. Physiol. Plant 172, 1966–1982. doi: 10.1111/ppl.13407
Wang, Y., Zhou, L., Wang, Y., Liu, S., Geng, Z., Song, A., et al. (2021). Functional identification of a flavone synthase and a flavonol synthase genes affecting flower color formation in Chrysanthemum morifolium. Plant Physiol. Biochem. 166, 1109–1120. doi: 10.1016/j.plaphy.2021.07.019
Waterhouse, A., Bertoni, M., Bienert, S., Studer, G., Tauriello, G., Gumienny, R., et al. (2018). SWISS-MODEL: homology modelling of protein structures and complexes. Nucleic Acids Res. 46, W296–W303. doi: 10.1093/nar/gky427
Wei, R., Hao, Z., Huang, D., Wang, R., Pan, X., and Zhang, W. (2023). Overexpression of JsFLS5 in calli improves salinity tolerance by maintaining active oxygen balance and reducing Na+ toxicity in Juglans sigillata. Physiol. Plant 175, e14002. doi: 10.1111/ppl.14002
Wei, S., Zhang, W., Fu, R., and Zhang, Y. (2021). Genome-wide characterization of 2-oxoglutarate and Fe(II)-dependent dioxygenase family genes in tomato during growth cycle and their roles in metabolism. BMC Genomics 22, 126. doi: 10.1186/s12864-021-07434-3
Winkel-Shirley, B. (2002). Biosynthesis of flavonoids and effects of stress. Curr. Opin. Plant Biol. 5, 218–223. doi: 10.1016/S1369-5266(02)00256-X
Xiao, W. J., Hu, Y. L., Wang, Q. Y., Duan, Y. J., and Hu, H. G. (2024). Cloning, bioinformatics and functional analysis of the MaFLS1 in bananas. J. Fruit Science. 41, 229–240. doi: 10.13925/j.cnki.gsxb.20230228
Xing, M. Y. (2021). Regulation of myricetin biosynthesis by FLSs and F3’5’H in Myrica rubra (Hangzhou: Zhejiang University). doi: 10.27461/d.cnki.gzjdx.2021.001635
Xu, F., Li, L., Zhang, W., Cheng, H., Sun, N., Cheng, S., et al. (2011). Isolation, characterization, and function analysis of a flavonol synthase gene from Ginkgo biloba. Mol. Biol. Rep. 39, 2285–2296. doi: 10.1007/s11033-011-0978-9
Yan, H., Zheng, W., Wang, Y., Wu, Y., Yu, J., and Xia, P. (2022). Integrative metabolome and transcriptome analysis reveals the regulatory network of flavonoid biosynthesis in response to MeJA in CamelliaVietnamensis Huang. Int. J. Mol. Sci. 23, 9370. doi: 10.3390/ijms23169370
Yang, W., Li, N., Fan, Y., Dong, B., Song, Z., Cao, H., et al. (2021). Transcriptome analysis reveals abscisic acid enhancing drought resistance by regulating genes related to flavonoid metabolism in pigeon pea. Environ. Exp. Bot. 191, 104627. doi: 10.1016/j.envexpbot.2021.104627
Ye, J. (2019). Identification and functional analysis of micrornas and their targets related to eu-rubber biosynthesis in Eucommia ulmoides. (Yangling: Northwest A & F University). doi: 10.27409/d.cnki.gxbnu.2019.000016
Ylstra, B., Touraev, A., Moreno, R. M., Stöger, E., van Tunen, A. J., Vicente, O., et al. (1992). Flavonols stimulate development, germination, and tube growth of tobacco pollen. Plant Physiol. 100, 902–907. doi: 10.1104/pp.100.2.902
Yu, Z., Dong, W., Teixeira da Silva, J. ,. A., He, C., Si, C., and Duan, J. (2021). Ectopic expression of DoFLS1 from Dendrobium officinale enhances flavonol accumulation and abiotic stress tolerance in Arabidopsis thaliana. Protoplasma. 258, 803–815. doi: 10.1007/s00709-020-01599-6
Yue, L., Zhong, M., Kang, D., Qin, H., Li, H., Chai, X., et al. (2024). Genome-wide identification and characterization of flavonol synthase (FLS) gene family in Brassica vegetables and their roles in response to biotic and abiotic stresses. Sci. Hortic. 331, 113168. doi: 10.1016/j.scienta.2024.113168
Zeng, Y. (2024). Research of the cloning and function of chestnut CMFLS gene in drought resistance (Qinhuangdao: Hebei Normal University of Science and Technology). doi: 10.27741/d.cnki.ghbkj.2024.000152
Zhang, Y. (2020). Studies on the effect of MeJA on flavonoid accumulation in Euphorbia kansui and the function verification and expression regulation of EkFLS (flavonol synthase) gene (Xian: Northwest University). doi: 10.27405/d.cnki.gxbdu.2020.000366
Zhang, L. S., Ding, Y., Dong, H. M., Liu, L., Ji, J. Q., and Guo, C. H. (2025). Genome-wide analysis of alfalfa flavonol synthase genes and functional identification of MsFLS13 in response to cold stress. Plant Physiol. Biochem. 223, 109871. doi: 10.1016/j.plaphy.2025.109871
Zhang, L., Sun, Y., Ji, J., Zhao, W., Guo, W., Li, J., et al. (2023). Flavonol synthase gene MsFLS13 regulates saline-alkali stress tolerance in alfalfa. Crop J. 11, 1218–1229. doi: 10.1016/j.cj.2023.05.003
Zhang, Z., Yuan, X., Liu, J., Guo, C., Kang, C., Luo, X., et al. (2025). Identification of the walnut CHS and FLS gene families and the role of JrHY5 in flavonoid synthesis. Ind. Crops Products. 235, 121698. doi: 10.1016/j.indcrop.2025.121698
Zheng, X. L. (2019). Correlation analysis between flavonol synthetase genetic expression and flavono accumulation in loquat. Fujian Agric. Sci. Technology. 05), 1–6. doi: 10.13651/j.cnki.fjnykj.2019.05.001
Keywords: Eucommia ulmoides, FLS gene family, genome-wide identification, growth and development, abiotic stress, expression pattern analysis
Citation: Liu J, Cheng T, Wang L, Lian C, Ma R, Feng W, Lan J, Zhang B, Du Q, Kou J and Chen S (2025) Genome-wide identification and comprehensive analysis of EuFLS genes in Eucommia ulmoides reveals their roles in growth, development, and abiotic stress response. Front. Plant Sci. 16:1662635. doi: 10.3389/fpls.2025.1662635
Received: 09 July 2025; Accepted: 25 September 2025;
Published: 23 October 2025.
Edited by:
Zhiqiang Wu, Chinese Academy of Agricultural Sciences, ChinaReviewed by:
Ruoruo Wang, Guizhou Academy of Agricultural Sciences, ChinaZhanhu Cui, Nanyang Medical College, China
Copyright © 2025 Liu, Cheng, Wang, Lian, Ma, Feng, Lan, Zhang, Du, Kou and Chen. This is an open-access article distributed under the terms of the Creative Commons Attribution License (CC BY). The use, distribution or reproduction in other forums is permitted, provided the original author(s) and the copyright owner(s) are credited and that the original publication in this journal is cited, in accordance with accepted academic practice. No use, distribution or reproduction is permitted which does not comply with these terms.
*Correspondence: Jun Liu, bGl1anVuXzAzMjVAMTYzLmNvbQ==; Jiefeng Kou, amllZmVuZzE2QDEyNi5jb20=; Suiqing Chen, c3VpcWluZ2NoZW5AMTYzLmNvbQ==