Abstract
Extreme climate induced heat stress during the reproductive phase significantly reduces yield and seed quality in chickpea, a vital cool-season pulse crop. While chickpea plants deploy various biochemical and molecular mechanisms, including the production of protective compounds and heat shock proteins to cope with heat stress, the metabolomic and lipidomic bases of heat tolerance remain poorly understood. This study used untargeted metabolomics and lipidomics to identify key metabolites, lipids, and potential biomarkers in seeds of a heat-tolerant (PI518255) and a heat-sensitive (PI598080) chickpea genotypes exposed to heat stress (35 °C day/20 °C night) under controlled environments. Results from volcano plot analysis revealed that 65 metabolites and 131 lipids were upregulated, while 17 metabolites and 195 lipids were downregulated under heat stress. Heatmap analysis showed that the heat-tolerant genotype had elevated metabolites (Naringenin, Astilbin,1-O-Cinnamoyl-(6-arabinosylglucose), Hesperetin 7-glucoside, luteolin, and neoandrographolide) and lipids [dimethylphosphatidylethanolamine (dMePE), phosphatidylinositol phosphates (PIP), phosphatidylethanolamine (PE), phosphatidylcholines (PC), phosphatidylglycerol (PG), phosphatidylinositol (PI), diacylglycerol monogalactoside (DGMG) (36:5), monogalactosyldiacylglycerol (MGDG), phosphatidic acid (PA), phosphatidylmonomethylethanolamine (PMe), Biotinyl Phosphatidylethanolamine (BiotinylPE), (O-acyl)-omega-hydroxy fatty acids (OAHFAs)], which may serve as diagnostic biomarkers for heat tolerance. Pathway enrichment analysis (KEGG) identified several heat stress-responsive metabolic pathways, including the pentose phosphate pathway, pyruvate metabolism, citrate (TCA) cycle, glyoxylate and dicarboxylate metabolism, starch and sucrose metabolism, glycolysis/gluconeogenesis, and cysteine and methionine metabolism. Lipid metabolic pathways involving MGDG, glycerophosphocholine, PI, PA, PC, phosphatidylcholines, lysophosphatidylcholine (LPC), lysophosphatidylglycerol (LPG), glycerophosphoinositol, and phosphoglyceric acid were also significantly affected. Future research employing targeted metabolomics and lipidomics profiling could elucidate candidate markers to enhance seed yield and quality, and support breeding programs to develop heat- and climate- resilient chickpea cultivars.
Introduction
Considering the escalating climate variability and occurrence of extreme events, heat stress is emerging as a major constraint to productivity of crops (Firmansyah and Argosubekti, 2020). Climate projections suggest more frequent and intense heat waves (Han et al., 2022), posing a significant threat to food production (Kompas et al., 2024). Heat stress is known to decrease yields of cereal grains and legume crops (Prasad et al., 2017; Sher et al., 2024; Siddique et al., 2025). Chickpea (Cicer arietinum L.) is a critical source of plant-based protein and essential micronutrients, contributing to global food and nutrition security (Jha et al., 2024a) and vulnerable to heat stress (Jha et al., 2025a). India is the world’s leading producer (12.3 million tons, about 75% of global production in 2023; FAOSTAT, 2023) of chickpeas. Heat stress adversely affects cellular metabolism across all stages of chickpea development from germination to reproduction and maturity (Jha et al., 2014; Bhandari et al., 2020; Devi et al., 2022, 2023). The crop is particularly vulnerable during the flowering and seed-filling stages, where above optimum temperatures can drastically reduce seed yield and quality (Bhandari et al., 2020; Devi et al., 2023; Jha et al., 2024b; 2025b).Rising temperatures and extreme events have increased heat exposure during the reproductive phase of chickpea (Devasirvatham et al., 2012). Heat stress during reproductive phase impairs pollen viability, stigmatic function, fertilization, pod development, and seed filling (Rani et al., 2020; Bhandari et al., 2020). In turn, this leads to substantial losses in both yield and seed quality (Awasthi et al., 2024).
In addition to yield, heat stress alters the biochemical composition of seeds in many crops (Kumar et al., 2023a; Jha et al., 2024b). While the impact of heat on seed metabolites has been extensively studied in cereal crops (Kumar et al., 2023a; Han et al., 2025), there is limited research on the effects of heat stress on seed quality traits including metabolites and lipids in legumes, and particularly in chickpea. A few studies have reported stress-induced changes in amino acids, carbohydrates, lipids, proteins, and secondary metabolites in legumes such as soybean (Glycine max L. Merr., Das et al., 2017), grass pea (Lathyrus sativus, Aloui et al., 2023), lentil (Lens culinaris L., Sehgal et al., 2019), mung bean (Vigna radiata L. R. Wilczek, Priya et al., 2023; Jha et al., 2025c), and chickpea (Devi et al., 2023; Malviya et al., 2025; Ruan et al., 2025).
Plants, including chickpea, activate various biochemical and molecular defense strategies under heat stress, such as producing heat shock proteins and protective metabolites (Al-Whaibi, 2011; Hasanuzzaman et al., 2013). Advances in conventional breeding and genomics have enabled the identification of heat-tolerant genotypes and the discovery of important quantitative trait loci (QTLs) and genes associated with heat tolerance (Jha et al., 2021a, 2021; Kumar et al., 2023b; Mohanty et al., 2025). Functional genomics has further facilitated the identification of candidate genes with putative roles in the stress response (Mohanty et al., 2024). The emerging disciplines of metabolomics and lipidomics offer promising tools to explore the complex biochemical responses to abiotic stress. Metabolomics has already provided valuable insights into drought-responsive metabolic pathways in chickpea (Chaturvedi et al., 2024), while lipidomics is beginning to shed light on stress-induced lipid remodeling in plants (Higashi and Saito, 2019; Qian et al., 2023). However, the investigation and integration of metabolomics and lipidomics to study chickpea’s response to heat stress remains limited.
To address this gap, we conducted untargeted metabolomic and lipidomic profiling of seeds from two chickpea genotypes, one heat tolerant (PI518255) and a heat-sensitive (PI598080), under non-stress and heat stress conditions in controlled environments to identify metabolites and lipids associated with heat tolerance. The biomarkers identified here could serve as potential tools for screening heat tolerance in breeding programs and improving seed quality under rising temperature scenarios.
Materials and methods
Two contrasting chickpea genotypes, PI518255 (heat-tolerant) (Kaloki et al., 2019; Patre et al., 2023) and PI598080 (heat-sensitive) (Wang et al., 2006) were grown in a greenhouse under a 25°C (day)/15°C (night) controlled temperature regime for 60 days until flower initiation and then transferred to a growth chamber and subjected to 25°C/15°C (non stress) and heat stress regime of 35°C (day)/20°C (night). Seeds were sown in 20 cm diameter pots filled with potting soil (Fafard®3B Mix/Metro-Mix®830, SUNGRO Horticulture, Agawam, MA, USA). Each genotype was grown with three biological replicates, and each biological replicate included two individual plants. Seeds were harvested at maturity, with three seeds selected randomly from each plant for downstream analysis.
The growth chamber provided photosynthetically active radiation (400–700 nm) at 600 μmol m-² s-¹ using cool fluorescent lamps, with a 12 h photoperiod. Relative humidity averaged 60% (Jha et al., 2025c). Plants were watered regularly to maintain field capacity (saturated soil without runoff) and received nutrient supplementation every 7–14 days using 1/2 teaspoon of Miracle-Gro (24-8-16) per 4.5 L of water (Jha et al., 2025c). Temperature data were recorded using a HOBO® data logger (Onset Computer Corporation, USA) and are presented in Supplementary Figure S1.
Sample preparation for metabolite isolation
Physiologically matured seed samples were thawed on ice. A 100 mg sample was weighed and transferred into a tube. Then, 800 µL of 80% methanol was added. All samples were grounded on a grinder at 65 Hz for 180 seconds, vortexed, and sonicated for 30 minutes at 4°C.
Each sample was then kept at -20°C for 1 hour, vortexed for 30 seconds, and kept at 4°C for 30 minutes. The samples were then centrifuged at 12,000 rpm and 4°C for 15 minutes. The supernatant was transferred to a new tube and kept at -20°C for 1 hour, then centrifuged again at 12,000 rpm and 4°C for 15 minutes. Finally, 200 µL of the supernatant and 5 µL of DL-o-Chlorophenylalanine (0.14 mg/mL) were transferred to a vial for LC-MS analysis (Chianese et al., 2022; Wang et al., 2024).
Metabolite separation was performed using an ACQUITY ultra-performance liquid chromatography (UPLC) (Waters, Milford, MA, USA) system coupled with a Q Exactive MS (Thermo), with screening by electrospray ionization-mass spectrometry (ESI-MS). The liquid chromatography (LC) system, equipped with an ACQUITY UPLC HSS T3 column (100 × 2.1 mm, 1.8 µm), used a mobile phase of Solvent A (0.05% formic acid in water) and Solvent B (acetonitrile). The gradient elution was as follows: 0–1 min, 5% B; 1–12 min, 5%–95% B; 12–13.5 min, 95% B; 13.5–13.6 min, 95%–5% B; and 13.6–16 min, 5% B. The flow rate was 0.3 mL/min, the column temperature was 40°C, and the sample manager temperature was 4°C.
Mass spectrometry was conducted in both positive (ESI+) and negative (ESI–) electrospray ionization modes with the following settings: ESI+ mode—heater temperature (300°C), sheath gas flow rate (45 arb), auxiliary gas flow rate (15 arb), sweep gas flow rate (1 arb), spray voltage (3.0 kV), capillary temperature (350°C), and S-Lens RF level (30%); ESI–mode—heater temperature (300°C), sheath gas flow rate (45 arb), auxiliary gas flow rate (15arb), sweep gas flow rate (1 arb), spray voltage (3.2 kV), capillary temperature (350°C), and S-Lens RF level (60%) (Thermo Scientific Q Exactive™ Orbitrap MS).
Sample preparation for lipid isolation
Samples were thawed on ice. Fifty milligrams of each sample was weighed into a tube, and 1.5 mL of chloroform: methanol (2:1, v/v) solution was added. The mixture was then vortexed for 1 minute and ground for 180 seconds at 65 Hz. Following this, 0.5 mL of ultrapure water was added, and the samples were sonicated for 30 minutes at 4°C. The samples were then centrifuged for 10 minutes at 3,000 rpm and 4°C. The lower phase was carefully transferred to a new tube and dried under a stream of nitrogen. The dried extract was resuspended in 200 µL of an isopropyl alcohol: methanol (1:1, v/v) solution. Five microliters of lysophosphatidylcholine (12:0) (0.14 mg/mL) was added as an internal standard. Finally, the solution was centrifuged for 10 minutes at 12,000 rpm and 4°C, and the resulting supernatant was transferred for LC-MS analysis (Chianese et al., 2022; Wang et al., 2024).
Lipid separation was carried out using UPLC coupled with a Q Exactive mass spectrometer (Thermo Fisher Scientific). The UPLC system was equipped with an ACQUITY UPLC BEH C18 column (100 × 2.1 mm × 1.7 μm particle size; Waters, Milford, MA, USA). The mobile phases comprised solvent A (60% acetonitrile, 40% water, + 10 mM ammonium formate) and solvent B (10% acetonitrile, 90% isopropyl alcohol, 10 mM ammonium formate).The elution gradient was as follows: 0–1.0 min, 30% B; 1.0–10.5 min, gradient from 30–100% B; 10.5–12.5 min, 100% B; 12.5–12.51 min, gradient from 100–30% B; 12.51–16 min, 30% B. The flow rate was 0.3 mL/min, the column temperature was maintained at 40°C, and the auto sampler was kept at 4°C (Chianese et al., 2022; Wang et al., 2024).
Mass spectrometry was conducted in both positive (ESI+) and negative (ESI–) electrospray ionization modes with the following settings: ESI+ mode—heater temperature (300°C), sheath gas flow rate (45 arb), auxiliary gas flow rate (15 arb), sweep gas flow rate (1 arb), spray voltage (3.0 kV), capillary temperature (350°C), and S-Lens RF level (30%); ESI–mode—heater temperature (300°C), sheath gas flow rate (45 arb), auxiliary gas flow rate (15arb), sweep gas flow rate (1 arb), spray voltage (3.2 kV),capillary temperature (350°C), and S-Lens RF level (60%) (Thermo Scientific Q Exactive™ Orbitrap MS).
Statistical analysis
For metabolites, the raw data were acquired and aligned using the Compound Discoverer (3.0, Thermo) based on the m/z value and the retention time of the ion signals. Ions from both ESI- and ESI+ were merged and imported into the SIMCA-P program (version 14.1) for multivariate analysis. For lipid, raw LC-MS data were acquired and processed using LipidSearch software (Thermo Fisher Scientific), with ion alignment based on mass-to-charge ratio (m/z) and retention time. Ion data from ESI+ and ESI– modes were merged and imported into SIMCA-P (version 14.1) for multivariate statistical analysis. Principal components analysis (PCA) was used as an unsupervised method to visualize data distribution and identify potential outliers (Wold et al., 1987). Supervised regression modeling was then applied using Partial Least Squares Discriminant Analysis (PLS-DA) (Barker and Rayens, 2003) and Orthogonal Partial Least Squares Discriminant Analysis (OPLS-DA) to identify potential biomarkers. These biomarkers were then filtered and confirmed based on Variable Importance in Projection (VIP> 1.5) scores (Wold et al., 1993), fold-change thresholds (|log2FC|>1) {where FC=Average abundance in PI518255 Group under non stress/Average abundance in PI598080 Group under non stress} and FC=Average abundance in PI518255 Group under heat stress/Average abundance in PI598080 Group under heat stress}. Metabolites and lipids with log2 fold change of ≥ 1 (up-regulated) and ≤ -1 (down-regulated) and P-value < 0.05 (statistical significance) were considered as differentially expressed.
Identification of potential biomarkers
Key metabolites were identified by matching accurate mass and MS/MS fragmentation data against publicly available online databases, including the Human Metabolome Database (www.hmdb.ca), Chemspider (www.chemspider.com), and Mass Bank (www.massbank.jp). Raw LC-MS data were processed using LipidSearch software (Thermo Fisher Scientific) for lipid biomarker identification, with alignment based on m/z ratios and retention time. Where necessary, identities were further confirmed using authentic standards by comparing retention times and MS/MS fragmentation patterns with those of the candidate compounds.
Cluster analysis
Hierarchical clustering analysis (HCA) was performed using the complete linkage algorithm implemented in Cluster 3.0 (Stanford University).The results were visualized using the PheatmapR package (version 1.0.12, RaivoKolde). The HCA was based on metabolite ratios from two independent experiments using significantly altered metabolites. In the heatmaps, color intensity represents the degree of metabolite change, with red indicating increased levels and green indicating decreased levels relative to the mean.
Correlation network of metabolites
A correlation network was constructed using pathway and annotation data from the KEGG database (Kanehisa and Goto, 2000) and the MetaboAnalyst platform to explore the functional relationships among significantly altered metabolites. All significant metabolites (P < 0.05, as determined by MetaboAnalyst) were subjected to categorical annotation using the HMDB and KEGG databases to identify associated metabolic pathways, enzyme interactions, and related biological functions. Enriched pathways were visualized using dot plots and network diagrams, offering insights into the interconnected roles of key biomarkers in response to heat stress.
Results
Under non-stress condition (25°C day/15°C night), PI518255 had effective pods/plant (57) and seeds per plant (60) and PI598080 had (50 and 52, respectively). The other morpho-physiological trait values are given in Supplementary Table S1.
Under heat stress (35°C day/20°C night), the heat-tolerant genotype PI518255 produced more effective pods per plant (42) and seeds per plant (49) than the heat-sensitive genotype PI598080 (31 and 33, respectively). Correspondingly, PI518255 produced significantly higher seed yield per plant (5.2g) than PI598080 (3.5g), confirming its greater tolerance to heat stress (Figure 1).
Figure 1
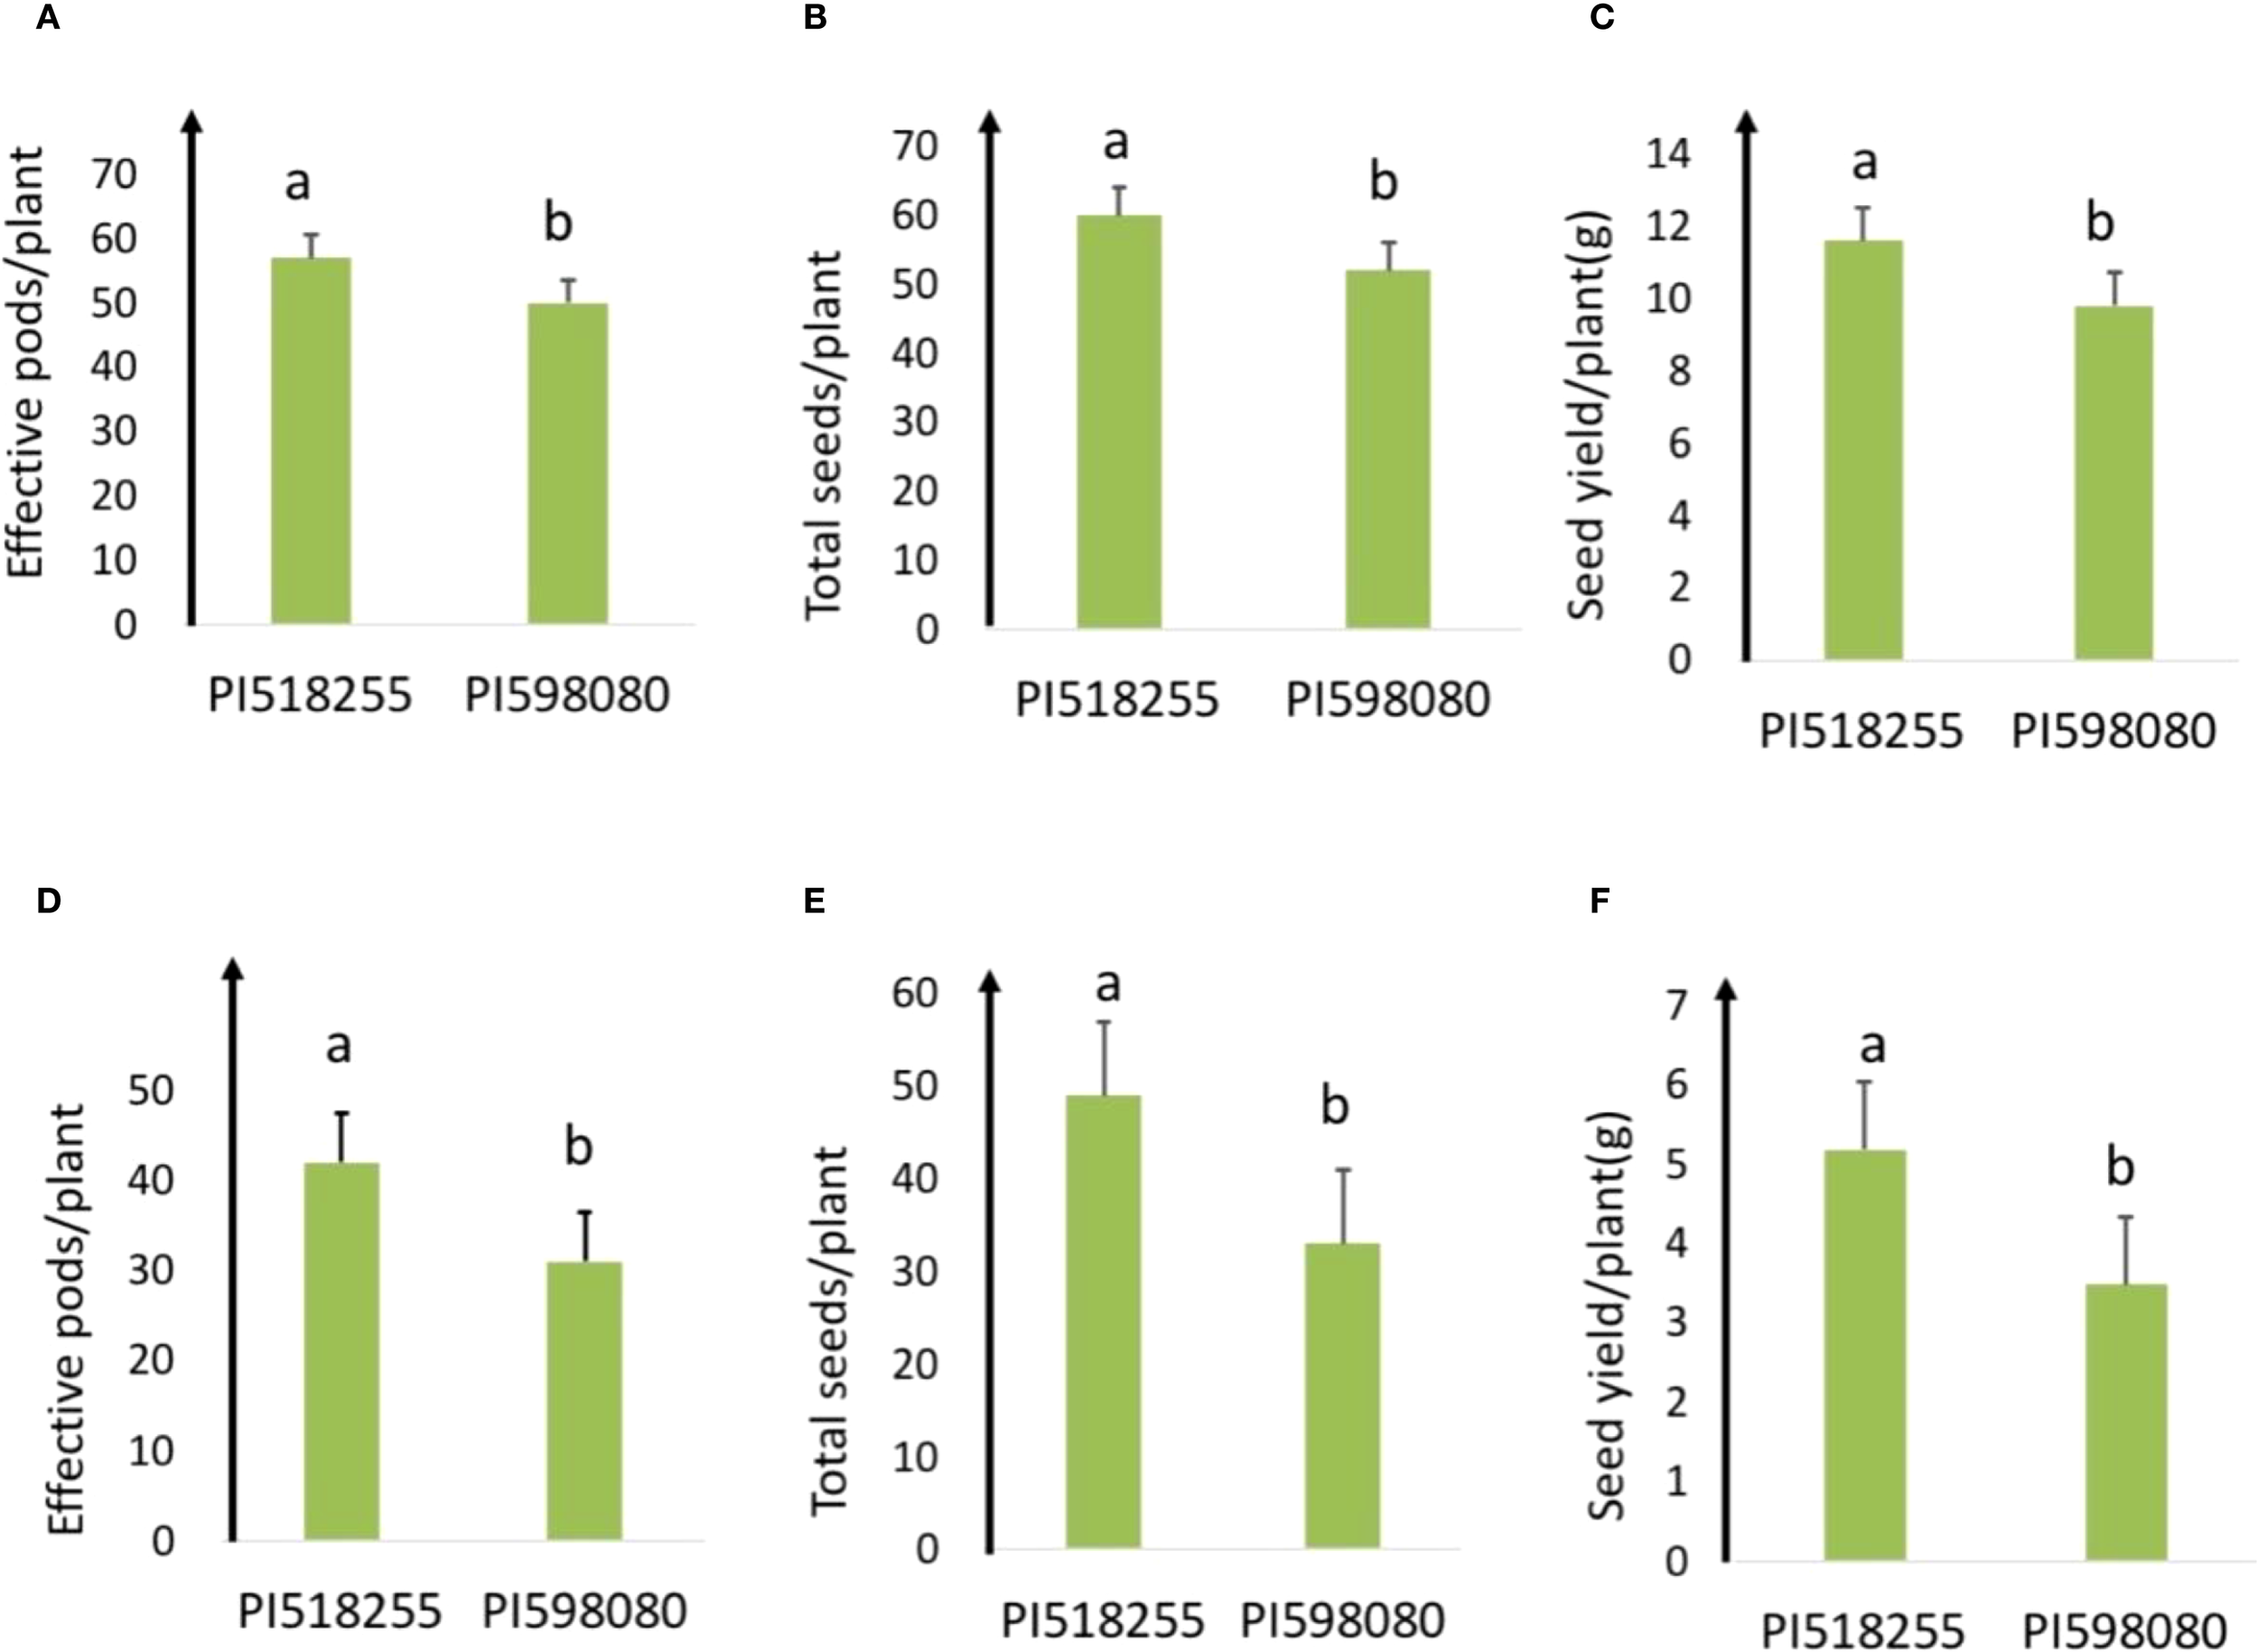
(A) Effective pods/plant; (B) total seeds/plant; and (C) seed yield/plant of PI 518255 and PI 598080 chickpea genotypes at 25°/15 °C(non-stress) and (D) effective pods/plant; (E) total seed/plant; and (F) seed yield/plant of PI 518255 and PI 598080 chickpea genotypes at 35°/20 °C under heat stress (HS) conditions. LSD (least significant difference) values (P < 0.05); Values are means + SE (standard error). (n = 5).
Multivariate statistical analysis
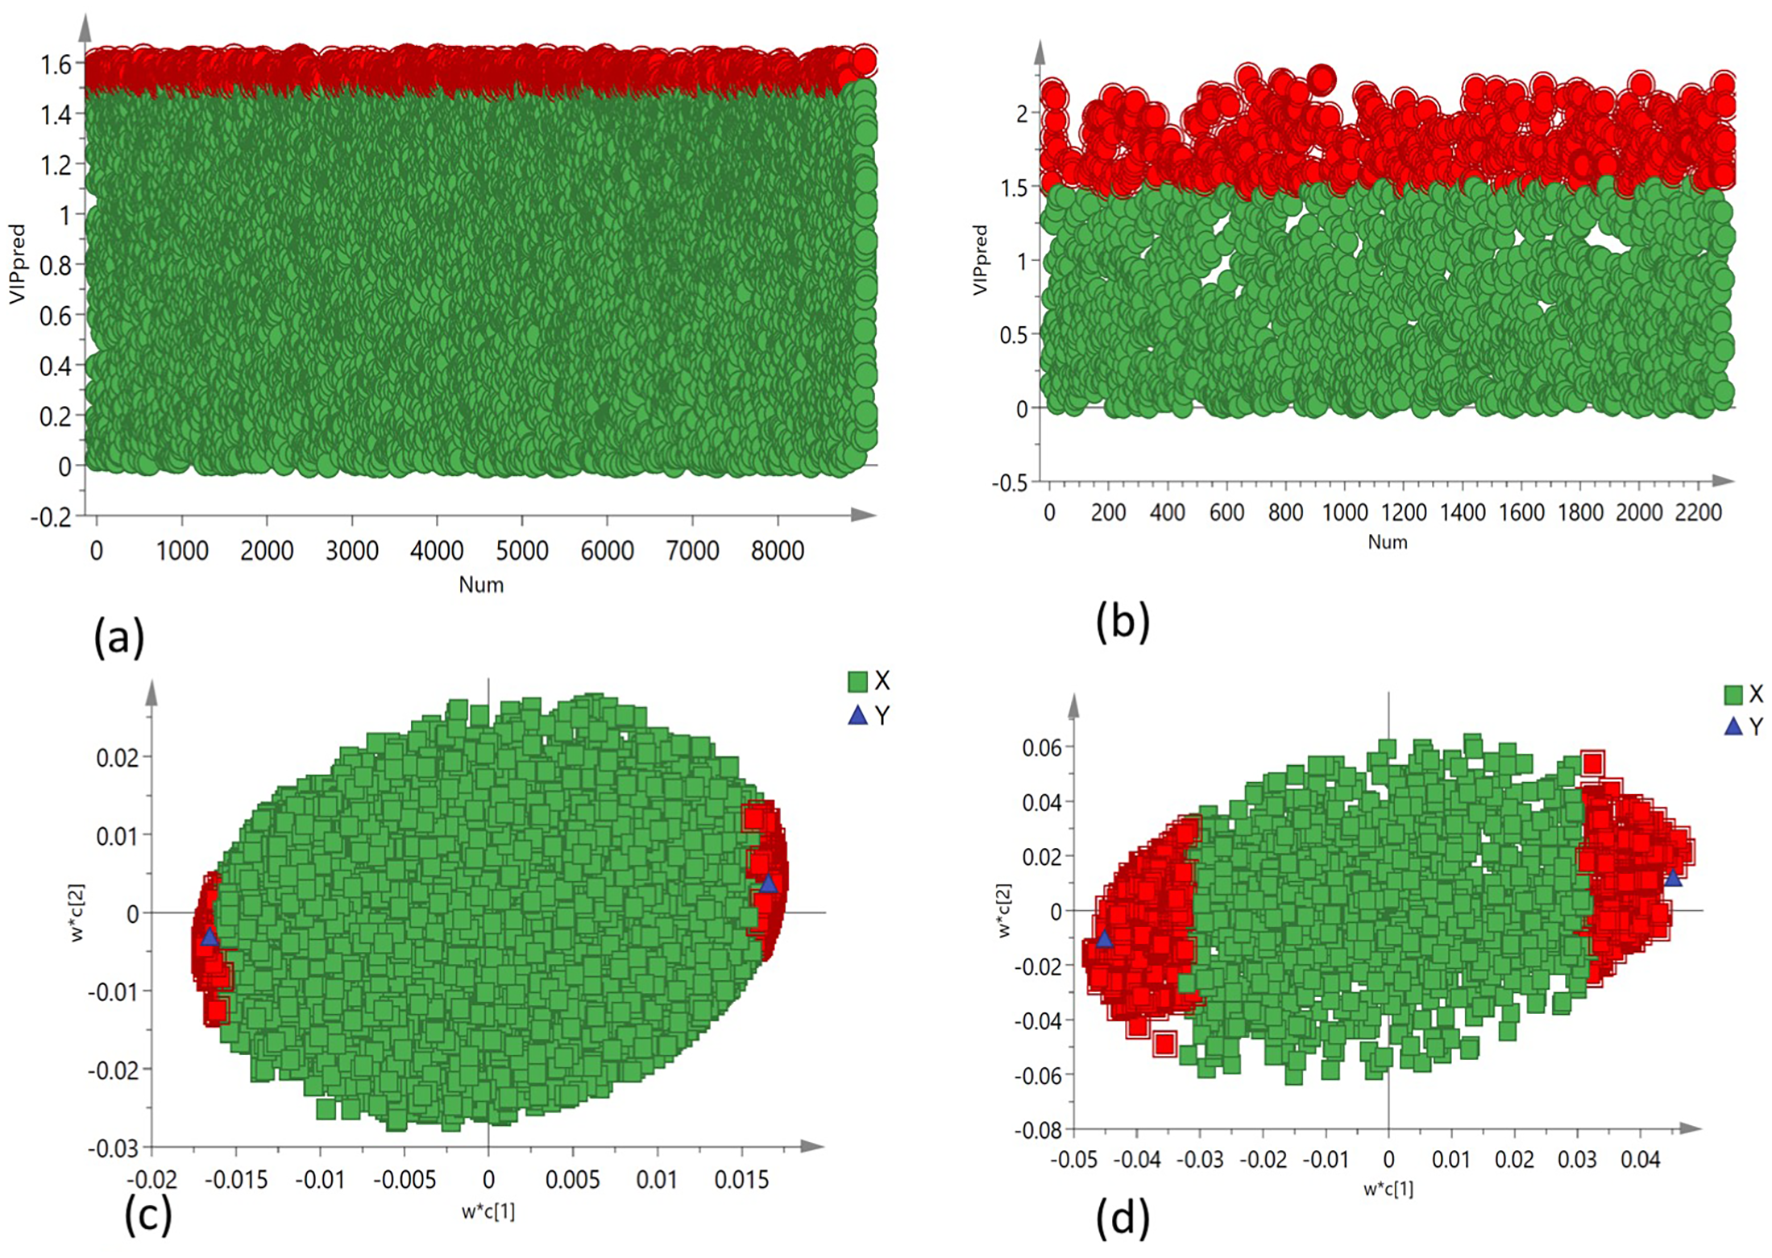
PCA was employed to assess the global variation in metabolomic and lipidomic datasets. The PCA score plots [Figure 2A (under non stress) and Figure 3A (under heat stress) for metabolites; Figure 4A (under non stress) and Figure 5A (under heat stress) for lipids] displayed clear grouping trends, reflecting separation between the two genotypes. To further refine group differences and minimize non-specific effects, supervised classification methods PLS-DA [Figure 2B (under non stress) and Figure 3B (under heat stress) for metabolites, Figure 4B (under non stress) and Figure 5B (under heat stress) for lipids] and OPLS-DA [Figure 2C (under non stress) and Figure 3C (under heat stress) for metabolites, Figure 4C (under non stress) and Figure 5C (under heat stress) for lipids] were applied. Both models revealed distinct separation between the genotypes under non stress and heat stress. Significantly altered metabolites and lipids were filtered using VIP values (VIP > 1.5). The distributions of both PI518255 and PI598080 are shown in Figure 6A (metabolites), Figure 6B (lipids) under non-stress, and Figures 7A (metabolites), Figures 7B (lipids) under heat stress conditions. Corresponding loading plots (Figures 6C, D) under non-stress and (Figures 7C, D) under heat stress highlight the most influential features, with red boxes indicating key discriminative metabolites and lipids.
Figure 2
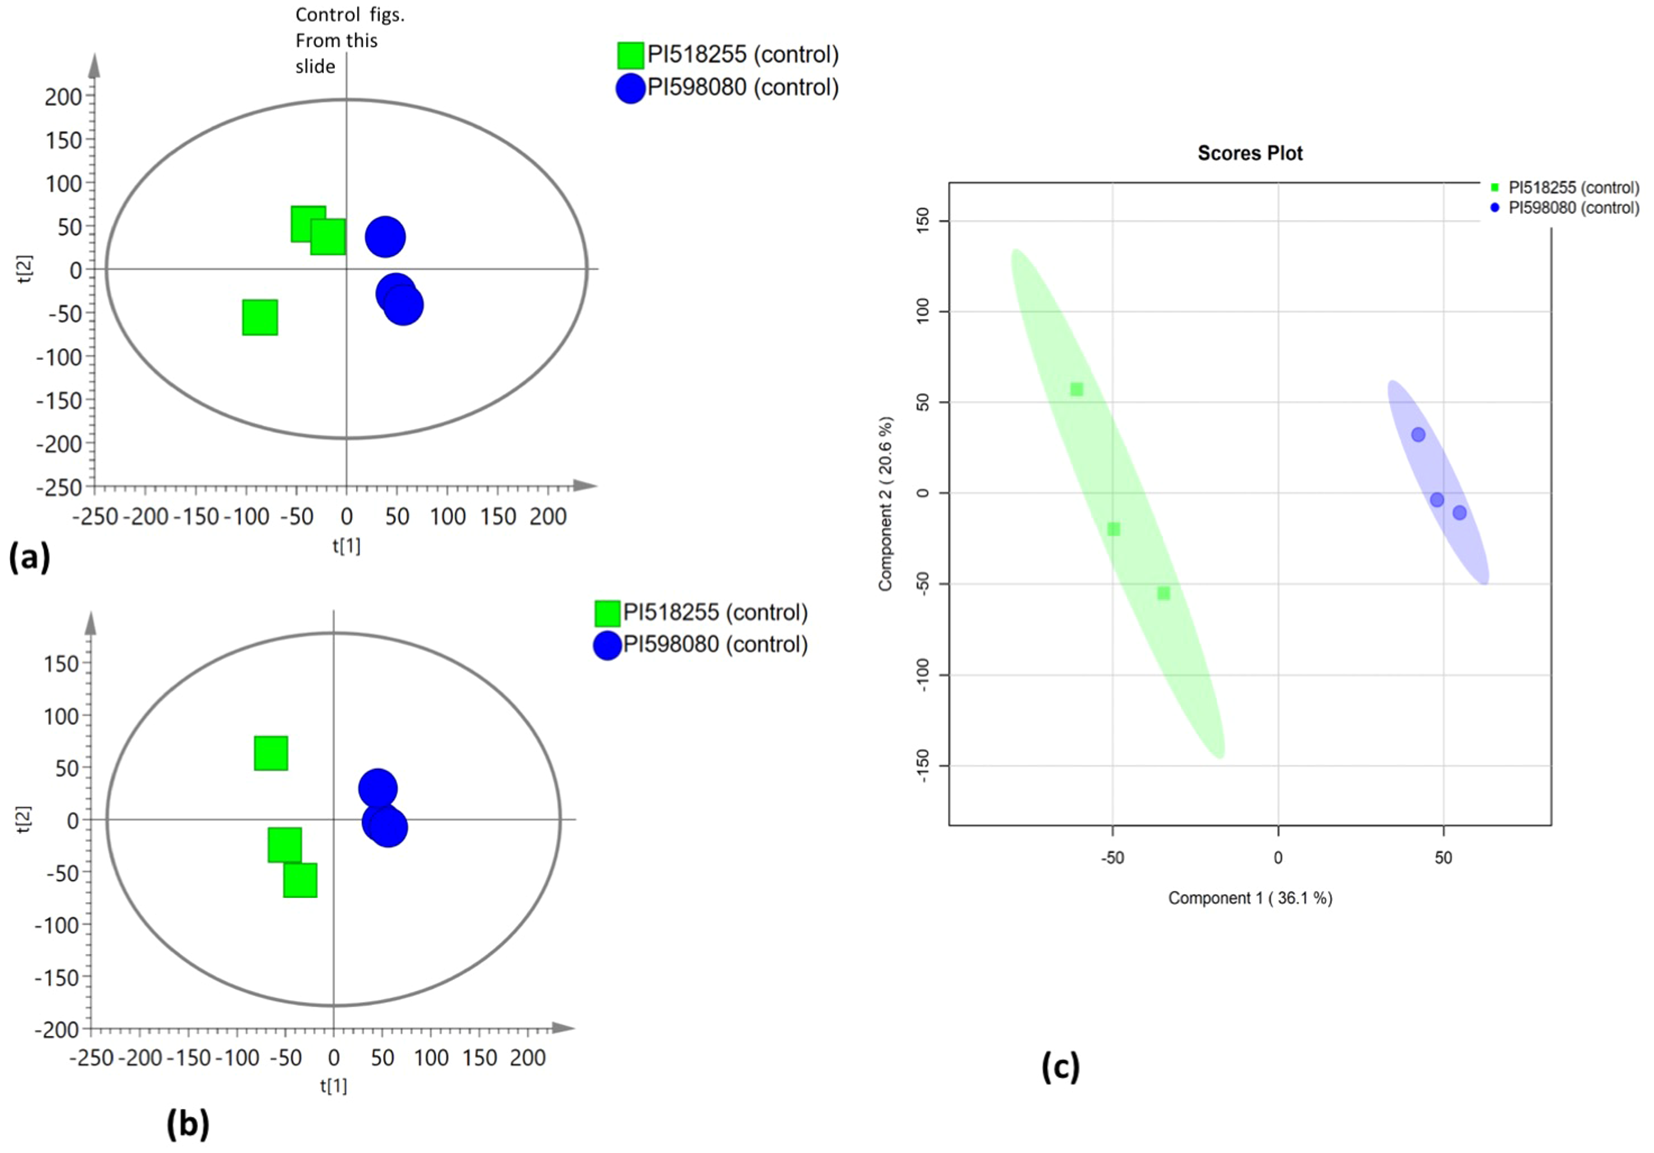
(A) The scores scatter plot of PCA model for the identified metabolites under non stress; (B) The scores scatter plot of PLSDA model for the identified metabolites under non stress; and (C) The scores scatter plot of OPLS-DA model for the identified metabolites under non stress.
Figure 3
![Three scatter plots showing scores of two groups, PI518255 (red diamonds) and PI598080 (yellow triangles), under heat stress. Plots A and B depict components t[1] and t[2] with circles indicating confidence limits. Plot C shows components 1 and 2. Each plot indicates clustering patterns of the groups.](https://www.frontiersin.org/files/Articles/1668751/xml-images/fpls-16-1668751-g003.webp)
(A) The scores scatter plot of PCA model for the identified metabolites under heat stress; (B) The scores scatter plot of PLSDA model for the identified metabolites under heat stress; and (C) The scores scatter plot of OPLS-DA model for the identified metabolites under heat stress.
Figure 4
![Graphs A and B display two-dimensional scatter plots with axes t[1] and t[2], featuring green squares for PI518255 and blue circles for PI598080. Plot C is a scores plot with PC1 and PC2 axes, showing similar color coding for two groups with ellipses indicating data distribution.](https://www.frontiersin.org/files/Articles/1668751/xml-images/fpls-16-1668751-g004.webp)
The scores scatter plots of (A) PCA model for the identified lipids under non-stress; (B) PLSDA model for the identified lipids under heat stress; and (C) OPLS-DA model for the identified lipids under non-stress.
Figure 5
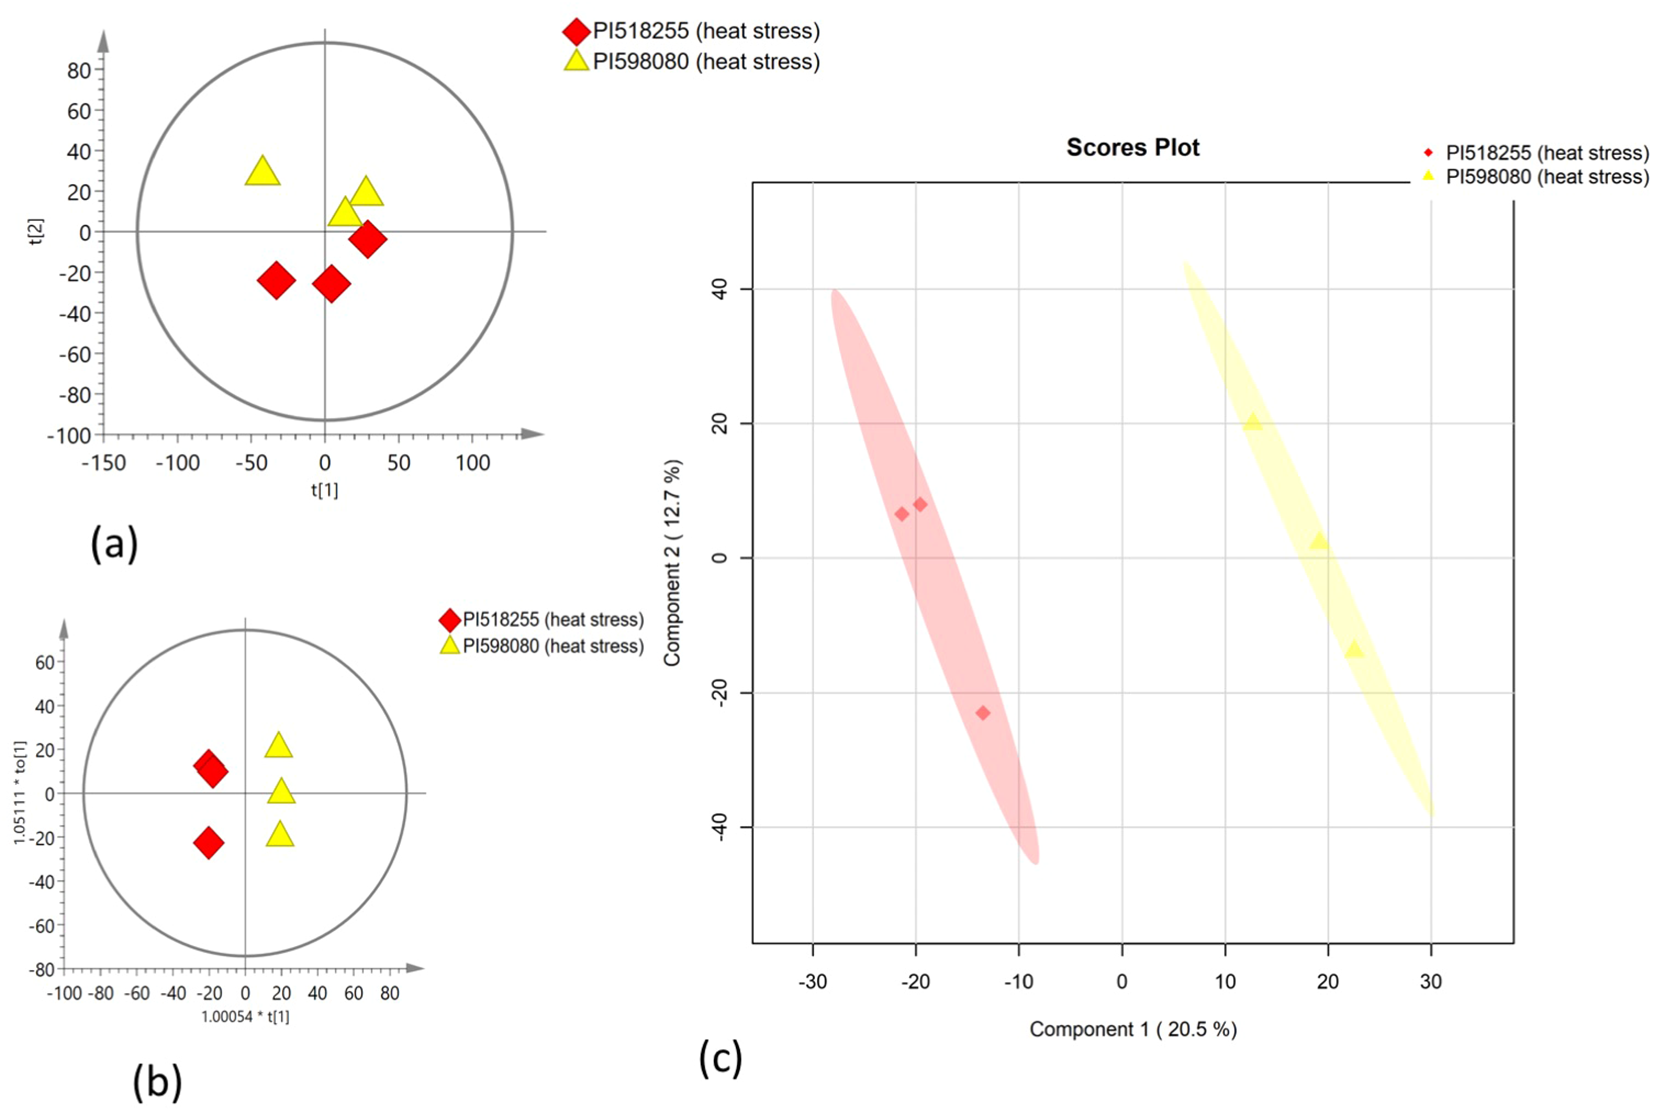
The scores scatter plots of (A) PCA model for the identified lipids under heat stress; (B) PLSDA model for the identified lipids under heat stress; and (C) OPLS-DA model for the identified lipids under heat stress.
Figure 6
![Four scatter plots labeled A to D. Plots A and B display data points along the VIPpred axis, with green and red dots representing different categories across a numerical range. Plots C and D show elliptical data distributions on the w*c[1] and w*c[2] axes, with green squares and red squares representing data points, while blue triangles denote another category. The plots highlight distinctions between data categories using colors and shapes.](https://www.frontiersin.org/files/Articles/1668751/xml-images/fpls-16-1668751-g006.webp)
The distribution of (A) VIP values (VIP > 1.5) for the metabolites under non-stress; (B) VIP values (VIP > 1.5) for the lipids under non stress; loading plot of (C) PLS-DA model, the metabolites with red box were labeled as significant compounds (VIP > 1.5); and (D) PLS-DA model, the lipids with red box were labeled as significant compounds (VIP > 1.5).
Figure 7
The distribution of (A) VIP values (VIP > 1.5) for the metabolites under heat stress; (B) VIP values (VIP > 1.5) for the lipids under heat stress; loading plot of (C) PLS-DA model, the metabolites with red box were labeled as significant compounds (VIP > 1.5); and (D) PLS-DA model, the lipids with red box were labeled as significant compounds (VIP > 1.5).
Single variable analysis
Volcano plot analysis (Figures 8A, B) of seeds from heat-tolerant and heat-sensitive genotypes under non-stress conditions revealed significant differences in metabolite and lipid levels. Specifically, the heat-tolerant genotypes had 28 upregulated and 58 downregulated metabolites, as well as 77 upregulated and 93 downregulated lipids (all at p ≤ 0.05) compared to the heat-sensitive genotype.
Figure 8
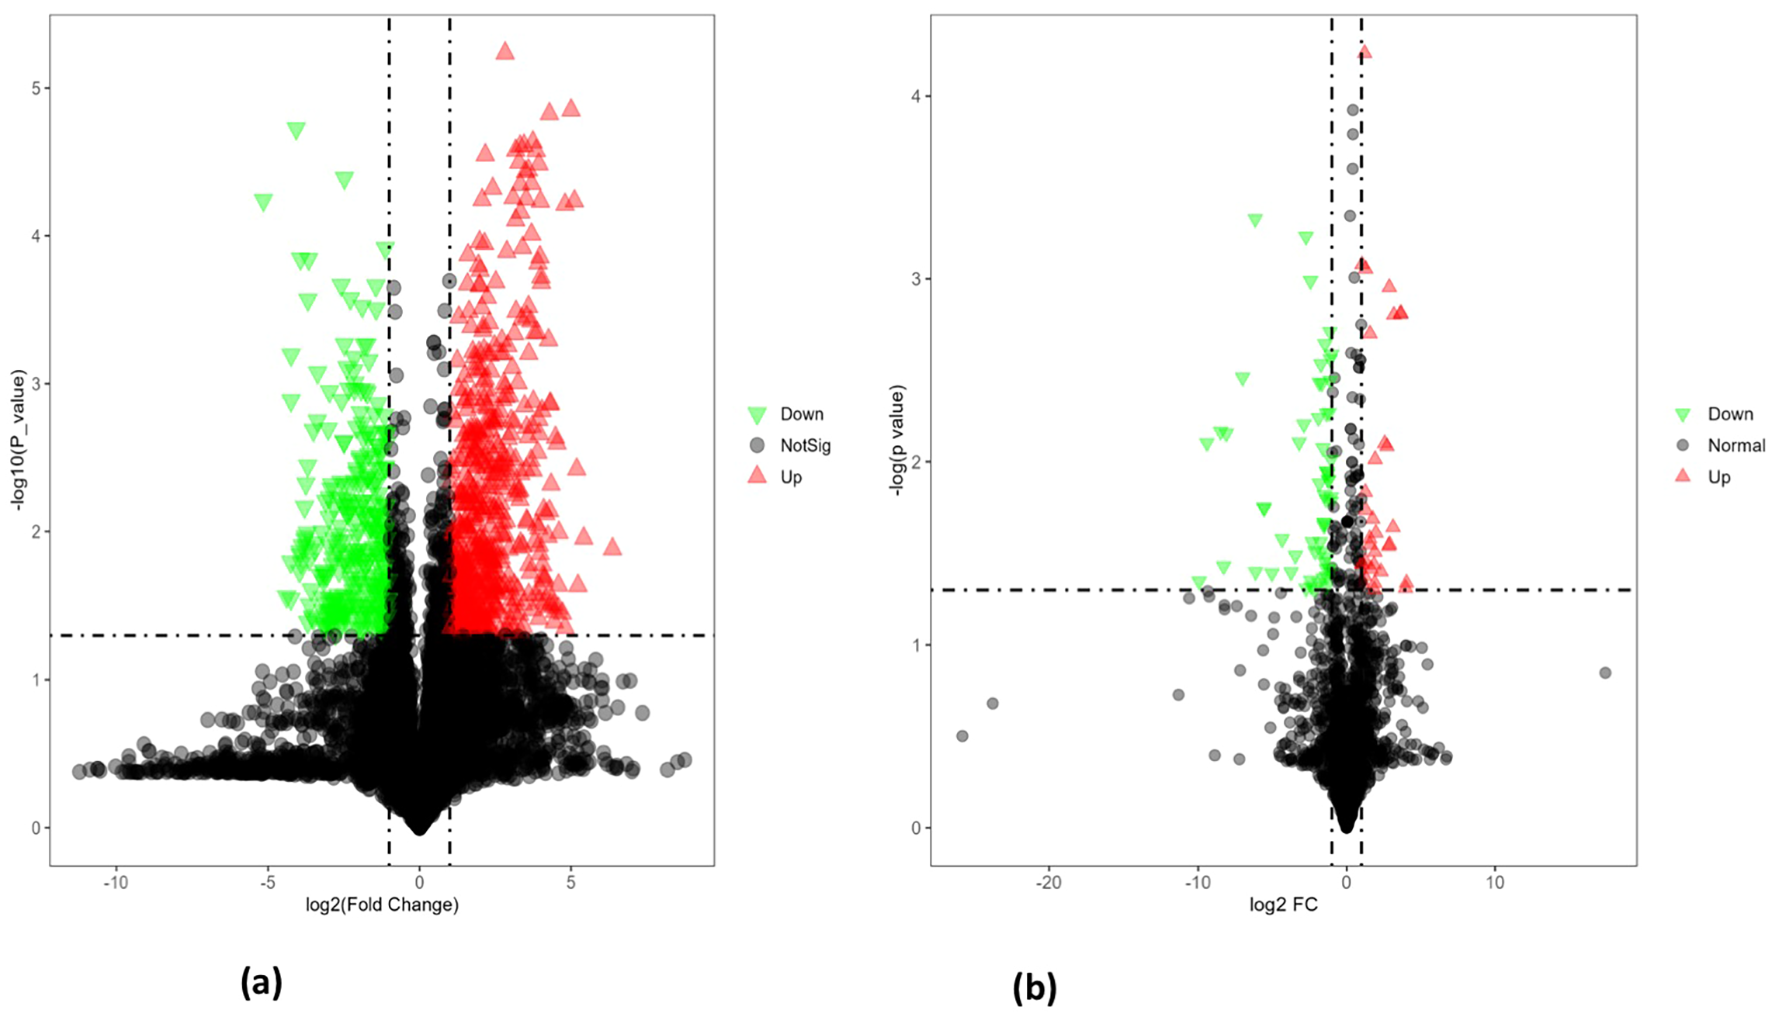
(A) The volcano plot for differentially expressed metabolites in PI518255 compared to PI598080 under non-stress condition. Red represents the up-regulated metabolites in PI518255 compared with PI598080, green represents the downregulated metabolites in PI518255 compared with PI598080, and gray represents the metabolites with no difference between PI518255 and PI598080, (B) volcano plot for differentially expressed lipids in PI518255 and PI598080. Red represents the up-regulated lipids in PI518255 compared with PI598080, green represents the downregulated lipids in PI518255 compared with PI598080, and gray represents the lipids with no difference between PI518255 and PI598080.
Similarly, under heat stress conditions (Figures 9A, B), the heat-tolerant genotypes showed 65 upregulated and 17 downregulated metabolites, along with 131 upregulated and 195 downregulated lipids compared to the heat-sensitive genotype.
Figure 9
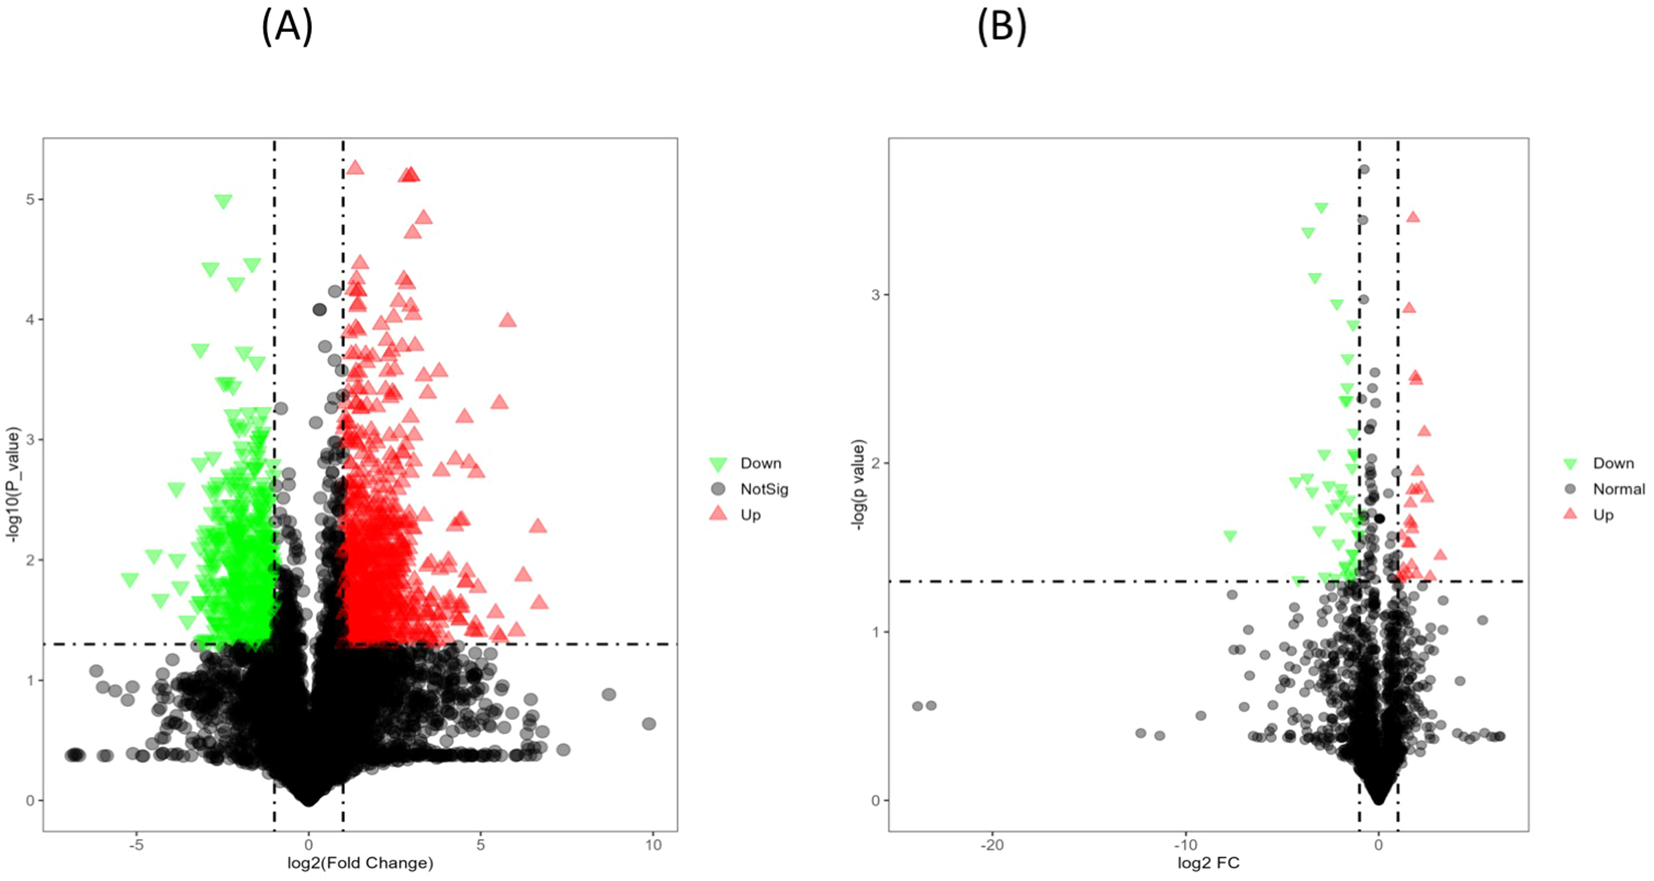
(A) The volcano plot for differentially expressed metabolites in PI518255 compared to PI598080 under heat-stress condition. Red represents the up-regulated metabolites in PI518255 compared with PI598080, green represents the downregulated metabolites in PI518255 compared with PI598080, and gray represents the metabolites with no difference between PI518255 and PI598080, (B) Volcano plot for differentially expressed lipids in PI518255 and PI598080. Red represents the up-regulated lipids in PI518255 compared with PI598080, green represents the downregulated lipids in PI518255 compared with PI598080, and gray represents the lipids with no difference between PI518255 and PI598080.
Metabolome profiling
Under non stress condition a total of 1,671 metabolites were detected in PI518255 and PI598080 seeds. Among them 28 were upregulated and 58 were downregulated in PI518255. Notable significantly upregulated metabolites included Moracetin, γ-Glutamylcysteinylγ-glutamylcysteinylglycine, N-(N-Acetylmethionyl) dopamine, Tricin 7-neohesperidoside and Pentacarboxyl porphyrinogen III [(VIP > 1.5, fold-change (|log2 FC| > 1), Student’s t-test (p < 0.05)]. The significantly down regulated metabolites included were Luteolin, Quercitrin, 5-Hydroxyferulic acid, Kaempferol and Diosmetin (Table 1; Supplementary Table S2).
Table 1
| SL. NO. | RT [min] | Molecular weight | m/z | HMDB_ID | Compound name | Chemical formula | Log2(FC) | T-Test | VIP | Regulation |
|---|---|---|---|---|---|---|---|---|---|---|
| 1 | 5.681 | 286.04854 | 285.04127 | HMDB0005801 | Kaempferol | C15H10O6 | -2.593 | 0.044 | 1.61 | DR |
| 2 | 6.006 | 286.0487 | 285.04142 | HMDB0005800 | Luteolin | C15H10O6 | -2.783 | 0.039 | 1.59 | DR |
| 3 | 6.006 | / | 429.08409 | HMDB0033751 | Quercitrin | C21H20O11 | -2.978 | 0.030 | 1.60 | DR |
| 4 | 4.684 | 788.20683 | 787.19955 | HMDB0040487 | Moracetin | C33H40O22 | 5.112 | 0.000 | 1.70 | UR |
| 5 | 4.9 | / | 419.09924 | HMDB0035484 | 5-Hydroxyferulic acid | C10H10O5 | -2.670 | 0.011 | 1.66 | DR |
| 6 | 6.661 | / | 371.1263 | HMDB0244495 | N-(N-Acetylmethionyl)dopamine | C15H22N2O4S | 3.438 | 0.031 | 1.67 | UR |
| 7 | 1.617 | 539.13702 | 538.12975 | CSID28184670 | γ-Glutamylcysteinylγ-glutamylcysteinylglycine | C18H29N5O10S2 | 3.815 | 0.027 | 1.64 | UR |
| 8 | 5.442 | 638.18815 | 637.18087 | HMDB0037462 | Tricin 7-neohesperidoside | C29H34O16 | 3.718 | 0.034 | 1.60 | UR |
| 9 | 6.392 | 700.2767 | 699.26943 | HMDB0001957 | Pentacarboxyl porphyrinogen III | C37H40N4O10 | 3.654 | 0.019 | 1.64 | UR |
| 10 | 7.603 | 300.06291 | 301.07018 | HMDB0029676 | Diosmetin | C16H12O6 | -4.97 | 0.035 | 1.66 | DR |
List of selected differentially expressed metabolite in the chickpea seeds of PI518255 compared to PI598080 under non stress condition.
DR, downregulated; UR, upregulated.
A total of 1,671 metabolites were detected in PI518255 and PI598080 seeds under heat stress. Among these, 82 showed significant differential expression: 65 upregulated and 17 downregulated in PI518255. Notably upregulated metabolites included cinnamyl alcohol, leucyl-threonine, hesperetin 7-glucoside, 1-O-cinnamoyl-(6-arabinosylglucose), 3-feruloylquinic acid, moracetin, luteolin [(VIP > 1.5, fold-change (|log2 FC| >1), Student’s t-test (p < 0.05)]. In contrast, significantly downregulated metabolites included N-acetylphenylalanine, Frangulanine, Cortolone-3-glucuronide, Apigenin, and Olmesartan medoxomil (Table 2; Supplementary Table S3).
Table 2
| SL. NO. | RT [min] | Molecular weight | m/z | HMDB_ID | Compound name | Chemical formula | Log2(FC) | T-Test | VIP | Regulation |
|---|---|---|---|---|---|---|---|---|---|---|
| 1 | 4.764 | 368.11543 | 367.11 | HMDB0030669 | 3-Feruloylquinic acid | C17H20O9 | 2.99 | 0.0212 | 1.54 | UR |
| 2 | 5.016 | / | 431.1 | HMDB0033850 | Astilbin | C21H22O11 | 3.04 | 0.0061 | 1.51 | UR |
| 3 | 4.755 | 442.15229 | 441.15 | HMDB0030294 | 1-O-Cinnamoyl-(6-arabinosylglucose) | C20H26O11 | 4.87 | 0.0019 | 1.6 | UR |
| 4 | 4.747 | / | 509.13 | HMDB0030747 | Hesperetin 7-glucoside | C22H24O11 | 4.42 | 0.0227 | 1.53 | UR |
| 5 | 7.945 | / | 525.27 | HMDB0255516 | Neoandrographolide | C26H40O8 | 3.15 | 0.0016 | 1.51 | UR |
| 6 | 4.724 | 696.1584 | 695.15 | HMDB0303154 | Luteolin 7-O-(6''-O-malonyl)-diglucoside | C30H32O19 | 3 | 0.0457 | 1.57 | UR |
| 7 | 4.684 | 788.20683 | 787.2 | HMDB0040487 | Moracetin | C33H40O22 | 2.46 | 0.0112 | 1.56 | UR |
| 8 | 6.005 | 270.05249 | 271.06 | HMDB0002124 | Apigenin | C15H10O5 | -2 | 2.82E-02 | 1.61 | DR |
| 9 | 4.115 | 558.21803 | 557.21 | HMDB0255956 | Olmesartan medoxomil | C29H30N6O6 | -3.56 | 0.0105 | 1.56 | DR |
| 10 | 6.844 | / | 541.27 | HMDB0010320 | Cortolone-3-glucuronide | C27H42O11 | -2.7 | 0.0327 | 1.51 | DR |
| 11 | 5.109 | 207.09016 | 206.08 | HMDB0000512 | N-Acetylphenylalanine | C11H13NO3 | -1.65 | 0.001 | 1.61 | DR |
| 12 | 8.251 | / | 545.33 | HMDB0030199 | Frangulanine | C28H44N4O4 | -1.52 | 0.0088 | 1.53 | DR |
List of selected differentially expressed metabolite in the chickpea seeds of PI518255 compared to PI598080 under heat tress condition.
DR, downregulated; UR, upregulated.
Under non stress condition a total of 10,846 lipids were detected, with 170 showing significant differential expression. Of these lipids, 77 were found to be upregulated in PI518255 and 93 were down regulated in PI518255. Notably upregulated lipids were DG (36:3e)+NH4, PE (36:2)+H, MG(16:0)+H, and PE(18:0_20:1)+Na. The notable down regulated lipids included MGDG (27:5e)-H, PA (38:1_11:4)-H, PEt(18:3_14:2)-H (See Table 3; Supplementary Table S4).
Table 3
| SL.NO | LipidIon | Lipid group | Class | FattyAcid | FA1 | FA2 | FA3 | CalcMz | ObsMz | Rt | IonFormula | Log2(FC) | T-Test | VIP | Regulation |
|---|---|---|---|---|---|---|---|---|---|---|---|---|---|---|---|
| 1 | MGDG(27:5e)-H | MGDG(27:5e)-H | MGDG | (27:5e) | (27:5e) | 635.416459 | 635.41646 | 3.3195 | C36 H59 O9 | -3.20 | 0.008 | 1.67 | DR | ||
| 2 | PA(38:1_11:4)-H | PA(49:5)-H | PA | (38:1_11:4) | (38:1) | (11:4) | 875.653532 | 875.65353 | 11.8795 | C52 H92 O8 N0 P1 | -2.43 | 0.001 | 1.72 | DR | |
| 3 | PEt(18:3_14:2)-H | PEt(32:5)-H | PEt | (18:3_14:2) | (18:3) | (14:2) | 665.418782 | 665.41878 | 7.178784956 | C37 H62 O8 N0 P1 | -8.49 | 0.007 | 1.91 | DR | |
| 4 | PS(38:6+3O)-H | PS(38:6+3O)-H | PS | (38:6+3O) | (38:6+3O) | 854.482506 | 854.48251 | 7.5255 | C44 H73 O13 N1 P1 | -1.10 | 0.003 | 1.90 | DR | ||
| 5 | DG(36:3e)+NH4 | DG(36:3e)+NH4 | DG | (36:3e) | (36:3e) | 622.576885 | 622.576374 | 11.7945 | C39 H76 O4 N1 | 4.92 | 0.00 | 1.99 | UR | ||
| 6 | PE(36:2)+H | PE(36:2)+H | PE | (36:2) | (36:2) | 744.553783 | 744.55378 | 7.986 | C41 H79 O8 N1 P1 | 2.80 | 0.02 | 1.88 | UR | ||
| 7 | PS(36:1)+H | PS(36:1)+H | PS | (36:1) | (36:1) | 790.559263 | 790.55926 | 8.074 | C42 H81 O10 N1 P1 | -2.17 | 0.01 | 1.89 | DR | ||
| 8 | TG(16:0_16:1_20:1)+NH4 | TG(52:2)+NH4 | TG | (16:0_16:1_20:1) | (16:0) | (16:1) | 876.801465 | 876.79872 | 7.941 | C55 H106 O6 N1 | 3.36 | 0.00 | 1.94 | UR | |
| 9 | MG(16:0)+H | MG(16:0)+H | MG | (16:0) | (16:0) | 331.284286 | 331.28429 | 5.8685 | C19 H39 O4 | 2.19 | 0.01 | 1.51 | UR | ||
| 10 | PE(18:0_20:1)+Na | PE(38:1)+Na | PE | (18:0_20:1) | (18:0) | (20:1) | 796.582678 | 796.58268 | 9.016 | C43 H84 O8 N1 P1 Na1 | 3.24 | 0.00 | 2.08 | UR |
List of selected differentially expressed lipids in seeds of PI518255 compared to PI598080 under non stress condition.
MGDG, Monogalactosyldiacylglycerol; PA, phosphatidic acid; PE, phosphatidylethanolamine; Pet, Phosphatidylethanol; PS, phosphatidylserine; DG, Diacylglycerol; PE, phosphatidylethanolamine; TG, triglyceride; MG, monoacylglycerol; DR, downregulated; UP, upregulated.
Under heat stress condition of the significantly detected lipids, 326 showed significant differential expression under heat stress. Of these, 131 were upregulated in PI518255, and while 195 were downregulated in PI518255. Notable upregulated lipids included MGDG (34:5), PA(38:1), PC(20:0), PE (20:0), PI(18:1), PS, and dimethylphosphatidylethanolamine (dMePE), whereas notable downregulated lipids included BiotinylPE, MGDG(45:14e),OAHFA (12:0), PA(49:5), PC (29:2CHO), PG(29:1), PIP (18:2), PMe (48:5), and PS (18:1) (Table 4; Supplementary Table S5).
Table 4
| Sl.no. | LipidIon | Lipidgroup | Class | FattyAcid | FA1 | FA2 | FA3 | CalcMz | ObsMz | Rt | IonFormula | Log2(FC) | T-Test | VIP | Regulation |
|---|---|---|---|---|---|---|---|---|---|---|---|---|---|---|---|
| 1 | MGDG(45:14e)-H | MGDG(45:14e)-H | MGDG | (45:14e) | (45:14e) | 869.557 | 869.56 | 11.076 | C54 H77 O9 | -4.18 | 0.05 | 1.81 | DR | ||
| 2 | BiotinylPE(14:2_16:0)-H | BiotinylPE(30:2)-H | BiotinylPE | (14:2_16:0) | (14:2) | (16:0) | 884.523 | 884.52 | 8.481 | C45 H79 O10 N3 S1 P1 | -2.09 | 0.03 | 1.83 | DR | |
| 3 | PMe(48:5)-H | PMe(48:5)-H | PMe | (48:5) | (48:5) | 875.654 | 875.65 | 11.902 | C52 H92 O8 N0 P1 | -2.97 | 0 | 2.06 | DR | ||
| 4 | PIP(18:2_11:4)-H | PIP(29:6)-H | PIP | (18:2_11:4) | (18:2) | (11:4) | 835.344 | 835.34 | 0.7015 | C38 H61 O16 N0 P2 | -2.44 | 0.02 | 1.88 | DR | |
| 5 | PC(29:2CHO)+HCOO | PC(29:2CHO)+HCOO | PC | (29:2CHO) | (29:2CHO) | 746.461 | 746.46 | 5.1525 | C38 H69 O11 N1 P1 | -3.7 | 0.01 | 1.92 | DR | ||
| 6 | MGDG(45:6e)-H | MGDG(45:6e)-H | MGDG | (45:6e) | (45:6e) | 885.683 | 885.68 | 11.865 | C54 H93 O9 | 3.19 | 0.04 | 2.19 | UR | ||
| 7 | PI(18:1e)-H | PI(18:1e)-H | PI | (18:1e) | (18:1e) | 597.305 | 597.3 | 2.177 | C27 H50 O12 N0 P1 | 2.51 | 0.02 | 2.04 | UR | ||
| 8 | LPG(18:1)-H | LPG(18:1)-H | LPG | (18:1) | (18:1) | 509.288 | 509.29 | 2.4095 | C24 H46 O9 N0 P1 | 2.02 | 0.01 | 2.09 | UR | ||
| 9 | DG(32:2e)+H | DG(32:2e)+H | DG | (32:2e) | (32:2e) | 551.5 | 551.5 | 10.82 | C35 H67 O4 | 4.12 | 0 | 2.15 | UR | ||
| 10 | PS(36:4+4O)-H | PS(36:4+4O)-H | PS | (36:4+4O) | (36:4+4O) | 846.477 | 846.48 | 9.864 | C42 H73 O14 N1 P1 | 2.36 | 0.01 | 1.93 | UR |
List of selected differentially expressed lipids in seeds of PI518255 compared to PI598080 under heat tress condition.
MGDG, Monogalactosyldiacylglycerol; BiotinylPE, Biotinyl Phosphatidylethanolamine; PC, phosphatidylcholine; PMe, phosphatidylmonomethylethanolamine; PIP phosphatidylinositol phosphates; PI, phosphatidylinositol PI; LPG, lysophosphatidylglycerol; DG, Diacylglycerol; PS, phosphatidylserine; DR, downregulated; UP, upregulated.
KEGG based pathway enrichment analysis of significantly altered metabolites revealed major heat stress-responsive pathways in the heat-tolerant genotype. These included the pentose phosphate pathway, TCA cycle, pyruvate metabolism, starch and sucrose metabolism, glyoxylate and dicarboxylate metabolism, glycolysis and gluconeogenesis, as well as cysteine and methionine metabolism (Figures 10, 11).
Figure 10
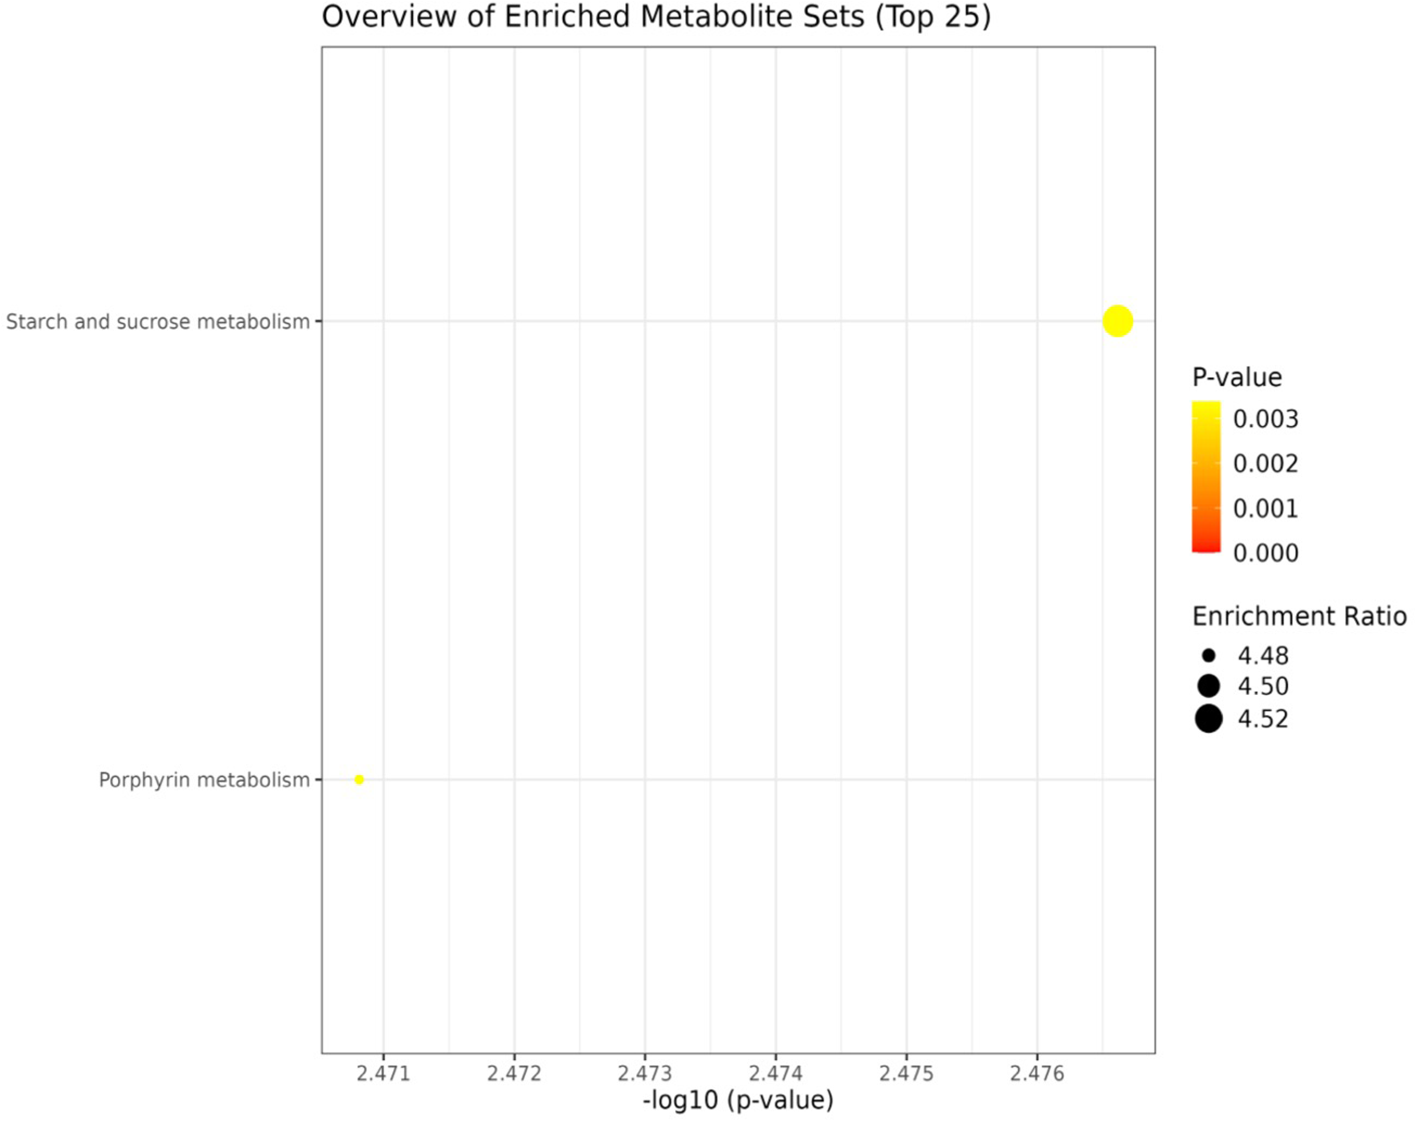
Network analysis plots of perturbed metabolites showed distinct patterns under non-stress condition. Metabolite pathway enrichment analysis further indicated enrichment in key metabolites in the starch and sucrose metabolism.
Figure 11
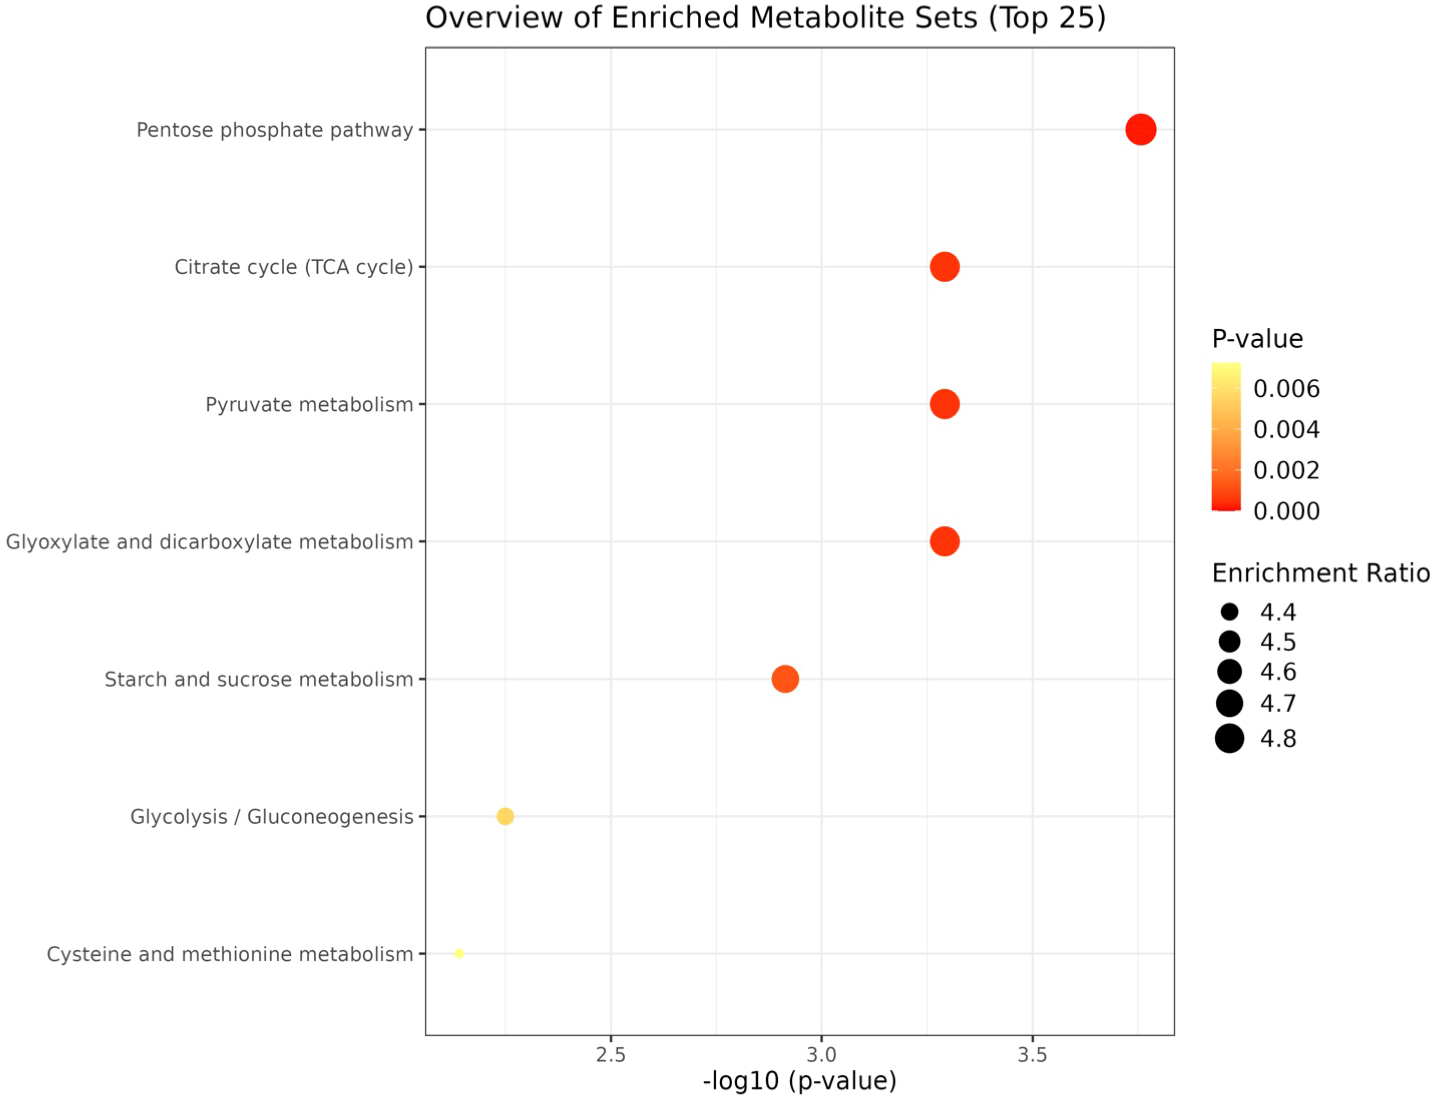
Network analysis plots of perturbed metabolites showed distinct patterns under heat stress condition. Metabolite pathway enrichment analysis further indicated enrichment in key metabolites in the TCA cycle, glycolysis/ gluconeogenesis, pentose phosphate pathway, glyoxylate, pyruvate and starch and sucrose metabolism.
Lipid pathway analysis indicated enrichment in several key lipid classes, including MGDG, glycerophosphocholine, PI, PA, PC, LPI, LPC, LPG, glycerophosphoinositol, and phosphoglyceric acid under non stress and heat stress (Figures 12, 13).
Figure 12
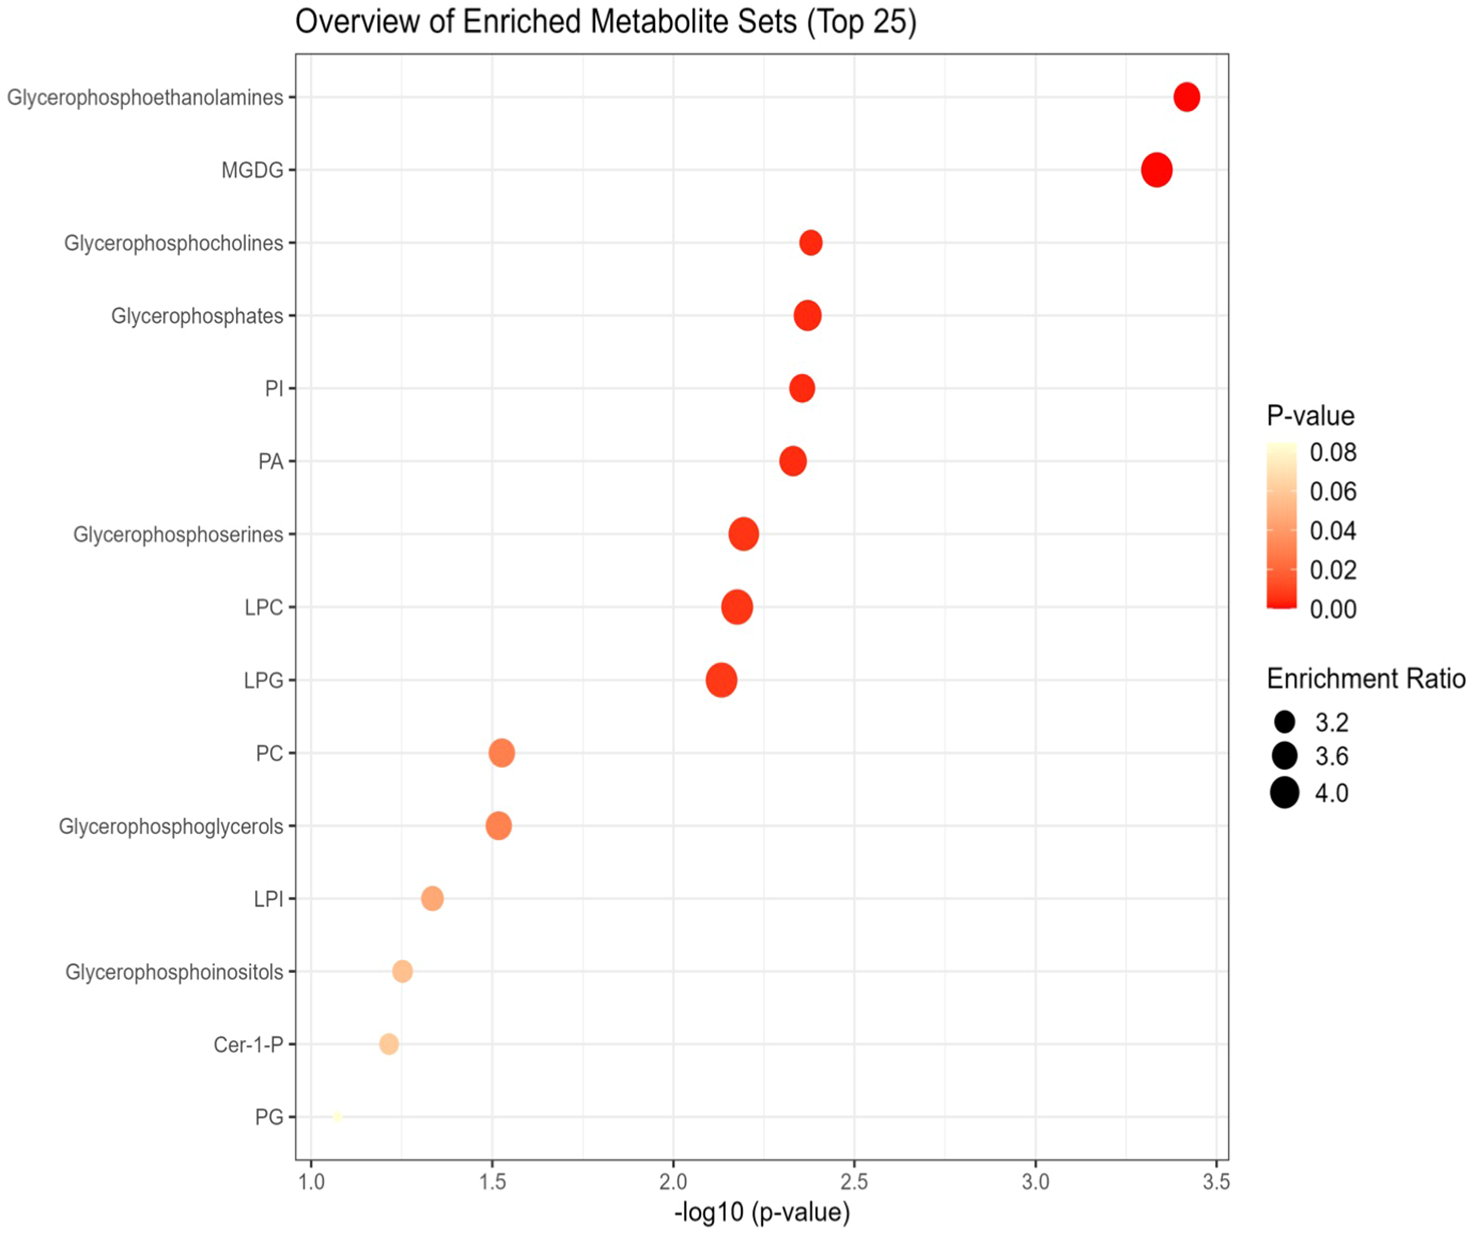
Network analysis plots of perturbed lipids revealed distinct patterns under non-stress. Lipid pathway analysis further indicated enrichment in key lipid classes, including Monogalactosyldiacylglycerol (MGDG), glycerophosphoethanolamine, glycerophosphocholine, glycerophosphoserine, glycerophosphates, phosphatidylinositol (PI), phosphatidic acid (PA), phosphatidylcholines (PC), lysophosphatidylinositol (LPI), lysophosphatidylcholine (LPC), lysophosphatidylglycerol (LPG), glycerophosphoinositol, and phosphoglyceric acid.
Figure 13
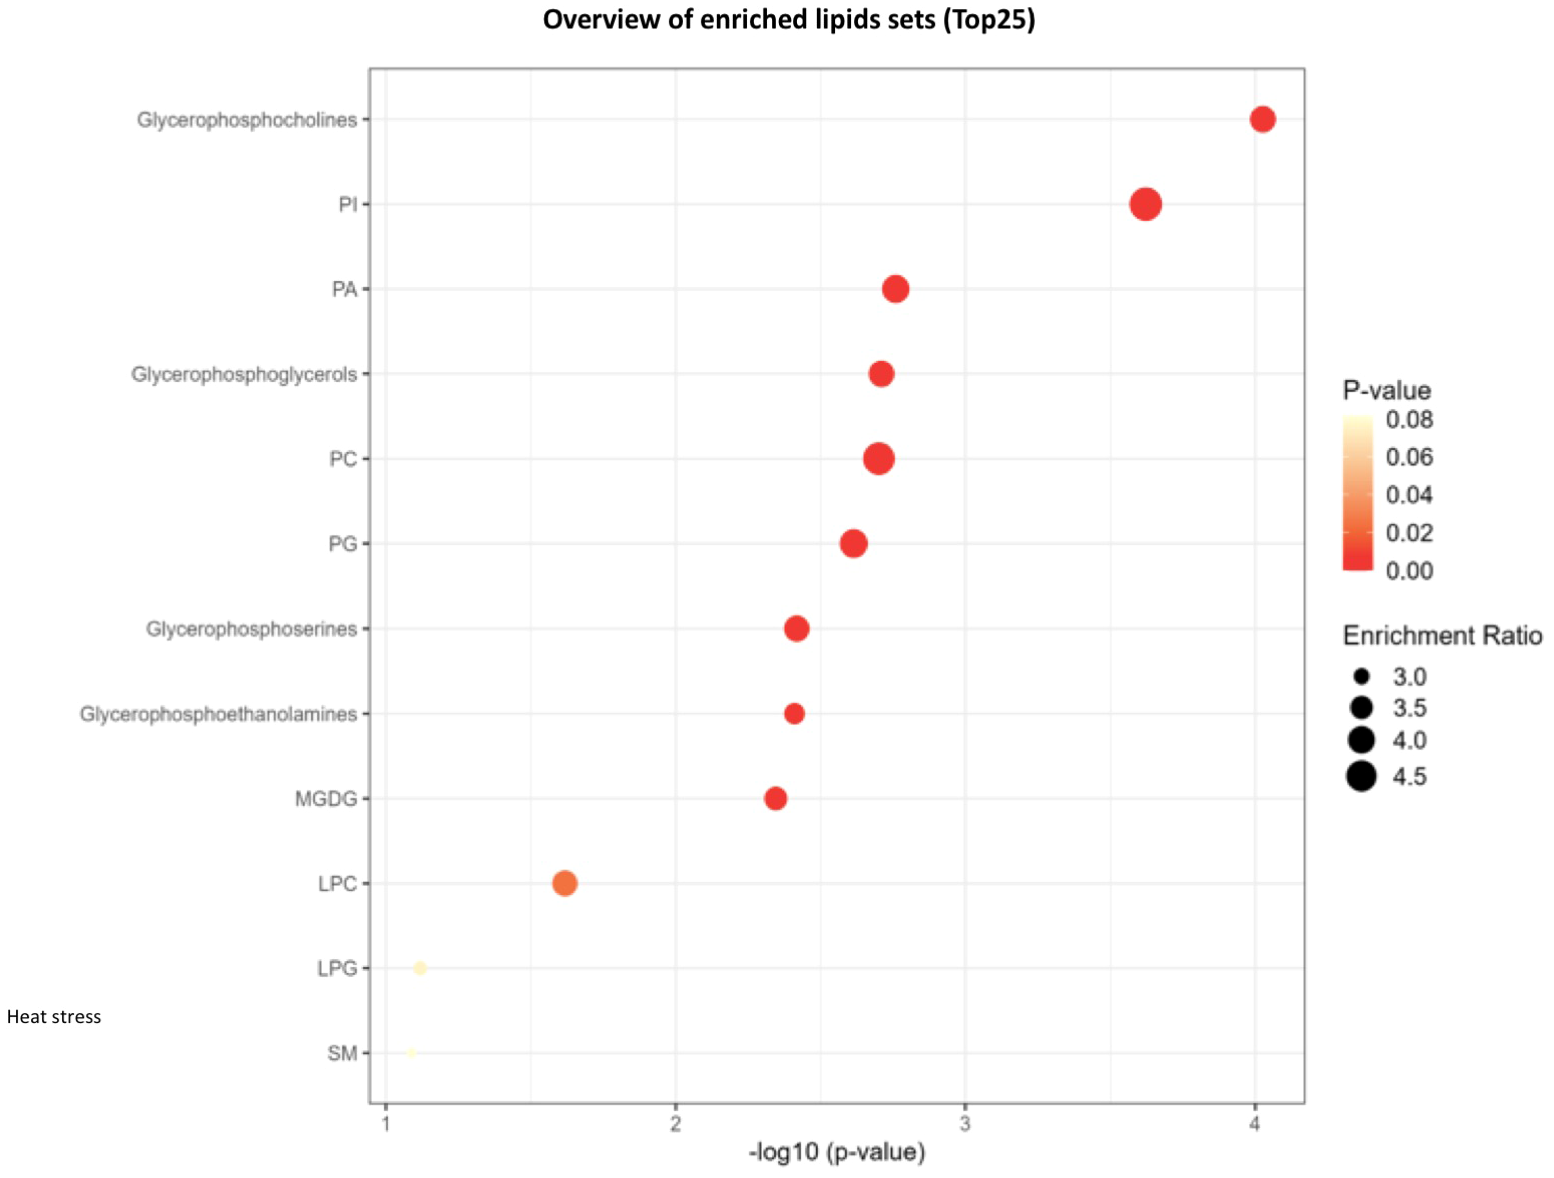
Network analysis plots of perturbed lipids revealed distinct patterns under heat stress conditions. Lipid pathway analysis further indicated enrichment in key lipid classes, including glycerophosphocholine, phosphatidylinositol (PI), phosphatidic acid (PA), phosphatidylcholines (PC), lysophosphatidylinositol (LPI), lysophosphatidylcholine (LPC), lysophosphatidylglycerol (LPG), Monogalactosyldiacylglycerol (MGDG), glycerophosphoserine, glycerophosphoethanolamine.
Clustering analysis
Hierarchical clustering analysis of differential metabolites (Figure 14) distinctly separated the two genotypes under heat stress, with PI518255 showing higher accumulation of potential biomarker metabolites such as 3-Feruloylquinic acid, Hesperetin 7-glucoside, Leucyl-Threonine, Moracetin, Luteolin, Astilbin1-O-Cinnamoyl-(6-arabinosylglucose), and neoandrographolide. Similarly, hierarchical clustering analysis of differential lipids (Figure 15) also separated the genotypes, with PI518255 displaying elevated levels of key lipids, including dMePE, PIP, PE, PC, PG, PI, DGMG (33:4), MGDG (45:6e), PC (49:5), PS (36:4), and PI (18:1e).
Figure 14
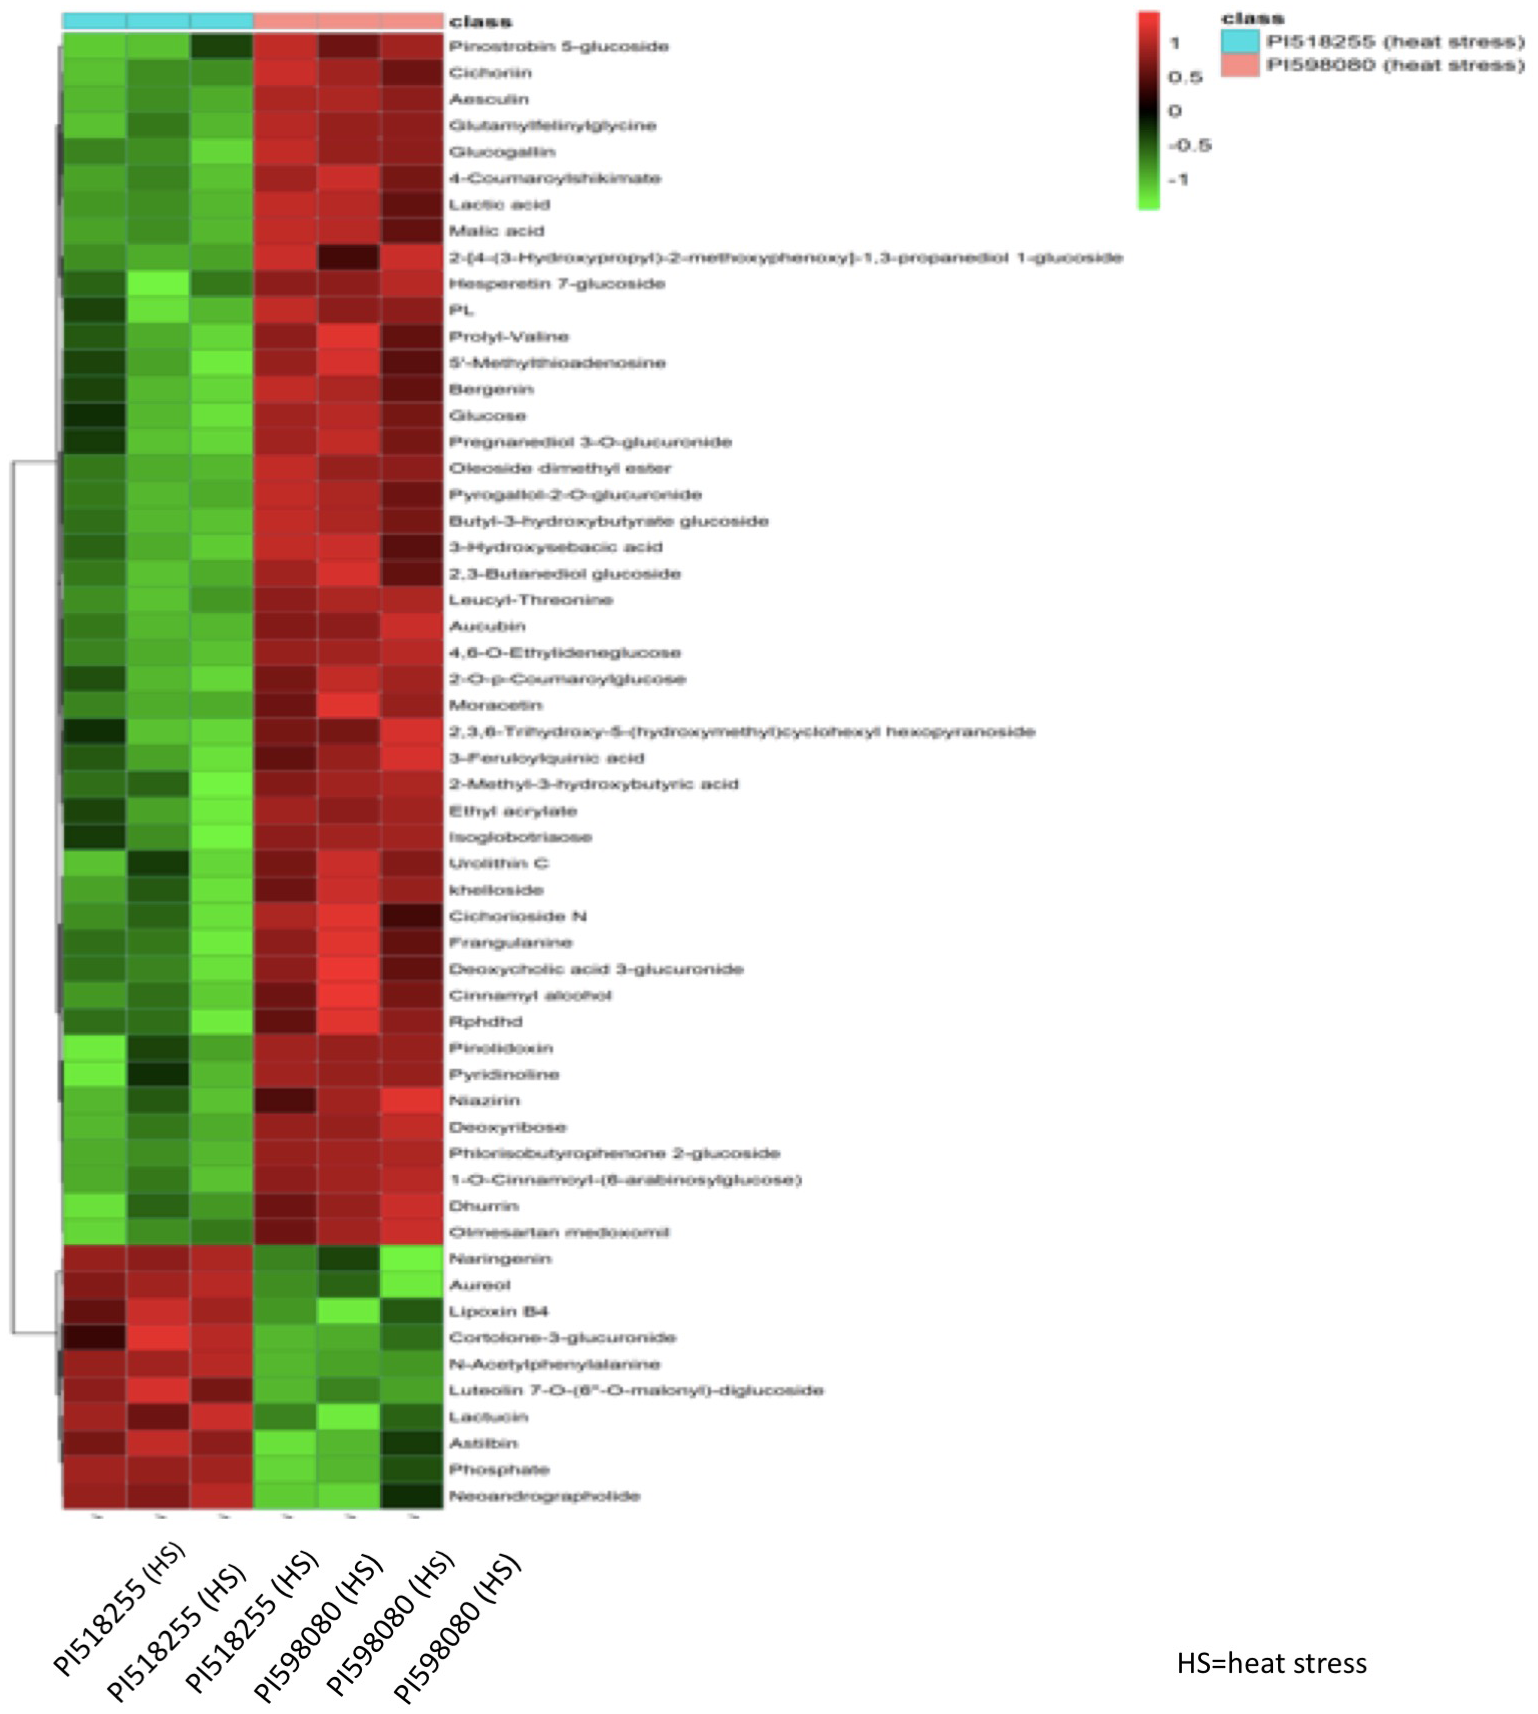
A hierarchical cluster analysis of metabolome data revealed that metabolites from two genotypes under heat stress were distinctly separated. The analysis showed that the PI518255 genotype had a higher accumulation of potential biomarker metabolites, including 3-Feruloylquinic acid, Hesperetin 7-glucoside, Leucyl-Threonine, Moracetin, Luteolin, Astilbin, 1-O-Cinnamoyl-(6-arabinosylglucose), and neoandrographolide.
Figure 15
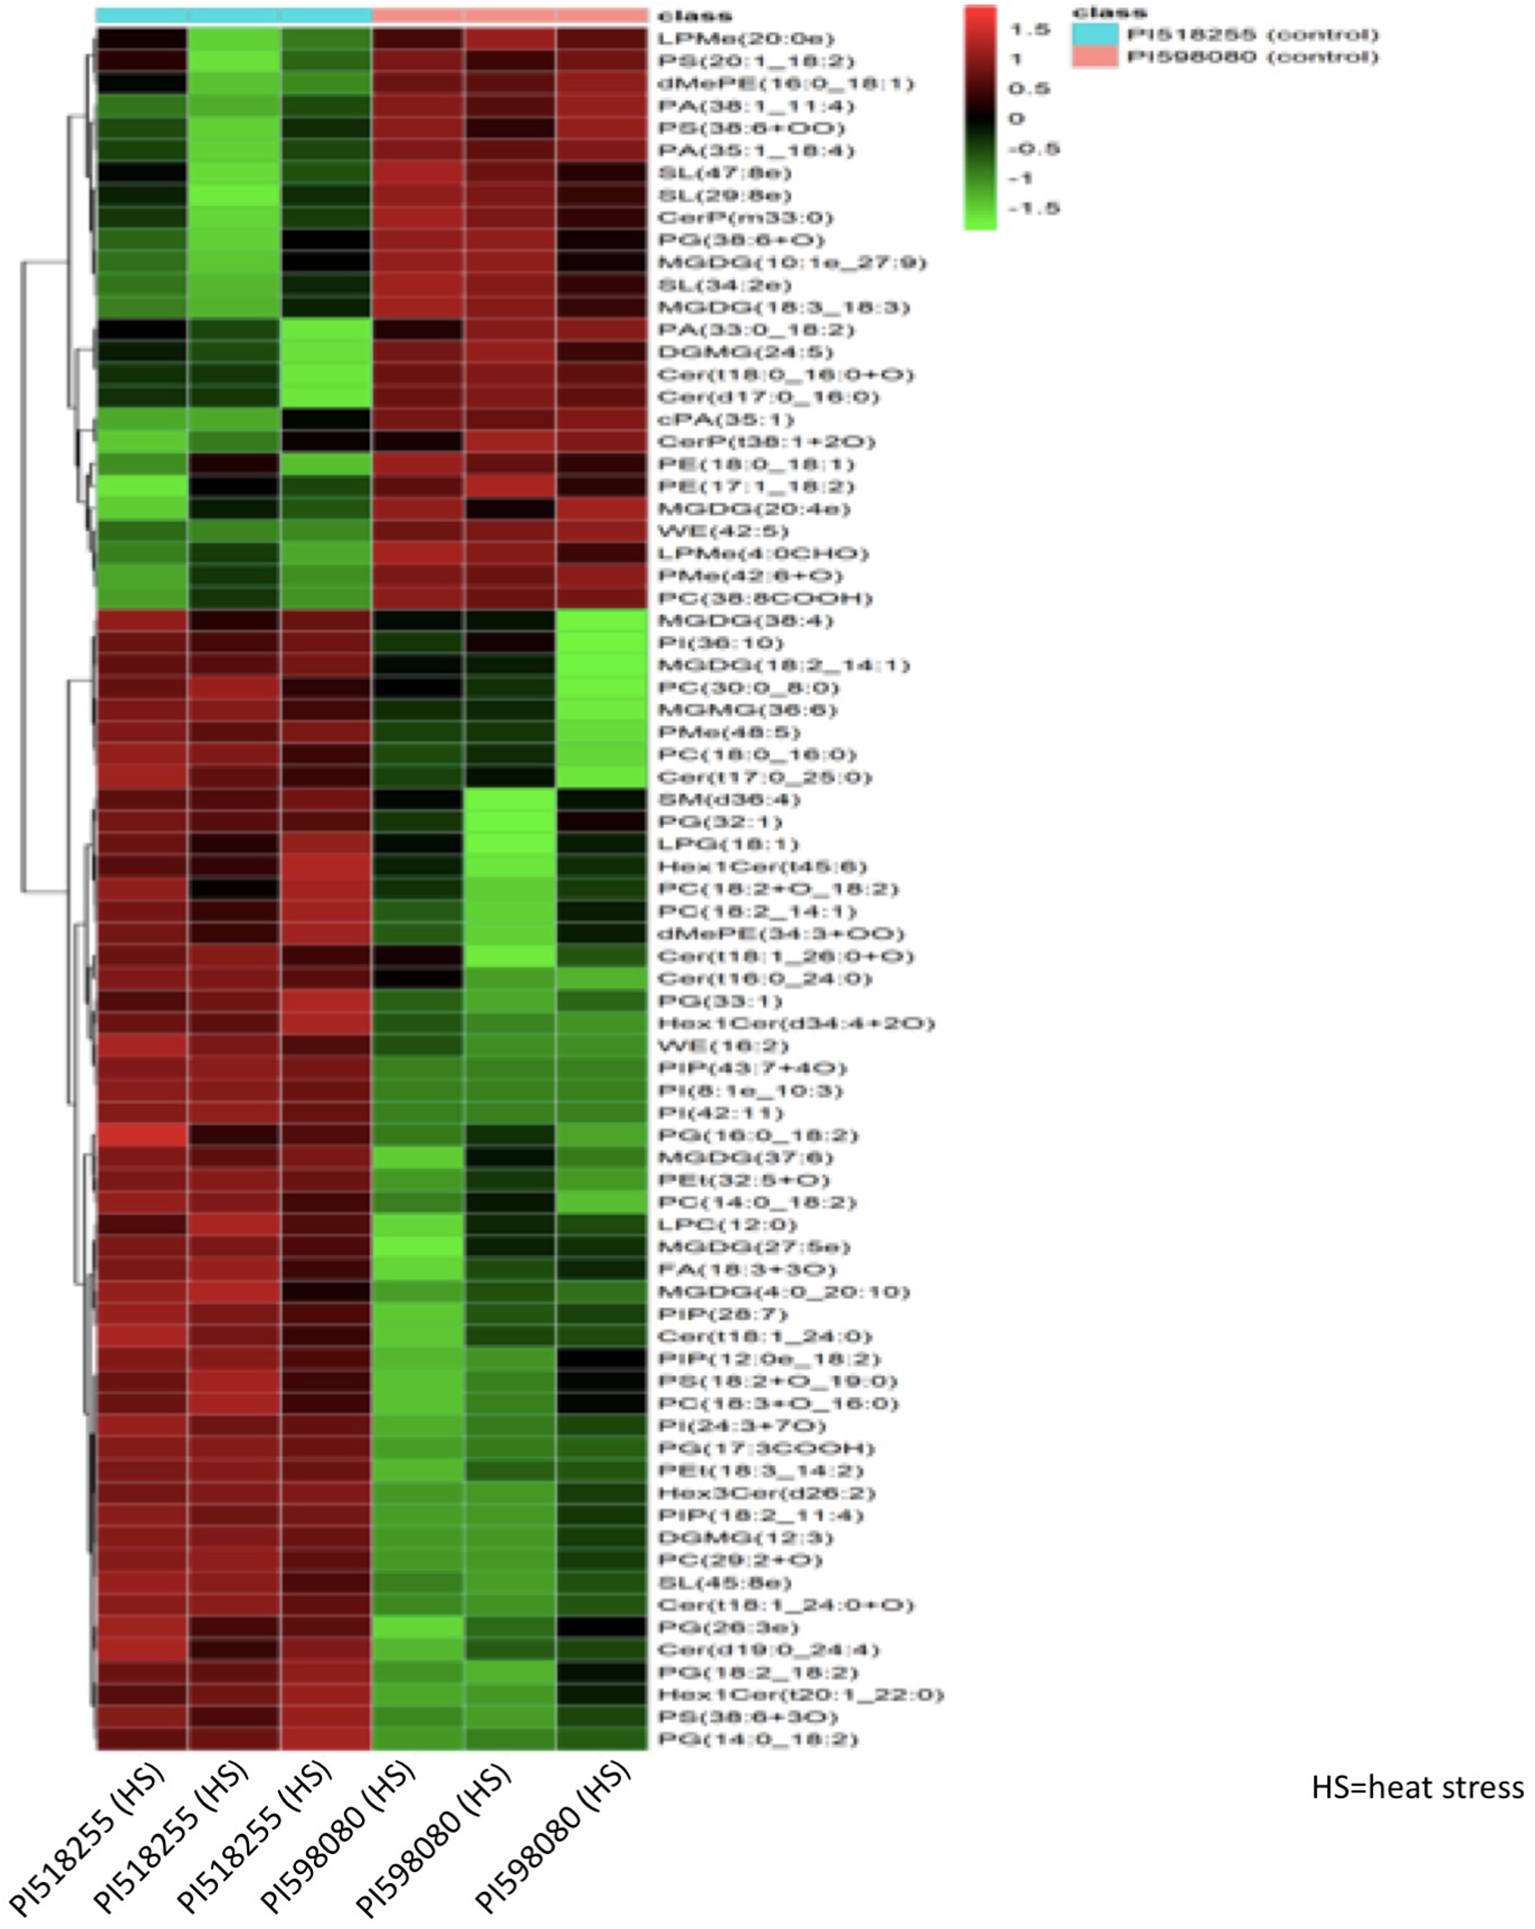
A hierarchical cluster analysis of lipidome data revealed a distinct separation of genotypes in response to heat stress. The analysis demonstrated that the PI518255 genotype accumulated elevated levels of several key lipids, specifically dimethylphosphatidylethanolamine (dMePE), phosphatidylinositol phosphates (PIP), phosphatidylethanolamine (PE), phosphatidylcholines (PC), phosphatidylglycerol (PG), phosphatidylinositol (PI), diacylglycerol monogalactoside (DGMG) (33:4), monogalactosyldiacylglycerol (MGDG) (45:6e), PC (49:5), phosphatidylserine (PS) (36:4), and PI (18:1e).
Discussion
The increasing frequency and intensity of heat stress events threaten global food security, particularly for temperature-sensitive crops like chickpea. In addition to reducing overall yield, heat stress can severely impair seed biochemical composition and quality (Kumar et al., 2023a; Jha et al., 2024b). In this context, metabolomic and lipidomic profiling offers a valuable tool for identifying biochemical markers and mechanisms associated with heat stress tolerance. In the present study, the heat-tolerant genotype PI518255 exhibited higher effective pods per plant, seed number per plant, and seed yield per plant than heat-sensitive PI598080. These findings are consistent with previous reports of significant yield losses and compromised reproductive traits in chickpea exposed to heat stress (Devi et al., 2022; Jha et al., 2024c).
Among the various heat stress-responsive metabolites, flavonoids were key compounds associated with tolerance. These phenolic compounds play diverse roles in plant development and abiotic stress responses (Agati et al., 2012; Ma et al., 2014; Cui et al., 2023). In particular, naringenin is widely recognized for enhancing heat tolerance by increasing antioxidant activity, as demonstrated in tomato (Šamec et al., 2021). Likewise, naringenin ameliorated salinity and osmotic stress in Phaseolus vulgaris by scavenging reactive oxygen species (ROS), increasing glycine betaine, proline, and choline accumulation, and regulating nitrogen metabolism (Ozfidan-Konakci et al., 2020). Similarly, Guo et al. (2023) identified increased naringenin and its derivative chalcone in P. ternate under heat stress, further supporting its protective role.
Luteolin, another flavonoid elevated in PI518255 under heat stress and downregulated under non-stress, has been associated with enhanced antioxidant responses in pigeonpea exposed to heat, drought, and salinity (Song et al., 2022). Although astilbin is less studied in the context of heat stress, it has been implicated in aluminum stress tolerance in Camellia drupifera (Wang et al., 2023) and light-induced responses in grape cell cultures (Ayenew et al., 2015), suggesting a broader role in stress adaptation.
1-O-Cinnamoyl-(6-arabinosylglucose), an o-cinnamoyl glycoside and cinnamic acid derivative, belongs to the extensive class of phenolic compounds (Araniti et al., 2018; Hu et al., 2022). These compounds are synthesized through the phenylpropanoid pathway, a primary metabolic route for various secondary metabolites in plants (Hu et al., 2022). It is hypothesized to improve plant heat tolerance by enhancing antioxidant defenses, protecting cellular structures via reduced oxidative damage, and contributing to overall cellular homeostasis during high temperatures (Dai et al., 2012; Xue et al., 2025). For instance, cinnamic acid pretreatment has been demonstrated to alleviate heat stress in cucumber leaves by modulating antioxidant enzyme activity and decreasing lipid peroxidation (Dai et al., 2012). Likewise, hydroxycinnamic acid amides (HCAAs), also derived from the phenylpropanoid pathway, are crucial in abiotic stress responses due to their significant antioxidant properties (Xue et al., 2025). Consequently, the elevated levels of phenolic acid derivatives in the heat-tolerant PI518255 suggest their potential role in mitigating reactive oxygen species (ROS) damage under heat stress.
3-Feruloylquinic acid (3-FQA) is a phenolic acid that acts as a powerful antioxidant in a plant’s defense against abiotic stress, such as high light intensity, ultraviolet (UV) radiation, and drought (Šamec et al., 2021; Khan et al., 2024). Its accumulation is a key part of the plant’s metabolic response to these challenging environmental conditions, as 3-FQA and other phenolic compounds are synthesized through the phenylpropanoid pathway in response to the stress (Šamec et al., 2021).
The chemical structure of 3-FQA allows it to effectively scavenge free radicals, neutralizing their harmful effects and helping to restore cellular homeostasis. Research on Rhododendron chrysanthum has demonstrated that the application of abscisic acid (ABA), a key stress hormone, leads to an increased accumulation of 3-O-feruloylquinic acid derivatives, highlighting its integral role within a coordinated defense system (Guo et al., 2024). Ultimately, by neutralizing harmful ROS and modulating metabolic pathways, 3-FQA helps plants tolerate environmental stressors, allowing them to maintain growth and productivity.
The low accumulation of 5-hydroxyferulic acid under non-stress conditions, coupled with the enhanced accumulation of 3-FQA and related phenolic compounds in PI518255 under heat stress, suggests a promising strategy to mitigate the adverse effects of heat stress and enhance heat tolerance in chickpea.
Astilbin, a dihydroflavonol glycoside type of flavonoid present in plants such as Smilax glabra Hypericum perforatum (Xin et al., 2020; Jan et al., 2021) and reported in chickpea seed (Xiao et al., 2023), has garnered attention for its biological activities, particularly its antioxidant properties. Although specific research on astilbin’s role in plant heat tolerance is still developing, its chemical structure and established properties indicate a substantial contribution to plant resilience under high-temperature stress. This contribution likely stems from its proven ability to act as an antioxidant, thereby mitigating oxidative damage and supporting cellular stability. The increased abundance of astilbin in heat-tolerant PI518255 suggests they may help mitigate ROS damage under heat stress.
Moracetin, a flavonoid glycoside (quercetin-3-O-gentiotrioside), plays a key role in a plant’s defense against abiotic stress by acting as a powerful antioxidant (National Center for Biotechnology Information, 2025). Identified in plants like mulberry and Tribulus terrestris, moracetin’s protective capabilities are attributed to its quercetin core, which effectively scavenges harmful free radicals (Aslam et al., 2022). Its multiple hydroxyl groups allow it to neutralize reactive oxygen species (ROS), thereby protecting cellular components from damage (Akram et al., 2024). While specific research on moracetin is limited, its function as a quercetin derivative indicates that its primary role is to protect the plant from oxidative damage (Akram et al., 2024). The increased synthesis of such compounds in PI518255 genotype under non stress and in response to heat stress is a vital survival strategy for plants in harsh conditions.
Andrographolide, a diterpene lactone, is another compound of interest. Although its function in heat stress is not well documented, studies in Andrographis paniculata have linked it to drought and flooding stress responses (Chen et al., 2020; Singh et al., 2025). Its accumulation in the heat-tolerant chickpea genotype suggests a potential regulatory role in stress adaptation, meriting further research.
Lipids, essential structural and signaling molecules in plants (Narayanan et al., 2016, 2018), are particularly vulnerable to stress-induced peroxidation of their unsaturated fatty acids and other compositional changes, leading to membrane damage and potentially cell death (Liu and Huang, 2000). Profiling lipidomic changes under stress can thus offer valuable insights into the molecular basis of heat tolerance. Notably, elevated levels of saturated fatty acids may contribute to heat tolerance by reducing membrane fluidity (Escandón et al., 2018). However, crucial chloroplast galactolipids—such as digalactosyl diacylglycerol (DGDG) and monogalactosyl diacylglycerol (MGDG) are prone to ROS-induced peroxidation under heat stress (Farmer and Mueller, 2013). Under high temperatures, a significant decline in MGDG, phosphatidylglycerol (PG), phosphatidylcholine (PC), phosphatidic acid (PA), and lysophospholipids (LPG, LPC, and LPE) has been reported (Djanaguiraman et al., 2018), accompanied by a shift from highly unsaturated lipid species to less unsaturated ones. In wheat, the heat-tolerant cultivar showed an increased proportion of DGDG and phosphatidylinositol (PI), with the opposite trend in the heat-sensitive line (Hu et al., 2023). Additionally, the tolerant cultivar exhibited a smaller increase in the unsaturation levels of MGDG and phosphatidylethanolamine (PE) under heat stress than the sensitive cultivar (Hu et al., 2023). In line with these findings, our current study revealed enhanced expression of BiotinylPE, MGDG (45:6e), PC (49:5), PS (36:4), and PI (18:1e) in the heat-tolerant genotype PI518255, suggesting their possible contribution to overall heat tolerance.
Heat stress reprograms plant metabolic networks to mitigate damage by enhancing antioxidant defense systems and promoting the synthesis of protective metabolites (Janni et al., 2020; Xu et al., 2024). This reprogramming involves the activation of several key metabolic pathways associated with stress-responsive metabolite production (Janni et al., 2020). Among these, the TCA cycle, central to carbohydrate and lipid metabolism is particularly susceptible to heat stress (Xu et al., 2024). Heat-induced ROS accumulation inhibits the TCA cycle, reducing NADPH production, a crucial cofactor in redox homeostasis (Dumont and Rivoal, 2019 see Supplementary Figure S2). Additionally, heat stress has been shown to suppress glycolysis and gluconeogenesis, further disrupting central metabolism. However, it simultaneously enhances the synthesis of stress-associated amino acids such as proline and arginine, as observed in celery (Apium graveolens L.) (Li et al., 2022).
Heat stress can significantly alter lipid metabolism pathways, including MGDG, PI, PA, PC, glycerophosphocholines, and glycerophosphoserines. MGDG lipids primarily enrich the thylakoid membrane remodeling pathway in response to heat stress. By altering the saturation of fatty acids, MGDG makes the membrane more rigid, which protects and stabilizes the photosynthetic machinery (photosystems I and II) (Narayanan et al., 2016, 2018; Hölzl and Dörmann, 2007). This ensures the continued function of the photosynthetic electron transport chain, which is critical for producing energy and antioxidants.
Under heat stress, glycerophosphates are central to glycerophospholipid metabolism and membrane remodeling, which helps maintain membrane fluidity. They are actively synthesized, degraded, and modified to adjust the ratio of saturated to unsaturated fatty acids, thereby stabilizing membranes and protecting cellular components (Higashi and Saito, 2019).
Phosphatidylinositol lipids are not just structural components but are at the very beginning of a complex signaling cascade (Mishkind et al., 2009; Laxalt et al., 2025). Their metabolism is a primary event that allows the plant to perceive heat stress and quickly activate a coordinated defense response, from calcium signaling to the expression of protective heat shock proteins (Mishkind et al., 2009; Laxalt et al., 2025). These findings underscore the importance of lipid composition in maintaining membrane stability under heat stress. Consequently, future targeted lipidome investigations in chickpea could offer valuable insights into the lipid-mediated mechanisms underlying heat tolerance.
Conclusions
The increasing frequency and intensity of heat stress events and the growing demand for nutritious food threaten global food security. In chickpea, heat stress significantly reduces grain yield and impairs seed quality. However, the biochemical basis of these effects, particularly at the metabolomic and lipidomic levels, remains insufficiently explored. Our results indicate that the plant’s strategy involves not only the production of protective metabolites like phenolic acids, flavonoids and terpenoids but also the dynamic remodeling of cellular membranes via lipids like MGDG, glycerophosphates, glycerophosphoserines, phosphatidylinositol and lysophosphatidylcholine. Upregulation of some unsaturated fatty acids help in maintaining membrane stability. This coordinated metabolic and lipid-signaling response allows the plant to perceive the stress signal, protect its cellular components, and survive under heat stress. Targeted metabolomics and lipidomics approaches have the potential to uncover novel heat-responsive biomarkers, which could be instrumental in distinguishing heat-tolerant from heat-sensitive chickpea genotypes and accelerating the development of climate-resilient cultivars through marker-assisted breeding and trait selection.
Statements
Data availability statement
The original contributions presented in the study are publicly available. This data can be found here: https://doi.org/10.6084/m9.figshare.30231736.
Author contributions
UJ: Data curation, Writing – original draft, Formal analysis, Conceptualization. MW: Methodology, Resources, Writing – review & editing. HN: Writing – review & editing, Methodology. KS: Writing – review & editing. PP: Methodology, Funding acquisition, Investigation, Formal analysis, Visualization, Project administration, Data curation, Conceptualization, Writing – review & editing, Supervision.
Funding
The author(s) declare that no financial support was received for the research, and/or publication of this article.
Acknowledgments
UCJ thanks ICAR, New Delhi, for supports. Contribution Number 26-042-J from the Kansas Agricultural Experiment Station is acknowledged.
Conflict of interest
The authors declare that the research was conducted in the absence of any commercial or financial relationships that could be construed as a potential conflict of interest.
The author(s) declared that they were an editorial board member of Frontiers, at the time of submission. This had no impact on the peer review process and the final decision.
Generative AI statement
The author(s) declare that no Generative AI was used in the creation of this manuscript.
Any alternative text (alt text) provided alongside figures in this article has been generated by Frontiers with the support of artificial intelligence and reasonable efforts have been made to ensure accuracy, including review by the authors wherever possible. If you identify any issues, please contact us.
Publisher’s note
All claims expressed in this article are solely those of the authors and do not necessarily represent those of their affiliated organizations, or those of the publisher, the editors and the reviewers. Any product that may be evaluated in this article, or claim that may be made by its manufacturer, is not guaranteed or endorsed by the publisher.
Supplementary material
The Supplementary Material for this article can be found online at: https://www.frontiersin.org/articles/10.3389/fpls.2025.1668751/full#supplementary-material
References
1
Agati G. Azzarello E. Pollastri S. Tattini M. (2012). Flavonoids as antioxidants in plants: location and functional significance. Plant Sci.196, 67–76. doi: 10.1016/j.plantsci.2012.07.014
2
Akram W. Khan I. Rehman A. Munir B. Guo J. Li G. (2024). A physiological and molecular docking insight on quercetin mediated salinity stress tolerance in Chinese flowering cabbage and increase in glucosinolate contents. Plants13, 1698. doi: 10.3390/plants13121698
3
Aloui K. Choukri H. El Haddad N. Gupta P. El Bouhmadi K. Emmrich P. M. F. et al . (2023). Impact of heat and drought stress on grass pea and its wild relatives. Plants (Basel)12, 3501. doi: 10.3390/plants12193501
4
Al-Whaibi M. H. (2011). Plant heat-shock proteins: a mini review. J. King Saud University-Sci.23, 139–150. doi: 10.1016/j.jksus.2010.06.022
5
Araniti F. Lupini A. Mauceri A. Zumbo A. Sunseri F. Abenavoli M. R. (2018). The allelochemical trans-cinnamic acid stimulates salicylic acid production and galactose pathway in maize leaves: A potential mechanism of stress tolerance. Plant Physiol. Biochem.128, 32–40. doi: 10.1016/j.plaphy.2018.05.006
6
Aslam M. A. Ahmed S. Saleem M. Shah A. A. Shah A. N. Tanveer M. et al . (2022). Quercetin ameliorates chromium toxicity through improvement in photosynthetic activity, antioxidative defense system; and suppressed oxidative stress in Trigonella corniculata L. Front. Plant Sci.13. doi: 10.3389/fpls.2022.956249
7
Awasthi R. Devi P. Jha U. C. Sharma K. D. Rookiwal M. Kumar S. et al . (2024). Exploring the synergistic effects of drought and heat stress on chickpea seed development: insights into nutritional quality and seed yield. Plant Stress14, 100635. doi: 10.1016/j.stress.2024.100635
8
Ayenew B. Degu A. Manela N. Perl A. Shamir M. O. Fait A. (2015). Metabolite profiling and transcript analysis reveal specificities in the response of a berry derived cell culture to abiotic stresses. Front. Plant Sci.6. doi: 10.3389/fpls.2015.00728
9
Barker M. Rayens W. (2003). Partial least squares for discrimination. J. Chemom.: A J. Chemometrics Soc.17, 166–173.
10
Bhandari K. Sita K. Sehgal A. Bhardwaj A. Gaur P. Kumar S. et al . (2020). Differential heat sensitivity of two cool-season legumes, chickpea and lentil, at the reproductive stage, is associated with responses in pollen function, photosynthetic ability and oxidative damage. J. Agron. Crop Sci.206, 734–758. doi: 10.1111/jac.12433
11
Chaturvedi P. Pierides I. López-Hidalgo C. Garg V. Zhang S. Barmukh R. et al . (2024). Natural variation in the chickpea metabolome under drought stress. Plant Biotechnol. J.22, 3278–3294. doi: 10.1111/pbi.14447
12
Chen X. Xie Y. Wei K. Lan Z. Li C. Li Y. et al . (2020). Drought stress enhanced andrographolides contents in Andrographispaniculata. Acta Ecologica Sin.40, 113–121. doi: 10.1016/j.chnaes.2020.02.003
13
Chianese U. Papulino C. Passaro E. Evers T. M. Babaei M. Toraldo A. et al . (2022). Histone lysine demethylase inhibition reprograms prostate cancer metabolism and mechanics. Mol. Metab.64, 101561. doi: 10.1016/j.molmet.2022.101561
14
Cui M. Liang Z. Liu Y. Sun Q. Wu D. Luo L. et al . (2023). Flavonoid profile of Anoectochilusrox burghii (Wall.) Lindl. Under short-term heat stress revealed by integrated metabolome, transcriptome, and biochemical analyses. Plant Physiol. Biochem.201, 107896. doi: 10.1016/j.plaphy.2023.107896
15
Dai A. H. Nie Y. X. Yu B. Li Q. Lu L. Y. Bai J. G. (2012). Cinnamic acid pretreatment enhances heat tolerance of cucumber leaves through modulating antioxidant enzyme activity. Environ. Expt. Bot.79, 1–10. doi: 10.1016/j.envexpbot.2012.01.003
16
Das A. Rushton P. J. Rohila J. S. (2017). Metabolomic profiling of soybeans (Glycine max L.) reveals the importance of sugar and nitrogen metabolism under drought and heat stress. Plants6, 21. doi: 10.3390/plants6020021
17
Devasirvatham V. Gaur P. M. Mallikarjuna N. Tokachichu R. N. Trethowan R. M. Tan D. K. (2012). Effect of high temperature on the reproductive development of chickpea genotypes under controlled environments. Funct. Plant Biol.39, 1009–1018. doi: 10.1071/FP12033
18
Devi P. Awasthi R. Jha U. Sharma K. D. Prasad P. V. V. Siddique K. H. et al . (2023). Understanding the effect of heat stress during seed filling on nutritional composition and seed yield in chickpea (Cicer arietinum L.). Sci. Reps.13, 15450. doi: 10.1038/s41598-023-42586-0
19
Devi P. Jha U. C. Prakash V. Kumar S. Parida S. K. Paul P. J. et al . (2022). ). Response of physiological, reproductive function and yield traits in cultivated chickpea (Cicer arietinum L.) under heat stress. Front. Plant Sci.13. doi: 10.3389/fpls.2022.880519
20
Djanaguiraman M. Boyle D. L. Welti R. Jagadish S. V. K. Prasad P. V. V. (2018). Decreased photosynthetic rate under high temperature in wheat is due to lipid desaturation, oxidation, acylation, and damage of organelles. BMC Plant Biol.18, 1–17. doi: 10.1186/s12870-018-1263-z
21
Dumont S. Rivoal J. (2019). Consequences of oxidative stress on plant glycolytic and respiratory metabolism. Front. Plant Sci.10. doi: 10.3389/fpls.2019.00166
22
Escandón M. Meijón M. Valledor L. Pascual J. Pinto G. Cañal M. J. (2018). Metabolome integrated analysis of high-temperature response in Pinus radiata. Front. Plant Sci.9. doi: 10.3389/fpls.2018.00485
23
FAOSTAT (2023). Food and Agricultural Organization (Rome, Italy). (Accessed April 25, 2025).
24
Farmer E. E. Mueller M. J. (2013). ROS-mediated lipid peroxidation and RES-activated signaling. Annu. Rev. Plant Biol.64, 429–450. doi: 10.1146/annurev-arplant-050312-120132
25
Firmansyah A. N. Argosubekti N. (2020). “A review of heat stress signaling in plants,” in IOP conference series: earth and environmental science, Bristol UK: IOP Vol. 484. 012041.
26
Guo L. Tan J. Deng X. Mo R. Y. Cao Y. et al . (2023). Integrated analysis of metabolome and transcriptome reveals key candidate genes involved in flavonoid biosynthesis inPinelliaternataunder heat stress. J. Plant Res.136, 359–369. doi: 10.1007/s10265-023-01446-8
27
Guo C. Xing J. Shamshad A. Jiang J. Wang D. Wang X. et al . (2024). In situ growth of sodium manganese hexacyanoferrate on carbon nanotubes for high-performance sodium-ion batteries. Molecules29, 313. doi: 10.3390/molecules29020313
28
Han Q. Sun S. Liu Z. Xu W. Shi P. (2022). Accelerated exacerbation of global extreme heatwaves under warming scenarios. Int. J. Climatology42, 5430–5441. doi: 10.1002/joc.7541
29
Han P. Wang Y. Sun H. (2025). Impact of temperature stresses on wheat quality: A focus on starch and protein composition. Foods14, 2178. doi: 10.3390/foods14132178
30
Hasanuzzaman M. Nahar K. Alam M. M. Roychowdhury R. Fujita M. (2013). Physiological, biochemical, and molecular mechanisms of heat stress tolerance in plants. Int. J. Mol. Sci.14, 9643–9684. doi: 10.3390/ijms14059643
31
Higashi Y. Saito K. (2019). Lipidomic studies of membrane glycerolipids in plant leaves under heat stress. Prog. Lipid Res.75, 100990. doi: 10.1016/j.plipres.2019.100990
32
Hölzl G. Dörmann P. (2007). Structure and function of glycoglycerolipids in plants and bacteria. Prog. Lipid Res.46, 225–243. doi: 10.1016/j.plipres.2007.05.001
33
Hu H. Jia Y. Hao Z. Ma G. Xie Y. Wang C. et al . (2023). Lipidomics-based insights into the physiological mechanism of wheat in response to heat stress. Plant Physiol. Biochem.205, 108190. doi: 10.1016/j.plaphy.2023.108190
34
Hu W. Sarengaowa Guan Y. Feng K. (2022). Biosynthesis of phenolic compounds and antioxidant activity in fresh-cut fruits and vegetables. Front. Microbiol.13. doi: 10.3389/fmicb.2022.906069
35
Jan R. Kim N. Lee S. H. Khan M. A. Asaf S. Lubna et al . (2021). Enhanced flavonoid accumulation reduces combined salt and heat stress through regulation of transcriptional and hormonal mechanisms. Front. Plant Sci.12. doi: 10.3389/fpls.2021.796956
36
Janni M. Gullì M. Maestri E. Marmiroli M. Valliyodan B. Nguyen H. T. et al . (2020). Molecular and genetic bases of heat stress responses in crop plants and breeding for increased resilience and productivity. J. Expt. Bot.71, 3780–3802. doi: 10.1093/jxb/eraa034
37
Jha U. C. Chaturvedi S. K. Bohra A. Basu P. S. Khan M. S. Barh D. (2014). Abiotic stresses, constraints and improvement strategies in chickpea. Plant Breed.133, 163–178. doi: 10.1111/pbr.12150
38
Jha U. C. Dutta D. Tripathi S. Bindra S. Kumar Y. Ghritlahre S. et al . (2024c). Unveiling heat-resilient chickpea (Cicer arietinum L.) lines under two mega chickpea growing regions in India using GGE biplot analysis. Indian J. Genet. Plant Breed.84, 723–726. doi: 10.31742/ISGPB.84.4.23
39
Jha U. C. Jha R. Thakro V. Kumar A. Gupta S. Nayyar H. et al . (2021b). Discerning molecular diversity and association mapping for phenological, physiological and yield traits under high temperature stress in chickpea (Cicer arietinum L.). J. Genet.100, 1–15. doi: 10.1007/s12041-020-01254-2
40
Jha U. C. Naik Y. D. Priya M. Nayyar H. Sofi P. A. Beena R. et al . (2025b). Chickpea (Cicer arietinum L.) battling against heat stress: plant breeding and genomics advances. Plant Mol. Biol.115, 101. doi: 10.1007/s11103-025-01628-z
41
Jha U. C. Nath C. P. Paul P. J. Nayyar H. Kumar N. Dixit G. P. et al . (2025a). Decoding the heat stress resilience in chickpea (Cicer arietinum L.): multi-trait analysis for genotypic adaptation. Sci. Rep.15, 25055. doi: 10.1038/s41598-025-07573-7
42
Jha U. C. Nayyar H. Palakurthi R. Jha R. Valluri V. Bajaj P. et al . (2021a). Major QTLs and potential candidate genes for heat stress tolerance identified in chickpea (Cicer arietinum L.). Front. Plant Sci.12. doi: 10.3389/fpls.2021.655103
43
Jha U. C. Nayyar H. Thudi M. Beena R. Prasad P. V. V. Siddique K. H. (2024a). Unlocking the nutritional potential of chickpea: strategies for biofortification and enhanced multinutrient quality. Front. Plant Sci.15. doi: 10.3389/fpls.2024.1391496
44
Jha U. C. Priya M. Naik Y. D. Nayyar H. Thudi M. Punnuri S. M. et al . (2024b). Major abiotic stresses on quality parameters in grain legumes: impacts and various strategies for improving quality traits. Environ. Expt. Bot.228, 105978. doi: 10.1016/j.envexpbot.2024.105978
45
Jha U. C. Shafi S. Tallury S. Nayyar H. Udgata A. R. Ciampitti I. A. et al . (2025c). Dynamic changes in seed nutritional components of mung bean [(Vigna radiata (L.) R. Wilczek)] under heat stress. Sci. Reps15, 12586. doi: 10.1038/s41598-025-93992-5
46
Kaloki P. Luo Q. Trethowan R. Tan D. K. (2019). Can the development of drought tolerant ideotype sustain Australian chickpea yield? Intl. J. Biometeor63, 393–403. doi: 10.1007/s00484-019-01672-7
47
Kanehisa M. Goto S. (2000). KEGG: kyotoencyclopedia of genes and genomes. Nucleic Acids Res.28, 27–30. doi: 10.1093/nar/28.1.27
48
Khan K. A. Saleem M. H. Afzal S. Hussain I. Ameen F. Fahad S. (2024). Ferulic acid: Therapeutic potential due to its antioxidant properties, role in plant growth, and stress tolerance. Plant Growth Regul.104, 1329–1353. doi: 10.1007/s10725-024-01243-w
49
Kompas T. Che T. N. Grafton R. Q. (2024). Global impacts of heat stress and water stress on food production and severe food insecurity. Sci. Rep.14, 14398. doi: 10.1038/s41598-024-65274-z
50
Kumar S. Bhushan B. Wakchaure G. C. Dutta R. Jat B. S. Meena K. K. et al . (2023a). Unveiling the impact of heat stress on seed biochemical composition of major cereal crops: Implications for crop resilience and nutritional value. Plant Stress9, 100183. doi: 10.1016/j.stress.2023.100183
51
Kumar R. Sharma V. K. Rangari S. K. Jha U. C. Sahu A. Paul P. J. et al . (2023b). High confidence QTLs and key genes identified using Meta-QTL analysis for enhancing heat tolerance in chickpea (Cicer arietinum L.). Front. Plant Sci.14. doi: 10.3389/fpls.2023.1274759
52
Laxalt A. M. van Hooren M. Munnik T. (2025). Plant PI-PLC signaling in stress and development. Plant Physiol.197, p.kiae534. doi: 10.1093/plphys/kiae534
53
Li M. Li J. Zhang R. Lin Y. Xiong A. Tan G. et al . (2022). Combined analysis of the metabolome and transcriptome to explore heat stress responses and adaptation mechanisms in Celery (ApiumgraveolensL.). Int. J. Mol. Sci.23, 3367. doi: 10.3390/ijms23063367
54
Liu X. Huang B. (2000). Heat stress injury in relation to membrane lipid peroxidation in creeping bentgrass. Crop Sci.40, 503–510. doi: 10.2135/cropsci2000.402503x
55
Ma D. Sun D. Wang C. Li Y. Guo T. (2014). Expression of flavonoid biosynthesis genes and accumulation of flavonoid in wheat leaves in response to drought stress. Plant Physiol. Biochem.80, 60–66. doi: 10.1016/j.plaphy.2014.03.024
56
Malviya R. Majumder S. Sharma P. Gayen D. (2025). Integrated proteomic and metabolomics analysis of chickpea seeds under aging conditions. J. Proteomics320, 105487. doi: 10.1016/j.jprot.2025.105487
57
Mishkind M. Vermeer J. E. Darwish E. Munnik T. (2009). Heat stress activates phospholipase D and triggers PIP2 accumulation at the plasma membrane and nucleus. Plant J.60, 10–21. doi: 10.1111/j.1365-313X.2009.03933.x
58
Mohanty J. K. Thakro V. Yadav A. Nayyar H. Dixit G. P. Agarwal P. et al . (2024). Delineation of genes for a major QTL governing heat stress tolerance in chickpea. Plant Mol. Biol.114, 19. doi: 10.1007/s11103-024-01421-4
59
Mohanty J. K. Yadav A. Narnoliya L. Thakro V. Nayyar H. Dixit G. P. et al . (2025). A next-generation combinatorial genomic strategy scans genomic loci governing heat stress tolerance in chickpea. Plant Cell Environ.48, 2706–2726. doi: 10.1111/pce.15186
60
Narayanan S. Prasad P. V. V. Welti R. (2016). Wheat leaf lipids during heat stress: II. Lipids experiencing coordinated metabolism are detected by analysis of lipid co-occurrence. Plant Cell Environ.39, 608–617. doi: 10.1111/pce.12648
61
Narayanan S. Prasad P. V. V. Welti R. (2018). Alterations to wheat pollen lipidome during high day and night temperature stress. Plant Cell Environ.41, 1749–1761. doi: 10.1111/pce.13156
62
National Center for Biotechnology Information . (2025). PubChem Compound Summary for CID 5319886, Moracetin. Available online at: https://pubchem.ncbi.nlm.nih.gov/compound/Moracetin (Accessed September 17, 2025).
63
Ozfidan-Konakci C. Yildiztugay E. Alp F. N. Kucukoduk M. Turkan I. (2020). Naringenin induces tolerance to salt/osmotic stress through the regulation of nitrogen metabolism, cellular redox and ROS scavenging capacity in bean plants. Plant Physiol. Biochem.157, 264–275. doi: 10.1016/j.plaphy.2020.10.032
64
Patre A. Zhodape V. Basu P. S. Guhey A. (2023). Impact of osmolytes in pollen viability and yield attributes of chickpea (Cicer arietinum L.) under drought and heat environment. Int. J. Stat. Appl. Math.8, 227–233.
65
Prasad P. V. V. Bheemanahalli R. Jagadish S. V. K. (2017). Field crops and the fear of heat stress – opportunities, challenges and future directions. Field Crop Res.200, 114–121. doi: 10.1016/j.fcr.2016.09.024
66
Priya M. Bhardwaj A. Jha U. C. HanumanthaRao B. Prasad P. V. V. Sharma K. D. et al . (2023). Investigating the influence of elevated temperature on nutritional and yield characteristics of mung bean (Vigna radiata L.) genotypes during seed filling in a controlled environment. Front. Plant Sci.14. doi: 10.3389/fpls.2023.1233954
67
Qian W. Zhu Y. Chen Q. Wang S. Chen L. Liu T. et al . (2023). Comprehensive metabolomic and lipidomic alterations in response to heat stress during seed germination and seedling growth of Arabidopsis. Front. Plant Sci.14. doi: 10.3389/fpls.2023.1132881
68
Rani A. Devi P. Jha U. C. Sharma K. D. Siddique K. H. Nayyar H. (2020). Developing climate-resilient chickpea involving physiological and molecular approaches with a focus on temperature and drought stresses. Front. Plant Sci.10. doi: 10.3389/fpls.2019.01759
69
Ruan S. Rocchetti L. Bitocch E. Wendenburg R. Santamarina C. Vittori V. D. et al . (2025). Metabolite-based genome-wide association studies enable the dissection of the genetic bases of bioactive compounds in Chickpea seeds. bioRxiv, 2025–2006.
70
Šamec D. Karalija E. Šola I. Vujčić Bok V. Salopek-Sondi B. (2021). The role of polyphenols in abiotic stress response: The influence of molecular structure. Plants10, 118. doi: 10.3390/plants10010118
71
Sehgal A. Sita K. Bhandari K. Kumar S. Kumar J. Prasad P. V. V. et al . (2019). Influence of drought and heat stress applied independently or in combination during seed development, on qualitative and quantitative aspects of seeds of lentil (Lens culinarisMedikus) genotypes, differing in drought sensitivity. Plant Cell Environ.42, 198–211. doi: 10.1111/pce.13328
72
Sher A. Noor M. A. Li H. X. Nasir B. Manzoor M. A. Hussain S. et al . (2024). Heat stress effects on legumes: challenges, management strategies and future insights. Plant Stress13, 100537. doi: 10.1016/j.stress.2024.100537
73
Siddique A. B. Shabala S. Li C. Chen Z. H. Varshney R. K. Zhao C. et al . (2025). Reducing heat stress damage in cereal crops through agronomic management and breeding strategies. Plant Stress16, 100888. doi: 10.1016/j.stress.2025.100888
74
Singh P. Laxman R. H. Rao V. K. Ravishankar K. V. Shivashankara K. S. Kumar P. (2025). Impact of water deficit stress on physiological performance, secondary metabolites, and gene expression in Andrographis paniculata. South Afr. J. Bot.178, 400–410. doi: 10.1016/j.sajb.2025.01.038
75
Song Z. Yang Q. Dong B. Li N. Wang M. Du T. et al . (2022). Melatonin enhances stress tolerance in pigeon pea by promoting flavonoid enrichment, particularly luteolin in response to salt stress. J. Exp. Bot.73, 5992–6008. doi: 10.1093/jxb/erac276
76
Wang Y. Cheng J. Wei S. Jiang W. Li Y. Guo W. et al . (2023). Metabolomic study of flavonoids in Camellia drupifera under aluminum stress by UPLC-MS/MS. Plants12, 1432. doi: 10.3390/plants12071432
77
Wang J. Gan Y. T. Clarke F. McDonald C. L. (2006). Response of chickpea yield to high temperature stress during reproductive development. Crop Sci.46, 2171–2178. doi: 10.2135/cropsci2006.02.0092
78
Wang Y. Pandak W. M. Hylemon P. B. Min H. K. Min J. Fuchs M. et al . (2024). Cholestenoic acid as endogenous epigenetic regulator decreases hepatocyte lipid accumulation in vitro and in vivo.Am. J. Physiol.-Gastrointest. Liver Physiol.326, G147–G162. doi: 10.1152/ajpgi.00184.2023
79
Wold S. Esbensen K. Geladi P. (1987). Principal component analysis. Chemometrics Intelligent Lab. Syst.2, 37–52. doi: 10.1016/0169-7439(87)80084-9
80
Wold S. Johansson E. Cocchi M. (1993). “PLS: partial least squares projections to latent structures,” in 3D QSAR in Drug Design: Theory, Methods and Applications (Leiden: Kluwer ESCOM Science Publisher), 523–550.
81
Xiao S. Li Z. Zhou K. Fu Y. (2023). Chemical composition of kabuli and desi chickpea (Cicer arietinum L.) cultivars grown in Xinjiang, China. Food Sci. Nutr.11, 236–248. doi: 10.1002/fsn3.3056
82
Xin C. Guangliang S. Qing Z. Qingqing L. Hang Y. Yiming Z. et al . (2020). Astilbin protects chicken peripheral blood lymphocytes from cadmium-induced necroptosis via oxidative stress and the PI3K/Akt pathway. Ecotoxicol. Environ. Safe.190, 110064. doi: 10.1016/j.ecoenv.2019.110064
83
Xu W. Miao Y. Kong J. Lindsey K. Zhang X. Min L. (2024). ROS signaling and its involvement in abiotic stress with emphasis on heat stress-driven anther sterility in plants. Crop Environ.3, 65–74. doi: 10.1016/j.crope.2023.12.002
84
Xue R. Gao N. Chen J. Wu Z. Sun N. Li Y. et al . (2025). Hydroxycinnamic acid amides in rice: biosynthesis, distribution, function, and implication for crop development. Front. Plant Sci.16. doi: 10.3389/fpls.2025.1525268
Summary
Keywords
chickpea, metabolomics, lipidome, heat stress, climate change
Citation
Jha UC, Warburton ML, Nayyar H, Siddique KHM and Prasad PVV (2025) Metabolomic and lipidomic changes in heat-stressed chickpea seeds. Front. Plant Sci. 16:1668751. doi: 10.3389/fpls.2025.1668751
Received
18 July 2025
Accepted
19 September 2025
Published
13 October 2025
Volume
16 - 2025
Edited by
Prafull Salvi, National Agri-Food Biotechnology Institute, India
Reviewed by
Santosh Kumar Gupta, ICAR-Indian Institute of Millets Research (IIMR), India
Vikas Dwivedi, Agricultural Research Organization (ARO), Israel
Vikram Singh, Amrapali University, India
Updates
Copyright
© 2025 Jha, Warburton, Nayyar, Siddique and Prasad.
This is an open-access article distributed under the terms of the Creative Commons Attribution License (CC BY). The use, distribution or reproduction in other forums is permitted, provided the original author(s) and the copyright owner(s) are credited and that the original publication in this journal is cited, in accordance with accepted academic practice. No use, distribution or reproduction is permitted which does not comply with these terms.
*Correspondence: Uday Chand Jha, u9811981@gmail.com; P. V. Vara Prasad, vara@ksu.in
Disclaimer
All claims expressed in this article are solely those of the authors and do not necessarily represent those of their affiliated organizations, or those of the publisher, the editors and the reviewers. Any product that may be evaluated in this article or claim that may be made by its manufacturer is not guaranteed or endorsed by the publisher.