 Ganesh Pinnika1
 Gregory N. Thyssen1Crista A. Madison1Ping Li1
 David D. Fang1
 Marina Naoumkina1*
 Doug J. Hinchliffe1,2*
- 1Cotton Fiber Bioscience and Utilization Research Unit, United States Department of Agriculture Agricultural Research Service (USDA-ARS), Southern Regional Research Center (SRRC), New Orleans, LA, United States
- 2Cotton Quality and Innovation Research Unit, United States Department of Agriculture Agricultural Research Service (USDA-ARS), SRRC, New Orleans, LA, United States
Introduction: The naturally brown colored fibers of some cottons exist in varying shades of brown. Linkage analyses have revealed up to six individual loci (Lc1–Lc6) for brown color and suggested a separate genetic basis for each color value of fibers. It was previously reported that the brown color and flame-retardant (FR) properties of Lc1 fibers resulted from an upstream inversion mutation that highly upregulates the GhTT2_A07 gene and, consequently, the entire phenylpropanoid pathway. However, the genes responsible for the coloration and FR of other brown cotton fibers remained undetermined.
Methods: In the current study, we used a previously uncharacterized SA-40 germplasm that produces rust-brown cotton. An F2 mapping population derived from the cross of SA-40 and TM-1 was used in an association mapping study to elucidate the genetics of SA-40 rust-brown fiber color and FR.
Results and discussion: The rust-brown locus was mapped to GhTT2 on chromosome A07 (GhTT2_A07). Comparison of the upstream sequence of GhTT2_A07 between TM-1 and SA-40 revealed the absence of a Ty3-like LTR retrotransposon in the SA-40 line. No remnants of the LTR retrotransposon in the SA-40 indicated that the retrotransposon insertion did not happen in that line. However, all investigated white cotton lines in this study displayed the presence of the LTR retrotransposon upstream of GhTT2_A07. Transcript analysis showed that the absence of retrotransposon upstream of GhTT2_A07 was associated with higher expression of this gene, but at lower levels than previously reported for the upstream inversion mutation in the MC-BL line, where the retrotransposon has been removed by structural rearrangement. Our finding suggests that the value of brown coloration in Lc1 fibers is directly controlled by the expression level of GhTT2_A07, with higher expression levels resulting in darker fibers.
1 Introduction
Cotton is a major crop grown mainly for raw fiber. It has been domesticated and cultivated for thousands of years (Lee and Fang, 2015). Early civilizations used naturally-colored cotton (NCC) to create intricate patterns in their textiles, with brown, red, rust, and green hues, rather than just white cotton (Crawford, 1924). With technological advancement, white cotton replaced NCC since its fiber has better qualities, making it better for spinning yarn. However, public interest in NCC has recently increased because it is considered environmentally friendly, as it eliminates pollution steps associated with the bleaching and dyeing of white cotton. The fiber lumen of naturally brown cotton (NBC) is filled with tannin pigments, which make the color stronger and more intense after laundering (Günaydin et al., 2019). NBC is naturally resistant to pests and can survive on depleted dry soils (Din et al., 2016; Madhu, 2024). The fiber of some NBC varieties shows flame-retardant (FR) properties (Hinchliffe et al., 2015, 2016; Nam et al., 2017, 2016).
Interest in the genetic regulation of NCC began in the early 20th century, when it was determined that plants producing fibers in various shades of brown and green were allelomorphic to white fibers (Ware, 1932). Later, mapping studies have identified at least six genetic loci associated with different shades of brown fiber coloration (Lc1-Lc6), which were incompletely dominant relative to white cotton (Endrizzi and Kohel, 1966; Kohel, 1985). The Lc1 locus was mapped on chromosome (Chr.) A07, while the Lc2 on Chr. A06 of G. hirsutum (Wang et al., 2014). A genome-wide association study (GWAS) detected two quantitative trait loci (QTLs), including qBF-A07-1 (Gh_A07G2341–TT2) and qBF-A07-2 (Gh_A07G0100–TTG1), that regulate the shades of brown color in G. hirsutum (Wen et al., 2018).
Advancements in the molecular understanding of NBC traits have revealed that the flavonoid branch of phenylpropanoid pathways largely governs brown pigmentation. Proanthocyanidins (PAs) or condensed tannins are mostly responsible for the brown coloration of fibers. The ternary MBW complex of transcription factors, including MYB (TT2)–bHLH (TT8)–WD40 (TTG1), plays a vital role in the regulation of different branches of the flavonoid biosynthesis pathway and epidermal cell fate determination in higher plants (Yu et al., 2023). The MBW complex functions differently depending on participating MYB and bHLH transcription factors (Wang et al., 2022a). For example, an R2R3-MYB–Lc1 or GhTT2 inhibits expression of ANS directing metabolic flux toward PA biosynthesis, while cooperation between another R2R3-MYB–Re or GhPAP1 and GhTT8 promotes expression of ANS and anthocyanin biosynthesis in cotton (Hinchliffe et al., 2016; Li et al., 2019; Wang et al., 2022b; Wen et al., 2018; Yan et al., 2018). Moreover, it has been demonstrated that GhTT16 negatively modulates the MBW complex and the PAs pathway (Li et al., 2024).
Recent studies have shown that the regulation of expression of PA biosynthetic genes influences fiber color intensity and shades. Ectopic expression of GhTT2-3A in fibers during the secondary cell wall (SCW) thickening stage resulted in a rise in PA content and brown mature fibers (Yan et al., 2018). Two R2R3-MYBs, Lc and GhPAP1D, were fused and expressed in fibers during the SCW deposition stage, increasing PAs and anthocyanins and producing reddish-brown fiber color at maturation (Ran et al., 2025).
Furthermore, changes in upstream regulatory regions, such as actions of transposable elements, structural rearrangements, insertions/deletions (Indels), or single nucleotide polymorphisms (SNPs) in promoter regions, can significantly influence the activity of key genes that control the phenylpropanoid pathway (Hinchliffe et al., 2016; Ke et al., 2022; Li et al., 2024). In particular, Hinchliffe et al. (2016) described a 1.4 Mb inversion on chromosome A07 that upregulates the GhTT2-A07 gene, resulting in brown color and FR properties of fibers. A T-DNA insertion into a retrotransposon positioned in the upstream region of flavonol O-methyltransferase (GhOMT1) suppressed the activity of GhOMT1, which caused overproduction of anthocyanidins and diversified colors of fiber (Ke et al., 2022). Another study experimentally demonstrated that subtle variations, such as SNPs or Indels, in the promoter of Gh_TT2 were related to its gain-of-function (Li et al., 2024). This intricate regulation underscores not only the biochemical complexity of PA biosynthesis but also the evolutionary and agronomic significance of naturally colored cotton varieties.
In addition to their distinct pigmentation, brown cotton fibers exhibit noteworthy FR compared with conventional white fibers. Early studies revealed that brown cotton fabrics release heat more slowly and maintain higher char yields, a phenomenon attributed to the interaction of tannin-like compounds with inorganic elements (Hinchliffe et al., 2015). Subsequent investigations demonstrated that elevated sodium and potassium content in brown fibers fosters the formation of metal-phenolic complexes, effectively stabilizing the fiber matrix during combustion (Nam et al., 2016). These complexes behave in a manner akin to intumescent FRs, inhibiting ignition and promoting self-extinguishing behavior under thermal stress (Nam et al., 2017). Consequently, cotton lines that accumulate both proanthocyanidins and key inorganic ions offer an appealing combination of environmental sustainability and improved safety, paving the way for advanced textile applications where natural coloration and FR are desired.
In our previous study, we identified a 1.4 Mb inversion upstream of the GhTT2_A07 (Lc1) in the MC-BL line that resulted in the significant upregulation of this gene, and consequently the whole phenylpropanoid pathway, leading to enhanced pigmentation and FR properties (Hinchliffe et al., 2016). In the current study, we utilized a previously uncharacterized germplasm, SA-40, that has rust-brown fibers. We mapped the rust-brown trait of the SA-40 line to the GhTT2_A07 locus, which coincides with the previously reported Lc1 locus (Hinchliffe et al., 2016; Wen et al., 2018). We discovered that the Ty3-like LTR retrotransposon presently located about 7.5 kb upstream of GhTT2_A07 in white cotton TM-1 is missing in the rust-brown cotton SA-40. The absence of the retrotransposon was associated with higher expression of the GhTT2_A07 gene, resulting in a rust-brown coloration on the cotton fiber.
2 Materials and methods
2.1 Plant materials
The cotton accession SA-40 (PI number 528453) was obtained from the USDA Cotton Germplasm Repository in College Station, TX, and is also referred to as Texas Rust Brown. The Texas Marker-1 (TM-1), a white fiber cultivar, was used as the control. An F2 population of 508 individuals was developed from a cross between SA-40 and TM-1. Crosses were made from plants grown under controlled greenhouse conditions in 20 L pots approximately 25cm in diameter and 30cm in height containing Metro-Mix 366 potting soil (Sun Gro Horticulture Canada Ltd, Agawam, MA, USA). F1 plants were grown in a greenhouse during winter 2017 to produce F2 seeds. The F2 population was grown in the summer of 2018 in a New Orleans field (30.02° N, 90.09° W). For cotton ovule collection, the cotton lines SA-40, MC-BL (Hinchliffe et al., 2016), and TM-1, about 20 plants each, were grown in the summer of 2019 in a New Orleans field. Organic field practices were applied during the growing season. Previously reported 132 accessions of white cotton were used to obtain the sequence of the LTR retrotransposon upstream of GhTT2_A07 (Thyssen et al., 2025).
2.2 Sample collection and nucleic acid isolation
Fiber samples were collected from developing fibers at 10 days post-anthesis (DPA) according to the previously published protocol (Hinchliffe et al., 2011). Total RNA was extracted using the Sigma Spectrum Plant Total RNA kit (Sigma-Aldrich, St. Louis, MO, USA) with an integrated DNase 1 treatment to eliminate genomic DNA contamination. Genomic DNA from parents and the F2 population was extracted from young leaf tissues using a modified CTAB protocol (Fang et al., 2010). RNA and DNA quality and quantity were confirmed by a NanoDrop 2000 spectrometer (Thermo Fisher Scientific, Waltham, MA) as previously described (Hinchliffe et al., 2011).
2.3 Bulked segregant analysis and genetic mapping
Bulked segregant analysis (BSA) sequencing was used to identify genetic variants between SA-40 and TM-1. We have prepared two bulks: the first contains 77 samples of brown cotton, and the second includes 77 white cotton F2 segregants. Novogene Corporation (Chula Vista, CA, USA) sequenced the samples on the Illumina HiSeq X Ten platform (150 bp paired-end reads). Sequence reads were aligned using bwa-mem2 (Vasimuddin et al., 2019) to the draft Gossypium hirsutum TM-1 JGI v1 reference genome (https://jgi.doe.gov/). Variant calling was conducted with bcftools (Li, 2011; Li et al., 2009) and manually verified. Identical variants, including SNPs and Indels, between the two bulks were subtracted across the genome. The subgenome-specific SNP markers were developed from the cluster of different variants on Chr. A07 as described by (Drenkard et al., 2000; Thyssen et al., 2014). Because the rust-brown mutation is dominant, only the mutant-specific genotypes of the SNP markers were analyzed in the F2 population. We optimized the annealing temperature for the markers to achieve the largest Δ Ct values between positive and negative samples. Supplementary Table S1 provides the primer sequences of the SNP markers along with their optimal temperatures.
2.4 RNAseq and gene expression analysis
Total RNA isolated from developing fibers of 10 DPA from SA-40, MC-BL, and TM-1 was used for RNAseq analysis. Two biological replicates from each line were processed. Each biological replicate represented a pool of samples collected from 10 plants. Novogene Corporation (Chula Vista, CA, USA) conducted library preparations and sequencing on the Illumina HiSeq 2000 platform to yield 100-bp paired-end reads. Quality control of RNAseq data, including Q20, Q30 and GC, are provided in the Supplementary Table S2. Raw reads were quality filtered and trimmed using SICKLE (Joshi and J.N., 2011) and aligned to the G. hirsutum TM-1 reference genome (Zhang et al., 2015) with GSNAP software (Wu and Nacu, 2010). We used a different version of the TM-1 reference genome for aligning the RNAseq data compared to the version used for the BSA analysis. This choice was made because we had previously published transcript analysis for the MC-BL aligned to that version, although at different developmental time points (Hinchliffe et al., 2016). Gene-level counts were generated using BEDTools (Quinlan and Hall, 2010). Normalization and ANOVA for differentially expressed genes were performed as described by (Naoumkina et al., 2014). The Illumina raw reads data were deposited into the NCBI-SRA database under BioProject number PRJNA1291244.
2.5 Assessment of flame retardancy
Flame retardancy was evaluated via microscale combustion calorimetry (MCC) method on approximately 4 mg of fiber. Samples were accurately weighed into a ceramic specimen cup using a Sartorius CP2P-F microbalance (Sartorius Bohemia, NY, USA) mounted on a Scienceware Vibrasorb system (Bel-Art products, Wayne, NJ, USA) on a marble slab. Pyrolysis was conducted in an MCC-2 instrument (Deatak, Mchenry. IL, USA) at a constant heating rate of 1.2 ° C s -1, with temperature ramped from 90 ° C to 550 ° C. Measured parameters using MCC model MCC-2 (Deatak, McHenry, IL, USA) included heat release capacity (HRC, J g-1 K-1), peak heat release rate (pHRR, W g-1), total heat release (tHR, KJ g-1), temperature at pHRR (° C), and percent char yield. Data was processed using MCC Curve Fit v.2 software (Deatak).
2.6 Quantitative color space analysis
Objective fiber color space measurements were obtained using a CR-400 Chroma Meter (Konica Minolta, Ramsey, NJ) to capture CIELab (International Commission on Illumination, Vienna, Austria) values (Ibraheem et al., 2012). Measurements in three technical replicates were taken per fiber sample and averaged. Differences in color of mature fibers of the F2 population were quantified by calculating ΔE values: . Where L* represents lightness (0 = black, 100 = white), a* represents the green-red axis (-a = green, +a = red) and b* represents the blue-yellow axis (-b = blue, +b = yellow). ΔE less than one is not perceptible to the human eye, while more than two is perceptible upon close observation. Colors are noticeably different for ΔE around 10, and completely different for ΔE over 50.
3 Results
3.1 Rust-brown fiber phenotype and inheritance
SA-40, a previously uncharacterized line, exhibits green, normal-shaped leaves and stems, cream-colored petals on its flowers without spots, and a distinctive rust-brown lint color in mature cotton. We used Texas Marker-1 (TM-1) as a standard reference line (Kohel et al., 1970) for comparison of fiber properties and generating the F2 mapping population. Figure 1 shows images of open bolls from SA-40 and TM-1 cotton lines.
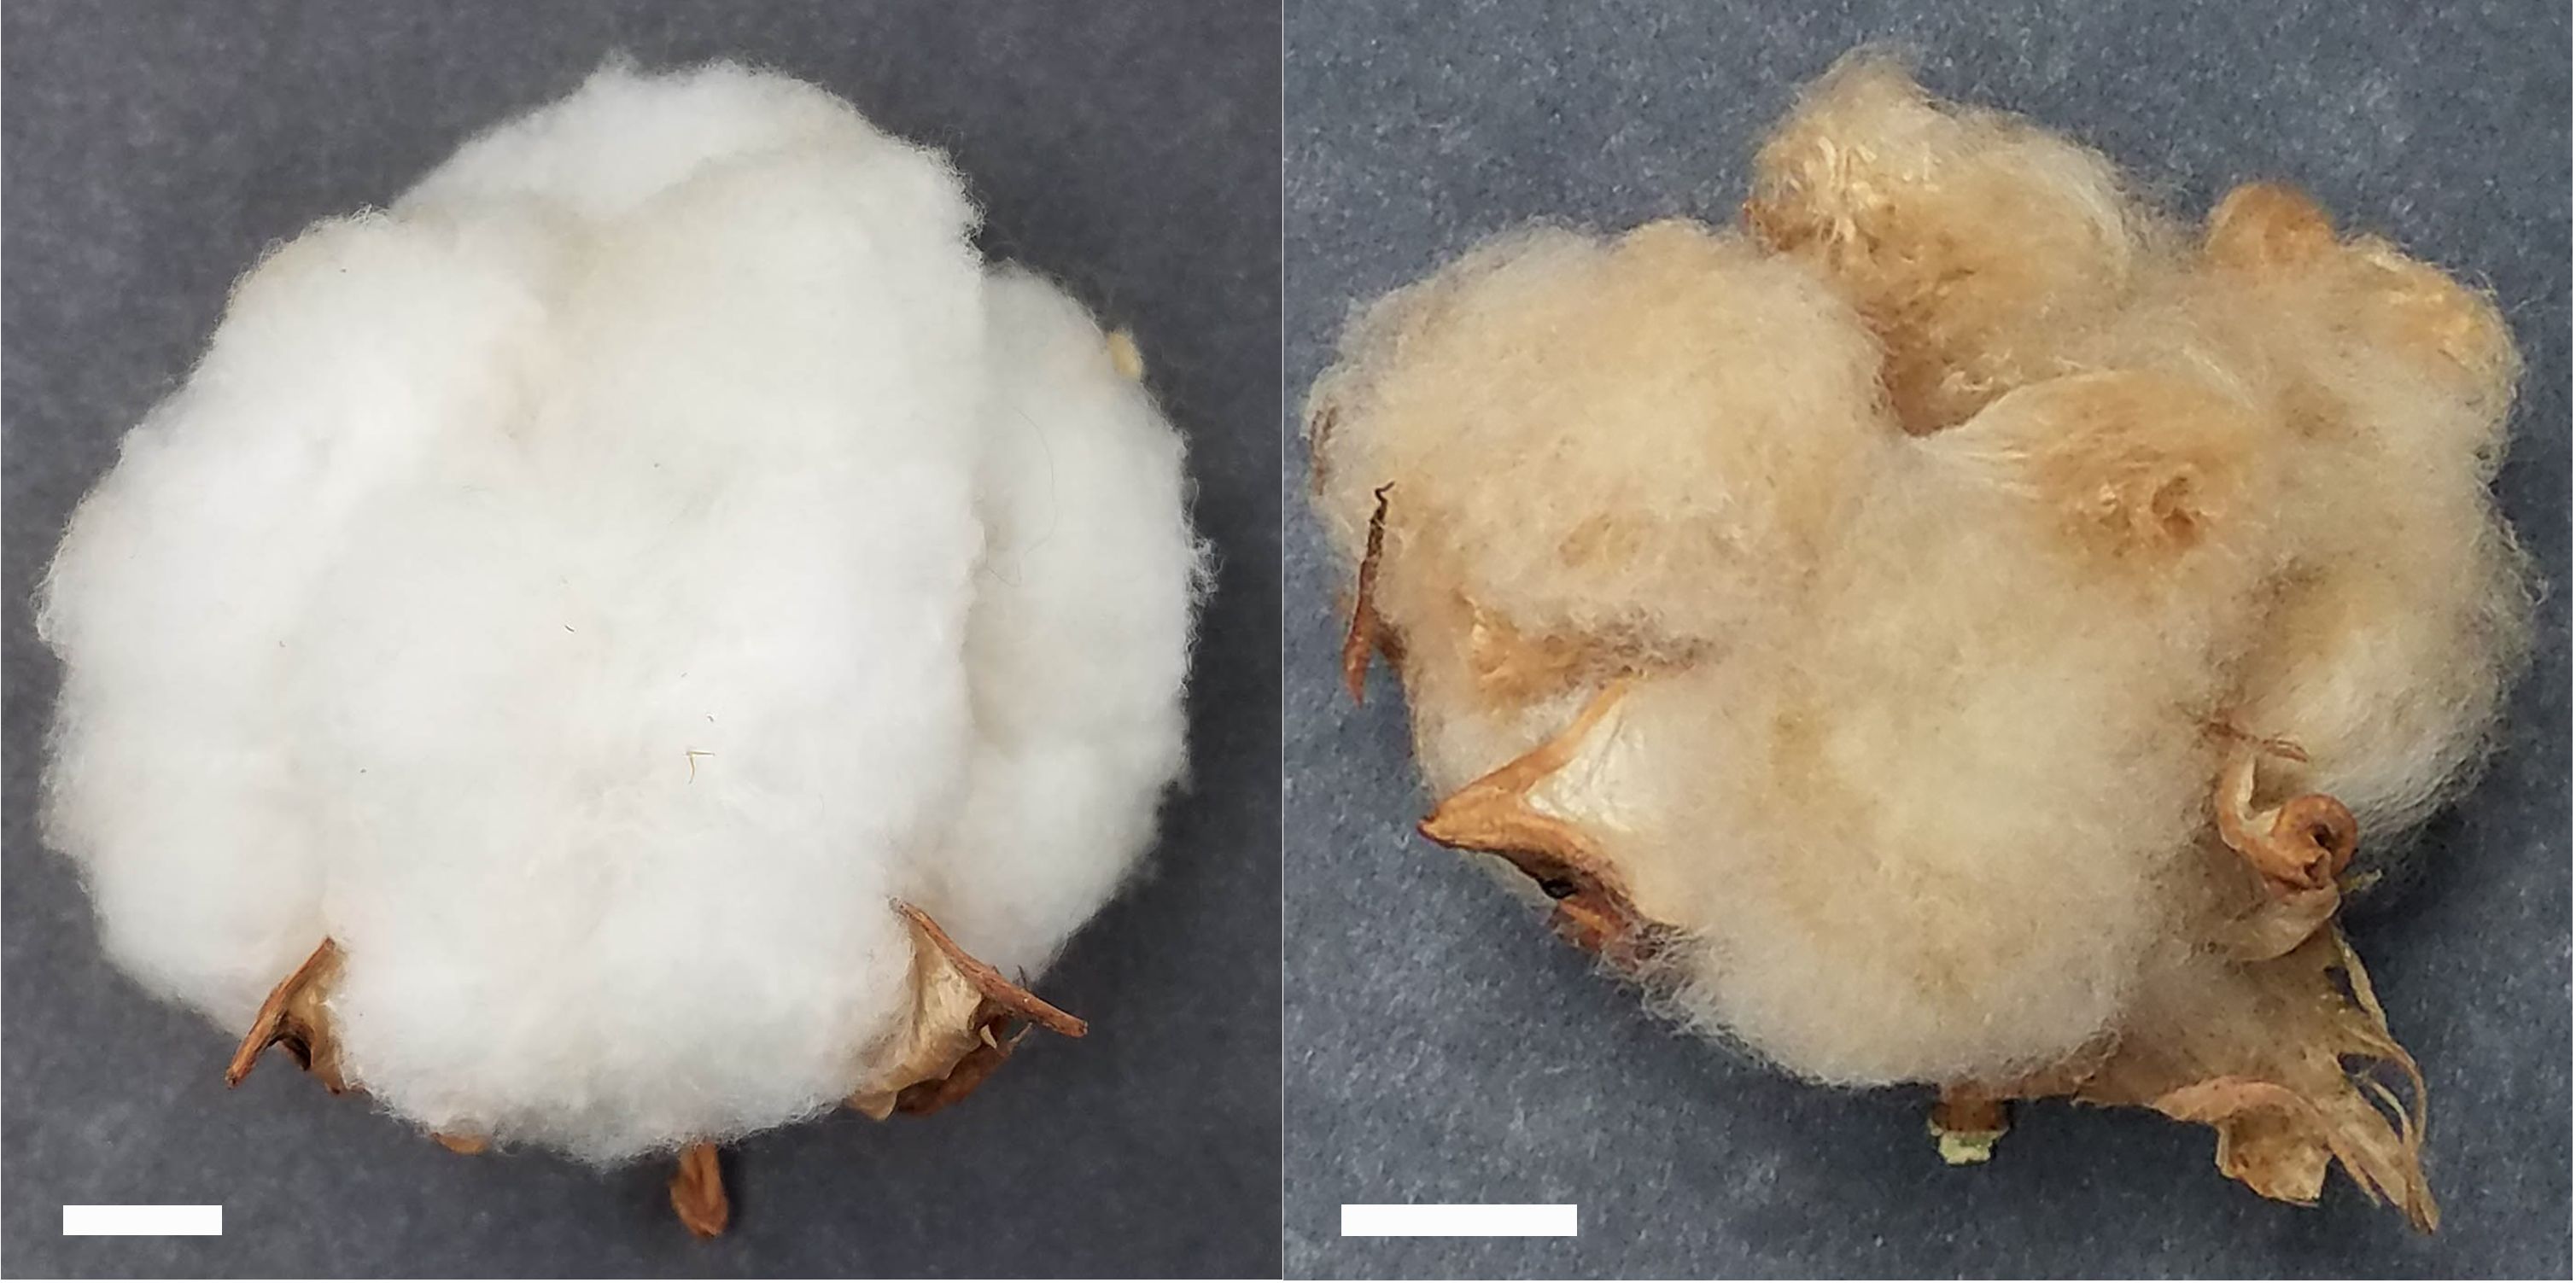
Figure 1. Open bolls of TM-1 (left) and SA-40 (right) cotton lines. Bar scale = 1cm shown in the lower left corner of each image.
CIELab color space analysis confirmed notable differences in fiber color parameters between these lines (Table 1). SA-40 fibers had a markedly lower L* value (indicating lower lightness or brightness) compared to TM-1, consistent with the darker appearance of brown fiber. Conversely, SA-40 showed higher positive a* and b* values, reflecting a stronger red and yellow hue component, respectively, relative to the essentially neutral white fiber of TM-1. These shifts in L*a*b* coordinates quantitatively characterize the rust-brown coloration of SA-40 fibers.
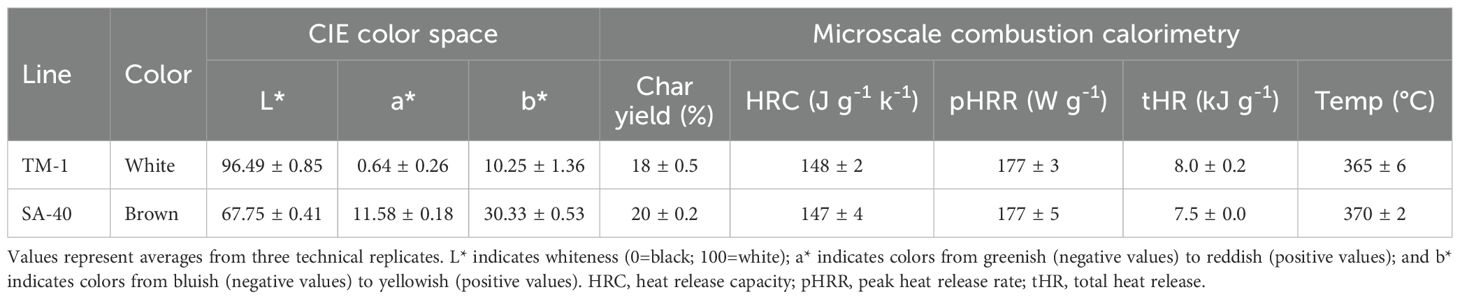
Table 1. CIELab color space values and microscale combustion calorimetry of TM-1 and SA-40 mature fibers.
In genetic crosses, the brown fiber trait exhibited incomplete dominance. F1 hybrids from the cross between SA-40 (brown fiber) and TM-1 (white fiber) produced tan-colored lint intermediate between the two parents, rather than purely brown or white. This intermediate phenotype in F1 indicates that the rust-brown allele is only partially dominant over the white allele. In the F2 generation, the observed segregation between brown/light brown (395) and white (113) lint phenotype fitted the expected 3:1 ratio with (p-value 0.15), consistent with a single gene inheritance. Thus, SA-40’s rust-brown fiber phenotype is governed by a single locus displaying partial dominance, as evidenced by the F1 fiber color and Mendelian segregation patterns, and this locus produces measurable shifts in standard colorimetric indices relative to white fiber.
3.2 Enhanced FR in F2 segregating population
Mature fibers of each individual of the F2 segregating population were measured in the CIELab color space, and ΔE values were calculated (Supplementary Data Sheet 1). The samples were separated into three groups based on significantly (p< 0.0001) differentiated colors: brown, cream, and white (Figure 2A). FR of fibers from a randomly selected subset of samples (69) from each group and parents were tested with MCC (Supplementary Data Sheet 2).
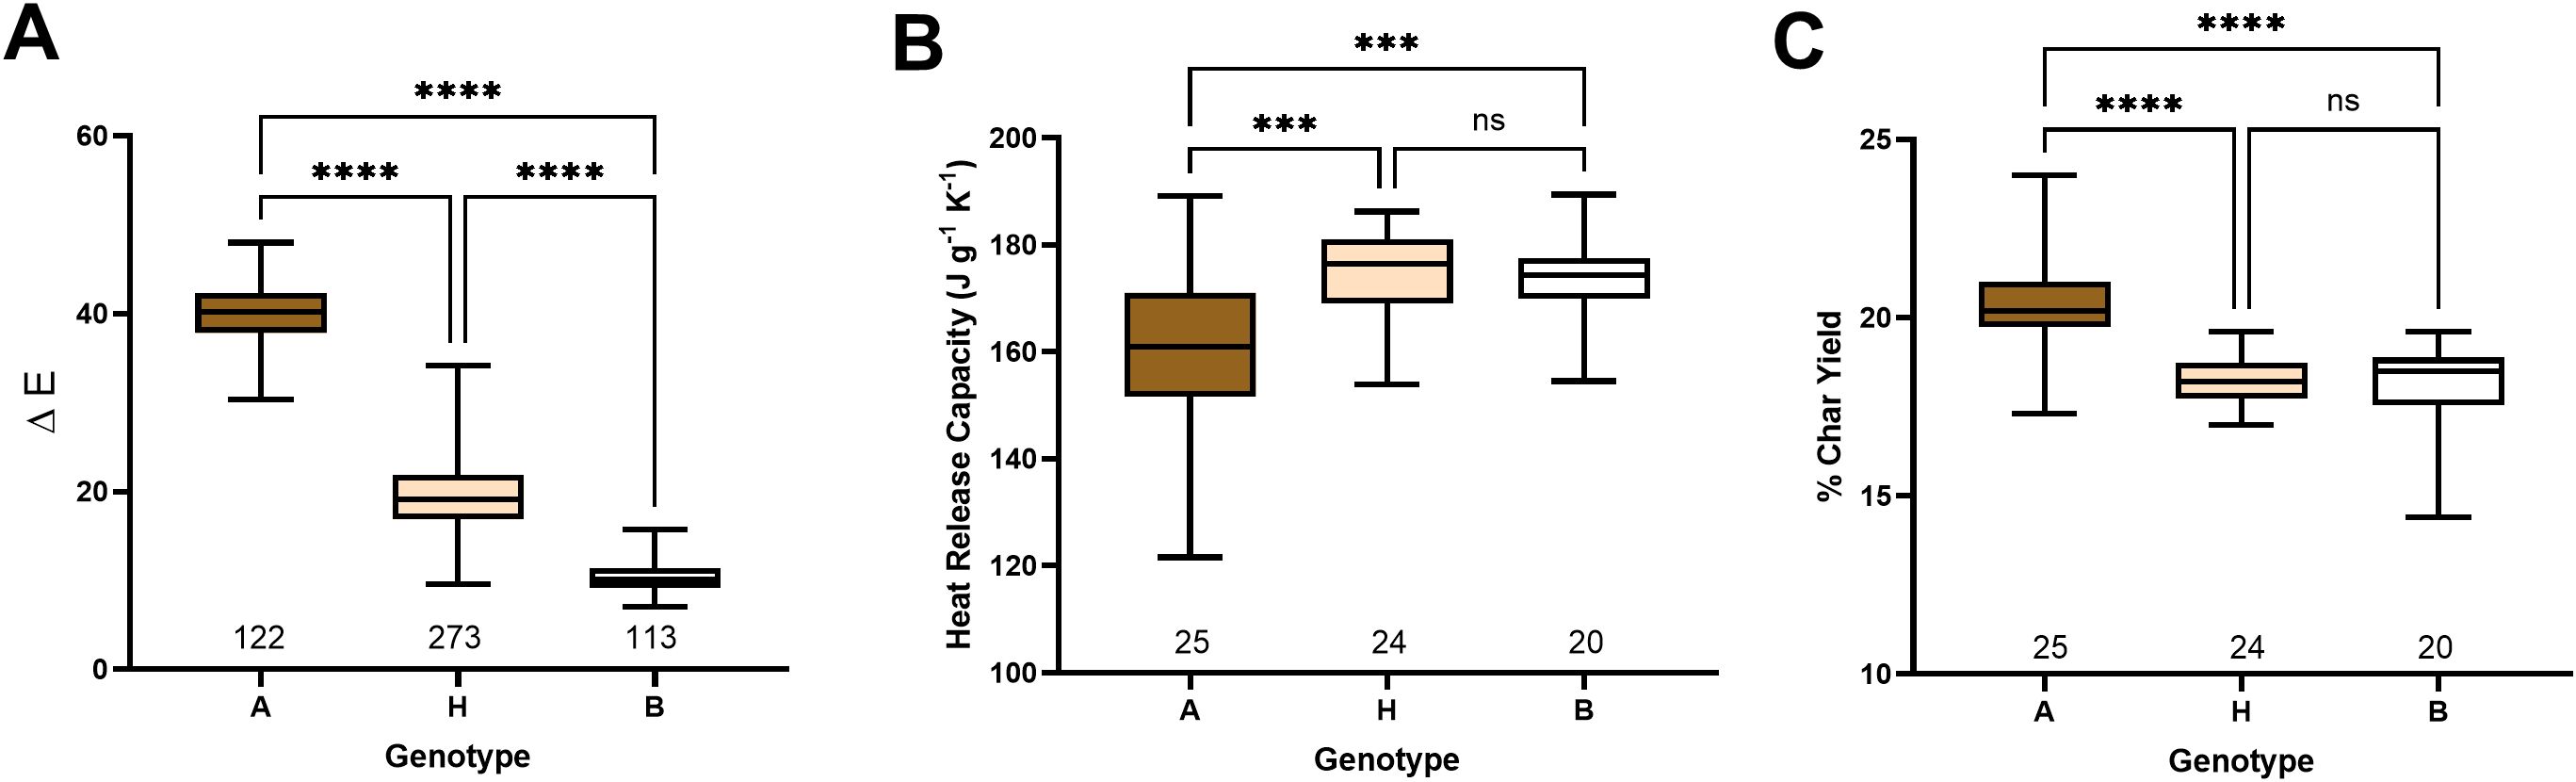
Figure 2. Color and FR segregation in the F2 population. (A) Box plot of CIELab color space measurements of segregating F2 population. Box plots of heat release capacity (B) and % of char yield (C) measured by microscale combustion calorimetry of selected individuals from the F2 population. The X-axis shows the number of samples in each group: A - brown, H – cream, and B – white colored cotton. Asterisks indicate the level of statistical significance, as determined using a one-way ANOVA multiple comparisons test with Tukey’s honest significant difference (Tukey, 1949). ***p-value < 0.001, ****p-value < 0.0001.
MCC analysis revealed a similar heat release profile during combustion between SA-40 and TM-1 fibers (Table 1). However, F2 segregating samples showed a significant FR difference between brown and cream and white, but not between cream and white (Figures 2B, C). Quantitatively, fiber samples from the brown group yielded a lower heat release capacity (p<0.001) than the white or cream groups, indicating a slower, less intense combustion (Figure 2B). At the same time, the percentage of the sample not consumed or char yield was significantly (p<0.001) elevated in the brown group than in the cream or white, reflecting a higher level of inorganic material in the brown samples (Figure 2C).
While neither parent exhibited notable FR properties, the FR trait manifested in the F2 progeny only in the brown lint group of samples, indicating transgressive segregation of this trait (Figure 2, Supplementary Data Sheet 1). The transgressive segregation of the FR trait has also been reported in a multi-parent advanced generation intercross (MAGIC) population of white lint cotton, suggesting that FR is not necessarily linked to the colored lint trait (Thyssen et al., 2023). However, in this study, we observed significantly enhanced FR properties in only the brown-lint samples, indicating that multiple factors contributed to that trait. It has been proposed that the accumulation of proanthocyanidin pigments (condensed tannins) in brown fibers may chelate inorganic salts or otherwise alter the fiber’s chemistry to promote char formation, thereby reducing flammability (Hinchliffe et al., 2015, 2016; Nam et al., 2017, 2016). It is also possible that the unknown FR compound is synthesized in developing fibers and segregated by PA precursors via metal-flavonoid complexes (Hinchliffe et al., 2016). Therefore, the accumulation of brown pigments could enhance FR properties in the brown fiber F2 progeny plants.
3.3 Genetic mapping of the rust-brown trait locus
BSA was utilized to develop markers for mapping the genetic locus associated with the rust-brown fiber trait. We created two pools of DNA from F2 segregating plants that exhibited contrasting phenotypes, as determined by CIELab color space. The first pool consisted of brown-colored cotton plants, while the second pool included white-colored cotton plants for the BSA. In the brown-colored bulk, each plant carries the mutation locus from the SA-40 genome, whereas the white-colored bulk contains plants with the TM-1 genomic region at the same locus. After performing genome-wide subtraction of the identical SNPs and Indels between the two bulks, we identified a significant peak with approximately 2,000 different variants on chromosome A07 (see Figure 3).
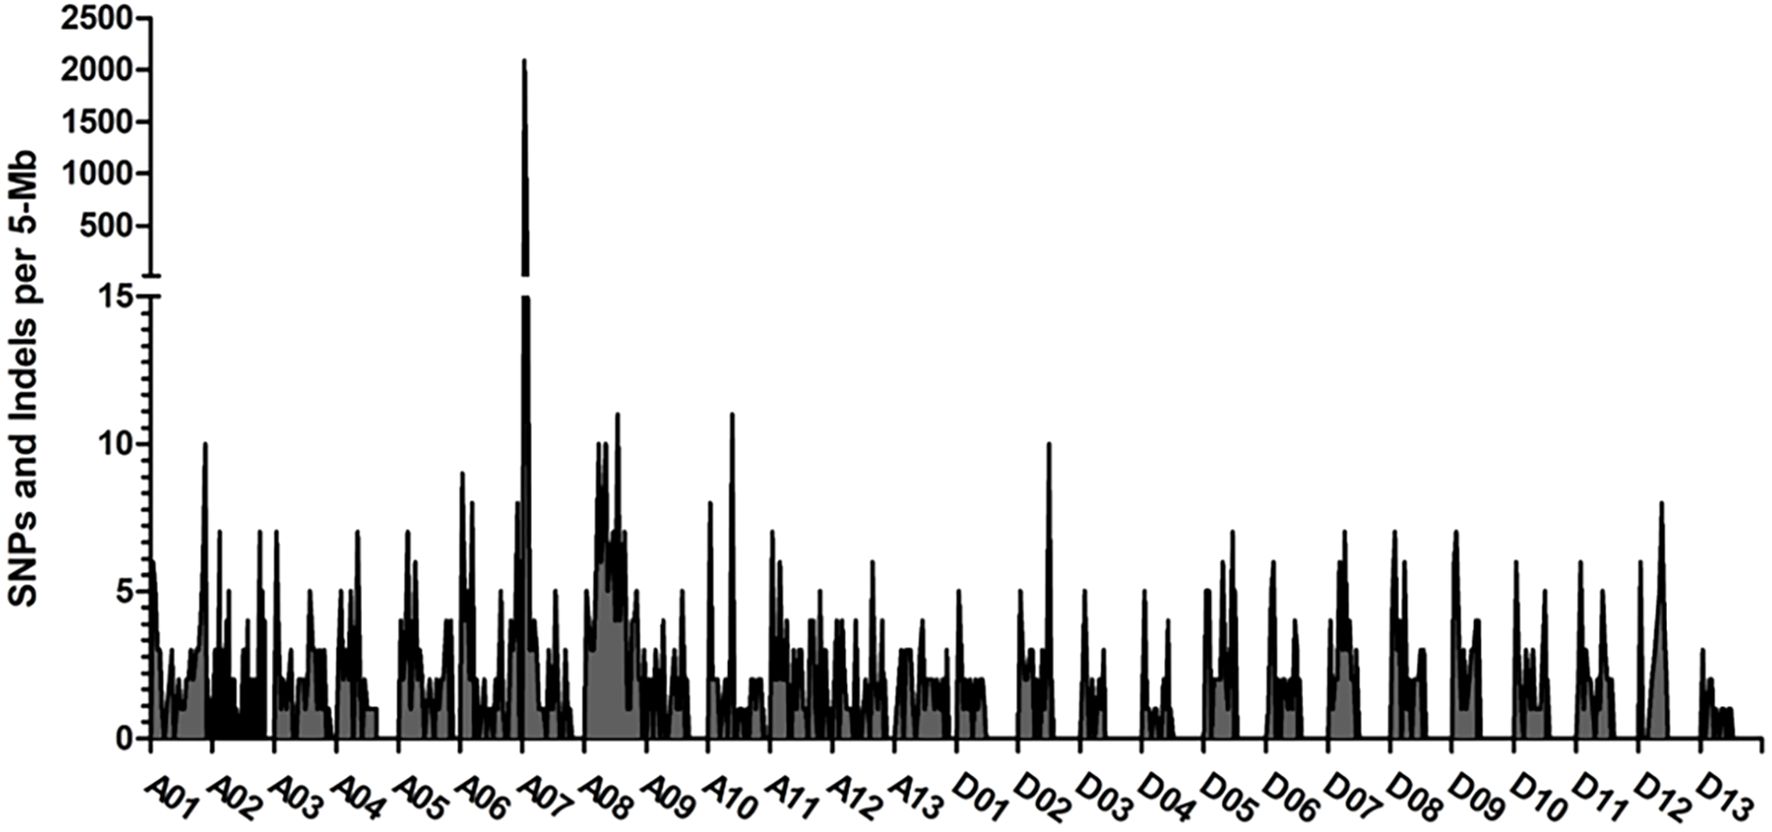
Figure 3. Distribution of sequence polymorphisms between the brown and white fiber bulked samples of the segregated F2 population. The frequencies of SNPs/Indels across the genome were obtained by the subtraction of the same variants between the bulks. The largest peak of different SNPs was observed at chromosome A07. Axis Y shows the number of variants per 5 Mb interval, and axis X shows the variants across the G. hirsutum genome.
The bin size in the frequency plot shown in Figure 3 is 5 MB. We hypothesized that the genomic region associated with this peak might harbor a locus for the rust-brown trait; therefore, we developed SNP markers within this interval (see Supplementary Table 1). Analysis of the SNP markers in the segregating F2 population revealed that the brown-rust locus was flanked by SNP markers CC0001 and CCU0011, spanning a genomic region of approximately 3.37 million base pairs (Figure 4). The marker CFBU0022 completely co-segregated with the rust-brown phenotype Supplementary Data Sheet 1). Figure 4A displays 40 recombinant plants from the mapping population, with the SNP marker CFBU0022 showing positive PCR results only for the samples exhibiting brown (a) or cream (h) fiber phenotypes.
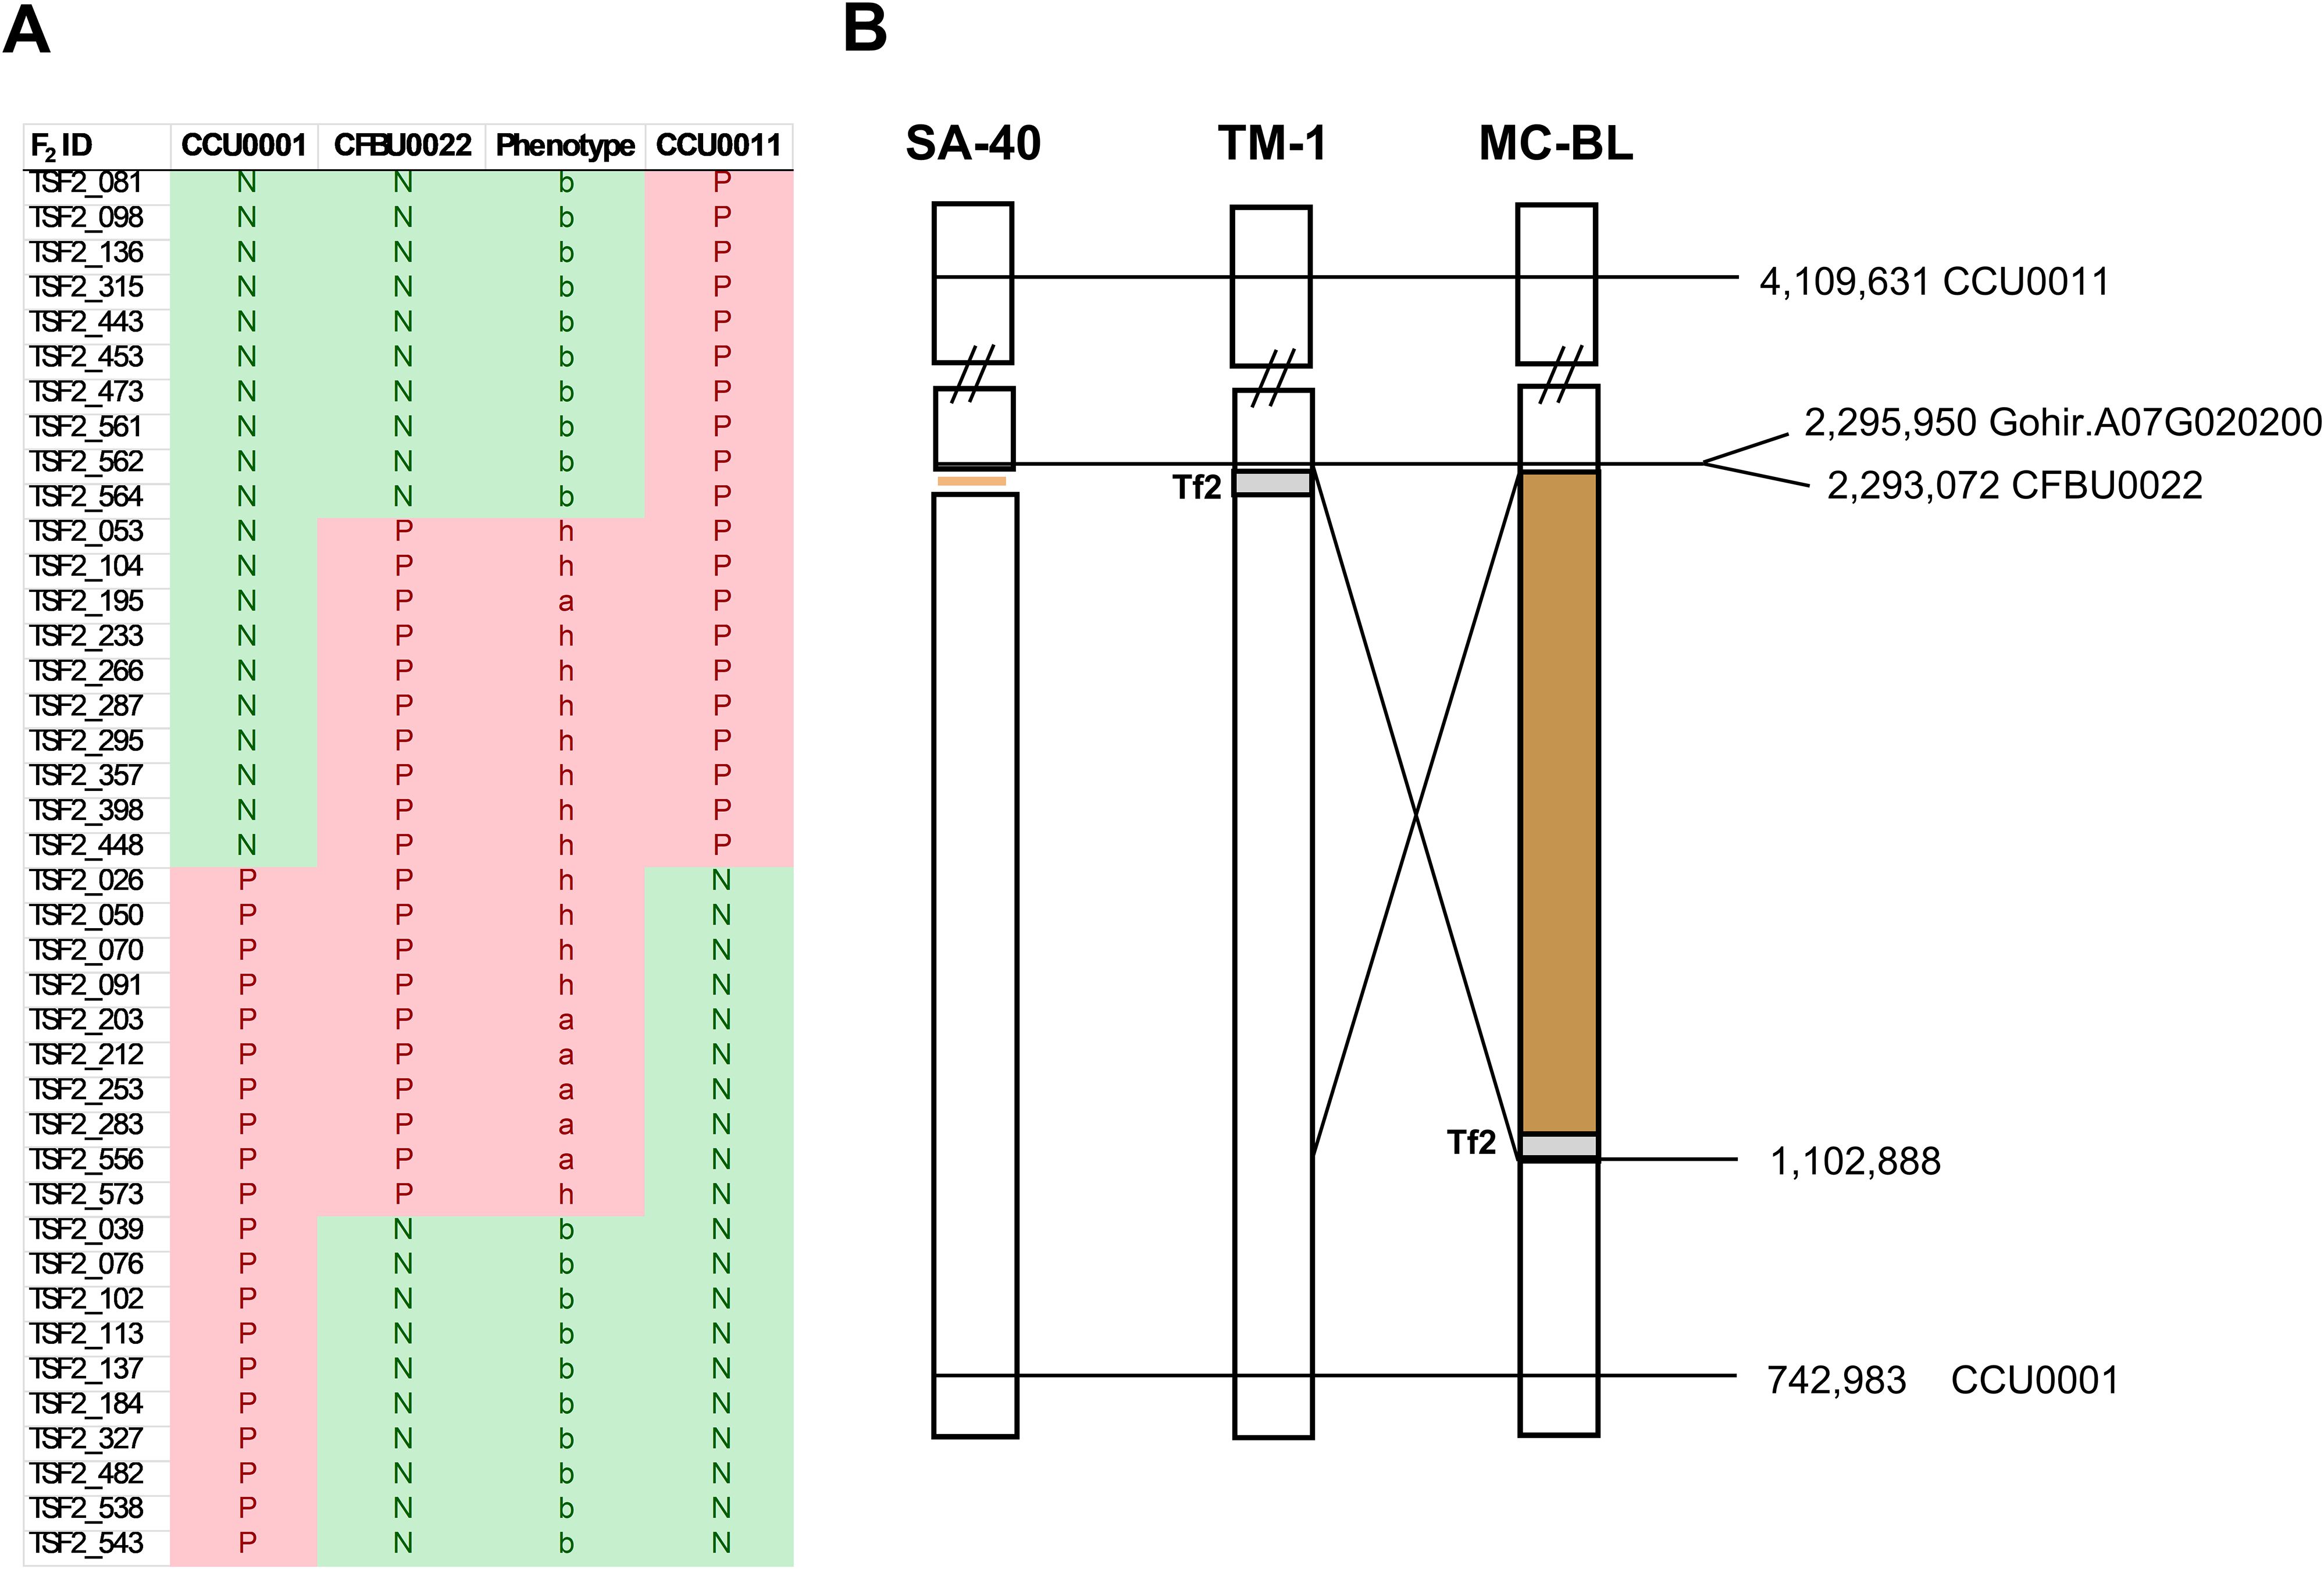
Figure 4. Physical maps of Lc1 loci in SA-40, MC-BL, and TM-1. (A) Recombinant plants from the F2 population. PCR was performed with SNP primers specific to the mutant (rust-brown) genotype; therefore, the result is shown as ‘N’ negative or ‘P’ positive. (B) The physical distance between markers on chromosome A07, according to the JGIv1 TM-1 reference genome assembly, is shown in base pairs. Positions and names of the markers are displayed on the right side of the diagram. The diagram shows Tf2, an LTR retrotransposon in TM-1, which is absent in SA-40 and has been relocated to 1.4 million base pairs away from Gh_TT2_A07 (Gohir.A07G02200) gene due to a structural rearrangement in the MC-BL line.
Marker CFBU0022 is positioned 2.9 kb from the start codon of the GhTT2-A07, making this gene a leading candidate within the mapped interval. The mapped genetic locus of the SA-40 rust-brown trait coincides with the previously well-characterized Lc1 genetic locus for natural brown cotton (Hinchliffe et al., 2016; Kohel, 1985; Li et al., 2012; Wen et al., 2018). To investigate allelic differences at GhTT2_A07, we compared the genomic sequence of this gene and its adjacent regions from SA-40 and TM-1. Notably, SA-40 misses a ~10.7-kb sequence in the upstream regulatory region of GhTT2_A07 compared to TM-1. This absent sequence harbors a retrotransposon, which is present in the reference TM-1 genome approximately at 7.5 kb upstream of the GhTT2_A07 coding sequence.
Blast search of the retrotransposon sequence showed the highest similarity (93% nucleotide identity) to predicted Gossypium raimondii transposon Tf2–1 polyprotein (XM_052634828.1). The structure of this retrotransposon in the G. hirsutum TM-1 consists of two mostly identical long terminal repeats (LTRs) with 5’LTR 2877 bp and 3’LTR 2879 bp, and three predicted ORFs in the polyprotein, all together 4687 bp (Supplementary Figure 1). The Tf2 retrotransposon belongs to the class of LTR retrotransposons of the Ty3/Gypsy family of the Metaviridae group. It is a well-studied element in the genome of Schizosaccharomyces pombe (Cui and Guo, 2022; Jia et al., 2023). Ty3-like LTR retrotransposons proliferate in plants through a “copy-and-paste” mechanism (Kumar and Bennetzen, 1999). They generally leave recognizable signatures when they move, such as target site duplications or residual LTR sequences; however, under certain circumstances, such as homologous recombination or large structural rearrangements, the LTR retrotransposon can be removed without leaving a trace (Kumar and Bennetzen, 1999; Neumann et al., 2019).
We observed that the structural rearrangement in the MC-BL line relocated the Tf2 retrotransposon 1.4 million base pairs away from the GhTT2_A07, resulting in upregulation of this gene (Figures 4, 5). However, careful evaluation of the GhTT2_A07 promoter region in the SA-40 line revealed that no signatures remain from the Tf2 retrotransposon. Retrotransposons are known to spread epigenetic silencing to neighboring regions (Eichten et al., 2012). We speculate that in the SA-40 line, the absence of the Tf2 retrotransposon upstream of the GhTT2_A07 gene does not inhibit its transcriptional activity, resulting in the production of rust-brown fiber. In contrast, the presence of the retrotransposon insertion upstream of the GhTT2_A07 gene in the TM-1 line reduces the activity of GhTT2_A07, leading to decreased production of PAs and, consequently, no brown coloration. To support our hypothesis, we tested 132 white cotton accessions (Thyssen et al., 2025) for the presence of the Tf2 retrotransposon in the promoter region of the GhTT2_A07. All tested white cotton cultivars contained the Tf2 retrotransposon upstream of the GhTT2_A07 (Supplementary Data Sheet 3).
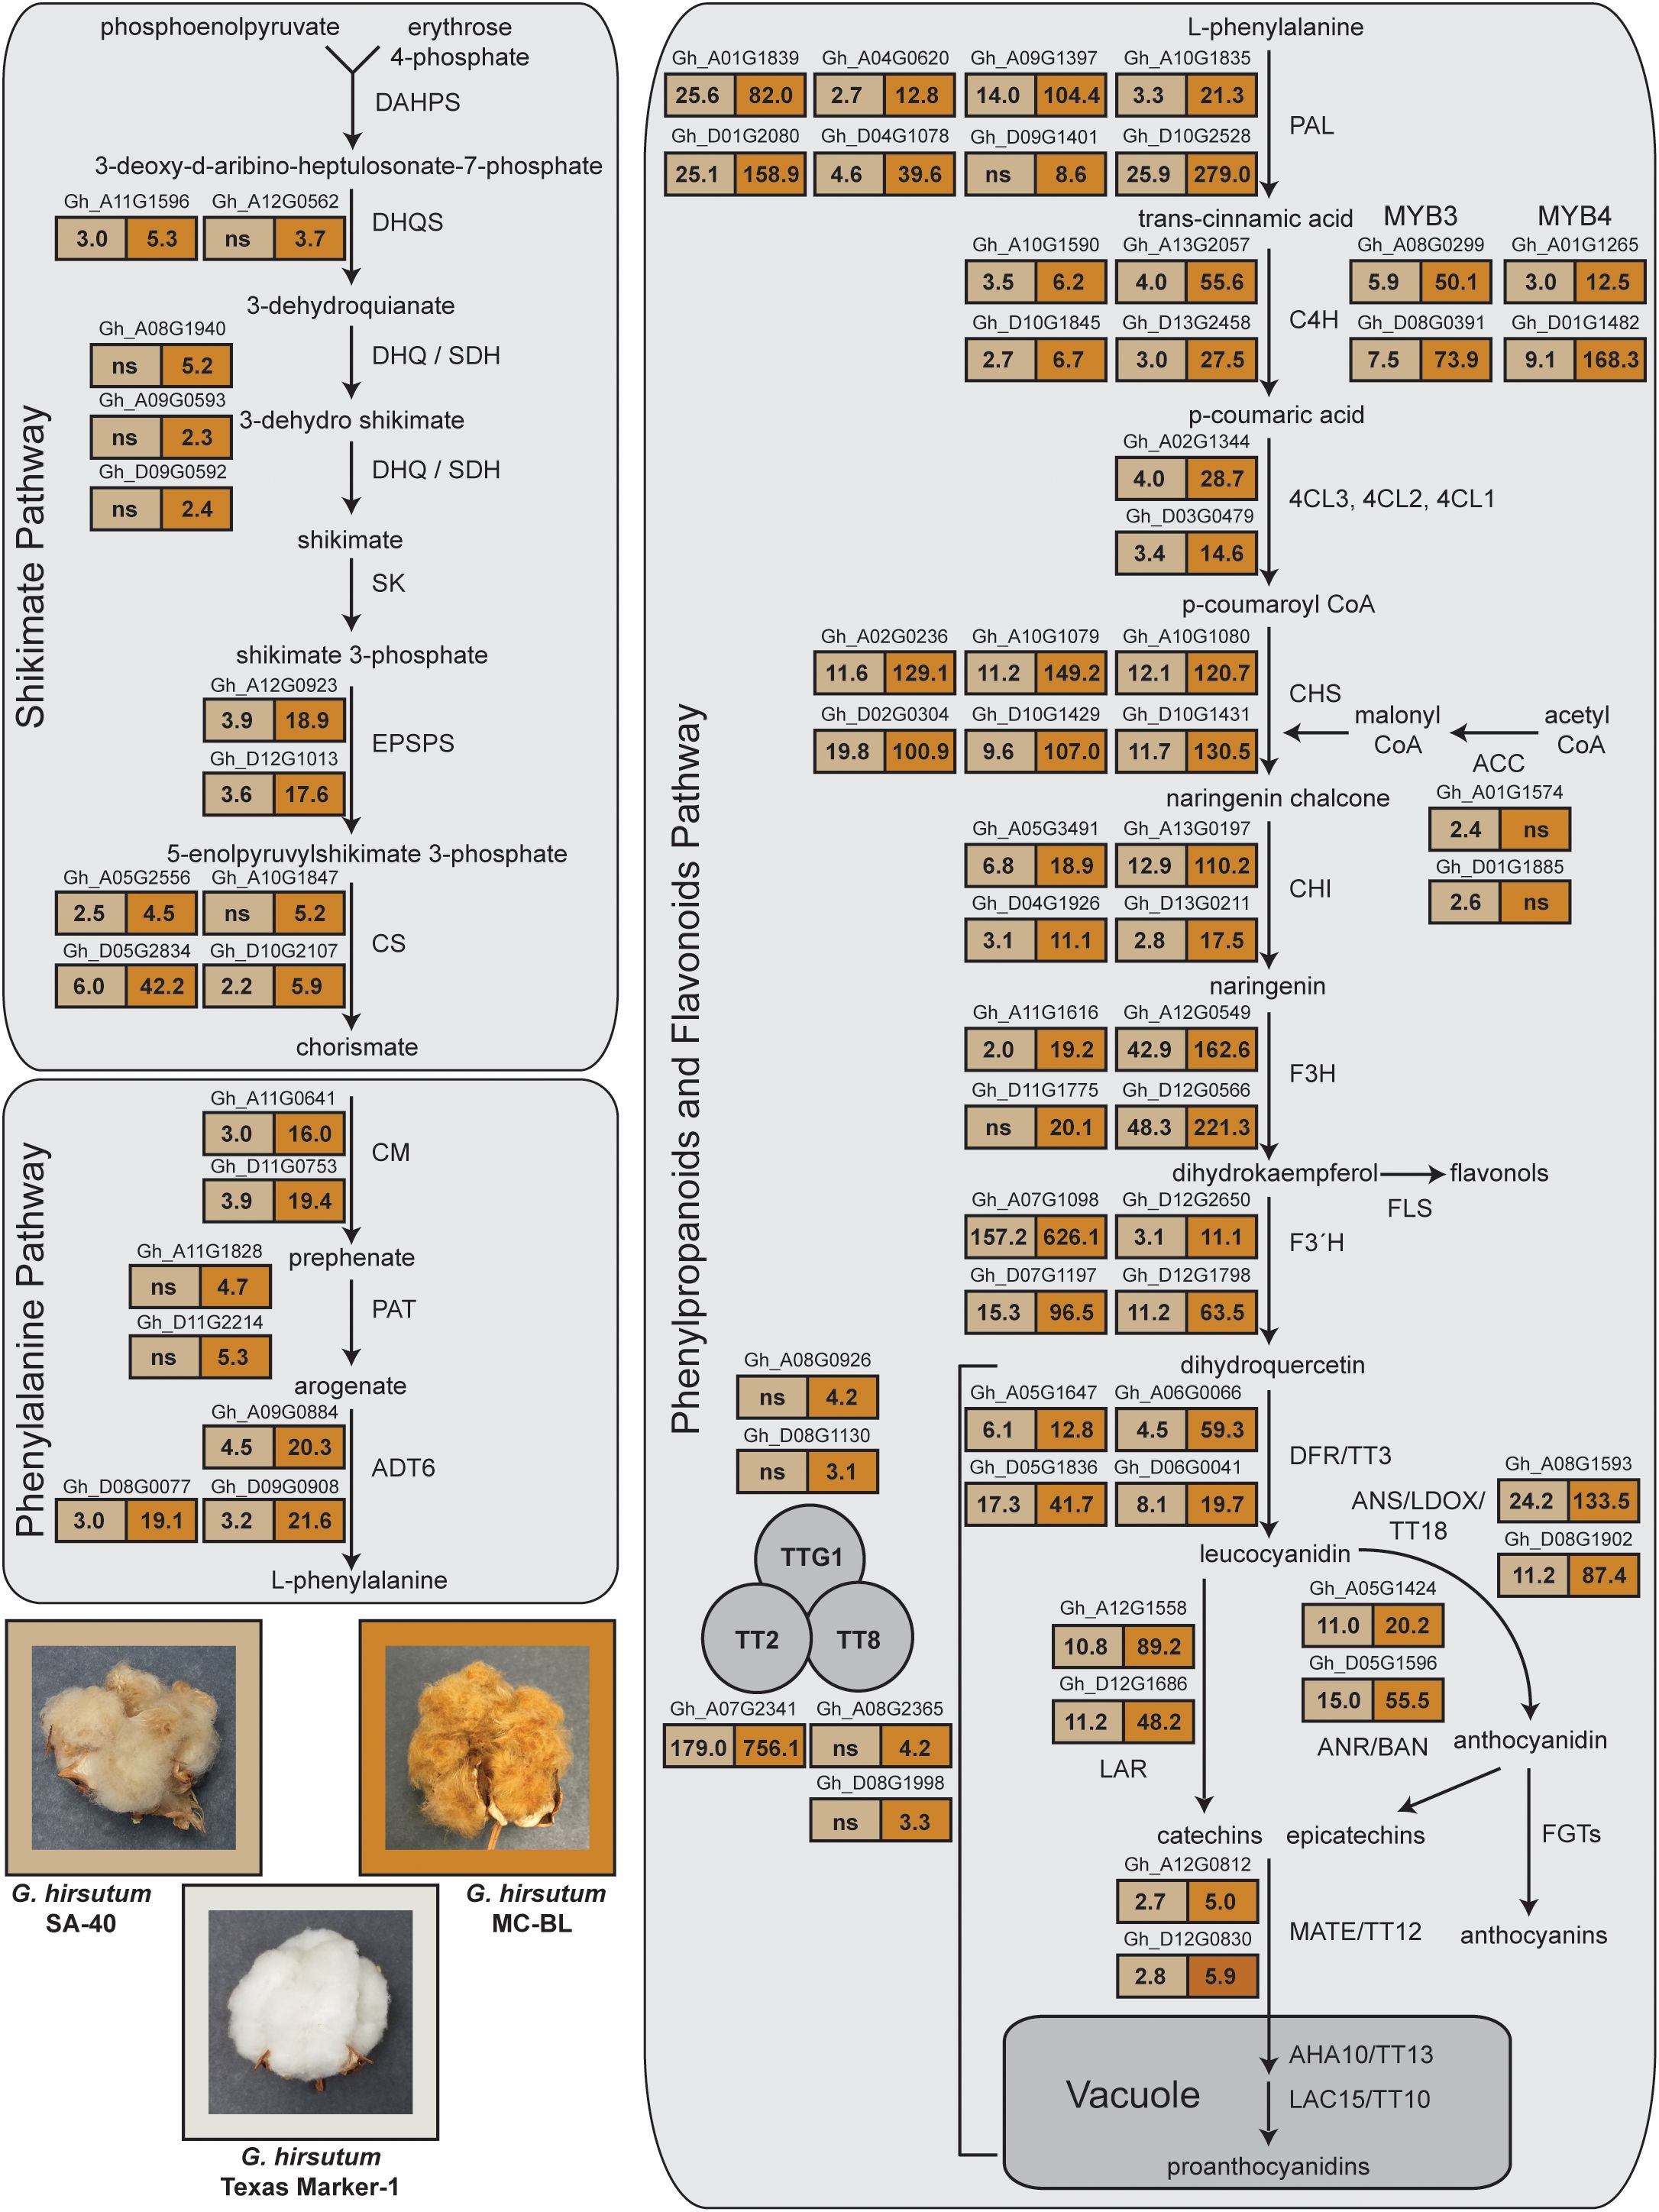
Figure 5. RNAseq analysis of gene expression from shikimate, phenylalanine, phenylpropanoid, and flavonoid pathways. RNA was evaluated from developing cotton fibers at 10 DPA. Images of open bolls from the SA-40, MC-BL, and TM-1 lines are shown in the bottom left corner of the figure. The boxes in the figure display the fold change values of gene expression in comparisons between SA-40 and TM-1, as well as between MC-BL and TM-1. The boxes are filled with two colors: light brown for SA-40 and brown for MC-BL, reflecting the hues of the cotton fibers from these lines. Significantly upregulated genes (more than 2-fold, DRF < 0.05) are indicated above the boxes displaying the fold change; gene names are provided from the G. hirsutum TM-1 genome (Zhang et al., 2015). See also <xr rid="sf5">Supplemental Data 3</xr> for details of ANOVA analysis of RNAseq data.
3.4 Absence of retrotransposon upstream of the GhTT2_A07 gene corresponds with its higher transcriptional activity
TM-1, a white cotton, harbors the Tf2 retrotransposon upstream of the GhTT2_A07 gene, while SA-40, a rust-brown fiber variety, does not. In MC-BL, a dark brown cotton line, the Tf2 retrotransposon was relocated 1.4 million bp away. To evaluate the transcript activity of genes involved in the proanthocyanidin (PA) pathway, we performed comparative RNAseq analysis of developing fiber samples at 10 DPA between SA-40/TM-1 and MC-BL/TM-1. TM-1 was selected as the baseline for comparative analysis since GhTT2_A07 expression was lowest among the cotton lines.
Analysis of Variance (ANOVA) in gene expression between SA-40 and TM-1 detected 1,770 genes that were significantly (FDR<0.05, two-fold) differently expressed (DEGs), while between MC-BL and TM-1 identified 14,898 DEGs, which is eight times more (Supplementary Data Sheet 4). Among those genes, we found 73 upregulated genes annotated as part of the shikimate, phenylalanine, phenylpropanoid, and flavonoid pathways (Figure 5). GhTT2_A07, a part of the MBW complex, was upregulated 179-fold in SA-40 and 756-fold in MC-BL compared to TM-1. At the same time, two copies annotated as TTG1 and two copies of the TT8 genes were upregulated 3–4 times only in MC-BL (Figure 5).
Upregulation of the GhTT2_A07 gene resulted in coordinated increases in the expression of genes involved in phenylpropanoid and flavonoid pathways, as well as their precursors of shikimate and phenylalanine biosynthesis. Different intensity upregulation of the GhTT2_A07 in SA-40 and MC-BL proportionally activated the transcriptional activity in the cohorts of the genes affected by TT2 (Figure 5). Genes involved in the final steps of PA biosynthesis, including anthocyanidin synthase (ANS), anthocyanidin reductase (ANR), and leucoanthocyanidin reductase (LAR), as well as vacuole transporters MATE/TT12, were proportionally upregulated in both lines. The expression data agreed with the visual phenotype: the higher GhTT2_A07 expressed, the darker brown fiber coloration developed in the cotton lines.
4 Discussion
4.1 Retrotransposon upstream of GhTT2_A07
The primary objective of this study was to determine the genetic basis of the rust-brown fiber coloration in the cotton line SA-40. The mapping of the F2 segregating population of 508 individuals showed an association of the rust-brown phenotype with the GhTT2 gene on chromosome A07 (Figure 4), which coincides with the Lc1 locus (Hinchliffe et al., 2016). Comparative analysis of the upstream region of GhTT2_A07 between TM-1 and SA-40 revealed a missing sequence of the Ty3-like LTR retrotransposon in the SA-40 line. We do not think that the SA-40 line lost the LTR retrotransposon since there were no traces of it left (Kumar and Bennetzen, 1999). We speculate that the white cotton variety obtained a copy of the LTR retrotransposon upstream of GhTT2_A07 during evolution and was preferentially selected during cotton domestication due to agronomical advantages.
The occurrence of the Ty3-like LTR retrotransposon upstream GhTT2_A07 in TM-1 corresponds with lower transcriptional activity of this gene and, consequently, colorless (white) cotton fibers. GhTT2_A07 is an R2R3 MYB transcription factor named for its homology to the Arabidopsis TRANSPARENT TESTA 2 (TT2) gene. TT2 in Arabidopsis is a well-characterized regulator of PA (condensed tannin) biosynthesis in seed coats (Nesi et al., 2001). The loss or gain of transposable element (TE) insertions can markedly influence nearby gene expression by disrupting cis-regulatory sequences, providing novel regulatory information, or altering chromatin state (Hirsch and Springer, 2017). For example, an LTR retrotransposon insertion upstream of the MdMYB1 gene, a known activator of the anthocyanin pathway, was linked to the red fruit color of apples (Zhang et al., 2019). In Capsella rubella, a TE insertion at the 3’ UTR of FLOWERING LOCUS C reduced its expression level, which promoted flowering (Niu et al., 2019). TE-mediated silencing of important metabolic genes has precedent in cotton; for example, a T-DNA inserted into a retrotransposon upstream of a flavonol O-methyltransferase (GhOMT1) led to suppressed GhOMT1 activity and concomitant over-accumulation of anthocyanin pigments in fiber (Ke et al., 2022).
TEs’ influence on adjacent gene expression by changing their chromatin state is well documented (Hirsch and Springer, 2017). It is known that the majority of TEs are epigenetically silenced and that this silencing can spread to adjoining sequences. A study in maize surveyed multiple retrotransposon families and found that some families can spread heterochromatin marks to nearby genes, lowering their expression levels (Eichten et al., 2012). In yellow mustard, retrotransposon insertion changed the chromatin state of the adjacent FAE1 gene and reduced its expression (Zeng and Cheng, 2014).
These examples underscore how TE insertions or excisions can act as cis-regulatory toggles, creating heritable variations that influence biochemical pathways. From an evolutionary standpoint, the LTR retrotransposon upstream of GhTT2_A07 may have been acquired in certain cotton lineages and preferred during human selection due to longer, stronger fiber and higher yield. NCCs were historically abundant (Crawford, 1924; Ware, 1932), but white fiber became dominant, especially in recent years, likely because it was easier to dye and had better fiber quality (Lee and Fang, 2015). The retrotransposon insertion upstream of GhTT2_A07 that turned off the PA pathway would confer a selective advantage under domestication by yielding desirable white fiber.
The finding in the current study closely parallels the previously characterized Lc1 locus, which identified a 1.4 Mb inversion upstream of the GhTT2_A07 gene in the MC-BL dark brown fiber line (Hinchliffe et al., 2016). The 1.4 Mb inversion removed the retrotransposon away from the GhTT2_A07 gene; however, in that case, the absence of the retrotransposon not only returned the expression level to the original state as in SA-40 but increased it even higher, probably due to new regulatory elements brought with the new sequence (Figure 4). Elevated expression of GhTT2_A07 triggers up-regulation of downstream flavonoid biosynthetic genes, ultimately driving the accumulation of PAs (condensed tannins) that impart a brown hue to the mature fibers (Yan et al., 2018). Notably, the GhTT2_A07 up-regulation in SA-40 is quantitatively lower than that reported for the Lc1 inversion allele, correlating with the lighter “rust-brown” color of SA-40 fibers compared to the dark brown MC-BL phenotype.
The current study found that the gradation in color intensity depends on the dosage of expression of the GhTT2_A07. However, other mechanisms of color shade manipulation have also been reported. Two epistatic QTLs found on chromosome A07, one corresponding to TT2 (qBF-A07-1) and another to TTG1 (qBF-A07-2), govern the shades of brown fiber (Wen et al., 2018). Their study is consistent with our observation: TT2 and TTG1 are both part of the MBW complex, where TT2 initiates the PAs production, while TTG1 affects the processing activity of TT2. Together, our results confirmed the GhTT2_A07 as a key regulator of cotton fiber pigmentation and demonstrated that retrotransposon activity can modulate the PA pathway to produce different shades of brown cotton fibers.
4.2 FR phenotype
The SA-40 fibers have no significant difference in FR properties compared to TM-1 fibers (Table 1); however, fibers of their F2 brown-colored progeny (group A) showed significantly enhanced FR (Figure 2). These results suggest that a new combination of alleles of genes occurred in the progeny that resulted in the FR trait being superior to that of its parents; this phenomenon is known as transgressive segregation. A similar observation has also been reported for the FR trait in the MAGIC population of white lint cotton, where four lines exhibited significant FR properties. The flammability test under standard 45˚ incline for fabrics produced from fibers of these four lines showed self-extinguishing properties (Thyssen et al., 2023).
Thyssen et al. (2023) suggested that FR is not a necessary attribute of brown fibers since white fibers can be flame retardant as well. The authors speculated that the colorless flavonoids accumulated in white cotton lines may share the ring structure that has been proposed to contribute to the FR properties of tannins (Nam et al., 2017). In the current study, significantly enhanced FR properties were detected only in the brown colored group samples that accumulated a higher amount of PA pigments. Therefore, other factors can be considered, such as: the accumulation of PAs (condensed tannins) in brown fibers may chelate inorganic salts as well as unknown FR compounds that can alter the fiber’s chemistry to promote char formation, and reduce flammability (Hinchliffe et al., 2015, 2016; Nam et al., 2017, 2016; Naoumkina et al., 2024).
In the previously reported MC-BL line, dark brown fibers accumulated higher levels of sodium, potassium, and other inorganic elements (Hinchliffe et al., 2016). The authors also observed that the FR effect in MC-BL manifests early in fiber development, well before brown pigmentation is visible. In SA-40, a similar biochemical scenario is likely at play. Our RNA-seq data confirmed the activation of the PA pathway in developing SA-40 fibers, presumably leading to the accumulation of flavanol units (e.g., catechin, epicatechin) and their oligomers. Although we did not specifically isolate the responsible metabolite, it is reasonable to infer that partially polymerized PAs or their precursors endow lint of brown-fiber segregants with improved flame retardancy. Supporting this idea, simple water-based processing can diminish the FR advantage of brown cotton by extracting water-soluble tannins (Hinchliffe et al., 2015; Nam et al., 2016), demonstrating that the flame retardant component is leachable and likely composed of lower-molecular-weight polyphenols.
Future metabolomic analyses of SA-40 fibers at progressive developmental stages could help pinpoint the specific compounds responsible for flame retardancy, which has implications for both plant biology and textile science. Identifying the active FR metabolite(s) may facilitate the use of natural fiber chemistry to reduce reliance on added flame-proofing chemicals in cotton products. In summary, our findings illustrate how structural genomic variation at a single regulatory locus can drive complex trait outcomes (color and FR) and how understanding these mechanisms enables targeted breeding for multi-functional crop products.
5 Conclusion
In this work, we revealed that the absence of Ty3-like LTR retrotransposon insertion upstream of the GhTT2_A07 is linked to the rust-brown fiber phenotype in the SA-40 line. All of the tested 132 white fiber accessions harbored the retrotransposon insertion upstream of the GhTT2_A07. The SA-40 line, where the retrotransposon insertion did not occur, has a higher transcriptional activity of the GhTT2_A07 and produces a brown-rust fiber. In the dark brown fiber MC-BL line, where a large structural inversion has removed the retrotransposon, the activity of the GhTT2_A07 was detected at a much higher degree. The study findings suggest that the expression level of GhTT2_A07 directly controls the value of brown coloration in Lc1 fibers; the higher expression produces darker fibers.
Understanding the regulation of cotton fiber pigmentation and its connection to FR has practical implications for cotton improvement. It provides a way to naturally infuse fibers with desirable qualities, supporting initiatives to create sustainable textiles. Future work will focus on deploying this allele in breeding and perhaps isolating the specific metabolites responsible for FR. Ultimately, the knowledge gained from mutations in the Lc1 locus reinforces the concept that modulating key regulatory nodes in the flavonoid pathway can yield a spectrum of beneficial traits – from aesthetic fiber colors to enhanced safety – thereby pushing the boundaries of what natural plant fibers can achieve.
Data availability statement
The RNAseq data were submitted to the NCBI-SRA under the BioProject number PRJNA1291244.
Author contributions
GP: Software, Writing – original draft, Formal analysis. GT: Formal analysis, Writing – review & editing, Methodology, Investigation, Software. CM: Investigation, Writing – review & editing. PL: Writing – review & editing, Investigation. DF: Resources, Writing – review & editing. MN: Writing – original draft, Formal analysis. DH: Writing – review & editing, Formal analysis, Methodology, Investigation, Conceptualization.
Funding
The author(s) declare financial support was received for the research and/or publication of this article. This research was supported by the US Department of Agriculture (USDA), Agricultural Research Service. CRIS projects: 6054-41000-108-000D and 6054-21000-019-00D.
Acknowledgments
We thank Dr. Wayne Smith from the Department of Soil and Crop Sciences, Texas A&M University, College Station, TX, USA, for providing some of the white cotton accessions used in the study. The mention of trade names or commercial products is solely for the purpose of providing specific information and does not imply recommendation or endorsement by the USDA. USDA is an equal opportunity provider and employer.
Conflict of interest
The authors declare that the research was conducted in the absence of any commercial or financial relationships that could be construed as a potential conflict of interest.
Generative AI statement
The author(s) declare that no Generative AI was used in the creation of this manuscript.
Any alternative text (alt text) provided alongside figures in this article has been generated by Frontiers with the support of artificial intelligence and reasonable efforts have been made to ensure accuracy, including review by the authors wherever possible. If you identify any issues, please contact us.
Publisher’s note
All claims expressed in this article are solely those of the authors and do not necessarily represent those of their affiliated organizations, or those of the publisher, the editors and the reviewers. Any product that may be evaluated in this article, or claim that may be made by its manufacturer, is not guaranteed or endorsed by the publisher.
Supplementary material
The Supplementary Material for this article can be found online at: https://www.frontiersin.org/articles/10.3389/fpls.2025.1668965/full#supplementary-material
Supplementary Figure 1 | Map of Tf2 LTR Retrotransposon.
Supplementary Table 1 | SNP genetic markers for mapping.
References
Crawford, M. D. C. (1924). The heritage of cotton: the fibre of two worlds and many ages (New York and London, The Knickerbocker Press; GP Putnam’s Sons).
Cui, Y. and Guo, Y. (2022). The local integration preference of the Tf1 retrotransposon in Schizosaccharomyces pombe. Virology 565, 52–57. doi: 10.1016/j.virol.2021.10.008
Din, Z., Malik, T., Azhar, F., and Ashraf, M. (2016). Natural resistance against insect pests in cotton. JAPS: J. Anim. Plant Sci. 26:1346-1353.
Drenkard, E., Richter, B. G., Rozen, S., Stutius, L. M., Angell, N. A., Mindrinos, M., et al. (2000). A simple procedure for the analysis of single nucleotide polymorphisms facilitates map-based cloning in Arabidopsis. Plant Physiol. 124, 1483–1492. doi: 10.1104/pp.124.4.1483
Eichten, S. R., Ellis, N. A., Makarevitch, I., Yeh, C.-T., Gent, J. I., Guo, L., et al. (2012). Spreading of heterochromatin is limited to specific families of maize retrotransposons. PLoS Genet. 8, e1003127. doi: 10.1371/journal.pgen.1003127
Endrizzi, J. E. and Kohel, R. J. (1966). Use of telosomes in mapping three chromosomes in cotton. Genetics 54, 535–550. doi: 10.1093/genetics/54.2.535
Fang, D. D., Xiao, J., Canci, P. C., and Cantrell, R. G. (2010). A new SNP haplotype associated with blue disease resistance gene in cotton (Gossypium hirsutum L.). Theor. Appl. Genet. 120, 943–953. doi: 10.1007/s00122-009-1223-y
Günaydin, G. K., Avinc, O., Palamutcu, S., Yavas, A., and Soydan, A. S. (2019). “Naturally colored organic cotton and naturally colored cotton fiber production,” in Organic Cotton: Is it a Sustainable Solution? Eds. Gardetti, M. A. and Muthu, S. S. (Singapore, Springer; Springer Singapore), 81–99. doi: 10.1007/978-981-10-8782-0_4
Hinchliffe, D., Condon, B., Delhom, C. D., Chang, S., Montalvo, J., Madison, C., et al. (2015). Physical and combustion properties of nonwoven fabrics produced from conventional and naturally colored cottons. Textile Res. J. 85, 1666–1680. doi: 10.1177/0040517515573410
Hinchliffe, D. J., Condon, B. D., Thyssen, G., Naoumkina, M., Madison, C. A., Reynolds, M., et al. (2016). The GhTT2_A07 gene is linked to the brown colour and natural flame retardancy phenotypes of Lc1 cotton (Gossypium hirsutum L.) fibres. J. Exp. Bot. 67, 5461–5471. doi: 10.1093/jxb/erw312
Hinchliffe, D. J., Turley, R. B., Naoumkina, M., Kim, H. J., Tang, Y., Yeater, K. M., et al. (2011). A combined functional and structural genomics approach identified an EST-SSR marker with complete linkage to the Ligon lintless-2 genetic locus in cotton (Gossypium hirsutum L.). BMC Genomics 12, 1–18. doi: 10.1186/1471-2164-12-445
Hirsch, C. D. and Springer, N. M. (2017). Transposable element influences on gene expression in plants. Biochim. Biophys. Acta (BBA) - Gene Regul. Mech. 1860, 157–165. doi: 10.1016/j.bbagrm.2016.05.010
Ibraheem, N. A., Hasan, M. M., Khan, R. Z., and Mishra, P. K. (2012). Understanding color models: a review. ARPN J. Sci. Technol. 2, 265–275.
Jia, G. S., Zhang, W. C., Liang, Y., Liu, X. H., Rhind, N., Pidoux, A., et al. (2023). A high-quality reference genome for the fission yeast Schizosaccharomyces osmophilus. G3 (Bethesda) 13:1-31. doi: 10.1093/g3journal/jkad028
Joshi, N. A. and J.N., F. (2011). Sickle: A sliding-window, adaptive, quality-based trimming tool for FastQ files (Version 1.33). Available online at: https://github.com/najoshi/sickle (Accessed August 26, 2025).
Ke, L., Yu, D., Zheng, H., Xu, Y., Wu, Y., Jiao, J., et al. (2022). Function deficiency of GhOMT1 causes anthocyanidins over-accumulation and diversifies fibre colours in cotton (Gossypium hirsutum). Plant Biotechnol. J. 20, 1546–1560. doi: 10.1111/pbi.13832
Kohel, R. J. (1985). Genetic analysis of fiber color variants in cotton. Crop Sci. 25:793-797. doi: 10.2135/cropsci1985.0011183X0025000500017x
Kohel, R., Richmond, T., and Lewis, C. (1970). Texas marker-1. Description of a genetic standard for Gossypium hirsutum L. Crop Sci. 10, 670–671. doi: 10.2135/cropsci1970.0011183X001000060019x
Kumar, A. and Bennetzen, J. L. (1999). Plant retrotransposons. Annu. Rev. Genet. 33, 479–532. doi: 10.1146/annurev.genet.33.1.479
Lee, J. A. and Fang, D. D. (2015). Cotton as a world crop: origin, history, and current status. Cotton 57, 1–23. doi: 10.2134/agronmonogr57.2013.0019
Li, H. (2011). A statistical framework for SNP calling, mutation discovery, association mapping and population genetical parameter estimation from sequencing data. Bioinformatics 27, 2987–2993. doi: 10.1093/bioinformatics/btr509
Li, H., Handsaker, B., Wysoker, A., Fennell, T., Ruan, J., Homer, N., et al. (2009). The sequence alignment/map format and SAMtools. Bioinformatics 25, 2078–2079. doi: 10.1093/bioinformatics/btp352
Li, F., Ning, X., Qiu, X., Su, C., Yao, J., and Tian, L. (2012). Genetic mapping of the dark brown fiber Lc1 gene in tetraploid cotton. Sci. Agric. Sin. 45, 4109–4114.
Li, X., Ouyang, X., Zhang, Z., He, L., Wang, Y., Li, Y., et al. (2019). Over-expression of the red plant gene R1 enhances anthocyanin production and resistance to bollworm and spider mite in cotton. Mol. Genet. Genomics 294, 469–478. doi: 10.1007/s00438-018-1525-3
Li, Y., Yao, T., Fu, C., Wang, N., Xu, Z., Yang, N., et al. (2024). TRANSPARENT TESTA 16 collaborates with the MYB-bHLH-WD40 transcriptional complex to produce brown fiber cotton. Plant Physiol. 196, 2669–2684. doi: 10.1093/plphys/kiae530
Madhu, A. (2024). “Naturally colored cotton: A sustainable innovation,” in Best Crop Management and Processing Practices for Sustainable Cotton Production. Eds. Gürsoy, S. and Akın, S. (IntechOpen). doi: 10.5772/intechopen.113290
Nam, S., Condon, B. D., Xia, Z., Nagarajan, R., Hinchliffe, D. J., and Madison, C. A. (2017). Intumescent flame-retardant cotton produced by tannic acid and sodium hydroxide. J. Analytical Appl. Pyrolysis 126, 239–246. doi: 10.1016/j.jaap.2017.06.003
Nam, S., Kim, H. J., Condon, B. D., Hinchliffe, D. J., Chang, S., McCarty, J. C., et al. (2016). High resistance to thermal decomposition in brown cotton is linked to tannins and sodium content. Cellulose 23, 1137–1152. doi: 10.1007/s10570-016-0871-8
Naoumkina, M., Hinchliffe, D. J., and Thyssen, G. N. (2024). Naturally colored cotton for wearable applications. Front. Plant Sci. 15. doi: 10.3389/fpls.2024.1350405
Naoumkina, M., Thyssen, G., Fang, D. D., Hinchliffe, D. J., Florane, C., Yeater, K. M., et al. (2014). The Li2 mutation results in reduced subgenome expression bias in elongating fibers of allotetraploid cotton (Gossypium hirsutum L.). PLoS One 9, e90830. doi: 10.1371/journal.pone.0090830
Nesi, N., Jond, C., Debeaujon, I., Caboche, M., and Lepiniec, L. c. (2001). The Arabidopsis TT2 gene encodes an R2R3 MYB domain protein that acts as a key determinant for proanthocyanidin accumulation in developing seed. Plant Cell 13, 2099–2114. doi: 10.1105/TPC.010098
Neumann, P., Novák, P., Hoštáková, N., and Macas, J. (2019). Systematic survey of plant LTR-retrotransposons elucidates phylogenetic relationships of their polyprotein domains and provides a reference for element classification. Mobile DNA 10, 1. doi: 10.1186/s13100-018-0144-1
Niu, X.-M., Xu, Y.-C., Li, Z.-W., Bian, Y.-T., Hou, X.-H., Chen, J.-F., et al. (2019). Transposable elements drive rapid phenotypic variation in Capsella rubella. Proc. Natl. Acad. Sci. 116, 6908–6913. doi: 10.1073/pnas.1811498116
Quinlan, A. R. and Hall, I. M. (2010). BEDTools: a flexible suite of utilities for comparing genomic features. Bioinformatics 26, 841–842. doi: 10.1093/bioinformatics/btq033
Ran, L., Li, Y., Chen, L., Mo, T., Liu, N., Xu, S., et al. (2025). Specific expression of a fusion gene Lc-GhPAP1D results in colored cotton fibers with increased flavonoid and lignin synthesis, but impaired elongation and secondary cell wall deposition. J. Integr. Agric. doi: 10.1016/j.jia.2025.02.044
Thyssen, G. N., Condon, B. D., Hinchliffe, D. J., Zeng, L., Naoumkina, M., Jenkins, J. N., et al. (2023). Flame resistant cotton lines generated by synergistic epistasis in a MAGIC population. PLoS One 18, e0278696. doi: 10.1371/journal.pone.0278696
Thyssen, G. N., Fang, D. D., Turley, R. B., Florane, C., Li, P., and Naoumkina, M. (2014). Next generation genetic mapping of the Ligon-lintless-2 (Li2) locus in upland cotton (Gossypium hirsutum L.). Theor. Appl. Genet. 127, 2183–2192. doi: 10.1007/s00122-014-2372-1
Thyssen, G. N., Smith, W., Naoumkina, M., Pinnika, G., Jenkins, J. N., McCarty, J. C., et al. (2025). Allele and transcriptome mining in Gossypium hirsutum reveals variation in candidate genes at genetic loci affecting cotton fiber quality and textile flammability. BMC Plant Biol. 25, 305. doi: 10.1186/s12870-025-06306-2
Tukey, J. W. (1949). Comparing individual means in the analysis of variance. Biometrics 5, 99–114. doi: 10.2307/3001913
Vasimuddin, M., Misra, S., Li, H., and Aluru, S. (2019). “Efficient architecture-aware acceleration of BWA-MEM for multicore systems,” in 2019 IEEE International Parallel and Distributed Processing Symposium (IPDPS). doi: 10.1109/IPDPS.2019.00041
Wang, L., Liu, H., Li, X., Xiao, X., Ai, X., Luo, C., et al. (2014). Genetic mapping of fiber color genes on two brown cotton cultivars in Xinjiang. Springerplus 3, 480. doi: 10.1186/2193-1801-3-480
Wang, B., Luo, Q., Li, Y., Du, K., Wu, Z., Li, T., et al. (2022a). Structural insights into partner selection for MYB and bHLH transcription factor complexes. Nat. Plants 8, 1108–1117. doi: 10.1038/s41477-022-01223-w
Wang, N., Zhang, B., Yao, T., Shen, C., Wen, T., Zhang, R., et al. (2022b). Re enhances anthocyanin and proanthocyanidin accumulation to produce red foliated cotton and brown fiber. Plant Physiol. 189, 1466–1481. doi: 10.1093/plphys/kiac118
Ware, J. O. (1932). Inheritance of lint colors in upland cotton. Agron. J. 24, 550–562. doi: 10.2134/agronj1932.00021962002400070008x
Wen, T., Wu, M., Shen, C., Gao, B., Zhu, D., Zhang, X., et al. (2018). Linkage and association mapping reveals the genetic basis of brown fibre (Gossypium hirsutum). Plant Biotechnol. J. 16, 1654–1666. doi: 10.1111/pbi.12902
Wu, T. D. and Nacu, S. (2010). Fast and SNP-tolerant detection of complex variants and splicing in short reads. Bioinformatics 26, 873–881. doi: 10.1093/bioinformatics/btq057
Yan, Q., Wang, Y., Li, Q., Zhang, Z., Ding, H., Zhang, Y., et al. (2018). Up-regulation of Gh TT 2-3A in cotton fibres during secondary wall thickening results in brown fibres with improved quality. Plant Biotechnol. J. 16, 1735–1747. doi: 10.1111/pbi.12910
Yu, K., Song, Y., Lin, J., and Dixon, R. A. (2023). The complexities of proanthocyanidin biosynthesis and its regulation in plants. Plant Commun. 4, 100498. doi: 10.1016/j.xplc.2022.100498
Zeng, F. and Cheng, B. (2014). Transposable element insertion and epigenetic modification cause the multiallelic variation in the expression of FAE1 in Sinapis alba. Plant Cell 26, 2648–2659. doi: 10.1105/tpc.114.126631
Zhang, L., Hu, J., Han, X., Li, J., Gao, Y., Richards, C. M., et al. (2019). A high-quality apple genome assembly reveals the association of a retrotransposon and red fruit colour. Nat. Commun. 10, 1494. doi: 10.1038/s41467-019-09518-x
Keywords: cotton, Lc1 locus, rust-brown fiber, flame-retardant, flavonoid, proanthocyanidin
Citation: Pinnika G, Thyssen GN, Madison CA, Li P, Fang DD, Naoumkina M and Hinchliffe DJ (2025) The brown fiber phenotype in cotton line SA-40 is linked to a missing Ty3-like retrotransposon upstream of the GhTT2_A07. Front. Plant Sci. 16:1668965. doi: 10.3389/fpls.2025.1668965
Received: 18 July 2025; Accepted: 19 August 2025;
Published: 03 September 2025.
Edited by:
Giovanni Stefano, University of Florence, ItalyReviewed by:
Wei Hu, Henan Academy of Agricultural Sciences (HNAAS), ChinaLong Chen, Zhejiang Sci-Tech University, China
Copyright © 2025 Pinnika, Thyssen, Madison, Li, Fang, Naoumkina and Hinchliffe. This is an open-access article distributed under the terms of the Creative Commons Attribution License (CC BY). The use, distribution or reproduction in other forums is permitted, provided the original author(s) and the copyright owner(s) are credited and that the original publication in this journal is cited, in accordance with accepted academic practice. No use, distribution or reproduction is permitted which does not comply with these terms.
*Correspondence: Marina Naoumkina, bWFyaW5hLm5hb3Vta2luYUB1c2RhLmdvdg==; Doug J. Hinchliffe, ZG91Zy5oaW5jaGxpZmZlQHVzZGEuZ292