 MingYu Zhu1,2†
 XinChang Zhu1†
 YuLing Zeng1‡Wei Li1
 Xuan Wen1‡Yang Mei1
 ChuTong Huang1‡
 ZhiGang Hu1,3*
 Lin Sen1,3*
- 1College of Pharmacy, Hubei University of Chinese Medicine, Wuhan, China
- 2Traditional Chinese Medicine of Wuxue City, Wuxue, China
- 3Hubei Shizhen Laboratory, Wuhan, China
Introduction: Polygonati Rhizoma is a Traditional Chinese medicine derived from three species of the Polygonatum Mill. (Polygonatum kingianum, Polygonatum sibiricum, and Polygonatum cyrtonema), renowned for its culinary and medicinal uses. Despite extensive research, comprehensive studies on the population genetic diversity and core collection construction of medicinal Polygonatum species remain scarce.
Methods: To address this, we employed 18 highly polymorphic SSR markers to develop two machine learning models for species discrimination. Subsequently, we performed comprehensive population genetic analyses on 175 accessions, followed by core germplasm construction.
Results: The study demonstrated that the machine learning-based approach achieved consistently high discrimination accuracy, exceeding 81% for Polygonatum species identification. Among the four investigated Polygonati Rhizoma, significant variations in genetic diversity were observed. Cluster and population structure analyses identified three primary subgroups. A core collection was constructed through stepwise clustering based on genetic distance. The C78 primary core collection achieved an allele retention rate of 84.59%, with minimal genetic redundancy.
Discussion: These findings provide a robust foundation for the conservation of medicinal Polygonatum spp. germplasm and offer potential resources for future genetic improvement and variety selection.
Introduction
Polygonati Rhizoma, a perennial herb belonging to the genus Polygonum within the Liliaceae family, is recognized in the 2025 edition of the Chinese Pharmacopoeia as a medicinal herb derived from the dried rhizomes of three species: Polygonatum kingianum Coll. et Hemsl., Polygonatum sibiricum Red., and Polygonatum cyrtonema Hua (Pharmacopoeia Committee, 2025). Included in the Ministry of Health's “List of Items that are both Food and Drugs” since 2002, Polygonati Rhizoma stands out for its significant medicinal and nutritional value, and renowned for its nutritional and therapeutic properties (Zhang et al., 2022), it was ranked among the “Top Ten Chuyao (Hubei Provincial Featured Chinese Medicines)” in year 2022 (https://www.hubei.gov.cn/zwgk/hbyw/hbywqb/202207/t20220716_4223149.shtml). Its therapeutic functions, including tonifying Qi (vital energy—the fundamental life force in TCM) and nourishing Yin (corporeal cooling and moistening functions), moisturizing the lungs, and strengthening the spleen, are attributed to its rich chemical composition, which primarily includes polysaccharides, steroids, anthraquinones, alkaloids, lignin, vitamins, and amino acids (Ma et al., 2022; Chen et al., 2015). Extensive pharmacological research has demonstrated its diverse biological activities, including anti-aging, hypoglycemia, immune enhancement, anti-atherosclerosis, cardiovascular protection, bacteriostasis, and intestinal flora regulation (Zhou et al., 2021; Wang et al., 2019). P. zanlanscianense (Polygonatum zanlanscianense Pamp.), a closely related species to Polygonati Rhizoma, also exhibits both medicinal and nutritional values and is often used in traditional Chinese medicine, sometimes serving as a substitute or being confused with Polygonati Rhizoma in certain regions (Li et al., 2024; Song et al., 2022). Polygonati Rhizoma thrives in shaded habitats such as forests and sloped terrains at altitudes of approximately 1000 meters. China boasts a vast array of germplasm resources within the Polygonatum Mill. genus, predominantly occurring in wild environments (Cheng et al., 2020). However, the increasing research focus on traditional Chinese herbal medicine has led to overexploitation, resulting in a significant depletion of Polygonati Rhizoma resources in primary production areas and substantial habitat destruction. Additionally, the phenomenon of substituting other Polygonatum Mill. Species for traditional medicinal Polygonati Rhizoma has emerged. This issue stems from the high degree of similarity in both geographical distribution and morphological characteristics among species within the Polygonatum Mill., which has significantly undermined the sustainable development of the Polygonati Rhizoma industry. Therefore, it is imperative to conduct research on resource collection and conservation, develop artificial cultivation techniques, and assess genetic diversity. The establishment of a core collection bank for medicinal Polygonati Rhizoma will not only provide innovative solutions to address resource scarcity but also serve as a valuable reference for selection, breeding, and the establishment of new germplasm.
Simple Sequence Repeat (SSR) molecular marker technology exhibits independence from organism developmental stages, growth environments, and inter-organ/tissue variations—representing a critical advantage over phenotype-based identification approaches (such as traits assessed through leaf morphology or fruit configuration) and other externally influenced molecular markers (Liu et al., 2020). Practically, SSR markers have found widespread application across diverse research fields: genetic diversity studies in plant germplasm resources (Liu et al., 2020; Yang et al., 2024), investigations into species evolutionary lineages (Thakur et al., 2017), establishment of DNA fingerprinting systems for germplasm characterization (Wu et al., 2024), and construction of genetic linkage maps (Zheng et al., 2023). Within the genus Polygonatum Mill. (valuable medicinal plants with dual economic and therapeutic significance), multiple polymorphic SSR loci have been characterized. Nevertheless, prior investigations predominantly focus on single species including P. cyrtonema (Cheng et al., 2020; Liu et al., 2023; Ji et al., 2020; Chen et al., 2024; Cheng, 2023), P. kingianum (Mi et al., 2024; Qian et al., 2023; Chen et al., 2022), and P. sibiricum (Yang et al., 2022). Crucially, a notable research void exists regarding comprehensive studies on the three pharmacopoeia-designated species of Polygonati Rhizoma, with existing works suffering from inadequate sample sizes (Yang et al., 2022; Feng et al., 2020; Zhu et al., 2018; Wang et al., 2018).
The global consensus underscores the critical role of germplasm resource collection and conservation in facilitating the selection and breeding of novel plant varieties, as well as in enhancing specific germplasm materials. As these resources accumulate, there is a significant rise in management costs and challenges associated with selecting and mining specific germplasm. Core germplasm collections are vital as they represent the entire genetic diversity of all resources with minimal resources and genetic duplications (Frankel and Brown, 1984; Frankel, 1984). Consequently, developing core germplasm collections is a strategic approach for comprehensive evaluation, efficient conservation, and optimal utilization of germplasm resources. The construction of core collections aims to preserve maximum genetic variation using minimal resources, marking it as a crucial area of research in plant germplasm management (Koorevaar et al., 2024). Given the detailed investigation into the current status of Polygonati Rhizoma germplasm resources, constructing a core collection is essential for improving the efficiency of management, conservation, evaluation, innovation, and utilization of Polygonati Rhizoma germplasm resources.
In this study, a total of 175 rhizome accessions from P. cyrtonema, P. kingianum, P. sibiricum, and P. zanlanscianense were collected across various geographical regions. Using SSR markers, the research systematically analyzed the kinship, genetic diversity, and population structure of the Polygonati Rhizoma germplasm to construct a core collection. This work provides crucial technical support for future variety selection and molecular identification of interspecific species within the genus Polygonatum.
Material and methods
Plant materials
To guarantee the rationality and representativeness of population delimitation during sampling, two accessions of Polygonati Rhizoma were considered to belong to the same population when their absolute geographical distance was less than 5 km. A total of 175 accessions of Polygonati Rhizoma were collected from 35 locations across 13 provinces in China (Table 1), encompassing four species: P. kingianum (41), P. cyrtonema (76), P. sibiricum (54), and P. zanlanscianense (4). All plant materials were identified by Associate Professor Lin Sen at Hubei University of Chinese Medicine. The collection was conducted with proper authorization and in accordance with the regulations of Hubei University of Chinese Medicine and national guidelines. The specimens are preserved in the Herbarium of Hubei University of Chinese Medicine (Associate Professor Lin Sen: MjM5MDExMjUwQHFxLmNvbQ==) and have been transplanted to the Tongxin Lake Resource Nursery of Hubei University of Chinese Medicine (N30°26′50.91″, E114°15′33.93″, 14m, Hubei, China). The specimens voucher number:HBZYY-HJZYP-0001~HBZYY-HJZYP-0175 (Supplementary Table S1).
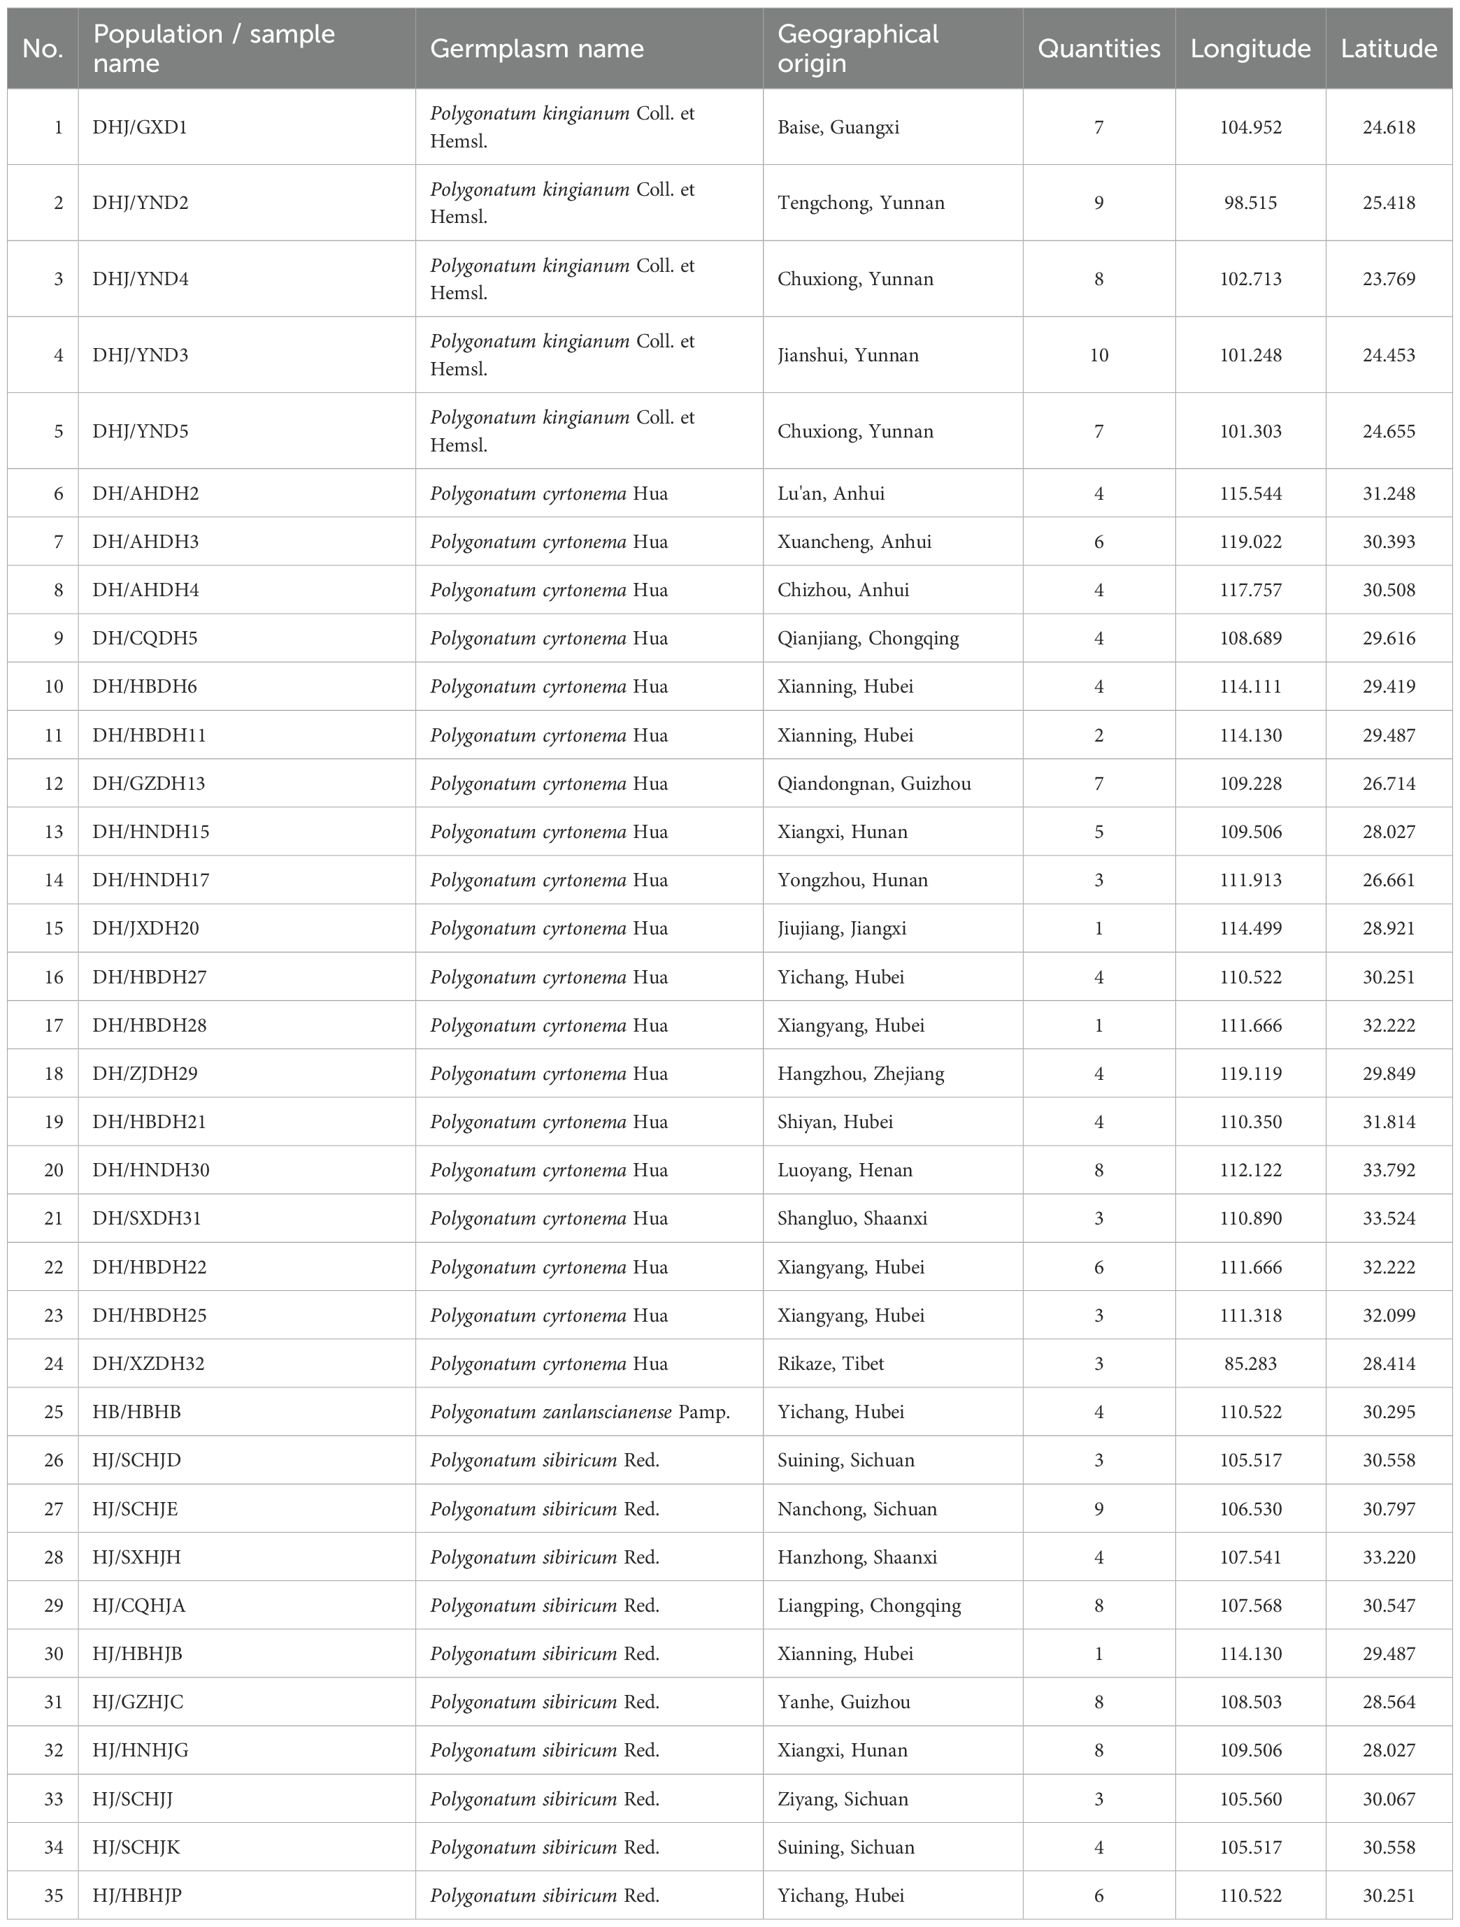
Table 1. Information table of Polygonati Rhizoma sample collection.
Rhizome dehydration was performed as a routine but critical step to extend sample shelf-life and prevent DNA degradation during post-sampling transport and storage (a standard practice in plant molecular studies for non-freshly analyzed materials). Specifically, rhizomes were dehydrated in a forced-air oven at 45°C for 48 h until constant weight was achieved—this temperature and duration balance efficiency and DNA integrity, avoiding thermal damage to genomic DNA.
DNA extraction
To ensure genomic DNA integrity during sample pretreatment and facilitate subsequent extraction, the rhizomes of Polygonati Rhizoma were first dehydrated using silica gel—this desiccation method effectively absorbs moisture from the rhizome tissue, preventing microbial growth and DNA degradation while maintaining tissue structure for downstream processing. After dehydration, the rhizome samples were pulverized to a fine powder using a mortar and pestle under liquid nitrogen (to avoid DNA shearing from heat generated during grinding).
Genomic DNA extraction was then performed strictly according to the manufacturer's instructions provided with the NuClean Plant Genomic DNA Kit. Following extraction, the concentration and purity of the obtained genomic DNA were quantified using a NanoDrop 2000 Ultra-Micro Spectrophotometer (assessing A260/A280 ratios to ensure purity, with optimal values ranging from 1.8 to 2.0). DNA quality was further verified by 1%(W/V) agarose gel electrophoresis, where clear, intact bands (without smearing) indicated high-quality genomic DNA.
To standardize samples for subsequent experiments (e.g., SSR amplification), the DNA concentration of all samples was adjusted to 50 ng/µL using TE buffer. The final standardized DNA samples were stored at -20 °C to maintain stability, ensuring they were suitable for subsequent molecular experiments.
Primer screening and SSR-PCR amplification
Based on literature-reported polymorphism and primer amplification (Cheng et al., 2020; Liu et al., 2023; Cheng, 2023; Qian et al., 2023; Chen et al., 2022; Yang et al., 2022; Feng et al., 2020; Wang et al., 2018; Cheng, 2012), a total of 120 pairs of fluorescent primers were selected and analyzed in this study (Supplementary Table S2). Primers were synthesized by Bioengineering (Shanghai) Co. The PCR reaction system comprised a total volume of 20 µL, including 3 µL genomic DNA, 10 µL 2× Es Taq MasterMix, 1.5 µL forward primer, 1.5 µL reverse primer, 0.3 µL M13 connector (ROX/HEX/FAM), and 4 µL ddH2O. The PCR amplification conditions included pre-denaturation at 94°C for 2 minutes, followed by 35 cycles of denaturation at 94°C for 30 seconds, annealing at the optimal temperature for 30 seconds (note that the annealing temperature varied according to the specific SSR primers used), extension at 72°C for 30 seconds, with a final extension at 72 °C for 2 minutes, and storage at 4°C. The PCR amplified products were analyzed using agarose gel electrophoresis (1%(W/V)), followed by fluorescence capillary electrophoresis.
The raw data were analyzed using GeneMarker v2.2.0 software (Holland et al., 2017). Primers exhibiting distinct peak shapes, smooth baselines, and significant polymorphisms were selected for large-scale amplification. Ultimately, 18 highly polymorphic SSR primer pairs were chosen for further analysis (Table 2).
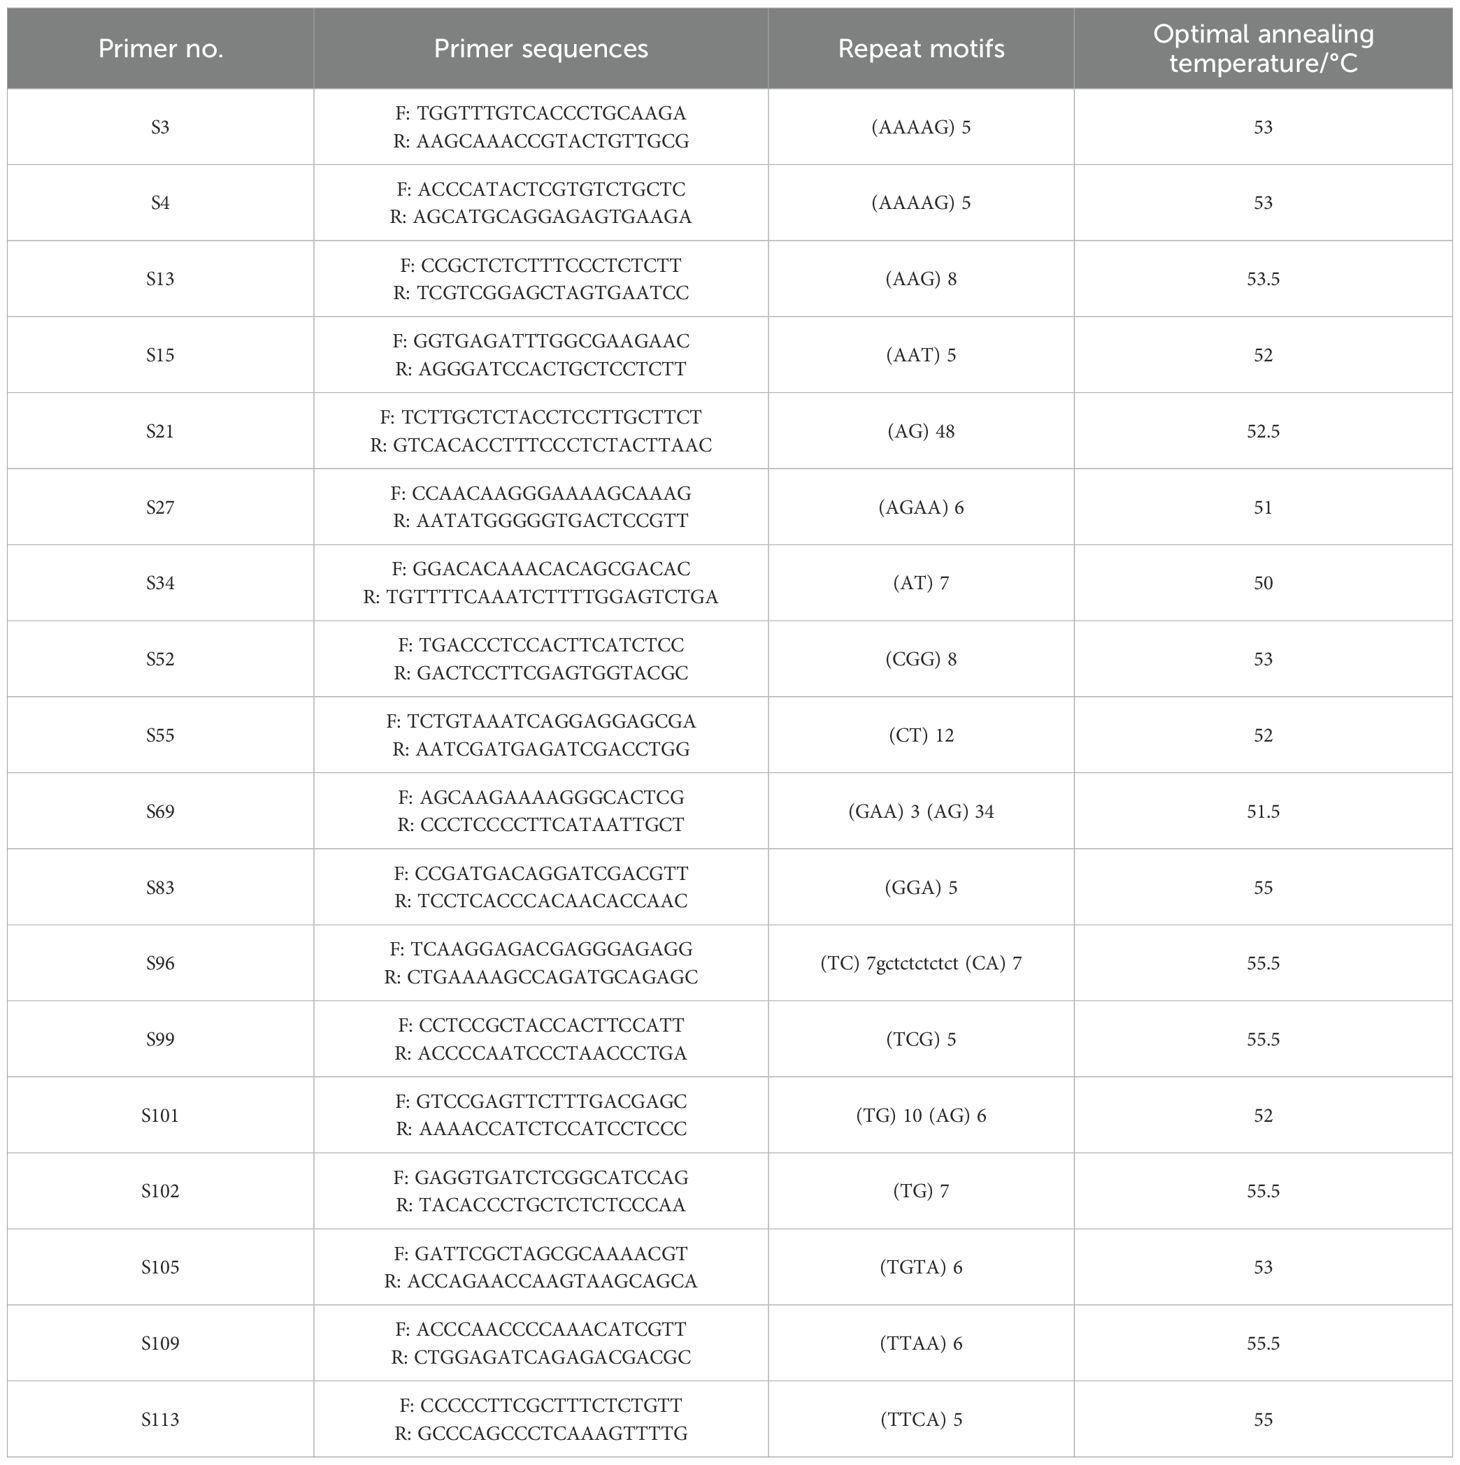
Table 2. Detailed information on 18 pairs of polymorphic SSR primers used for genetic diversity analysis and core collection.
Data analysis
A presence-absence matrix, coded as ‘1’ for presence and ‘0’ for absence of specific allelic variants, was constructed based on allelic data obtained from 18 highly polymorphic SSR primer pairs (Supplementary Table S3). This coding scheme, which indicates the presence or absence of a particular allele at each locus, was implemented to facilitate analysis using GenAlEx v6.5 software (Peakall and Smouse, 2012). Using this software, we calculated genetic diversity parameters including allele frequencies, observed number of alleles (Na), effective number of alleles (Ne), observed heterozygosity (Ho), expected heterozygosity (He), and Shannon's information index (I). GenAlEx v6.5 was also used to perform Analysis of Molecular Variance (AMOVA) and compute genetic differentiation coefficients (Fst). The polymorphism information content (PIC) was determined using PowerMarker v3.25 software (Liu and Muse, 2005). For cluster analysis, Neighbor-Joining (NJ) trees were constructed with the R package ape (Paradis and Schliep, 2018), and the resulting tree files were visualized and annotated using the online tool iTOL v6.5.8 (Letunic and Bork, 2021). Population structure analysis was conducted using STRUCTURE software.
Development of SSR-based predictive models for Polygonati Rhizoma authentication
In this study, we employed two supervised classification models (Support Vector Machine-Recursive Feature Elimination (SVM-RFE) and Random Forest (RF)) for population identification using SSR markers (Agho et al., 2024). The SVM is a supervised machine learning model that utilizes kernel methods for nonlinear classification by constructing hyperplanes for discrimination. The SVM-RFE approach, built upon the SVM framework, employs recursive feature elimination to extract significant correlated variables. This iterative process trains the model to score and rank each feature, sequentially removing the lowest-scoring features until the optimal number of features is selected. The RF model operates through an ensemble of decision trees, providing inherent resistance to overfitting (Niederer et al., 2024). For SVM-RFE implementation, we utilized the caret package in R. The training and test set ratios were determined through multiple iterations based on learning curve accuracy. Model parameters were optimized via 10-fold cross-validation of the training matrix, with validation sets used to assess predictive performance. Feature elimination was performed using the e1071 package. The RF model was constructed using R's randomForest and rfPermute packages, with the number of decision trees ultimately set to 300. Model performance was rigorously evaluated through confusion matrices, accuracy rates, precision, and F1 scores to ensure reliability. Due to limited sample availability for P. zanlanscianense, the final dataset comprised SSR markers from P. sibiricum, P. cyrtonema, and P. kingianum.
Core collection construction
To optimize the conservation of genetic diversity within the germplasm resources of Polygonati Rhizoma while minimizing the number of samples, we employed a Least Distance Stepwise Sampling (LDSS) strategy in this study. This method specifically aims to identify the group exhibiting the smallest genetic distance and the highest genetic similarity. Following the construction of the core subset, we compared the genetic diversity parameters of this core collection with those of the original collection. These comparisons were visualized through Principal Component Analysis (PCA) and Neighbor-Joining (NJ) trees. Finally, the reliability of the core collection was validated using a T-test conducted in SPSS software, comparing the core samples against the overall sample set.
Results
Genetic diversity analysis of SSR molecular marker primers
A total of 18 highly polymorphic SSR primer pairs were rigorously selected from an initial pool of 120 candidates (Table 2), with the corresponding analysis results systematically presented in Table 3. The fluorescent capillary electrophoresis profiles are shown in Supplementary Figure S1. These 18 primer pairs successfully amplified a total of 186 alleles, with an average of 15.89 alleles per locus. The calculated core genetic diversity parameters were as follows: the mean effective number of alleles (Ne) was 2.817, observed heterozygosity (Ho) was 0.016, expected heterozygosity (He) was 0.466, mean Shannon's information index (I) was 0.997, and mean polymorphic information content (PIC) was 0.775—all parameters met the criteria for highly polymorphic markers (1.0 > PIC > 0.5). Among the primers, primer S83 exhibited the highest polymorphism (PIC = 0.909, Supplementary Figure S1), followed by primer S99 (PIC = 0.902, Supplementary Figure S1). The above data indicate that the developed primers possess extremely high polymorphism, and the 175 Polygonati Rhizoma germplasm resources exhibit rich and significant genetic diversity.
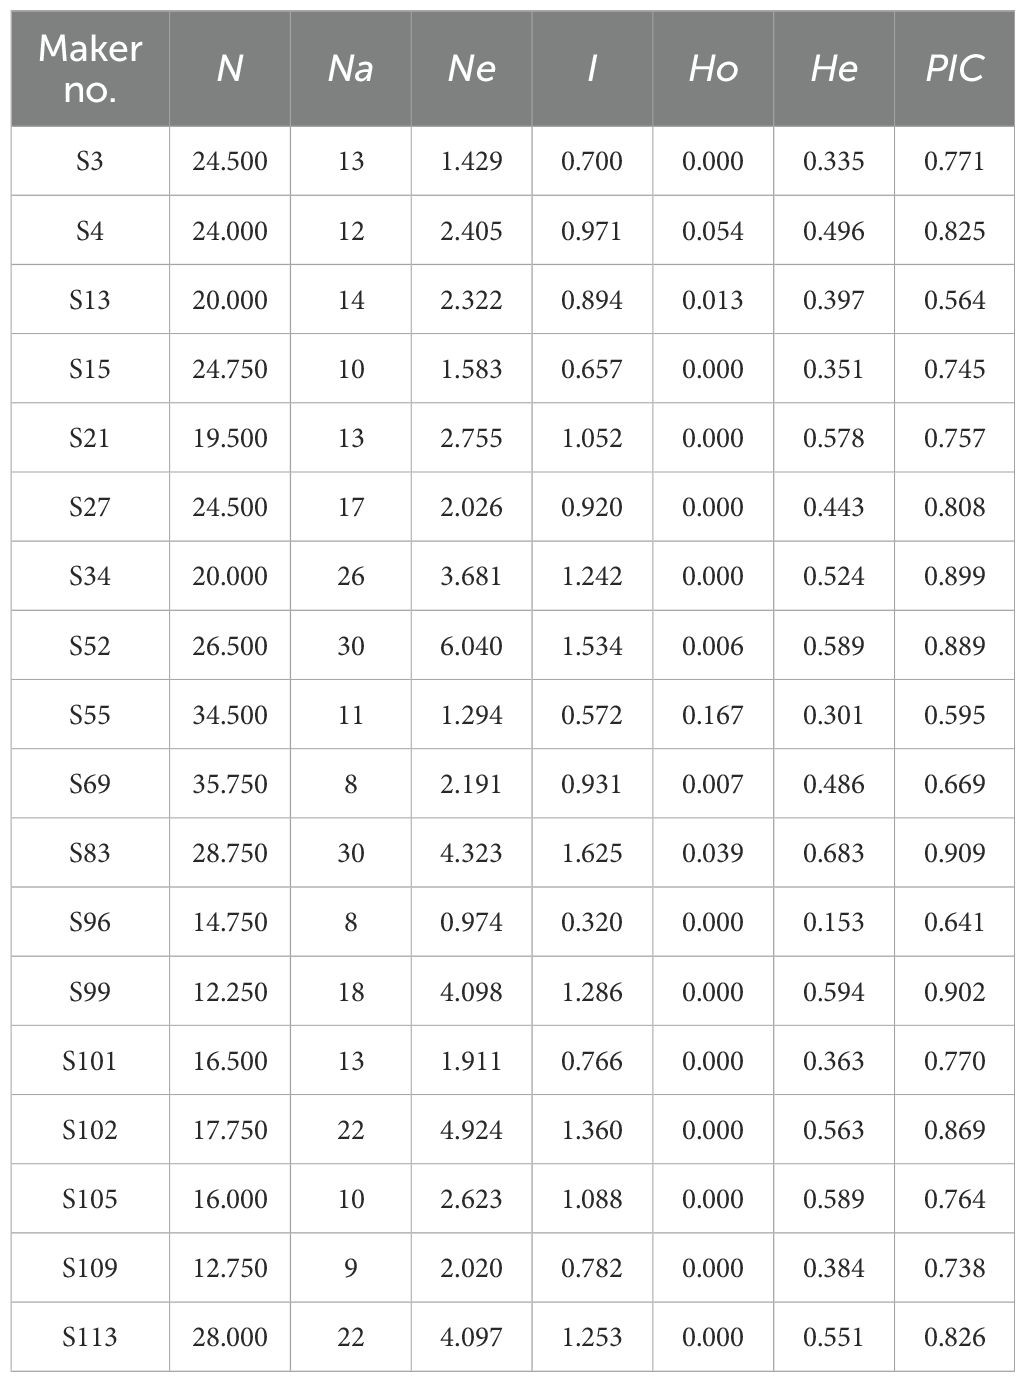
Table 3. Genetic diversity parameters for the overall samples of Polygonati Rhizoma.
Subsequently, high-frequency alleles within each species population were identified based on allele frequencies and visualized in a heatmap (Figure 1). Specifically, the P. cyrtonema population showed dominant alleles at 7 loci (S3, S55, S69, S83, S96, S101, S109); P. kingianum had characteristic alleles at 13 loci (S3, S13, S15, S21, S27, S52, S55, S69, S96, S101, S105, S109, S113); the P. sibiricum population displayed characteristic alleles at 12 loci (S3, S4, S13, S15, S27, S34, S55, S96, S101, S102, S105, S109); and P. zanlanscianense exhibited characteristic alleles at 11 loci (S21, S34, S52, S69, S83, S99, S101, S102, S105, S109, S113). Notably, loci such as S15, S21, S83, and S96 had preferential alleles across multiple populations, demonstrating both high genetic diversity and polymorphism.
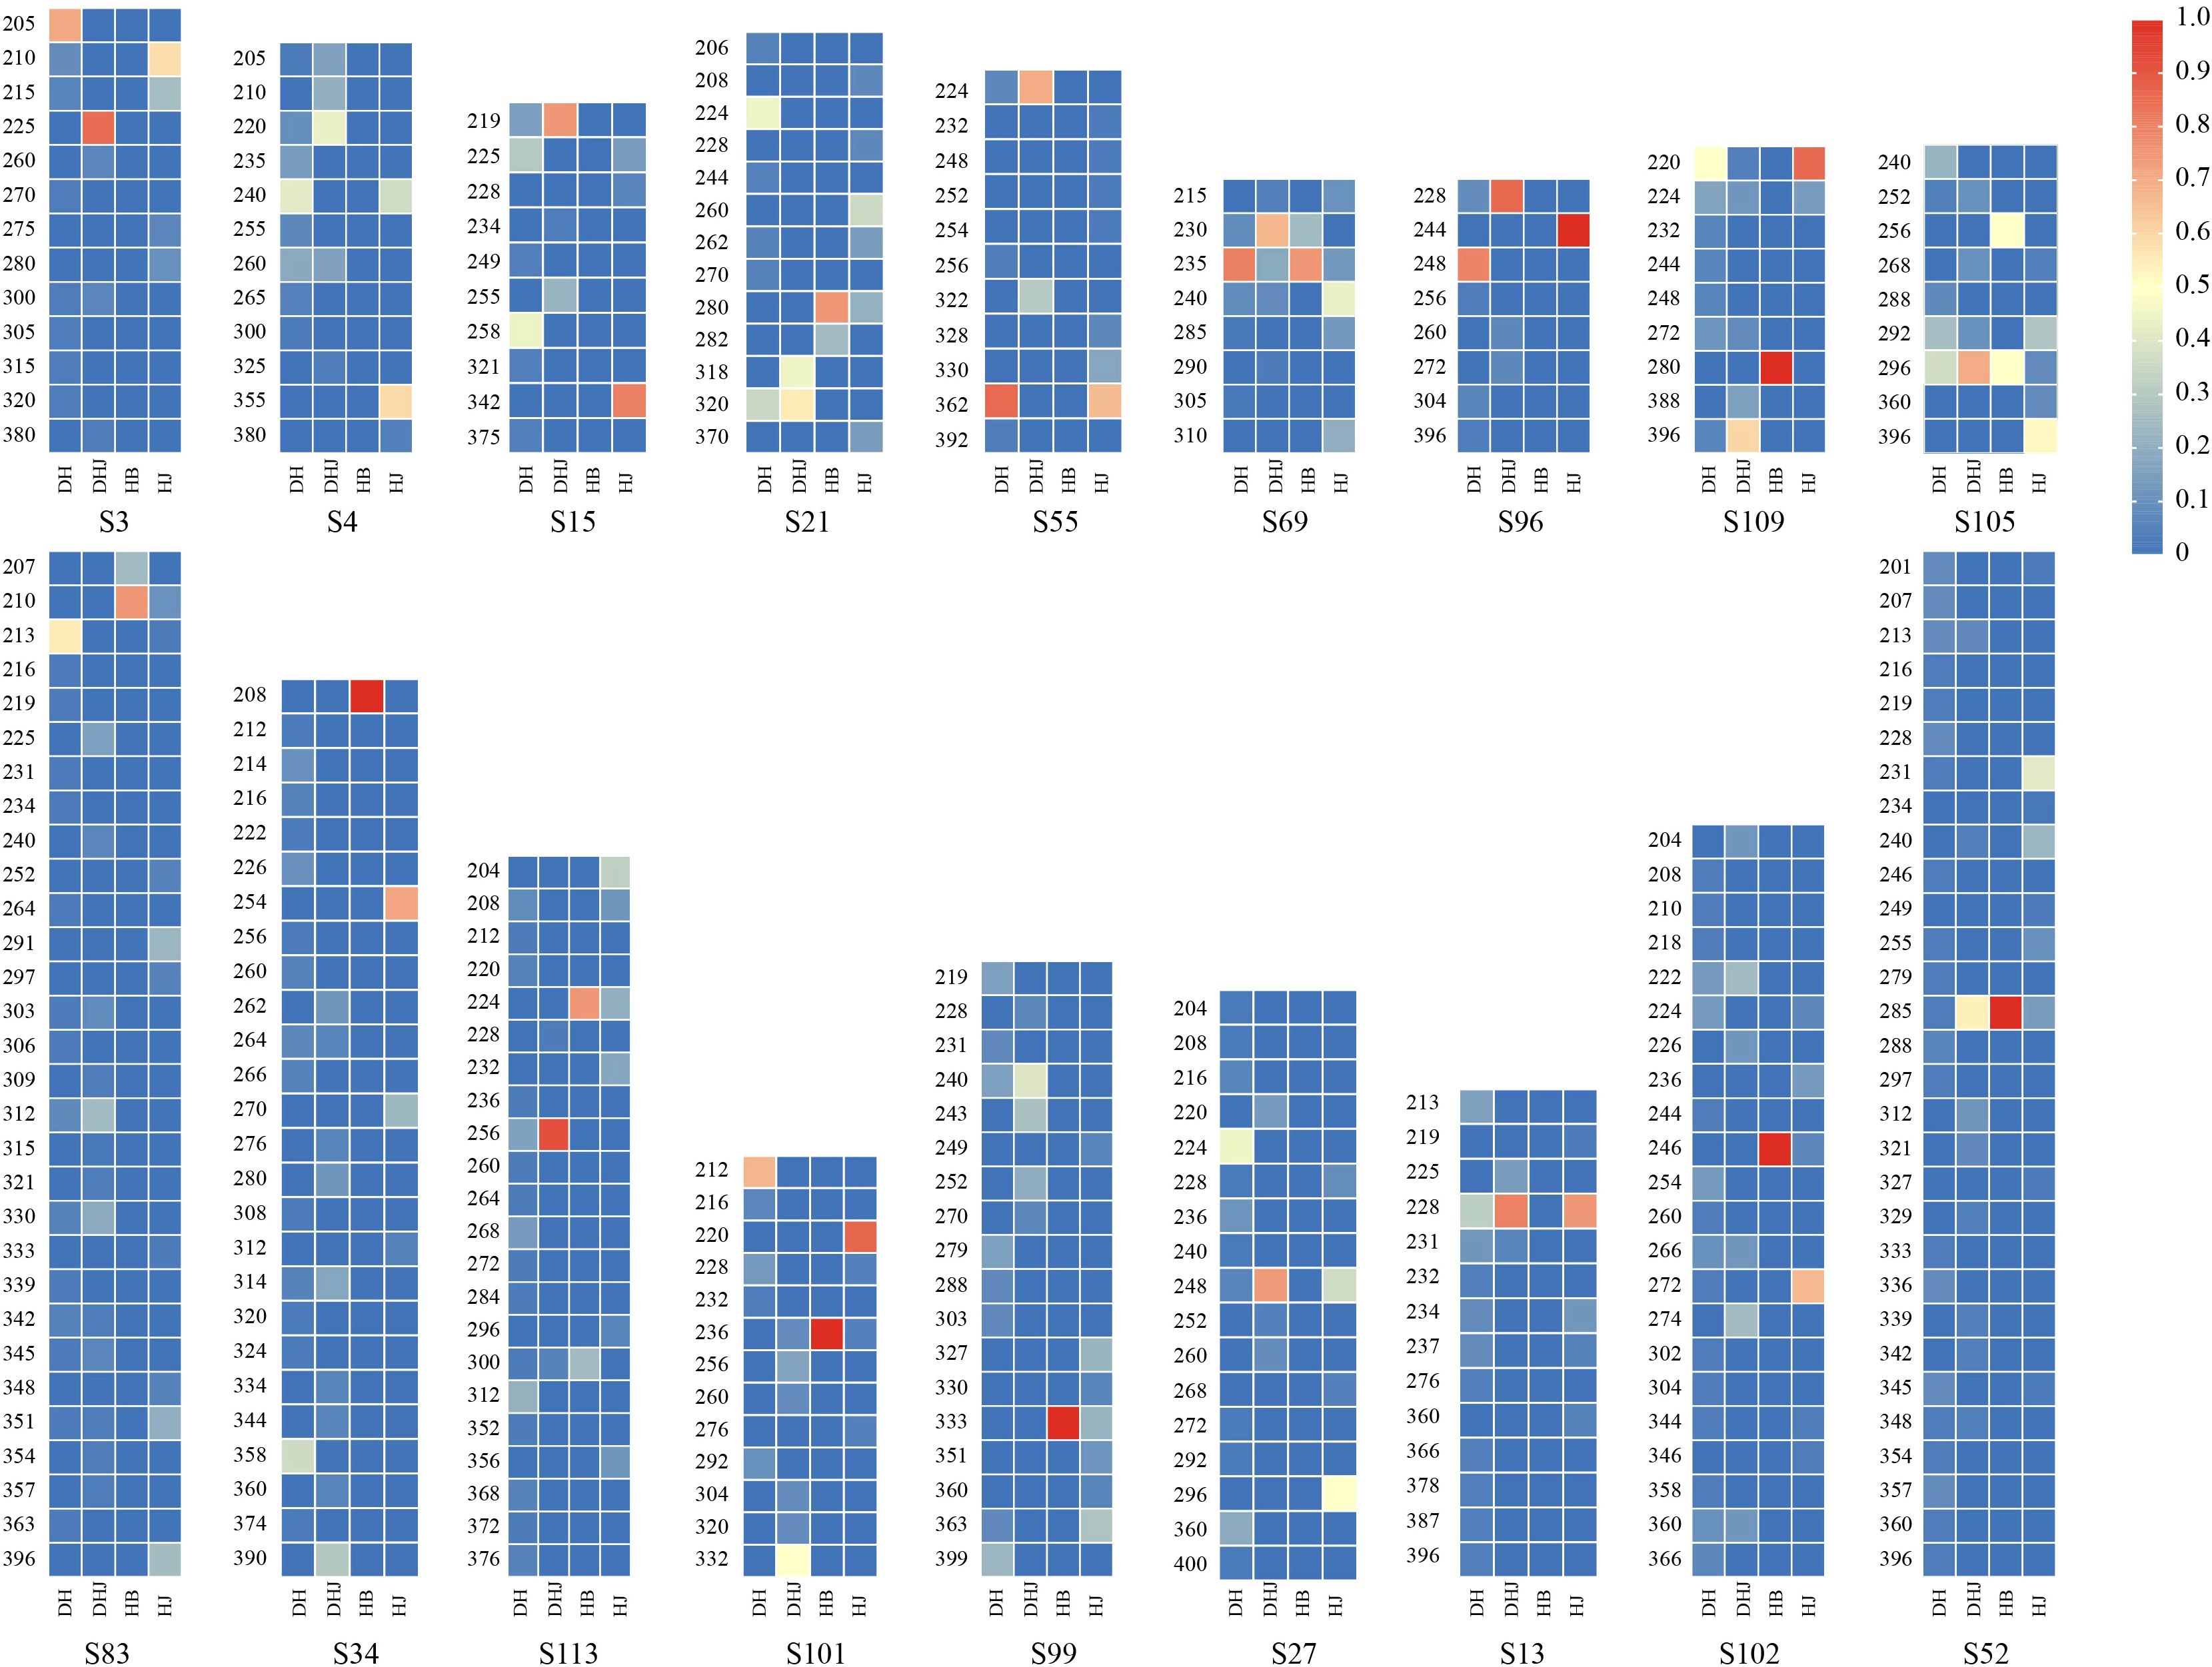
Figure 1. Heat map of allele frequencies of 18 pairs of primers.
Species prediction of Polygonati Rhizoma based on different algorithms
SVM-RFE model
When using the SVM-RFE model, 90% of the dataset was allocated as the training set (Supplementary Figure S2) and 18 primer variables were used as input. After optimization, the model performance was as follows: the classification accuracy of the training set reached 81.94% (Figure 2A), the classification accuracy of the validation set was 81.25% (Figure 2B), and the overall classification accuracy of the test set was 81.25%. Comparative analysis of precision and F1-scores revealed that the model had better classification performance for P. cyrtonema and P. kingianum than for P. sibiricum (Supplementary Table S5). Through recursive feature elimination, 5 primers with the strongest discriminative ability were selected, ranked by importance as: 34, 3, 21, 96, 109 (Figure 3A). Although these 5 primers could be used to construct a simplified classification model, the recursive feature selection parameters showed that the complete model with 18 primers achieved the optimal performance (Supplementary Table S4).
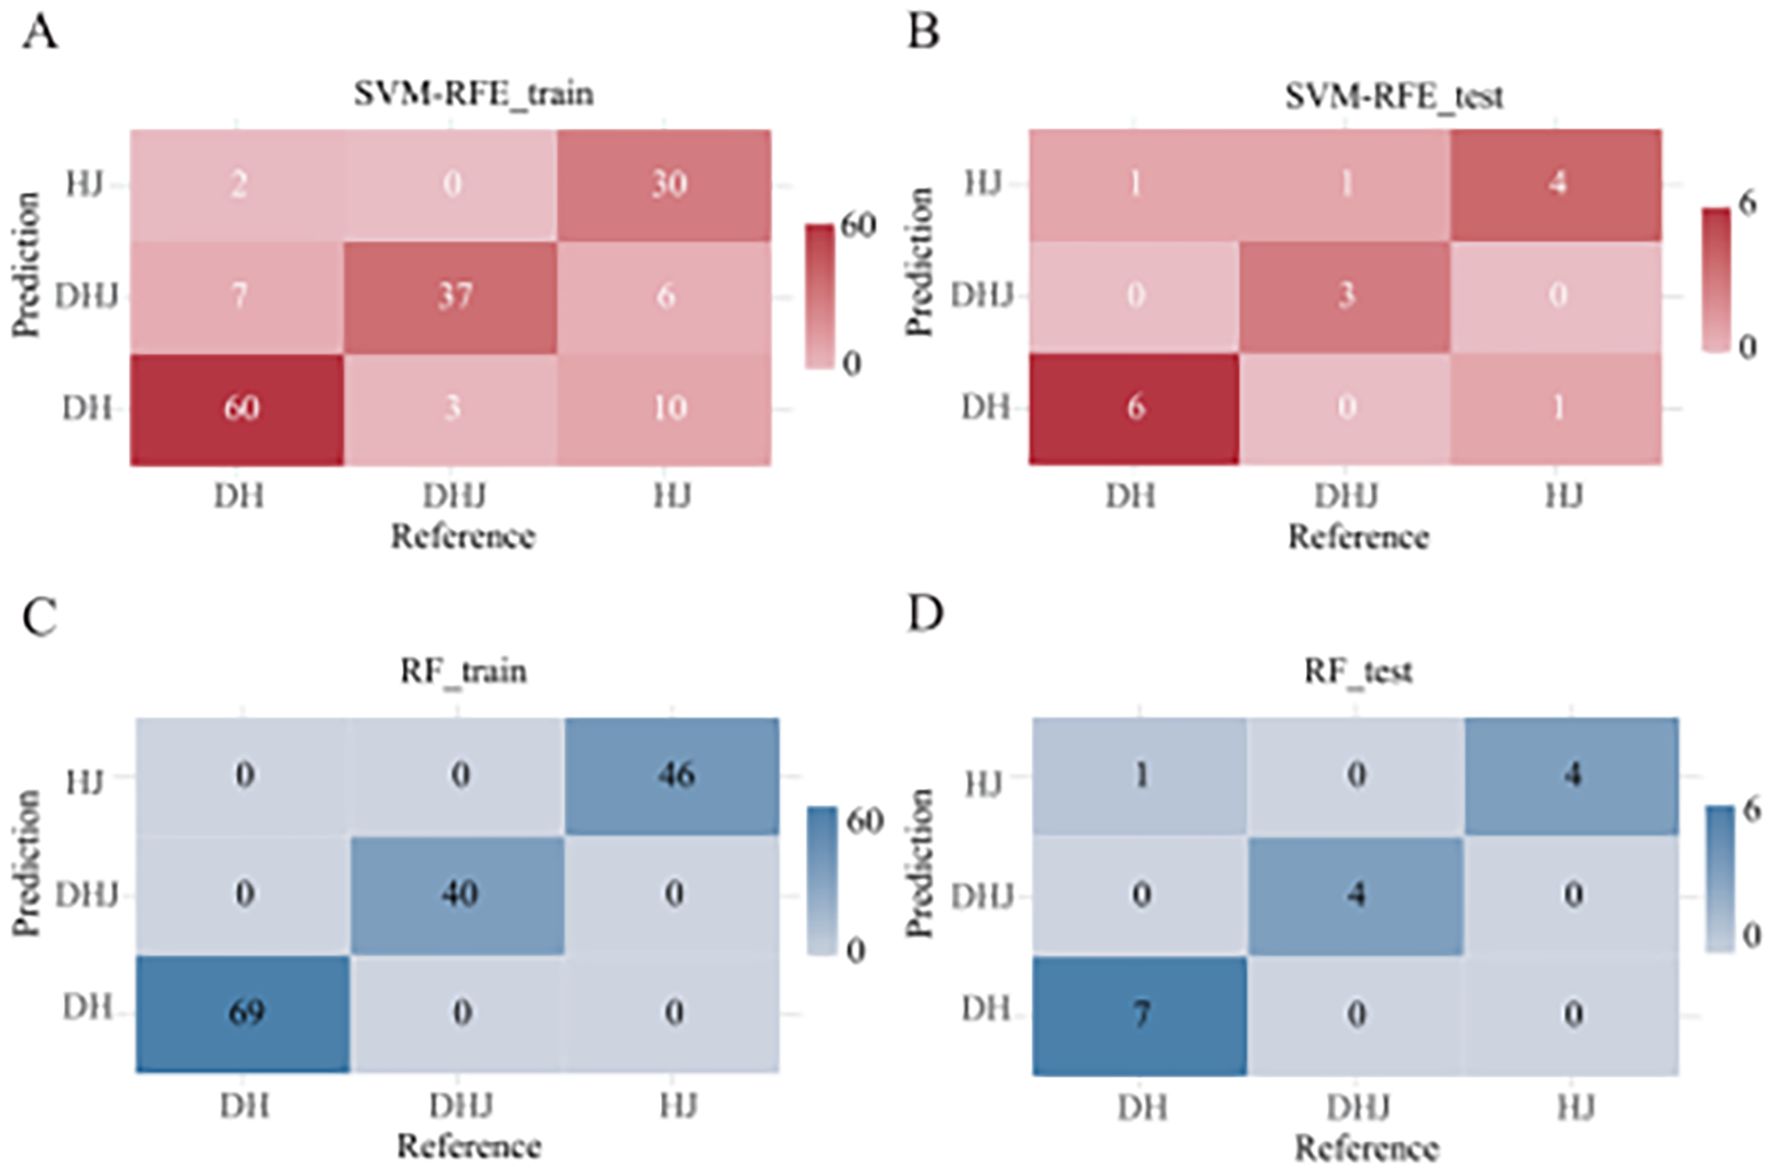
Figure 2. Confusion matrices. (A) SVM-RFE model training set; (B) SVM-RFE model test set; (C) RF model training set; (D) RF model test set. (The x-axis represents true species labels, while the y-axis indicates predicted species labels. Cell values denote sample counts.).
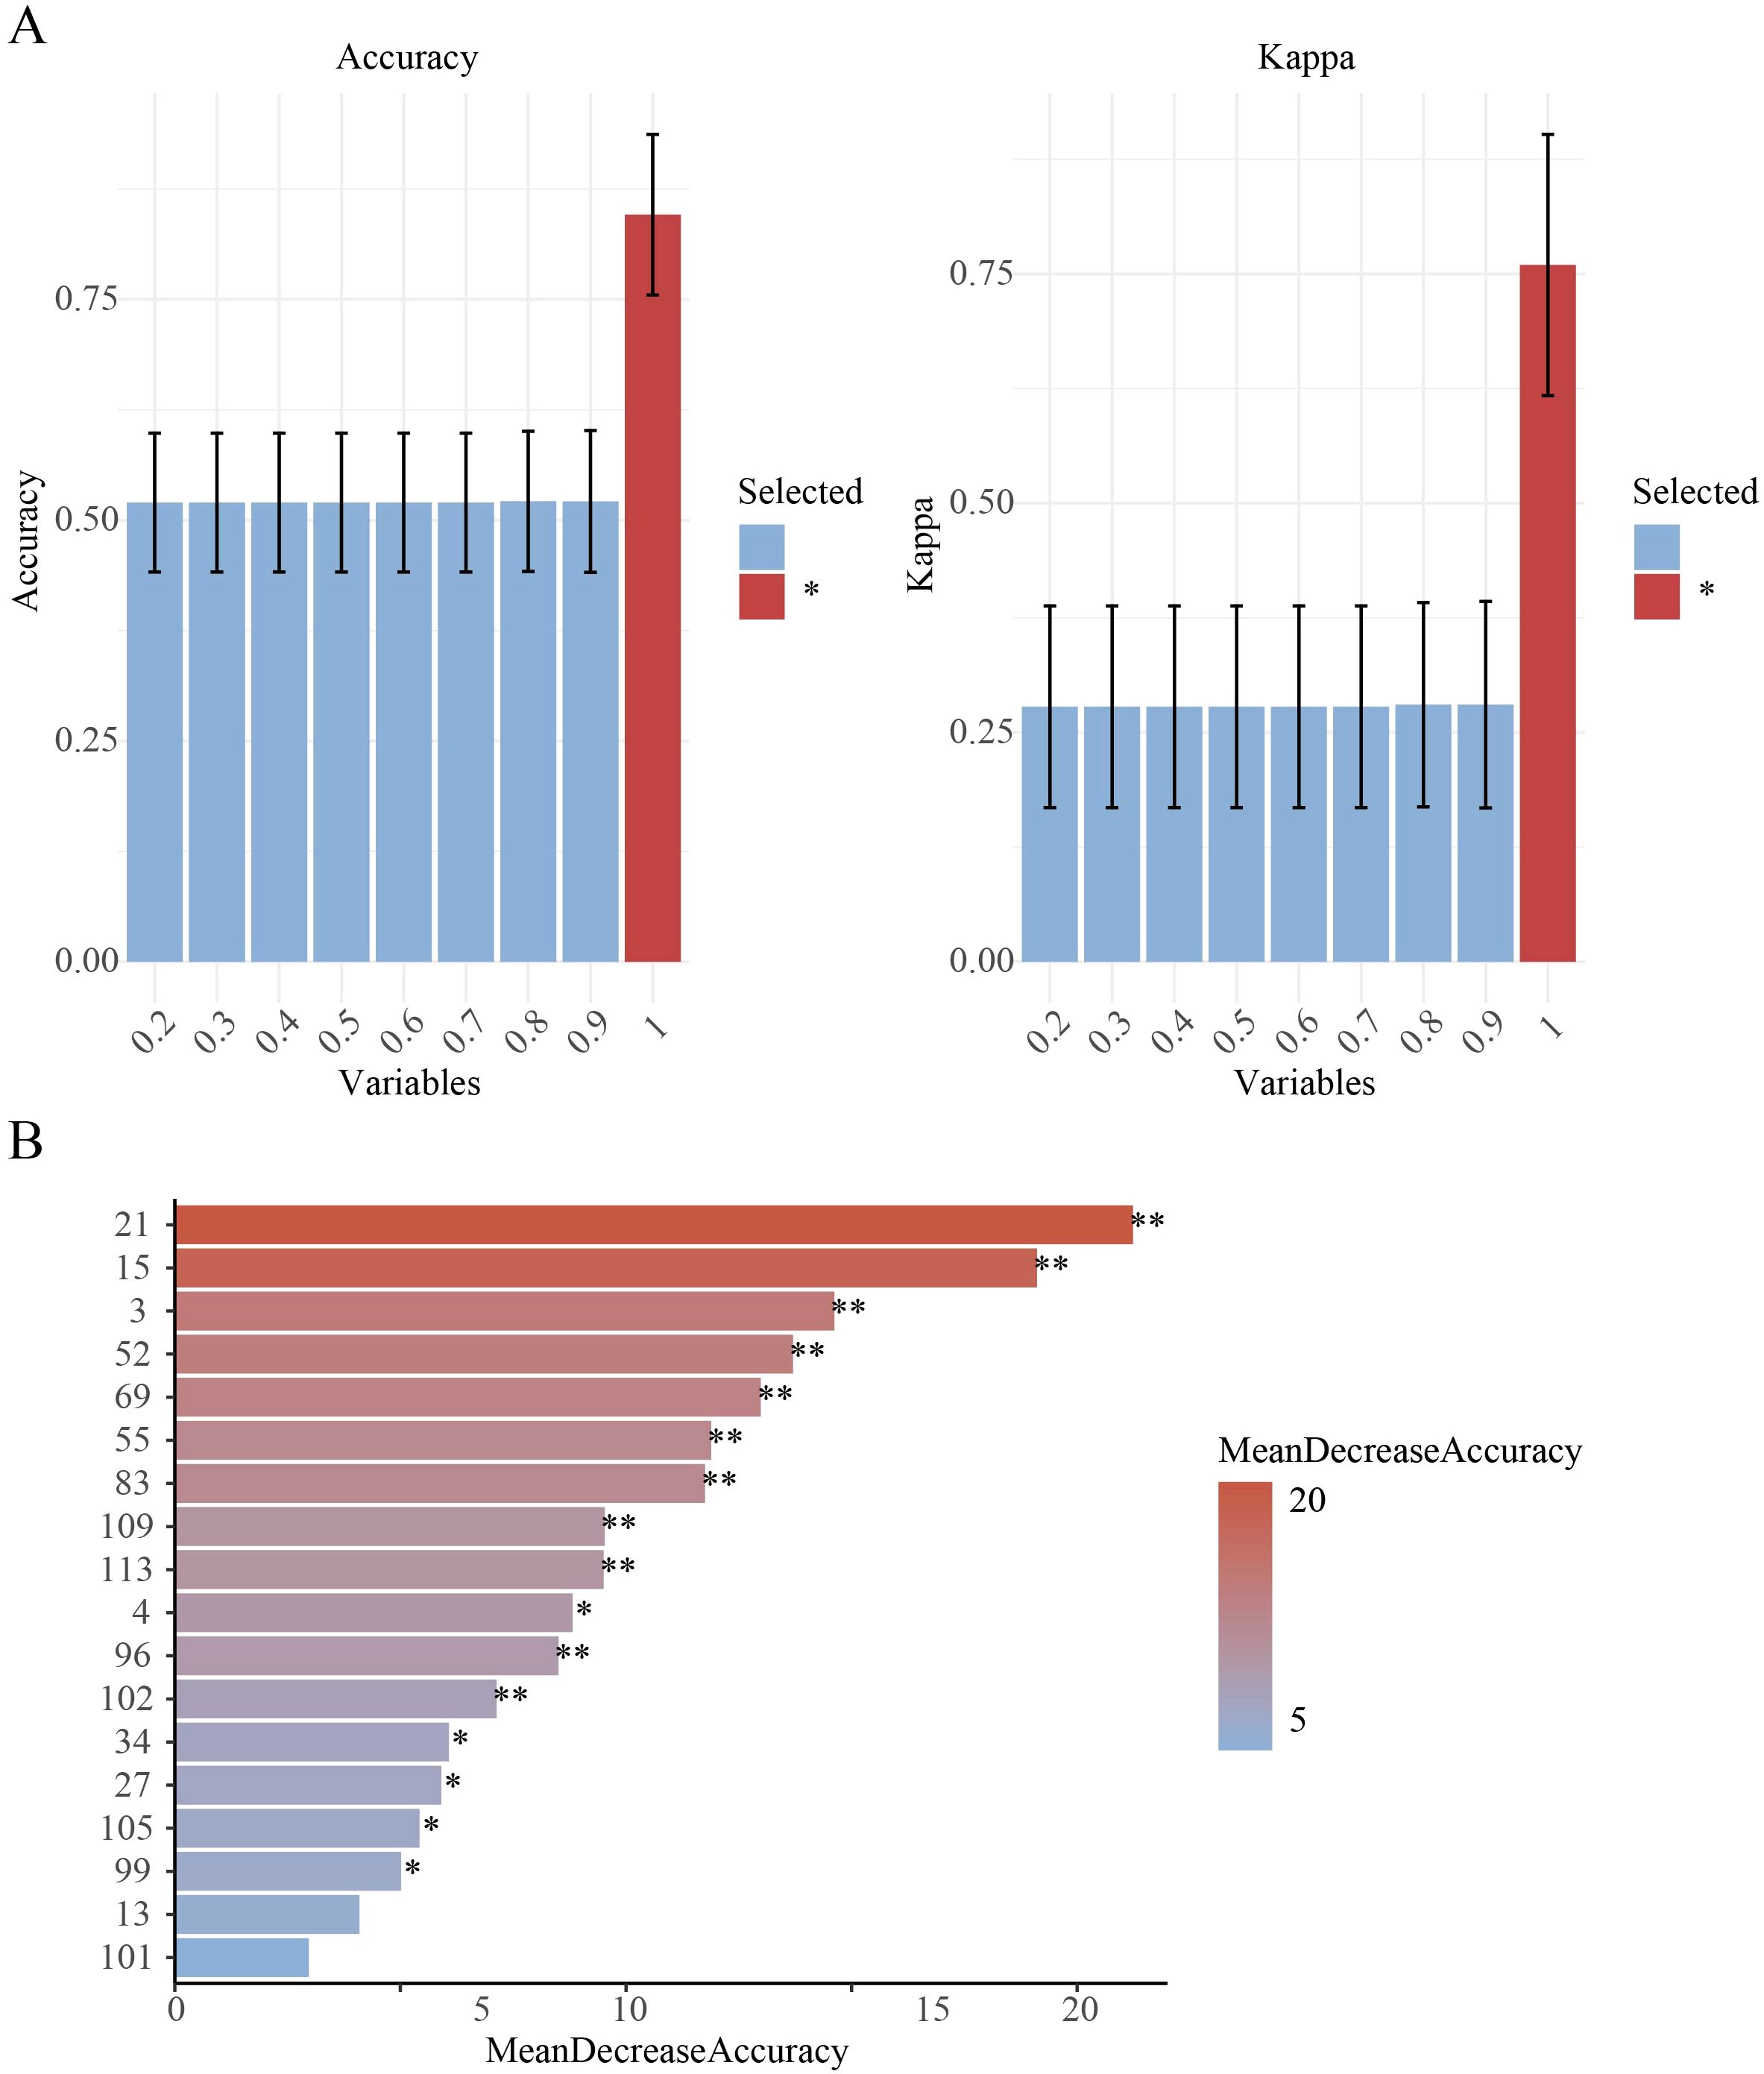
Figure 3. Feature importance analysis. (A) SVM-RFE feature selection parameters, Variables indicates the subset size/proportion of features used in training, Accuracy represents classification accuracy on the validation set (percentage of correctly predicted samples), Kappa (Cohen's Kappa coefficient) measures classification consistency, * denotes the optimal model selection; (B) RF feature importance: MeanDecreaseAccuracy quantifies a feature's contribution by measuring the reduction in prediction accuracy when its values are permuted (**p < 0.01, *p < 0.05).
RF model
To enable direct performance comparison with the SVM-RFE model, the RF model used the same proportion of the training set. The results showed that the model achieved an accuracy of 100% on the training set (Figure 2C) and 93.75% on the validation set (Figure 2D). It had strong classification ability for P. cyrtonema and P. kingianum, but the recall rate for P. sibiricum was slightly lower, indicating potential under-prediction for this species (Supplementary Table S5). Feature importance analysis (Figure 3B) showed that the top 5 primers with the highest contribution were: 21, 15, 3, 69, 55.
Genetic diversity analysis of Polygonati Rhizoma populations
Genetic diversity of populations from different species
Based on SSR amplification results, genetic diversity analysis was conducted on populations from different species (Table 4). Among them, the mean number of alleles (Na) of the DH, DHJ, HJ, and HB populations was 9.667, 5.056, 4.944, and 0.889, respectively; the mean effective number of alleles (Ne) was 4.869, 2.825, 2.772, and 0.800, respectively; Shannon's information index (I) was 1.638, 1.099, 1.089, and 0.163, respectively; the mean observed heterozygosity (Ho) was 0.000, 0.042, 0.021, and 0.000, respectively; and the mean expected heterozygosity (He) was 0.676, 0.535, 0.540, and 0.111, respectively. Among all populations, the DH population had the highest values for all genetic diversity parameters, indicating that it had the richest genetic diversity and a more extensive genetic variation pool. In addition, the observed heterozygosity (Ho) of all populations was lower than the expected heterozygosity (He), suggesting limited gene flow within these populations.
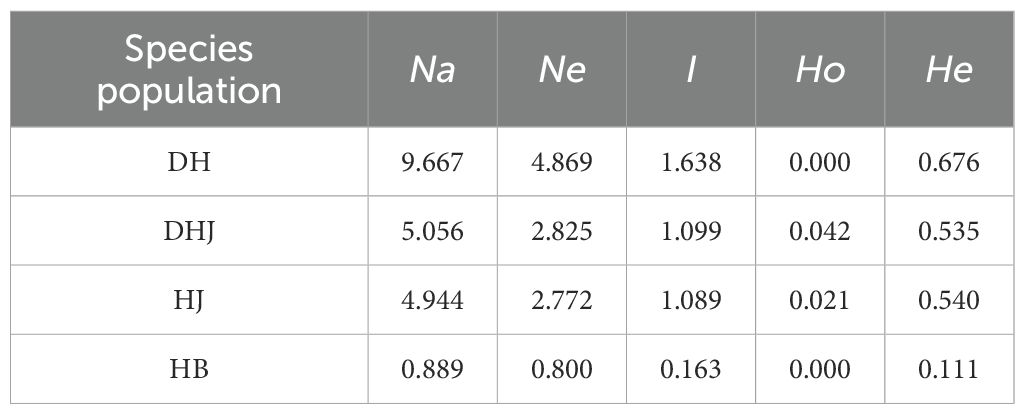
Table 4. Genetic diversity among the populations of four distinct species.
Pairwise genetic differentiation coefficients (Fst) and gene flow (Nm) among the four populations were analyzed (Figure 4). The results showed significant genetic differentiation among populations, particularly between the HB and HJ populations, and between the DH and DHJ populations. In contrast, the genetic differentiation between the HJ and DH populations was relatively low (Fst = 0.197), accompanied by higher gene flow (Nm = 1.019).
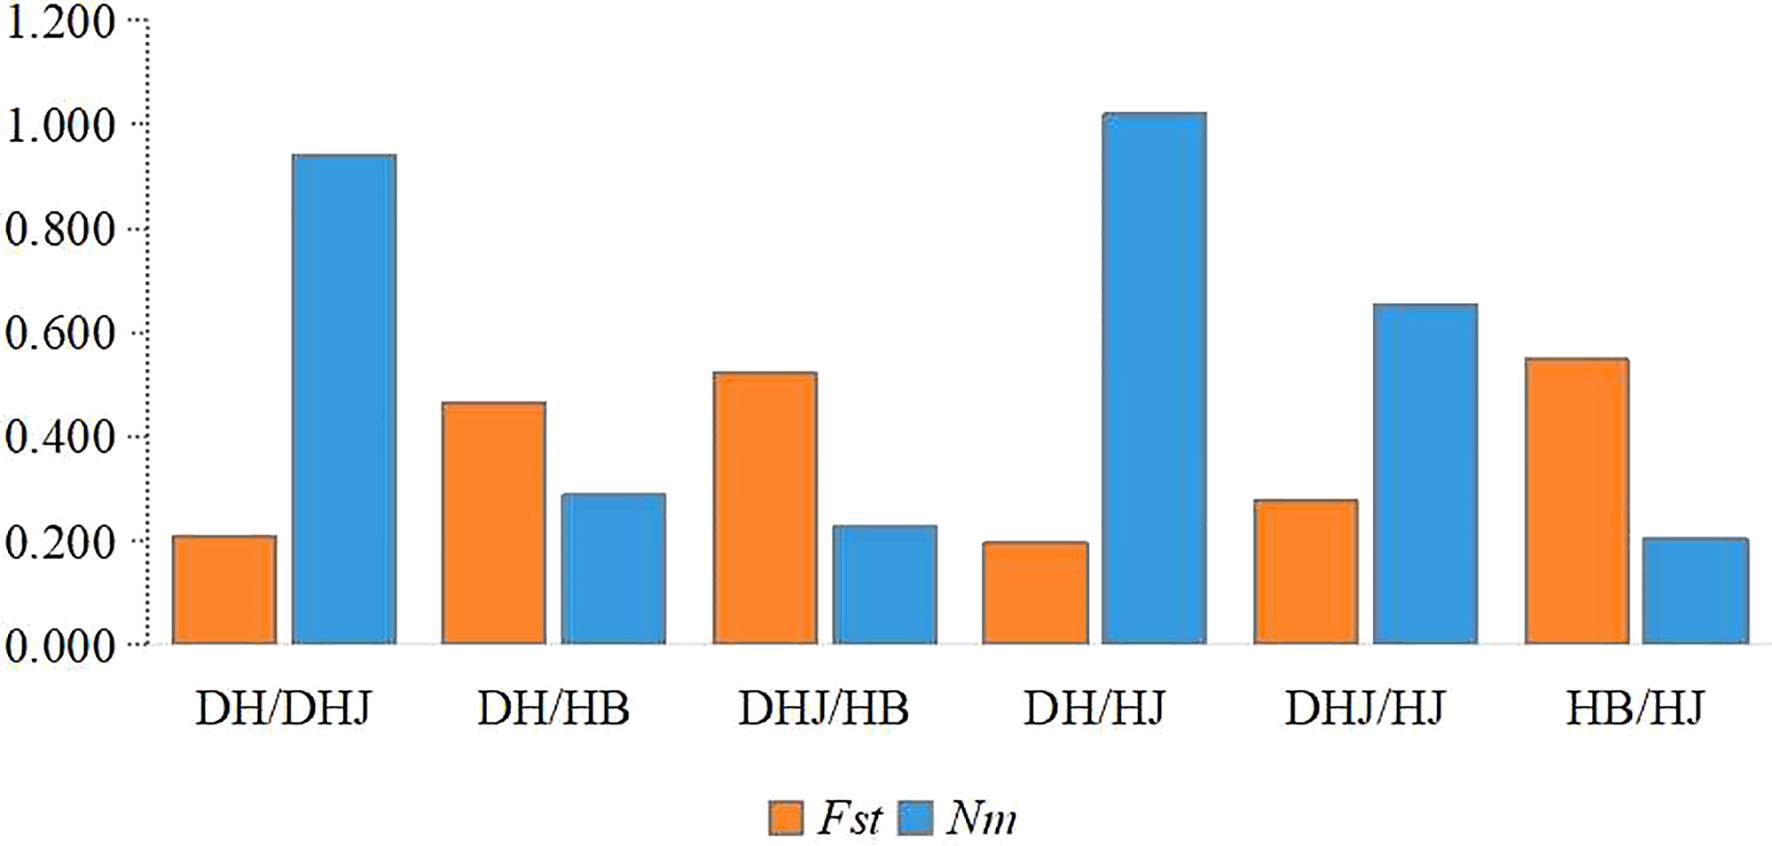
Figure 4. Coefficient of pairwise genetic differentiation (Fst) along with the level of gene flow (Nm) among populations.
Genetic diversity of populations from different geographic regions
Genetic diversity analysis was performed on 35 Polygonati Rhizoma populations from different geographic regions (Table 5). The results showed significant genetic differentiation among populations of the same species from different regions. Among the DH populations, the GZDH13 population from Qiandongnan, Guizhou Province, had the highest values for all genetic diversity parameters, which were significantly higher than those of other DH populations. Specifically, the mean number of alleles (Na), mean effective number of alleles (Ne), and Shannon's information index (I) of DH populations from different geographic regions ranged from 0.389 to 1.556, 0.389 to 1.470, and 0.000 to 0.353, respectively. For HJ populations, these diversity indices across different geographic populations ranged from 0.278 to 1.611 for Na, 0.278 to 1.418 for Ne, and 0.000 to 0.397 for I. Overall, the genetic diversity among DHJ populations showed minimal variation.
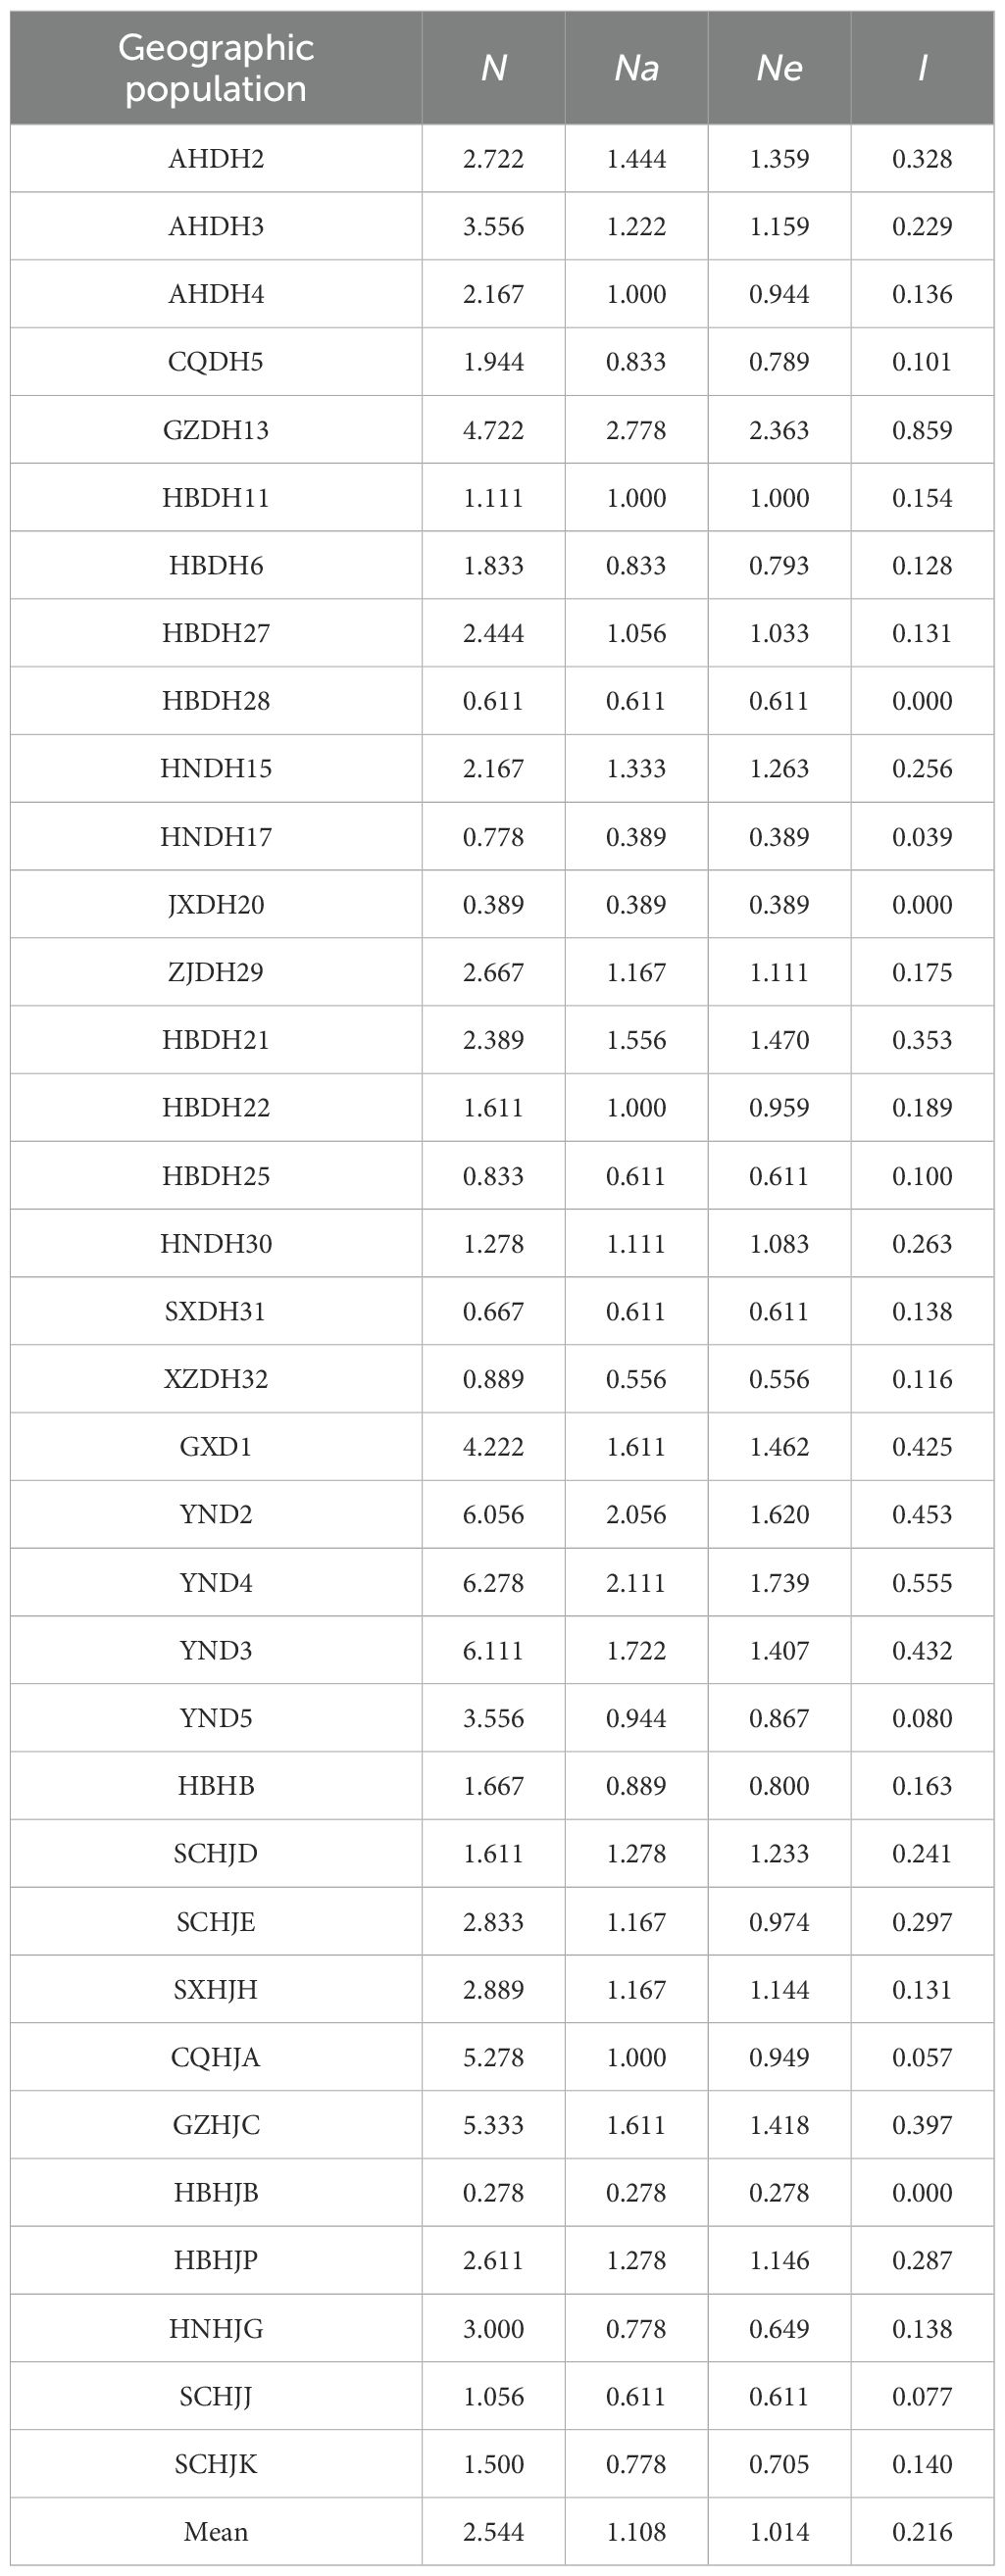
Table 5. Genetic diversity in 35 geographic populations.
The results of pairwise genetic differentiation (Fst) and gene flow (Nm) analysis of the 35 Polygonatum populations are shown in Figure 5. Among them, the DH region populations JXDH20 and HBDH28 exhibited the highest genetic differentiation (Fst = 1.000), followed by the HJ region populations HBHJB and CQHJA (Fst = 0.970). In contrast, the genetic differentiation among populations within the DHJ group was relatively low. In addition, the GZDH13 population had a closer genetic relationship with the YND2 population (mean Fst = 0.301), with higher gene flow observed between these two populations (Nm = 1.243).
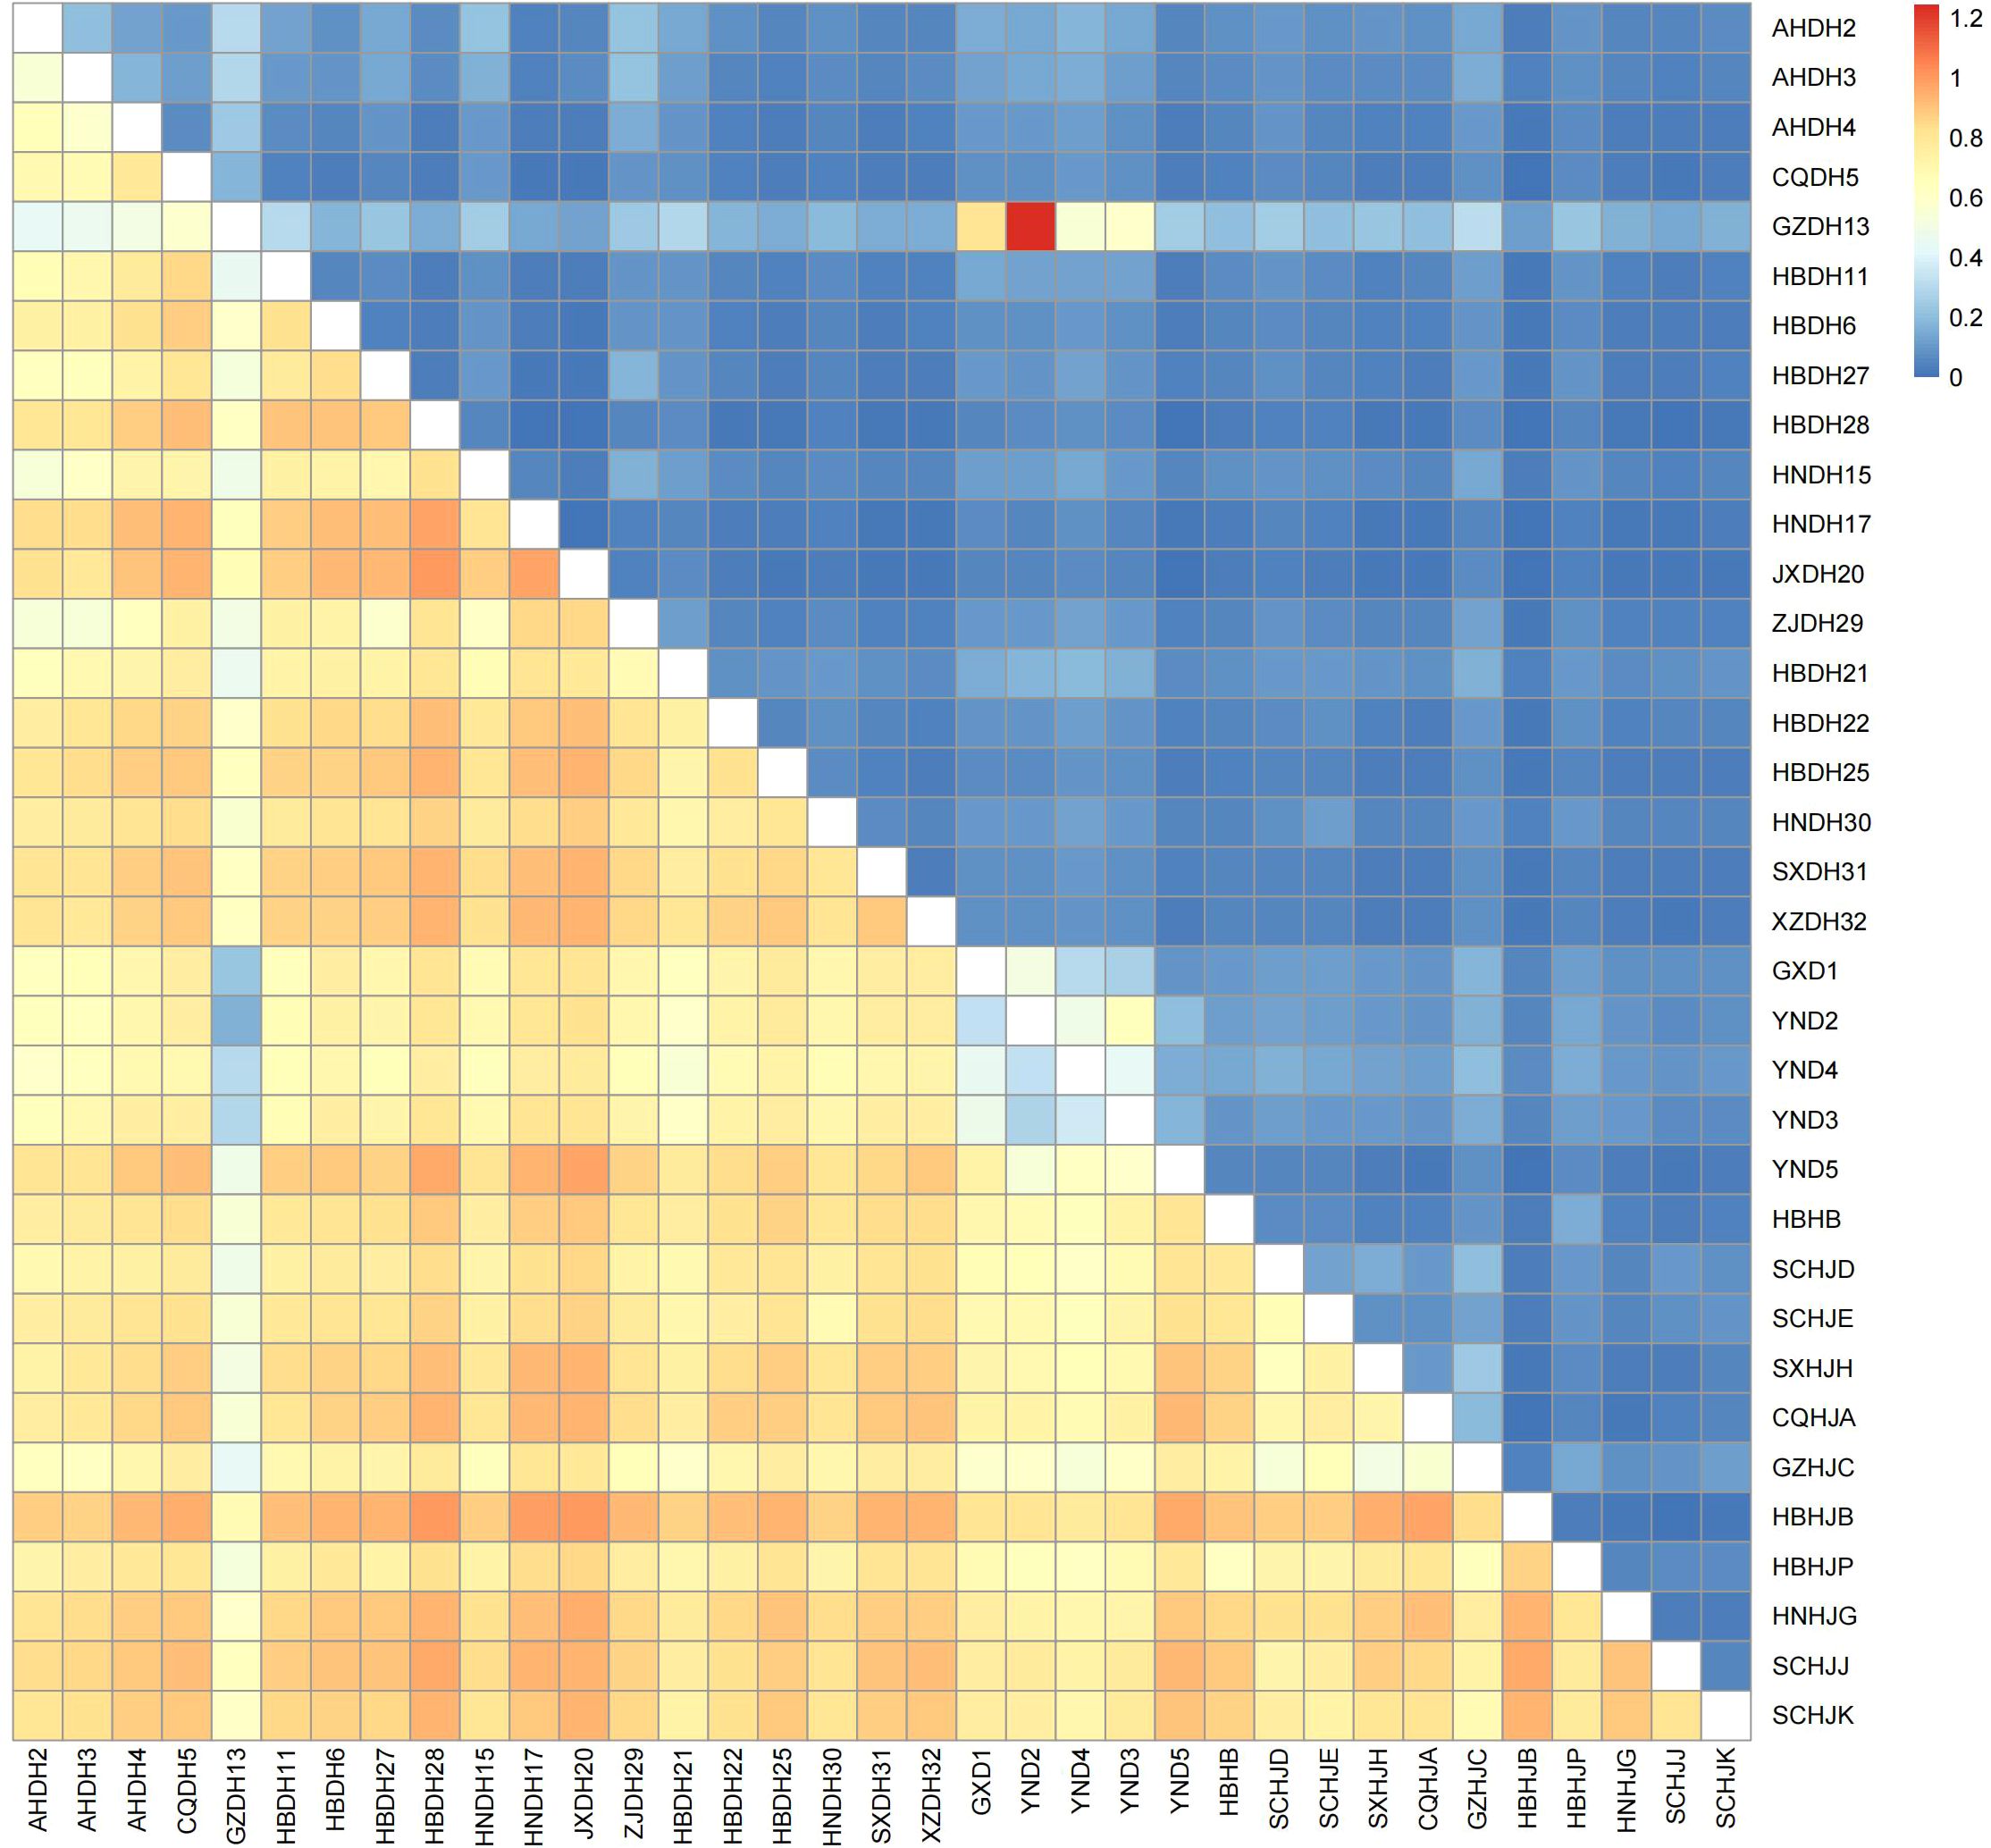
Figure 5. Heatmap illustrating the pairwise genetic differentiation coefficients (Fst) between colonies and corresponding gene flow levels (Nm). (Lower left quadrant: Fst values; Upper right quadrant: Nm values).
The results of AMOVA analysis (Supplementary Table S6) showed that most of the genetic variation in Polygonatum Mill. occurred within populations, and the inter-population variation of P. sibiricum accounted for 54%, which was the main source of intraspecific variation. The results of the Mantel test (Figure 6) indicated a significant positive correlation between genetic distance and geographic distance among the 35 Polygonatum populations (R² = 0.273, P = 0.001); this significant correlation still existed when P. cyrtonema, P. kingianum, and P. sibiricum were analyzed individually.
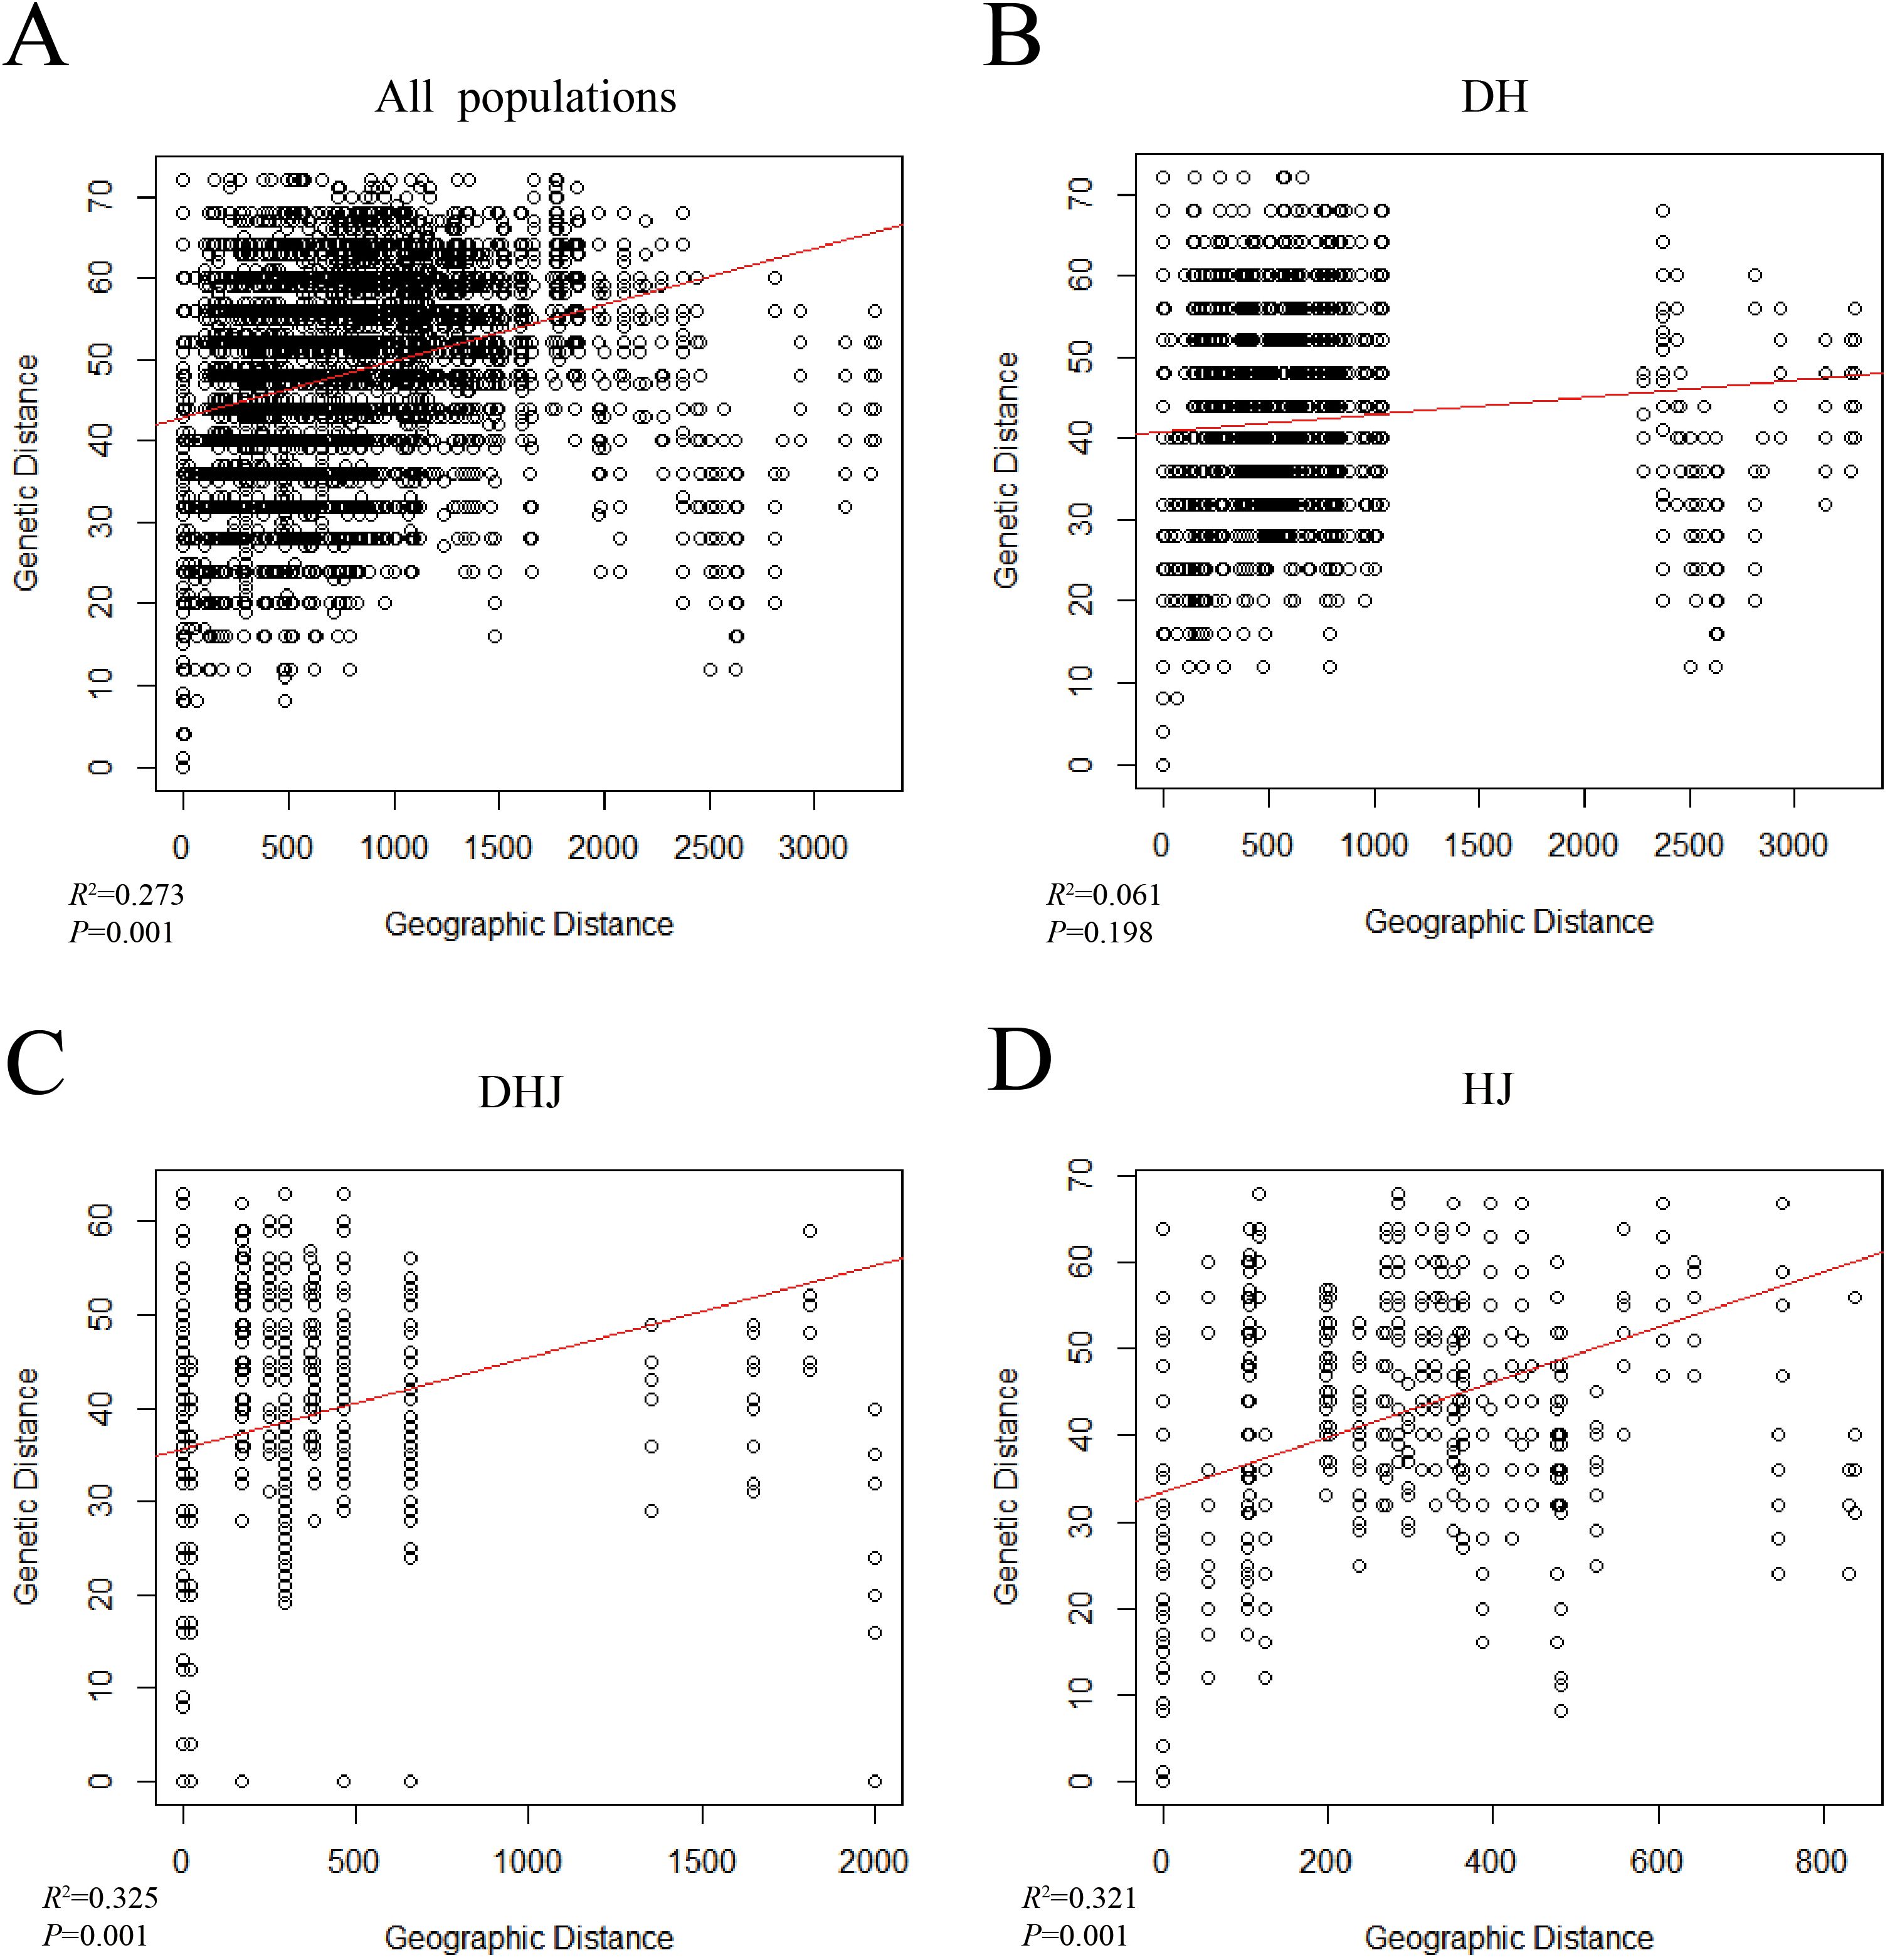
Figure 6. Mantel's test analysis of the populations of Polygonatum Mill. (A) all populations; (B) P. cyrtonema population (DH); (C) P. kingianum population (DHJ); (D) P. sibiricum population (HJ).
Kinship and population structure analysis of Polygonati Rhizoma populations
The results of kinship clustering analysis of Polygonati Rhizoma populations are shown in Figure 7A. Group 1 included 5 P. kingianum (DHJ) populations, and the GZDH13 population from Qiandongnan, Guizhou Province, showed genetic component admixture with this group. This result was consistent with the lower Fst value and higher Nm value between the GZDH13 population and the P. kingianum (DHJ) population. Group 2 included 5 P. sibiricum (HJ) populations and the P. zanlanscianense (HB) population; notably, the HBHJB population from Xianning, Hubei Province, and the SCHJD, SCHJE, SCHJJ, and SCHJK populations from Sichuan Province all showed admixture with the P. cyrtonema (DH) population. Group 3 included 17 P. cyrtonema (DH) populations, excluding only the HBDH21 population from Shiyan, Hubei Province, and the GZDH13 population from Qiandongnan, Guizhou Province.
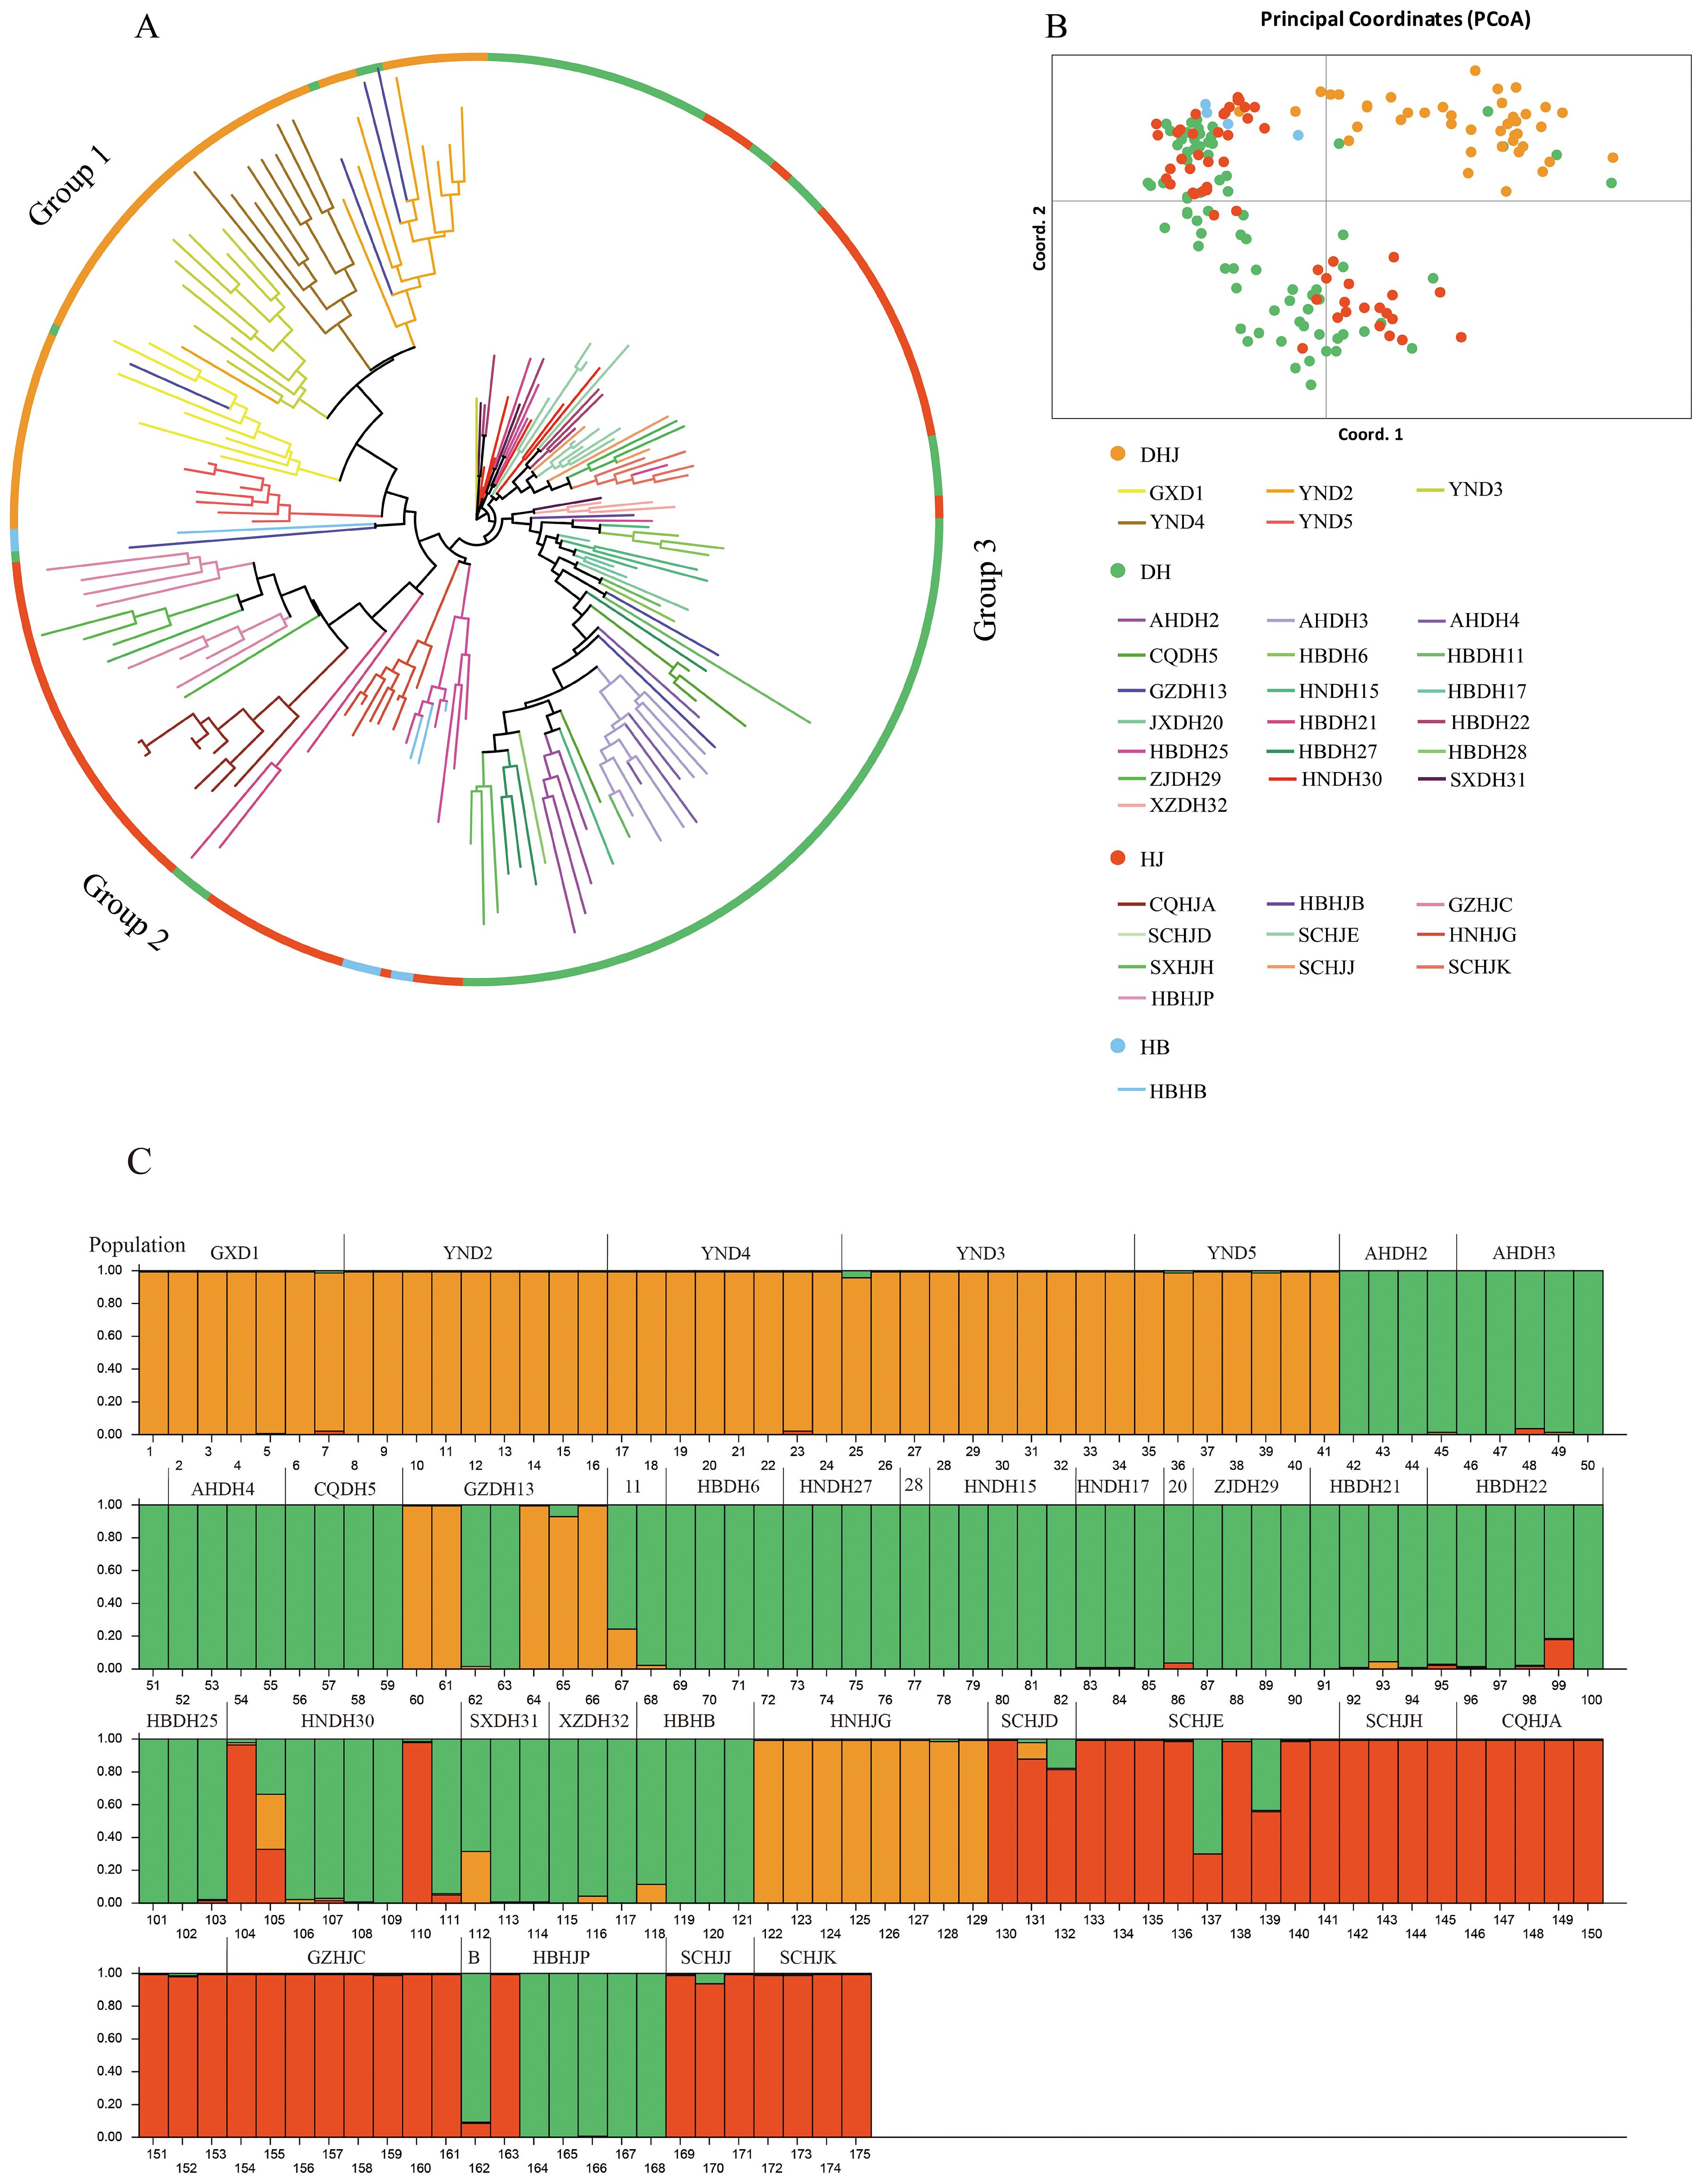
Figure 7. NJ tree, PCoA principal coordinates analysis and Population structure of 175 Polygonati Rhizoma germplasm. (A) NJ tree; (B) PCoA principal coordinates analysis (Germplasm from different population sources are indicated by different colored sample numbers); (C) Population structure of 175 Polygonati Rhizoma germplasm (K = 3) (Note: 11 is HBDH11, 28 is HBDH28, 20 is JXDH20, B is HBHJB).
The results of principal component analysis (PCA) (Figure 7B) further verified the clustering conclusions of the neighbor-joining (NJ) tree: the P. sibiricum (HJ) and P. zanlanscianense (HB) populations had a close genetic relationship and could not be clearly divided into independent groups; in contrast, the P. kingianum (DHJ) population was significantly different from other groups and could be clearly clustered into an independent group.
Cluster analysis of 175 Polygonati Rhizoma germplasm samples showed that the optimal grouping was achieved when K = 3 (Figure 7C). The P. kingianum (DHJ) population had a relatively homogeneous ancestral composition, while the P. sibiricum (HJ), P. zanlanscianense (HB), and P. cyrtonema (DH) populations had a higher degree of genetic component admixture, indicating a closer genetic relationship among the three. Further analysis showed that most of the germplasm resources from Hubei Province were mainly assigned to the green group (corresponding to the P. cyrtonema (DH) population), including the HBHB, HBHJB, and HBHJP genotypes. In contrast, the genetic relationships and backgrounds of the four P. sibiricum (HJ) populations from Sichuan (SCHJD, SCHJE, SCHJJ, and SCHJK) were unclear; these populations showed a close genetic relationship with the P. cyrtonema (DH) population in kinship clustering analysis and were more closely associated with the red group of the (HJ) population in population structure analysis.
Construction of a core collection bank
The LDSS (Linkage Disequilibrium-Stratified Sampling) strategy was used for stepwise clustering based on genetic distance, and five primary core germplasm banks were constructed sequentially (Table 6; Supplementary Tables S7-S11). During the clustering process, germplasm with high genetic similarity was gradually excluded, which improved the genetic diversity of the remaining samples and increased the corresponding genetic parameters: as the sampling proportion decreased, the number of alleles (Na) gradually decreased; in contrast, the effective number of alleles (Ne), Shannon's information index (I), and expected heterozygosity (He) all reached their maximum values when the sampling proportion was 45%. The allele retention rate of the C78 primary core germplasm bank was 84.59%, indicating that it had the lowest genetic redundancy while maintaining the most extensive genetic diversity. When the sampling proportion was lower than 45% (the proportion corresponding to C78), the reduction in germplasm materials led to significant loss of genetic variation and a decline in genetic diversity; therefore, the overall genetic diversity of the C62, C42, and C22 core germplasm banks was lower than that of C78.
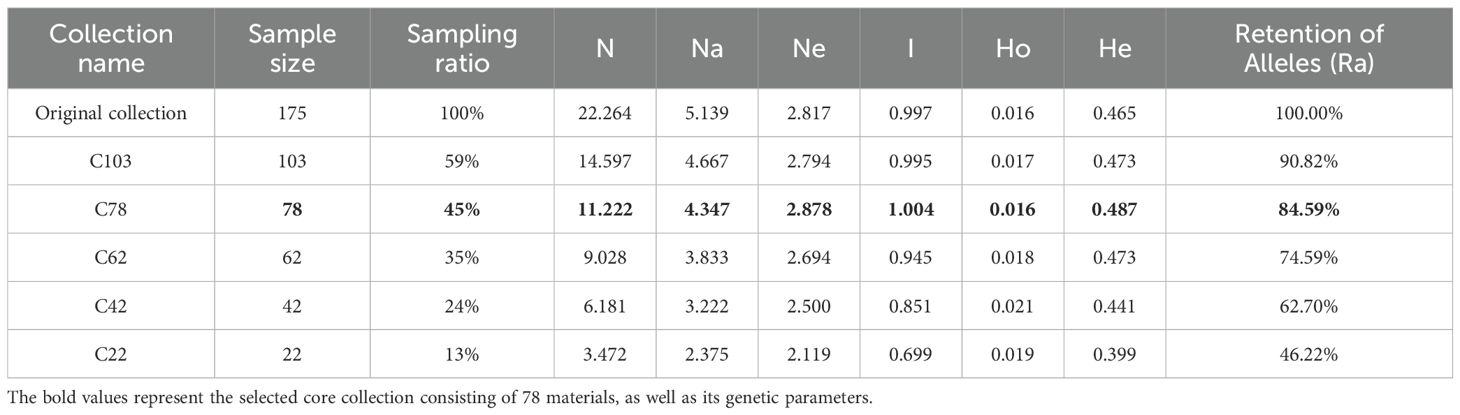
Table 6. Genetic diversity characteristics of the original germplasm and the five primary core collections at different sampling ratios.
Cluster analysis was performed on the samples of the core germplasm bank (Figure 8A), and the results showed that these samples had a wide geographic distribution, covering most of the sampling areas of the original populations. The results of principal component analysis (PCA) (Figure 8B) indicated a high degree of consistency in the distribution pattern between the core germplasm bank samples and the original populations, suggesting that the core germplasm bank could accurately represent the genetic diversity of the original populations within the same geographic range. The above results confirm that the constructed core germplasm bank can effectively retain the genetic structure of the original populations and has high representativeness and comprehensive coverage.
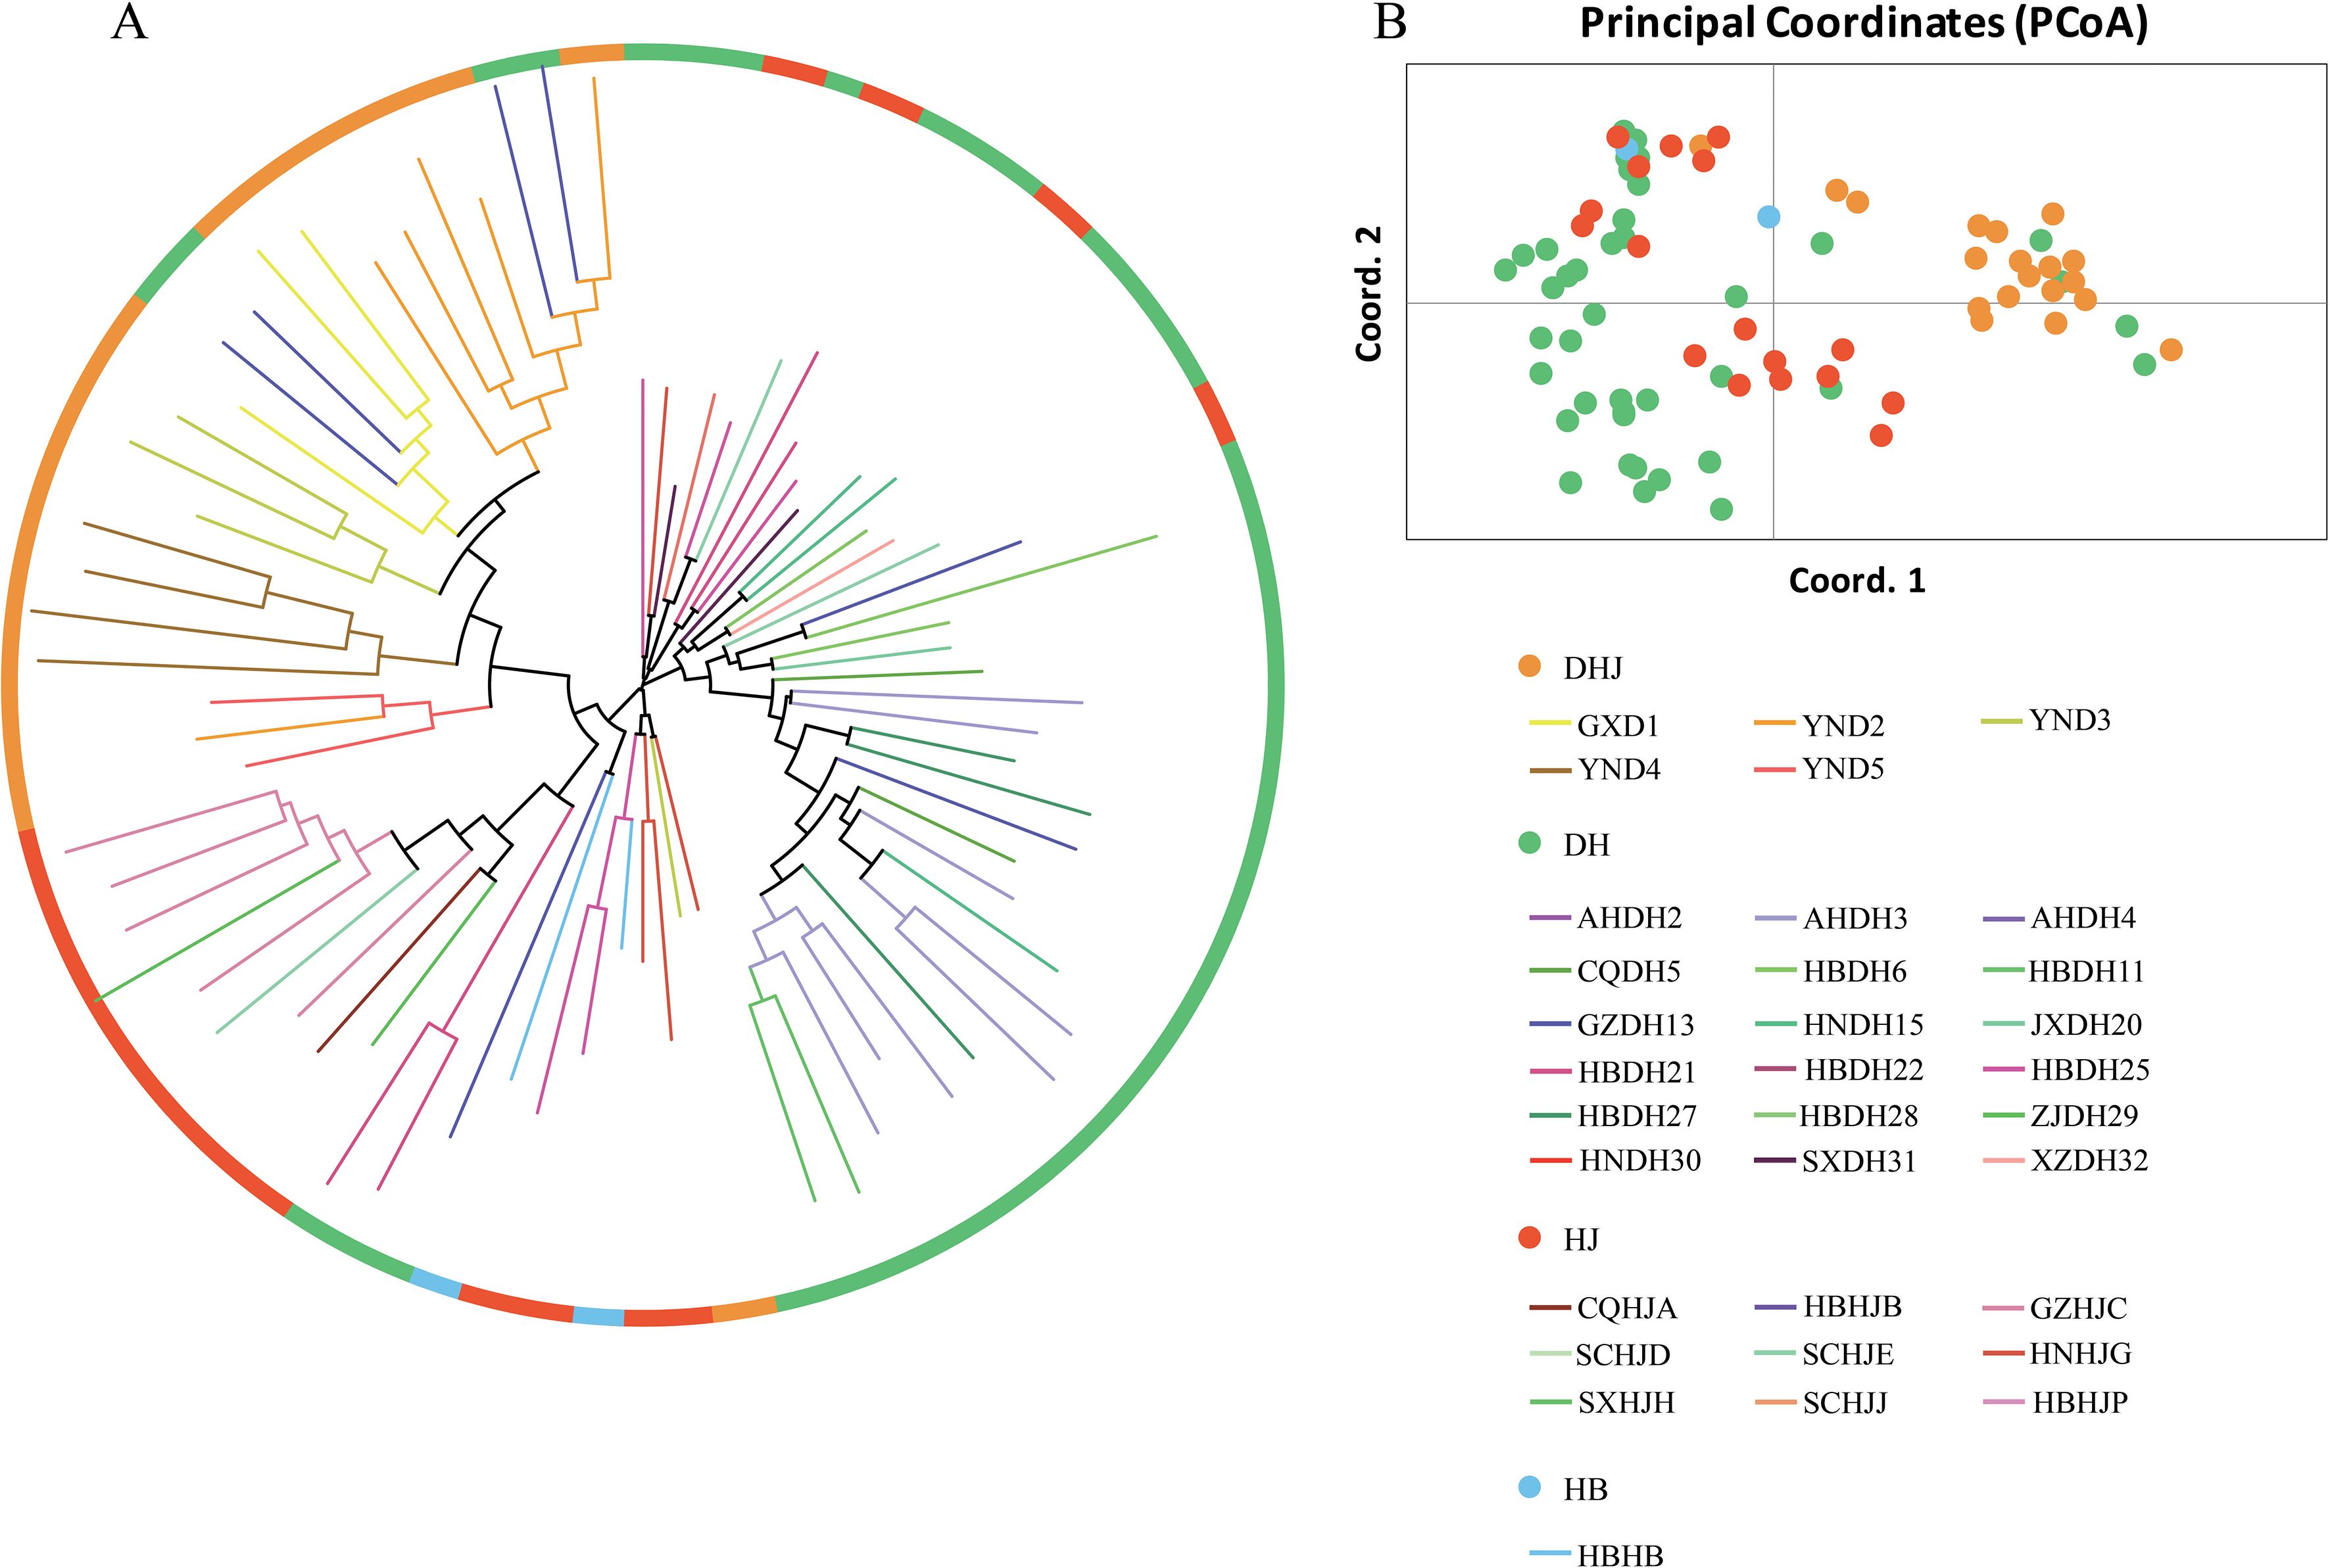
Figure 8. NJ tree and PCoA principal coordinates analysis of 78 Polygonati Rhizoma core collection. (A) NJ tree; (B) PCoA principal coordinates analysis. (Germplasm from different population sources are indicated by different colored sample numbers).
Discussion
The current identification of Polygonatum Mill. plant resources mainly depends on phenotypic traits. However, morphological analyses of Polygonatum species from different regions often exhibit similar characteristics. This similarity can lead to confusion in germplasm classification and negatively impact the conservation and development of germplasm resources.
Simple Sequence Repeat (SSR) molecular markers, renowned for their co-dominance, high polymorphism, robust repeatability, abundance, and reliable outcomes, are pivotal tools in unraveling plant genetic diversity, species identification, breeding enhancement, and genetic map construction (Ouyang et al., 2018). A thorough investigation into genetic diversity and population structure is crucial for the conservation, exploitation, and genetic enhancement of germplasm resources. Despite the existing body of research on Polygonatum species that predominantly delves into their chemical composition, including polysaccharides, preparation techniques, and pharmacological activities (as shown in Figure 9), the deployment of SSR markers has been somewhat constrained. Although SSR markers have been established for P. kingianum, P. sibiricum, and P. cyrtonema, their practical application is scarce, and comprehensive studies on genetic diversity and their broader implications are infrequent (Cheng et al., 2020; Wang et al., 2018). Consequently, the present study is dedicated to a systematic exploration of the genetic diversity within Polygonatum species in China. Leveraging 18 highly discriminative SSR markers, we have assessed genetic diversity, kinship, and population structure across 175 medicinal Polygonatum accessions. Furthermore, a core collection has been meticulously curated to encapsulate the genetic diversity of these germplasm resources, thereby optimizing the number of accessions and reducing the associated management costs of germplasm banks, while simultaneously augmenting the efficient utilization of these valuable resources.
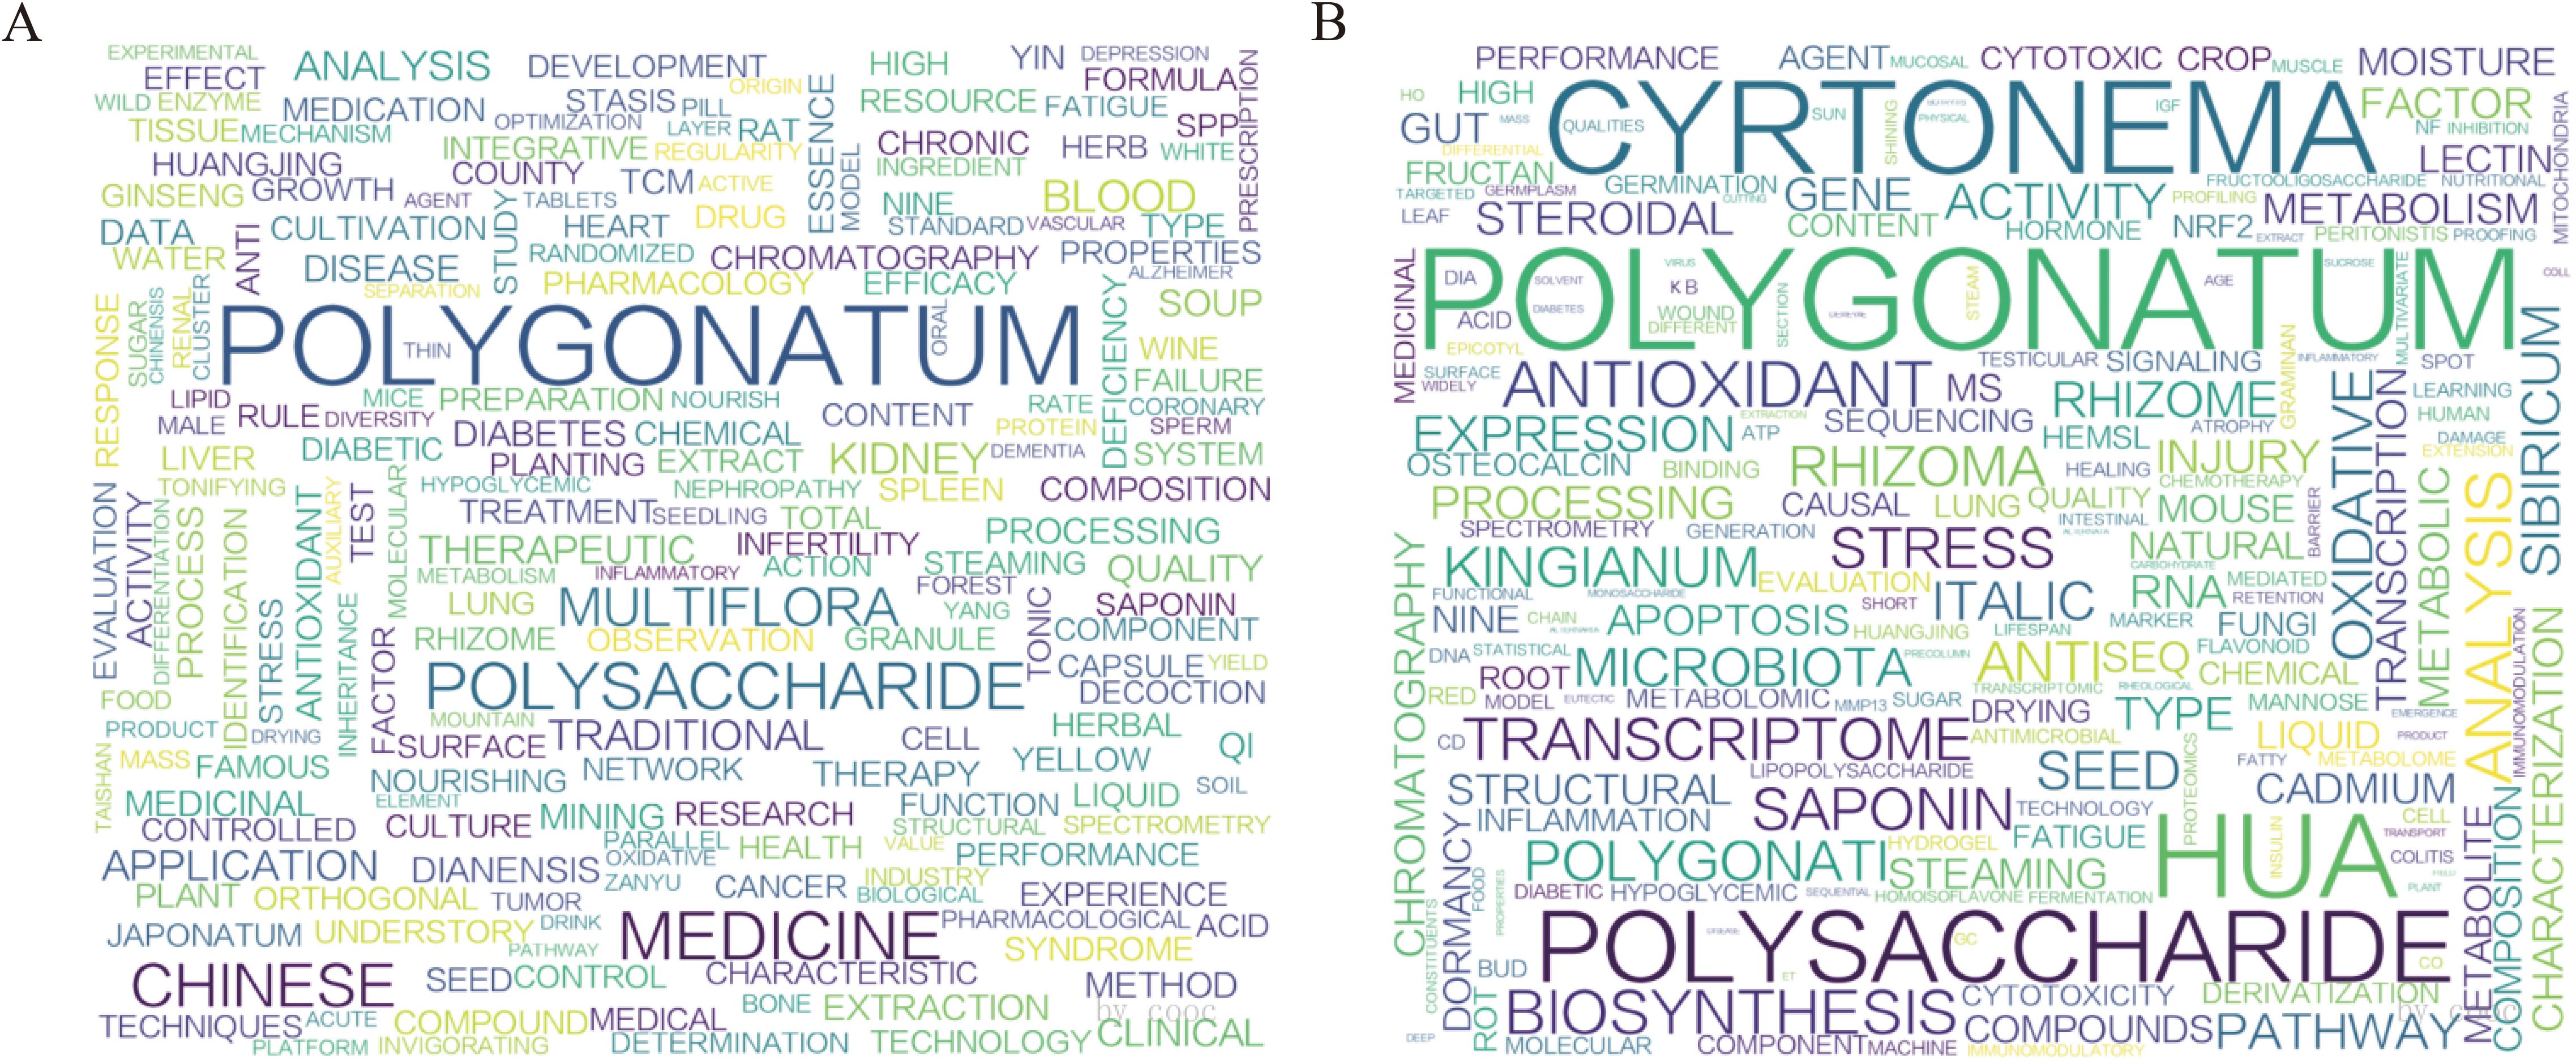
Figure 9. Word cloud of keywords for Polygonati Rhizoma plant research. (A) Chinese research keywords; (B) Foreign research keywords.
The advent of high-throughput sequencing has facilitated the incorporation of genetic data as complementary evidence for taxonomic delineation. Machine learning-based integrative approaches (e.g., BPP and DISSECT) have demonstrated superior applicability in species boundary determination, though their implementation requires extensive datasets and substantial computational resources (Karbstein et al., 2024). This study pioneers the development of two machine learning models (both achieving >81% discrimination accuracy) for Polygonatum species identification using SSR markers, which effectively differentiate taxa without requiring a priori assumptions of population genetic structure. Notably, these models enable the identification of highly informative primers, providing practical guidance for cost-efficient marker selection in future applications.
Traditional morphological classification methods for Polygonatum face inherent limitations due to the subjective interpretation of diagnostic characters (e.g., rhizome shape, leaf arrangement), environmental plasticity (e.g., leaf size variation under different light and soil conditions), and the frequent homoplasy of phenotypic traits (Zhu et al., 2018; Wang et al., 2020). This is consistent with our observation that some morphologically similar accessions (e.g., 3 accessions of P. cyrtonema from Hunan and Guizhou) showed clear genetic differentiation in the SSR-based cluster analysis (Figure 3), further confirming that morphological traits alone are insufficient for accurate germplasm identification—underscoring the value of our developed SSR markers for resolving taxonomic ambiguities.
The developed SSR markers exhibit exceptional interspecific discriminative power, with all 18 primer pairs showing high polymorphism (0.5 < PIC < 1.0). A comparative analysis of genetic parameters, including the number of alleles (Na), effective number of alleles (Ne), Shannon's information index (I), observed heterozygosity (Ho), and expected heterozygosity (He), across various Polygonati Rhizoma populations revealed that P. cyrtonema possessed the highest genetic diversity, followed by P. kingianum and P. sibiricum. Furthermore, P. zanlanscianense exhibited relatively lower genetic diversity in this study, which may be attributable to its limited sample size (n = 4). We acknowledge that further analysis with an expanded sample set will be necessary to draw definitive conclusions. Further examination of populations from different geographic regions highlighted significant genetic differentiation among populations of the same species, with pronounced differences particularly evident in P. cyrtonema and P. sibiricum populations.
A clustering analysis of 175 Polygonatum Mill. accessions from various regions showed that P. kingianum formed a distinct cluster (Group 1). In contrast, P. sibiricum, P. cyrtonema, and P. zanlanscianense exhibited some degree of mixing within the clustering framework. Geographically, P. kingianum is predominantly found in Yunnan, Sichuan, and Guizhou provinces, whereas P. cyrtonema has a broader distribution, including Sichuan, Guizhou, Hunan, Hubei, Henan, and Jiangxi. P. sibiricum is mainly distributed in Hebei, Shaanxi, Shanxi, Henan, Heilongjiang, and surrounding areas. Notably, there is overlap in the distribution areas of P. kingianum and P. cyrtonema, as well as between P. cyrtonema and P. sibiricum, which aligns with the clustering results, indicating a geographical distribution pattern that correlates with genetic variation. The Mantel test further revealed a significant positive correlation between genetic distance and geographical distance across Polygonatum populations, suggesting that geographic factors such as mountains, plains, water bodies, and varying climatic conditions play a major role in the genetic differentiation of populations. For instance, the GZDH13 population from Qiandongnan, Guizhou Province, exhibited a genetic background similar to that of the P. kingianum population, supporting this conclusion. Evidence of gene flow and introgression, both within and between populations, particularly between P. sibiricum populations from different regions and some P. cyrtonema populations, reflects the impact of long-term domestication and cultivation, which have facilitated gene flow and introgression among populations from diverse regions (Wang et al., 2020, Wang et al., 2022). In particular, certain geographically isolated populations, such as GZHJC (Guizhou) and SXHJH (Shaanxi), ZJDH29 (Zhejiang) and HBDH27 (Hubei), as well as XZDH30 (Tibet) and HBHJB (Hubei), exhibited signs of potential artificial introgression, likely due to cultivation. This was supported by their clustering patterns and genetic differentiation levels. The HBHB population, with a genetic background resembling that of the HBHJQ population from Hubei Province, may also have originated from artificial cultivation. The population structure of P. sibiricum, including the SCHJD, SCHJF, SCHJJ, and SCHJK populations, was more ambiguous, with genetic similarities to both P. cyrtonema and P. sibiricum. This is consistent with previous reports suggesting that the southwestern region of China may be the center of origin for Polygonati Rhizoma (Zhu et al., 2018).
Conserving genetic diversity within a species' entire germplasm resource is a complex and resource-intensive task. Therefore, establishing a core collection that minimizes redundancy while maximizing genetic diversity is crucial for effectively representing the species' gene pool (Anoumaa et al., 2017). In this study, we utilized the LDSS method to construct a core collection of medicinal Polygonatum spp. populations. To assess the representativeness of this core collection, we compared genetic parameters (allele frequency, number of alleles [Na], effective number of alleles [Ne], observed heterozygosity [Ho], expected heterozygosity [He], and Shannon's information index [I]) and allele retention rates between the original germplasm and the core collection. The final core collection, designated as C78, captured the genetic diversity of 33 sampled populations across 13 provinces. The representativeness of this core collection was further validated through principal component analysis (PCA), which compared the genetic structures of the core collection and the original germplasm. Additionally, the core collection geographically encompassed most of the regions from which the original germplasm was sampled.
Conclusion
This study addresses key gaps in Polygonati Rhizoma germplasm research by leveraging 18 pairs of highly polymorphic SSR markers (average PIC unreported, but validated for strong discriminative power) to conduct comprehensive analyses of population genetics, phylogenetic relationships, and population structure across 175 Polygonatum accessions—yielding three novel, actionable findings:
First, our SSR-based analysis delineated three distinct genetic groups with clear taxonomic and geographic relevance: Group 1 (exclusively P. kingianum), Group 2 (P. sibiricum + P. zanlanscianense), and Group 3 (P. cyrtonema + Sichuan-sourced P. sibiricum). This resolution resolves prior ambiguity in Polygonatum intraspecific classification, providing a genetic framework for accurate germplasm identification—critical for avoiding mismanagement of conservation resources.
Second, we established a core germplasm collection, with the C78 primary core collection standing out for its minimal genetic redundancy while effectively capturing the geographic origin and full genetic diversity of the original accessions. This is the first systematic Polygonati Rhizoma core collection built via SSR-guided screening, offering a cost-efficient solution to address the resource-intensive challenge of conserving large germplasm pools.
These results deliver dual value for Polygonati Rhizoma germplasm conservation: The genetic grouping clarifies priority populations (e.g., geographically distinct P. kingianum in Group 1, genetically unique Sichuan P. sibiricum in Group 3) for targeted in-situ protection, while the C78 collection enables streamlined ex-situ conservation and germplasm regeneration. Additionally, the 18 SSR markers and genetic grouping data provide technical support for future genetic improvement—facilitating selection of diverse parental materials (e.g., crossbreeding between Group 1 and Group 3 accessions) to develop high-quality Polygonatum varieties.
Future work will expand the P. zanlanscianense sample size to refine its phylogenetic placement in Group 2, and combine SSR data with medicinal component traits to accelerate marker-assisted breeding—ultimately advancing sustainable utilization of Polygonati Rhizoma germplasm resources.
Data availability statement
The datasets presented in this study can be found in online repositories. The names of the repository/repositories and accession number(s) can be found in the article/Supplementary Material.
Ethics statement
Polygonatum kingianum Coll. et Hemsl., Polygonatum sibiricum Red., Polygonatum cyrtonema Hua. and Polygonatum zanlanscianense Pamp. are not endangered in China, and no specific permission was required for the collection. All Polygonati Rhizoma in this study were collected in China with the permission. The study complied with relevant institutional, national, and international guidelines and legislation. The sample has been identified by Associate Professor Lin Sen as P. kingianum, P. sibiricum, P. cyrtonema and P. zanlanscianense, the samples have been preserved in the herbarium of Hubei University of Chinese Medicine (DHJ20231028-sl, HJ20231116-sl, DH20231116-sl and HB20231116-sl).
Author contributions
MZ: Writing – original draft, Conceptualization, Data curation, Formal Analysis, Investigation, Methodology, Visualization, Writing – review & editing. XZ: Conceptualization, Data curation, Formal Analysis, Investigation, Methodology, Visualization, Writing – original draft, Writing – review & editing. YZ: Investigation, Validation, Visualization, Writing – original draft. WL: Investigation, Validation, Writing – original draft. XW: Investigation, Validation, Writing – original draft. YM: Investigation, Writing – original draft. CH: Investigation, Writing – original draft. ZH: Funding acquisition, Resources, Supervision, Writing – original draft. LS: Conceptualization, Funding acquisition, Project administration, Resources, Supervision, Writing – review & editing.
Funding
The author(s) declare that financial support was received for the research and/or publication of this article. This study was funded by "National Natural Science Foundation of China Youth Fund Project (No. 31500260)".
Conflict of interest
The authors declare that the research was conducted in the absence of any commercial or financial relationships that could be construed as a potential conflict of interest.
Generative AI statement
The author(s) declare that no Generative AI was used in the creation of this manuscript.
Any alternative text (alt text) provided alongside figures in this article has been generated by Frontiers with the support of artificial intelligence and reasonable efforts have been made to ensure accuracy, including review by the authors wherever possible. If you identify any issues, please contact us.
Publisher’s note
All claims expressed in this article are solely those of the authors and do not necessarily represent those of their affiliated organizations, or those of the publisher, the editors and the reviewers. Any product that may be evaluated in this article, or claim that may be made by its manufacturer, is not guaranteed or endorsed by the publisher.
Supplementary material
The Supplementary Material for this article can be found online at: https://www.frontiersin.org/articles/10.3389/fpls.2025.1674396/full#supplementary-material
References
Agho, C. A., Śliwka, J., Nassar, H., Niinemets, Ü., and Runno-Paurson, E. (2024). Machine learning-based identification of mating type and metalaxyl response in Phytophthora infestans using SSR markers. Microorganisms 12, 982. doi: 10.3390/microorganisms12050982
Anoumaa, M., Yao, N. K., Kouam, E. B., Kanmegne, G., Machuka, E., Osama, S. K., et al. (2017). Genetic diversity and core collection for potato (Solanum tuberosum L.) cultivars from Cameroon as revealed by SSR markers. Am. J. Potato Res. 94, 449–463. doi: 10.1007/s12230-017-9584-2
Chen, H., Feng, S. S., Sun, Y. J., Hao, Z. Y., Feng, W. S., and Zheng, X. K. (2015). Advances in studies on chemical constituents of three medicinal plants from Polygonatum Mill. and their pharmacological activities. Chin. Tradit Herb Drugs 46, 2329–2338. doi: 10.7501/j.issn.0253-2670.2015.15.025
Chen, C. R., Li, X. L., Wang, Q. S., Luo, J., Ban, J. J., Zhou, J. J., et al. (2024). Analysis of SSR site characteristics of Polygonatum multiflorum based on full-length transcriptomics. Mol. Plant Breed, 1–15. doi: 10.7501/j.issn.0253-2670.2020.01.024
Chen, H., Qian, H. L., Xu, Z., Su, J. Y., Chen, X. L., and Ji, P. Z. (2022). SSR loci information analysis in Polygonatum kingianum transcriptome. Northern Hortic. 22), 104–109.
Cheng, W. J. (2012). The development of SSR markers from Polygonatum cyrtonema, and their application (Wuhu: Anhui Normal University).
Cheng, H. (2023). Investigation and quality evaluation of Polygonatum cyrtonema Hua germplasm resources in Anhui Province (Hefei: Anhui University of Chinese Medicine).
Cheng, Y. W., Liao, R. J., Ye, B. H., Song, Q. Y., Yang, Y., Li, N., et al. (2020). Analysis on SSR loci in transcriptome and development of molecular markers in Polygonatum cyrtonema. Chin. Tradit Herb Drugs 51, 182–189.
Feng, T. H., Jia, Q. J., Meng, X., Chen, X. L., Wang, F. F., Chai, W. G., et al. (2020). Evaluation of genetic diversity and construction of DNA fingerprinting in Polygonatum Mill. based on EST-SSR and SRAP molecular markers. 3 Biotech. 10, 322. doi: 10.1007/s13205-020-02316-z
Frankel, O. H. (1984) Genetic perspectives of germplasm conservation in Genetic manipulation: impact on man and societyEd. Arber, W. 161–170. (Cambridge University, Cambridge).
Frankel, O. H. and Brown, A. H. D. (1984). Current plant genetic resources—a critical appraisal (New Delhi, Bombay, Calcutta: Oxford & IBH Publishing).
Holland, M. M., Pack, E. D., and McElhoe, J. A. (2017). Evaluation of GeneMarker® HTS for improved alignment of mtDNA MPS data, haplotype determination, and heteroplasmy assessment. Forensic Sci. Int-Genet 28, 90–98. doi: 10.1016/j.fsigen.2017.01.016
Karbstein, K., Kösters, L., Hodač, L., Hofmann, M., Hörandl, E., Tomasello, S., et al. (2024). Species delimitation 4.0: integrative taxonomy meets artificial intelligence. Trends Ecol. Evol. 39, 771–784. doi: 10.1016/j.tree.2023.11.002
Koorevaar, T., Willemsen, J. H., Visser, R. G. F., Arens, P., and Maliepaard, C. (2024). Construction of a strawberry breeding core collection to capture and exploit genetic variation. BMC Genomics 24, 740. doi: 10.1186/s12864-023-09824-1
Letunic, I. and Bork, P. (2021). Interactive Tree of Life (iTOL) v5: an online tool for phylogenetic tree display and annotation. Nucleic Acids Res. 49, W293–W296. doi: 10.1093/nar/gkab301
Li, H. R., Zhou, C., Wei, W., He, F., Wang, Y. H., and Chen, F. J. (2024). The reproductive biology theory of sporogenesis and gametogenesis in Polygonatum zanlanscianense Pamp. Acta Bot. Boreali-Occident Sin. 44, 813–823. doi: 10.7606/j.issn.1000-4025.20230650
Liu, H., Cheng, H., Xu, J., Hu, J. Y., Zhao, C. C., Xing, L. H., et al. (2023). Genetic diversity and population structure of Polygonatum cyrtonema Hua in China using SSR markers. PloS One 18, e0290605. doi: 10.1371/journal.pone.0290605
Liu, R., Huang, Y. N., Yang, T., Hu, J. G., Zhang, H. Y., Ji, Y. S., et al. (2020). Population genetic structure and classification of cultivated and wild pea (Pisum sp.) based on morphological traits and SSR markers. J. Syst. Evol. 60, 85–100. doi: 10.1111/jse.12710
Liu, K. and Muse, S. V. (2005). PowerMarker: an integrated analysis environment for genetic marker analysis. Bioinformatics 21, 2128–2129. doi: 10.1093/bioinformatics/bti282
Ma, C. D., Chang, H., Yang, Y. C., Wang, E. H., and Zhan, Z. L. (2022). Herbal textual research on Polygonati Rhizoma in famous classical formulas. Chin. J. Exp. Tradit Med. Formul 28, 193–206. doi: 10.13422/j.cnki.syfjx.20211865
Mi, Q., Zhao, Y. L., Xu, P., Yu, M. W., Zhang, X., Tu, Z. H., et al. (2024). Full-length transcriptome sequencing and bioinformatics analysis of Polygonatum kingianum. Acta Pharm. Sin. 59, 1864–1872. doi: 10.16438/j.0513-4870.2023-1259
Niederer, D., Schiller, J., Groneberg, D. A., Behringer, M., Wolfarth, B., and Gabrys, L. (2024). Machine learning-based identification of determinants for rehabilitation success and future healthcare use prevention in patients with high-grade, chronic, nonspecific low back pain: an individual data 7-year follow-up analysis on 154,167 individuals. Pain 165, 772–784. doi: 10.1097/j.pain.0000000000003087
Ouyang, P., Kang, D. L., Mo, X. L., Tian, E. W., Hu, Y. Y., and Huang, R. S. (2018). Development and characterization of high-throughput EST-Based SSR markers for Pogostemon cablin using transcriptome sequencing. Molecules 23, 2014. doi: 10.3390/molecules23082014
Paradis, E. and Schliep, K. (2018). ape 5.0: An environment for modern phylogenetics and evolutionary analyses in R. Bioinformatics 35, 526–528. doi: 10.1093/bioinformatics/bty633
Peakall, R. and Smouse, P. E. (2012). GenAlEx 6.5: Genetic analysis in Excel. Population genetic software for teaching and research—an update. Bioinformatics 28, 2537–2539. doi: 10.1093/bioinformatics/bts460
Pharmacopoeia Committee (2025). Pharmacopoeia of the people's republic of China Vol. 1 (Beijing: China Medical Science and Technology Press), 328–329.
Qian, L. H., Yan, J. L., Wu, X. J., Ruan, S. L., Yin, S. Y., and Cui, H. R. (2023). Development of simple sequence repeat (SSR) markers based on transcriptome sequences of Polygonatum kingianum and their application in analysis of Polygonatum germplasm resources. Jiangsu J. Agric. Sci. 39, 1120–1131. doi: 10.3969/j.issn.1000-4440.2023.05.004
Song, G., Xia, J., and Xiao, Q. (2022). GC-MS analysis and antioxidant activities determination of volatile oil from leaves of Polygonatum zanlanscianense Pamp. J. Hubei Minzu Univ (Nat Sci. Ed) 40, 374–379+384. doi: 10.13501/j.cnki.42-1908/n.2022.12.003
Thakur, A. K., Singh, K. H., Singh, L., Nanjundan, J., Khan, Y. J., and Singh, D. (2017). SSR marker variations in Brassica species provide insight into the origin and evolution of Brassica amphidiploids. Hereditas 155, 6. doi: 10.1186/S41065-017-0041-5
Wang, Y., Dong, P., Jing, C. Z., Kang, J. H., Hu, Y. H., and Wang, Z. (2019). Analysis on composition of Polygonatum sibiricum polysaccharide and its anti-oxidant activity. Genomics Appl. Biol. 38, 2191–2199. doi: 10.13417/j.gab.038.002191
Wang, X., Liu, X. Q., Ko, Y. Z., Jin, X. L., Sun, J. H., Zhao, Z. Y., et al. (2020). Genetic diversity and phylogeography of the important medical herb, cultivated Huang-Lian populations, and the wild relatives Coptis species in China. Front. Genet. 11, 708. doi: 10.3389/fgene.2020.00708
Wang, Y. H., Sun, J. H., Zhao, Z. Y., Xu, C., Qiao, P., Wang, S., et al. (2022). Multiplexed massively parallel sequencing of plastomes provides insights into the genetic diversity, population structure, and phylogeography of wild and cultivated Coptis chinensis. Front. Plant Sci. 13, 923600. doi: 10.3389/fpls.2022.923600
Wang, S. Q., Wang, L. R., Liu, S., Niu, J. F., Feng, S. C., Liang, X. Y., et al. (2018). Construction of DNA fingerprint database based on SSR marker for Polygonatum varieties (Lines). Mol. Plant Breed 16, 1878–1887. doi: 10.13271/j.mpb.016.001878
Wu, F. C., Cai, G. J., Xi, P. Y., Guo, Y. L., Xu, M., and Li, A. D. (2024). Genetic diversity analysis and fingerprint construction for 87 passionfruit (Passiflora spp.) germplasm accessions on the basis of SSR fluorescence markers. Int. J. Mol. Sci. 25, 10815.
Yang, Q. W., Jiang, Y. J., Wang, Y. P., Han, R. L., Liang, Z. S., He, Q. L., et al. (2022). SSR loci analysis in transcriptome and molecular marker development in Polygonatum sibiricum. BioMed. Res. Int. 2022, 4237913. doi: 10.1155/2022/4237913
Yang, W. C., Yang, B. N., Lu, L. Y., Zhang, X. M., Sun, J., Wang, L. W., et al. (2024). Utilizing SSR-based core collection development to improve conservation and utilization of Corylus L. genetic resources. PloS One 19, e0312116. doi: 10.1371/journal.pone.0312116
Zhang, K., Zhang, Z., Fan, Y. F., and Zhang, B. G. (2022). Nutritional and bioactive components of Polygonati Rhizoma and Polygonati Odorati Rhizoma with medicinal and edible property. Mod Chin. Med. 24, 1463–1472. doi: 10.13313/j.issn.1673-4890.20211219001
Zheng, C. X., Jiang, Z. C., Meng, Y. S., Yu, J., Yang, X. S., Zhang, H., et al. (2023). Construction of a high-density SSR genetic linkage map and identification of QTL for storage-root yield and dry-matter content in sweetpotato. Crop J. 11, 963–967. doi: 10.1016/j.cj.2022.11.003
Zhou, Z. G., Gong, M. H., Wang, X. H., Zheng, X. Q., Liu, N., Li, D. H., et al. (2021). Research progress on pharmacological action and mechanism of Polygonatum sibiricum polysaccharide. J. Liaoning Univ Tradit Chin. Med. 23, 1–4. doi: 10.13194/j.issn.1673-842x.2021.12.001
Keywords: Polygonati Rhizoma, SSR fluorescent markers, genetic diversity, core collection, SSR markers
Citation: Zhu M, Zhu X, Zeng Y, Li W, Wen X, Mei Y, Huang C, Hu Z and Sen L (2025) Genetic diversity and core collection of Polygonati Rhizoma in China via SSR markers. Front. Plant Sci. 16:1674396. doi: 10.3389/fpls.2025.1674396
Received: 01 August 2025; Accepted: 14 October 2025;
Published: 06 November 2025.
Edited by:
Alejandra Moreno-Letelier, National Autonomous University of Mexico, MexicoReviewed by:
Mohan Lal, North East Institute of Science and Technology (CSIR), IndiaAnchal Rana, ICFAI University, Dehradun, India
Copyright © 2025 Zhu, Zhu, Zeng, Li, Wen, Mei, Huang, Hu and Sen. This is an open-access article distributed under the terms of the Creative Commons Attribution License (CC BY). The use, distribution or reproduction in other forums is permitted, provided the original author(s) and the copyright owner(s) are credited and that the original publication in this journal is cited, in accordance with accepted academic practice. No use, distribution or reproduction is permitted which does not comply with these terms.
*Correspondence: Lin Sen, MjM5MDExMjUwQHFxLmNvbQ== ; ZhiGang Hu, emdodTA2MDhAMTYzLmNvbQ==
†These authors have contributed equally to this work and share first authorship
‡ORCID: YuLing Zeng, orcid.org/0009-0001-2857-1353
Xuan Wen, orcid.org/0009-0009-1539-8852
ChuTong Huang, orcid.org/0009-0004-3259-2191