 Magdi A. A. Mousa
 Khalid A. Asiry
- Department of Agriculture, Faculty of Environment Sciences, King Abdulaziz University, Jeddah, Saudi Arabia
Water scarcity is a major constraint to agricultural productivity in arid and semi-arid regions, underscoring the need for crops with high water-use efficiency and resilience to drought. This study evaluated 21 quinoa (Chenopodium quinoa Willd.) accessions under three drip-irrigation regimes—W1 (15 min), W2 (10 min), and W3 (5 min)—applied twice daily in a split-plot design with three replications in the arid conditions of western Saudi Arabia. Significant effects of irrigation, genotype, and their interaction were detected for most phenological, morphological, physiological, and yield traits. Among the evaluated accessions, CHEN-195, CHEN-316, and CHEN-140 consistently outperformed others, producing the highest seed yields per plant (up to 13.58 g) and per hectare (2400.2 kg ha-1), with greater 1000-seed weight and stable chlorophyll a and b contents across growth stages. Principal component analysis explained 70.7 % of the total variation, identifying yield, plant height, and drought tolerance indices as the principal contributors to genotype differentiation. Heatmap clustering confirmed distinct performance groups, reinforcing the robustness of multivariate classification in discriminating drought-adapted genotypes. The combined results highlight considerable genetic variability in quinoa response to irrigation levels and identify promising accessions with superior adaptation and resource-use efficiency. Overall, this study supports the integration of quinoa into dryland farming systems and provides a foundation for breeding programs targeting enhanced drought tolerance and sustainable production under water-limited conditions.

Graphical Abstract.
Introduction
Globally, over 70% of total water resources are allocated to agricultural irrigation (Frimpong et al., 2023). Escalating freshwater scarcity necessitates the development of efficient, crop-specific irrigation strategies to enhance water-use efficiency and maintain agricultural productivity, especially in arid and semi-arid regions (Bazile et al., 2016). The combined effects of drought and rising temperatures represent major abiotic stressors, reducing plant morphological and physiological performance by lowering leaf water potential, sap flow, stomatal conductance, and xylem function, ultimately diminishing crop productivity (Bhusal et al., 2019; Marengo et al., 2021). The Middle East and North Africa (MENA) region, including Saudi Arabia, is among the most water-stressed areas globally. According to the World Bank, countries with annual renewable water resources below 1,700 m³ per capita are classified as water-stressed (Benlhabib et al., 2016; Nanduri et al., 2019; Al-Naggar et al., 2020; Hejazi et al., 2023). According to FAO data, per capita renewable water resources in MENA have declined extremely from about 1,752 m³ in 1970 to roughly 530 m³ by 2020 indicating that many countries in the region now fall well below the water-stress and scarcity thresholds (Lahham et al., 2022). Saudi Arabia receives only 50–150 mm of rainfall annually, with erratic precipitation patterns (Almazroui, 2020). In Saudi Arabia, agriculture accounts for approximately 78% of total national water demand (11.4 out of ~14.3 BCM/year in 2021), while irrigation efficiency remains low around 50% compared to global best practices of ~85% (Al-Zahrani and Khan, 2023). Although Saudi Arabia leads the world in seawater desalination, growing pressure on aquifers and limited natural recharge from rainfall continue to jeopardize long-term water security (Abdella et al., 2024). To address these constraints, the country has adopted policies to reduce water-intensive crop cultivation, improve irrigation technologies, and explore alternative cropping systems including halophyte farming (Multsch et al., 2017). One such promising halophytic crop is quinoa (Chenopodium quinoa Willd.), a highly adaptable pseudocereal originating from the Andean region. It thrives in marginal environments, tolerating drought, salinity, and frost (Alandia et al., 2020; González et al., 2021). Quinoa is a facultative halophyte with a C₃ photosynthetic pathway and has shown strong agronomic performance under a wide range of agroecological conditions (Afzal et al., 2022). Its grains are nutritionally rich, providing essential proteins, amino acids, fatty acids, vitamins, and minerals, making it valuable for food and nutritional security (Repo-Carrasco et al., 2003; Stikic et al., 2012). In addition, quinoa has been used as a food crop, forage, cover crop, and phytoremediation agent (Hinojosa et al., 2018). The life cycle of quinoa comprises both vegetative and reproductive stages influenced by photoperiod and temperature, contributing to its broad genetic diversity and adaptive capacity (Afzal et al., 2022; Alandia et al., 2021). Genotypes vary in flowering and maturity timing, ranging from 109 to 182 days (Hafeez et al., 2022). Under drought or rainfed conditions, quinoa exhibits various adaptive traits, such as increased root proliferation, reduced shoot biomass, early flowering, and stomatal closure, enabling survival under limited water availability (Jacobsen et al., 2009; Zurita Silva et al., 2015a; b; Choukr-Allah et al., 2016). Its antioxidant-rich profile, including flavonoids and anthocyanins, provides added protection against abiotic stresses (Saad-Allah and Youssef, 2018; Wang et al., 2020; Razzaghi et al., 2020). Antioxidants help drought tolerance by scavenging reactive oxygen species (ROS) that accumulate under water deficit, thereby protecting cellular structures such as membranes, proteins, and DNA from oxidative damage. Additionally, they stabilize photosynthetic pigments and maintain enzyme activities, supporting continued growth and metabolic function under stress conditions (Dabravolski et al., 2023). Recent advancements in quinoa phenotyping and digital agriculture have enhanced our understanding of its stress response. UAV-based approaches, such as those using SPAD-derived chlorophyll indices and machine learning, have proven effective for large-scale diversity evaluations (Jiang et al., 2021). Standardized phenotyping protocols have also been established to ensure data comparability and reproducibility across research sites and environments (Stanschewski et al., 2021; Alghanem et al., 2021). These innovations are particularly valuable for screening accessions for drought tolerance traits under field conditions. In Saudi Arabia, quinoa is increasingly regarded as a viable crop for ensuring food and water security. Its high tolerance to salinity and arid climates aligns well with the Kingdom’s strategy to diversify cropping systems and improve sustainability in agriculture (Alrwis et al., 2021; Shams, 2022). Field trials and research initiatives have demonstrated quinoa’s strong adaptability and yield potential under Saudi conditions, particularly when grown with efficient irrigation management (Hinojosa et al., 2019; El-Harty et al., 2021). In this context, quinoa (Chenopodium quinoa Willd.) has emerged as a resilient crop with considerable potential for cultivation under arid and semi-arid environments due to its tolerance to drought and salinity. However, genotype × environment interactions remain poorly understood, particularly under the specific water-limited conditions of the western region of Saudi Arabia, where agricultural productivity is increasingly constrained by declining water resources. Therefore, this study aimed to evaluate the agronomic performance, yield stability, and physiological responses of diverse quinoa accessions under contrasting irrigation regimes. By linking global concerns of water scarcity with localized field evaluation, this research provides insights into the potential of quinoa as a strategic crop to enhance food security in water-scarce regions.
Materials and methods
Investigation site
This study was conducted at the Agricultural Research Station of King Abdulaziz University in Hada Al-Sham, situated in the western region of Saudi Arabia (21.7961° N, 39.7256° E). The site experiences an arid climate, characterized by low and highly variable annual rainfall (ranging from 50 to 100 mm), elevated temperatures, and sandy-loam soil with limited water-holding capacity and low organic matter. The soil pH measured 7.8, and electrical conductivity (EC) was 1.79 dS/m, indicating moderately saline conditions. Detailed soil characteristics are presented in Table 1. These environmental features are typical of dryland farming systems across the Arabian Peninsula (Odokonyero et al., 2024), making the site ideal for evaluating crop responses under water-limited conditions.
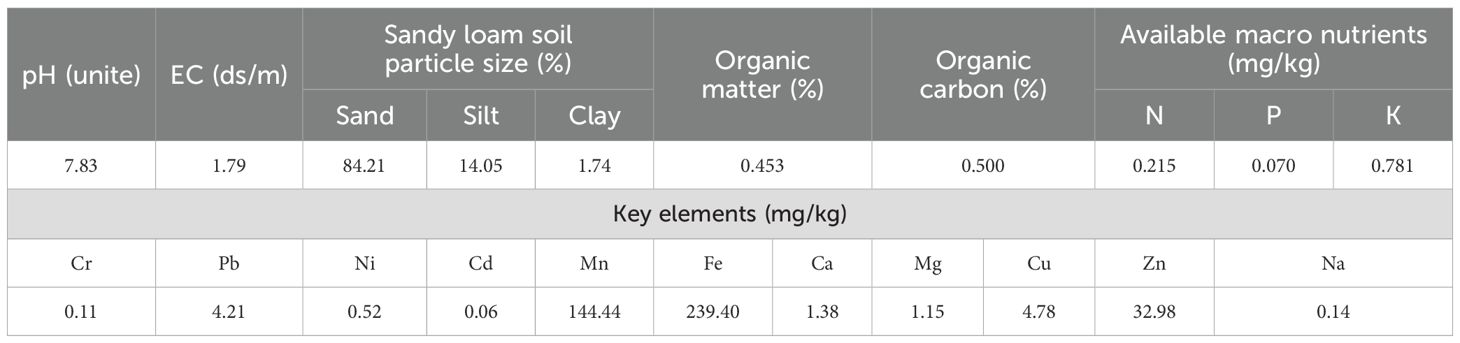
Table 1. Soil physical and chemical properties of the KAU Agriculture Research Station at Hada Al Sham, Al-Jamoom, Saudi Arabia.
Plant materials
A total of 21 quinoa (Chenopodium quinoa Willd.) accessions were evaluated in this study. The accessions were generously provided by Prof. Mark Tester from King Abdullah University of Science and Technology (KAUST). The accessions were sourced from international and regional germplasm collections, including varieties adapted to a wide range of environments. These genotypes represent a diverse range of geographical origins and genetic backgrounds, and they differ in morphological traits such as panicle color and growth habit. This genetic diversity offered a robust framework for assessing performance under contrasting irrigation regimes. Detailed descriptions of the accessions, including their origins and panicle coloration, are listed in Table 2 (Jiang et al., 2022).
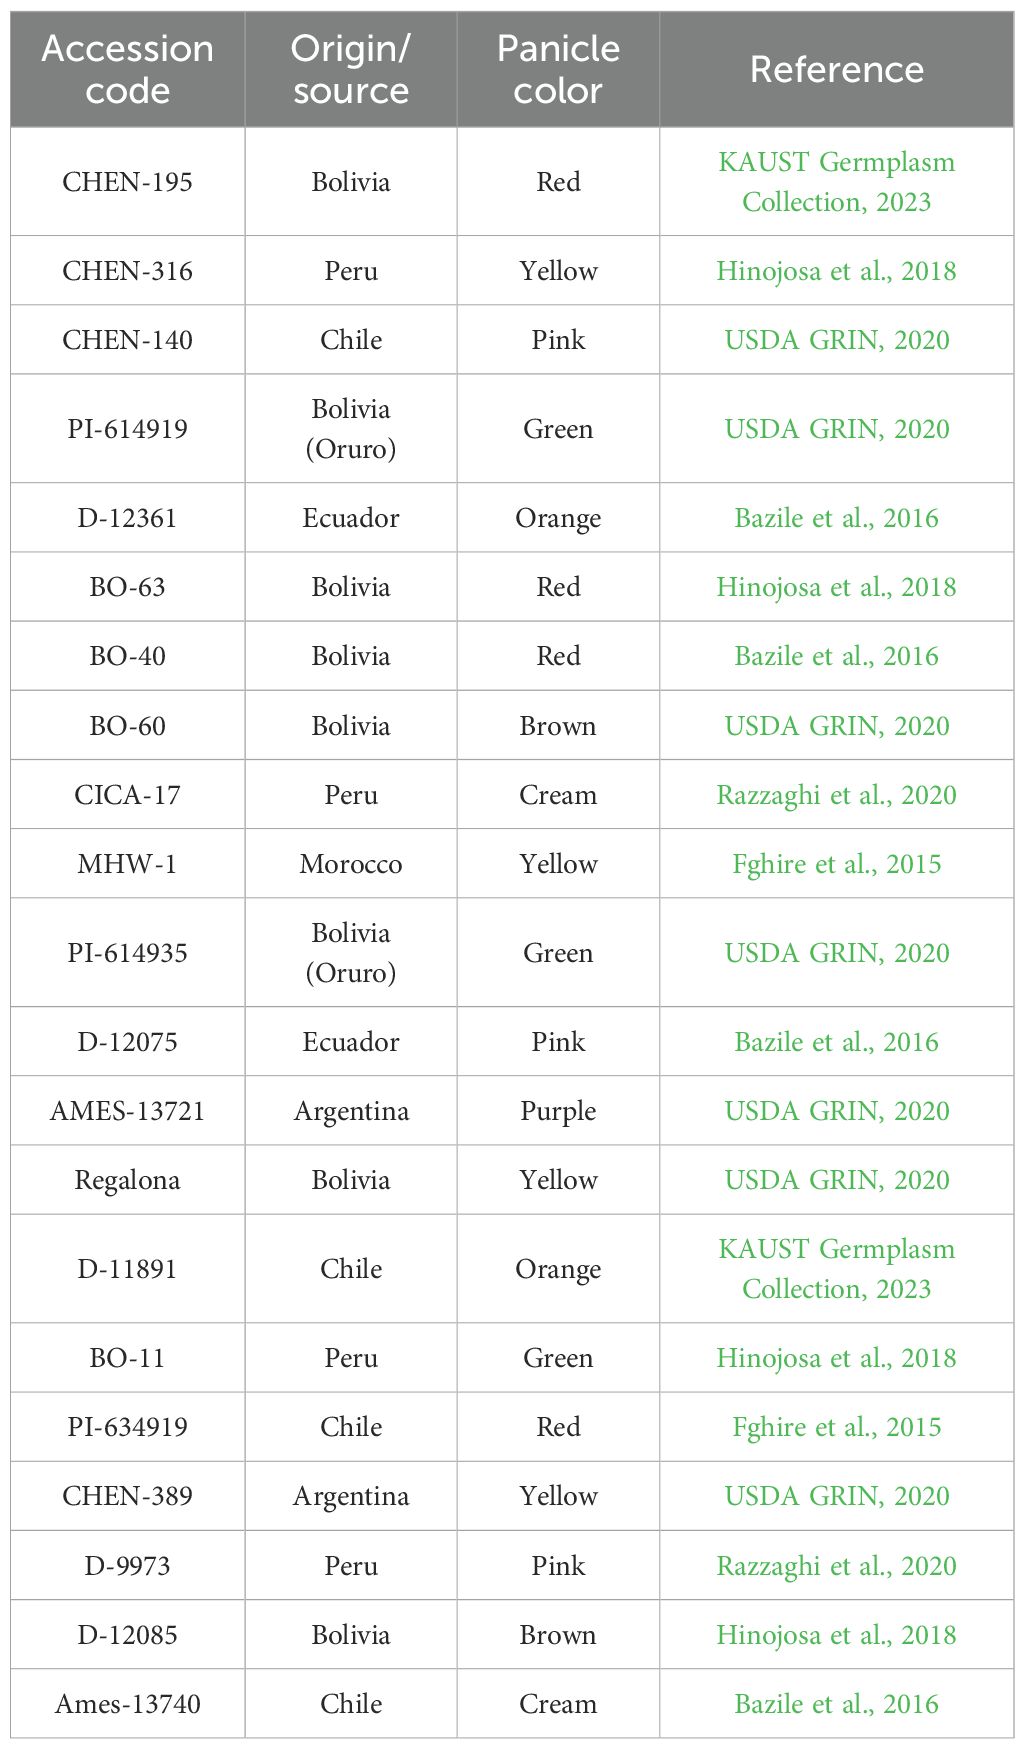
Table 2. Origin, source, and panicle color of the quinoa (Chenopodium quinoa Willd.) accessions evaluated under different irrigation regimes in arid conditions.
Experimental design and layout
The experiment followed a split-plot design with three replications. The main plots were assigned to three irrigation regimes, and the sub-plots to the 21 quinoa accessions, which were randomly arranged within each replication. Each subplot measured 1 m × 1 m, with rows spaced 30 cm apart and 10 cm between planting hills. Each hill was initially seeded with four seeds, and thinning was performed 15 days after sowing to retain one healthy plant per hill, ensuring uniform plant density across treatments. The three irrigation regimes were designed to simulate different levels of water availability: W1, 15 minutes twice daily (full irrigation, ~24 L/m2/day); W2, 10 minutes twice daily (moderate irrigation, ~16 L/m2/day); and W3, 5 minutes twice daily (deficit irrigation, ~8 L/m2/day). Irrigation treatments began after thinning and were maintained consistently throughout the growth cycle. All plots received standardized agronomic management, including fertilization, weeding, and pest control, based on quinoa production guidelines (Taaime et al., 2023).
Plant growth conditions and data collection
To ensure consistent water application, a pressure-compensated drip irrigation system (Rain Bird LD-06-12-1000) was installed. This system delivered water at a rate of 4 L/h per emitter, with emitters spaced 30 cm apart along the laterals and the drip lines spaced at 25cm. Irrigation was applied twice daily, at 7:00 AM and 5:00 PM, in accordance with the treatment durations. Fertigation was applied weekly via the same system, using a balanced N:P:K fertilizer (20:20:20) during the vegetative stage, and a reproductive-stage formula (10:10:40) during flowering and seed development. This helped ensure uniform nutrient availability across treatments. A wide range of plant parameters were measured: Phenological traits: Days to 50% flowering and Days to seed set; Growth and yield-related traits (at harvest): Plant height (cm), Shoot dry weight (g), Root dry weight (g), Panicle dry weight (g), Seed yield per plant (g), Estimated seed yield per hectare (kg ha-1) and 1000-seed weight (g); Physiological traits (measured using samples of 5 representative plants/subplot): Chlorophyll a and b contents (mg/100 g fresh weight) were measured at 30, 60, and 90 days after sowing. SPAD readings were taken from the uppermost fully expanded leaves of each plant. Pigments were extracted using 80% acetone and quantified spectrophotometrically following the method of Lichtenthaler and Wellburn (1983); Stress tolerance indices: Yield Tolerance Index (YTI) and Drought Tolerance Index (DTI). These indexes were calculated based on yield performance under stress and non-stress conditions, following the approach of Fernandez (1992).
Data analysis
All recorded data were analyzed using a split-plot analysis of variance (ANOVA) to account for the experimental design. Irrigation regimes were considered as the main plot factor, while genotypes were assigned to subplots, with replicates treated as random effects. Mean comparisons were performed using the least significant difference (LSD) test at the 5% probability level (P < 0.05). Statistical analyses were conducted using SAS software (version 9.4, SAS Institute Inc., Cary, NC, USA). To further explore trait associations and genotype performance: Principal Component Analysis (PCA) was conducted to identify the major traits contributing to variability across genotypes and treatments. PCA biplots were generated using the FactoMineR and factoextra packages in R (Husson et al., 2017). A hierarchical clustered heatmap was created to visualize phenotypic groupings among the quinoa accessions. Standardized trait values were used, and clustering was based on Euclidean distance and Ward’s linkage method, implemented via the heatmap package in R. These multivariate analyses helped distinguish high-performing genotypes and traits associated with drought resilience and productivity under arid conditions.
Results and discussion
This study evaluated the performance of 21 quinoa accessions under three water regimes: W1 (15 min twice/day), W2 (10 min twice/day), and W3 (5 min twice/day) in arid conditions typical of Saudi Arabia. The following discussion presents a detailed and integrated interpretation of morphological and yield traits, focusing on genotype–irrigation interactions and highlighting traits that contribute to quinoa resilience and
Days to 50% flowering
Days to 50% flowering was significantly influenced by both genotype and irrigation regime (Table 3), although their interaction was not significant, indicating consistent genotypic behavior across water treatments. Mean flowering time was delayed with increased irrigation: W1 (15 min twice/day) recorded the latest flowering (42.41 days), followed by W2 (38.21 days), while the earliest occurred under W3 (32.35 days). Genotypes ‘Regalona’ and ‘CICA-17’ exhibited the longest flowering duration, while ‘CHEN-140’, ‘CHEN-195’, and ‘CHEN-316’ flowered earliest, suggesting potential drought escape ability. The absence of a significant interaction suggests that flowering time is largely under genetic control, and thus stable across environments. These results support prior work by Peterson and Murphy (2015) and Bazile et al. (2016), which found that high soil moisture prolongs vegetative stages and delays reproductive development.
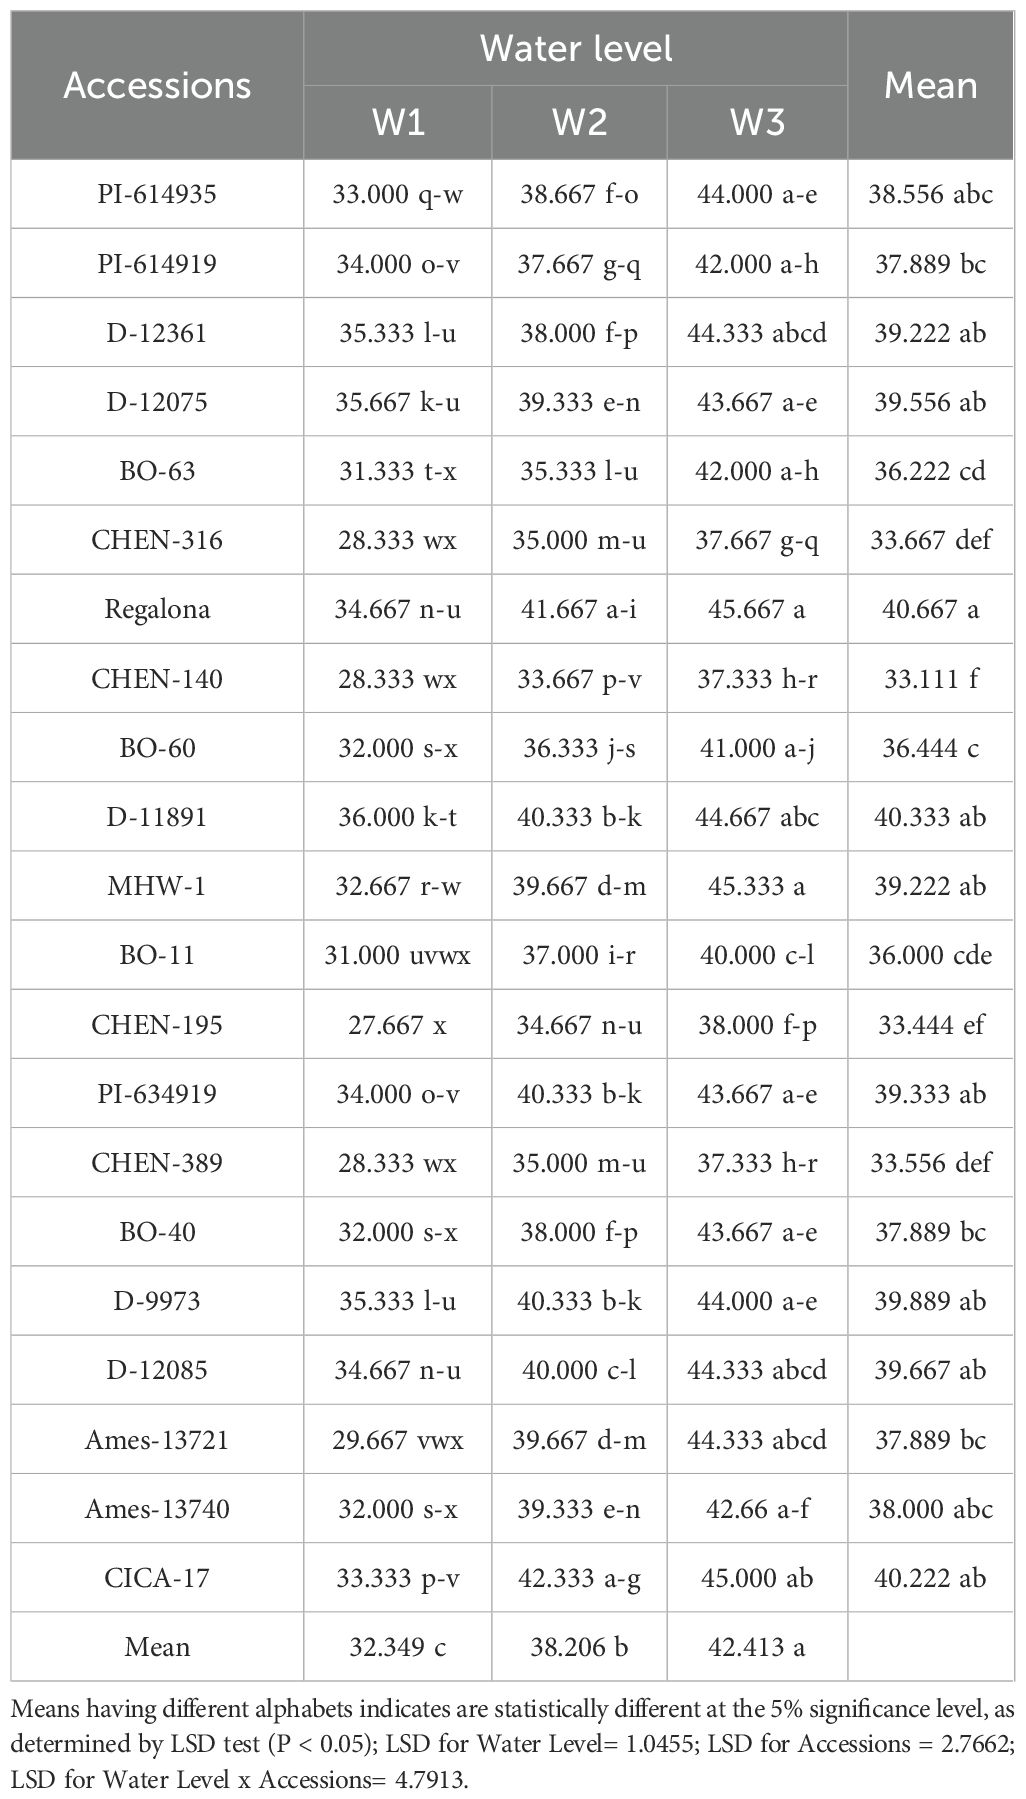
Table 3. Days to 50% flowering of 21 quinoa accessions under different irrigation regimes in arid conditions.
Days to seed set
Significant variation in days to seed set was observed across genotypes, irrigation levels, and their interaction. Early seed set was favored under reduced irrigation (W3), while prolonged durations were associated with W1. ‘CHEN-140’ showed the shortest seed set interval, especially under W3, while ‘Regalona’ exhibited the longest duration (Table 4). The mean days to seed set followed the trend W1 > W2 > W3, emphasizing the role of water availability in prolonging vegetative phases. The significant interaction between genotype and irrigation highlights differential adaptive strategies, where early seed setting genotypes may exhibit drought escape potential (Table 4). These findings align with reports by Adams et al. (2020) and Jacobsen et al. (2003) on phenological plasticity in quinoa.
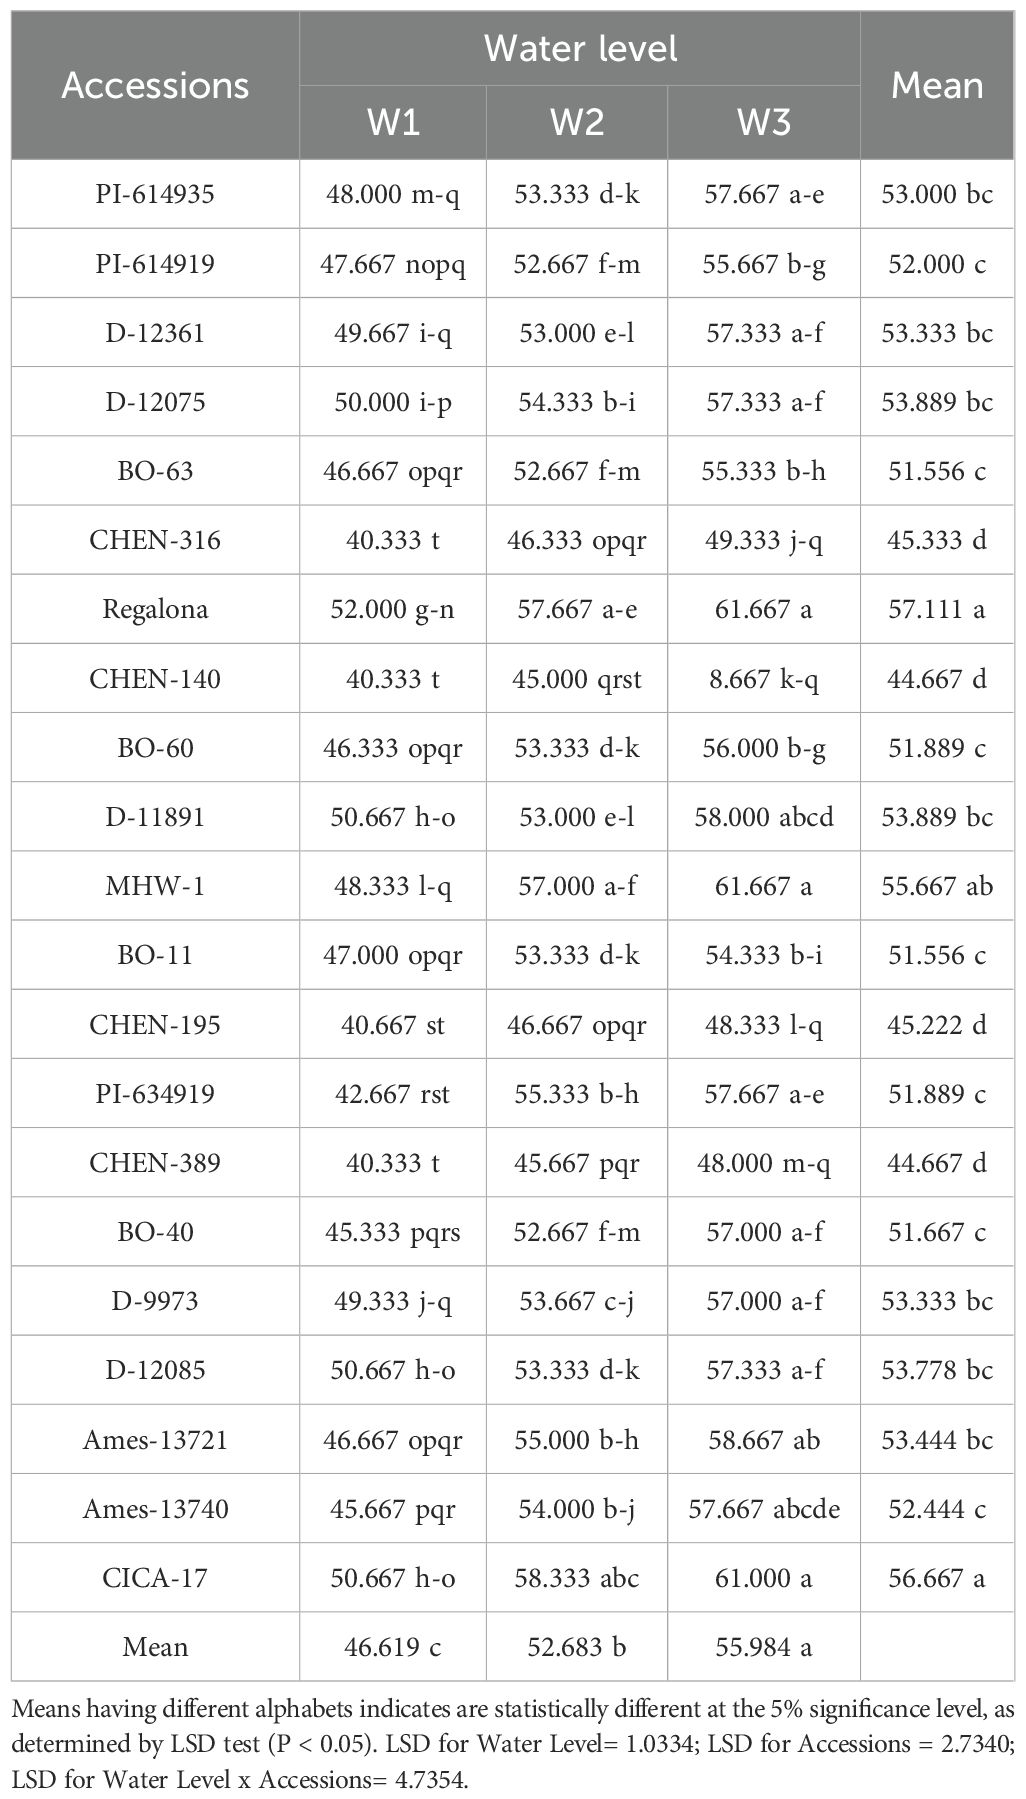
Table 4. Days to seed set of 21 quinoa accessions under different irrigation regimes in arid conditions.
Plant height (cm)
Plant height varied significantly among irrigation regimes, genotypes, and their interaction. The tallest plants were observed under W1, with ‘CHEN-140’, ‘CHEN-316’, and ‘CHEN-195’ attaining heights above 115 cm. The shortest plant height was recorded in ‘AMES-13721’ under W3 (63. 25 cm), suggesting strong negative effects of water stress on vegetative growth. Overall, mean plant height declined from W1 (99. 91 cm) to W3 (79.48 cm), underscoring the importance of sufficient irrigation for optimal height development (Table 3). Genotype × irrigation interaction showed that accessions like ‘CHEN-140’ and ‘CHEN-316’ responded particularly well to increased water, suggesting suitability for irrigated environments (Table 5). These trends corroborate the results of AbdElgalil et al. (2023) and Razzaghi et al. (2020), who found that plant height in quinoa is sensitive to water deficits and serves as an indicator of drought stress response. (Table 5)
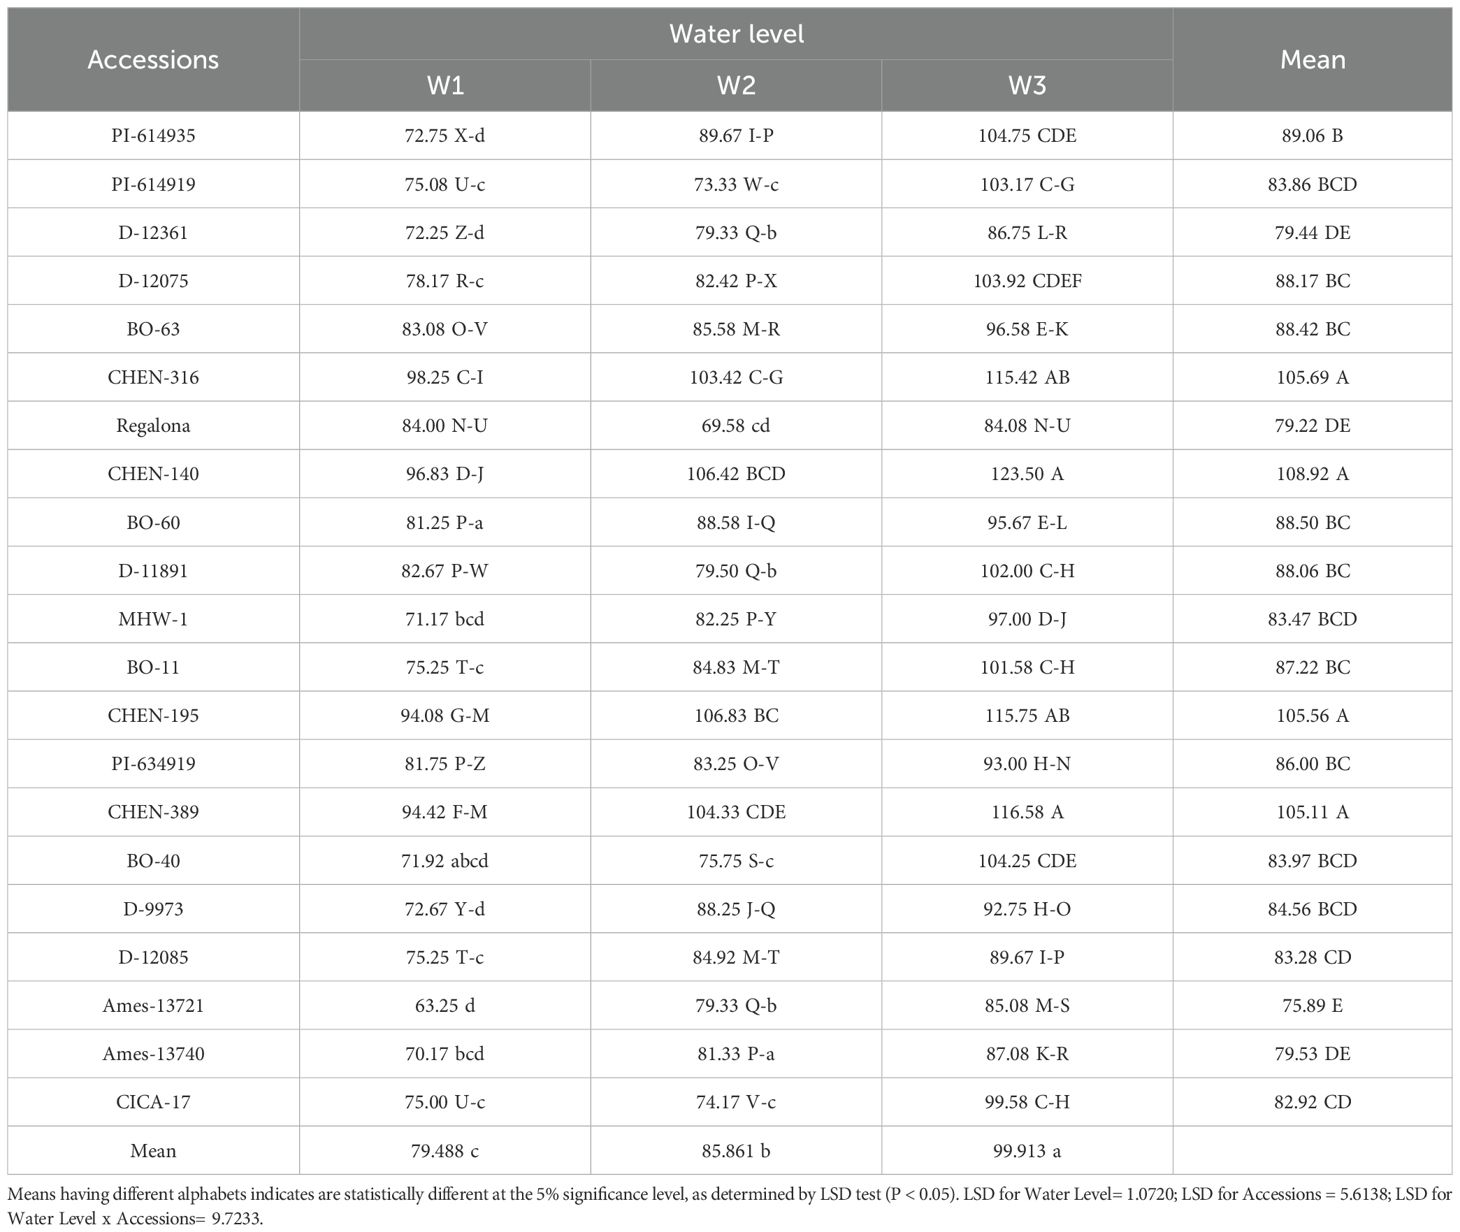
Table 5. Plant height (cm) of 21 quinoa accessions under different Irrigation Regimes in arid conditions.
Shoot, panicle, and root dry weight (g)
Shoot, panicle, and root dry weights were all significantly influenced by irrigation regime, genotype, and their interaction (Tables 6, 7, 8). Across traits, the general trend was W1 > W2 > W3, reflecting the positive effect of higher water availability on biomass accumulation. However, notable genotypic differences emerged. Accessions ‘CHEN-140’ and ‘CHEN-316’ consistently recorded the highest shoot (89.67 and 88.67 g, respectively) and panicle dry weights (>47 g) under W1, indicating superior vegetative vigor and reproductive investment under optimal irrigation. In contrast, ‘AMES-13721’ and ‘PI-614919’ were among the lowest performers under W3 across all three biomass traits. Root biomass also followed the same irrigation trend, with ‘CHEN-316’ and ‘CHEN-140’ producing the highest values under W1, while maintaining relatively higher root dry weight under W3. This suggests deeper or more efficient root systems, a trait associated with drought resilience (Geerts et al., 2008). The consistency of CHEN accessions in maintaining superior shoot, panicle, and root dry weights under stress aligns with previous findings (Razzaghi et al., 2020; Bazile et al., 2016), highlighting their adaptability and potential as parents in breeding for drought-prone environments.
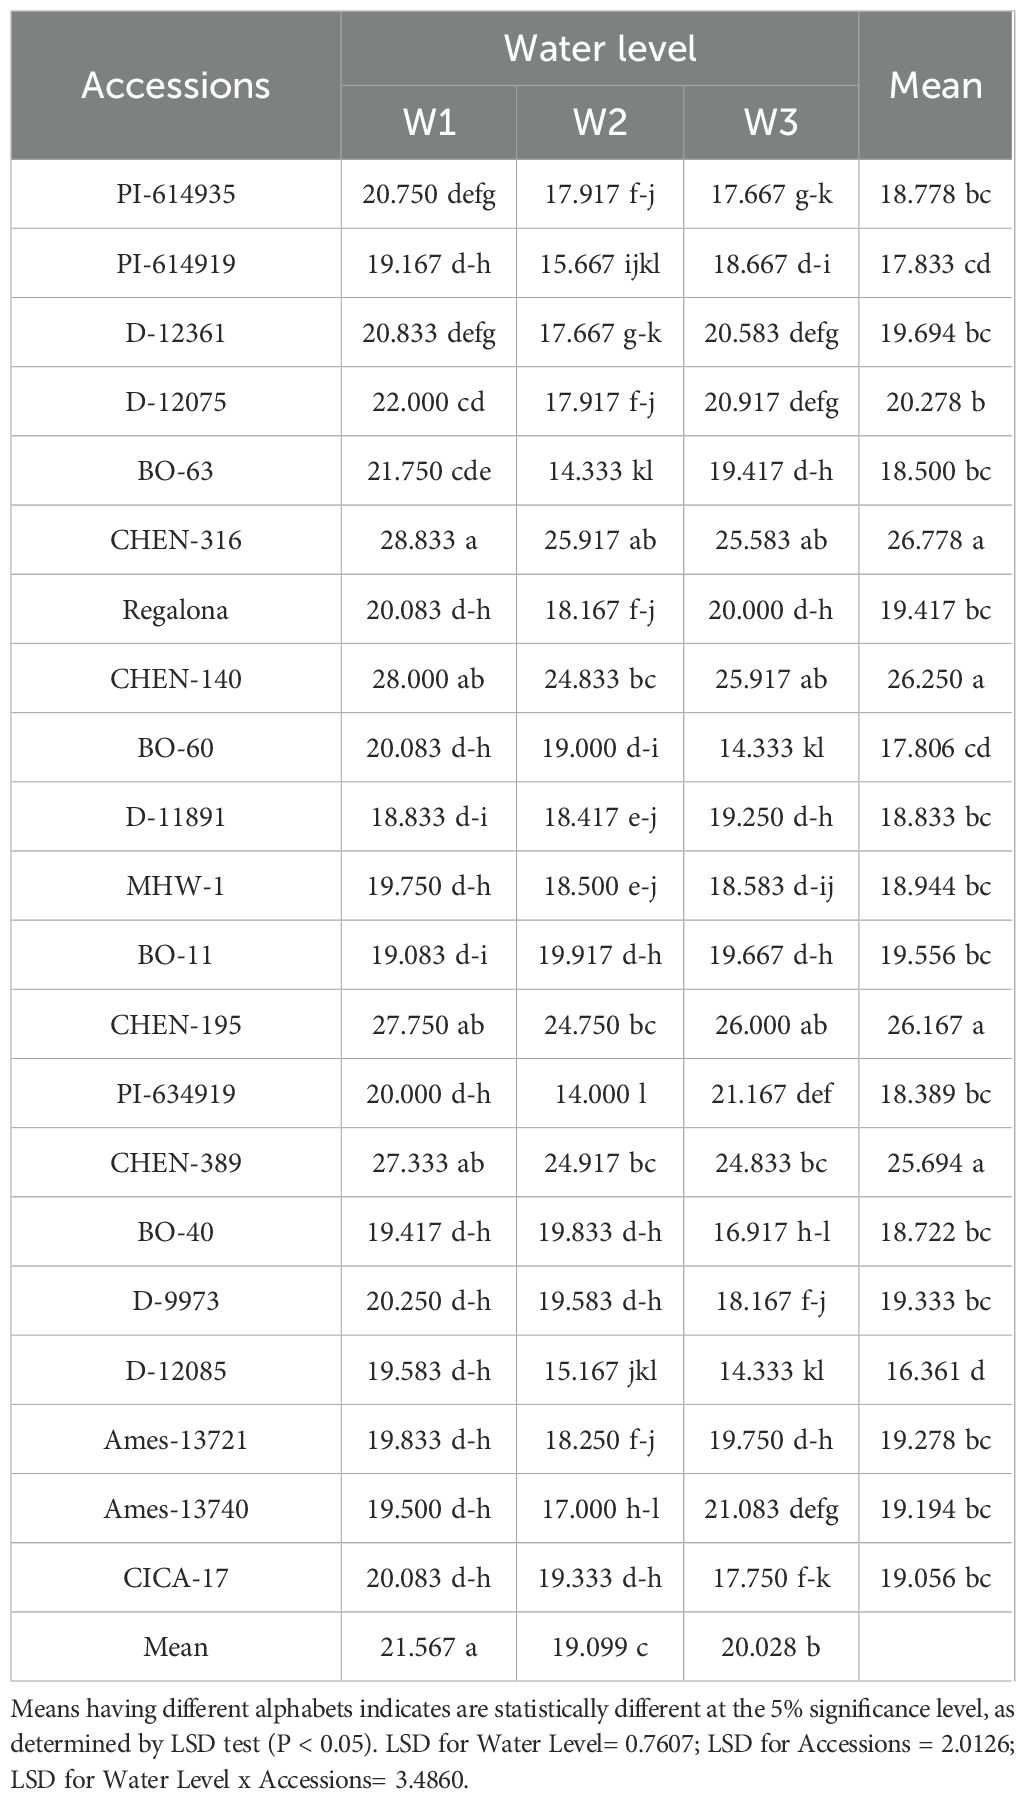
Table 6. Root dry weight (g) of 21 quinoa accessions under different irrigation regimes in arid conditions.

Table 7. Panicle dry weight (g) of 21 quinoa accessions under different irrigation regimes in arid conditions.
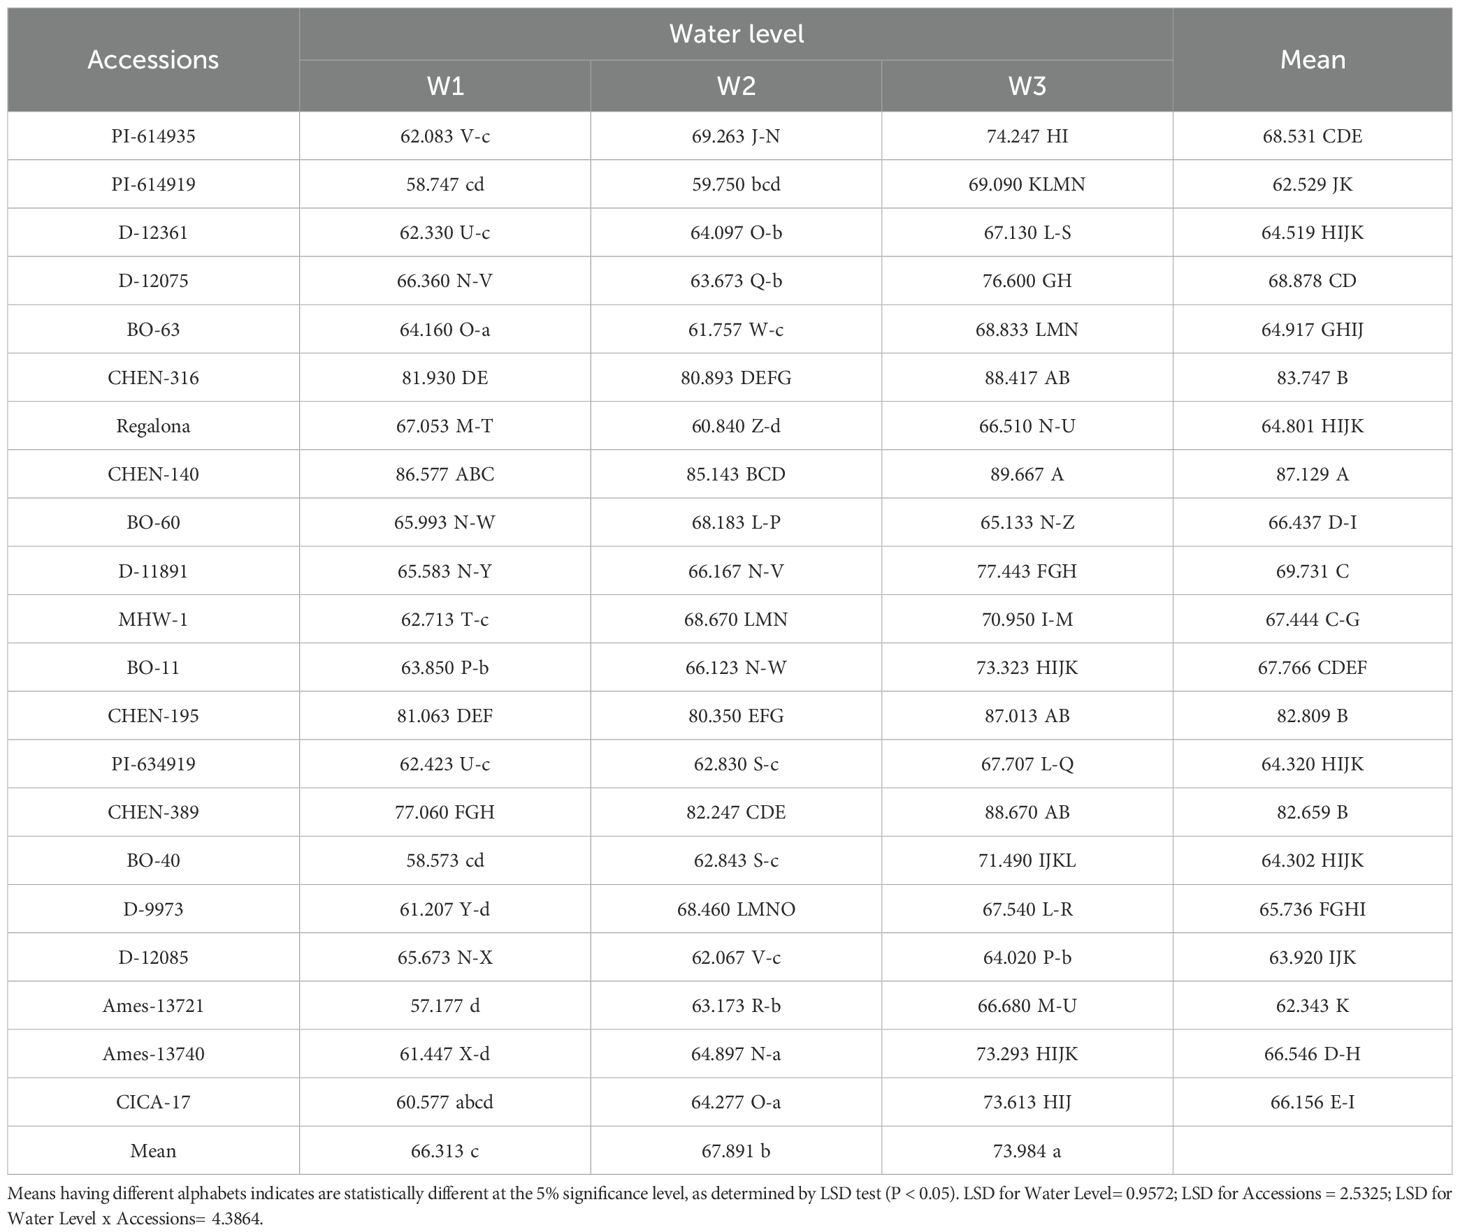
Table 8. Shoot dry weight (g) of 21 quinoa accessions under different irrigation regimes in arid conditions (Table 5).
Seed yield/plant (g)
Seed yield per plant integrates vegetative growth, assimilate partitioning, and reproductive efficiency, serving as a key indicator of genotype performance under arid conditions. Irrigation regime, genotype, and their interaction significantly influenced yield per plant (Table 9). The highest mean yield per plant was recorded under W3 (5 min twice daily; 8.60 g), followed by W2 (7.73 g), while W1 (15 min twice daily; 6.54 g) produced the lowest yield. This pattern suggests that water stress may have reduced intra-plant competition for assimilates and enhanced reproductive efficiency by prioritizing resource allocation to fewer but more productive reproductive structures. Similar responses have been reported in quinoa and other crops, where drought stress often reduces vegetative expansion while stabilizing or even increasing per-plant reproductive efficiency (Razzaghi et al., 2020; Ruiz et al., 2023). Genotypic variation was pronounced. Accessions such as ‘CHEN-195’ (13.58 g), ‘CHEN-316’ (11.87 g), and ‘CHEN-140’ demonstrated superior yield stability across water regimes. These accessions may combine traits such as efficient stomatal regulation, high water-use efficiency, and effective carbon remobilization to reproductive sinks, which are crucial for sustaining productivity under stress (AbdElgalil et al., 2023; Fghire et al., 2015). Conversely, low-yielding accessions like ‘D-12361’ (4.59 g) and ‘PI-614919’ (4.65 g) likely suffer from shallow root systems, poor reproductive allocation, or inefficient stress-response mechanisms, making them unsuitable for arid cultivation. The higher yield per plant under W3 also highlights quinoa’s phenotypic plasticity. Under restricted irrigation, reduced plant density or tiller abortion may have lowered competition for soil resources, thereby increasing the assimilate supply per surviving plant. This mechanism has been previously described as a drought escape or compensation strategy in quinoa and cereals grown in water-limited regions (Mirsafi et al., 2024). Collectively, these results suggest that selecting genotypes with stable reproductive efficiency under stress (e.g., ‘CHEN-195’, ‘CHEN-316’, and ‘CHEN-140’) is essential for sustainable quinoa cultivation in arid zones.
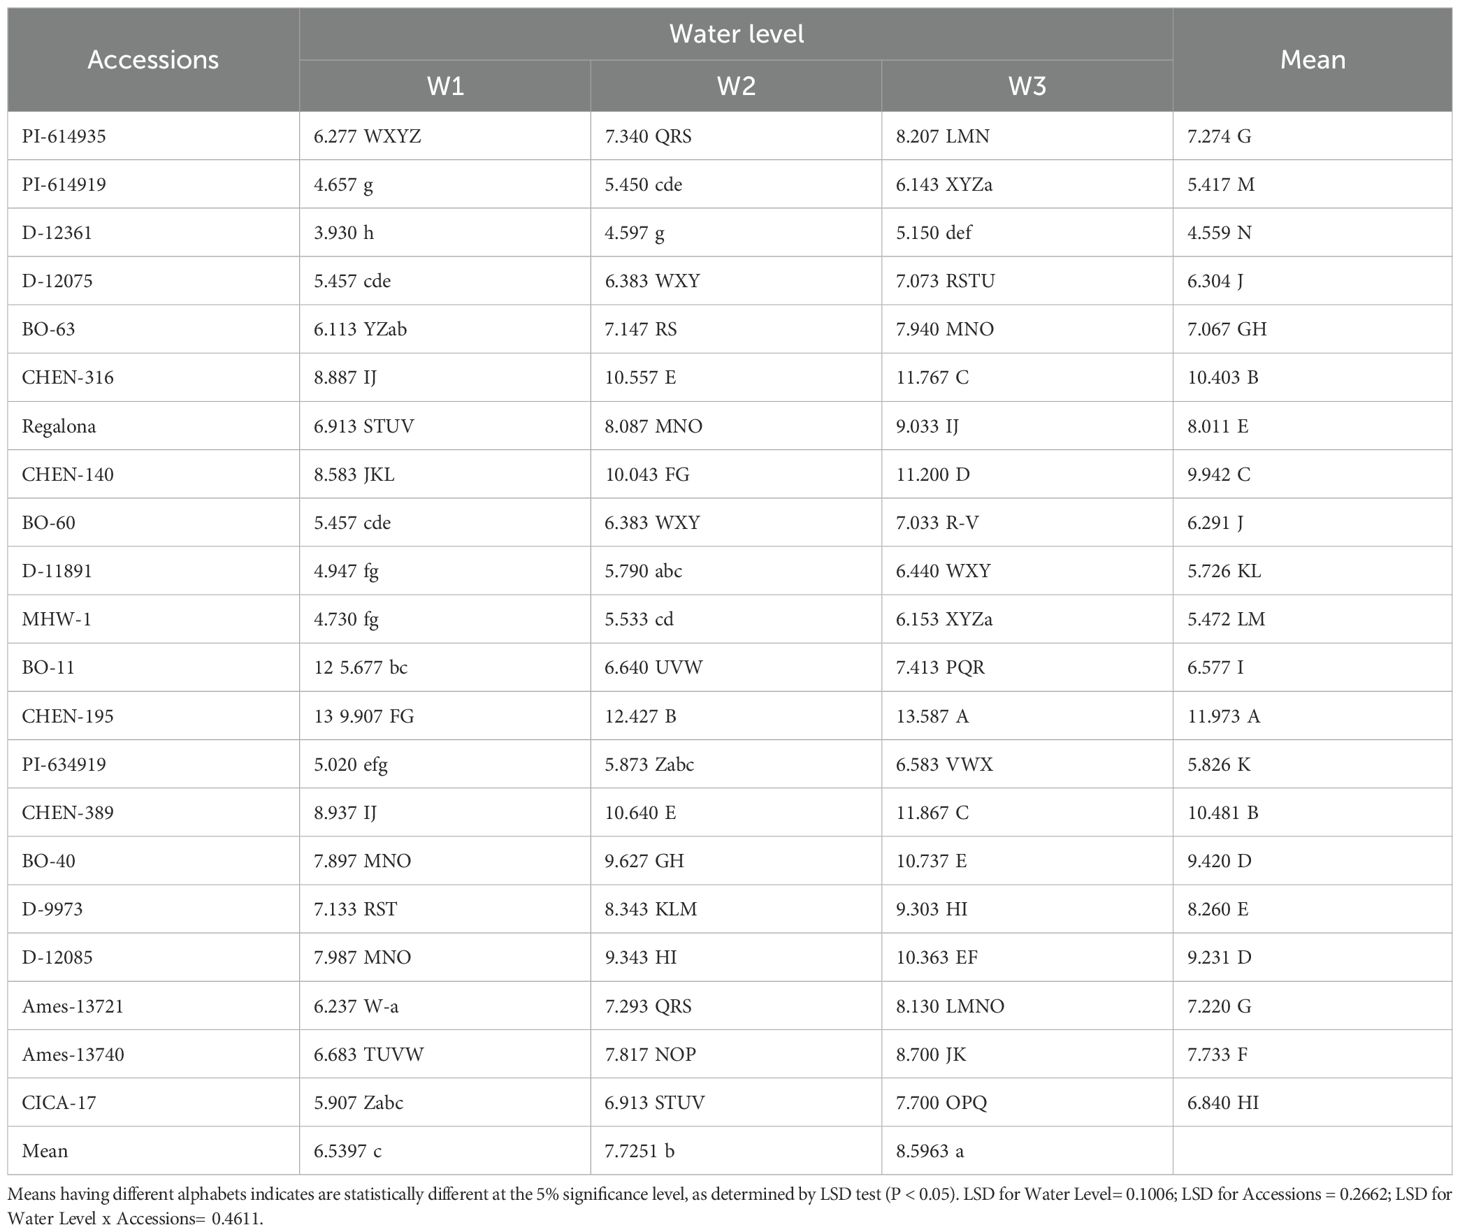
Table 9. Seed yield/plant(g) of 21 quinoa accessions under different irrigation regimes in arid conditions.
Seed yield (kg ha-1)
Grain yield per hectare reflects the integration of plant-level performance, stand density, and agronomic stability, making it the most relevant trait for field-scale productivity assessments. In this study, irrigation and genotype had significant effects on grain yield per hectare, while their interaction was not significant (Table 10). The overall trend mirrored the per-plant results: W3 produced the highest average yield (1810.7 kg ha-1), followed by W2 (1553.6 kg ha-1), and W1 (1193.1 kg ha-1) produced the lowest yield. The superior performance under W3 reflects quinoa’s ability to optimize water use efficiency under limited water supply. Reduced irrigation may have suppressed excessive vegetative growth and competition, enabling greater partitioning of assimilates to reproductive tissues and maintaining yield at the population level (Razzaghi et al., 2020; Hafeez et al., 2022). Moreover, stress-induced enhancement of root depth and osmotic adjustment could have improved water acquisition and carbon assimilation efficiency, mechanisms often associated with quinoa’s adaptation to drought (Hinojosa et al., 2018). Among accessions, the highest yields were achieved by ‘CHEN-195’ (2400.2 kg ha-1), ‘CHEN-316’ (2299.2 kg ha-1), and ‘CHEN-140’ (2284.1 kg ha-1), confirming their strong adaptive potential. These accessions likely combine high reproductive resilience with efficient physiological responses such as chlorophyll stability and high harvest index under drought, as previously emphasized in quinoa improvement studies (Stanschewski et al., 2021; Alghamdi et al., 2018). In contrast, the poorest performers, ‘D-12361’ (931.3 kg ha-1) and ‘MHW-1’ (1040.8 kg ha-1), underline the importance of selecting stress-tolerant accessions when targeting production in arid and semi-arid regions. Interestingly, the absence of a significant genotype × irrigation interaction suggests that most accessions followed a similar response pattern, although the magnitude of yield varied. This implies that general adaptation mechanisms to water stress were consistent across genotypes, but only the top performers could fully exploit these mechanisms to sustain high yields. Similar trends have been reported in quinoa and other pseudocereals under arid conditions, where genotype ranking tends to remain stable across irrigation treatments (Bazile et al., 2016; Frimpong et al., 2023; Ruiz et al., 2023). Taken together, the results demonstrate that quinoa can sustain both per-plant and population-level productivity under restricted irrigation, with some genotypes even performing better under moderate to severe water stress. This highlights its potential as a resilient crop for sustainable intensification in water-scarce environments.
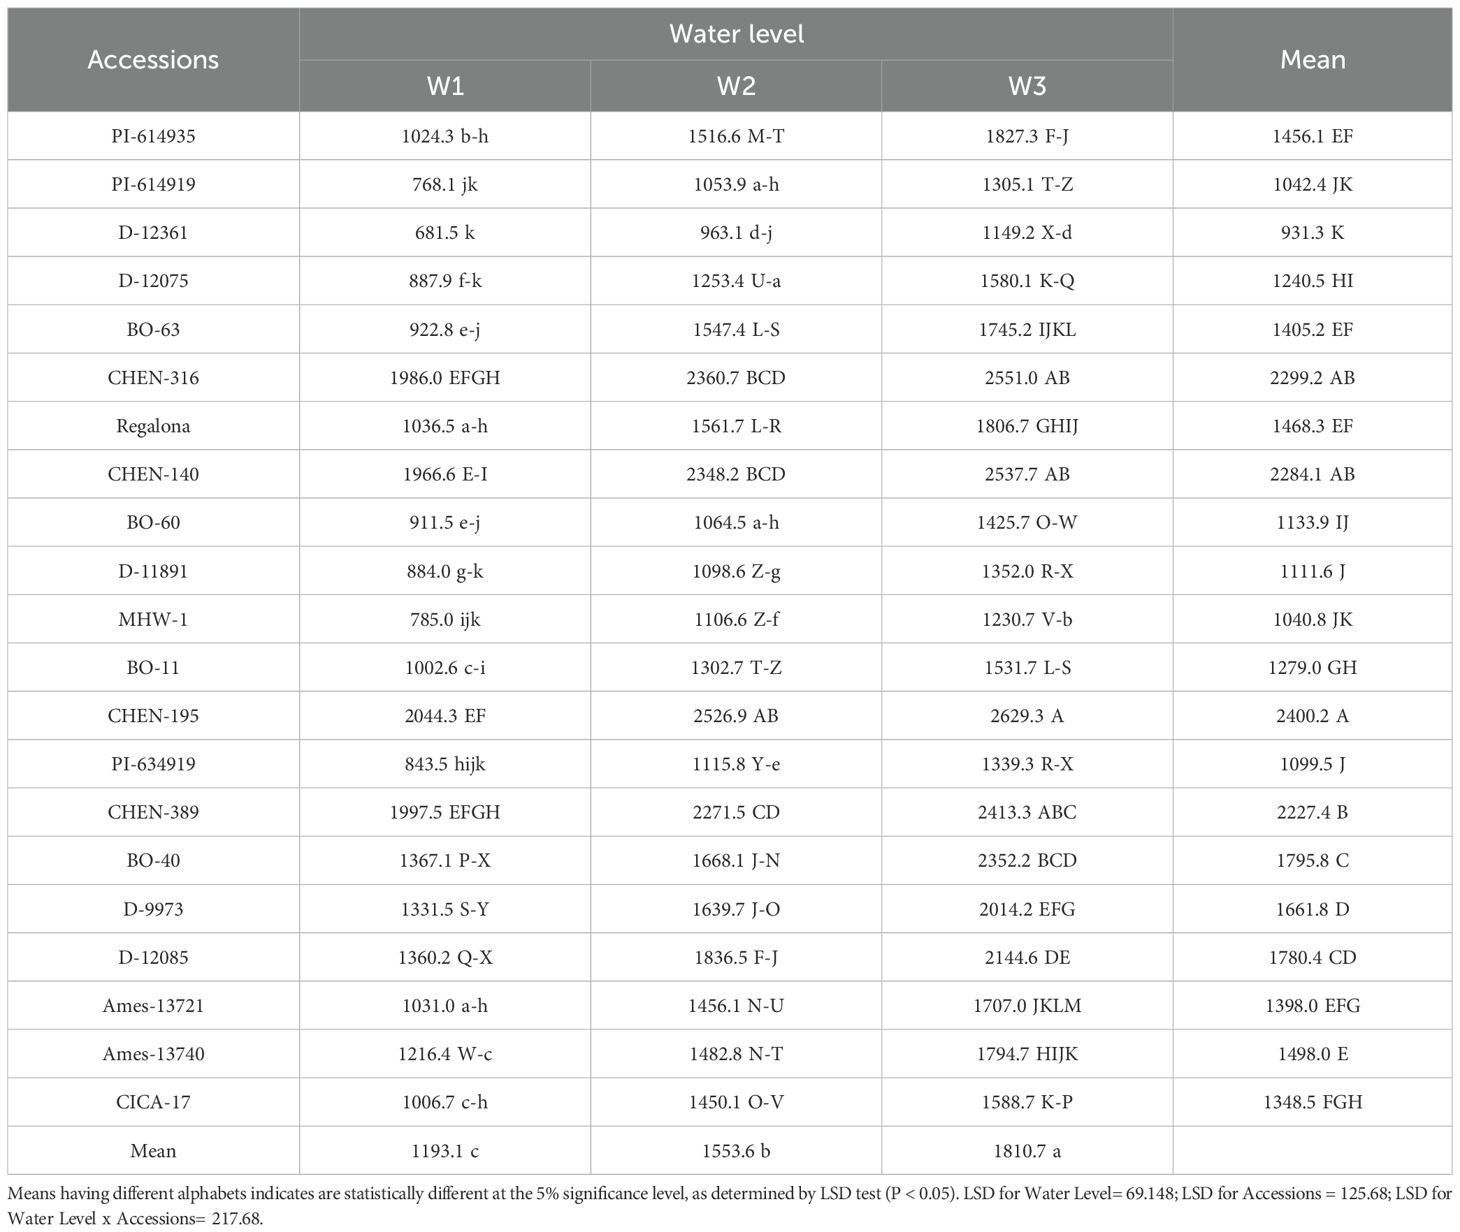
Table 10. Seed yield (kg ha-1) of 21 quinoa accessions under different irrigation regimes in arid conditions.
Reduction (%) in seed yield (kg ha-1)
The percentage reduction in seed yield per hectare varied significantly across genotypes, irrigation regimes, and their interaction. As the interaction was significant, only genotype × irrigation combinations are reported. Under severe water stress (W3: 5 minutes twice daily), the highest yield reductions were observed in ‘BO-63’ (–89.1%), followed by ‘PI-614935’ (–78.4%), ‘D-12075’ (–78.0%), and ‘Regalona’ (–74.3%), indicating high sensitivity to drought. Other accessions, such as ‘BO-40’ (–72.1%) and ‘PI-614919’ (–69.9%), also experienced substantial declines under W3 (Table 11 and Table 12). In contrast, accessions including ‘CHEN-316’ (–28.5%), ‘CHEN-140’ (–29.0%), and ‘CHEN-195’ (–28.6%) exhibited the smallest yield penalties, demonstrating superior drought tolerance. At the moderate irrigation level (W2: 10 minutes twice daily), yield reductions were smaller but still varied among genotypes. The most tolerant accessions were ‘CHEN-316’ (–18.9%), ‘CHEN-140’ (–19.4%), and ‘CHEN-316_2’ (–13.7%), whereas the most sensitive were ‘BO-63’ (–67.7%), ‘Regalona’ (–50.7%), and ‘PI-614935’ (–48.1%). Overall, the mean reduction across accessions was –36.6% under W2 and –58.5% under W3, confirming the wide range of adaptive responses among quinoa genotypes (Table 13). These results align with previous findings that drought stress significantly limits quinoa yield, especially in less-adapted genotypes (Bazile et al., 2016; Hinojosa et al., 2018; Razzaghi et al., 2020). Genotypes showing lower yield reductions under W2 and W3, such as ‘CHEN-316’ and ‘CHEN-195’, are promising candidates for cultivation in arid regions where efficient irrigation management is critical (Stanschewski et al., 2021; Hafeez et al., 2022).
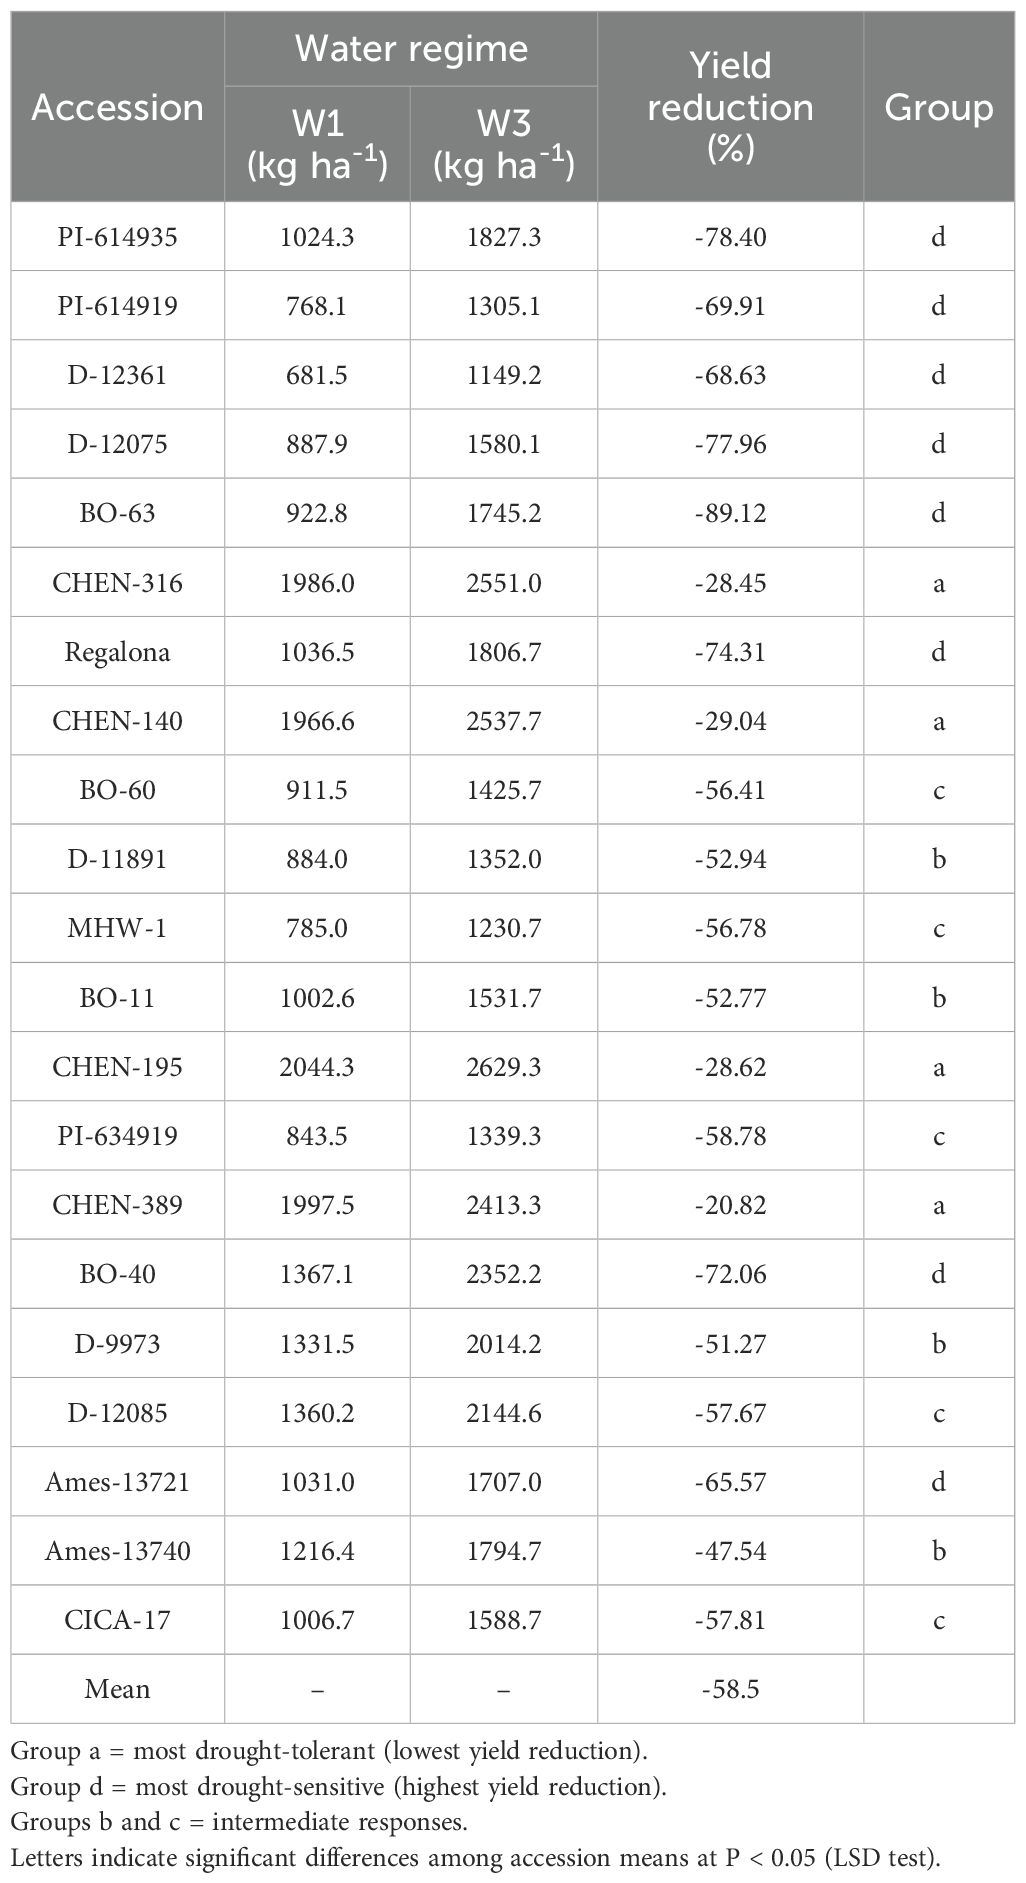
Table 11. Percentage change in seed yield (kg ha-1) of 21 quinoa accessions between W1 (full irrigation, 15 min twice daily) and W3 (severe deficit, 5 min twice daily).
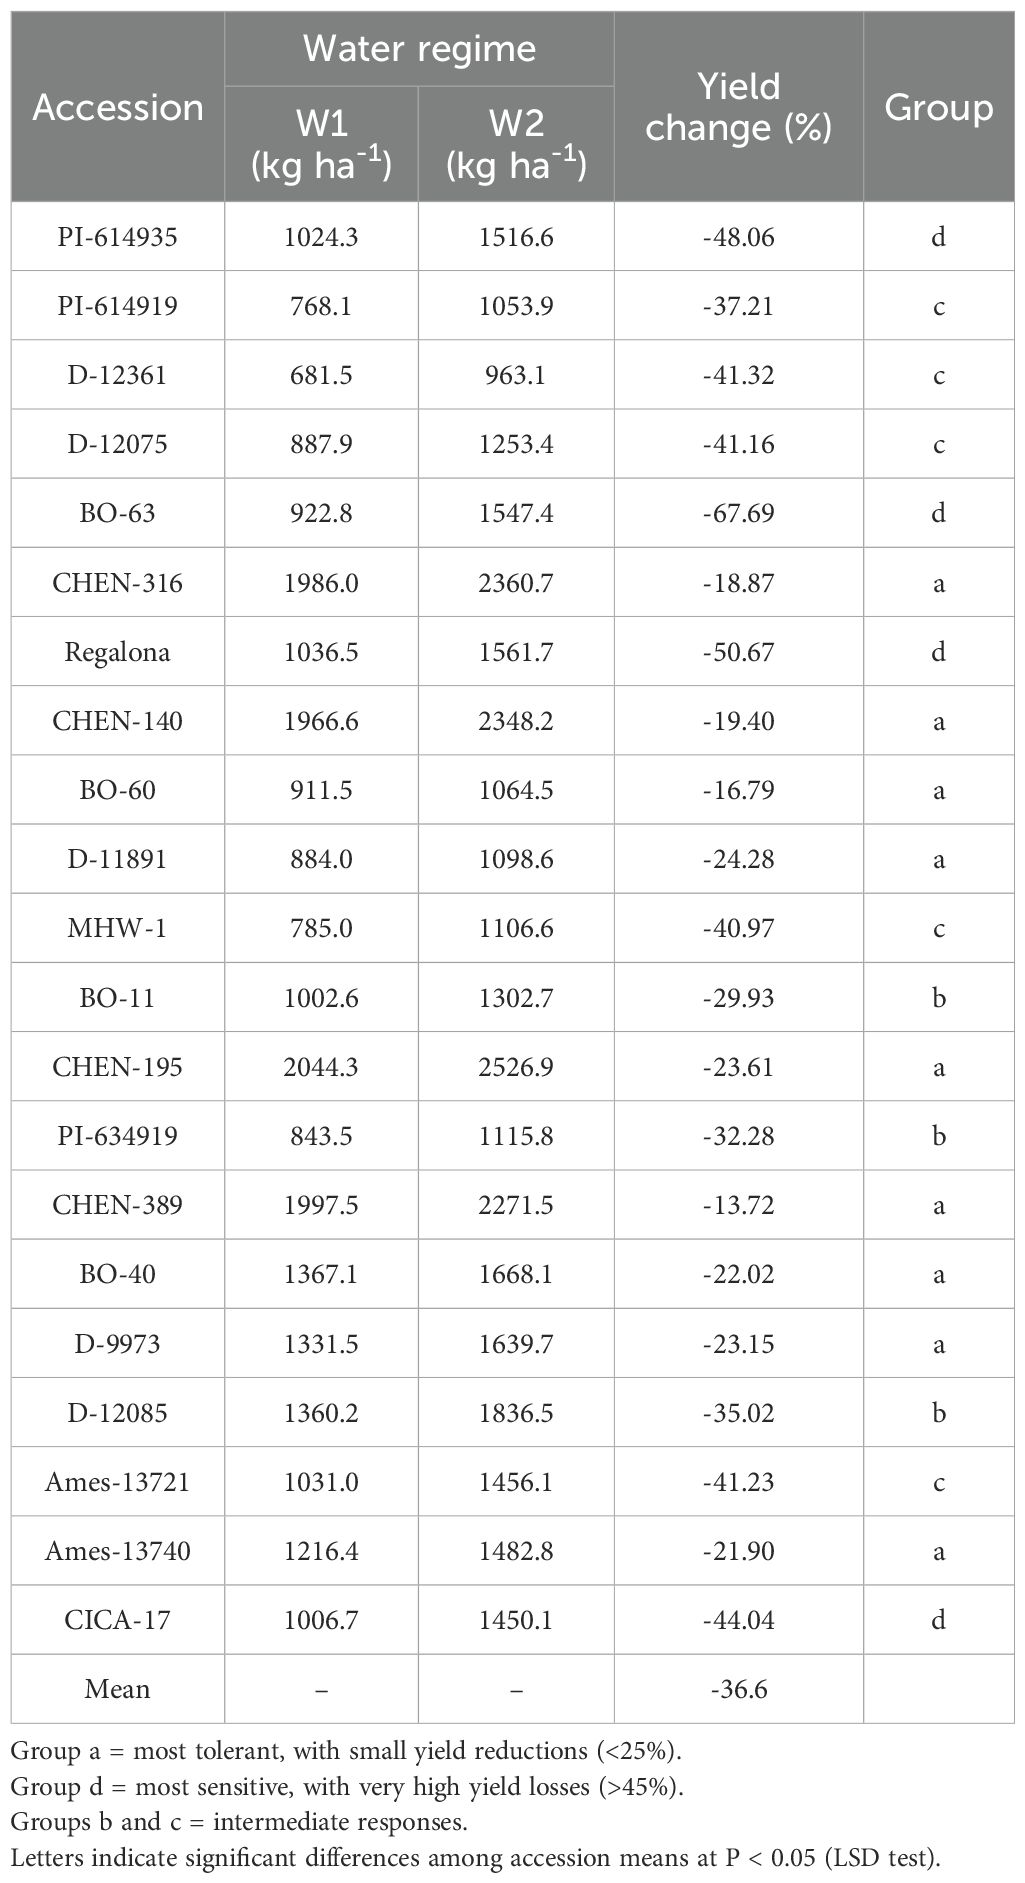
Table 12. Percentage change in seed yield (kg ha-1) of 21 quinoa accessions between W1 (full irrigation, 15 min twice daily) and W2 (moderate deficit, 10 min twice daily).
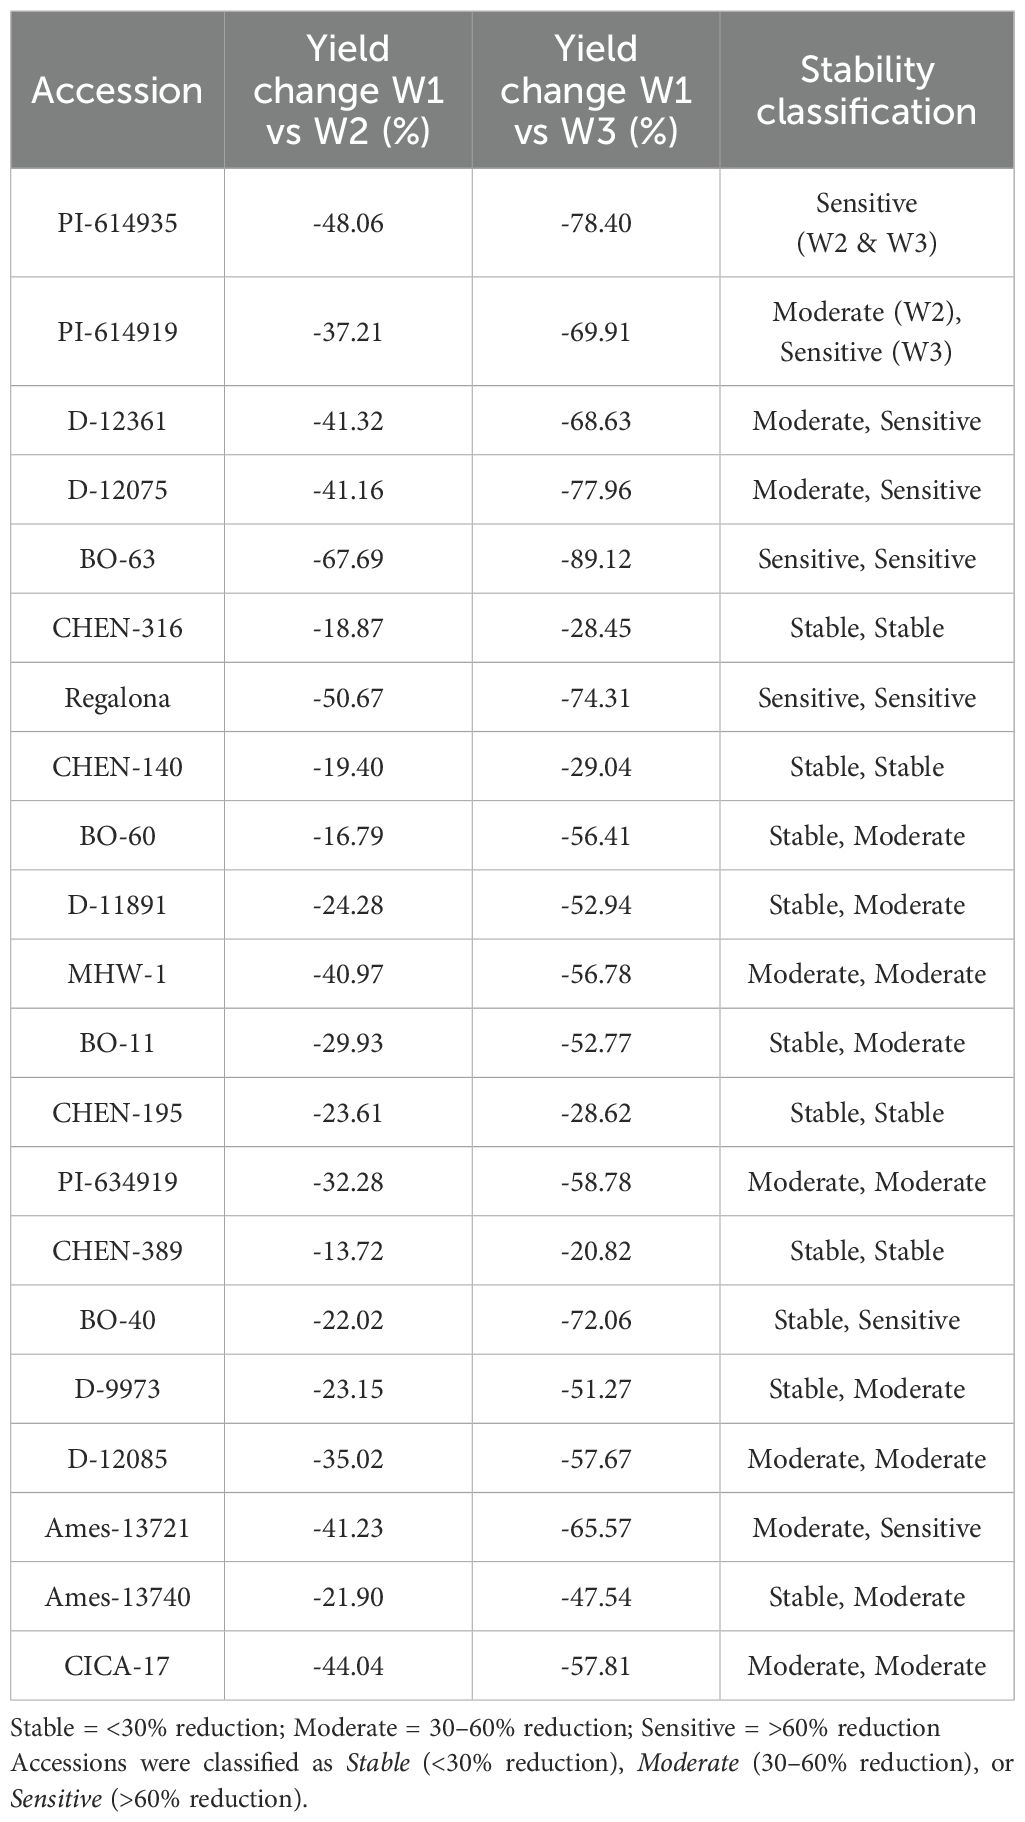
Table 13. Comparative percentage change in seed yield (kg ha-1) of 21 quinoa accessions between W1 (full irrigation, 15 min twice daily) and W2 (moderate deficit, 10 min twice daily), and between W1 and W3 (severe deficit, 5 min twice daily), under arid conditions.
Yield tolerance index
The Yield Tolerance Index (YTI) reflects a genotype’s ability to maintain grain yield under water-deficit conditions relative to well-watered control, thereby indicating its drought tolerance capacity. YTI differed significantly among quinoa accessions, irrigation treatments, and their interaction, highlighting the contrasting abilities of genotypes to withstand varying levels of water availability. As the interaction effect was significant, only genotype × irrigation combinations are discussed. The highest YTI values were observed under W1 (15 minutes twice daily), where ‘CHEN-140’ exhibited the maximum index (1.124), followed closely by ‘CHEN-195’ (1.063) and ‘CHEN-316’ (1.058). These accessions showed superior drought recovery and resilience under moderate stress conditions, suggesting their capacity to maintain yield stability and physiological function in water-limited environments (Table 14). On the other hand, the lowest average YTI values were associated with ‘BO-60’ and ‘D-12361’, both of which recorded less than 0.45, indicating their greater susceptibility to drought. Across all genotypes, W3 (5 minutes twice daily) produced a YTI of 0.00, reflecting complete failure to sustain yield under severe water limitation. This finding aligns with previous studies indicating that prolonged and severe drought imposes significant constraints on quinoa growth and yield performance (Razzaghi et al., 2020; Hinojosa et al., 2018). In contrast, intermediate irrigation (W2; 10 minutes twice daily) resulted in the highest mean YTI (0.8547), revealing its optimal balance between water use and yield protection, consistent with observations by Alghamdi et al. (2018) and Hafeez et al. (2022). The marked variation in tolerance index among the accessions underlines the role of genotype selection in improving drought resilience. Accessions like ‘CHEN-140’, ‘CHEN-316’, and ‘CHEN-195’ demonstrated high plasticity and efficient resource utilization under water-limited regimes, in line with findings from Bazile et al. (2016) and Stanschewski et al. (2021).
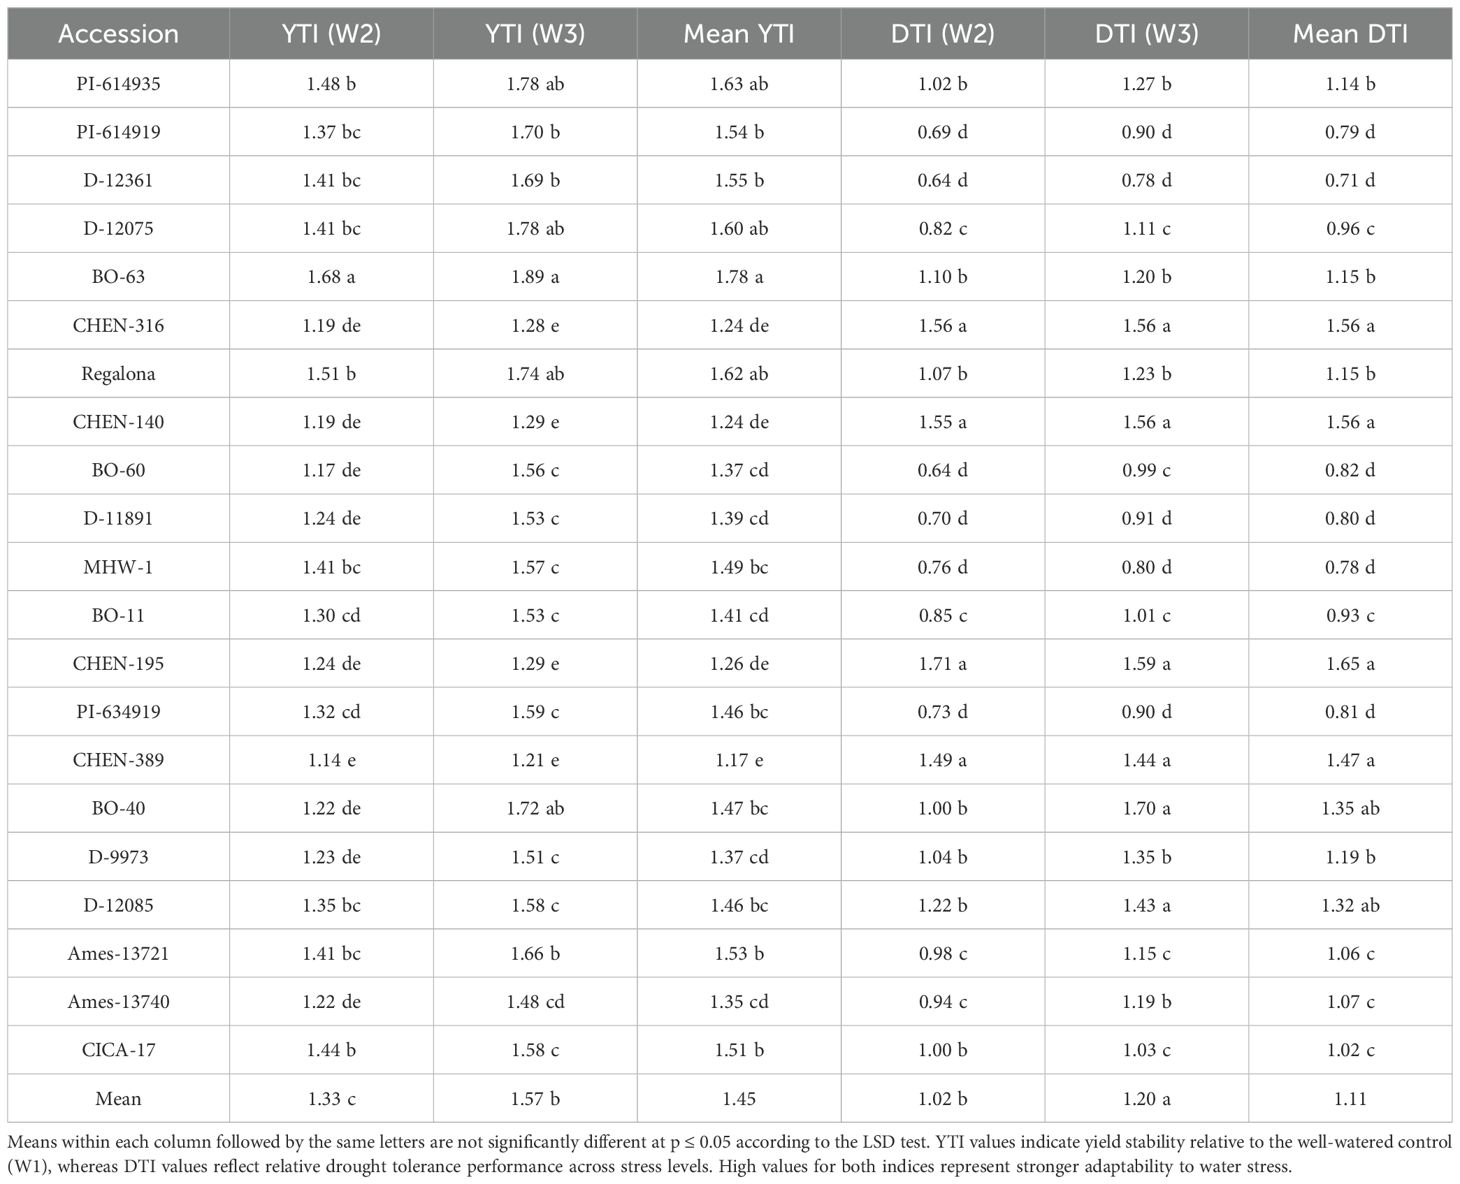
Table 14. Yield Tolerance Index (YTI) and Drought Tolerance Index (DTI) of 21 quinoa accessions under moderate (W2) and severe (W3) water stress regimes.
Drought tolerance index
The Drought Tolerance Index (DTI) quantifies the relative performance of a genotype under water stress compared with optimal irrigation, with values typically ranging from 0 to 1; higher values indicate stronger yield stability and superior drought tolerance, whereas lower values reflect greater susceptibility to drought-induced yield losses. The drought tolerance index (DTI) showed significant variation among quinoa accessions, irrigation regimes, and their interaction. Because the interaction was significant, only genotype × irrigation combinations are presented to highlight how different accessions respond under varying irrigation intensities. The highest DTI was observed for ‘CHEN-195’ under W1 (15 minutes twice daily; 2.4843), followed by ‘CHEN-140’ (2.3163) and ‘CHEN-316’ (2.2277), indicating their superior resilience under mild drought stress (Table 15). These accessions are known for their stable grain filling and enhanced physiological tolerance mechanisms such as osmotic adjustment and stomatal regulation under water-limited conditions (Kiani et al., 2021; Morales et al., 2022). In contrast, accessions such as ‘D-12361’ and ‘PI-614919’ exhibited low DTI values (0.2518 and 0.3194, respectively), suggesting a poor capacity to maintain yield under drought stress. The zero DTI values observed under W3 (5 minutes twice daily) across all accessions underscore the critical threshold of water availability required for quinoa survival and productivity, echoing the thresholds reported by Razzaghi et al. (2020) and Ruiz et al. (2023). These findings highlight the genetic variation in drought adaptation and reinforce the suitability of ‘CHEN-195’, ‘CHEN-316’, and ‘CHEN-140’ as drought-resilient cultivars for arid and semi-arid environments. Such accessions have been repeatedly noted for their agronomic performance under stress due to favorable traits like deep rooting, leaf retention, and photosynthetic stability (Hinojosa et al., 2018; Bazile et al., 2016).
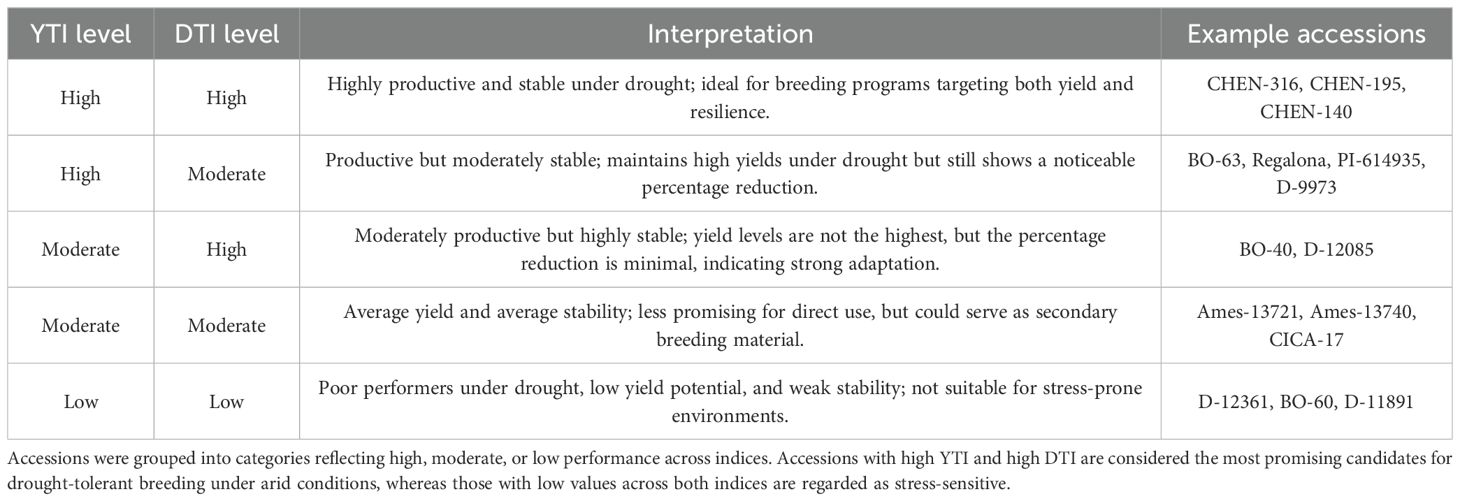
Table 15. Comparative classification of quinoa accessions based on combined Yield Tolerance Index (YTI) and Drought Tolerance Index (DTI) under moderate (W2) and severe (W3) water stress conditions.
Weight of 1000 seeds(g)
The weight of 1000 seeds is a key yield component that reflects seed development and is influenced by both genetic and environmental factors. In this study, significant variation was observed among accessions and water regimes for 1000-seed weight. However, the interaction effect between genotype and irrigation was not significant, indicating consistent seed weight responses across irrigation treatments.
Among the quinoa accessions, ‘CHEN-195’ produced the highest 1000-seed weight (3.6111 g), followed by ‘CHEN-316’ (3.5444 g), suggesting greater assimilate allocation and seed filling capacity (Table 14). In contrast, ‘PI-614919’ (2.2333 g) and ‘MHW-1’ (2.4333 g) recorded the lowest values, reflecting less favorable partitioning under stress conditions (Table 16). These findings are in line with previous studies reporting substantial genotypic variation in quinoa seed traits under varying irrigation levels (Hinojosa et al., 2018; Hafeez et al., 2022). Regarding water regimes, seed weight improved significantly with increasing irrigation. W1 (15 min twice daily) resulted in the highest mean weight (3.1778 g), followed by W2 (10 min twice daily; 2.9556 g), while the lowest mean weight was recorded under W3 (5 minutes twice daily; 2.5849 g). The trend supports the view that seed development in quinoa is highly sensitive to water availability during grain filling, as previously noted by Morales et al. (2022) and Razzaghi et al. (2020). The absence of significant interaction implies that high-performing genotypes like ‘CHEN-195’ and ‘CHEN-316’ are stable across irrigation levels. This makes them suitable candidates for breeding programs targeting grain quality and seed size under both optimal and reduced irrigation. On the other hand, the 1000-seed weight showed only a weak correlation with seed yield, suggesting that yield was primarily influenced by seed number, panicle density, and harvest index rather than seed size (Bhargava et al., 2007; Peterson and Murphy, 2015). Positive associations of 1000-seed weight with plant height and panicle length indicate that larger vegetative structures may support heavier seeds (Bertero et al., 2004). Under water stress, the correlation between 1000-seed weight and yield weakened, reflecting a trade-off between seed size and number (Rojas et al., 2015). Therefore, 1000-seed weight alone is not a reliable predictor of yield and should be assessed alongside biomass, panicle traits, and drought tolerance indices when selecting superior genotypes.
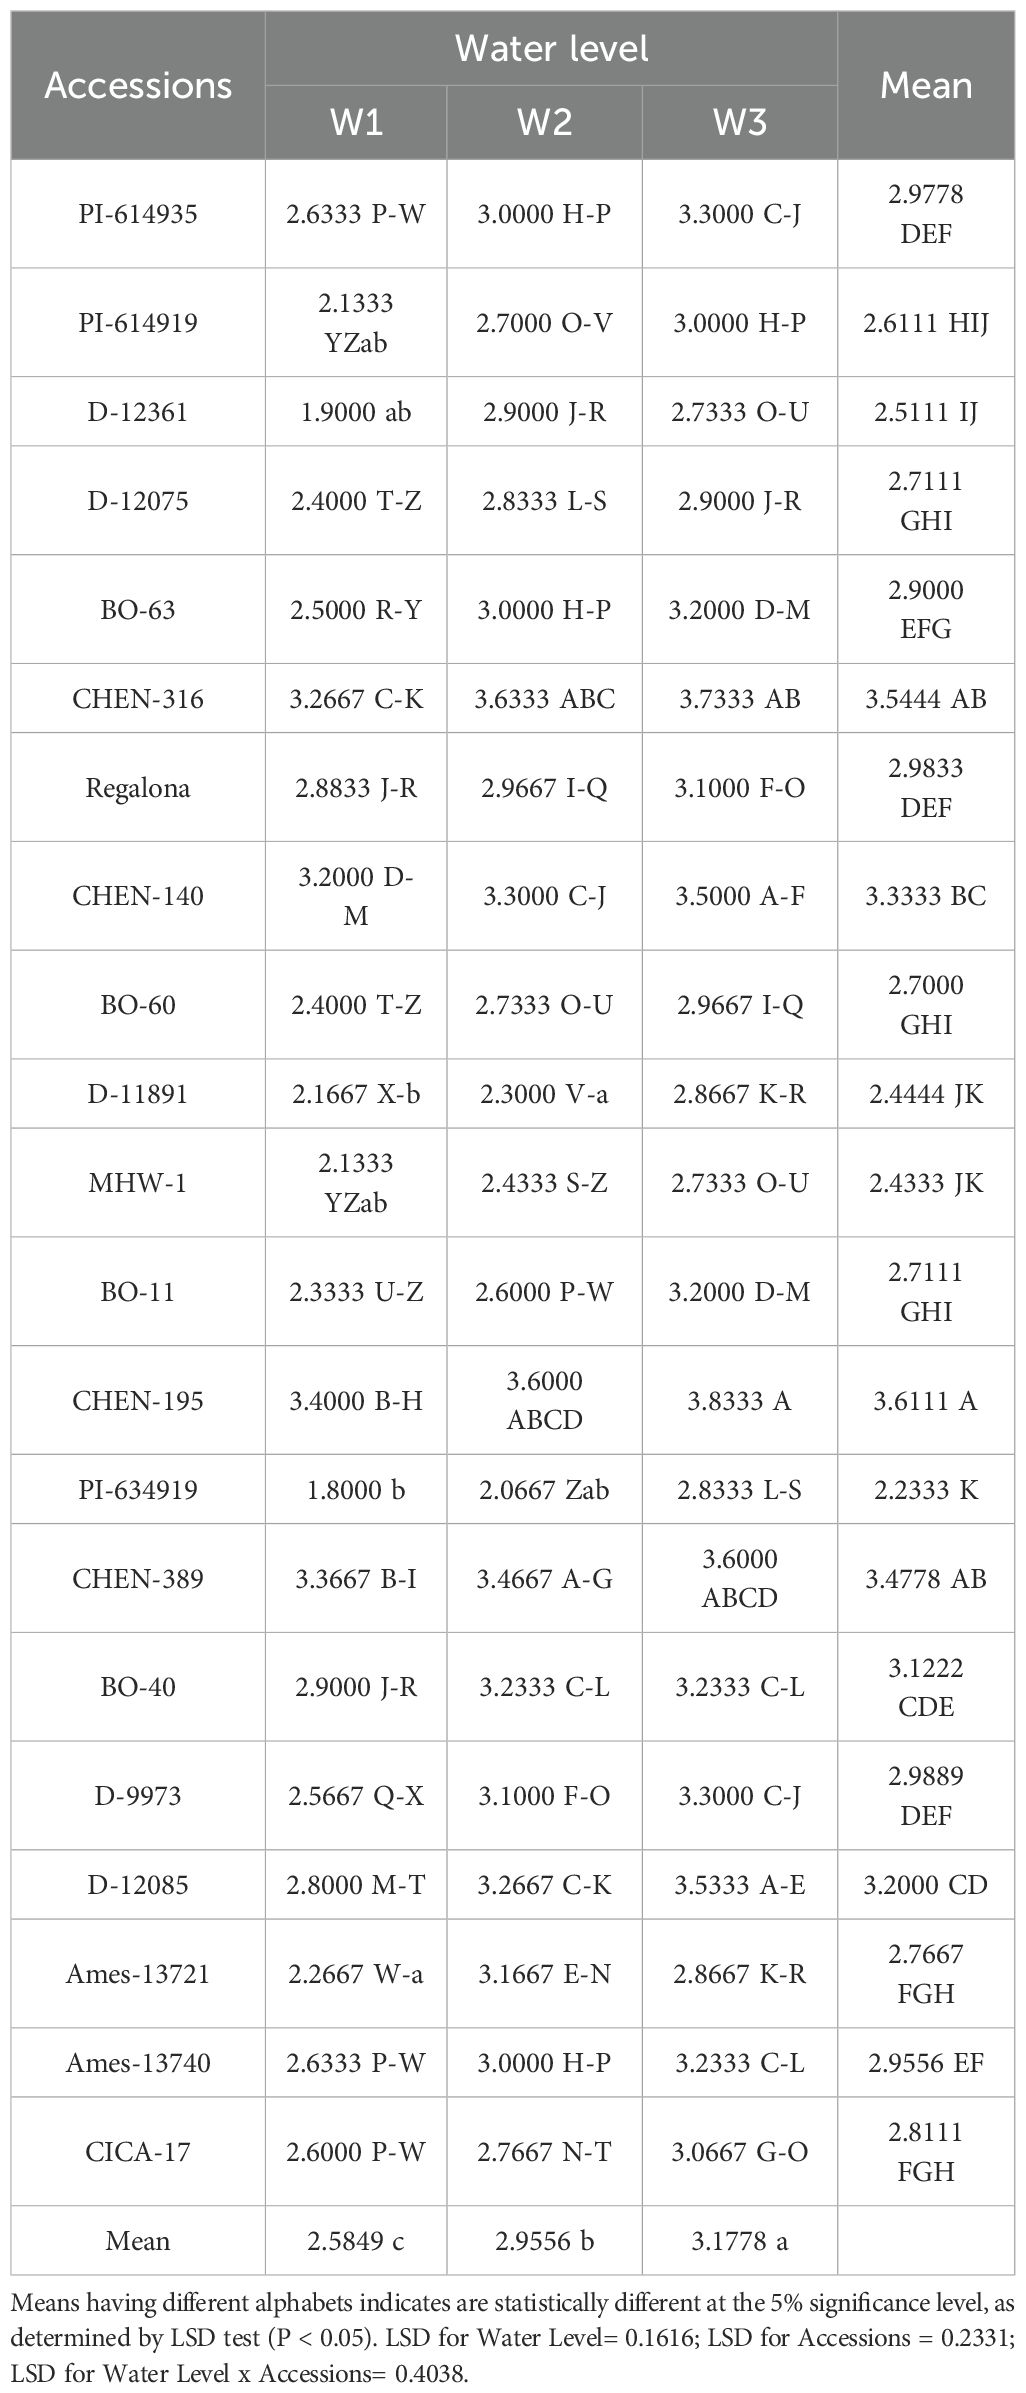
Table 16. Weight of 1000 seeds(g) of 21 quinoa accessions under different irrigation regimes in arid conditions.
Chlorophyll a content at 30 days (mg/100g)
Chlorophyll a concentration reflects early photosynthetic efficiency and is a useful indicator of stress response in plants. The analysis of variance revealed significant differences among quinoa accessions, irrigation treatments, and their interaction. Therefore, only genotype × irrigation interaction data are presented. The highest chlorophyll a level at 30 days was recorded in ‘CHEN-316’ under W1 (5 minutes twice daily; 0. 7947± 0.0063 mg/100g), followed by ‘CHEN-195’ (0.7727± 0.0063 mg/100g), both under W1 (Figure 1). These genotypes displayed superior physiological stability and maintained high chlorophyll levels under stress, aligning with previous reports linking chlorophyll retention to drought tolerance in quinoa (Morales et al., 2022; Kiani et al., 2021). In contrast, ‘BO-40’ and ‘PI-614935’ under W3 (15 minutes twice daily) showed the lowest chlorophyll a content (0.4263 ± 0.0063 and 0.4270± 0.0063 mg/100g, respectively), suggesting impaired photosynthetic machinery under limited water supply. The ability of ‘CHEN-316’ and ‘CHEN-195’ to sustain high chlorophyll levels is consistent with their performance across other agronomic traits and highlights their suitability for early stress detection and resilience. These findings are in agreement with prior studies emphasizing the role of chlorophyll a as a sensitive biomarker for evaluating drought stress responses in quinoa and its contribution to biomass accumulation and productivity under water-deficit conditions (Hinojosa et al., 2018; Ruiz et al., 2023).
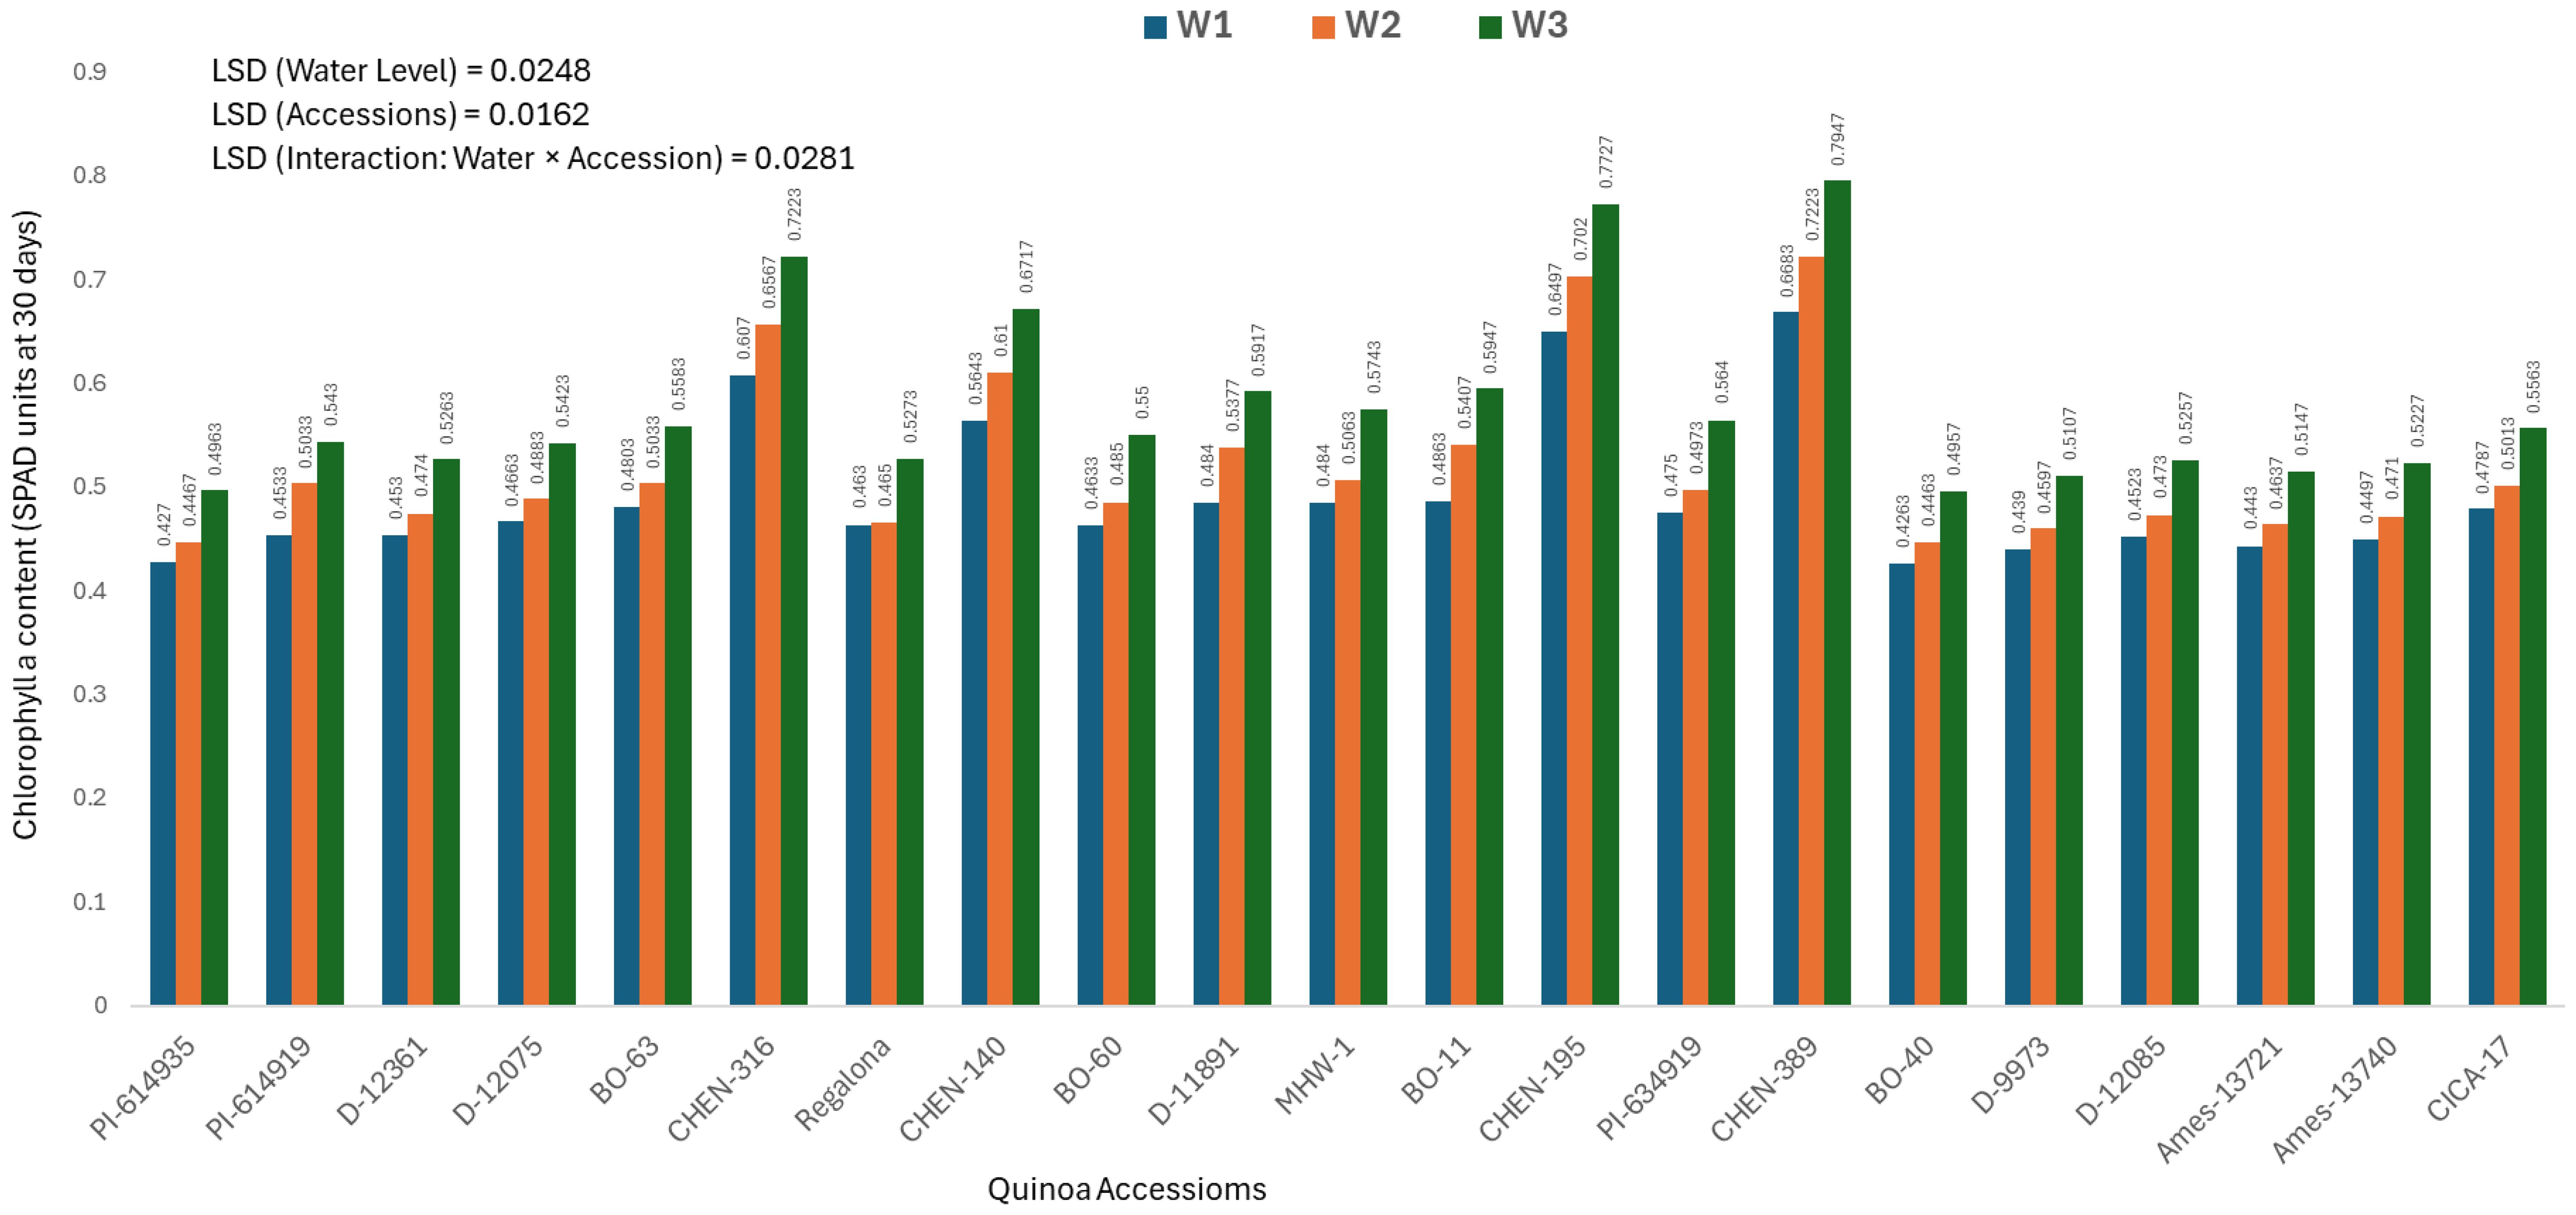
Figure 1. Chlorophyll a content (SPAD readings at 30 days) in 21 quinoa accessions under three irrigation regimes (W1: 15 min twice/day, W2: 10 min twice/day, and W3: 5 min twice/day) in arid conditions.
Chlorophyll a content at 60 days (mg/100g)
Chlorophyll a content measured at 60 days provides insights into the mid-growth photosynthetic activity and plant vigor under irrigation stress. The analysis of variance showed significant effects of genotype, water regime, and their interaction, and thus only genotype × irrigation combinations are discussed. The highest chlorophyll a content was recorded for ‘CHEN-195’ under W3 (5 minutes twice daily; 0.8887± 0.0055 mg/100g), followed by ‘CHEN-316’ (0.8310± 0.0055 mg/100g), confirming their superior photosynthetic capacity and resilience in water-limited conditions (Figure 2). These accessions maintained pigment stability under stress, supporting previous findings that chlorophyll a retention is linked to enhanced drought tolerance and delayed senescence in quinoa (Morales et al., 2022; Hinojosa et al., 2018). On the other hand, the lowest values were observed in ‘BO-60’ and ‘BO-40’ under W1 (15 minutes twice daily), registering only 0.4770 ± 0.0055 and 0.4900 ± 0.0055 mg/100g, respectively. These results reflect a significant reduction in chlorophyll a content, likely due to stress-induced pigment degradation and compromised photosynthetic performance. These findings reinforce the utility of chlorophyll a as a physiological marker of drought tolerance and support the selection of genotypes like ‘CHEN-195’ and ‘CHEN-316’ for cultivation in arid regions. Similar patterns of chlorophyll preservation and yield stability have been noted in earlier quinoa research under regulated deficit irrigation (Kiani et al., 2021; Ruiz et al., 2023).
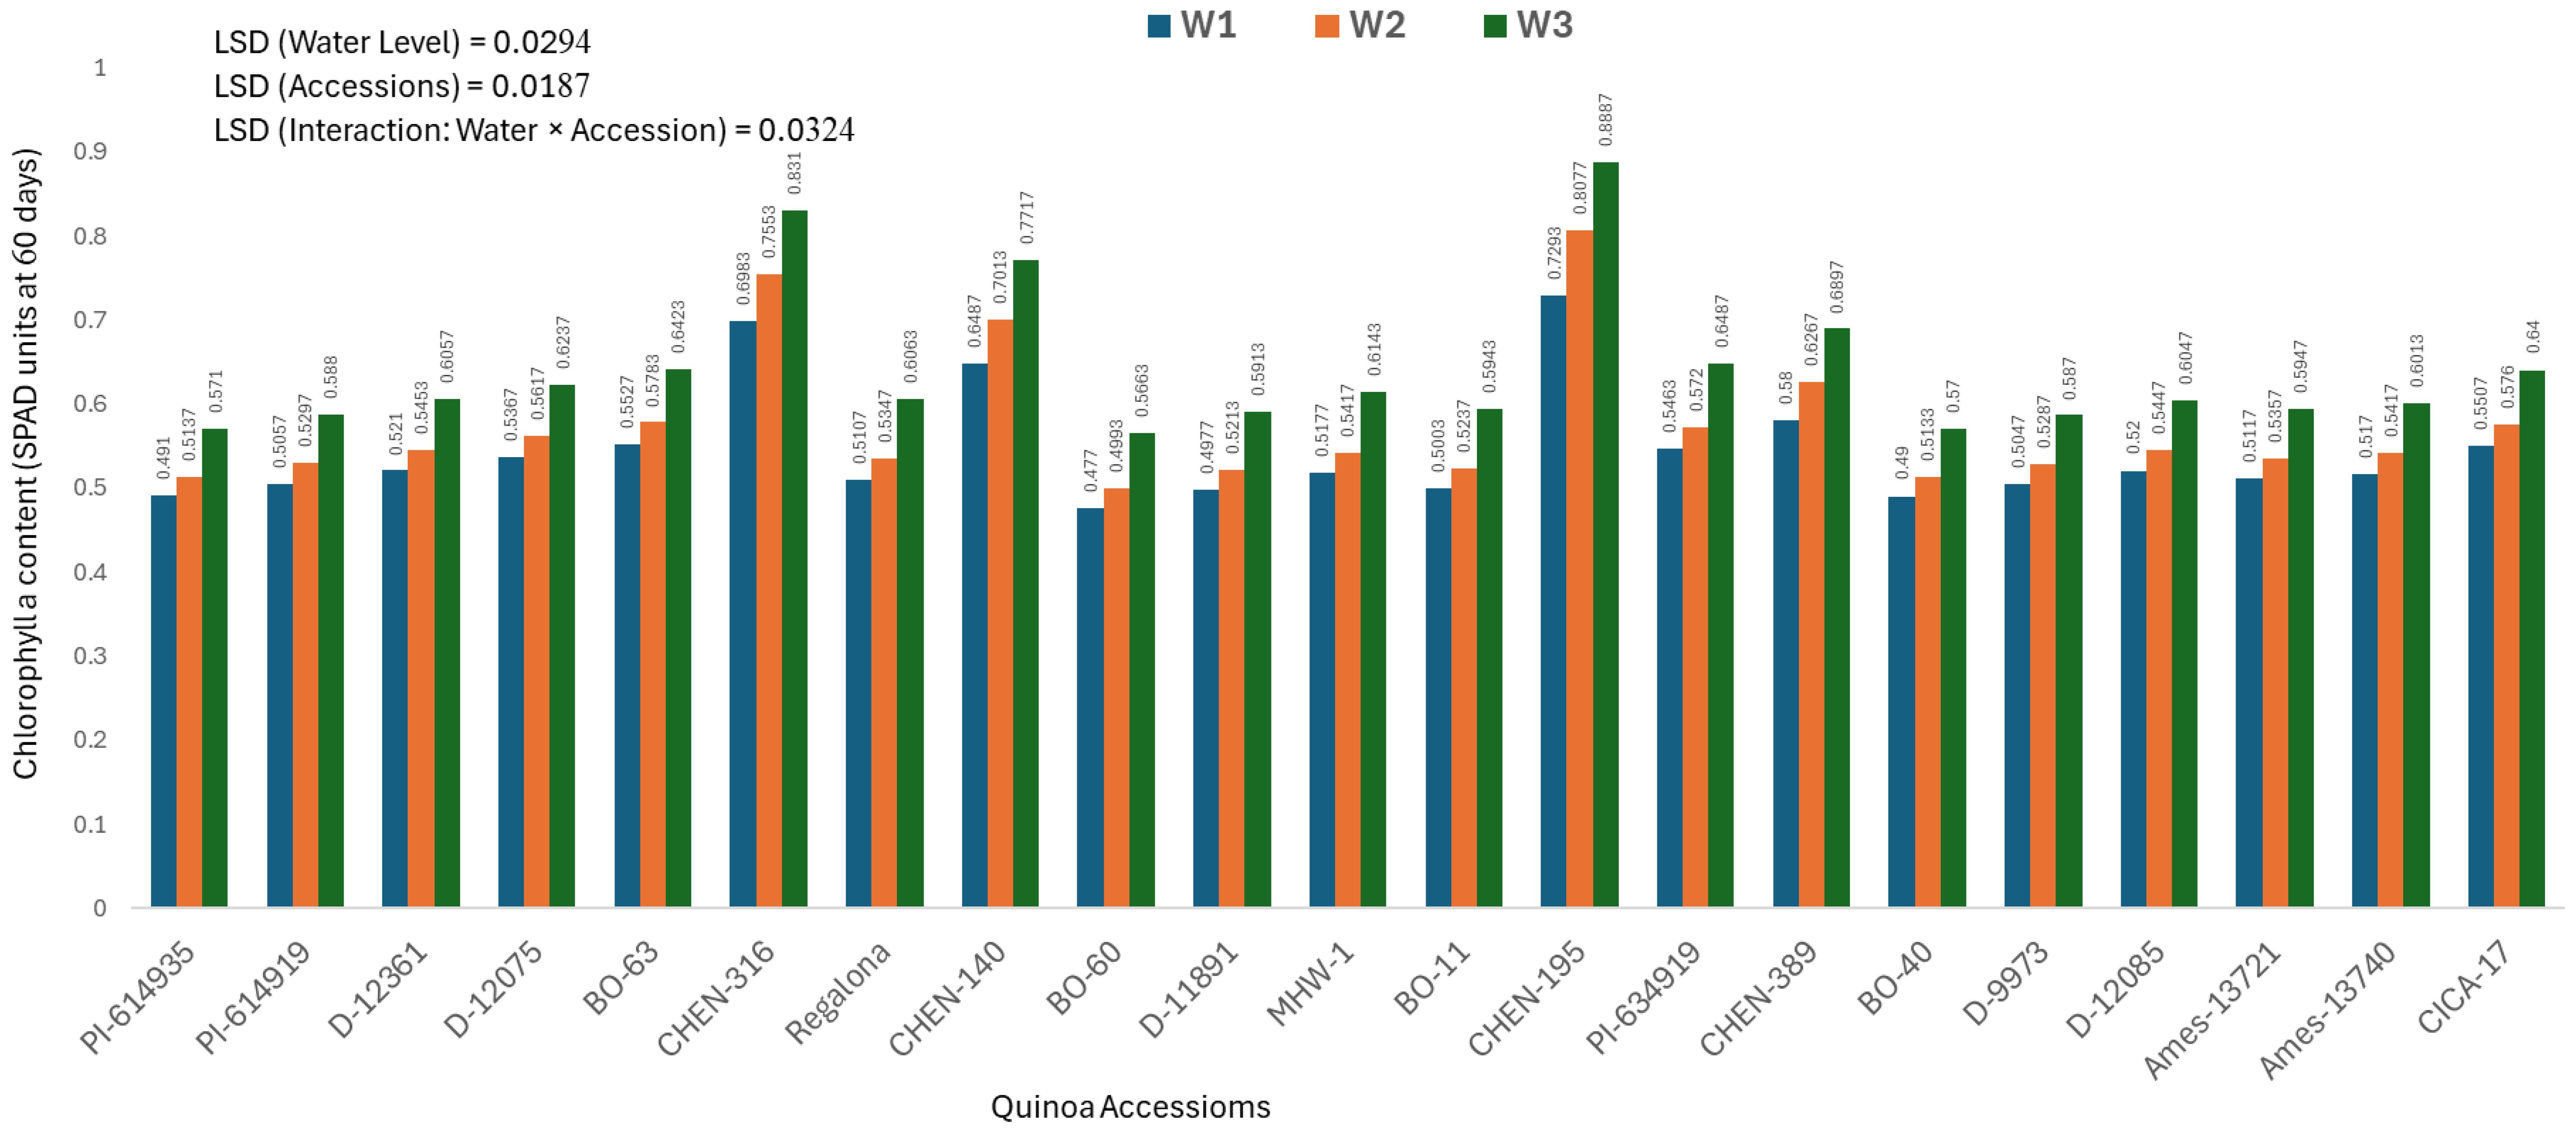
Figure 2. Chlorophyll a content (SPAD readings at 60 days) in 21 quinoa accessions under three irrigation regimes (W1: 15 min twice/day, W2: 10 min twice/day, and W3: 5 min twice/day) in arid conditions.
Chlorophyll a content at 90 days (mg/100g)
Chlorophyll a content at 90 days provides insight into photosynthetic efficiency during the reproductive stage, when plants are most susceptible to prolonged stress. The analysis of variance showed significant effects of genotype, water regime, and their interaction, warranting presentation of genotype × irrigation combinations.
The highest chlorophyll a content was observed in ‘CHEN-140’ under W3 (5 minutes twice daily; 0.8797 ± 0.0063 mg/100g), followed by ‘CHEN-195’ under W3 (0.8503 ± 0.0063 mg/100g), confirming their exceptional ability to retain pigment integrity under water-limited conditions (Figure 3). These genotypes demonstrated consistent chlorophyll stability across earlier time points and sustained photosynthetic function, supporting findings by Morales et al. (2022) and Kiani et al. (2021) regarding delayed senescence and enhanced drought tolerance. In contrast, ‘PI-614919’ recorded the lowest chlorophyll a values under W1 (15 minutes twice daily; 0.4747 ± 0.0063 mg/100g) and W2 (10 minutes twice daily; 0.4963 ± 0.0063 mg/100g), suggesting that this genotype experiences greater pigment degradation and stress susceptibility. The same trend was noted for ‘CICA-17’ under full irrigation, highlighting its overall limited adaptability. These results affirm that genotypes such as ‘CHEN-140’, ‘CHEN-195’, and ‘CHEN-316’ maintain high chlorophyll a level throughout development under water deficit. Their capacity to preserve chlorophyll content reinforces their classification as drought-resilient and confirms their breeding value for stable productivity in arid climates. Chlorophyll a content at 90 days showed a positive association with seed yield and related agronomic traits, suggesting that sustained photosynthetic capacity during grain filling is a key determinant of productivity in quinoa under arid conditions. Higher chlorophyll retention is often linked to delayed senescence and improved assimilation efficiency, which in turn supports seed set and filling (Benešová et al., 2012; Fghire et al., 2015). Recent studies confirm that chlorophyll stability under stress can serve as a physiological marker for drought tolerance and yield resilience in quinoa and other crops (Hinojosa et al., 2018; Alvar-Beltrán et al., 2019). These findings highlight the importance of chlorophyll maintenance as a selection trait for improving yield potential under water-limited environments.
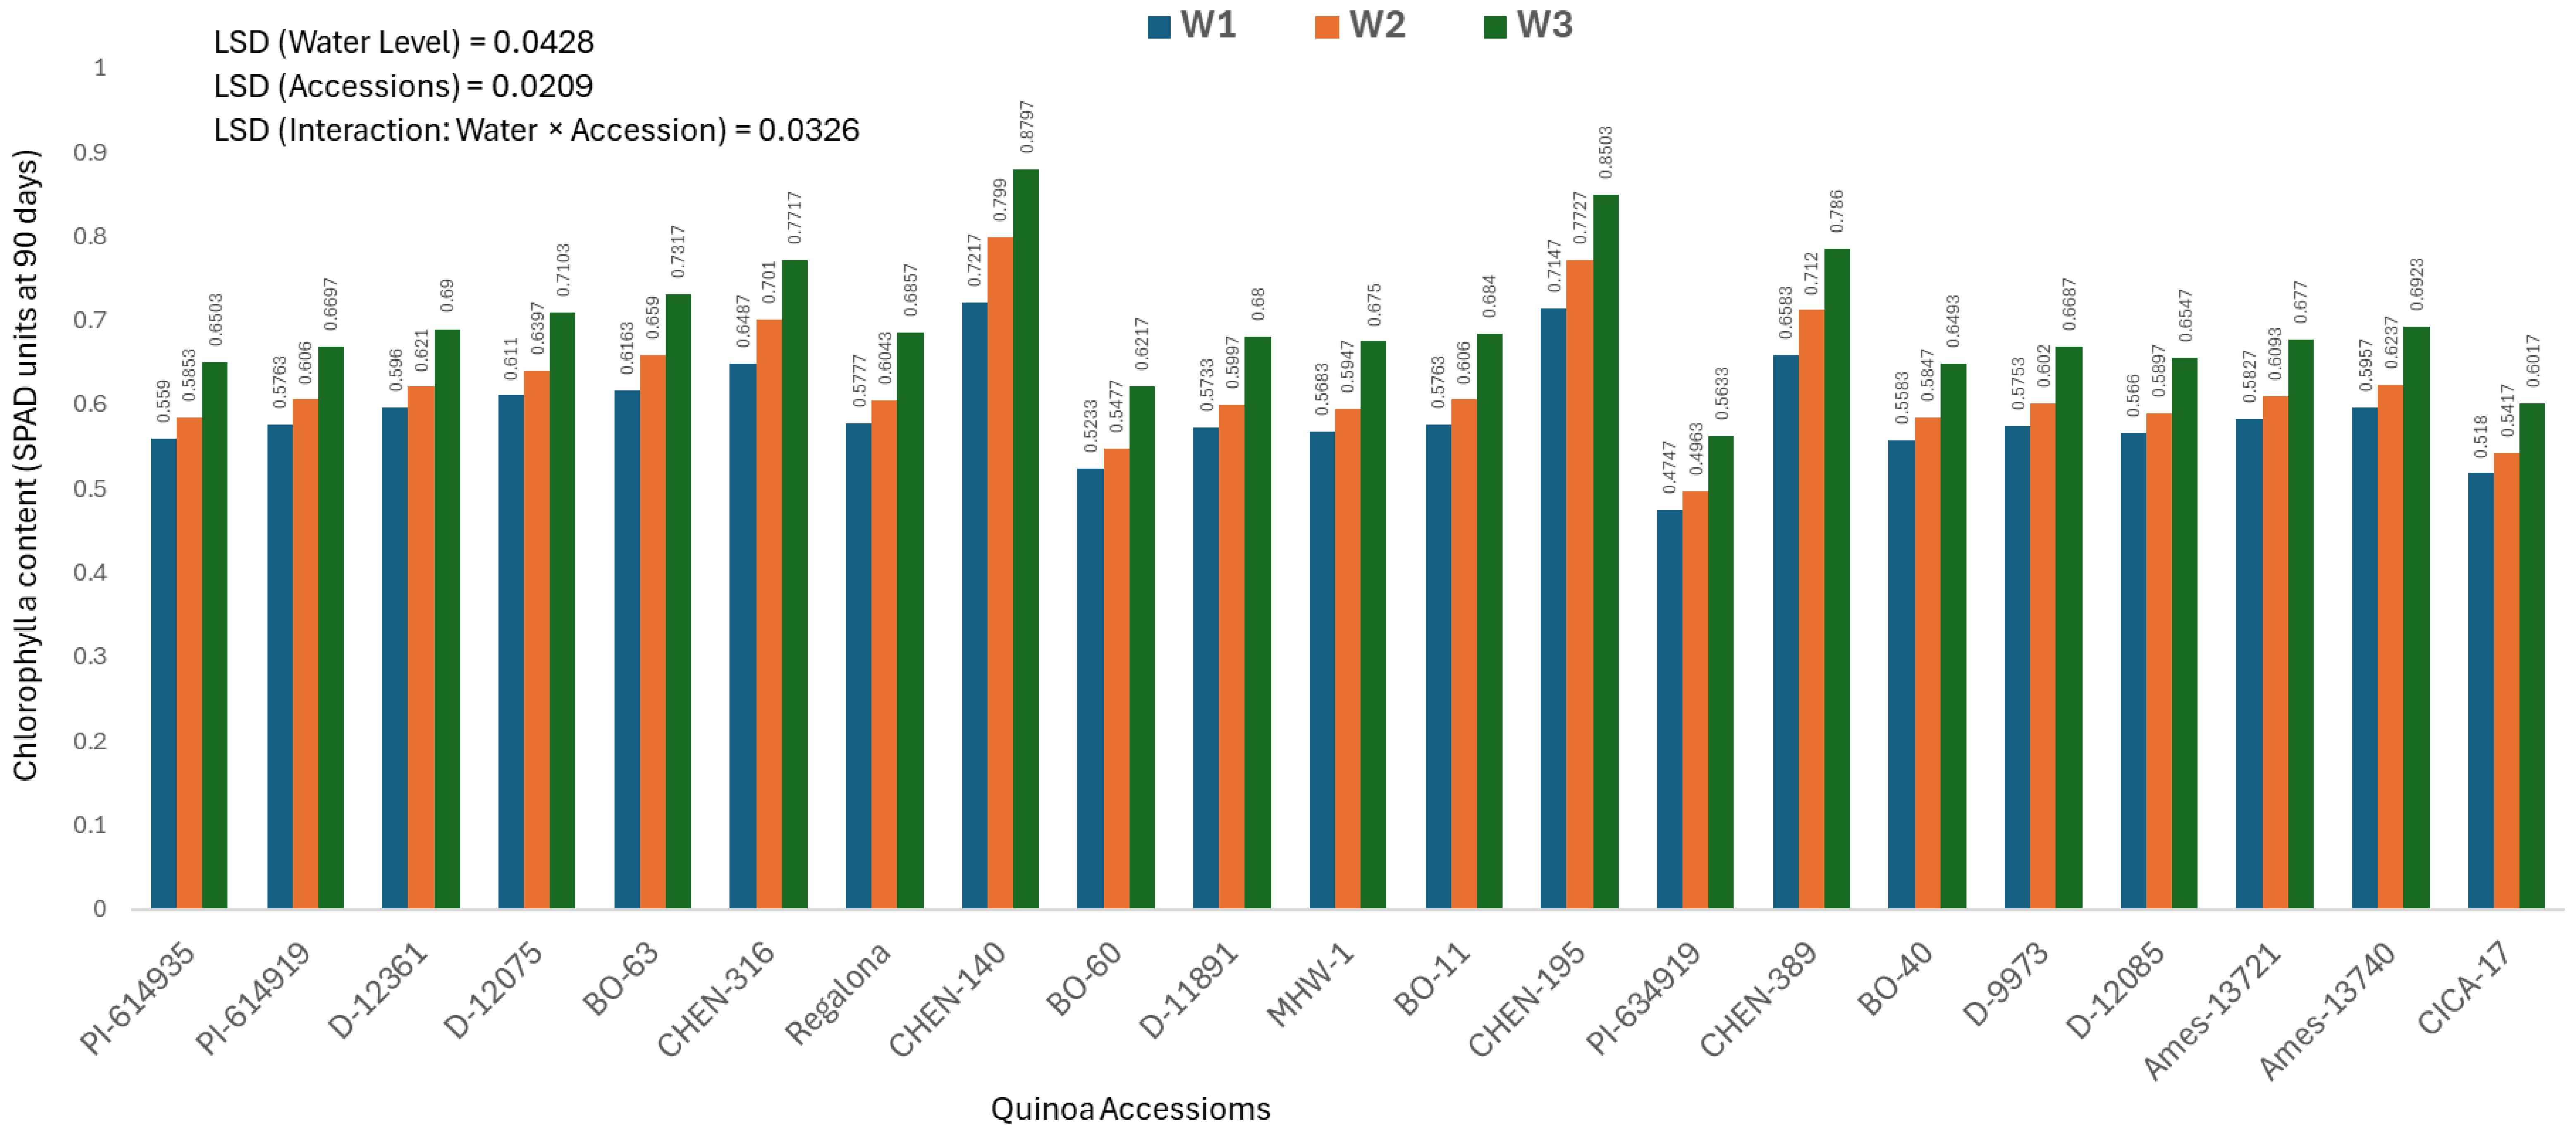
Figure 3. Chlorophyll a content (SPAD readings at 90 days) in 21 quinoa accessions under three irrigation regimes (W1: 15 min twice/day, W2: 10 min twice/day, and W3: 5 min twice/day) in arid conditions.
Chlorophyll b content at 30 days (mg/100g)
Chlorophyll b content measured 30 days after sowing differed significantly across quinoa accessions, irrigation treatments, and their interaction. As the interaction was significant, only genotype × irrigation combinations are discussed. The highest chlorophyll b content was observed in ‘CHEN-195’ under W3 (5 minutes twice daily; 0.4737 ± 0.0130 mg/100g), followed by ‘CHEN-316’ (0.4690 ± 0.0130 mg/100g) and ‘CHEN-140’ (0.4393 ± 0.0130 mg/100g), confirming their superior pigment retention and photosynthetic function during early growth (Figure 4). This indicates better light harvesting and physiological activity under limited water, in line with earlier research highlighting pigment stability as a key trait for drought resilience (Morales et al., 2022; Kiani et al., 2021). On the contrary, the lowest values were recorded in ‘BO-60’ under W2 (10 minutes twice daily; 0.3100 ± 0.0130 mg/100g) and under W1 (15 minutes twice daily; 0.3120 ± 0.0130 mg/100g), suggesting compromised pigment biosynthesis or accelerated degradation under low irrigation. ‘PI-614935’ and ‘BO-40’ also exhibited weak chlorophyll b responses under stress. These data align with previous findings that genotypes with greater chlorophyll b retention under drought show better photosynthetic efficiency and stress recovery. Thus, ‘CHEN-195’, ‘CHEN-316’, and ‘CHEN-140’ appear promising for selection in breeding programs targeting arid zones where early-season vigor and pigment preservation are critical for yield stability (Ruiz et al., 2023; Hinojosa et al., 2018).
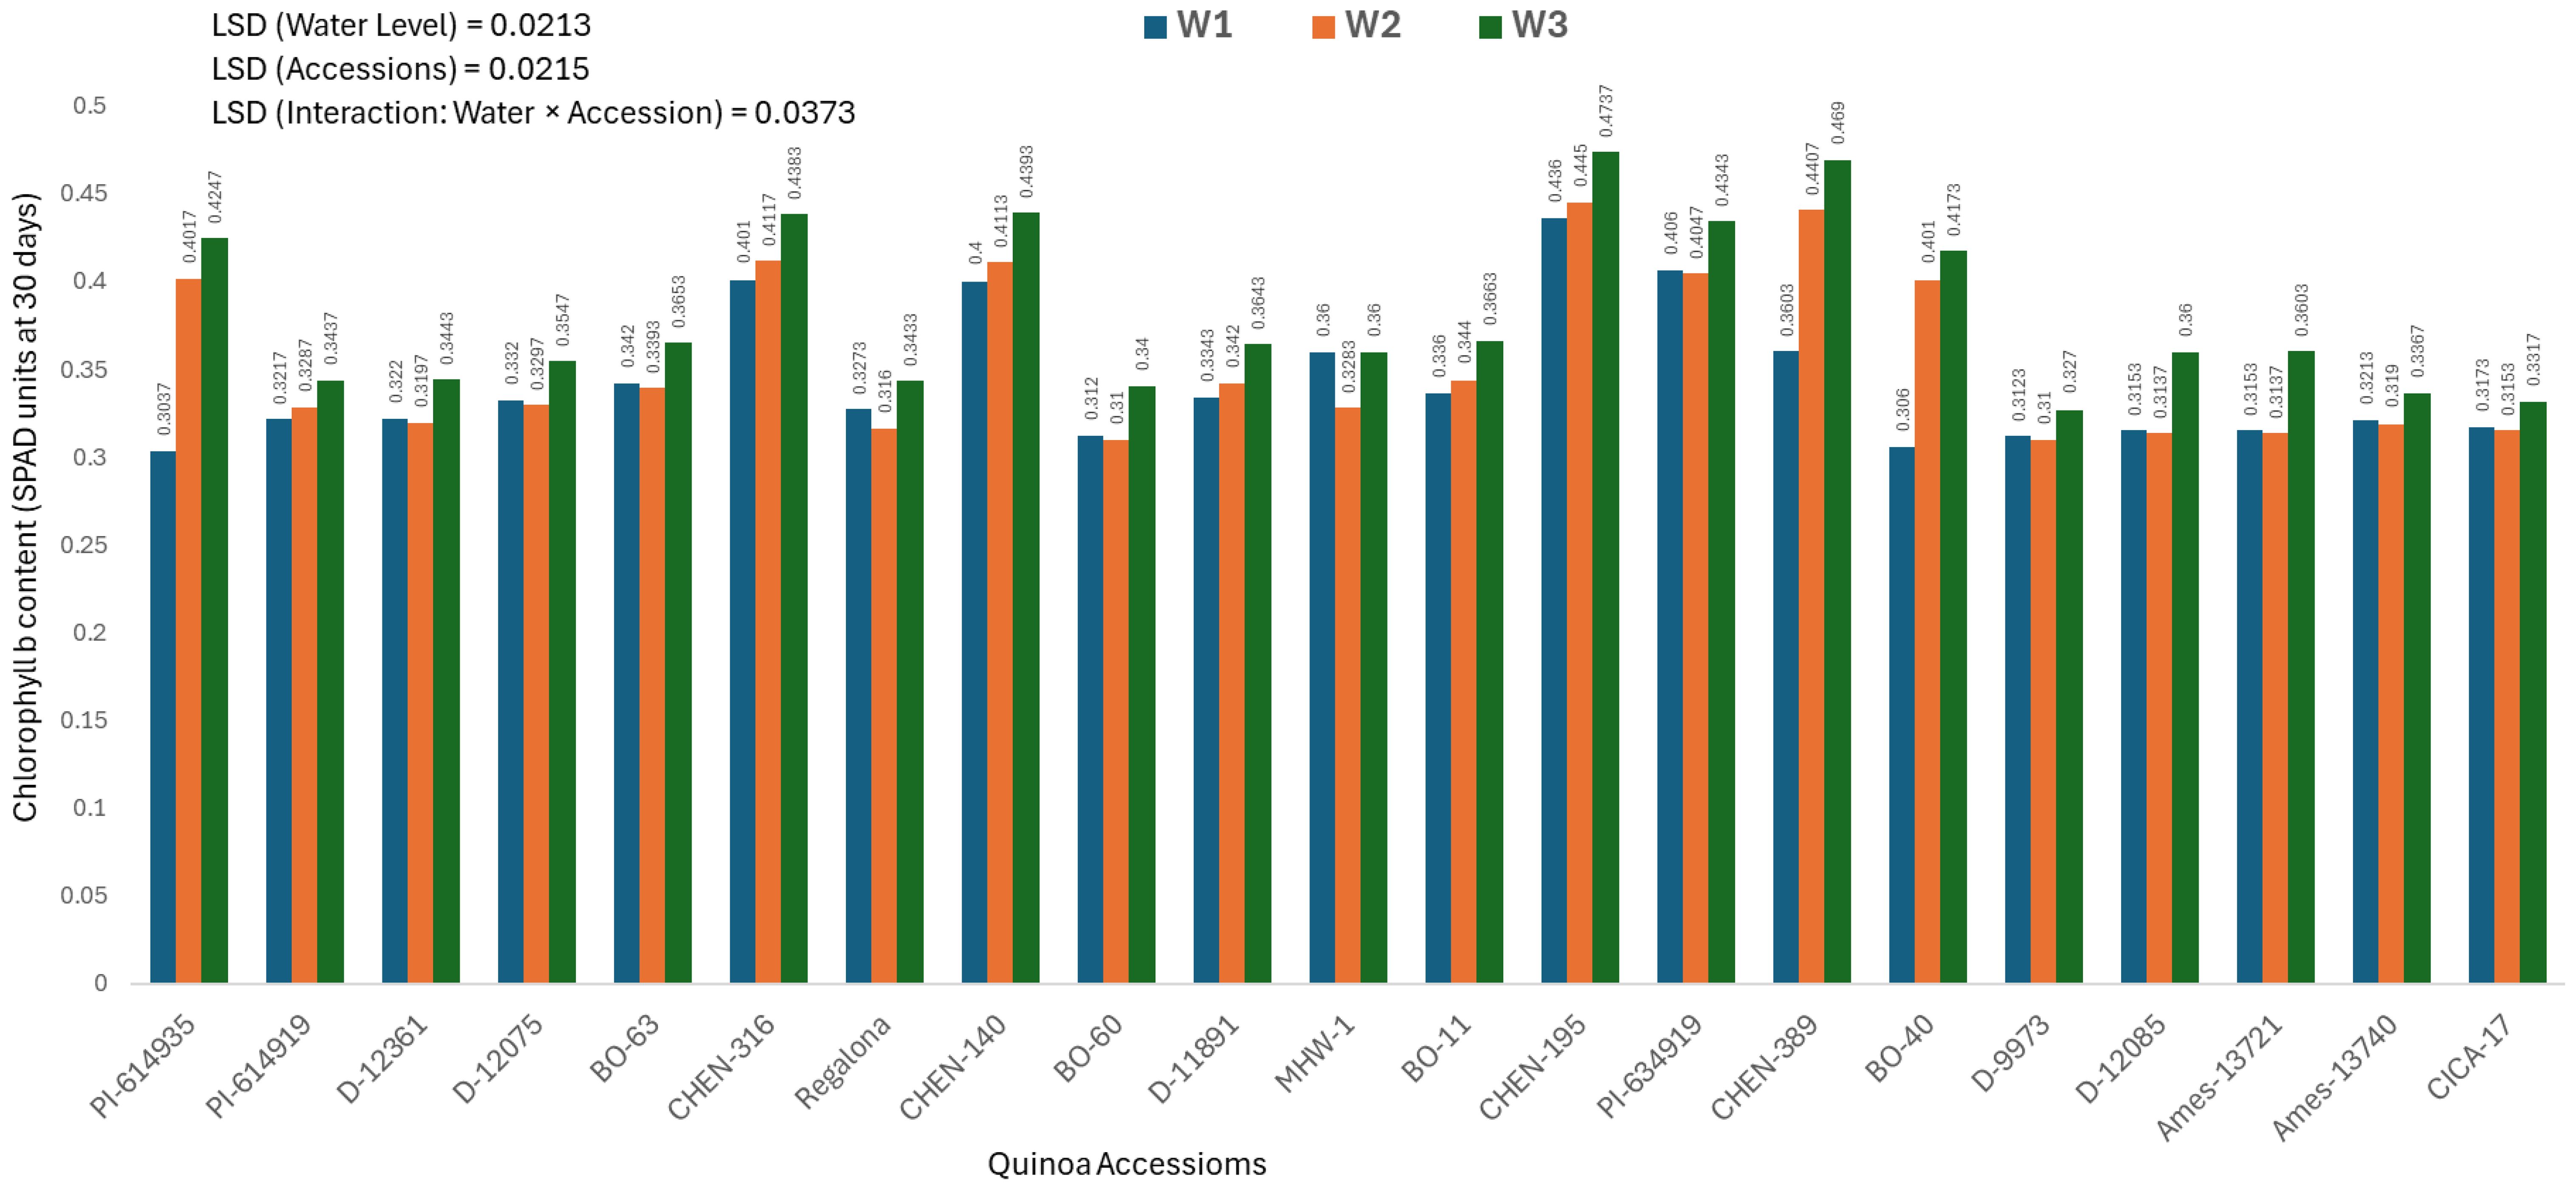
Figure 4. Chlorophyll b content (SPAD readings at 30 days) in 21 quinoa accessions under three irrigation regimes (W1: 15 min twice/day, W2: 10 min twice/day, and W3: 5 min twice/day) in arid conditions.
Chlorophyll b content at 60 days (mg/100g)
The chlorophyll b content measured at 60 days varied significantly across quinoa accessions, irrigation regimes, and their interaction. As the interaction was significant, only genotype × irrigation combinations are discussed below. The highest chlorophyll b value was recorded in ‘CHEN-195’ under W3 (5 minutes twice daily; 0.5533 ± 0.0125 mg/100g), followed by ‘CHEN-195’ × W2 (0.5187 ± 0.0125 mg/100g) and ‘CHEN-140’ × W3 (0.5140 ± 0.0125 mg/100g), indicating their superior ability to preserve chlorophyll pigments during the critical mid-growth stage (Figure 5). These findings reinforce the stability of these genotypes in maintaining photosynthetic activity under water-limited conditions, in agreement with Morales et al. (2022) and Kiani et al. (2021). In contrast, the lowest chlorophyll b levels were recorded in ‘BO-60’ under W2 and W1 (0.3377 ± 0.0125 and 0.3403 mg/100g, respectively), suggesting limited pigment biosynthesis or accelerated degradation in this genotype under drought. Similarly, ‘PI-614935’ and ‘BO-40’ showed poor chlorophyll retention under moderate and severe stress. Genotypes like ‘CHEN-195’, ‘CHEN-140’, and ‘CHEN-316’ demonstrated strong pigment preservation and could serve as valuable resources for enhancing drought resilience in breeding programs. These findings confirm that chlorophyll b content is a reliable physiological marker for selecting drought-tolerant quinoa cultivars (Ruiz et al., 2023; Hinojosa et al., 2018).
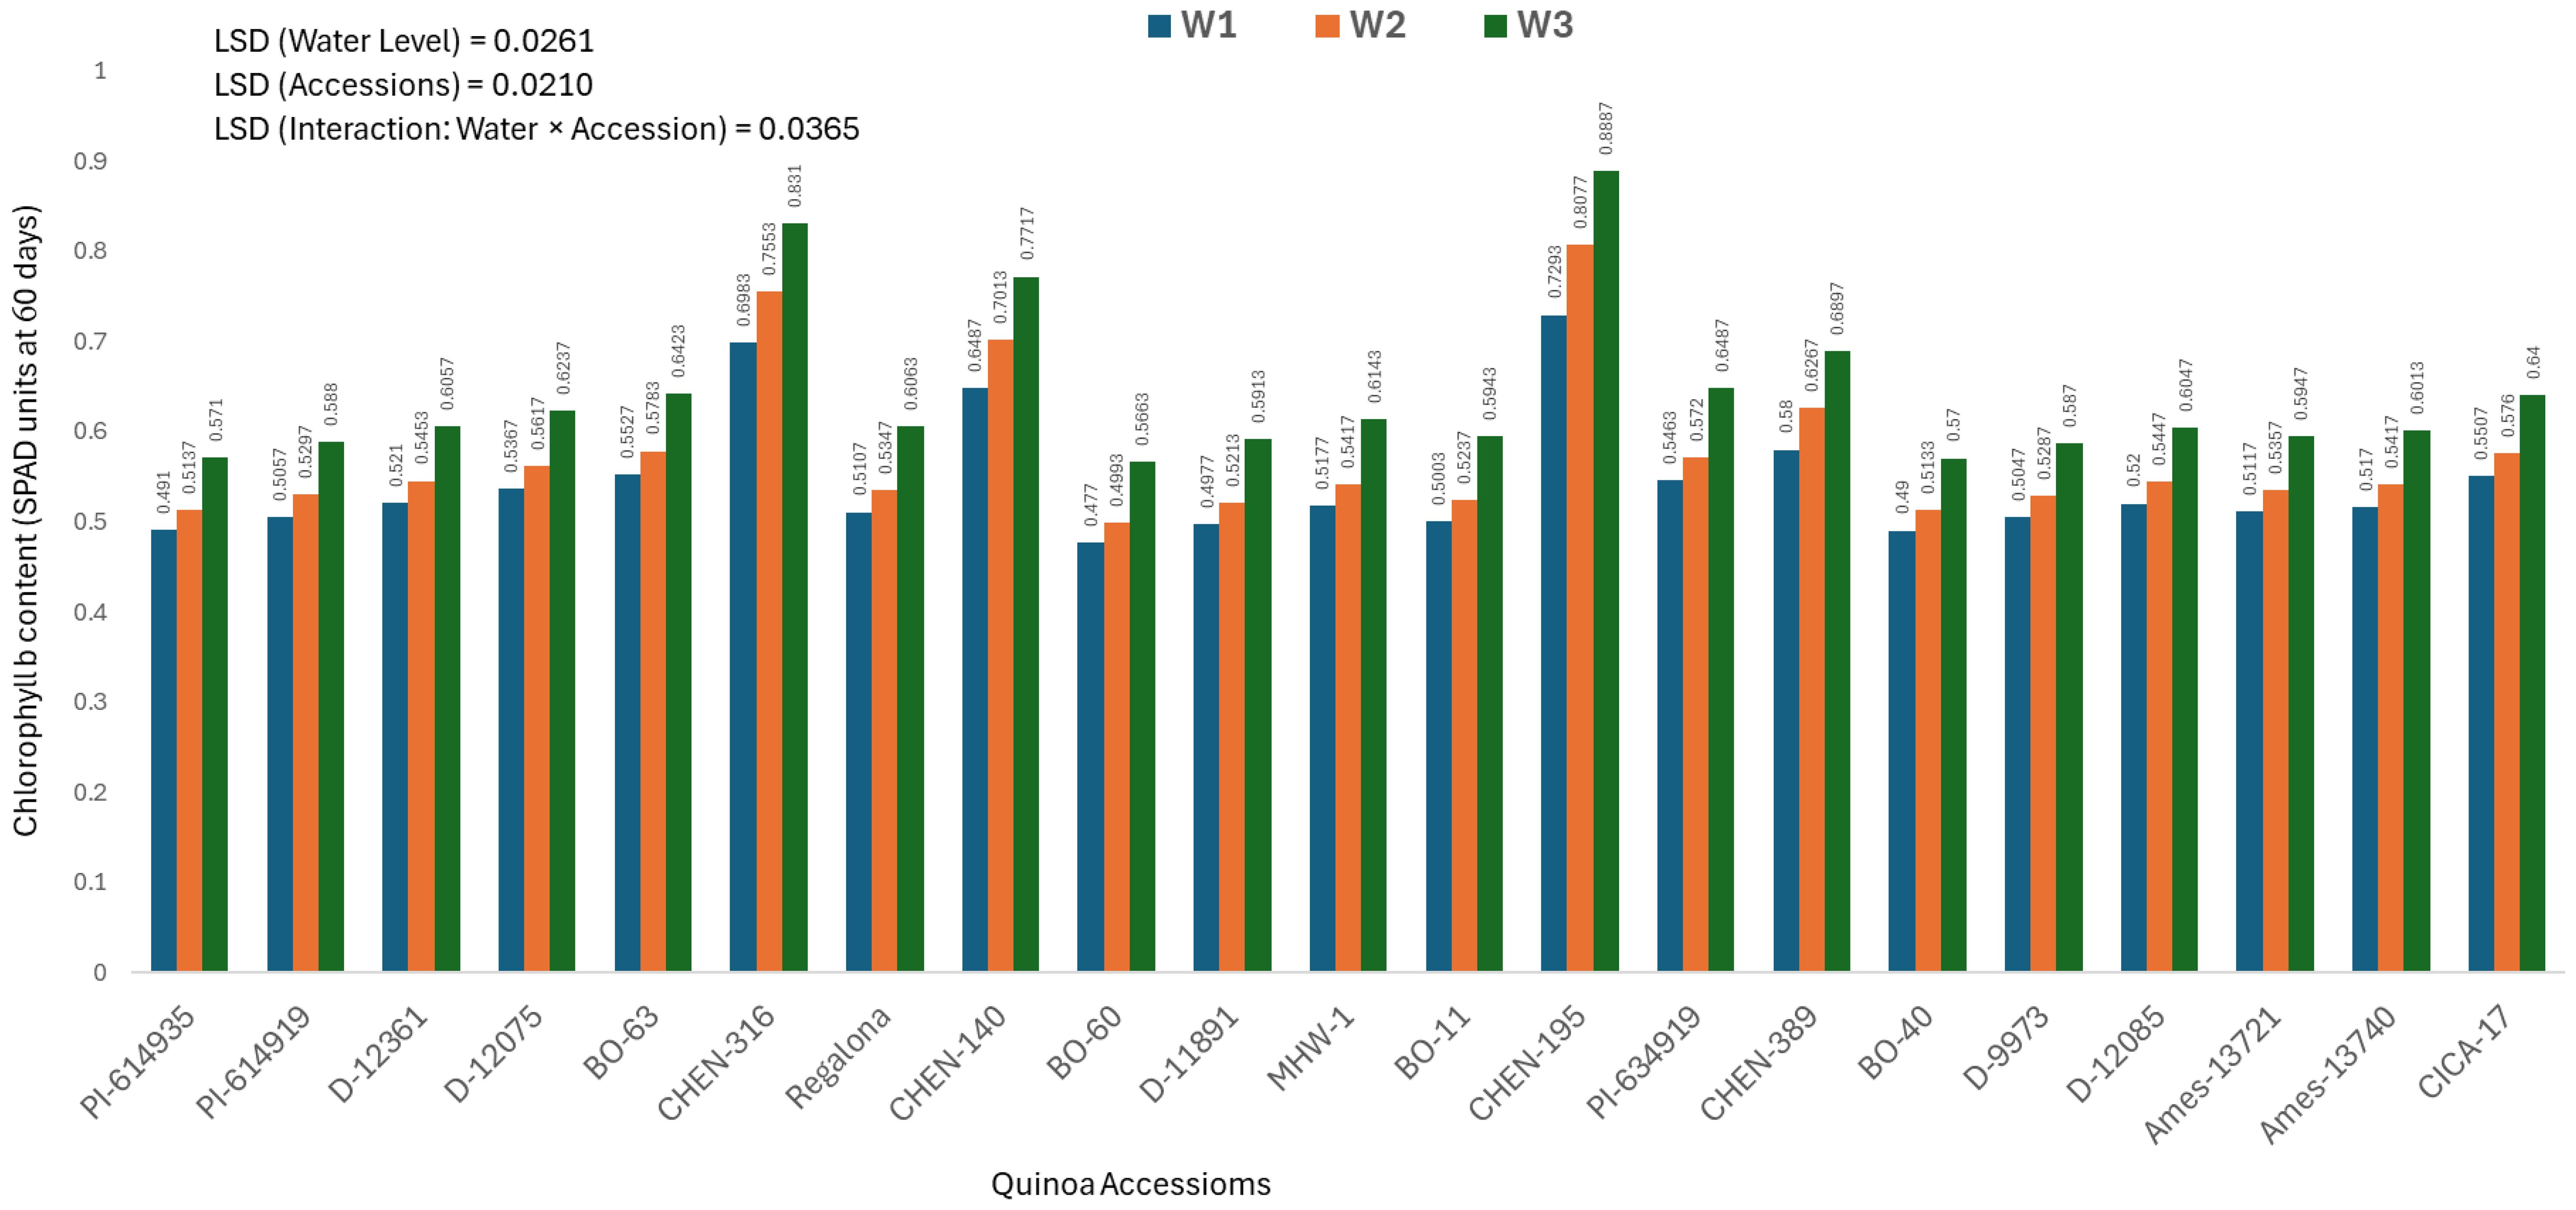
Figure 5. Chlorophyll b content (SPAD readings at 60 days) in 21 quinoa accessions under three irrigation regimes (W1: 15 min twice/day, W2: 10 min twice/day, and W3: 5 min twice/day) in arid conditions.
Chlorophyll b content at 90 days (mg/100g)
At 90 days after sowing, a significant genotype × water regime interaction was observed for chlorophyll b concentration. The highest values were recorded in ‘CHEN-140’ (0.5558 ± 0.0071 mg/100g) and ‘CHEN-195’ (0.5483 ± 0.0071 mg/100g), particularly under W3 (5 minutes twice/day), where both accessions achieved peak values of 0.5900 ± 0.0071 and 0.5783 ± 0.0071 mg/100g, respectively (Figure 6). These findings suggest strong stay-green traits and late-season photosynthetic efficiency. Conversely, ‘CICA-17’ and ‘BO-60’ showed the lowest chlorophyll b levels (0.3878 ± 0.0071 and 0.3972 ± 0.0071 mg/100g, respectively), reflecting advanced senescence. The most stress-sensitive response was noted in ‘PI-614919’ under W2 (10 minutes twice/day) and W1 (15 minutes twice/day), where chlorophyll b dropped to 0.3477 ± 0.0071 and 0.3507 ± 0.0071 mg/100g, respectively. Among water regimes, W3 (5 minutes twice/day) maintained the highest overall chlorophyll b (0.4688 ± 0.0071 mg/100g), followed by W2 (0.4362 ± 0.0071 mg/100g), while W1 had the lowest (0.4350 ± 0.0071 mg/100g). These findings are consistent with those of Kiani et al. (2021) and Ruiz et al. (2023), who highlighted the effectiveness of mild stress in maintaining pigment retention in resilient genotypes. Top-performing accessions namely ‘CHEN-140’, ‘CHEN-195’, and ‘CHEN-316’ demonstrated stable pigment concentration, reinforcing their suitability for drought-prone environments. Chlorophyll content is a reliable indicator of photosynthetic performance under stress. The highest chlorophyll a and b contents were observed in ‘CHEN-195’, ‘CHEN-316’, and ‘CHEN-140’ under W3, showing strong pigment retention. Lowest values were recorded in ‘PI-614919’, ‘BO-60’, and ‘CICA-17’, indicating weak physiological resilience. Chlorophyll degradation was more pronounced in late stages (90 days), especially in sensitive accessions.
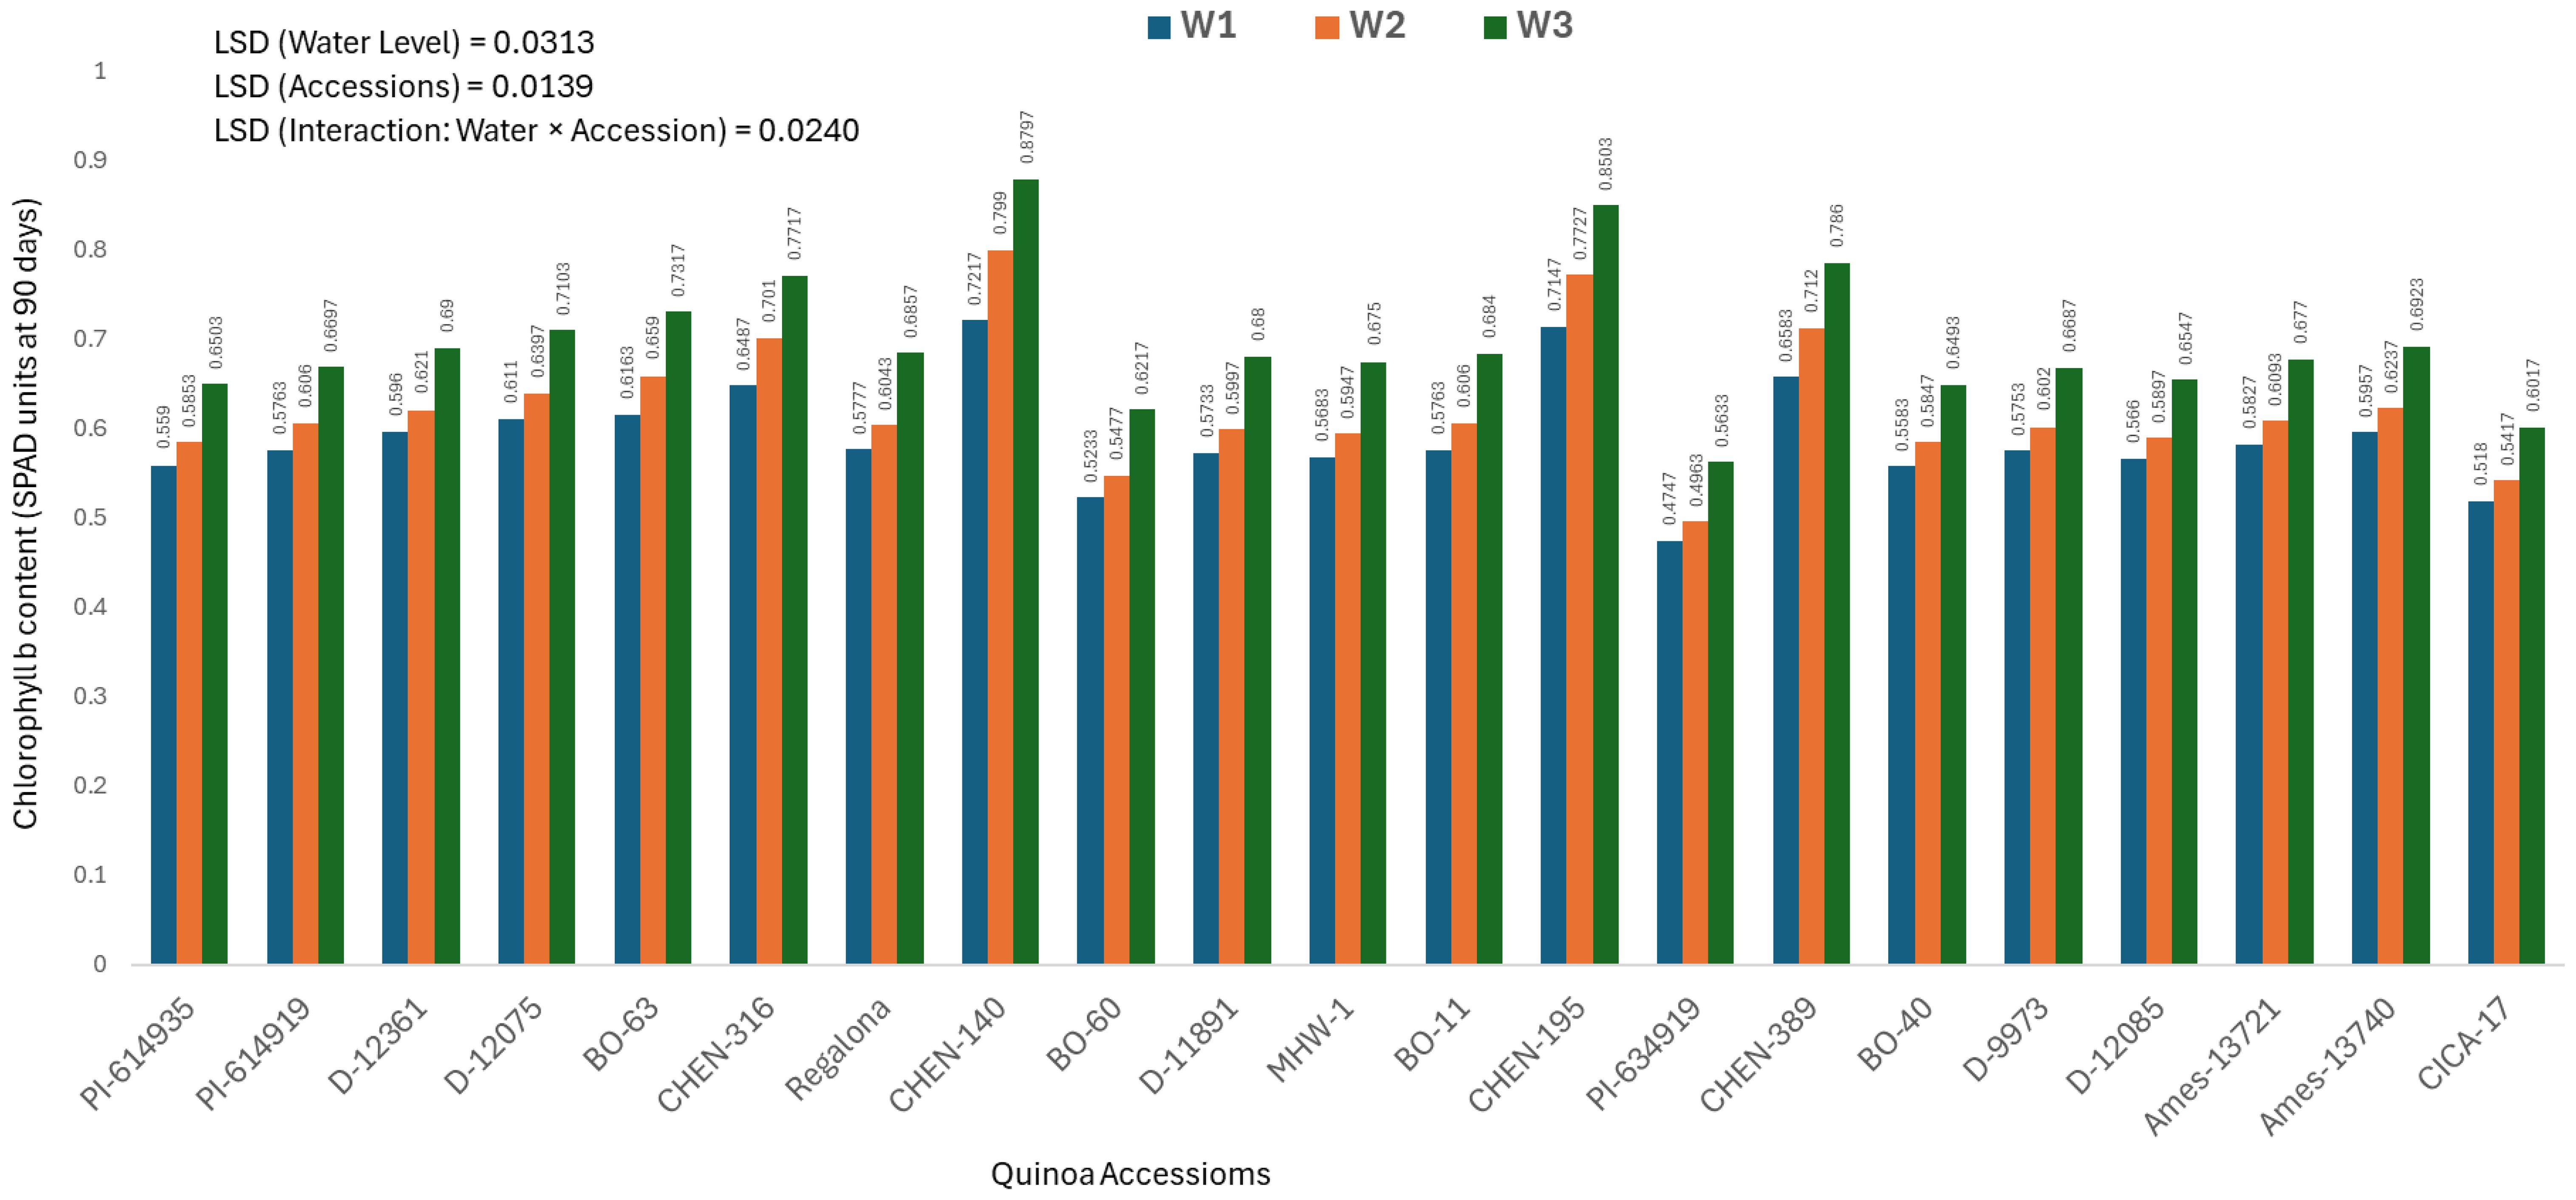
Figure 6. Chlorophyll b content (SPAD readings at 90 days) in 21 quinoa accessions under three irrigation regimes (W1: 15 min twice/day, W2: 10 min twice/day, and W3: 5 min twice/day) in arid conditions.
Principal component analysis
Principal component analysis (PCA) of nine agronomic and yield traits revealed clear multivariate differentiation among the 21 quinoa accessions under arid conditions. The first two principal components explained 70.7% of the total variance, with PC1 (49.6%) strongly influenced by seed yield, shoot dry weight, plant height, 1000-seed weight, and drought tolerance index (DTI), indicating that variation in biomass and productivity was the primary source of divergence (Figure 7). By contrast, PC2 (21.1%) was mainly associated with chlorophyll content, harvest index, and yield tolerance index (YTI), reflecting differences in physiological efficiency and stress adaptation. This separation suggests that while PC1 captures variation in overall growth vigor and yield capacity, PC2 highlights adaptive mechanisms linked to photosynthetic stability and resource use efficiency under water limitation. The PCA biplot showed broad dispersion of accessions, with CHEN-195, CHEN-140, and CHEN-316 clustered in the high-performing quadrant due to superior yield and biomass traits, while PI-614919_2 and D-12361 grouped on the opposite side with reduced trait values. These findings underscore the utility of PCA in identifying quinoa accessions combining both high yield potential and physiological resilience, supporting previous studies that highlighted PCA as a robust approach for screening stress-adaptive traits in quinoa (Kiani et al., 2021).

Figure 7. PCA biplot for all 21 quinoa accessions under three water regimes (W1: 15min twice/day), W2: 10min twice/day and W3: 5min twice/day) based on agronomic and yield traits PC1 explains ~49.6% of total variance. PC2 explains ~21.1%, bringing the combined variance explained to about 70.7%, indicating strong dimensionality reduction. Accessions like CHEN-195, CHEN-316, CHEN-140, and BO-40 cluster toward the positive PC1/PC2 quadrant, indicating higher values in traits like yield, height, and drought tolerance index (DTI). Accessions like PI-614919_2, CHEN-140, and D-12361 on the negative PC1 axis may show lower overall trait performance.
Clustered heatmap analysis
Hierarchical cluster analysis of the nine agronomic and physiological traits, visualized through a heatmap, further supported the multivariate patterns observed in PCA (Figure 8). The heatmap was constructed using z-score normalized trait values, ensuring comparability across traits with different scales. Distinct clusters of quinoa accessions were evident: high-performing accessions such as CHEN-195, CHEN-316, and CHEN-140 grouped together, characterized by elevated biomass, yield, and drought tolerance traits. This “superior performance” cluster likely reflects shared physiological strategies or genetic backgrounds favorable for arid adaptation. In contrast, accessions such as D-12361, PI-614919_2, and Ames-13721 consistently clustered together with comparatively lower trait values. The heatmap also highlighted co-variation among traits; for example, accessions with high shoot and panicle dry weights typically also expressed higher seed yield and DTI values, suggesting functional linkages among growth and yield components under drought stress. Similar clustering patterns were reported by Hirich et al. (2020) and Bazile et al. (2016), who demonstrated the utility of cluster analysis in distinguishing quinoa genotypes by drought-response profiles. Overall, the heatmap complements the PCA results, providing an intuitive visualization of genotype × trait associations that strengthen the identification of promising accessions for breeding in water-limited environments.
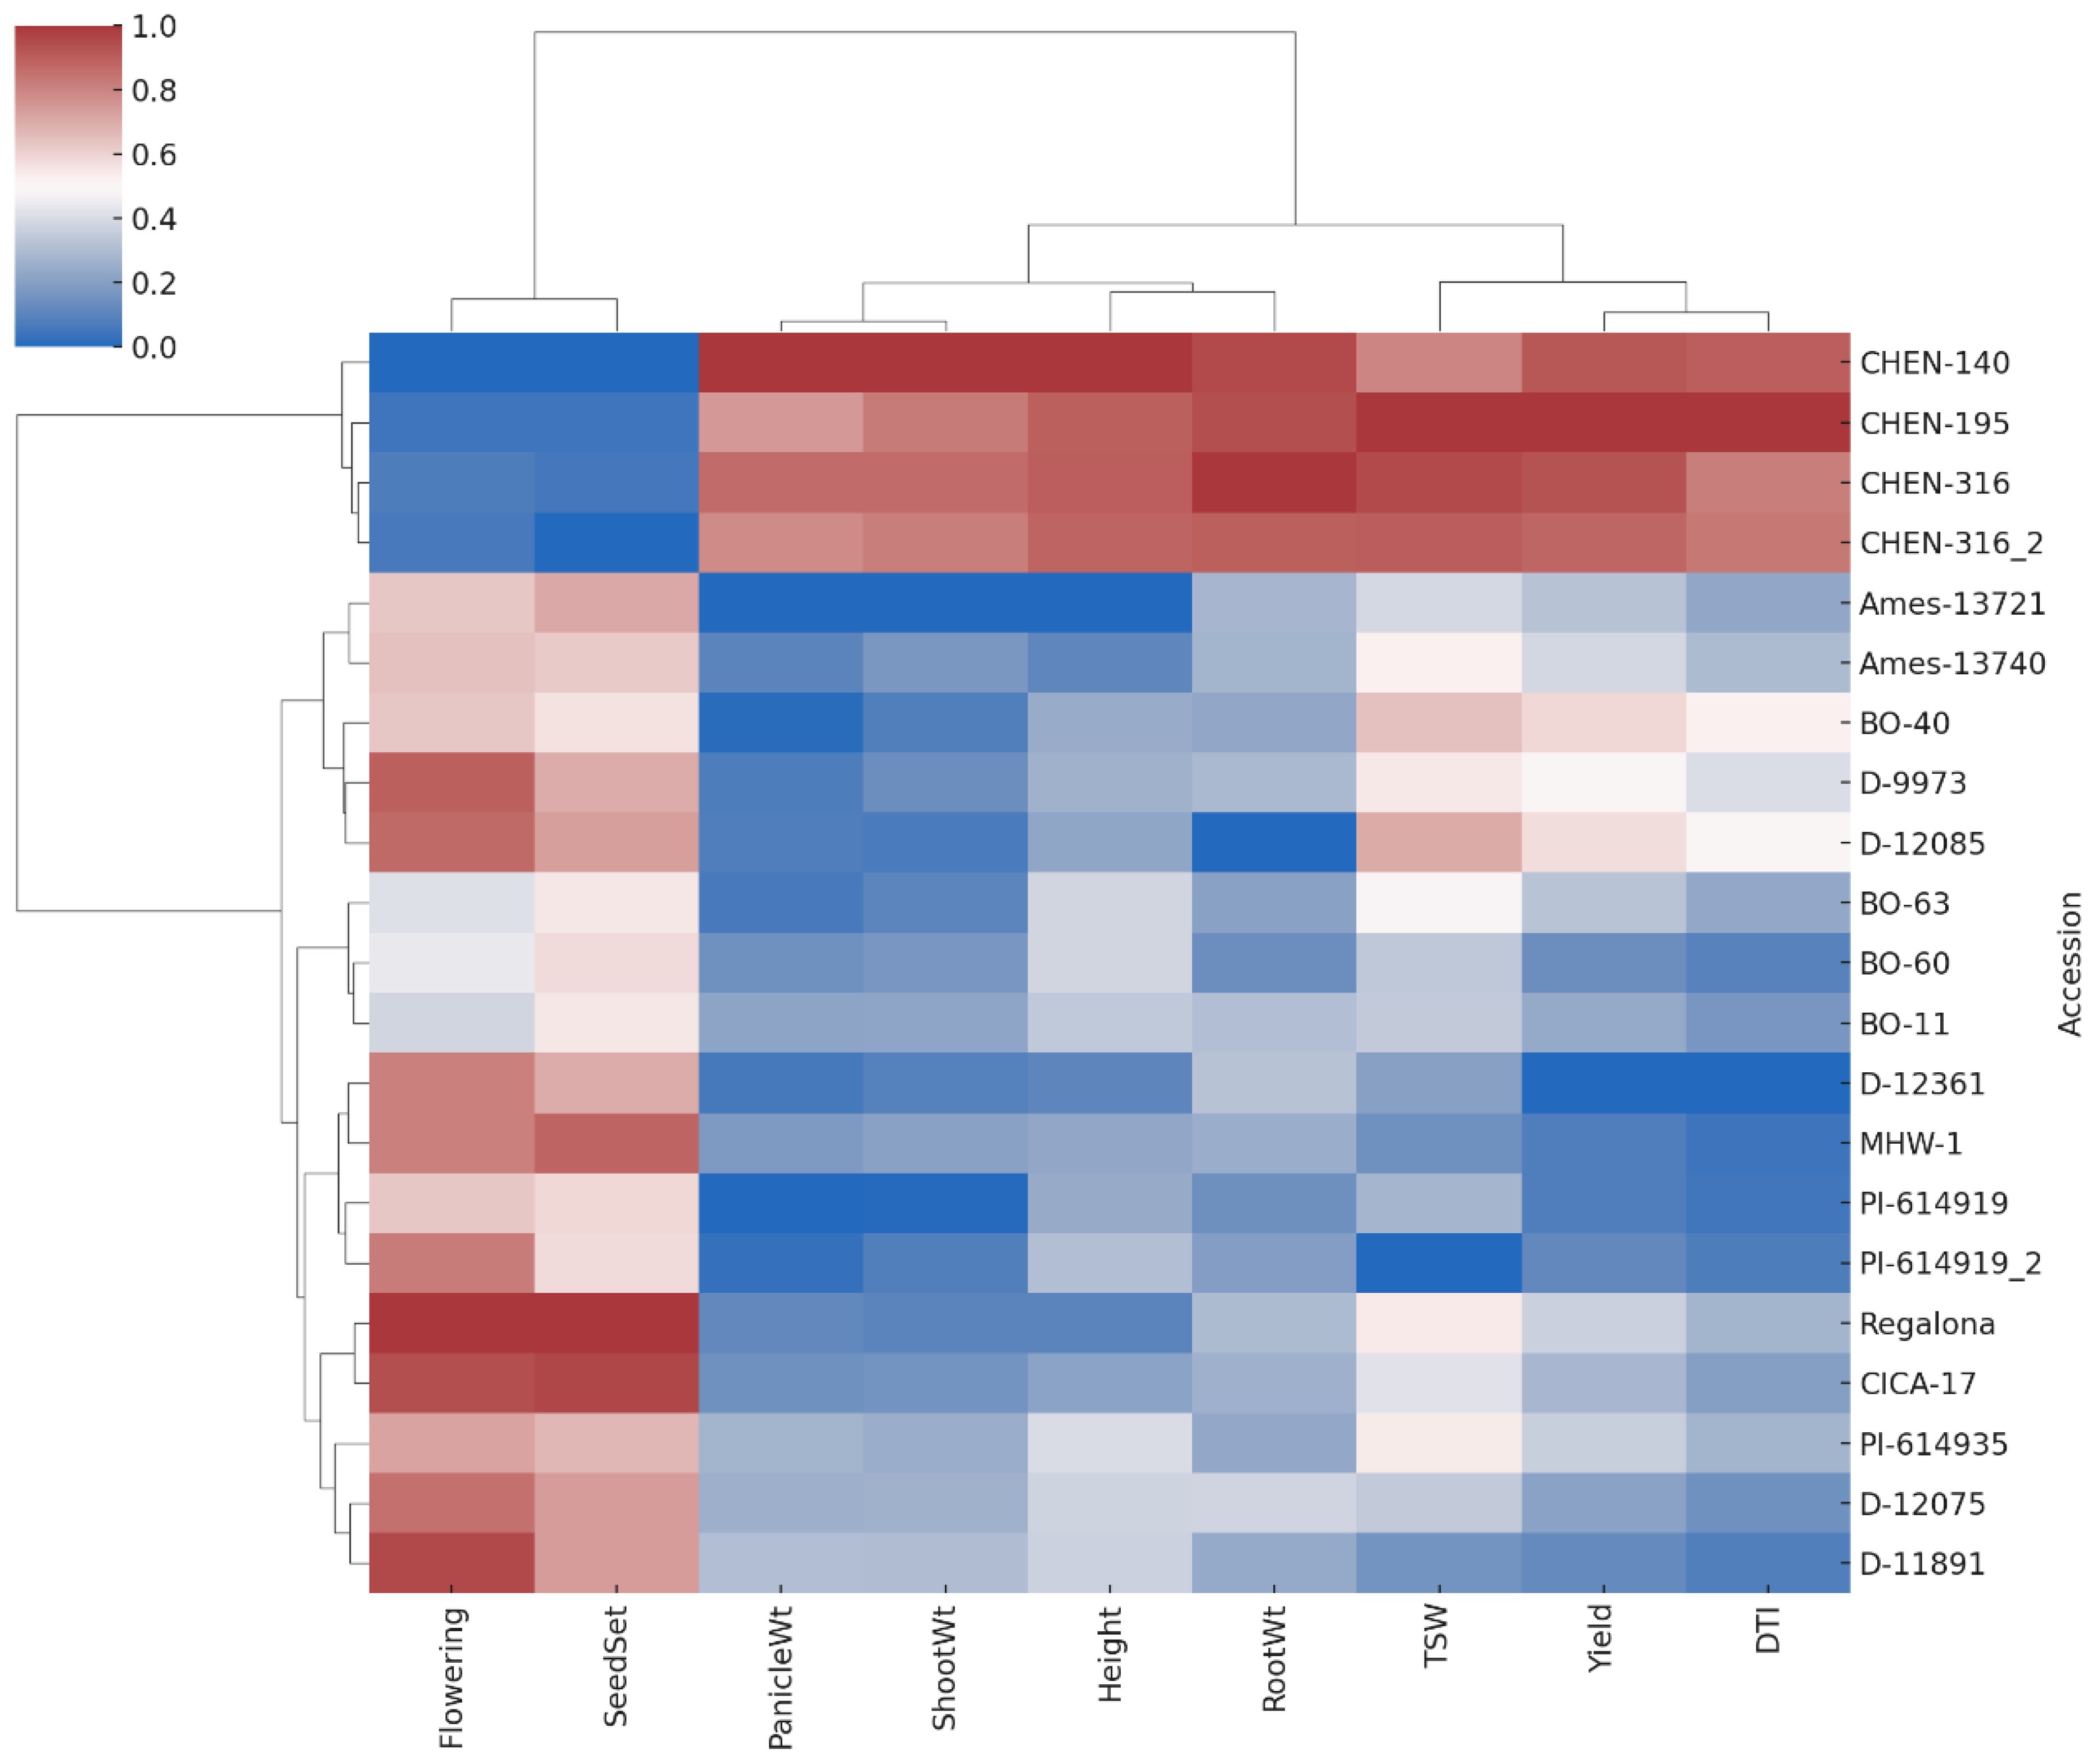
Figure 8. Heatmap with hierarchical clustering of standardized trait values for 21 quinoa accessions across nine agronomic and yield traits. Accessions and traits were clustered using Ward’s method and Euclidean distance. Red shades indicate higher trait values, while blue shades indicate lower values. Clustering reveals groupings of accessions with similar performance profiles under arid conditions.
Conclusion
This study evaluated the performance of 21 quinoa accessions under three irrigation regimes (W1: 15 min twice/day, W2: 10 min twice/day, and W3: 5 min twice/day) in arid conditions representative of central Saudi Arabia. The results demonstrated significant genotypic variation and strong genotype × irrigation interactions across phenological, physiological, and yield-related traits. Accessions such as CHEN-195, CHEN-316, and CHEN-140 consistently outperformed others, exhibiting superior chlorophyll stability, biomass accumulation, seed yield, and drought tolerance indices. Their physiological plasticity, delayed senescence, and sustained photosynthetic capacity highlight robust adaptability to both full and deficit irrigation. While W1 generally promoted maximum biomass and yield, some accessions maintained yield stability under moderate (W2) and even limited (W3) irrigation, underscoring their suitability for water-saving cultivation strategies in water-scarce regions. The integration of PCA and clustered heatmap analysis further revealed clear multivariate trait associations, confirming their utility as selection tools for identifying resilient genotypes. These findings have practical implications for breeding and cultivation: CHEN-195, CHEN-316, and CHEN-140 represent promising genetic resources for developing high-yielding, water-efficient quinoa cultivars tailored to arid and semi-arid environments. Their use could enhance food security while reducing irrigation demands in climate-vulnerable regions. While this study revealed substantial variation in quinoa responses to irrigation regimes, several aspects warrant further exploration. The physiological and genetic mechanisms underlying the observed genotype × irrigation interactions remain unclear, and integrating molecular, physiological, and genomic studies would provide deeper insights into the basis of drought resilience. Moreover, although yield tolerance (YTI) and drought tolerance indices (DTI) proved useful in differentiating accessions, their robustness should be validated across broader environments and in conjunction with additional stress indices. Expanding future research to include high-throughput phenotyping, physiological modeling, and marker-assisted or genomic selection will enhance the precision of trait-based breeding. Finally, scaling up promising accessions such as CHEN-195, CHEN-316, and CHEN-140 in multi-environment, farmer-oriented trials will be crucial to confirm their suitability for water-saving strategies and to accelerate the development of resilient, high-yielding quinoa cultivars tailored to arid and semi-arid agro-ecosystems.
Data availability statement
The original contributions presented in the study are included in the article/Supplementary Material. Further inquiries can be directed to the corresponding author
Author contributions
MM: Conceptualization, Data curation, Formal analysis, Funding acquisition, Investigation, Methodology, Project administration, Resources, Software, Supervision, Validation, Visualization, Writing – original draft, Writing – review & editing. KA: Conceptualization, Investigation, Methodology, Project administration, Supervision, Validation, Writing – review & editing. AA: Writing – review & editing, Conceptualization, Data curation, Formal analysis, Investigation, Methodology, Software, Validation. NA: Data curation, Formal analysis, Investigation, Methodology, Software, Writing – original draft. ME: Conceptualization, Data curation, Formal analysis, Investigation, Methodology, Software, Writing – original draft.
Funding
The author(s) declare financial support was received for the research and/or publication of this article. The Deanship of Scientific Research (DSR) at King Abdulaziz University, Jeddah, Saudi Arabia, under grant no. (IPP:170-155-2025).
Acknowledgments
This project was funded by the Deanship of Scientific Research (DSR) at King Abdulaziz University, Jeddah, Saudi Arbia under grant no. (IPP:170-155-2025). The authors, therefore, acknowledge with thanks DSR for technical and financial support.
Conflict of interest
The authors declare that the research was conducted in the absence of any commercial or financial relationships that could be construed as a potential conflict of interest.
Generative AI statement
The author(s) declare that no Generative AI was used in the creation of this manuscript.
Any alternative text (alt text) provided alongside figures in this article has been generated by Frontiers with the support of artificial intelligence and reasonable efforts have been made to ensure accuracy, including review by the authors wherever possible. If you identify any issues, please contact us.
Publisher’s note
All claims expressed in this article are solely those of the authors and do not necessarily represent those of their affiliated organizations, or those of the publisher, the editors and the reviewers. Any product that may be evaluated in this article, or claim that may be made by its manufacturer, is not guaranteed or endorsed by the publisher.
Supplementary material
The Supplementary Material for this article can be found online at: https://www.frontiersin.org/articles/10.3389/fpls.2025.1679444/full#supplementary-material
References
AbdElgalil, A. A., Alghabari, F., El-Maghraby, M. A., and Alghamdi, S. S. (2023). Morphological and physiological traits associated with drought tolerance in quinoa under arid conditions. J. Plant Res. 136, 249–261. doi: 10.1007/s10265-022-01394-2
Abdella, K. A., Alghabari, F., Al-Dakheel, A. J., and Alghamdi, S. S. (2024). Assessment of water scarcity and agricultural sustainability in arid regions. Agric. Water Manage. 286, 108315. doi: 10.1016/j.agwat.2023.108315
Adams, R. T., Hinojosa, L., and Murphy, K. M. (2020). Agronomic performance and physiological response of diverse quinoa genotypes under drought stress. Field Crops Res. 249, 107760. doi: 10.1016/j.fcr.2020.107760
Afzal, I., Hussain, S., Basra, S. M. A., and Rehman, H. U. (2022). Quinoa: A multipurpose crop for food and nutritional security in marginal environments. Plant Physiol. Rep. 27, 23–36. doi: 10.1007/s40502-021-00611-4
Alandia, G., Pulvento, C., Poschlod, P., and Jacobsen, S. E. (2021). Climate-resilient quinoa for a changing world. Plant Physiol. Rep. 26, 653–667. doi: 10.1007/s40502-021-00603-4
Alandia, G., Rodriguez, J. P., Jacobsen, S. E., Bazile, D., and Condori, B. (2020). Global expansion of quinoa and challenges for the Andean region. Global Food Secur. 26, 100429. doi: 10.1016/j.gfs.2020.100429
Alghamdi, A. S., Khan, M. A., and Alzahrani, D. A. (2018). Response of quinoa to water stress under Saudi desert conditions. Saudi J. Biol. Sci. 25, 1357–1362. doi: 10.1016/j.sjbs.2018.01.001, PMID: 31516351
Alghanem, S. M., Ahmed, A. H., and Al Harbi, A. M. (2021). Phenotypic evaluation of quinoa genotypes under drought stress. J. Arid Environments 184, 104310. doi: 10.1016/j.jaridenv.2020.104310
Almazroui, M. (2020). Rainfall trends and extremes in Saudi Arabia in recent decades. Atmosphere 11, 964. doi: 10.3390/atmos11090964
Al-Naggar, A. M., Shabana, R., and El-Maghraby, M. A. (2020). Performance of quinoa genotypes under arid environments in Egypt. Egyptian J. Agron. 42, 283–296. doi: 10.21608/agro.2020.26055.1215
Alrwis, N., Alazba, A., and Al-Ghobari, H. (2021). Enhancing agricultural sustainability through water-saving technologies in Saudi Arabia. Sustainability 13, 3179. doi: 10.3390/su13063179
Alvar-Beltrán, J., Hinojosa, L., Sanad, M. N. M. E., Jarvis, D. E., and Murphy, K. M. (2019). Response to drought stress in quinoa (Chenopodium quinoa Willd.): Phenology, physiology, and yield components. Genes 10, 448. doi: 10.3390/genes10060448, PMID: 31200546
Al-Zahrani, M. and Khan, M. A. (2023). Towards sustainable water resources management considering climate change in the case of Saudi Arabia. Sustainability 15, 14674. doi: 10.3390/su152014674
Bazile, D., Jacobsen, S. E., and Verniau, A. (2016). The global expansion of quinoa: Trends and limits. Front. Plant Sci. 7. doi: 10.3389/fpls.2016.00622, PMID: 27242826
Benešová, M., Holá, D., Fischer, L., Jedelský, P. L., Hnilička, F., Wilhelmová, N., et al. (2012). The physiology and proteomics of drought tolerance in maize: Early stomatal closure as a cause of lower tolerance to short-term dehydration? PloS One 7, e38017. doi: 10.1371/journal.pone.0038017, PMID: 22719860
Benlhabib, O., Boujartani, N., and Maataoui, A. (2016). Quinoa performance in Moroccan marginal areas. Cereal Chem. 93, 333–338. doi: 10.1094/CCHEM-08-15-0166-R
Bertero, H. D., de la Vega, A. J., Correa, G., Jacobsen, S. E., and Mujica, A. (2004). Genotype and genotype-by-environment interaction effects for grain yield and grain size of quinoa (Chenopodium quinoa) grown in multi-environmental trials. Field Crops Res. 89, 299–318. doi: 10.1016/j.fcr.2004.02.006
Bhargava, A., Shukla, S., and Ohri, D. (2007). Genetic variability and interrelationship among various morphological and quality traits in Chenopodium quinoa Willd. Field Crops Res. 101, 104–116. doi: 10.1016/j.fcr.2006.10.001
Bhusal, N., Han, S. G., Yoon, T. M., Han, J. G., and Sung, J. K. (2019). Evaluation of morphological, physiological and biochemical traits for drought tolerance in tomato. J. Plant Interact. 14, 245–257. doi: 10.1080/17429145.2019.1619810
Choukr-Allah, R., Rao, N. K., Hirich, A., Shahid, M., Alshankiti, A., Toderich, K., et al. (2016). Quinoa for marginal environments: Toward future food and nutritional security in MENA and Central Asia regions. Front. Plant Sci. 7. doi: 10.3389/fpls.2016.00346, PMID: 27066019
Dabravolski, S. A. and Isayenkov, S. V. (2023). The Role of Anthocyanins in Plant Tolerance to Drought and Salt Stresses. Plants, 12(13), 2558. doi: 10.3390/plants12132558, PMID: 37447119
El-Harty, E. H., Ghazy, A., Al Ateeq, T. K., Al-Faifi, S. A., Khan Altaf, M., Afzal, M., et al. (2021). “Morphological and Molecular Characterization of Quinoa Genotypes.” Agriculture 11(4), 286. doi: 10.3390/agriculture11040286
Fghire, R., Ali, O. I. E., Anaya, F., Benlhabib, O., Ragab, R., and Wahbi, S. (2015). Physiological and agronomic responses of quinoa to drought stress. J. Agron. Crop Sci. 201, 390–404. doi: 10.1111/jac.12114
Frimpong, F., Asante, M. D., Peprah, C. O., Amankwaa-Yeboah, P., Danquah, E. O., Ribeiro, P. F., et al. (2023). Water-smart farming: review of strategies, technologies, and practices for sustainable agricultural water management in a changing climate in West Africa. Front. Sustain. Food Syst. 7. doi: 10.3389/fsufs.2023.1110179
Geerts, S., Raes, D., Garcia, M., Del Castillo, C., and Buytaert, W. (2008). Response of quinoa (Chenopodium quinoa Willd.) to differential irrigation strategies in the Bolivian Altiplano. Agric. Water Manage. 95, 894–908. doi: 10.1016/j.agwat.2008.03.002
González, J. A., Eisa, S. S., Hussin, S. A. E., and Prado, F. E. (2021). Quinoa: A multipurpose crop in the context of climate change. Plant Stress 1, 100008. doi: 10.1016/j.stress.2021.100008
Hafeez, M. N., Shah, A. N., and Mubeen, M. (2022). Genetic diversity in flowering time and yield traits among quinoa genotypes under heat and drought stress. J. Crop Improvement 36, 83–99. doi: 10.1080/15427528.2021.1984604
Hejazi, M., Santos Da Silva, S. R., Miralles-Wilhelm, F., Kim, S., Kyle, P., Liu, Z., et al. (2023). Impacts of water scarcity on agricultural production and electricity generation in the Middle East and North Africa. Front. Environ. Sci. 11. doi: 10.3389/fenvs.2023.1082930
Hinojosa, L., González, J. A., Barrios-Masias, F. H., Fuentes, F., and Murphy, K. M. (2018). Quinoa abiotic stress responses: A review. Plants 7, 106. doi: 10.3390/plants7040106, PMID: 30501077
Hinojosa, L., Sanad Golshani, F., Kumar, N., Gill, K. S., and Murphy, K. M. (2019). Spectral reflectance indices and physiological traits in quinoa under contrasting irrigation treatments. Field Crops Res. 230, 66–75. doi: 10.1016/j.fcr.2018.10.007
Husson, F., Josse, J., Le, S., and Mazet, J. (2017). FactoMineR: Multivariate Exploratory Data Analysis and Data Mining. R package version 1.41. Comprehensive R Archive Network (CRAN). Available online at: https://CRAN.R-project.org/package=FactoMineR.
Jacobsen, S. E., Monteros, C., Corcuera, L. J., Bravo, L. A., Christiansen, J. L., and Mujica, A. (2009). Frost resistance mechanisms in quinoa (Chenopodium quinoa Willd.). Eur. J. Agron. 30, 299–305. doi: 10.1016/j.eja.2008.12.003
Jacobsen, S. E., Mujica, A., and Jensen, C. R. (2003). The resistance of quinoa (Chenopodium quinoa Willd.) to adverse abiotic factors. Food Rev. Int. 19, 99–109. doi: 10.1081/FRI-120018872
Jiang, Y., Zhao, Y., Ma, Z., Fu, X., Huang, L., and Yang, C. (2021). UAV-based high-throughput phenotyping reveals genotype-by-environment interaction of quinoa under drought. Remote Sens. 13, 936. doi: 10.3390/rs13050936
Jiang, J., Johansen, K., Stanschewski, C. S., Wellman, G., Mousa, M. A. A., Fiene, G. M., et al. (2022). Phenotyping a diversity panel of quinoa using UAV-retrieved leaf area index, SPAD-based chlorophyll and a random forest approach. Precision Agriculture, 23(3), 961–983. doi: 10.1007/s11119-021-09870-3
KAUST Germplasm Collection (2023). Germplasm database records (Thuwal, Saudi Arabia: King Abdullah University of Science and Technology (KAUST).
Kiani, M., Abbasi, A. R., and Khavari-Nejad, R. A. (2021). Antioxidative responses and physiological adaptation of quinoa to water deficit. Physiol. Mol. Biol. Plants 27, 1895–1905. doi: 10.1007/s12298-021-01017-1
Lahham, N., Mateo-Sagasta, J., Orabi, M. O. M., and Brouziyne, Y. (2022). Water reuse in the Middle East and North Africa: A sourcebook (Rome, Italy: Food and Agriculture Organization of the United Nations (FAO) and International Water Management Institute (IWMI).
Marengo, J. A., Galdos, M. V., Challinor, A., Cunha, A. P., Marin, F. R., MdS, V., et al. (2021). Drought in Northeast Brazil: a review of agricultural and policy adaptation options for food security. Climate Resilience Sustainability 1, 1–20. doi: 10.1002/cli2.17
Mirsafi, S. M., Sepaskhah, A. R., and Ahmadi, S. H. (2024). Physiological traits, crop growth, and grain quality of quinoa in response to deficit irrigation and planting methods. BMC Plant Biology, 24, 809. doi: 10.1186/s12870-024-05523-5, PMID: 39198743
Morales, A. J., Vega-Gálvez, A., Uribe, E., and Pastén, A. (2022). Photosynthetic responses and yield stability of quinoa (Chenopodium quinoa Willd.) under regulated deficit irrigation. Agronomy 12, 708. doi: 10.3390/agronomy12030708
Multsch, S., Al-Rhumikhani, Y. A., and Frede, H. G. (2017). Integrated water resources management in arid regions: The case of Saudi Arabia. Water 9, 945. doi: 10.3390/w9120945
Nanduri, U., Al-Mashaqbeh, I. A., and Salim, B. (2019). Water scarcity in the Middle East and North Africa: Challenges and solutions. Water Resour. Econ 28, 100136. doi: 10.1016/j.wre.2019.100136
Odokonyero, K., Vernooij, B., Albar, B., Exposito, L. O., Alsamdani, A., Haider, A. A. G., et al. (2024). Superhydrophobic sand mulch and date palm biochar boost growth of Moringa oleifera in sandy soils via enhanced irrigation and nutrient use efficiency. Frontiers in Plant Science, 15, 1434462. doi: 10.3389/fpls.2024.1434462, PMID: 39659422
Peterson, A. and Murphy, K. M. (2015). Tolerance of quinoa cultivars to salinity and deficit irrigation. J. Agron. Crop Sci. 201, 390–401. doi: 10.1111/jac.12110
Razzaghi, F., Plauborg, F., Ahmadi, S. H., Jacobsen, S. E., and Andersen, M. N. (2020). Drought stress responses of quinoa genotypes under field conditions. Agric. Water Manage. 236, 106137. doi: 10.1016/j.agwat.2020.106137
Repo-Carrasco, R., Espinoza, C., and Jacobsen, S. E. (2003). Nutritional value and use of the Andean crops quinoa (Chenopodium quinoa) and kañiwa (Chenopodium pallidicaule). Food Rev. Int. 19, 179–182. doi: 10.1081/FRI-120018884
Rojas, W., Pinto, M., Alanoca, C., Gómez-Pando, L., León-Lobos, P., Alercia, A., et al. (2015). “Quinoa genetic resources and ex situ conservation,” in State of the art report on quinoa around the world in 2013. Eds. Bazile, D., Bertero, D., and Nieto, C. (FAO & CIRAD, Rome), 56–82. Available online at: http://www.fao.org/3/i4042e/i4042e.pdf (Accessed April 2, 2025).
Ruiz, K. B., Bertero, D., and Jacobsen, S. E. (2023). Advances in quinoa drought adaptation research: Insights into plant performance under dryland conditions. Plant Sci. 329, 111582. doi: 10.1016/j.plantsci.2023.111582
Saad-Allah, K. M. and Youssef, T. (2018). Flavonoid and anthocyanin profile changes in quinoa plants under drought stress. Biol. Plantarum 62, 152–158. doi: 10.1007/s10535-017-0747-7
Shams, A. S. (2022). Evaluation of quinoa genotypes under water deficit conditions in Saudi Arabia. Arabian J. Plant Sci. 4, 201–211.
Stanschewski, C., Stanturf, J. A., and Ristow, M. (2021). Toward standardized phenotyping of quinoa under abiotic stress. Plant Methods 17, 123. doi: 10.1186/s13007-021-00785-7
Stikic, R., Glamoclija, D., Demin, M., Vucelic-Radovic, B., Jovanovic, Z., Milojkovic-Opsenica, D., et al. (2012). Agronomical and nutritional evaluation of quinoa seeds (Chenopodium quinoa Willd.) as an ingredient in bread formulations. J. Cereal Sci. 55, 132–138. doi: 10.1016/j.jcs.2011.10.010
Taaime, N., Rafik, S., El Mejahed, K., Oukarroum, A., Choukr-Allah, R., Bouabid, R., et al. (2023). Worldwide development of agronomic management practices for quinoa cultivation: A systematic review. Front. Agron. 5. doi: 10.3389/fagro.2023.1215441
USDA GRIN (2020). Germplasm resources information network (GRIN) (United States Department of Agriculture, Agricultural Research Service). Available online at: https://npgsweb.ars-grin.gov/ (Accessed July 15, 2025).
Wang, S., Bai, Y., and Liu, J. (2020). Physiological and antioxidant responses of quinoa to drought stress. Agronomy 10, 1282. doi: 10.3390/agronomy10091282
Zurita Silva, A., Fuentes, F., Zamora, P., Jacobsen, S. E., and Schwember, A. R. (2015a). Breeding quinoa (Chenopodium quinoa Willd.): Potential and perspectives. Mol. Breeding. 35, 39. doi: 10.1007/s11032-015-0263-1
Keywords: quinoa, drought tolerance, irrigation regimes, seed yield, chlorophyll, PCA, arid agriculture, genotypic variation
Citation: Mousa MAA, Asiry KA, Al-qurashi AD, Almasoudi NM and Elsayed MI (2025) Genotypic variation in yield, physiological traits, and drought tolerance of quinoa (Chenopodium quinoa Willd.) under arid conditions. Front. Plant Sci. 16:1679444. doi: 10.3389/fpls.2025.1679444
Received: 04 August 2025; Accepted: 02 October 2025;
Published: 18 November 2025.
Edited by:
Maharajan Theivanayagam, Pohang University of Science and Technology, Republic of KoreaReviewed by:
Shakeel Ahmad Jatoi, Pakistan Agricultural Research Council, PakistanZahra Dehghanian, Azarbaijan Shahid Madani University, Iran
Copyright © 2025 Mousa, Asiry, Al-qurashi, Almasoudi and Elsayed. This is an open-access article distributed under the terms of the Creative Commons Attribution License (CC BY). The use, distribution or reproduction in other forums is permitted, provided the original author(s) and the copyright owner(s) are credited and that the original publication in this journal is cited, in accordance with accepted academic practice. No use, distribution or reproduction is permitted which does not comply with these terms.
*Correspondence: Magdi A. A. Mousa, bWFtb3VzYUBrYXUuZWR1LnNh