 Umar Akram1
 Ali Ahmad2
 Muhammad Nadeem Shah3,4
 Furqan Ahmad1
 Muhammad Baber2
 Muhammad Tanveer Altaf5
 Muhammad Aneeq Ur Rahman6
 Önder Albayrak5*
- 1Institute of Plant Breeding and Biotechnology, Muhammad Nawaz Shareef University of Agriculture Multan, Multan, Pakistan
- 2Institute of Molecular Biology and Biotechnology, Bahauddin Zakariya University, Multan, Pakistan
- 3Indiana Wesleyan University, Merrillville, IN, United States
- 4Department of Agriculture, Government College University Lahore, Lahore, Pakistan
- 5Department of Field Crops, Faculty of Agriculture, Recep Tayyip Erdoğan University, Rize/Pazar, Türkiye
- 6Biotechnology Research Institute, Graduate School of Chinese Academy of Agricultural Sciences, Beijing, China
Voltage-dependent anion channels (VDACs) are proteins present at the outer membrane of mitochondria that are involved in stress response, such as drought and salt, signal transduction, and cellular metabolism. The role of the VDAC gene family in other crops has been identified, but its role in cotton has been uncharacterized. In this study, a genome-wide study was conducted in upland cotton (G. hirsutum L.) under drought and salt stresses. We identified 18 GhVDAC genes and mapped them using the MG2C online tool. The random distribution of GhVDAC genes was determined using the GSDS server for their intron-exon structure. Phylogenetic analysis using MEGA. 11 software constructed the phylogenetic tree by the maximum likelihood method of 14 different species with 66 VDAC genes, which were distributed across four clades. All p. patens VDAC genes were present in a single clade, and 10 GhVDAC genes were found in clade IV. Ten motifs were identified, and motif 9 was absent in GhVDAC3, GhVDAC9, GhVDAC10, GhVDAC11, and GhVDAC18. Motif 10 was present in only two genes, GhVDAC5 and GhVDAC14. Promoter analysis revealed cis-elements involved in hormone and stress response. Synteny and circos analysis revealed orthologous gene duplication events and evolutionary relationships. In-silico expression mapping was used to identify candidate genes, and then qRT-PCR was done for validation of GhVDAC6, GhVDAC11, GhVDAC13, and GhVDAC15 genes. In conclusion, this is a genome-wide study on the VDAC gene family in cotton under drought and salt stress that provides insights into their structure, evolutionary relationship, and molecular mechanism, and this study lays the theoretical foundation for future breeding programs to develop resistant crops for drought and salt stress.
1 Introduction
Gossypium hirsutum L. is a widely cultivated cotton crop variety that produces 90% of the fiber among all cotton species (Li et al., 2022). Due to harsh environmental conditions, the yield and quality of cotton crop need to be improved (Liu et al., 2021). Almost 60 different countries produce cotton around the globe, and it is the third-largest crop after canola and soybeans. After China, India, the USA, and Brazil, Pakistan is the 5th largest producer of cotton in the world that accounting for about 40% of the industrial sector accounts cotton (Raza et al., 2023; Khan et al., 2024). Cotton production has always been hindered due to several environmental stresses, such as salt, drought, inadequate water resources, and high temperatures, but salinity and drought stresses are the major stresses that influence the yield (Naresh et al., 2024).
As the population is increasing, there is a need to produce crops globally, as the crop production demand has increased at least by 40% in arid and semi-arid areas (Pennisi, 2008). But climate change is the biggest challenge for crop production, which can lead to severe abiotic and biotic stresses (Nakashima et al., 2014; Shaar-Moshe et al., 2017). Salt stress affects almost one billion hectares of semi-arid and dry regions around the world, and it is responsible for low cotton yield, which decreases production by about 50-60%. Under salt stress, the Na+/Cl level increases and disrupts the natural defense system of plants (Munns and Tester, 2008; Jain et al., 2024). On the other hand, water is essential for every crop at every stage, from seed germination to maturity. The terminology “drought” refers to the reduced groundwater and rainfall availability with the rise in temperature. When crops are exposed to drought stress, several parameters are disrupted, such as reduced photosynthesis, cell shrinkage, and leaf rolling, which ultimately lead to wilting, thus leading to plant death (Joshi et al., 2016). Drought can cause anatomical, physiological, and morphological disturbance among all crops especially in cotton, which results in lower yield (Farooq et al., 2008; Saleem et al., 2016; Haj Sghaier et al., 2022). In response to drought stress, plants regulate gene expression via complex transcriptional networks (Singh and Laxmi, 2015). Thus, it is important to develop transgenic stress-resilient crops to sustain crop production globally.
Voltage-dependent anion-selective channel (VDAC) genes are mitochondrial proteins that comprise almost 30% of the mitochondrial area in eukaryotic organisms. The VDAC genes are involved in environmental and developmental stresses such as drought and salt (Takahashi and Tateda, 2013; Ashraf et al., 2021). To maintain homeostasis during drought and salt stress, these genes regulate the transport of metabolites. The VDAC proteins interact with several other proteins for gene regulation in mitochondria and the cytoplasm (Gonçalves et al., 2007). Reactive oxygen species (ROS) can be induced via high accumulation of ROS pathways under abiotic stresses, which leads to programmed cell death (PCD) due to the high accumulation of ROS (Ying et al., 2008; Suzuki et al., 2011; Dietz et al., 2016; Nadarajah, 2020; Sohaib et al., 2023). An enzyme, nucleoredoxin 1, is a member of the thioredoxin family, is responsible for the to protect the detoxifying enzymes from oxidative stress (Mittler, 2002). The recent VDAC gene study on Arabidopsis showed that AtVDAC3 and thioredoxin are responsible for the regulation of ROS in plants (Zhang et al., 2015). Hence, this PCD, due to mitochondrial-mediated apoptosis, is also due to the VDAC genes (Yu et al., 2022).
Several genes, such as CDPK (Shi and Zhu, 2022), NHX (Akram et al., 2020), Box (Sun et al., 2023), SAMS (Kilwake et al., 2023), BASS (Myo et al., 2021), GDSL (Liu et al., 2023), and many more, are involved in different abiotic stresses in the cotton plant. Moreover, there are few studies on the VDAC gene family, like in tobacco (Yang et al., 2021), china rose (Ashrafei Kolteh et al., 2022), wheat (Yu et al., 2022), rice (Xu et al., 2015), beans (Saidani et al., 2016), pearl millet (Desai et al., 2006), and Arabidopsis (Yu et al., 2022), but still, the VDAC gene family in G. hirsutum L. remains unexplored.
In the current study, a genome-wide characterization study of the VDAC gene family in cotton under salt and drought stresses was performed. The PF01459 Pfam domain was used to identify candidate GhVDAC sequences to performvarious bioinformatic analyses, including subcellular localization, phylogenetic analysis, Protein-Protein Interaction (PPI), motif analysis, promoter analysis, synteny and circos analysis, in-silico expression analysis, and qRT-PCR. These analyses provide a better molecular function of the VDAC gene.
2 Materials and methods
2.1 Identification and sub-cellular localization of GhVDAC genes
The genomic, conserved domain sequences (CDS), and amino acid sequences were retrieved from the CottonMD database (https://yanglab.hzau.edu.cn/CottonMD.1) (Yang et al., 2023) after performing protein BLAST (BLASTP), and protein arabidopsis sequences were used as a query. GhVDAC genes with a score of >100 and an e-value of <10−5 were selected as candidate cotton genes for further analyses. HMMER 3.0 (https://www.ebi.ac.uk/Tools/hmmer/) (Finn et al., 2011) was used for the identification of VDAC genes in cotton by using PF01459 as a Pfam domain after confirming it through the SMART website (http://smart.embl-heidelberg.de) database (Letunic et al., 2021). The redundant sequences were removed from the files, and the obtained sequences were converted into FASTA format. The physiochemical properties of GhVDAC genes were extracted from the Expasy database (https://web.expasy.org/protparam/) (Gasteiger et al., 2003). Sub-cellular localization of GhVDAC genes was predicted through the WoLFPSORT database (https://wolfpsort.hgc.jp/) (Horton et al., 2007). All the parameters were set to default.
2.2 Chromosomal mapping, chromosome linkage, and gene structure analysis of GhVDAC genes
The exon-intron boundaries of GhVDAC genes were visualized using the Gene Structure Display Server (GSDS) (http://gsds.cbi.pku.edu.cn) (Hu et al., 2015) and MG2C (http://mg2c.iask.in/mg2c_v2.1/) databases (Chao et al., 2021), respectively.
2.3 Phylogenetic tree construction and visualization analysis
For constructing a phylogenetic tree of VDAC genes across different plant species, the maximum likelihood method (ML) with 1,000 bootstrap method was employed in MEGA.11 software (Felsenstein, 1981; Kumar et al., 2008). The multiple sequence alignment via MUSCLE (Edgar, 2004) was done for several plant species such as A. thaliana (At) from TAIR database (https://www.arabidopsis.org/) (Lamesch et al., 2012), G. hirsutum (Gh) and G. barbadense (Gb) from cottonmd database, G. arboreum (Ga) and G. raimondii from cottongen database (https://www.cottongen.org/) (Yu et al., 2014), P. patens (Pt), S. mollendorfii (Sm), T. cocao (Tc) and T. aestivium (Ta) Ensembl plant database (https://plants.ensembl.org/index.html) (Bolser et al., 2016), S. bicolor (Sb), O. sativa (Os) A. comosus (Ac), G. max (Gm), and Z. mays (Zm) from phytozome database (https://phytozome-next.jgi.doe.gov/) (Goodstein et al., 2012). Furthermore, the iTOL online tool (https://itol.embl.de/) (Letunic and Bork, 2016) was used for circular visualization of the tree.
2.4 Motif, protein–protein interaction, and promoter analysis of GhVDACs
After setting the total number of motifs to 10, the motifs of GhVDAC genes were found using the MEME suite (https://meme-suite.org/meme/tools/meme) database (Bailey et al., 2009). To analyze the protein interaction of GhVDAC genes, the STRING database (https://string-db.org/) was used (Szklarczyk et al., 2021). The promoter analysis of GhVDAC genes was done by using the PlantCare database (https://bioinformatics.psb.ugent.be/webtools/plantcare/html/) (Lescot et al., 2002) to find out different stress-responsive genes.
2.5 Synteny and circos plot construction of GhVDAC genes
The TbTools software (Chen et al., 2020) was used to visualize GhVDAC genes on corresponding chromosomes. The synteny analysis was performed among G. hirsutum, G. arboreum, G. raimondii, and A. thaliana using TbTools software. The MCScanX with ≤ 1 × 10⁻⁵ threshold e-value was used to calculate the duplication events (Wang et al., 2012).
2.6 Expression profiling and heatmap visualization
The in-silico expression data of drought and salt stress of GhVDAC genes were retrieved from the cottonmd database, and it was further confirmed by using the NCBI Geodataset (https://www.ncbi.nlm.nih.gov/bioproject/PRJNA490626 accessed on 1st May, 2025). The expression heatmap using FPKM values was generated using TbTools.
2.7 Primer design, RNA, cDNA synthesis, and qRT-PCR analysis
The TRIzol method (Rio et al., 2010) was used for RNA extraction of the candidate gene after designing the primer, and then the Thermofisher cDNA kit was used for cDNA synthesis. The specificity was determined by using the melting curve, and a student’s t-test analysis was done with a P<0.05 significance.
2.8 Salt and drought stress treatments for GhVDAC genes
For drought and salt stress in G. hirsutum, the TM-1 (Texas marker) cultivar of cotton was grown in 12 hours of light and 12 hours of dark conditions under greenhouse conditions. For salt stress, the 400mM salt was applied to 2-week-old plant leaves. The drought stress was applied by withholding water till the relative water content (RWC) reached about 7% in pots. The controls for NaCl and drought treatment remained the same, and no stress was applied. The second and third true leaves were used for qRT-PCR analysis. The samples were kept at -80°C after being snap-frozen in liquid nitrogen. The results of both salt and drought stress were checked after 0 hours, 3 hours, 12 hours, and 24 hours.
2.9 qRT-PCR analysis of GhVDAC genes
For qRT-PCR, BioRAD qPCR analyzer was used, and the cycles that were used are 95 °C for pre-denaturation for 30 seconds, 95 °C for denaturation for 5 seconds, annealing/extension till fluorescent signal, for 60 °C for 1 minute. Three biological replicates were analyzed, and relative expression of GhVDAC genes was calculated by the 2−△△Ct method (Livak and Schmittgen, 2001).
3 Results
3.1 Gene structure, subcellular localization, and chromosome mapping
The gene structure analysis through the GSDS server is represented by blue color boxes for upstream and downstream regions, a black line for introns, and red color boxes for CDS regions. The results of 18 GhVDAC genes are shown in Figure 1.
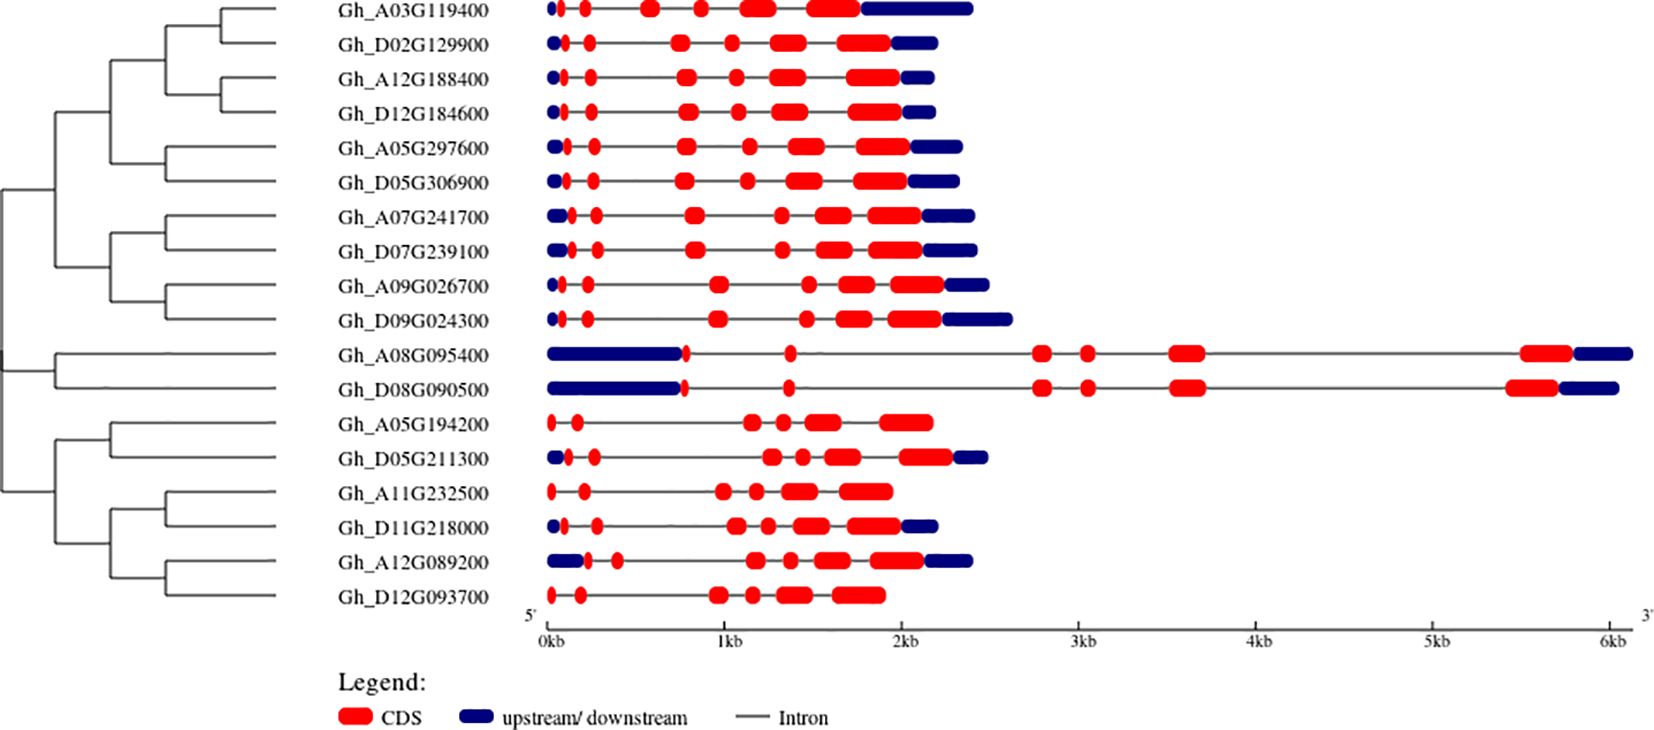
Figure 1. Structural representation of GhVDAC genes by using the GSDS server tool. The red color indicates the CDS region, and the black line indicates the intronic region. The Y-axis shows gene IDs in phylogenetic Tree order While the X-axis shows the length of genes in kilo base pairs (Kb).
The transcript IDs, gene names, molecular weight (MW), amino acid (A.A.) numbers, theoretical isoelectric point (PI), grand average of hydropathy (GRAVY), and predicted subcellular locations are represented in Table 1. The diagrammatic representation of the predicted subcellular locations of GhVDAC genes is shown in Figure 2.
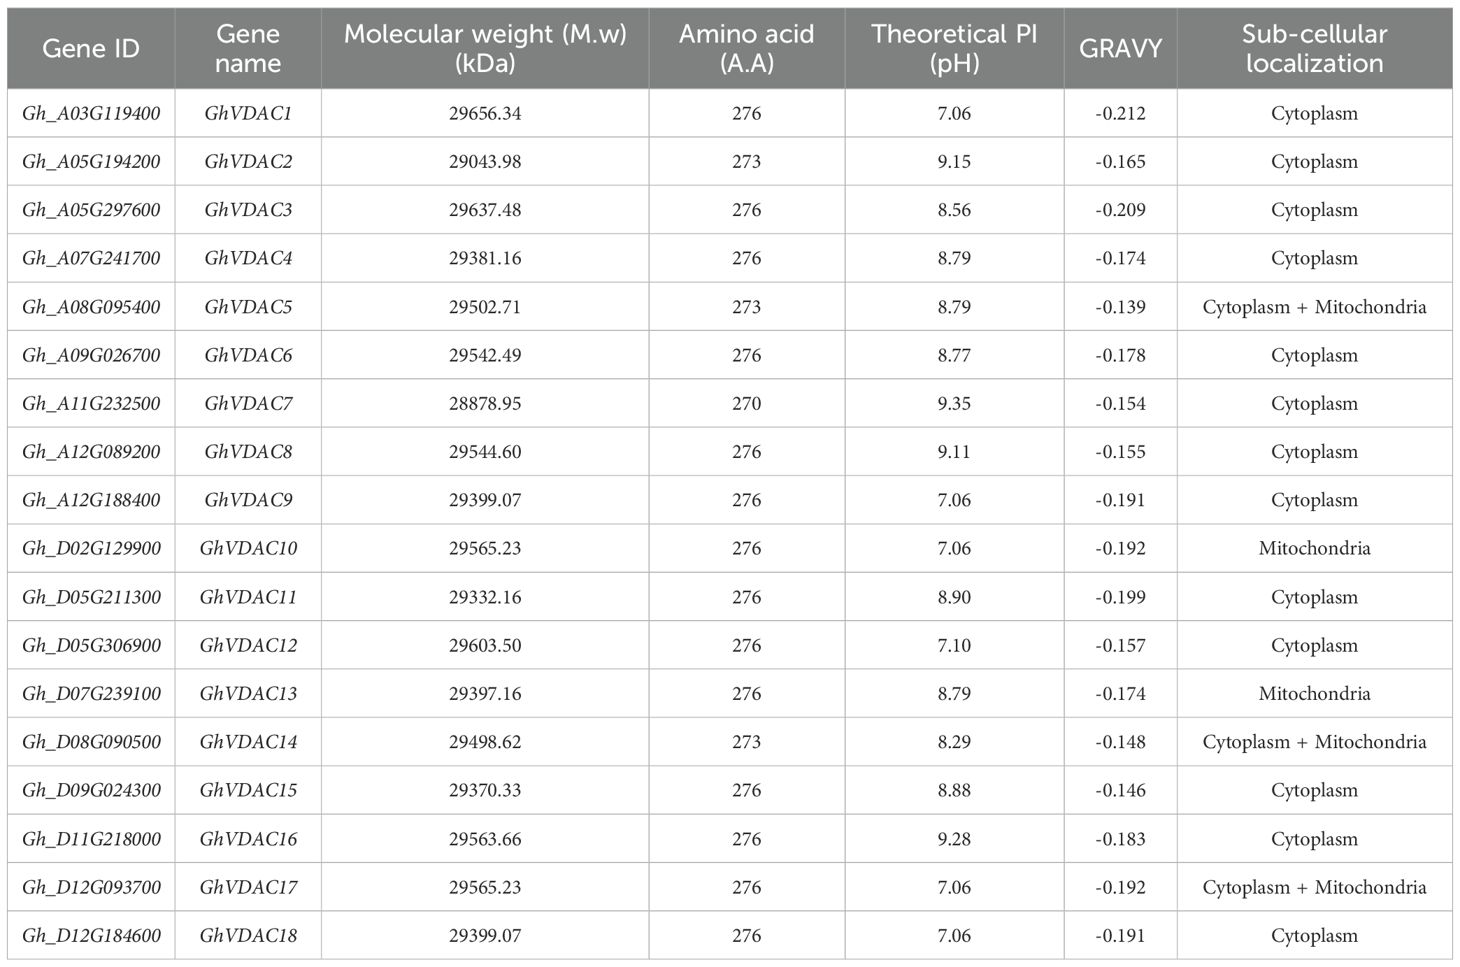
Table 1. Structural properties of GhVDAC genes.
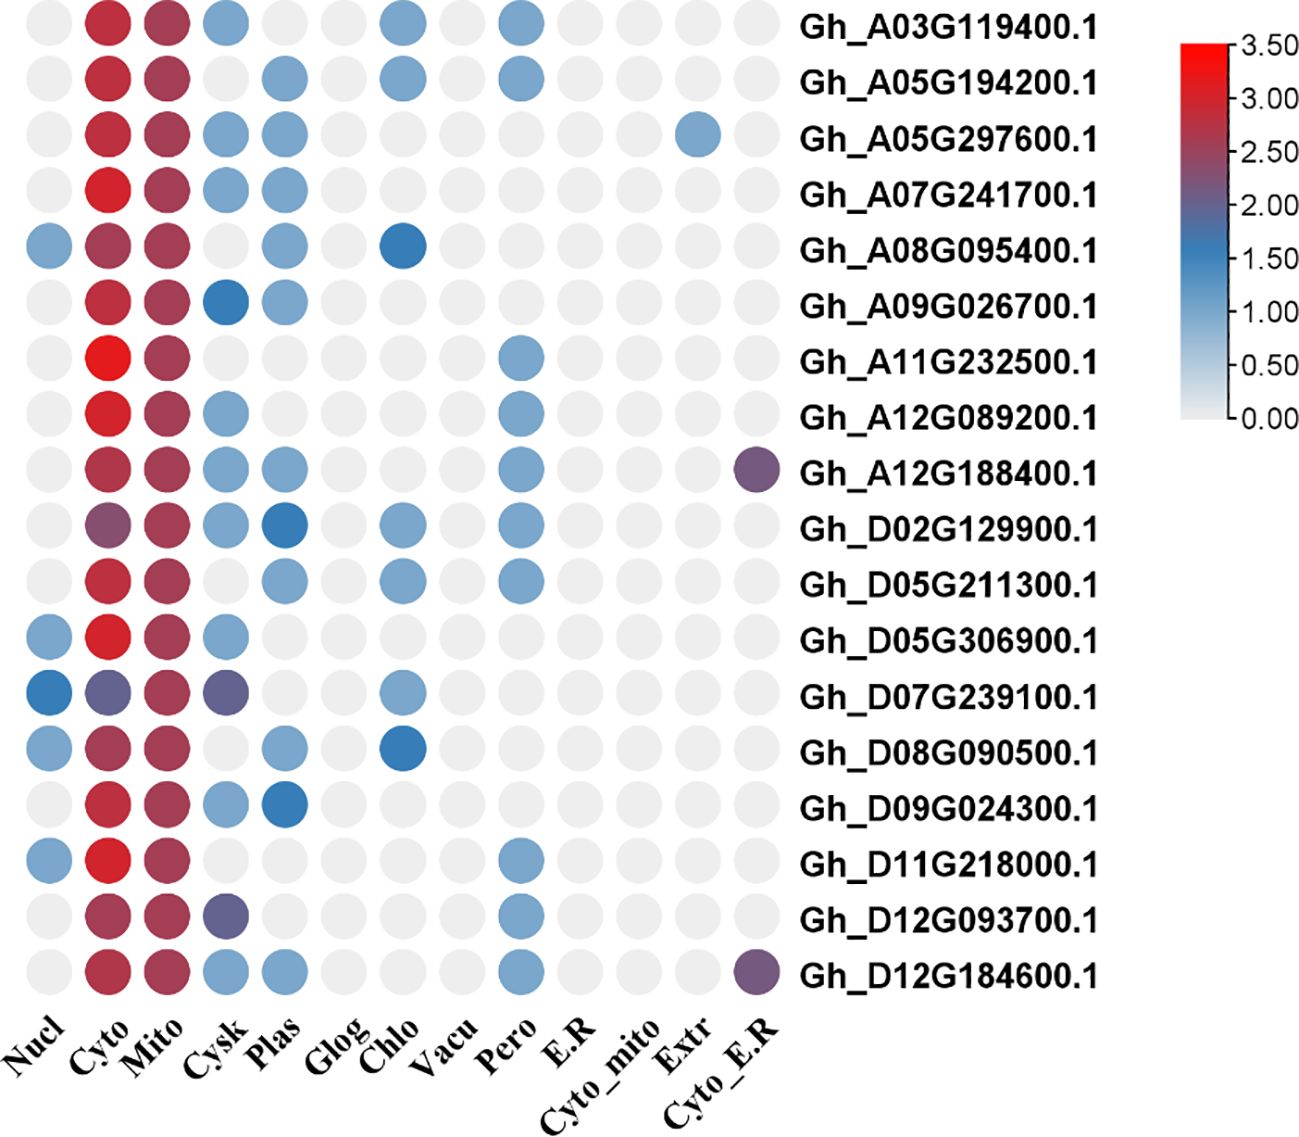
Figure 2. Sub-cellular localization of GhVDAC genes by using the WOLFPSORT database. The X-axis shows the cell organelle names while the Y-axis shows the gene IDs.
The cytoplasm had most genes present, and some genes were present in both, cytoplasm and mitochondria. The chromosome mapping of genes shows that A05, A12, and D12 chromosomes had two genes present on them, whereas all remaining chromosomes had a single gene present (Figure 3). The detailed file of subcellular localization is in Supplementary Table S1.
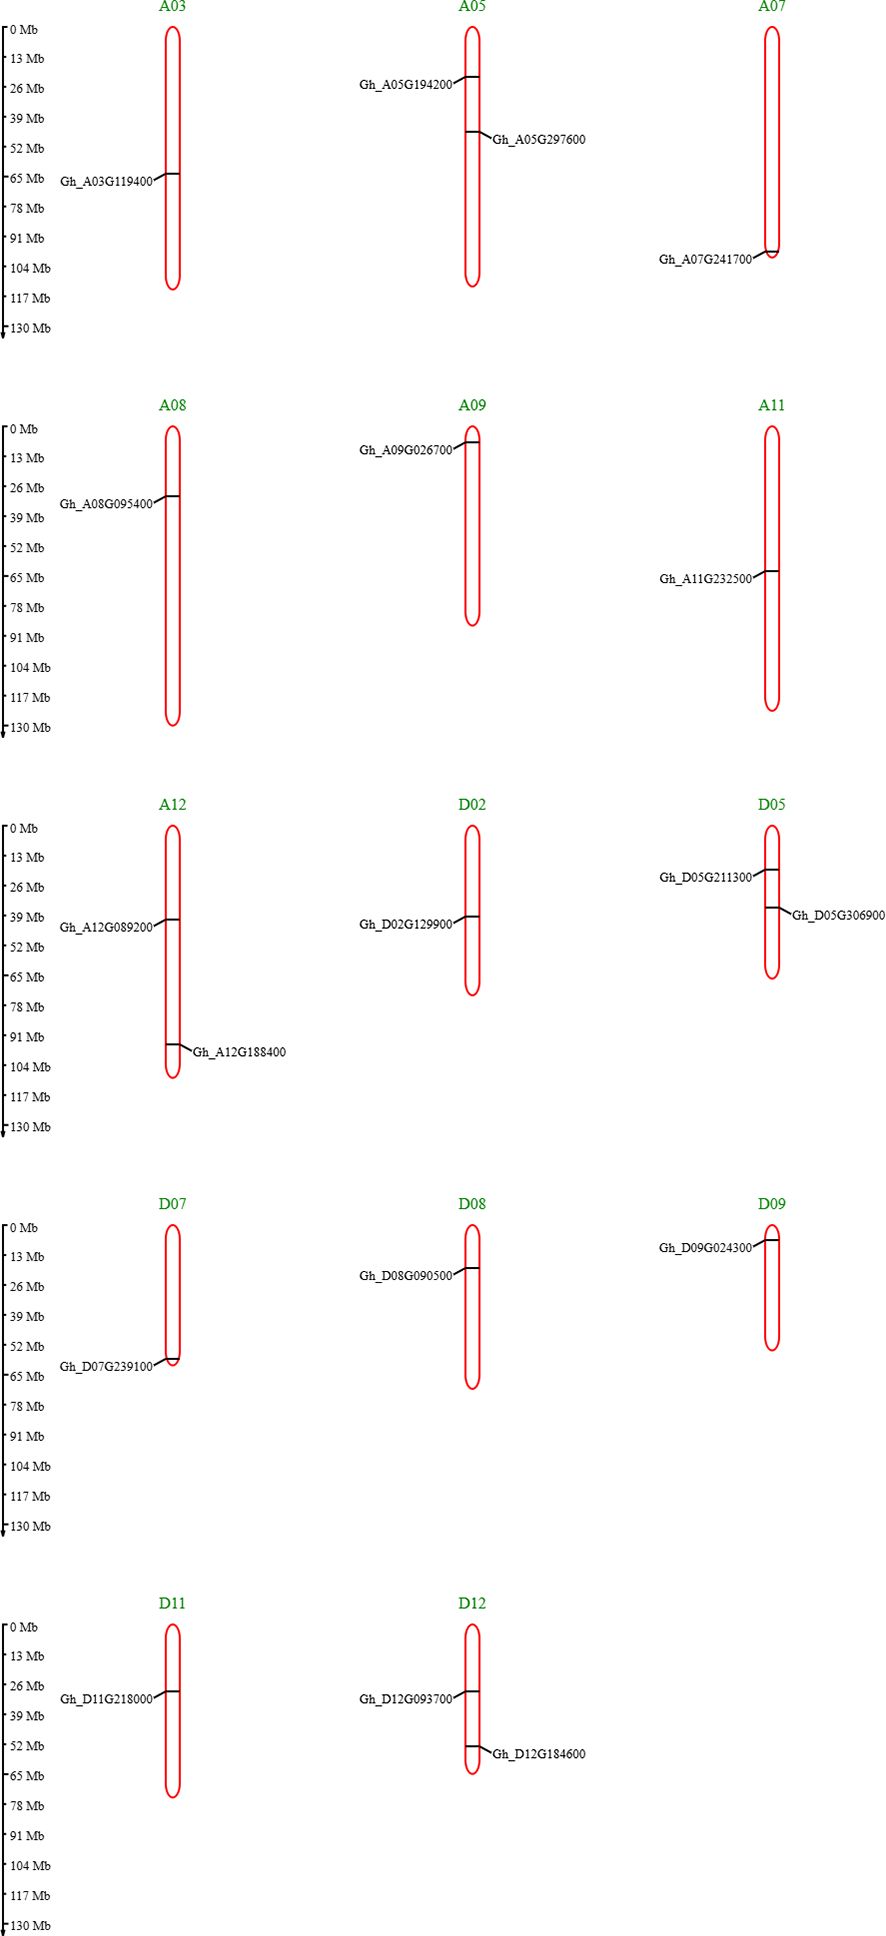
Figure 3. Chromosome mapping of GhVDAC genes by using the MG2C database.
3.2 Motif and sequence logos analysis
The GhVDAC gene motifs from the Meme Suite database were identified, and interestingly, among all domains, the porin3 superfamily was abundantly present in all motifs. Also, motif 9 was present in all genes except GhVDAC2, GhVDAC7, GhVDAC9, GhVDAC10, GhVDAC11, and GhVDAC18. Motif 10 was present in only two genes, GhVDAC5 and GhVDAC14. Moreover, the UTRs were absent in GhVDAC2, GhVDAC7, and GhVDAC17. The results suggest that these genes may be involved in the stress regulatory mechanism (Figure 4). The file for motif analysis is present in Supplementary Table S2.
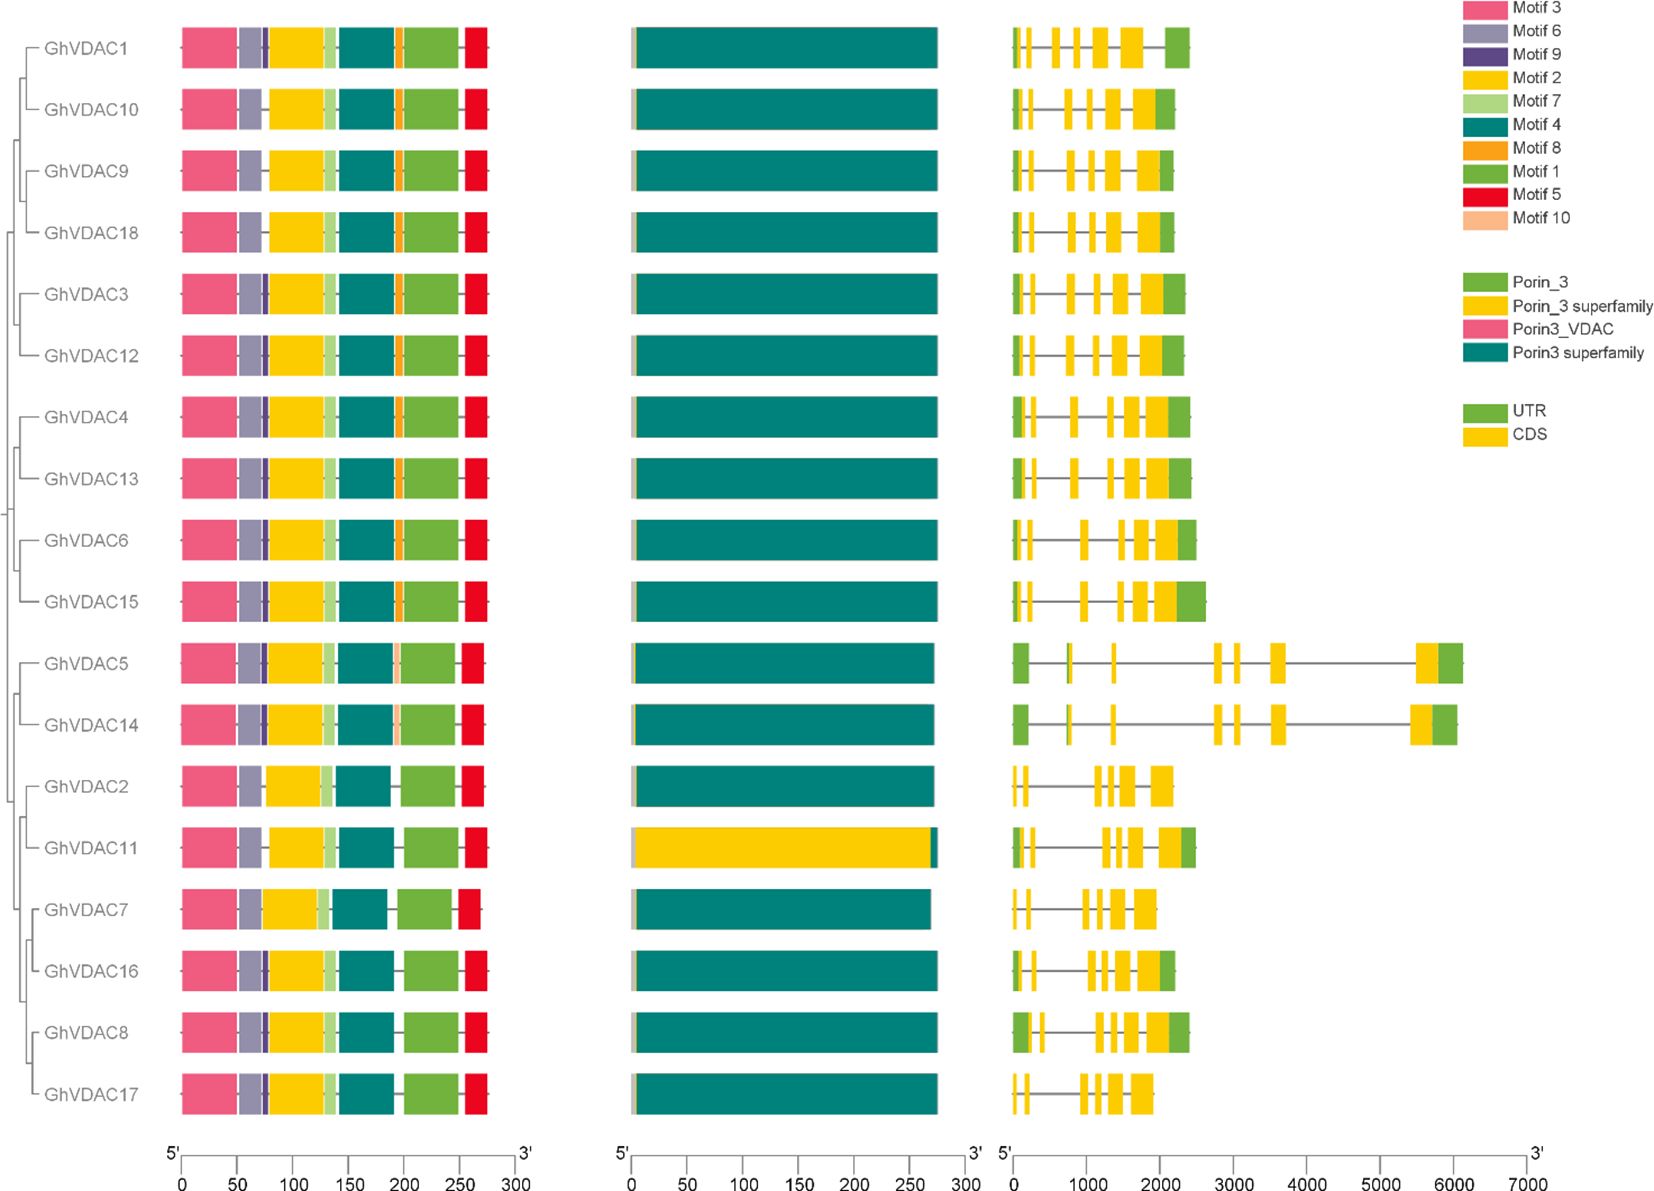
Figure 4. GhVDAC phylogenetic relationship, gene structure, and conserved motifs. The different motif boxes were present in different colors, numbered from 1 to 10. The exons are represented by Yellow boxes, and introns are represented by black lines. The X-axis represents the length and the Y-axis shows the Gene IDs in Phylogenetic tree order.
3.3 Phylogenetic tree construction of VDAC genes
The VDAC genes of several plant species were analyzed using MEGA software, and iTOL was used for circular visualization. The results indicated that a total of 66 genes were identified from 14 different plant species phylogenetic tree construction. Interestingly, all of the G. arboreum genes were present in clade I, and 10 genes of G. hirsutum were present in clade IV. Also, the G. hirsutum exhibited a close relation with T. cacao and other cotton species (Figure 5). The Sequences of all species are present in Supplementary Table S3.
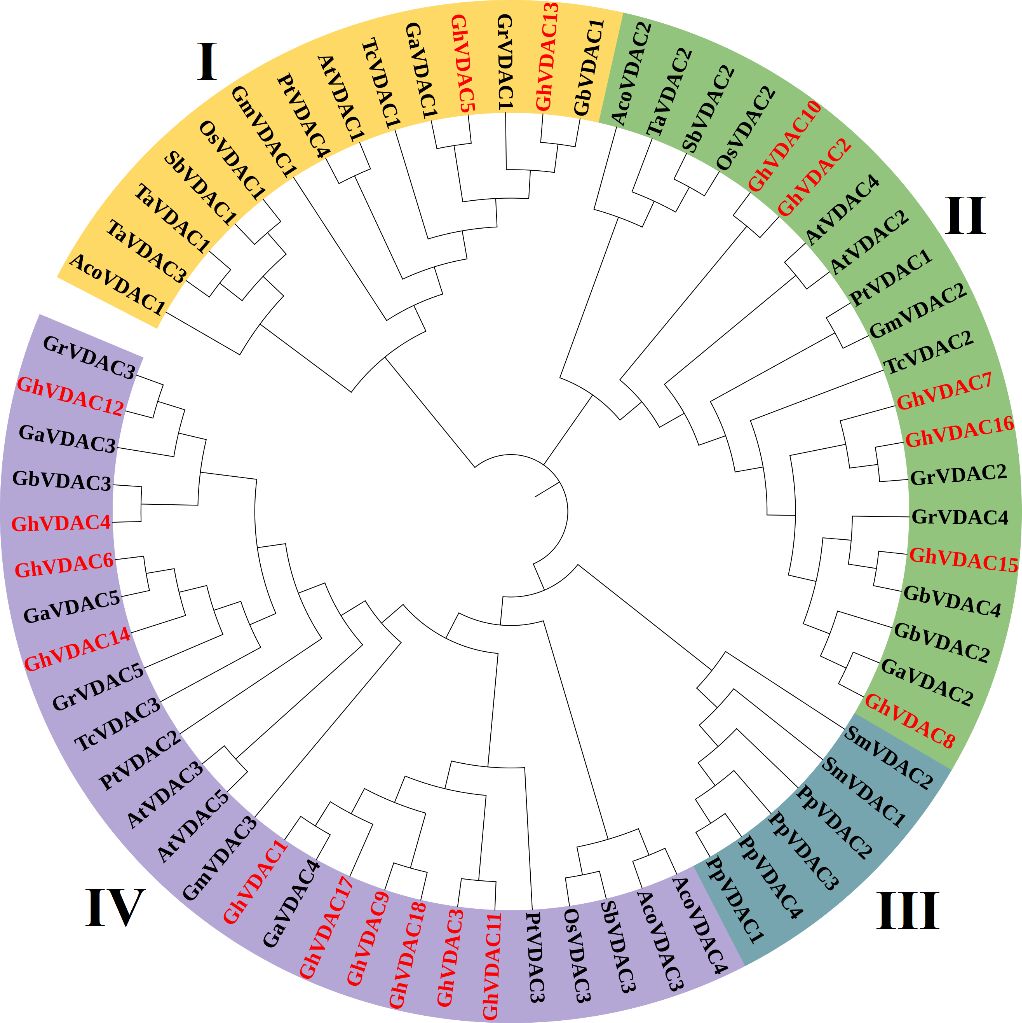
Figure 5. The phylogenetic tree of 14 different species was constructed using the maximum likelihood method (ML) with 1000 bootstrap replicates in MEGA 11. The phylogenetic tree was distributed into 4 clades, and GhVDAC was marked in red color.
3.4 Cis-regulatory element analysis of GhVDACs
The promoter analysis of GhVDAC genes was done using the PlantCARE database with a 2 kb upstream region. The results indicated that several cis-elements were found in GhVDAC genes, such as MBS, GT-1 motif, G-box, ABRE, TCA-element, and LTR. Hormone-responsive cis-elements like TCA elements (salicylic acid), CGTCA motifs (jasmonic acid), exhibit distinct patterns, suggesting their involvement in hormonal signaling pathways; stress-related cis-elements, such as ABRE (abscisic acid response), MBS (MYB-binding site for drought), are distributed with stress-associated regions. The light-responsive element, like the G-box, played a role in photo-regulation (Figure 6). The raw cis-elements file of GhVDAC genes is provided in Supplementary Table S4.
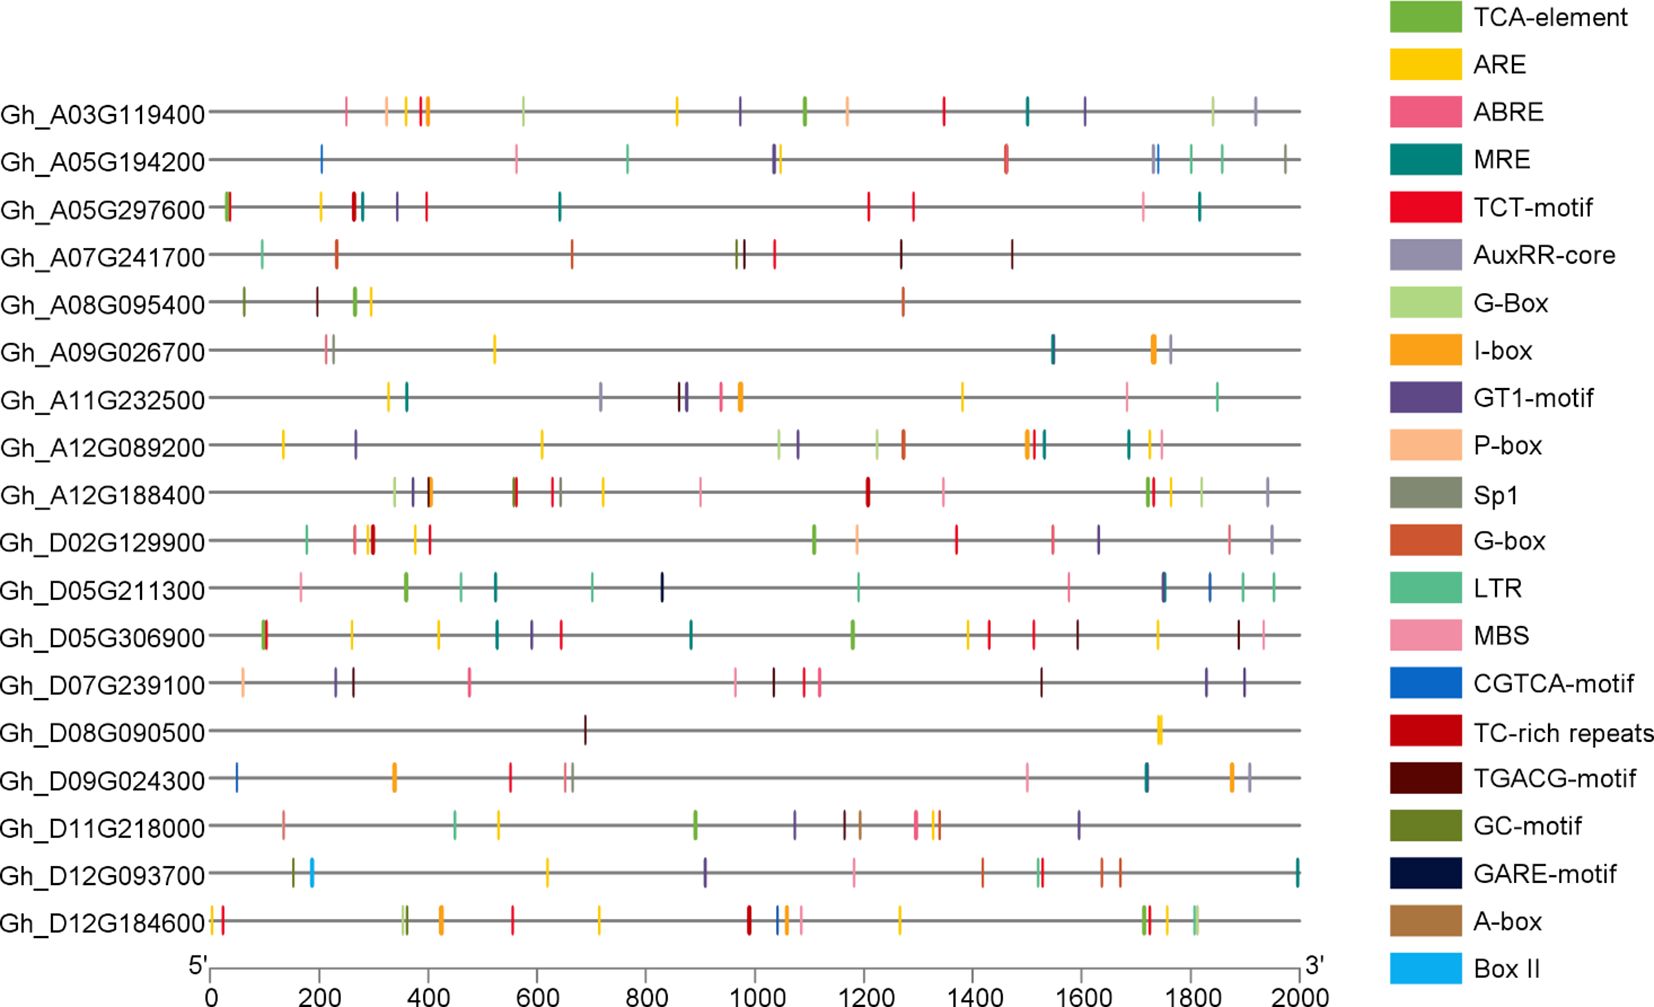
Figure 6. Distributions of different cis-acting elements in GhVDAC gene promoters. Different colors indicate the cis-elements. The -axis shows the length of the promoter region in base pairs, and Y-axis shows the GhVDAC gene IDs.
3.5 Protein-protein interaction of GhVDAC genes
The string database was used for PPI of GhVDAC genes, and the analysis showed that the clustering coefficient was 0.597 with 20 nodes and 82 edges. The results indicated that, as a group, these proteins are partially biologically connected (Figure 7).
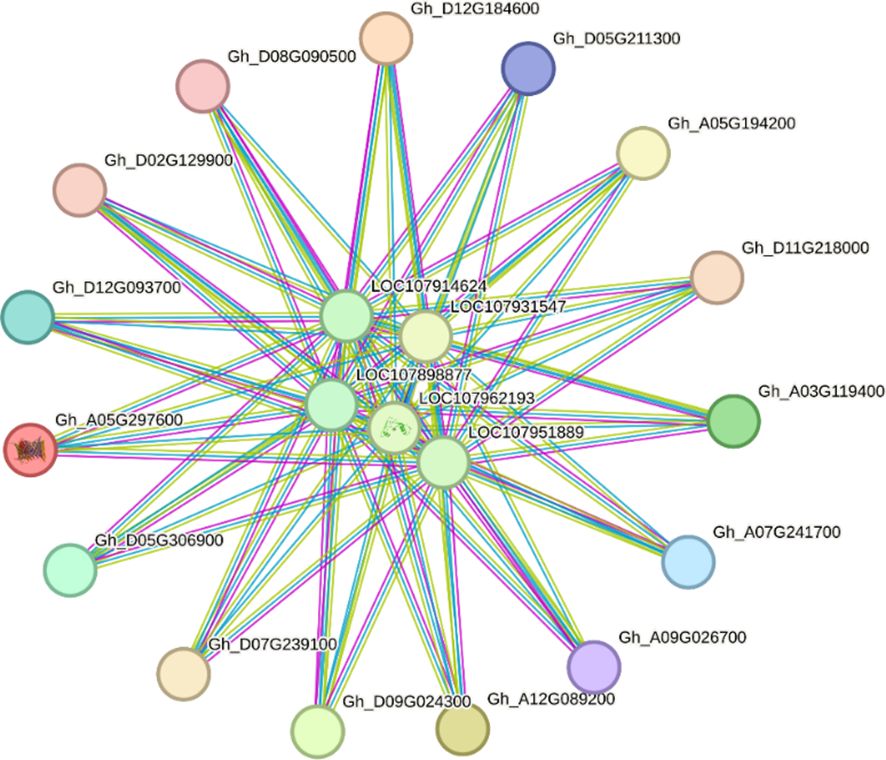
Figure 7. Protein-protein interaction (PPI) network of GhVDAC genes. Specific protein interaction of VDAC genes in G. hirsutum was determined by using the STRING database.
3.6 Ka/Ks ratio and collinearity analysis of GhVDAC genes
The selective pressure analysis was performed to understand the coding sequences for proteins. To check whether the selective pressure is acting upon them or not, the ratio between the non-substitution rate and protein-coding substitution rate was checked. The substitution mutations are not considered as natural selection because they do not disturb the protein function or structure. The non-substitution mutations, on the other hand, disrupt the protein functions. If Ka/Ks < 1, it is considered a negative selection; if Ka/Ks > 1, it is considered positive selection. Hence, our results indicated that all GhVDAC genes had Ka/Ks < 1, thus, indicating the negative selection in GhVDAC genes. The Ka/Ks ratio data of GhVDAC genes is provided in Supplementary Table S5.
The segmental and tandem duplications are critical for gene family expansion, as segmental duplications are multiple chromosomal blocks present in a genome. On the other hand, tandem duplications are adjacent genes on the same chromosome. Our results suggested that both segmental and tandem duplications were found in collinearity analysis, as shown in Figure 8. The GhVDAC genes have Ka/Ks < 1, demonstrating that duplicated genes are purified proteins that are stable.
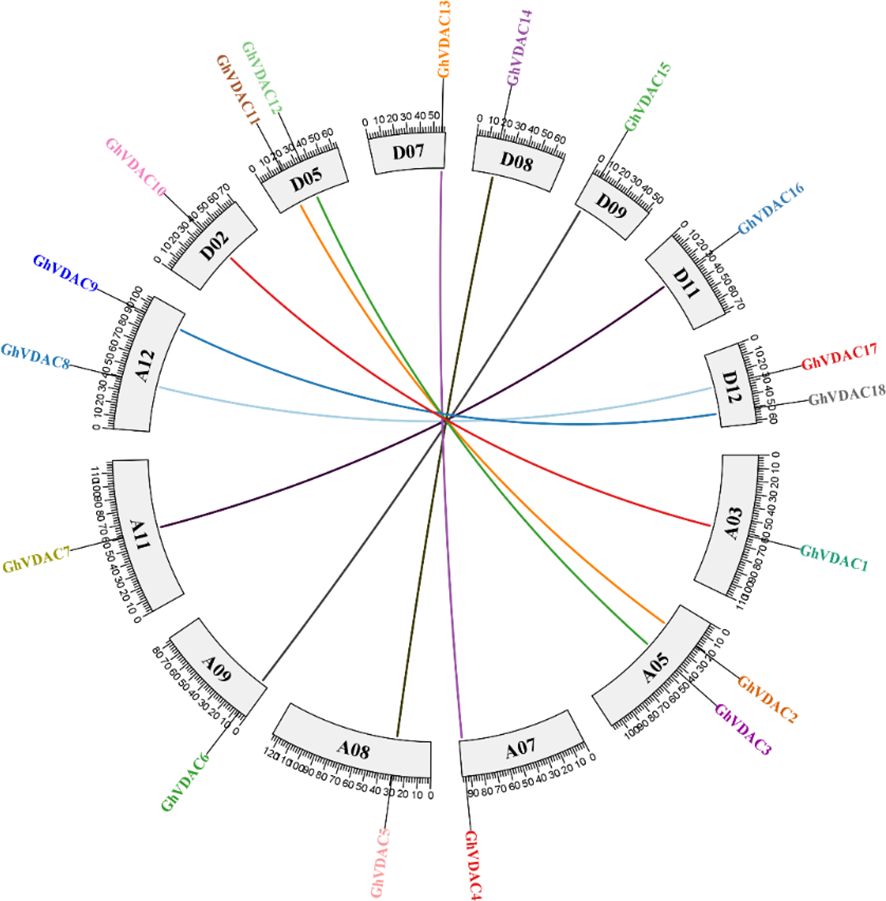
Figure 8. Collinearity analysis of all GhVDAC genes among all Gossypium chromosomes.
3.7 Synteny analysis of GhVDAC genes with other species
The synteny analysis was performed between G. hirsutum and other plant species, like G. raimodaii, G. barbadense, A thaliana, and G. arboreum (Figures 9A–C). A total of 17 orthologous genes are dispersed in G. hirsutum vs A. thaliana, except A01-A10, A13, D01-D04, D06, D09, D10, D11, and D13 (Figure 9A). Also, on G. hirsutum and G. arboreum, 17 orthologous genes were identified on A05, A09, D02-D05, D09, D10, and D12 (Figure 9B). Interestingly, 41 orthologous genes were identified in G. hirsutum vs G. raimondii, except A01, A03, A08, A11, A13, D01, D03, D04, D08, and D13 (Figure 9C).
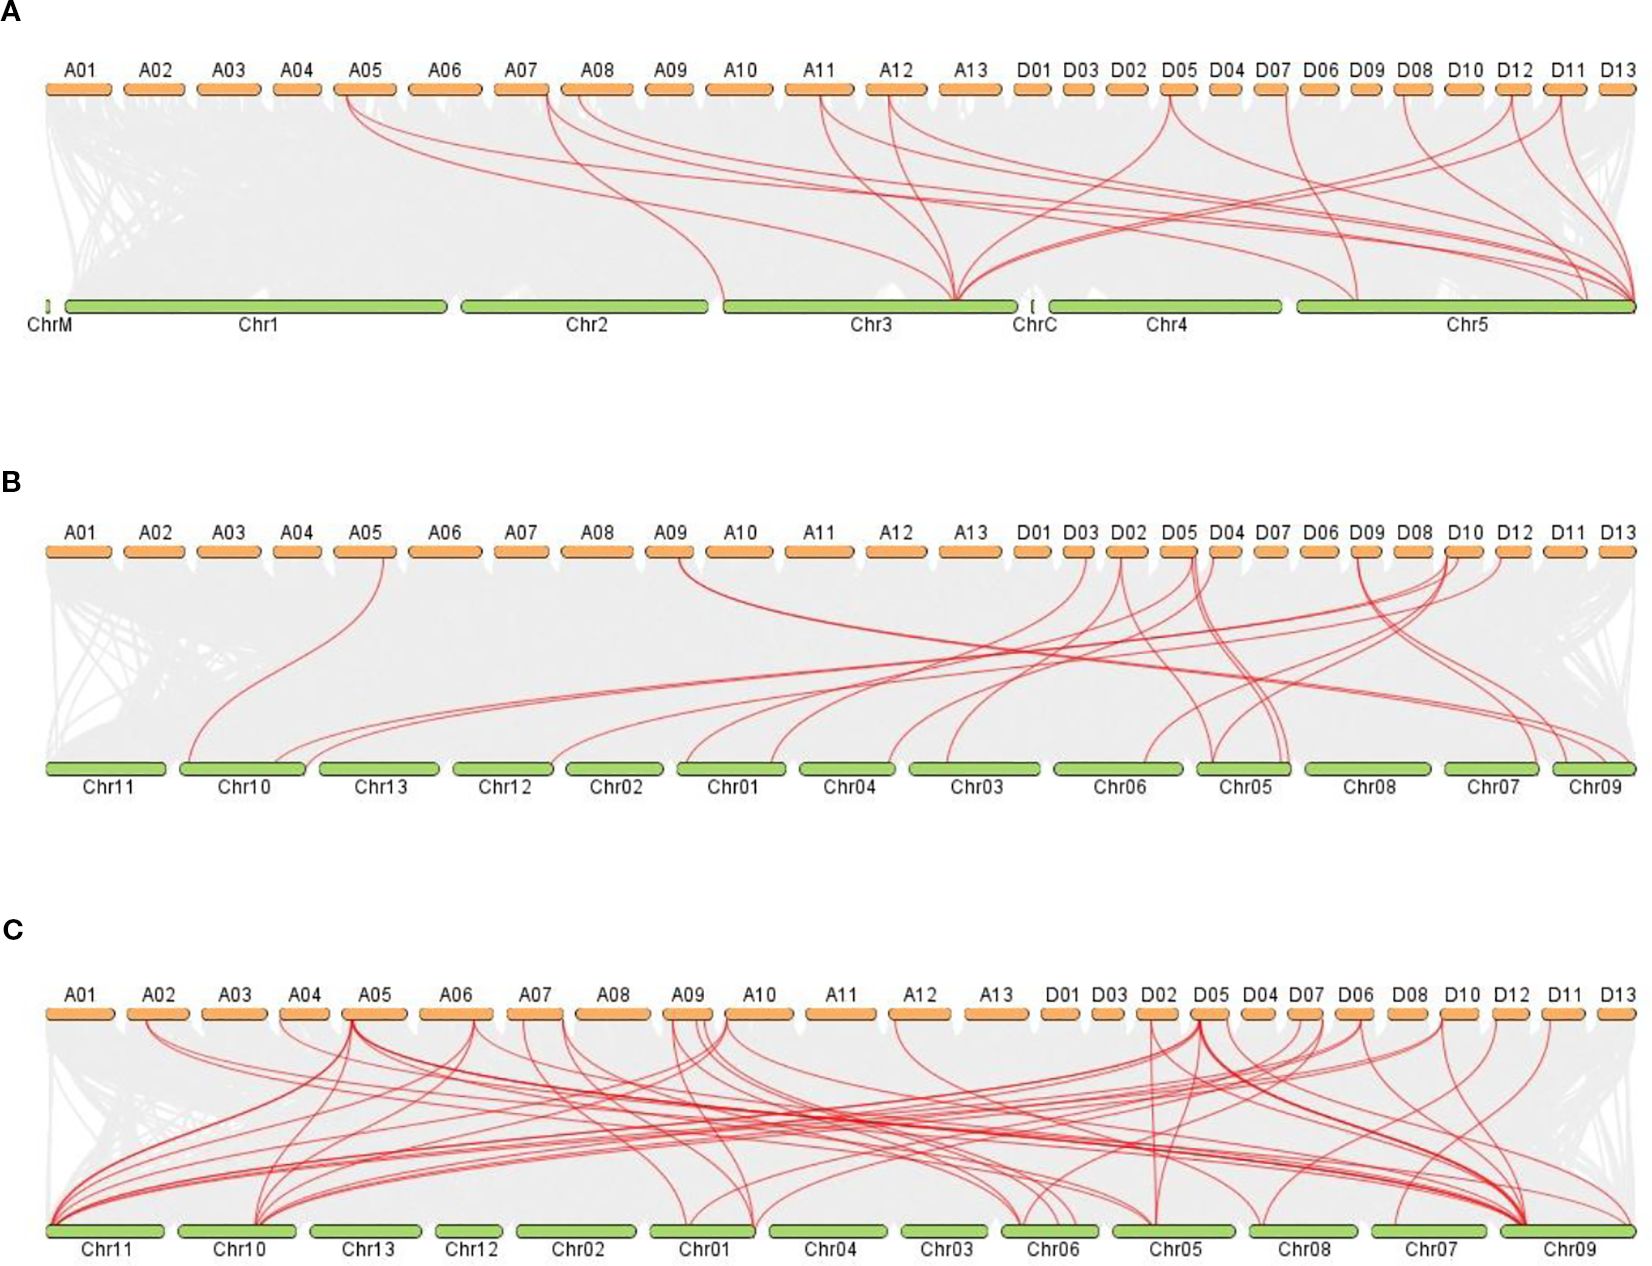
Figure 9. (A–C) The collinear relationship between G. hirsutum and other crops. (A) G. hirsutum vs A. thaliana (B) G. hirsutum vs G. arboreum C) G. hirsutum vs G. raimondii. Red lines indicate the collinear gene pairs of G. hirsutum and other crops, and grey lines represent the syntenic blocks. The X-axis shows the number of chromosomes present between two species.
3.8 Heatmap analysis of GhVDACs
The heatmap expression analysis of GhVDAC genes was performed using publicly available RNA-seq data. The control, drought, and salt stress data were obtained under 1 hour, 3 hours, and 12 hours for control, whereas 1 hour, 3 hours, 12 hours, and 24 hours for drought and salt stress. Out of the 18 GhVDAC genes, 4 candidate genes (Gh_A03G06296, Gh_A09G01181, Gh_A07G13146, and Gh_A12G04801) were identified on their in-silico expression pattern (Figure 10). These candidate genes were further submitted for qRT-PCR analysis.
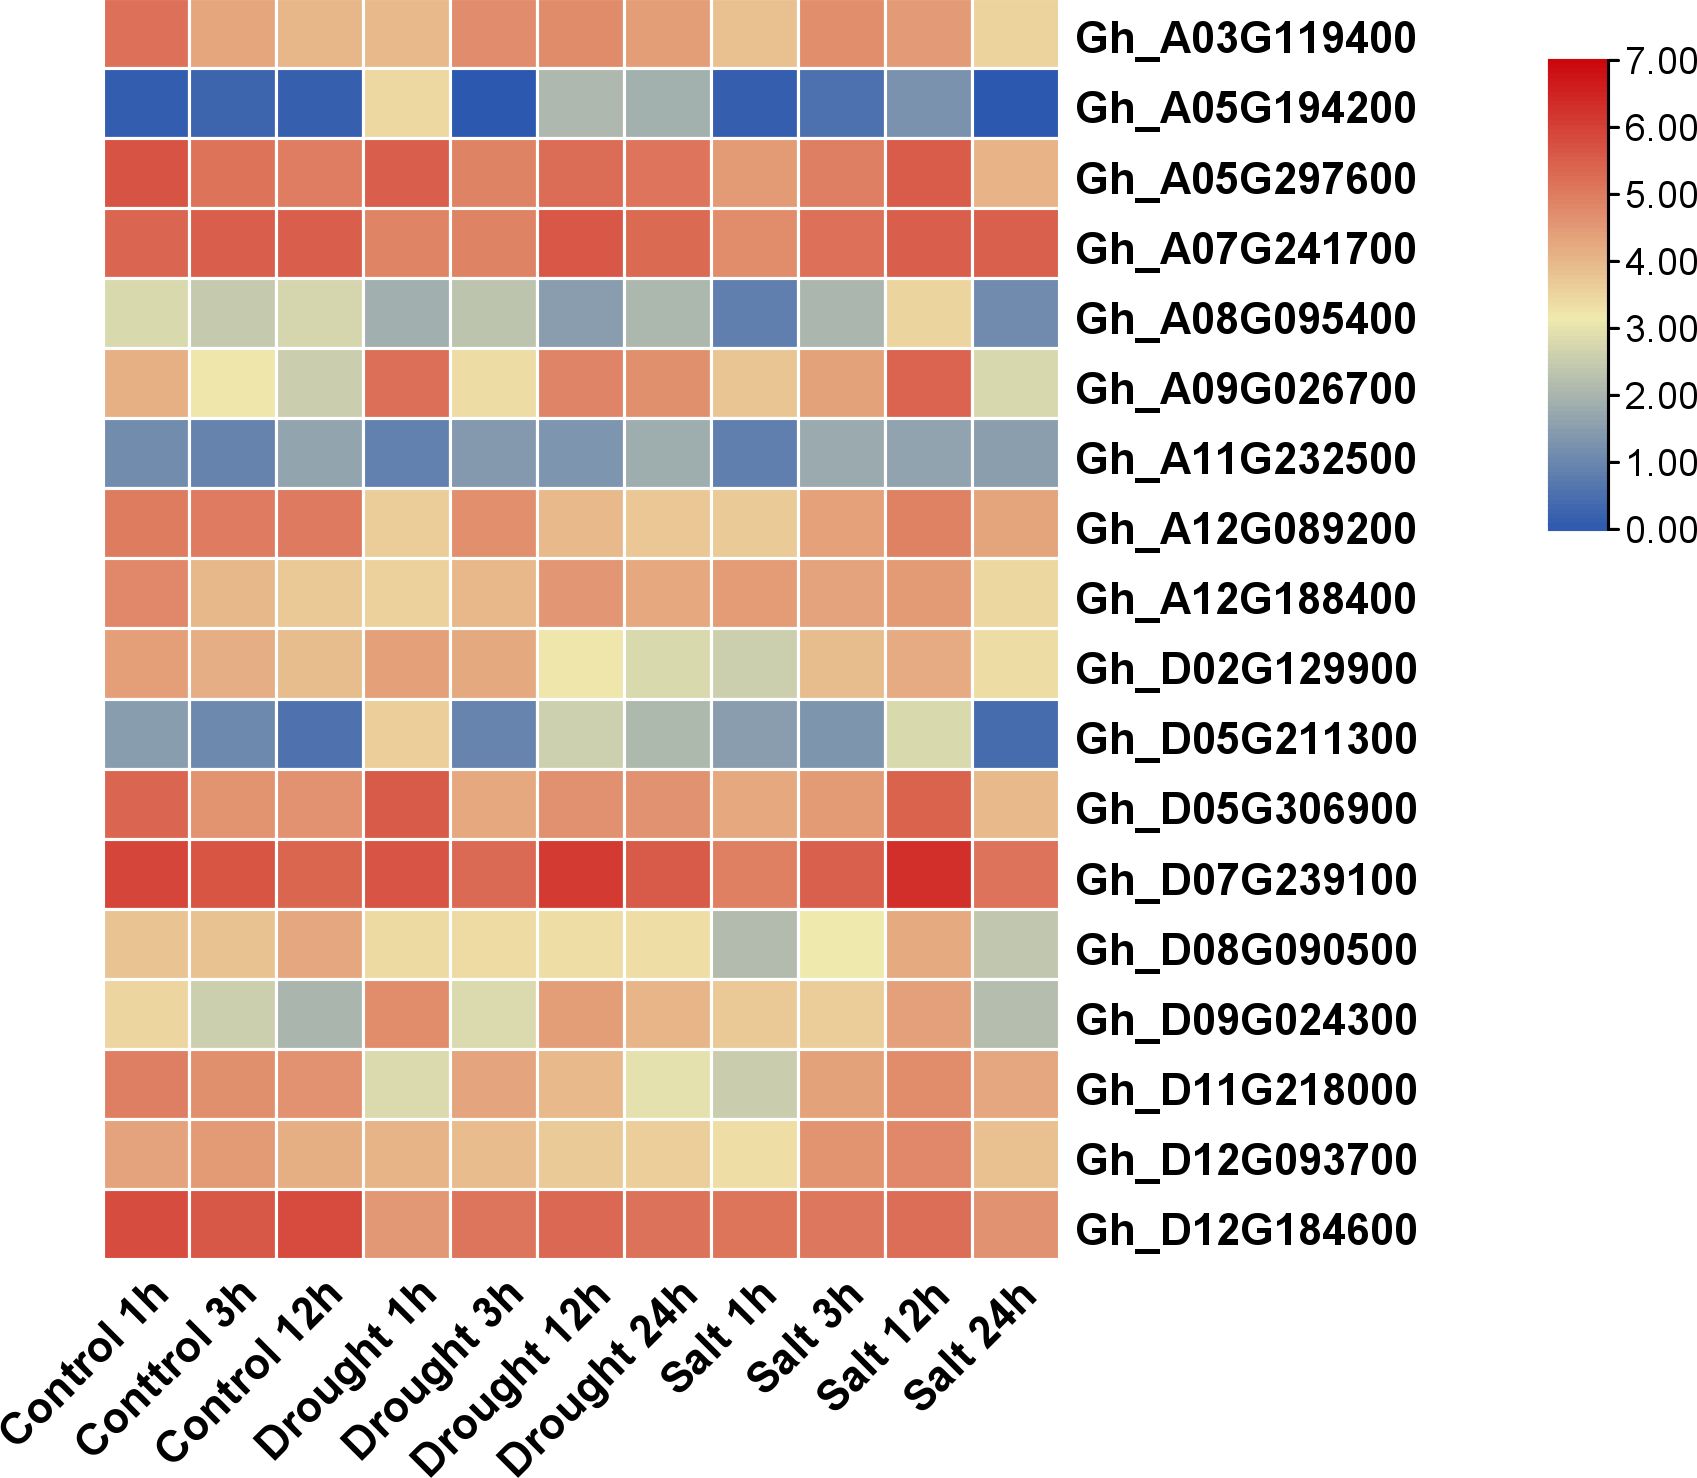
Figure 10. Expression profile of 18 GhVDAC genes under drought and salt stresses with logarithm with base 2 for standardization. Different colors represent the expression level of cotton leaves under stresses. The X-axis represents the different stress treatments with time intervals, and the Y-axis represents the Gene IDs.
3.9 qRT-PCR analysis of candidate GhVDAC genes
The qRT-PCR analysis of four candidate GhVDAC genes was performed, and notably, all genes were upregulated in the transcriptome data. In drought stress response, the GhVDAC6 was minimal at 24 hours and maximum at 1 hour. Similarly, the expression level of the GhVDAC11 gene was minimal at 3 hours and up-regulated at 12 hours. In salt stress, the GhVDAC13 gene was minimal at 3h and up-regulated at 1 hour, whereas the GhVDAC15 gene was minimal at 3 hours and up-regulated at 12 hours (Figure 11). Different primers for GhVDAC genes are provided in Supplementary Table S6.
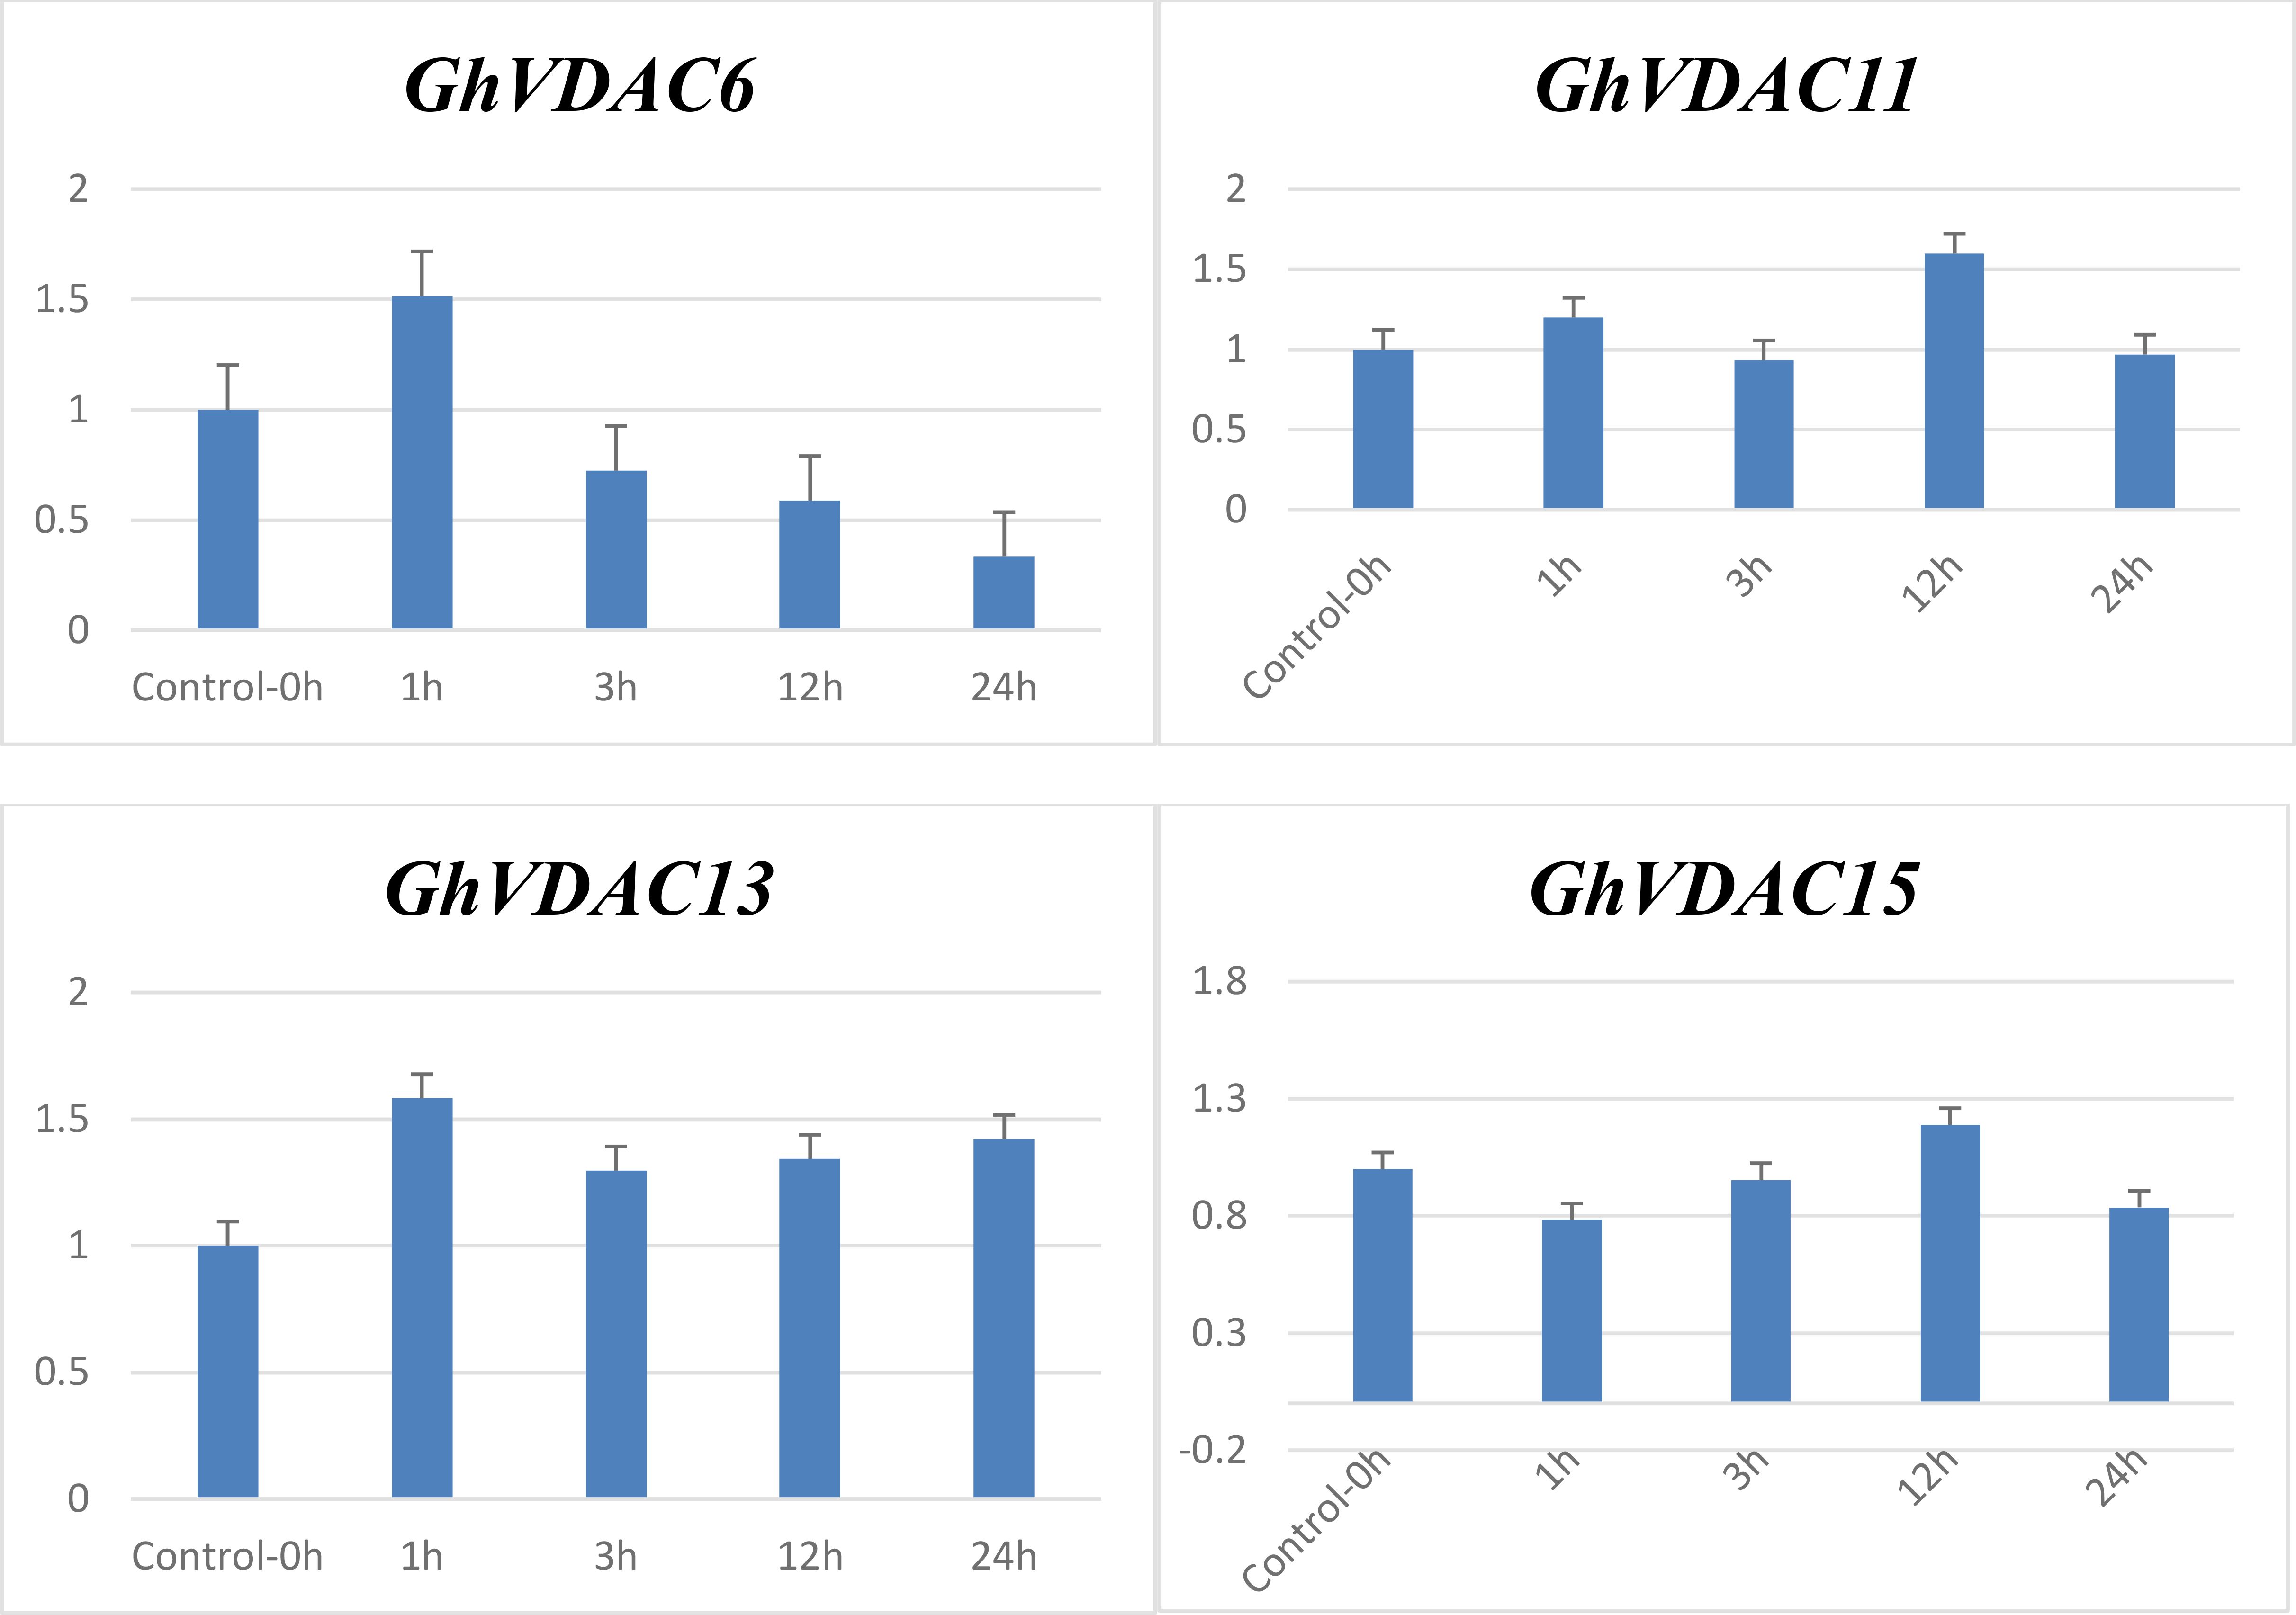
Figure 11. qRT-PCR expression of GhVDAC6, GhVDAC11, GhVDAC13, and GhVDAC15 under drought and salt stress conditions. On X-axis are the different times intervals i.e., 0h, 1h, 3h, 12h and 24h on which the sample was taken. To check the fold expression of GhVDAC genes under drought and salt stresses, the control was normalized and kept constant at 1. Error bars indicate standard deviations among three independent replications. p < 0.05. The Y-axis represents the relative expression level of GhVDAC genes.
4 Discussion
4.1 VDAC gene family in G. hirsutum
Cotton is the main source of fiber, and it is the backbone of the economy in several countries in the world (Thyavihalli Girijappa et al., 2019). But the yield of cotton around the world has been hindered due to several factors, and abiotic stresses such as heat, salt, cold, and drought are the major ones (Zhu, 2016; Zhang et al., 2022). Omics approaches have now been extensively studied and integrated to decipher the molecular mechanism leading to abiotic stress tolerance in plants (Roychowdhury et al., 2023). In plants, the resistance to these factors can only be achieved through a better understanding of the molecular mechanisms. The VDAC genes are found in the outer mitochondrial membrane of plants and play a role in metabolite transportation (Li et al., 2013). The study on VDAC genes has been done in different plants (Xu et al., 2015; Ashrafei Kolteh et al., 2022; Yu et al., 2022; Zheng et al., 2025), however, the information is scarce for the VDAC gene family. This study provides a better mechanism for understanding VDAC genes in cotton through genome-wide analysis studies.
4.2 In-Sillico Characterization of GhVDAC
The subcellular localization of genes is crucial for several biological processes (Ehrlich, 2002; Glory and Murphy, 2007), and WoLF PSORT analysis of the GhVDAC gene predicted that few genes were present in the mitochondria and cytoplasm, whereas most genes were present in the cytoplasm. VDAC genes are present in the cytoplasm, but they encode the proteins outside of the mitochondria. The drought resistance was affected in Arabidopsis plants due to ROS specie (Li et al., 2013). The phylogenetic tree analysis revealed that a total of 66 genes in different species were found, and these genes were divided into 4 clades. Clade I had 5 genes, Clade II had 13 genes, Clade III had 19 genes, and Clade IV had 29 genes present. The motif analysis revealed that almost all GhVDAC genes exhibited the same results in motif distribution except Gh_A05G194200, Gh_A11G232500, Gh_A08G095400, and Gh_D07G239100. Interestingly, Gh_A05G194200, Gh_A11G232500, and Gh_D12G093700 exhibited no UTR regions.
The cis-regulatory element analysis plays a crucial role in abiotic stresses and how genes can regulate gene expression (Zhao et al., 2016). The results showed several cis-elements such as Tc-rich repeats, MBS, and LTR. Other hormone-responsive genes like P-Box, TATC-box, and ABRE (abscisic acid response) (Ezcurra et al., 2000) were also found, suggesting the involvement of the GhVDAC gene in response to different stresses. The CGTCA-motif and GC motif are involved in anoxic-specific inducibility (Martin-Malpartida et al., 2017).
The molecular evolutionary relationship between two different species can be determined by the synteny analysis (Cheng et al., 2012). The colinear gene pairs of GhVDAC genes in G. hirsutum L. exhibited that the gene pairs were not maintained throughout evolution in gene duplication. The specific gene association with other known proteins can be determined by PPI (Piya et al., 2014). The PPI analysis exhibited that GhVDAC genes had a good coefficient score and have similar functions.
4.3 GhVDAC genes under drought and salt stresses
The promoter analysis was done to determine the cis-regulatory elements of GhVDAC genes under abiotic stresses, and results showed that most of the cis-elements were found under the abiotic stress region. The ROS accumulation can increase under drought stress, which can lead to PCD and disrupt the plant functions (Fu and Huang, 2001; Sugimoto et al., 2014). The in-silico expression analysis of GhVDAC genes, the leaves RNA-seq data of control, NaCl, and drought were retrieved. The candidate genes were found via RNA-seq data, and then further qRT-PCR was done for validation of these candidate genes. The gene function can be determined by gene expression profiling (Roeber et al., 2021), and the qRT-PCR of 4 GhVDAC genes was done. The results showed that GhVDAC6, GhVDAC11, GhVDAC13, and GhVDAC15 genes were up-regulated after NaCl and drought treatment. In conclusion, these genes are crucial for NaCl and drought stresses, and further research is required for the functional validation of these genes.
5 Conclusion
In this study of genome-wide analysis of VDAC genes in G. hirsutum L., a total of 18 genes were identified. The promoter analysis revealed that most of the genes were present in the abiotic stress region, and phylogeny analysis showed that all of the VDAC genes from different species were categorized in 4 clades. The candidate genes were identified through RNA-Seq analysis, and these genes were further validated via qRT-PCR. Further studies are required for the understanding deep molecular mechanisms and functional validation of these genes to develop transgenic cotton crops such as Virus-induced gene silencing (VIGS) and CRISPR-Cas technology. This study can provide the foundation for future breeding programs to develop resilient cotton crops for harsh environmental conditions.
Data availability statement
The datasets presented in this study can be found in online repositories. The names of the repository/repositories and accession number(s) can be found in the article/Supplementary Material.
Author contributions
UA: Data curation, Methodology, Conceptualization, Writing – original draft. AA: Writing – review & editing, Methodology, Formal Analysis. MS: Writing – review & editing, Formal Analysis, Software, Methodology. FA: Writing – review & editing, Methodology, Data curation. MB: Writing – review & editing, Methodology, Conceptualization. MTA: Formal Analysis, Writing – review & editing. MU: Software, Writing – review & editing. ÖA: Funding acquisition, Writing – review & editing, Project administration, Supervision.
Funding
The author(s) declare financial support was received for the research and/or publication of this article. This Study has been supported by the Recep Tayyip Erdoğan University Development Foundation, Turkey (Grant Number: 02025008018700).
Conflict of interest
The authors declare that the research was conducted in the absence of any commercial or financial relationships that could be construed as a potential conflict of interest.
Generative AI statement
The author(s) declare that no Generative AI was used in the creation of this manuscript.
Any alternative text (alt text) provided alongside figures in this article has been generated by Frontiers with the support of artificial intelligence and reasonable efforts have been made to ensure accuracy, including review by the authors wherever possible. If you identify any issues, please contact us.
Publisher’s note
All claims expressed in this article are solely those of the authors and do not necessarily represent those of their affiliated organizations, or those of the publisher, the editors and the reviewers. Any product that may be evaluated in this article, or claim that may be made by its manufacturer, is not guaranteed or endorsed by the publisher.
Supplementary material
The Supplementary Material for this article can be found online at: https://www.frontiersin.org/articles/10.3389/fpls.2025.1682305/full#supplementary-material
References
Akram, U., Song, Y., Liang, C., Abid, M. A., Askari, M., Myat, A. A., et al. (2020). Genome-wide characterization and expression analysis of NHX gene family under salinity stress in Gossypium barbadense and its comparison with Gossypium hirsutum. Genes 11, 803. doi: 10.3390/genes11070803
Ashraf, M., Mao, Q., Hong, J., Shi, L., Ran, X., Liaquat, F., et al. (2021). HSP70-16 and VDAC3 jointly inhibit seed germination under cold stress in Arabidopsis. Plant Cell Environ. 44, 3616–3627. doi: 10.1111/pce.14138
Ashrafei Kolteh, G. M., Khoshhal Sarmast, M., and Liu, J. (2022). Genome-wide analysis, annotation and expression profile analysis of VDAC gene family in Rosa chinensis. J. Plant Production Res. 29, 111–132. doi: 10.22069/jopp.2021.18859.2782
Bailey, T. L., Boden, M., Buske, F. A., Frith, M., Grant, C. E., Clementi, L., et al. (2009). MEME SUITE: tools for motif discovery and searching. Nucleic Acids Res. 37, W202–W208. doi: 10.1093/nar/gkp335
Bolser, D., Staines, D. M., Pritchard, E., and Kersey, P. (2016). Ensembl plants: integrating tools for visualizing, mining, and analyzing plant genomics data. Plant bioinformatics: Methods Protoc. 1374, 115–140. doi: 10.1007/978-1-4939-3167-5_6
Chao, J., Li, Z., Sun, Y., Aluko, O. O., Wu, X., Wang, Q., et al. (2021). MG2C: A user-friendly online tool for drawing genetic maps. Mol. horticulture 1, 1–4. doi: 10.1186/s43897-021-00020-x
Chen, C., Chen, H., Zhang, Y., Thomas, H. R., Frank, M. H., He, Y., et al. (2020). TBtools: an integrative toolkit developed for interactive analyses of big biological data. Mol. Plant 13, 1194–1202. doi: 10.1016/j.molp.2020.06.009
Cheng, F., Wu, J., Fang, L., and Wang, X. (2012). Syntenic gene analysis between Brassica rapa and other Brassicaceae species. Front. Plant Sci. 3, 198. doi: 10.3389/fpls.2012.00198
Desai, M., Mishra, R., Verma, D., Nair, S., Sopory, S., and Reddy, M. (2006). Structural and functional analysis of a salt stress inducible gene encoding voltage dependent anion channel (VDAC) from pearl millet (Pennisetum glaucum). Plant Physiol. Biochem. 44, 483–493. doi: 10.1016/j.plaphy.2006.08.008
Dietz, K.-J., Mittler, R., and Noctor, G. (2016). Recent progress in understanding the role of reactive oxygen species in plant cell signaling. Plant Physiol. 171, 1535–1539. doi: 10.1104/pp.16.00938
Edgar, R. C. (2004). MUSCLE: multiple sequence alignment with high accuracy and high throughput. Nucleic Acids Res. 32, 1792–1797. doi: 10.1093/nar/gkh340
Ehrlich, J. S. (2002). Spatio-temporal dynamics of Rac1, PI 3-kinase, and the cytoskeleton during cadherin-mediated cell-cell adhesion (Stanford University) 3(2):259–270. doi: 10.1016/S1534-5807(02)00222-6
Ezcurra, I., Wycliffe, P., Nehlin, L., Ellerström, M., and Rask, L. (2000). Transactivation of the Brassica napus napin promoter by ABI3 requires interaction of the conserved B2 and B3 domains of ABI3 with different cis-elements: B2 mediates activation through an ABRE, whereas B3 interacts with an RY/G-box. Plant J. 24, 57–66. doi: 10.1046/j.1365-313x.2000.00857.x
Farooq, M., Basra, S., Wahid, A., Cheema, Z., Cheema, M., and Khaliq, A. (2008). Physiological role of exogenously applied glycinebetaine to improve drought tolerance in fine grain aromatic rice (Oryza sativa L.). J. Agron. Crop Sci. 194, 325–333. doi: 10.1111/j.1439-037X.2008.00323.x
Felsenstein, J. (1981). Evolutionary trees from DNA sequences: a maximum likelihood approach. J. Mol. Evol. 17, 368–376. doi: 10.1007/BF01734359
Finn, R. D., Clements, J., and Eddy, S. R. (2011). HMMER web server: interactive sequence similarity searching. Nucleic Acids Res. 39, W29–W37. doi: 10.1093/nar/gkr367
Fu, J. and Huang, B. (2001). Involvement of antioxidants and lipid peroxidation in the adaptation of two cool-season grasses to localized drought stress. Environ. Exp. Bot. 45, 105–114. doi: 10.1016/S0098-8472(00)00084-8
Gasteiger, E., Gattiker, A., Hoogland, C., Ivanyi, I., Appel, R. D., and Bairoch, A. (2003). ExPASy: the proteomics server for in-depth protein knowledge and analysis. Nucleic Acids Res. 31, 3784–3788. doi: 10.1093/nar/gkg563
Glory, E. and Murphy, R. F. (2007). Automated subcellular location determination and high-throughput microscopy. Dev. Cell 12, 7–16. doi: 10.1016/j.devcel.2006.12.007
Gonçalves, R. P., Buzhynskyy, N., Prima, V., Sturgis, J. N., and Scheuring, S. (2007). Supramolecular assembly of VDAC in native mitochondrial outer membranes. J. Mol. Biol. 369, 413–418. doi: 10.1016/j.jmb.2007.03.063
Goodstein, D. M., Shu, S., Howson, R., Neupane, R., Hayes, R. D., Fazo, J., et al. (2012). Phytozome: a comparative platform for green plant genomics. Nucleic Acids Res. 40, D1178–D1186. doi: 10.1093/nar/gkr944
Haj Sghaier, A., Tarnawa, Á., Khaeim, H., Kovács, G. P., Gyuricza, C., and Kende, Z. (2022). The effects of temperature and water on the seed germination and seedling development of rapeseed (Brassica napus L.). Plants 11, 2819. doi: 10.3390/plants11212819
Horton, P., Park, K.-J., Obayashi, T., Fujita, N., Harada, H., Adams-Collier, C., et al. (2007). WoLF PSORT: protein localization predictor. Nucleic Acids Res. 35, W585–W587. doi: 10.1093/nar/gkm259
Hu, B., Jin, J., Guo, A.-Y., Zhang, H., Luo, J., and Gao, G. (2015). GSDS 2.0: an upgraded gene feature visualization server. Bioinformatics 31, 1296–1297. doi: 10.1093/bioinformatics/btu817
Jain, H., Singh, I., Chahal, S., Kaur, R., and Siwach, P. (2024). Phylogenetic and recombination analysis of Begomoviruses associated with Cotton leaf curl disease and in silico analysis of viral-host protein interactions. Microbial Pathogenesis 186, 106504. doi: 10.1016/j.micpath.2023.106504
Joshi, R., Wani, S. H., Singh, B., Bohra, A., Dar, Z. A., Lone, A. A., et al. (2016). Transcription factors and plants response to drought stress: current understanding and future directions. Front. Plant Sci. 7, 1029. doi: 10.3389/fpls.2016.01029
Khan, A., Awan, A. A., Yasin, M., Ramzan, A., Cheema, M. W. A., and Jan, A. (2024). Edible oilseeds: historical perspectives, recent advances, and future directions. Food Sci Nutr. IntechOpen. doi: 10.5772/intechopen.115045
Kilwake, J. W., Umer, M. J., Wei, Y., Mehari, T. G., Magwanga, R. O., Xu, Y., et al. (2023). Genome-wide characterization of the SAMS gene family in cotton unveils the putative role of GhSAMS2 in enhancing abiotic stress tolerance. Agronomy 13, 612. doi: 10.3390/agronomy13020612
Kumar, S., Nei, M., Dudley, J., and Tamura, K. (2008). MEGA: a biologist-centric software for evolutionary analysis of DNA and protein sequences. Briefings Bioinf. 9, 299–306. doi: 10.1093/bib/bbn017
Lamesch, P., Berardini, T. Z., Li, D., Swarbreck, D., Wilks, C., Sasidharan, R., et al. (2012). The Arabidopsis Information Resource (TAIR): improved gene annotation and new tools. Nucleic Acids Res. 40, D1202–D1210. doi: 10.1093/nar/gkr1090
Lescot, M., Déhais, P., Thijs, G., Marchal, K., Moreau, Y., Van De Peer, Y., et al. (2002). PlantCARE, a database of plant cis-acting regulatory elements and a portal to tools for in silico analysis of promoter sequences. Nucleic Acids Res. 30, 325–327. doi: 10.1093/nar/30.1.325
Letunic, I., Khedkar, S., and Bork, P. (2021). SMART: recent updates, new developments and status in 2020. Nucleic Acids Res. 49, D458–D460. doi: 10.1093/nar/gkaa937
Letunic, I. and Bork, P. (2016). Interactive tree of life (iTOL) v3: an online tool for the display and annotation of phylogenetic and other trees. Nucleic Acids Research 44, W242-W245.
Li, X., Liu, W., Ren, Z., Wang, X., Liu, J., Yang, Z., et al. (2022). Glucose regulates cotton fiber elongation by interacting with brassinosteroid. J. Exp. Bot. 73, 711–726. doi: 10.1093/jxb/erab451
Li, Z.-Y., Xu, Z.-S., He, G.-Y., Yang, G.-X., Chen, M., Li, L.-C., et al. (2013). The voltage-dependent anion channel 1 (AtVDAC1) negatively regulates plant cold responses during germination and seedling development in Arabidopsis and interacts with calcium sensor CBL1. Int. J. Mol. Sci. 14, 701–713. doi: 10.3390/ijms14010701
Liu, J., Liu, J., Wang, H., Khan, A., Xu, Y., Hou, Y., et al. (2023). Genome wide identification of GDSL gene family explores a novel GhirGDSL 26 gene enhancing drought stress tolerance in cotton. BMC Plant Biol. 23, 14. doi: 10.1186/s12870-022-04001-0
Liu, J., Mehari, T. G., Xu, Y., Umer, M. J., Hou, Y., Wang, Y., et al. (2021). GhGLK1 a key candidate gene from GARP family enhances cold and drought stress tolerance in cotton. Front. Plant Sci. 12, 759312. doi: 10.3389/fpls.2021.759312
Livak, K. J. and Schmittgen, T. D. (2001). Analysis of relative gene expression data using real-time quantitative PCR and the 2– ΔΔCT method. methods 25, 402–408. doi: 10.1006/meth.2001.1262
Martin-Malpartida, P., Batet, M., Kaczmarska, Z., Freier, R., Gomes, T., Aragón, E., et al. (2017). Structural basis for genome wide recognition of 5-bp GC motifs by SMAD transcription factors. Nat. Commun. 8, 2070. doi: 10.1038/s41467-017-02054-6
Mittler, R. (2002). Oxidative stress, antioxidants and stress tolerance. Trends Plant Sci. 7, 405–410. doi: 10.1016/S1360-1385(02)02312-9
Munns, R. and Tester, M. (2008). Mechanisms of salinity tolerance. Annu. Rev. Plant Biol. 59, 651–681. doi: 10.1146/annurev.arplant.59.032607.092911
Myo, T., Wei, F., Zhang, H., Hao, J., Zhang, B., Liu, Z., et al. (2021). Genome-wide identification of the BASS gene family in four Gossypium species and functional characterization of GhBASSs against salt stress. Sci. Rep. 11, 11342. doi: 10.1038/s41598-021-90740-3
Nadarajah, K. K. (2020). ROS homeostasis in abiotic stress tolerance in plants. Int. J. Mol. Sci. 21, 5208. doi: 10.3390/ijms21155208
Nakashima, K., Yamaguchi-Shinozaki, K., and Shinozaki, K. (2014). The transcriptional regulatory network in the drought response and its crosstalk in abiotic stress responses including drought, cold, and heat. Front. Plant Sci. 5, 170. doi: 10.3389/fpls.2014.00170
Naresh, R., Srivastava, R., Gunapati, S., Sane, A. P., and Sane, V. A. (2024). Functional characterization of GhNAC2 promoter conferring hormone-and stress-induced expression: a potential tool to improve growth and stress tolerance in cotton. Physiol. Mol. Biol. Plants 30, 17–32. doi: 10.1007/s12298-024-01411-2
Pennisi, E. (2008). The blue revolution, drop by drop, gene by gene. Science 320, 171–173. doi: 10.1126/science.320.5873.171
Piya, S., Shrestha, S. K., Binder, B., Stewart, C. N., Jr., and Hewezi, T. (2014). Protein-protein interaction and gene co-expression maps of ARFs and Aux/IAAs in Arabidopsis. Front. Plant Sci. 5, 744. doi: 10.3389/fpls.2014.00744
Raza, M. Y., Wu, R., and Lin, B. (2023). A decoupling process of Pakistan’s agriculture sector: Insights from energy and economic perspectives. Energy 263, 125658. doi: 10.1016/j.energy.2022.125658
Rio, D. C., Ares, M., Hannon, G. J., and Nilsen, T. W. (2010). Purification of RNA using TRIzol (TRI reagent). Cold Spring Harbor Protoc. 2010. doi: 10.1101/pdb.prot5439
Roeber, V. M., Bajaj, I., Rohde, M., Schmülling, T., and Cortleven, A. (2021). Light acts as a stressor and influences abiotic and biotic stress responses in plants. Plant Cell Environ. 44, 645–664. doi: 10.1111/pce.13948
Roychowdhury, R., Das, S.P., Gupta, A., Parihar, P., Chandrasekhar, K., Sarker, U., et al. (2023). Multi-omics pipeline and omics-integration approach to decipher plant's abiotic stress tolerance responses. Genes 14, 1281.
Saidani, H., Grobys, D., Léonetti, M., Kmita, H., and Homblé, F. (2016). Towards understanding of plant mitochondrial VDAC proteins: an overview of bean (Phaseolus) VDAC proteins. AIMS Biophys. 4, 43–62. doi: 10.3934/biophy.2017.1.43
Saleem, M. F., Sammar Raza, M. A., Ahmad, S., Khan, I. H., and Shahid, A. M. (2016). Understanding and mitigating the impacts of drought stress in cotton-a review. Pakistan J. Agric. Sci. 53, 609–623.
Shaar-Moshe, L., Blumwald, E., and Peleg, Z. (2017). Unique physiological and transcriptional shifts under combinations of salinity, drought, and heat. Plant Physiol. 174, 421–434. doi: 10.1104/pp.17.00030
Shi, G. and Zhu, X. (2022). Genome-wide identification and functional characterization of CDPK gene family reveal their involvement in response to drought stress in Gossypium barbadense. PeerJ 10, e12883. doi: 10.7717/peerj.12883
Singh, D. and Laxmi, A. (2015). Transcriptional regulation of drought response: a tortuous network of transcriptional factors. Front. Plant Sci. 6, 895. doi: 10.3389/fpls.2015.00895
Sohaib, N., Arif, M., and Anwar, H. (2023). Exploring the role of anti-oxidant on growth and yield of cotton to mitigate the heat stress. J. Global Innovations in Agricultural Sci. 11, 41–47. doi: 10.22194/jgias/11.1044
Sugimoto, M., Oono, Y., Gusev, O., Matsumoto, T., Yazawa, T., Levinskikh, M. A., et al. (2014). Genome-wide expression analysis of reactive oxygen species gene network in Mizuna plants grown in long-term spaceflight. BMC Plant Biol. 14, 1–11. doi: 10.1186/1471-2229-14-4
Sun, F., Ma, J., Wang, P., and Yang, Y. (2023). Genome-wide Identification of the Upland Cotton (Gossypium hirsutum L.) B-BOX gene Family and its Expression After Drought Stress. J. Plant Growth Regul. 42, 7452–7462. doi: 10.1007/s00344-023-11023-x
Suzuki, N., Miller, G., Morales, J., Shulaev, V., Torres, M. A., and Mittler, R. (2011). Respiratory burst oxidases: the engines of ROS signaling. Curr. Opin. Plant Biol. 14, 691–699. doi: 10.1016/j.pbi.2011.07.014
Szklarczyk, D., Gable, A. L., Nastou, K. C., Lyon, D., Kirsch, R., Pyysalo, S., et al. (2021). The STRING database in 2021: customizable protein–protein networks, and functional characterization of user-uploaded gene/measurement sets. Nucleic Acids Res. 49, D605–D612. doi: 10.1093/nar/gkab835
Takahashi, Y. and Tateda, C. (2013). The functions of voltage-dependent anion channels in plants. Apoptosis 18, 917–924. doi: 10.1007/s10495-013-0845-3
Thyavihalli Girijappa, Y. G., Mavinkere Rangappa, S., Parameswaranpillai, J., and Siengchin, S. (2019). Natural fibers as sustainable and renewable resource for development of eco-friendly composites: a comprehensive review. Front. materials 6, 226. doi: 10.3389/fmats.2019.00226
Wang, Y., Tang, H., Debarry, J. D., Tan, X., Li, J., Wang, X., et al. (2012). MCScanX: a toolkit for detection and evolutionary analysis of gene synteny and collinearity. Nucleic Acids Res. 40, e49–e49. doi: 10.1093/nar/gkr1293
Xu, X., Tan, Y., Cheng, G., Liu, X., Xia, C., Luo, F., et al. (2015). Genomic survey and gene expression analysis of the VDAC gene family in rice. Genet. Mol. Res. 14, 15683–15696. doi: 10.4238/2015.December.1.20
Yang, M., Duan, X., Wang, Z., Yin, H., Zang, J., Zhu, K., et al. (2021). Overexpression of a voltage-dependent anion-selective channel (VDAC) protein-encoding gene, MsVDAC, from Medicago sativa confers cold and drought tolerance to transgenic tobacco. Genes 12, 1706. doi: 10.3390/genes12111706
Yang, Z., Wang, J., Huang, Y., Wang, S., Wei, L., Liu, D., et al. (2023). CottonMD: a multi-omics database for cotton biological study. Nucleic Acids Res. 51, D1446–D1456. doi: 10.1093/nar/gkac863
Ying, M., Tu, C., Ying, H., Hu, Y., He, Q., and Yang, B. (2008). MSFTZ, a flavanone derivative, induces human hepatoma cell apoptosis via a reactive oxygen species-and caspase-dependent mitochondrial pathway. J. Pharmacol. Exp. Ther. 325, 758–765. doi: 10.1124/jpet.107.135657
Yu, J., Jung, S., Cheng, C.-H., Ficklin, S. P., Lee, T., Zheng, P., et al. (2014). CottonGen: a genomics, genetics and breeding database for cotton research. Nucleic Acids Res. 42, D1229–D1236. doi: 10.1093/nar/gkt1064
Yu, M., Yu, Y., Song, T., Zhang, Y., Wei, F., Cheng, J., et al. (2022). Characterization of the voltage-dependent anion channel (VDAC) gene family in wheat (Triticum aestivum L.) and its potential mechanism in response to drought and salinity stresses. Gene 809, 146031. doi: 10.1016/j.gene.2021.146031
Zhang, H., Zhu, J., Gong, Z., and Zhu, J.-K. (2022). Abiotic stress responses in plants. Nat. Rev. Genet. 23, 104–119. doi: 10.1038/s41576-021-00413-0
Zhang, M., Takano, T., Liu, S., and Zhang, X. (2015). Arabidopsis mitochondrial voltage-dependent anion channel 3 (AtVDAC3) protein interacts with thioredoxin m2. FEBS Lett. 589, 1207–1213. doi: 10.1016/j.febslet.2015.03.034
Zhao, W., Liu, Y.-W., Zhou, J.-M., Zhao, S.-P., Zhang, X.-H., and Min, D.-H. (2016). Genome-wide analysis of the lectin receptor-like kinase family in foxtail millet (Setaria italica L.). Plant Cell Tissue Organ Culture (PCTOC) 127, 335–346. doi: 10.1007/s11240-016-1053-y
Zheng, Q., Tang, H., Qin, Y., Liu, D., Chen, G., Tong, T., et al. (2025). Genome-wide identification, molecular evolution, and expression divergence of CLC, ALMT, VDAC, and MSL gene family in barley. Food Sci. Nutr. 13, e70110. doi: 10.1002/fsn3.70110
Keywords: voltage-dependent anion channels (VDACs), G. hirsutum, phylogeny, stress response, motif
Citation: Akram U, Ahmad A, Shah MN, Ahmad F, Baber M, Altaf MT, Rahman MAU and Albayrak Ö (2025) Genome-wide characterization and expression divergence of voltage-dependent anion channel (VDAC) in upland cotton (Gossypium hirsutum L.) in response to abiotic stresses. Front. Plant Sci. 16:1682305. doi: 10.3389/fpls.2025.1682305
Received: 08 August 2025; Accepted: 11 September 2025;
Published: 30 September 2025.
Edited by:
Bingsong Zheng, Zhejiang Agriculture and Forestry University, ChinaReviewed by:
Muhammad Atif Muneer, Fujian Agriculture and Forestry University, ChinaHamza Ali Khan, University of Talca, Chile
Usman Arshad, Chinese Academy of Agricultural Sciences, China
Copyright © 2025 Akram, Ahmad, Shah, Ahmad, Baber, Altaf, Rahman and Albayrak. This is an open-access article distributed under the terms of the Creative Commons Attribution License (CC BY). The use, distribution or reproduction in other forums is permitted, provided the original author(s) and the copyright owner(s) are credited and that the original publication in this journal is cited, in accordance with accepted academic practice. No use, distribution or reproduction is permitted which does not comply with these terms.
*Correspondence: Önder Albayrak, b25kZXIuYWxiYXlyYWtAZXJkb2dhbi5lZHUudHI=