 Amar Jeet Gupta*
 Kavya V. AribenchiAshwini BenkeSupriya KaldatePushpa Hulagannavar
 Rajiv Kale
 Vijay Mahajan
- Department of Crop Improvement, -Indian Council of Agricultural Research (ICAR) -Directorate of Onion and Garlic Research, Pune, Maharashtra, India
Introduction: Red onion (Allium cepa L.) productivity and quality are highly contingent on environmental context, necessitating rigorous genotype evaluation across sites and seasons.
Methods: Twenty-four red onion genotypes were evaluated in multi-environment trials (METs) across fixed, agro ecologically diverse Indian locations, during two consecutive rabi seasons (2023-24). As the same locations were used in both years, they were treated jointly as eight distinct environments (E1-E8) to quantify genotype × environment interaction (GEI) and identify broadly or specifically adapted cultivars. An integrated analytical pipeline combined GGE and AMMI biplots with mixed-model BLUPs, including the Harmonic Mean of the Relative Performance of Genotypic Values (HMRPGV), alongside multivariate indices Genotype-by-Trait (GT), Genotype-by-Yield × Trait (GYT), and Multi-Trait Genotype-Ideotype Distance Index (MGIDI) to facilitate multi-trait selection across marketable yield (MY), days to harvest (DTH), average bulb weight (ABW), total soluble solids (TSS), double bulb formation (DB), and thrips incidence (TI).
Results: Pooled ANOVA and GGE analyses indicated significant genotype, environment and GEI effects for all traits. The first two GGE axes captured substantial variation of 56.7% (MY) to 86.6% (DB) of variation, supporting reliable biplot interpretation. Across complementary models, Bhima Shakti (G24), RO-1672 (G11), Bhima Kiran (G23) and RO-1773 (G19) consistently ranked among the top performers, exhibiting desirable stability profiles; MGIDI index further supported these selections. GGE delineated three mega environments for MY, DTH and TI, with vertex genotypes varying by trait, while AMMI biplots identified genotypes proximate to the origin as broadly stable. Environment ranking emphasized E6 (ICAR-DOGR, Pune) as most informative (discriminative and representative) for MY.
Discussion/Conclusion: Integrating BLUP with AMMI, GGE and multi-trait selection indices enhances accuracy of genotype recommendations, enabling the identification of high-performing and stable red onion cultivars across diverse Indian agro-ecologies.
1 Introduction
Onion (Allium cepa L.) is one of the world’s most widely cultivated and consumed vegetables, valued for its characteristic pungency, culinary versatility, and documented therapeutic properties (Gupta et al., 2025a, 2025b; Pareek et al., 2017; Singh and Khar, 2022). Indian onions are particularly renowned for their pungency and occur in a wide range of bulb colors—red, purple, pink, yellow, and white—many of which are associated with specific culinary uses and consumer preferences (Gupta et al., 2025b; Gokce et al., 2010). Red onions, in particular, are preferred by Indian consumers for everyday cooking, salads, chutneys, and pickles because of their color, flavor, and perceived freshness, and they also represent an important export class. In several production regions, red-skinned types command premium prices due to their favorable organoleptic and storage attributes, making varietal choice a key determinant of farmer income and marketability (Hassan, 2015).
In India, onion is cultivated in three cropping seasons—kharif (June–November), late kharif (August–March), and rabi (October–May)—to ensure year-round availability. The rabi crop accounts for nearly 60% of national production, while kharif and late kharif crops each contribute roughly 20% (Hiremath and Mantur, 2018). The crop is grown across most parts of the country, except in some regions of the northeast and Kerala (Dhotre et al., 2025). Onion’s substantial genetic variability provides opportunities for breeding; however, bulb yield, a complex polygenic trait influenced by bulb weight, maturity, and plant architecture, remains vulnerable to biotic stresses (purple blotch, anthracnose, Stemphylium blight, thrips) and abiotic stresses (drought, salinity, temperature extremes), as well as postharvest losses (Barnoh, 2021; Chaudhry et al., 2023; Ratnarajah and Gnanachelvam, 2021; Muhie, 2022). Although molecular breeding and high-throughput phenotyping have accelerated trait discovery (Sharma et al., 2024), environmental variability still strongly affects yield, quality, and storability, leading to high genotype × environment interaction (GEI)–driven inconsistencies in performance across locations (Gupta et al., 2024b; Khokhar, 2017).
To resolve such inconsistencies, multi-environment trials (METs) are essential for robust genotype evaluation and cultivar recommendation, enabling the identification of genotypes that combine high productivity with broad or specific adaptability (DeLacy et al., 1996). However, pervasive GEI complicates selection, as genotypic responses often change with location and season (Romagosa et al., 2013). Graphical-analytic methods such as the Additive Main effects and Multiplicative Interaction (AMMI) model and the Genotype and Genotype × Environment (GGE) biplot are particularly useful because they jointly represent genotype main effects and GEI in a single ordination space, facilitating intuitive visualization of “which-won-where” patterns and stability relationships (Gauch, 2006; Yan and Tinker, 2006).
AMMI decomposes GEI into interpretable interaction principal components, while best linear unbiased predictions (BLUPs) obtained via restricted maximum likelihood (REML) provide shrinkage-adjusted estimates of genotypic merit that accommodate unbalanced designs and heterogeneous error variances (Ajay et al., 2018; Farshadfar, 2008; Jambhulkar et al., 2014; Olivoto et al., 2019; Zali et al., 2012). Treating genotypic effects as random, indices such as the harmonic mean of the relative performance of genotypic values (HMRPGV) allow simultaneous selection for productivity, stability, and adaptability (De Resende and De Resende, 2002; Dos Santos et al., 2019). More recent multivariate tools, including the GYT (genotype-by-yield x trait) biplot and the MGIDI (multi-trait genotype-ideotype distance index) index, further enhance selection efficiency by integrating yield stability with multiple trait profiles (Yan and Fregeau-Reid, 2018; Olivoto and Nardino, 2021).
Despite these advances, previous studies on red onion have often been limited by the evaluation of a small number of genotypes, restricted environmental coverage, or single-trait selection approaches, which constrain the identification of broadly adapted and stable genotypes. Moreover, the effects of GEI on multi-trait performance and yield stability are not always fully captured by conventional methods, limiting actionable recommendations for breeders and stakeholders.
In this context, the present study evaluated 24 red onion genotypes across eight diverse rabi-season environments in India. By integrating AMMI, GGE biplot, and BLUP analyses with contemporary multi-trait selection indices including HMRPGV, MGIDI, and GYT, the study aimed to (i) quantify GEI and partition its components, (ii) identify high-yielding genotypes with broad or specific adaptation, and (iii) provide robust, evidence-based recommendations for breeding and targeted cultivar deployment. This integrated analytical framework combines graphical interpretation, interaction partitioning, and robust prediction to deliver both intuitive visuals and statistically sound rankings for genotype selection, addressing key limitations of prior studies and supporting enhanced productivity and stability in red onion improvement.
2 Materials and methods
2.1 Experimental site
The study was conducted during two consecutive rabi seasons (2023–2024) at eight agro-climatically diverse test locations in India. Since the same locations were used in both years, these were considered as eight fixed environments (E1–E8) for analysis rather than as 16 separate location–year combinations. The test sites included the ICAR–Indian Agricultural Research Institute (ICAR-IARI), New Delhi; Regional Research Station of the National Horticultural Research and Development Foundation (RRS-NHRDF), Karnal; Chandra Shekhar Azad University of Agriculture and Technology (CSAUAT), Kanpur; Jawaharlal Nehru Krishi Vishwavidyalaya (JNKVV), Jabalpur; Junagadh Agricultural University (JAU), Junagadh; ICAR–Directorate of Onion and Garlic Research (ICAR-DOGR), Pune; ICAR–Indian Institute of Horticultural Research (ICAR-IIHR), Bengaluru; and Tamil Nadu Agricultural University (TNAU), Coimbatore (Table 1). The seasonal weather parameters recorded at these locations are presented in Supplementary File 1.
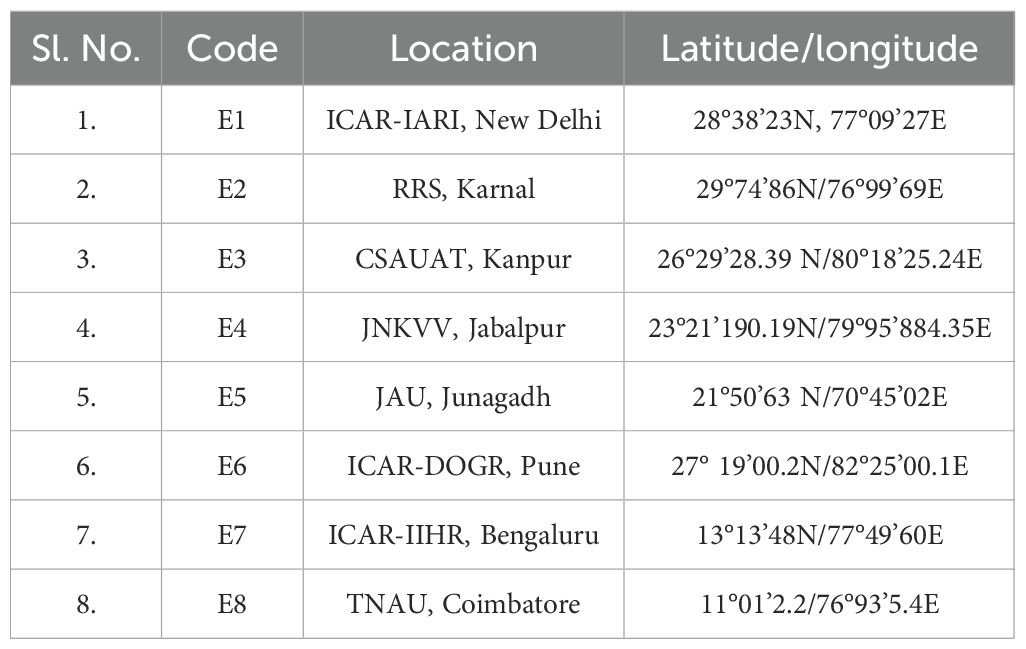
Table 1. Geographic details of the eight research environments (E1-E8) representing fixed locations evaluated across two consecutive rabi seasons (2023-24).
2.2 Plant materials and field trials
The experimental material comprised 24 red onion genotypes, including two checks (Table 2). Field trials were conducted during the rabi season of 2023–2024 across eight agro-ecologically distinct locations, following a randomized complete block design (RCBD) with three replications. Standard land preparation and crop management practices were adopted as per the guidelines of the ICAR–Directorate of Onion and Garlic Research (ICAR-DOGR), Pune. Transplanting was carried out using 45-day-old seedlings raised on nursery beds. Seedlings were established on raised beds measuring 1.0 m in width and 15 cm in height, with spacing of 15 × 10 cm (row × plant). Each replicate consisted of 70 plants, from which five plants were randomly sampled for trait evaluation, giving a total of 15 plants per genotype at each location. Harvesting was undertaken when more than 50% of the plants exhibited neck fall, indicating physiological maturity.
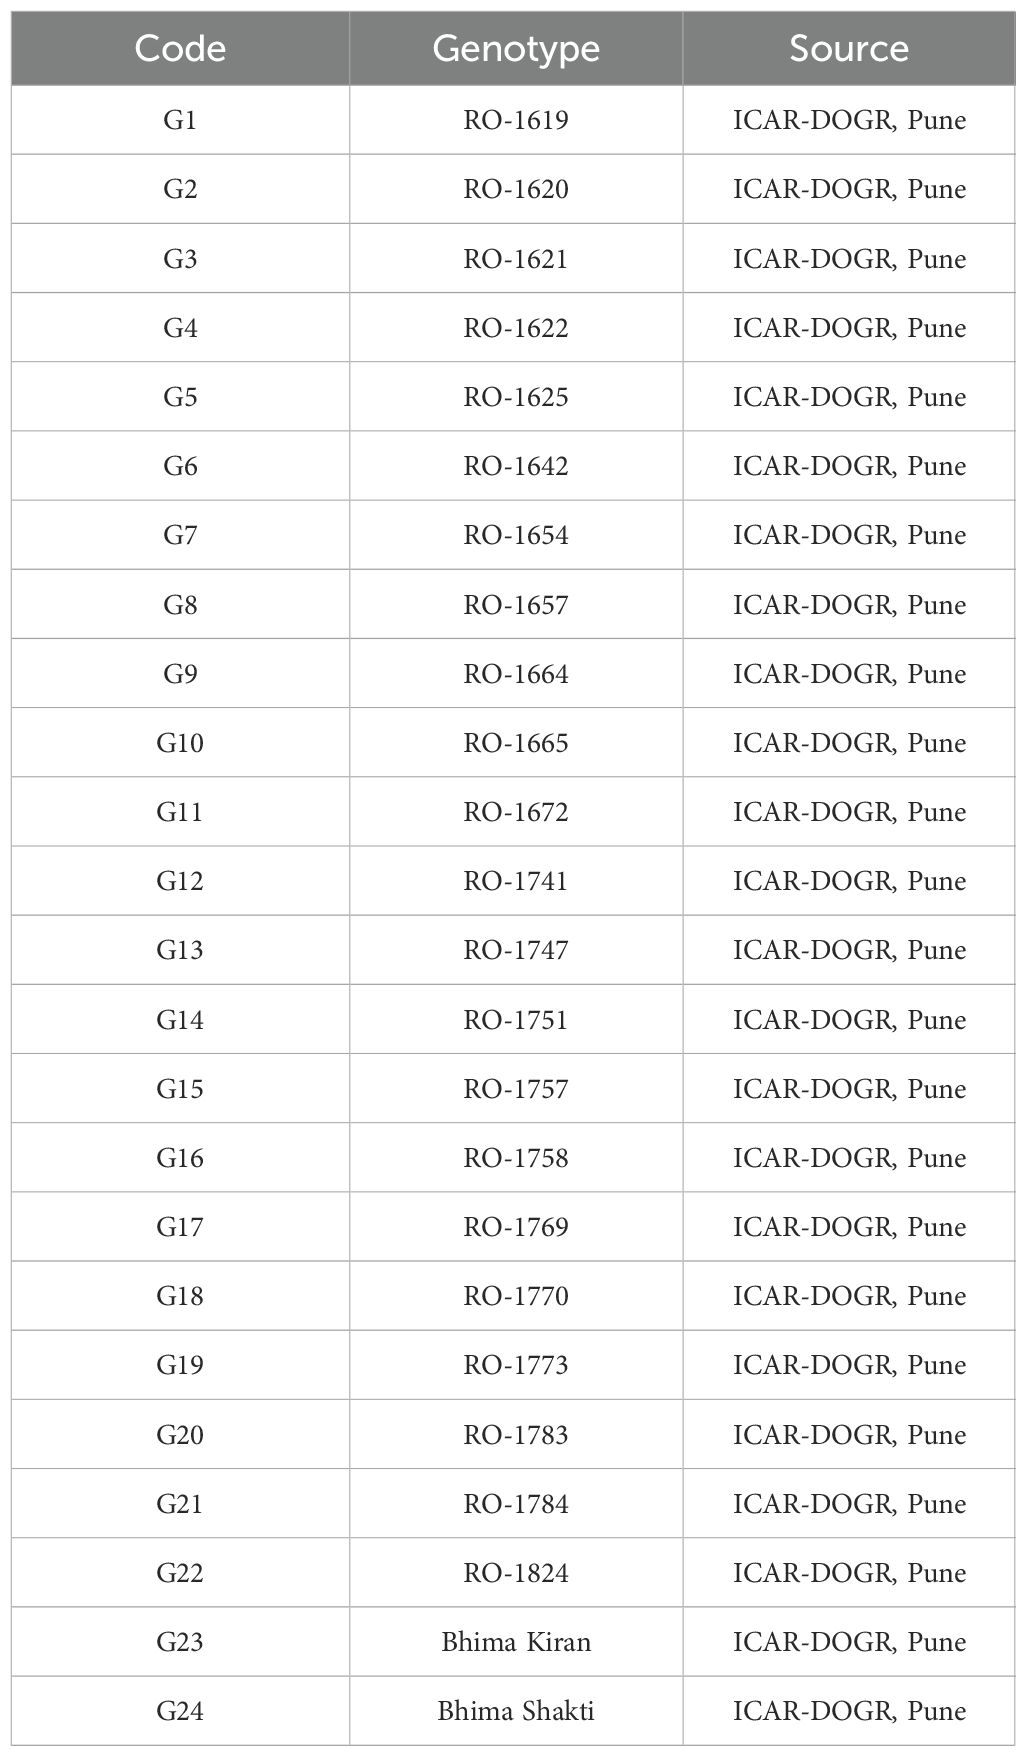
Table 2. List of 24 red onion genotypes included in this study.
2.3 Phenotypic data collection
Observations were recorded for six key traits: (i) marketable yield (q/ha), (ii) days to harvest, (iii) average bulb weight (g), (iv) total soluble solids (TSS, %), (v) double bulb formation (%), and (vi) thrips incidence (%). Marketable yield was estimated from the total weight of harvestable bulbs from all plants within each plot and expressed on a per-hectare basis. Average bulb weight was calculated as the mean weight of marketable bulbs from the sampled plants, while TSS content was determined using a hand-held refractometer. Thrips incidence was assessed visually using a 1–5 severity rating scale adapted from Smith et al. (1994), where 1 = 1%–20% foliage damage, 2 = 21%–40%, 3 = 41%–60%, 4 = 61%–80%, and 5 = 81%–100%. The percentage of double bulbs was computed as the proportion of sampled bulbs exhibiting splitting or twin-bulb formation.
2.4 Statistical analysis
All statistical analyses and graphical outputs were performed in R (version 2025.05.1) using the metan package. Data handling and plotting followed standard procedures for multi-environment trial (MET) analysis. Unless stated otherwise, tests were conducted at the 5% significance level. Data from each environment were inspected for entry errors and missing values, and summary statistics (means, standard deviations, coefficients of variation) were computed. Homogeneity of residual variances across environments was tested by Bartlett’s test (α = 0.05). Individual analyses of variance (ANOVA) were then performed separately for each environment to assess within-site genotypic variation. When Bartlett’s test indicated homogeneous variances, a combined ANOVA across environments was fitted to partition total variation into environment (E), genotype (G), and genotype × environment interaction (G×E) components. The combined ANOVA was based on the linear model (Equation 1):
where, yijk is the observed plot mean for genotype i in j environment and replication k; μ is the overall mean; gi is the genotype effect; ej is the environment effect; (ge)ij is the genotype × environment interaction; rk(j) is the replication effect nested within environment; and εijk; is the residual error. For the combined ANOVA reported in the results, genotypes and environments were treated as fixed effects to summarize observed performance and interaction patterns.
Best linear unbiased predictions (BLUPs) of genotypic effects were obtained from linear mixed models in which genotypes (and, where appropriate G×E) were modeled as random effects, and variance components were estimated by restricted maximum likelihood (REML). The mixed model used for BLUP estimation corresponded to the combined model above but with g (and/or (ge)ij depending on the specific analysis) treated as random. BLUPs were used to generate shrinkage-adjusted genotype means, rank genotypes, and compute prediction standard errors.
The additive main effects and multiplicative interaction (AMMI) and genotype × environment interaction (GGE) biplot models were used to visualize the winning genotypes and mega-environments (MEs) for yield-related traits (Yan et al., 2000). To support multi-trait selection, we computed the harmonic mean of the relative performance of genotypic values (HMRPGV) following De Resende and De Resende (2002) and the multi-trait genotype-ideotype distance index (MGIDI) as described by Olivoto and Nardino (2021), as follows (Equation 2):
where, is the score of the ith genotype on the jth factor (obtained from factor analysis or PCA), is the ideotype score for factor j, f is the number of retained factors, i= 1, 2, …, g indexes genotypes and j = 1, 2, ……, f indexes the factors. Prior to MGIDI computation, traits were oriented so that the desired direction (increase or decrease) was consistent, and factor scores were standardized when required by the method.
We also employed genotype-by-yield × trait (GYT) biplots to visualise multi-trait performance. For AMMI and GGE, the number of interaction axes retained for interpretation was chosen based on the proportion of interaction variance explained and graphical clarity. For factor-based index (MGIDI), the number of factors retained followed Kaiser’s criterion (eigenvalues > 1) and examination of the scree plot. For all models, estimated variance components, BLUPs, mean squares, F-values and the percentage variance explained by model terms or axes are reported in the results together with the associated significance levels.
3 Results
Pooled ANOVA indicated significant differences (P < 0.05) among genotypes across environments (Supplementary File 2), confirming substantial genetic variability. Based on pooled means, Bhima Shakti achieved the highest yield (330.34 q/ha), followed by Bhima Kiran (302.23 q/ha), while RO-1824 recorded the lowest (211.33 q/ha). Similarly, RO-1620 and RO-1622 were earliest to harvest, whereas Bhima Kiran was late maturing. Detailed descriptive performance across environments is provided in Supplementary Files 2, 3.
3.1 BLUP-based summary of yield-related traits across environments
To obtain more robust rankings that account for environmental variation, BLUP-based stability indices were computed (Table 3). Across traits, Bhima Shakti (G24), Bhima Kiran (G23), RO-1769 (G17), RO-1773 (G19), and RO-1672 (G11) emerged as consistently high- and stable-yielding genotypes. For days to harvest, RO-1620 (G2), RO-1622 (G4), and RO-1619 (G1) matured earliest, while for average bulb weight, Bhima Shakti (G24), RO-1672 (G11), Bhima Kiran (G23), RO-1773 (G19), and RO-1620 (G2) were superior. Regarding TSS, RO-1784 (G21), Bhima Kiran (G23), and Bhima Shakti (G24), along with RO-1654 (G7), recorded the highest values. For double-bulb formation, most genotypes showed above-mean values, although RO-1769 (G17) and RO-1770 (G18) consistently displayed the lowest. For thrips incidence, RO-1642 (G6), RO-1751 (G14), and RO-1654 (G7) were identified as the most resistant.
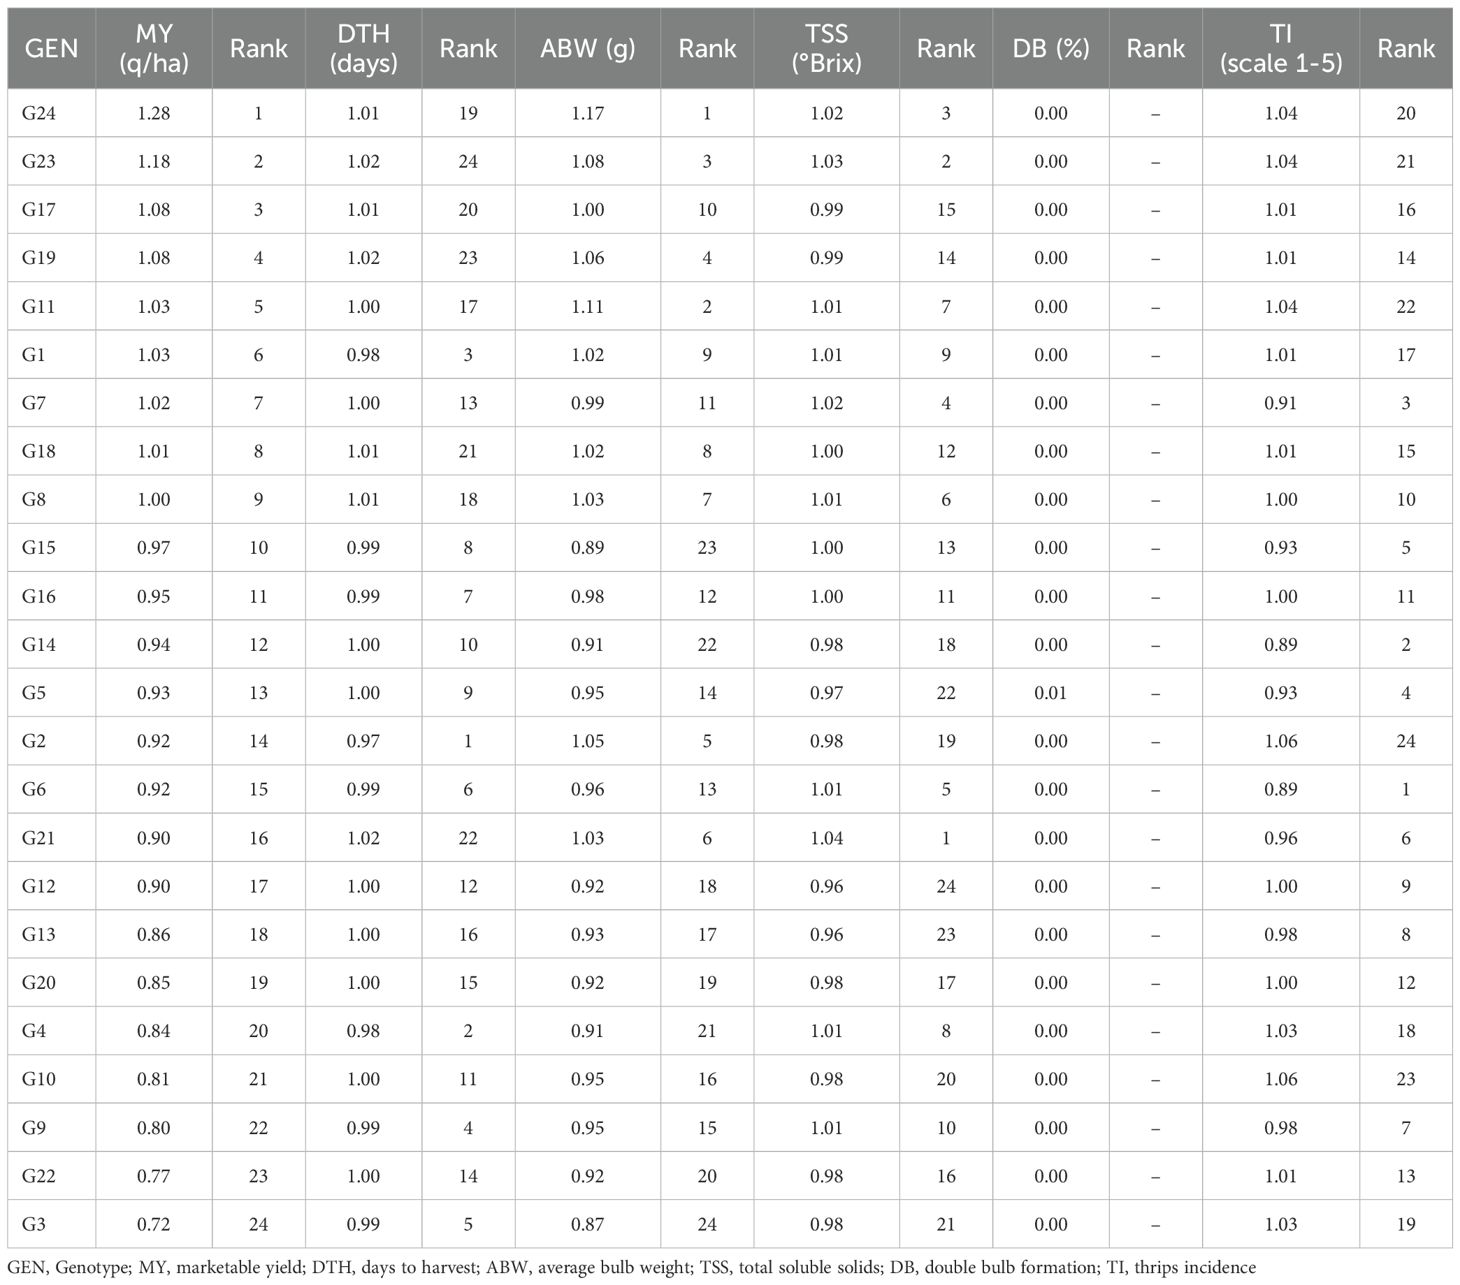
Table 3. HMRPGV-based BLUP scores for onion yield-related traits.
Overall, BLUP results largely supported pooled mean performance while refining genotype rankings, thereby providing a more reliable basis for selecting genotypes with wide adaptation (Bhima Shakti, Bhima Kiran, RO-1672), as well as those with specific advantages such as early maturity (RO-1620), low double-bulb incidence (RO-1769, RO-1770), and thrips resistance (RO-1751, RO-1642). Trait-wise, the top-performing environments were as follows: E6 > E7 > E5 for marketable yield; E4 > E6 > E2 for days to harvest; E7 > E6 > E5 for average bulb weight; E5 > E2 > E3 for TSS; E1 = E8 > E5 for double bulbs; and E7 > E2 = E3 = E4 = E8 for thrips incidence (Supplementary File 3).
3.2 Genotype evaluation using GGE biplot
The combined ANOVA based on the GGE biplot approach revealed statistically significant differences (P < 0.05) among genotypes, environments, and their interactions (G × E) for all six evaluated traits: marketable yield, days to harvest, average bulb weight, TSS, double bulbs, and thrips incidence (Table 4). The biplot analysis effectively explained a considerable proportion of the total variation through the first two principal components (PC1 and PC2), with cumulative variation ranging from 55% to 85% depending on the trait. Specifically, the proportion of variation explained by PC1 and PC2 was 56.74% for marketable yield, 78.44% for days to harvest, 61.87% for average bulb weight, 58.02% for TSS, 86.55% for double bulbs, and 82.06% for thrips incidence. Thus, the first two principal components successfully captured a substantial share of the total variability across the eight environments (Figure 1).
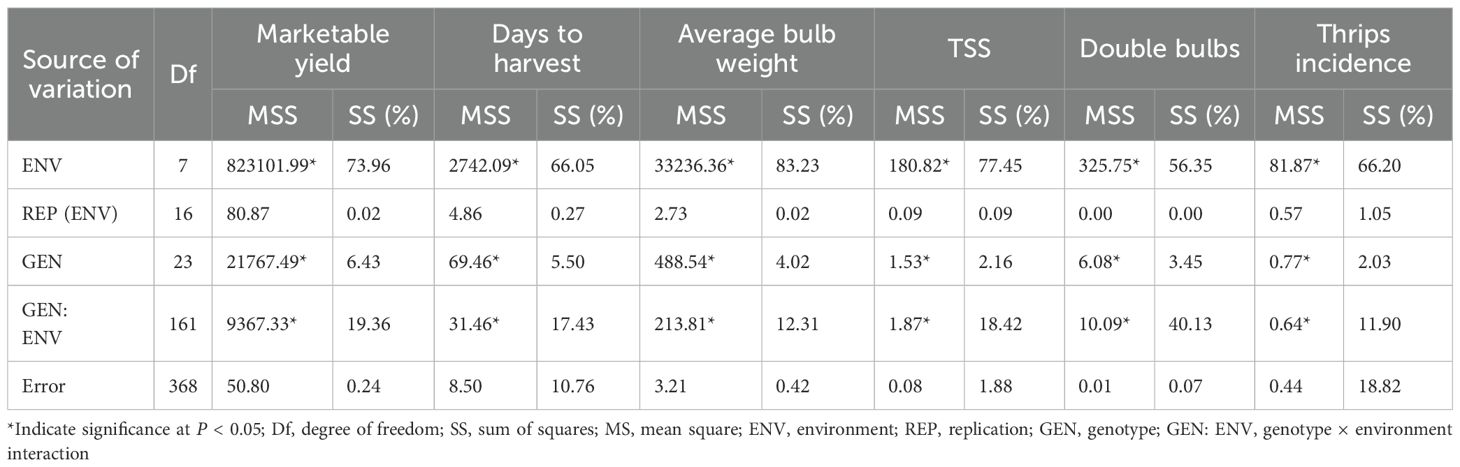
Table 4. Combined analysis of variance using GGE biplot approach.
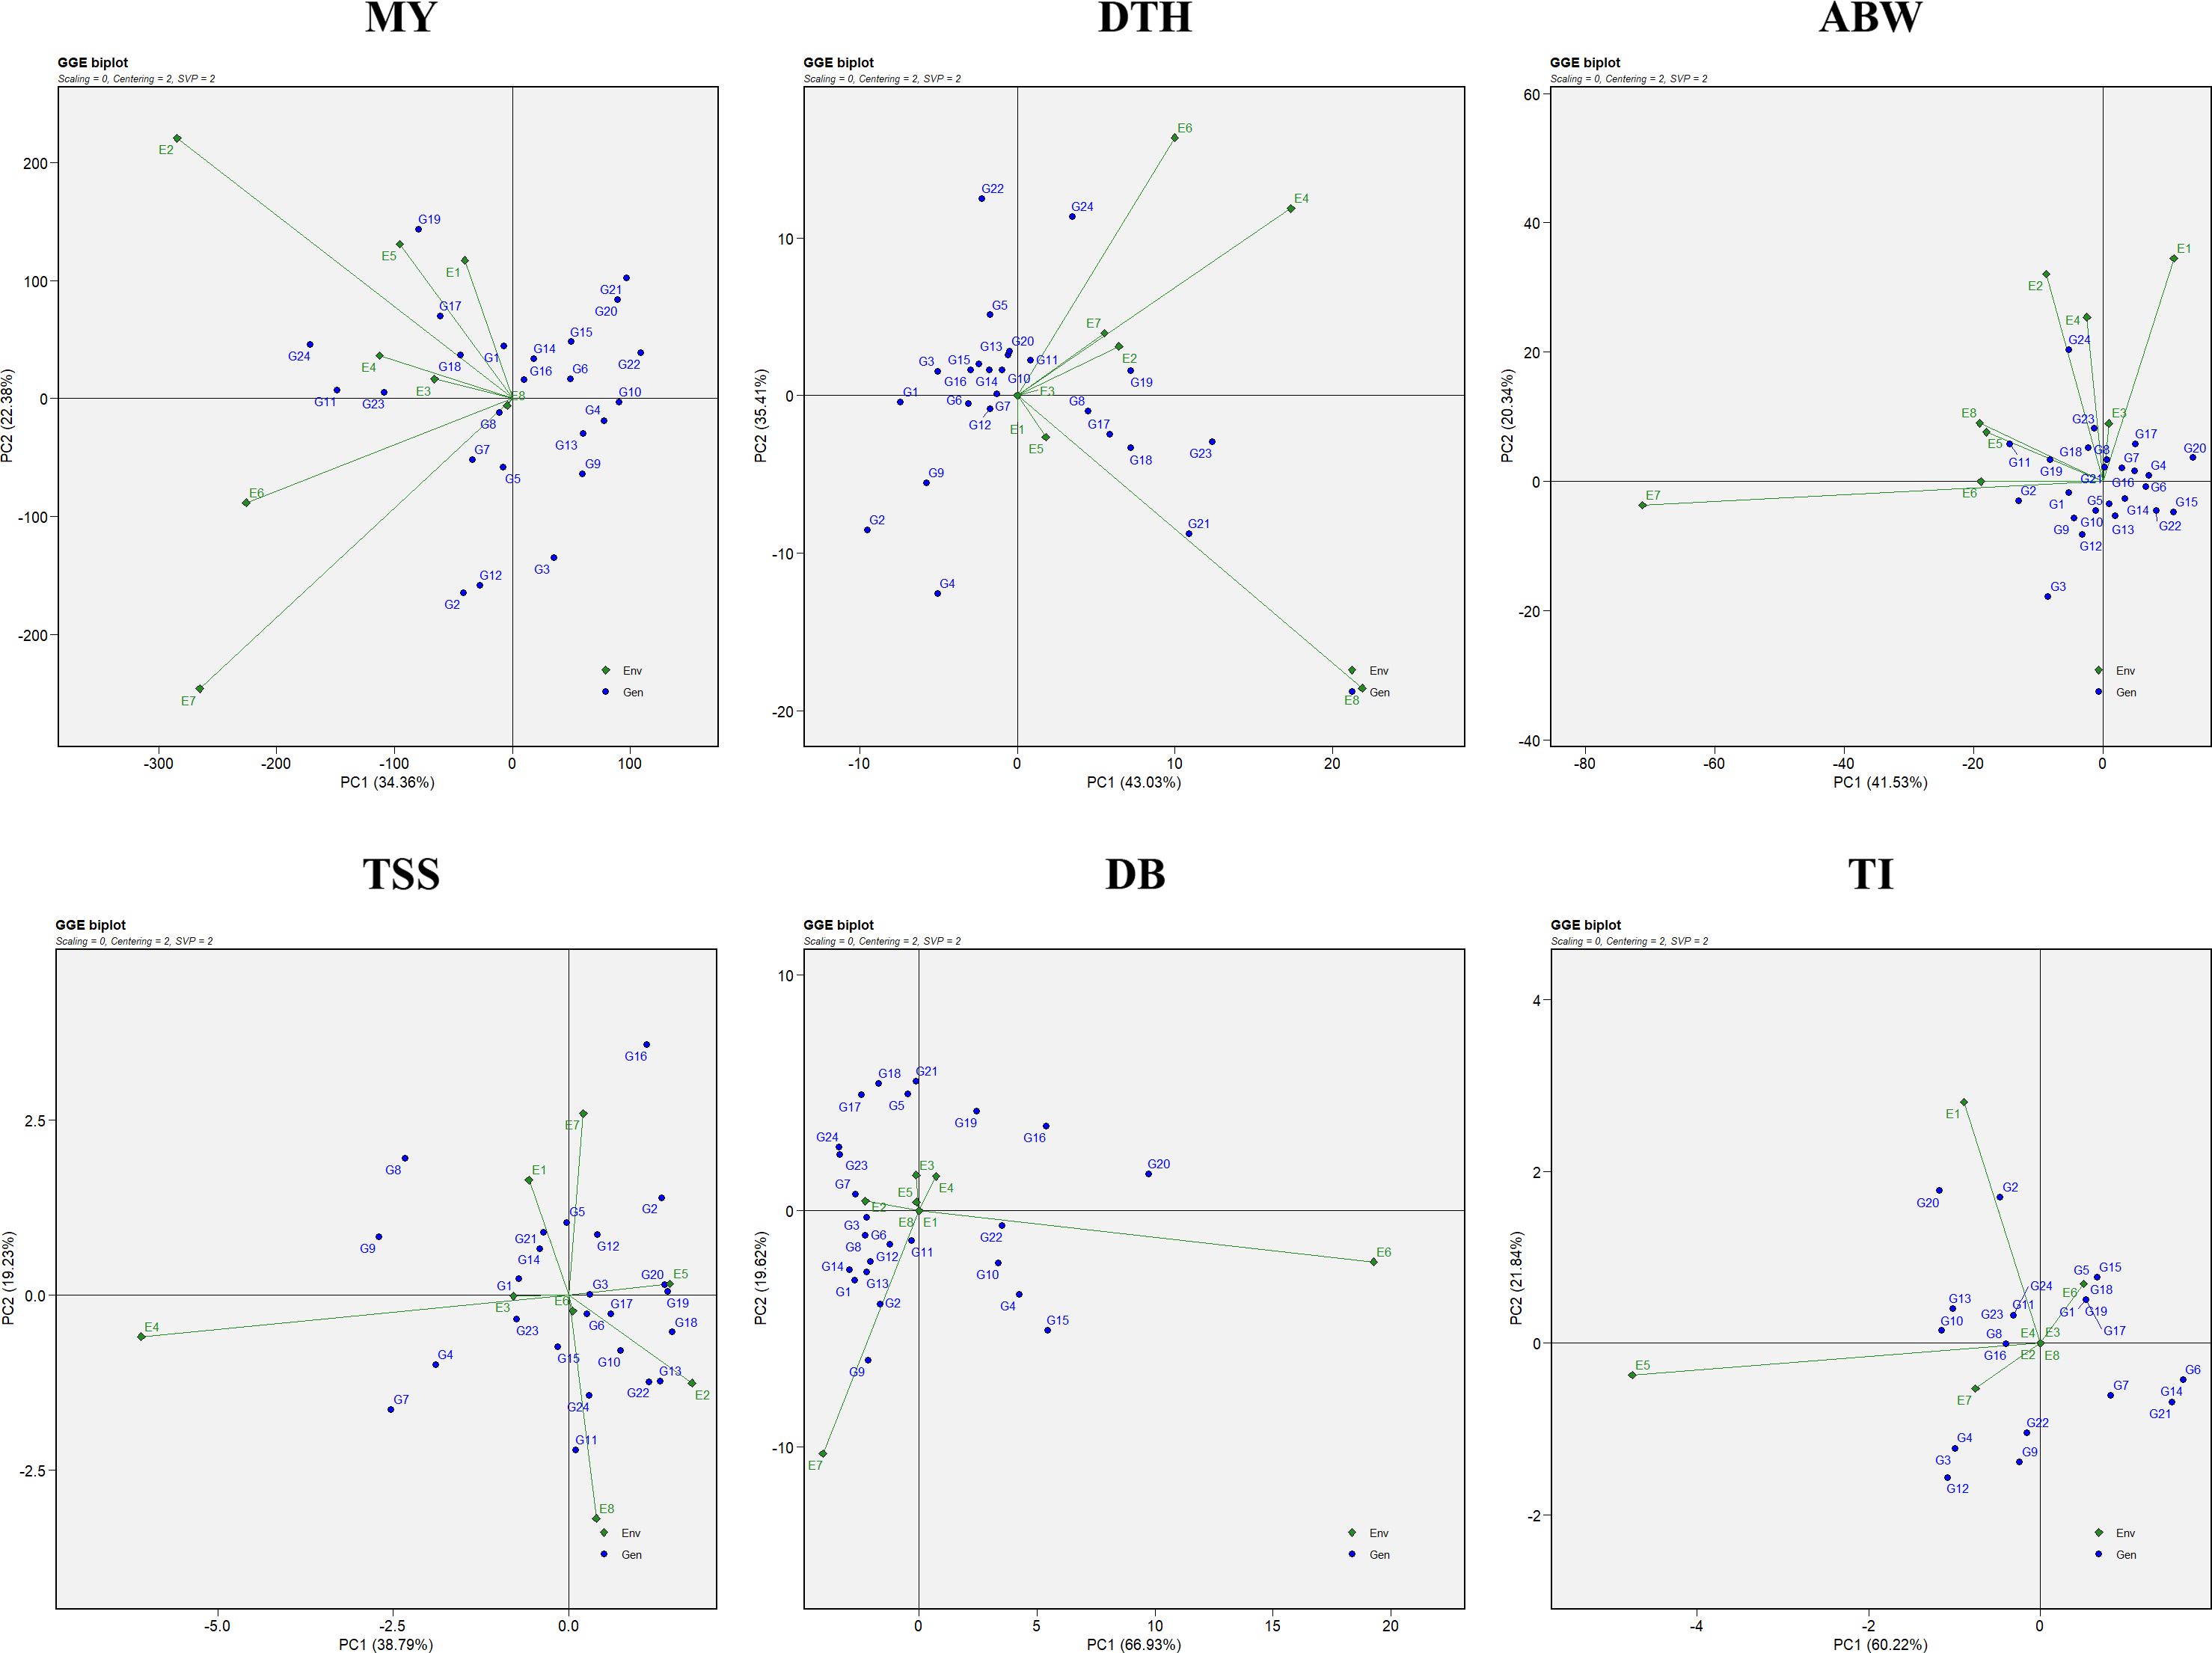
Figure 1. GGE biplot representation of onion genotypes for the evaluated traits: MY, marketable yield; DTH, days to harvest; ABW, average bulb weight; TSS, total soluble solids; DB, double bulb formation; and TI, thrips incidence.
3.2.1 Stability assesment using average environment coordination view
Genotypic performance and stability were evaluated using the average environment coordination (AEC) view of the GGE biplot (Figure 2). The horizontal axis (x-axis) represents the average performance of genotypes across environments, derived from the mean PC1 and PC2 scores. The arrow along this axis points toward genotypes with higher average performance. The vertical axis (y-axis), perpendicular to the average environment axis, reflects genotype stability, with genotypes located closer to this axis considered more stable and those farther away regarded as less stable (Yan and Tinker, 2006). For marketable yield, the most stable genotypes included G4 (RO-1622), G24 (Bhima Shakti), G13 (RO-1747), and G8 (RO-1657). Notably, genotypes G24 (Bhima Shakti), G11 (RO-1672), G23 (Bhima Kiran), and G18 (RO-1770) combined both high yield potential and stability.
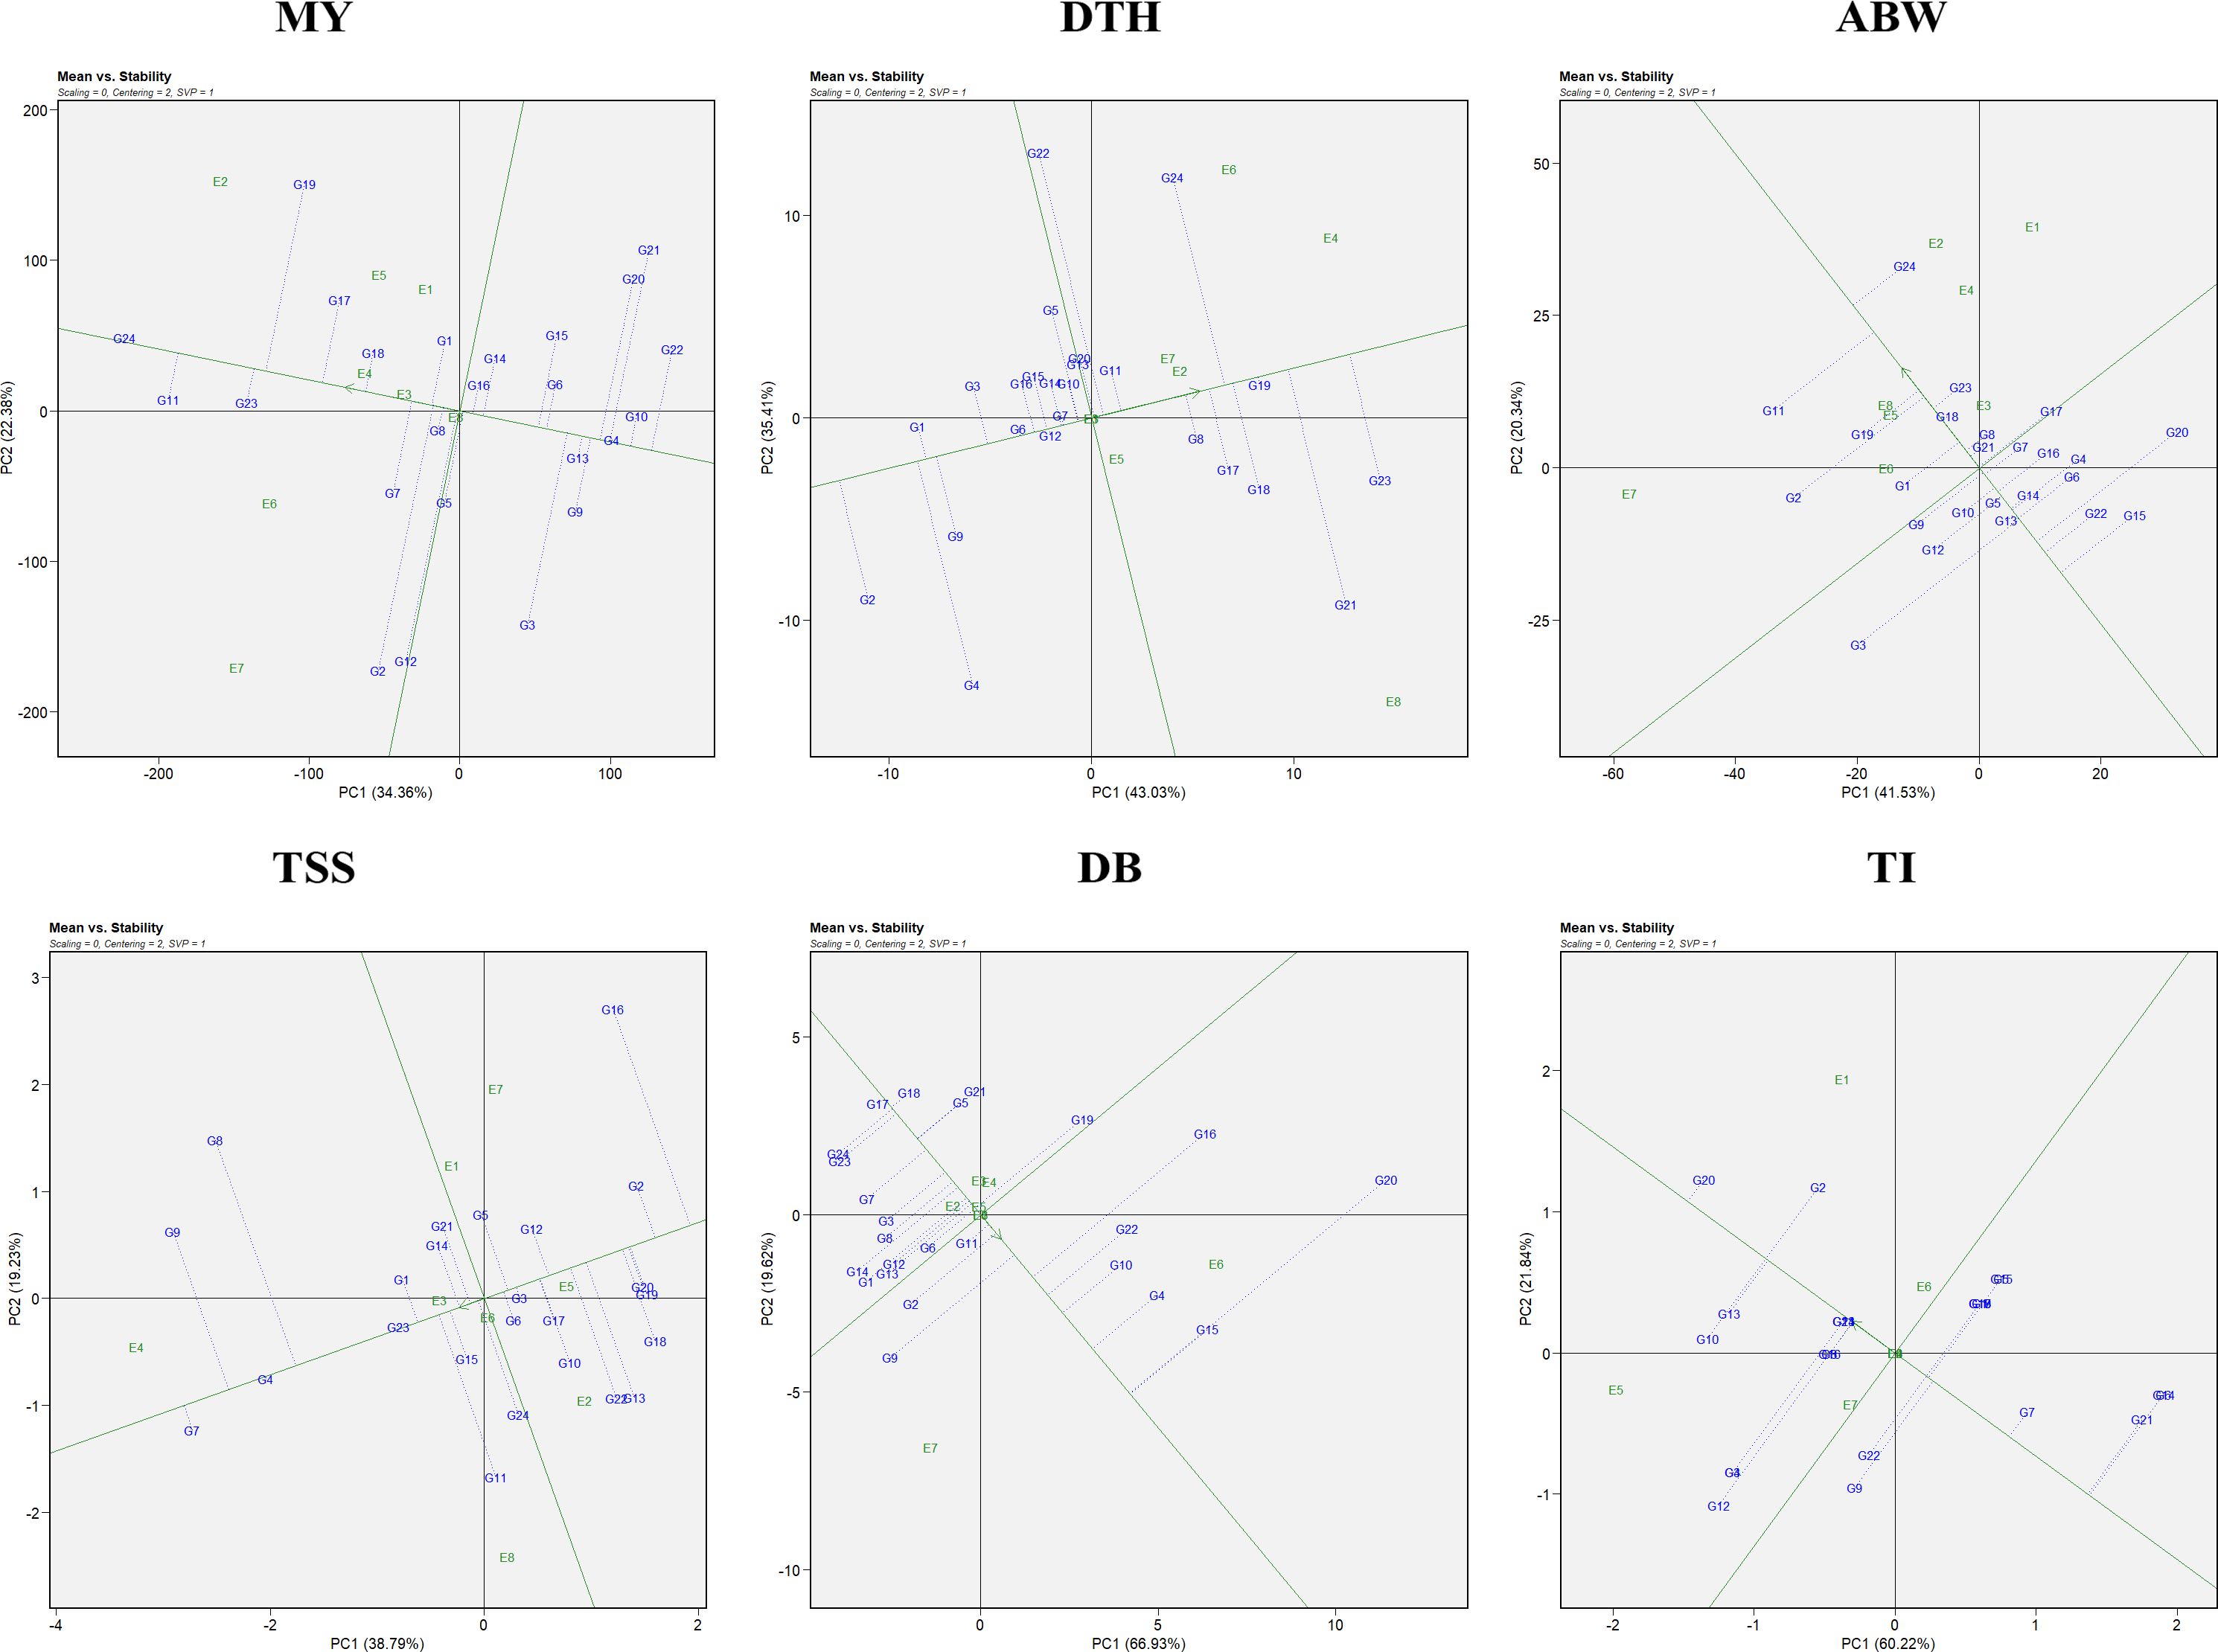
Figure 2. Mean vs stability representation of the GGE biplot for evaluated traits: MY: marketable yield; DTH, days to harvest; ABW, average bulb weight; TSS, total soluble solids; DB, double bulb formation; and TI, thrips incidence.
In the case of days to harvest, the most stable genotypes were G6 (RO-1642), G12 (RO-1741), G19 (RO-1773), and G7 (RO-1654), while G1 (RO-1619), G6 (RO-1642), G12 (RO-1741), and G7 (RO-1654) demonstrated both earliness and stability across environments. For average bulb weight, stability was greatest in G18 (RO-1770), G5 (RO-1625), and G13 (RO-1747). Notably, genotypes G24 (Bhima Shakti), G19 (RO-1773), G23 (Bhima Kiran), and G18 (RO-1770) emerged as both productive and stable. For TSS, genotypes G4 (RO-1622), G23 (Bhima Kiran), and G3 (RO-1621) were identified as the most stable, whereas G7 (RO-1654), G4 (RO-1622), and G23 (Bhima Kiran) excelled in both performance and stability. For double-bulb formation, genotypes G17 (RO-1769), G18 (RO-1770), G24 (Bhima Shakti), and G23 (Bhima Kiran) had the lowest values, with G17 (RO-1769), G18 (RO-1770), and G11 (RO-1672) being both stable and superior in performance. For thrips incidence, G23 (Bhima Kiran) and G24 (Bhima Shakti) demonstrated high stability. Notably, G7 (RO-1654), G23 (Bhima Kiran), and G24 (Bhima Shakti) were identified as ideal genotypes with both low thrips incidence and consistent performance.
3.2.2 Mega-environment analysis
The “which-won-where” pattern of the GGE biplot facilitates visualization of genotype performance across multiple environments by dividing the biplot into sectors, each representing a different mega-environment (Figure 3). The polygon was constructed by connecting genotypes that were farthest from the biplot origin, with vertex genotypes representing either the highest or lowest performance in specific environments. Equality lines perpendicular to the polygon sides delineated the sectors and enabled the identification of winning genotypes for each group of environments. Based on this analysis, three mega-environments were identified for marketable yield, days to harvest, and thrips incidence; two mega-environments for average bulb weight; five mega-environments for TSS; and four mega-environments for double-bulb formation.
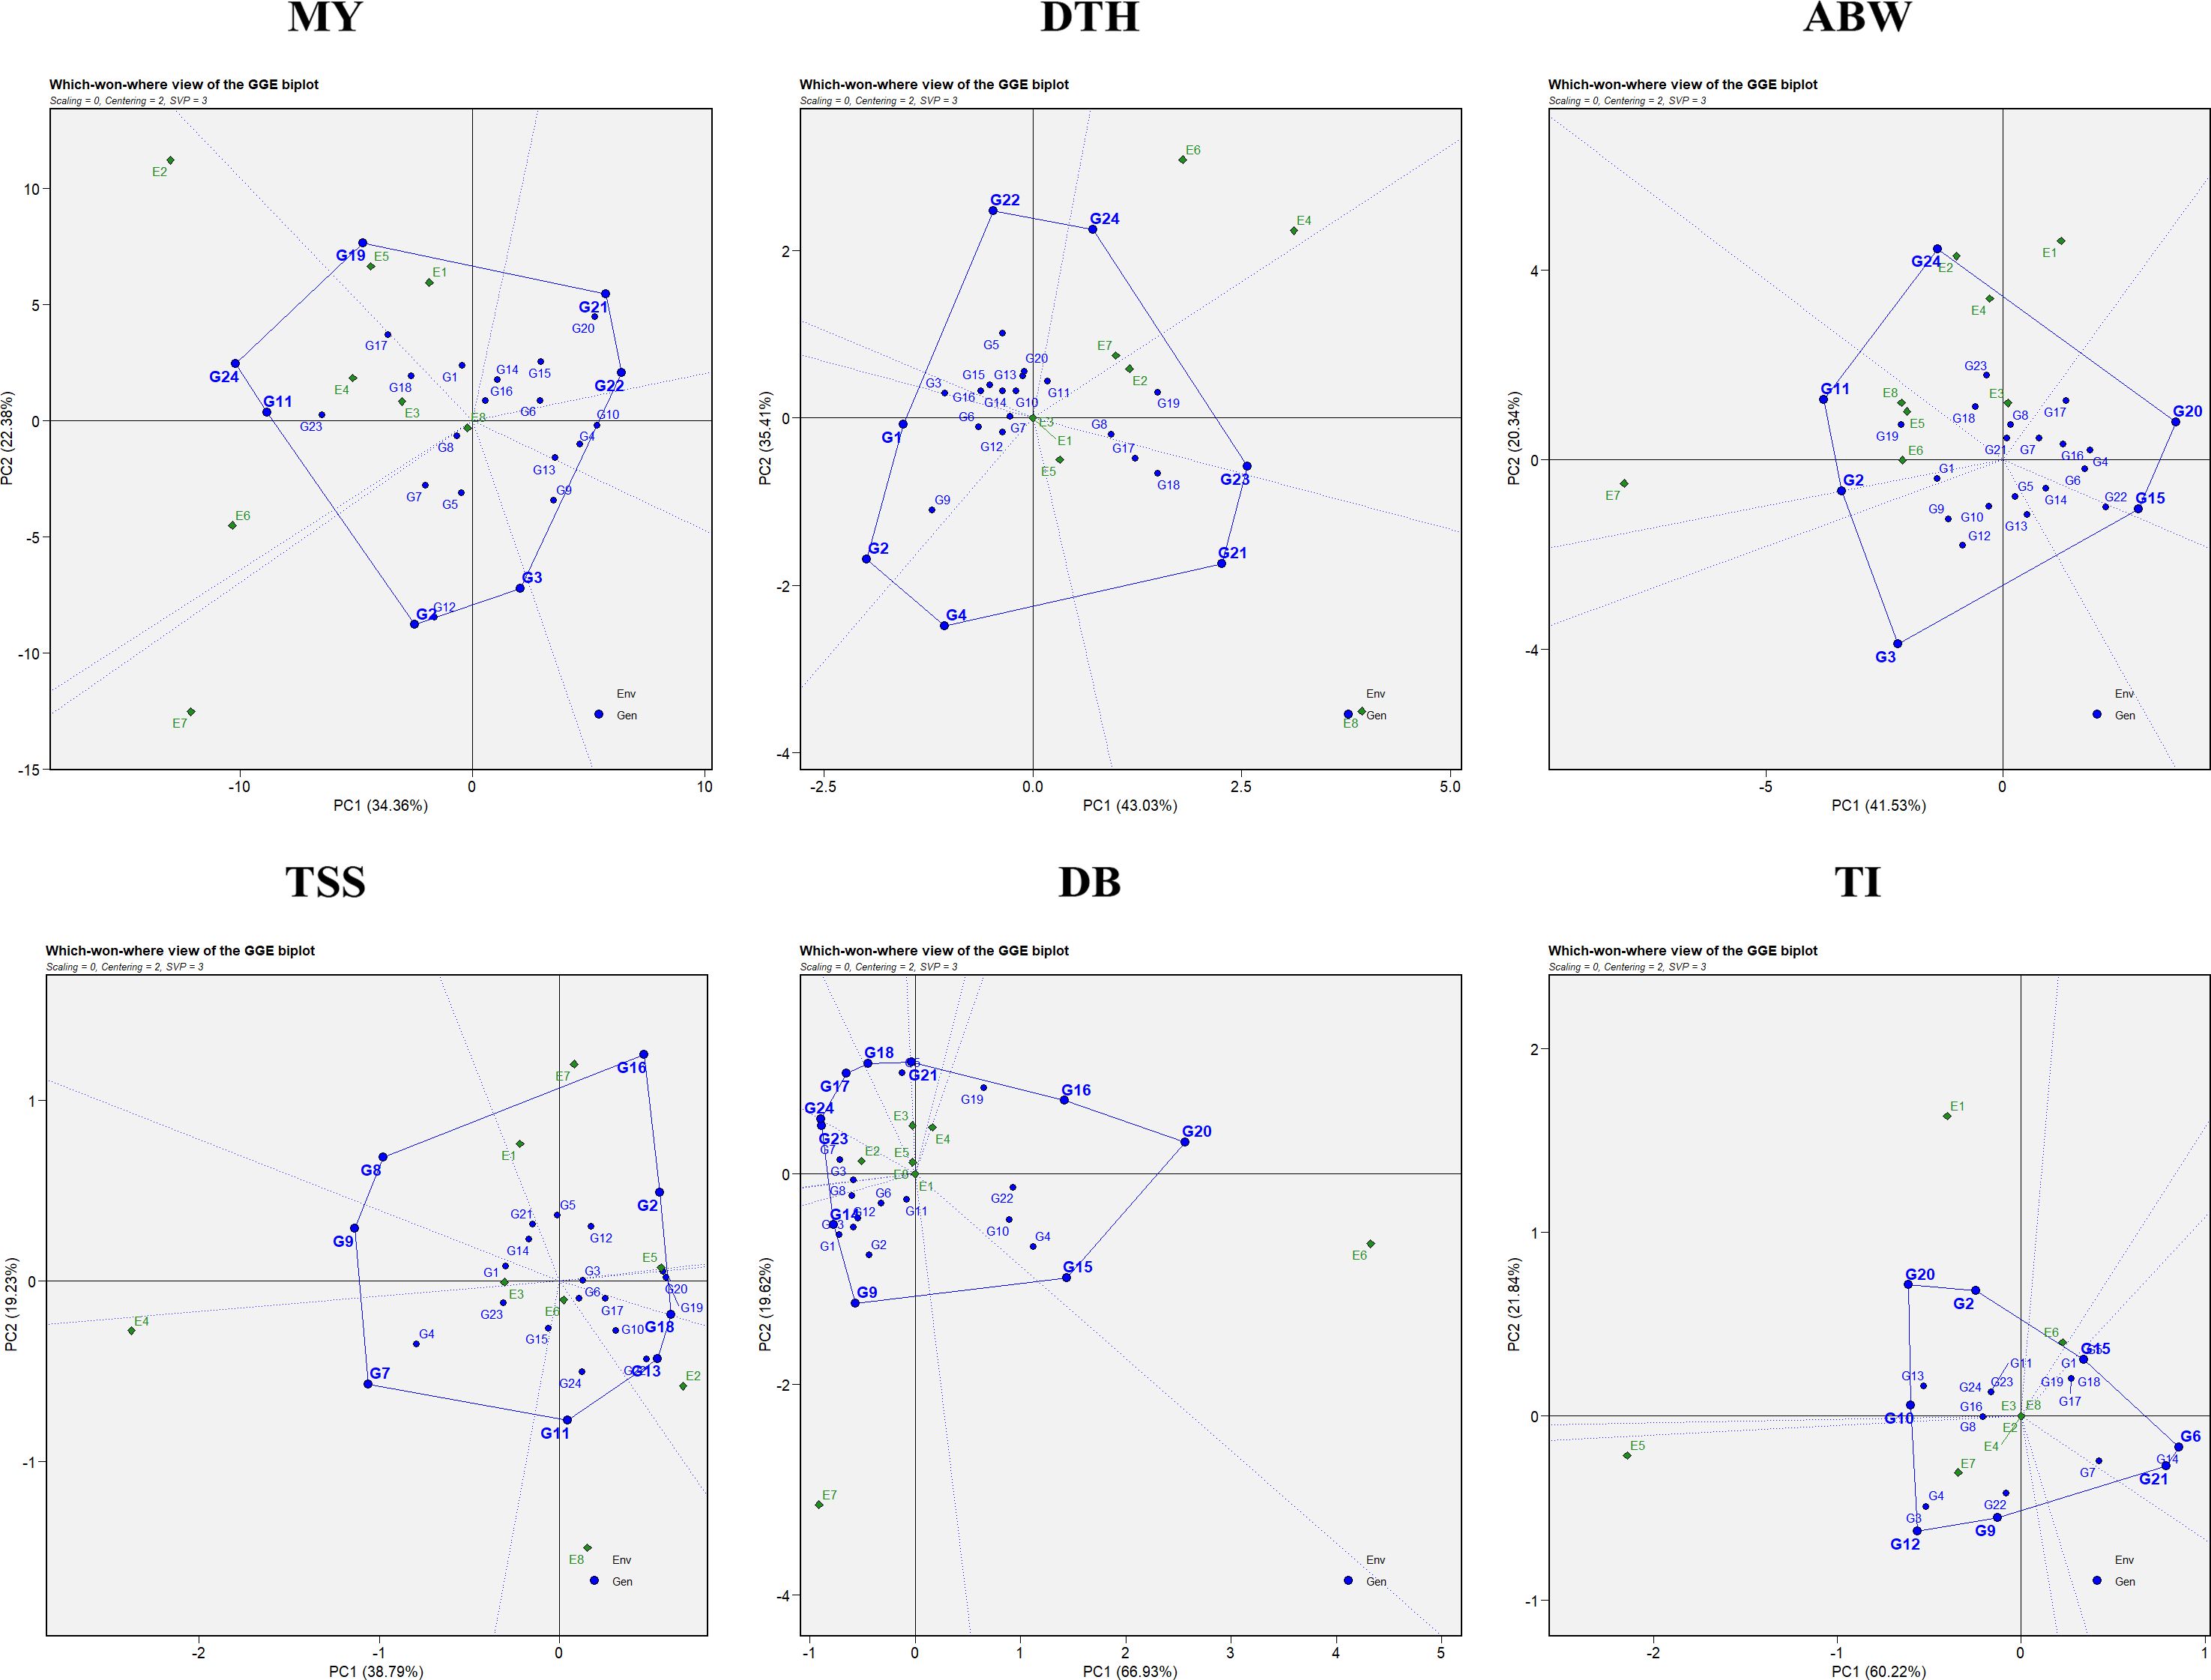
Figure 3. Which-won-where polygon view of the GGE biplot for evaluated traits: MY: marketable yield; DTH: days to harvest; ABW: average bulb weight; TSS: total soluble solids; DB: double bulb formation; and TI: thrips incidence.
For marketable yield, environments E7 and E8 grouped into the first mega-environment with G2 and G3 as winners; E2, E3, E4, and E6 formed the second mega-environment with G11 and G24 as winners, while E1 and E5 constituted the third mega-environment with G19 as the top performer. For days to harvest, E1, E3, E5, and E8 formed the first mega-environment, where G21 was the best performer; E2 represented the second mega-environment with G23 as winner; and the remaining environments clustered into a third mega-environment with G24 as winner. For average bulb weight, E5, E6, E7, and E8 grouped into one mega-environment dominated by G11, whereas the remaining environments formed a second mega-environment where G24 excelled.
For TSS, five distinct mega-environments were observed: E1, E5, and E7 grouped together with G2 and G16 as winners; E3 represented a single-environment cluster with G9 as winner; E4 formed another with G7; E6 and E8 clustered together with G11 as the best, while E2 grouped separately with G13 and G18 as winners. For double-bulb formation, four mega-environments were defined: E1, E7, and E8 grouped together with G9 and G14 as winners; E4 and E6 formed another with G15, G16, and G20; E3 and E5 clustered together with G18 and G21; and E2 represented the fourth with G23 and G24. For thrips incidence, E2, E3, E4, E5, E7, and E8 grouped into a broad mega-environment where G9 and G12 performed best; E1 formed a second mega-environment with G2, G10, and G20 as winners, while E6 represented a third cluster with G15 as winner.
3.2.3 Evaluating ideal environments: discriminativeness vs representativeness
Assessment of an ideal environment is fundamental for identifying superior genotypes adapted to specific multi-environments (MEs). Discriminativeness refers to an environment’s ability to distinguish among genotypes and is reflected by the length of its vector in the GGE biplot. Representativeness is determined by the angle between the environment’s vector and the AEC axis, with an acute angle signifying high representativeness. An ideal environment possesses both a long vector (high discriminativeness) and a small angle with the AEC axis (high representativeness).
In this study, E6 emerged as the most effective environment for evaluating marketable yield and double-bulb formation; E4 for days to harvest and TSS; E5 for thrips incidence; and E8 for average bulb weight (Figure 4). These environments provided optimal conditions for selecting stable, well-adapted genotypes. In contrast, environments such as E7 (for marketable yield, average bulb weight, and double-bulb formation), E8 (for days to harvest and TSS), and E1 (for thrips incidence) were highly discriminative but less representative. Overall, E6 (ICAR–DOGR, Pune) and E4 (JNKVV, Jabalpur) were identified as the most suitable test environments for onion trait evaluation, offering both strong discrimination and reliable representativeness of overall performance trends.
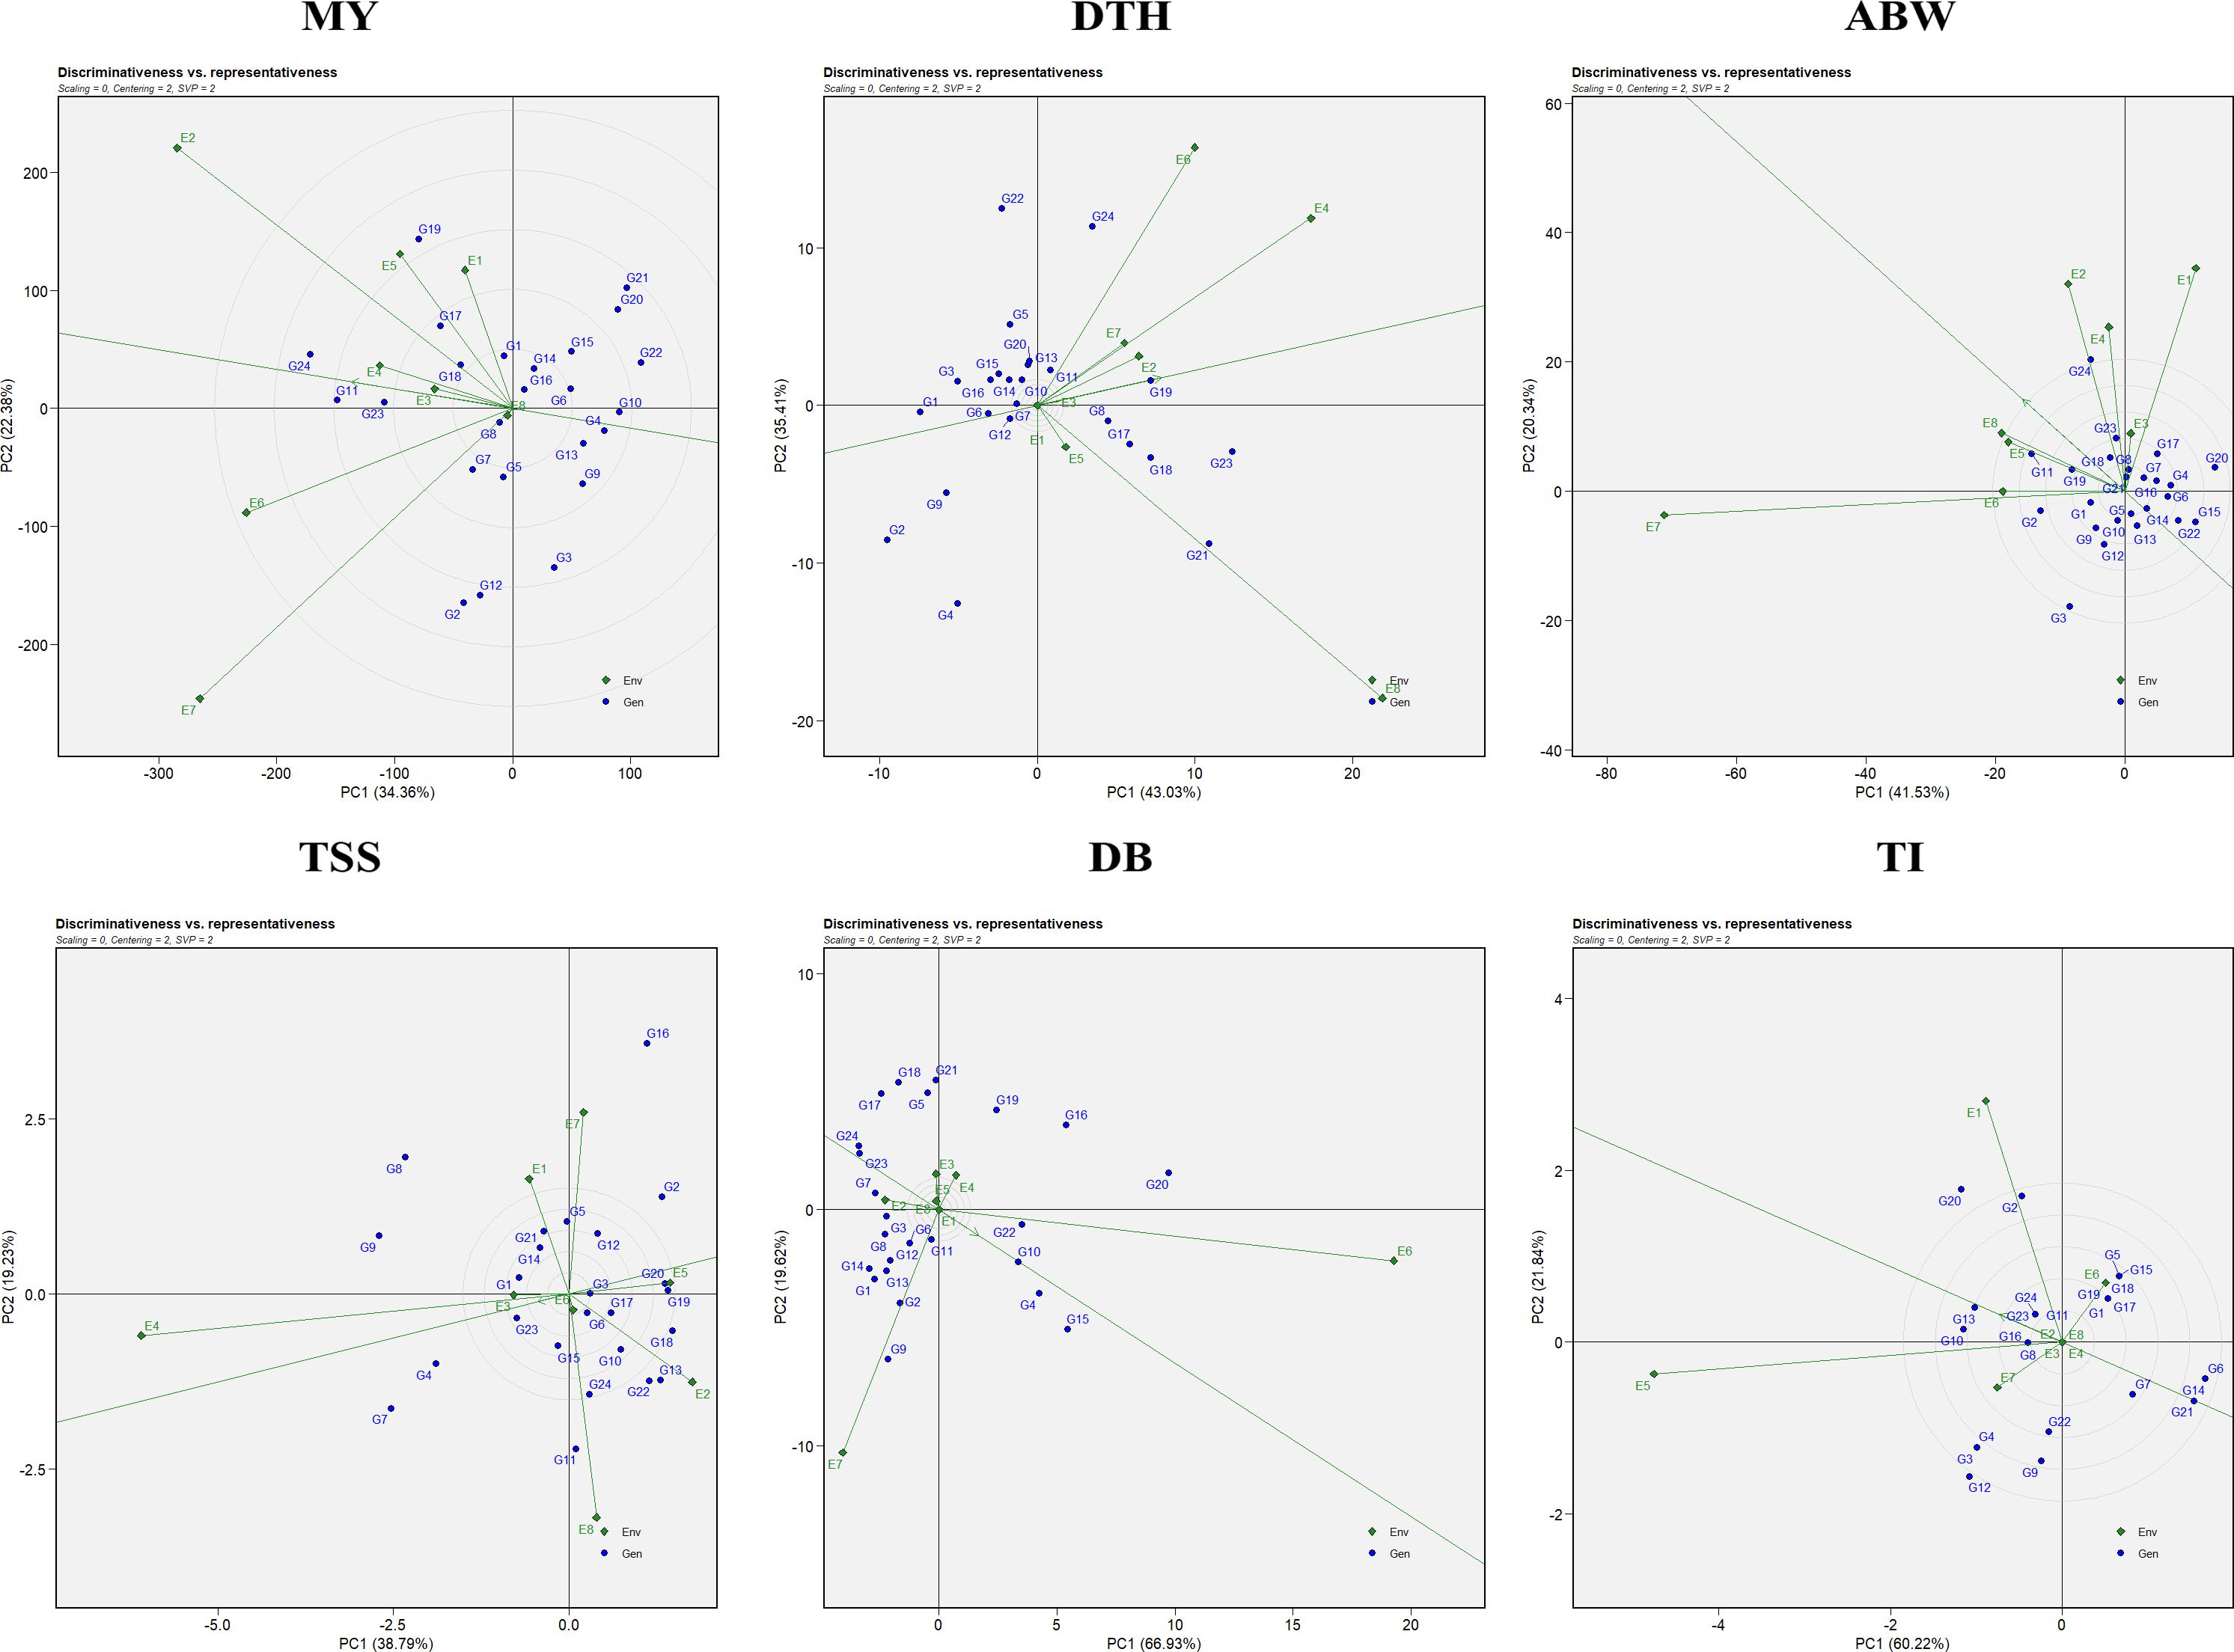
Figure 4. Discriminativeness vs. representativeness view of the GGE biplot for evaluated traits: MY, marketable yield; DTH, days to harvest; ABW, average bulb weight; TSS, total soluble solids; DB, double bulb formation; and TI, thrips incidence.
3.2.4 Ranking genotypes and environments using GGE biplot
The GGE biplot facilitates the identification of both superior genotypes and favorable test environments across multiple traits. An ideal genotype is defined as one that combines high mean performance with consistent stability across diverse environments. In the biplot (Figure 5), the ideal genotype is represented at the center of the innermost concentric circle, and genotypes positioned closer to this reference point are regarded as more suitable candidates for selection and breeding. For marketable yield, G24 (Bhima Shakti) was ranked as the ideal performer, followed by G11 (RO-1672), G23 (Bhima Kiran), G17 (RO-1769), and G19 (RO-1773). For days to harvest, G2 (RO-1620) was the earliest-maturing genotype, followed by G4 (RO-1622), while G19 (RO-1773) and G23 (Bhima Kiran) were late maturing. In terms of average bulb weight, G24 (Bhima Shakti) was closest to the ideal genotype, with G11 (RO-1672), G19 (RO-1773), and G23 (Bhima Kiran) showing competitive performance. For TSS, G7 (RO-1654) was the top-ranking genotype, followed by G4 (RO-1622), G9 (RO-1664), and G23 (Bhima Kiran). With respect to double-bulb percentage, G17 (RO-1769) and G18 (RO-1770) recorded the lowest (desirable) values, whereas G15 (RO-1757) and G4 (RO-1622) had higher (undesirable) values. For thrips incidence, genotypes G6 (RO-1642), G14 (RO-1751), and G21 (RO-1784) exhibited the highest resistance, while G20 (RO-1783) showed the highest incidence among all evaluated genotypes.
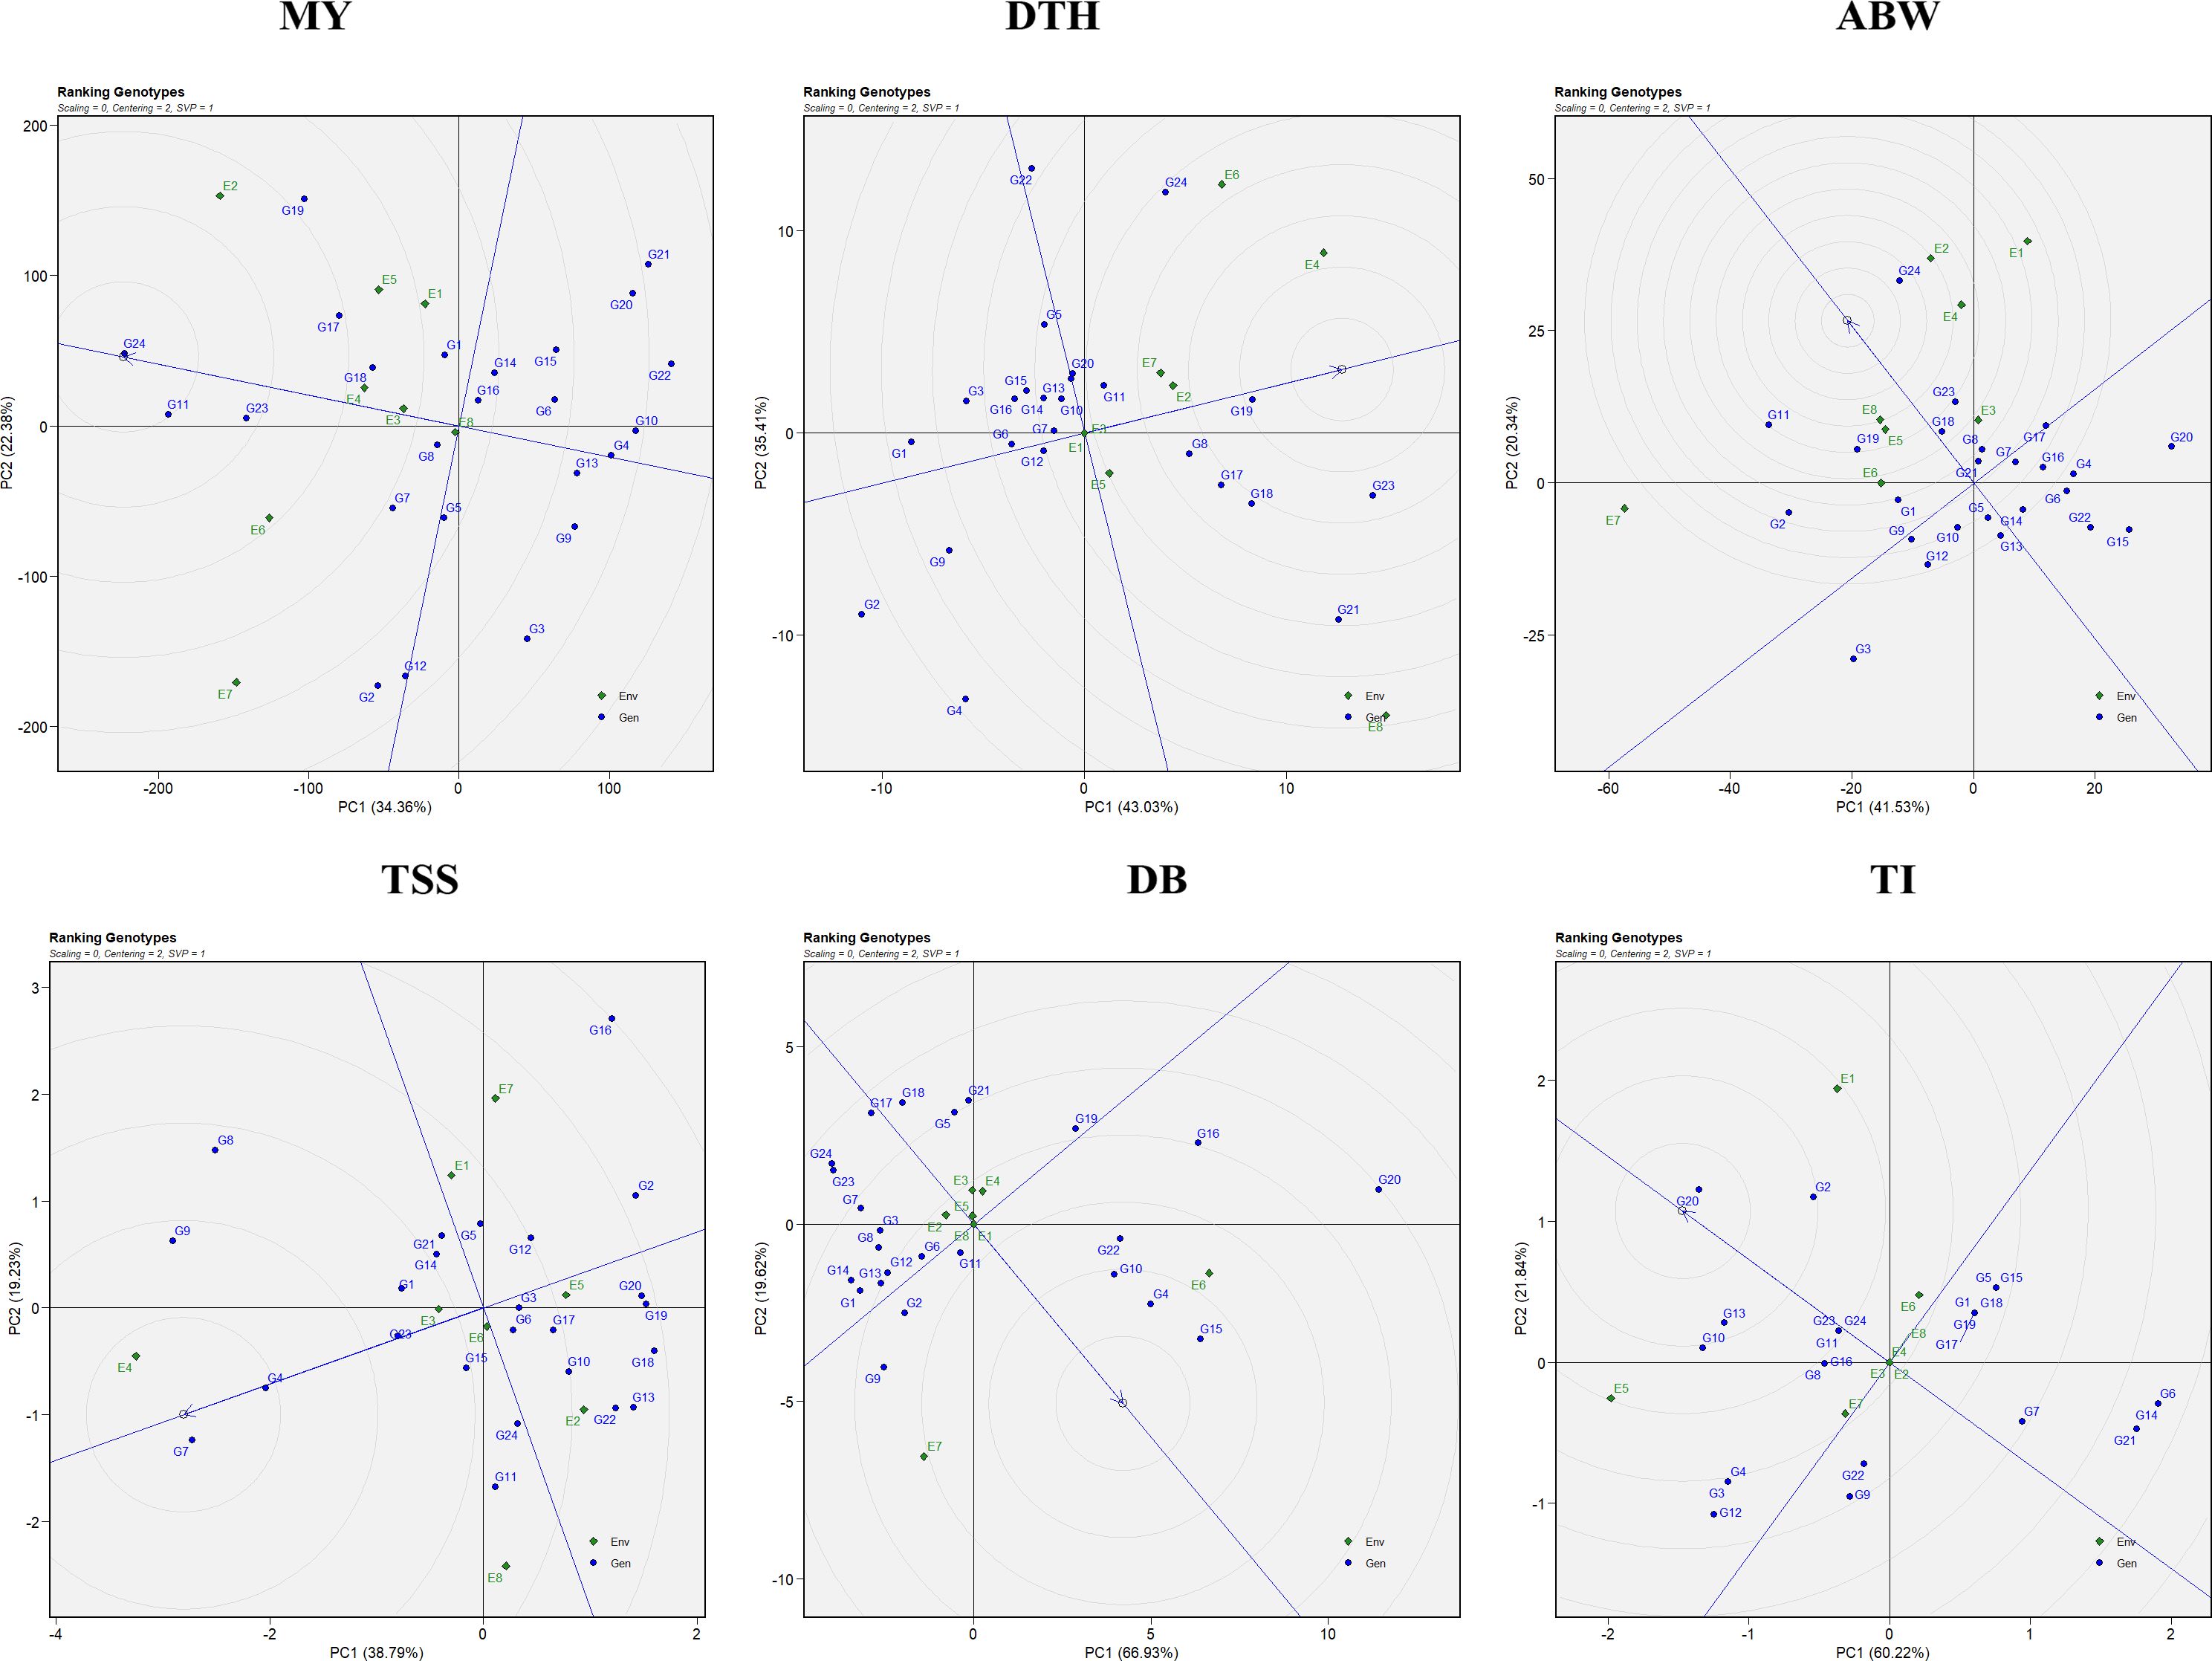
Figure 5. Ranking genotypes view of the GGE biplot for the evaluated traits: MY: marketable yield; DTH, days to harvest; ABW, average bulb weight; TSS, total soluble solids; DB, double bulb formation; and TI, thrips incidence.
In the environment-focused biplot, the arrow on the x-axis at the center of the concentric circles denotes the ideal environment (Figure 6). Test locations situated closer to this point are considered more desirable for evaluating genotypes. The relative distance of each environment from the ideal reference is reflected by its position along the concentric circles, providing a visual measure of its representativeness and discriminative ability. Regarding environments, E6, followed by E2 and E4, were closest to the ideal for marketable yield. For days to harvest, although E4 and E6 recorded higher values (indicating delayed maturity), E1, E3, and E5—being farthest from the delayed environments—were considered better for early maturity. For average bulb weight, E2, E8, and E4 were near the ideal environment, whereas for TSS, E4, E3, and E6 showed better suitability. For double-bulb formation, E2, E3, and E4 were farthest from the ideal environment and thus preferred for selecting genotypes with minimal expression of this trait. Similarly, for thrips incidence, E6, E2, E4, E3, and E8—being farthest from the ideal environment—were suitable for identifying resistant genotypes (Figure 6). Overall, E6 (ICAR–DOGR, Pune), E2 (RRS, Karnal), and E4 (JNKVV, Jabalpur) were identified as the most favorable environments, consistently supporting superior genotype performance across multiple traits.
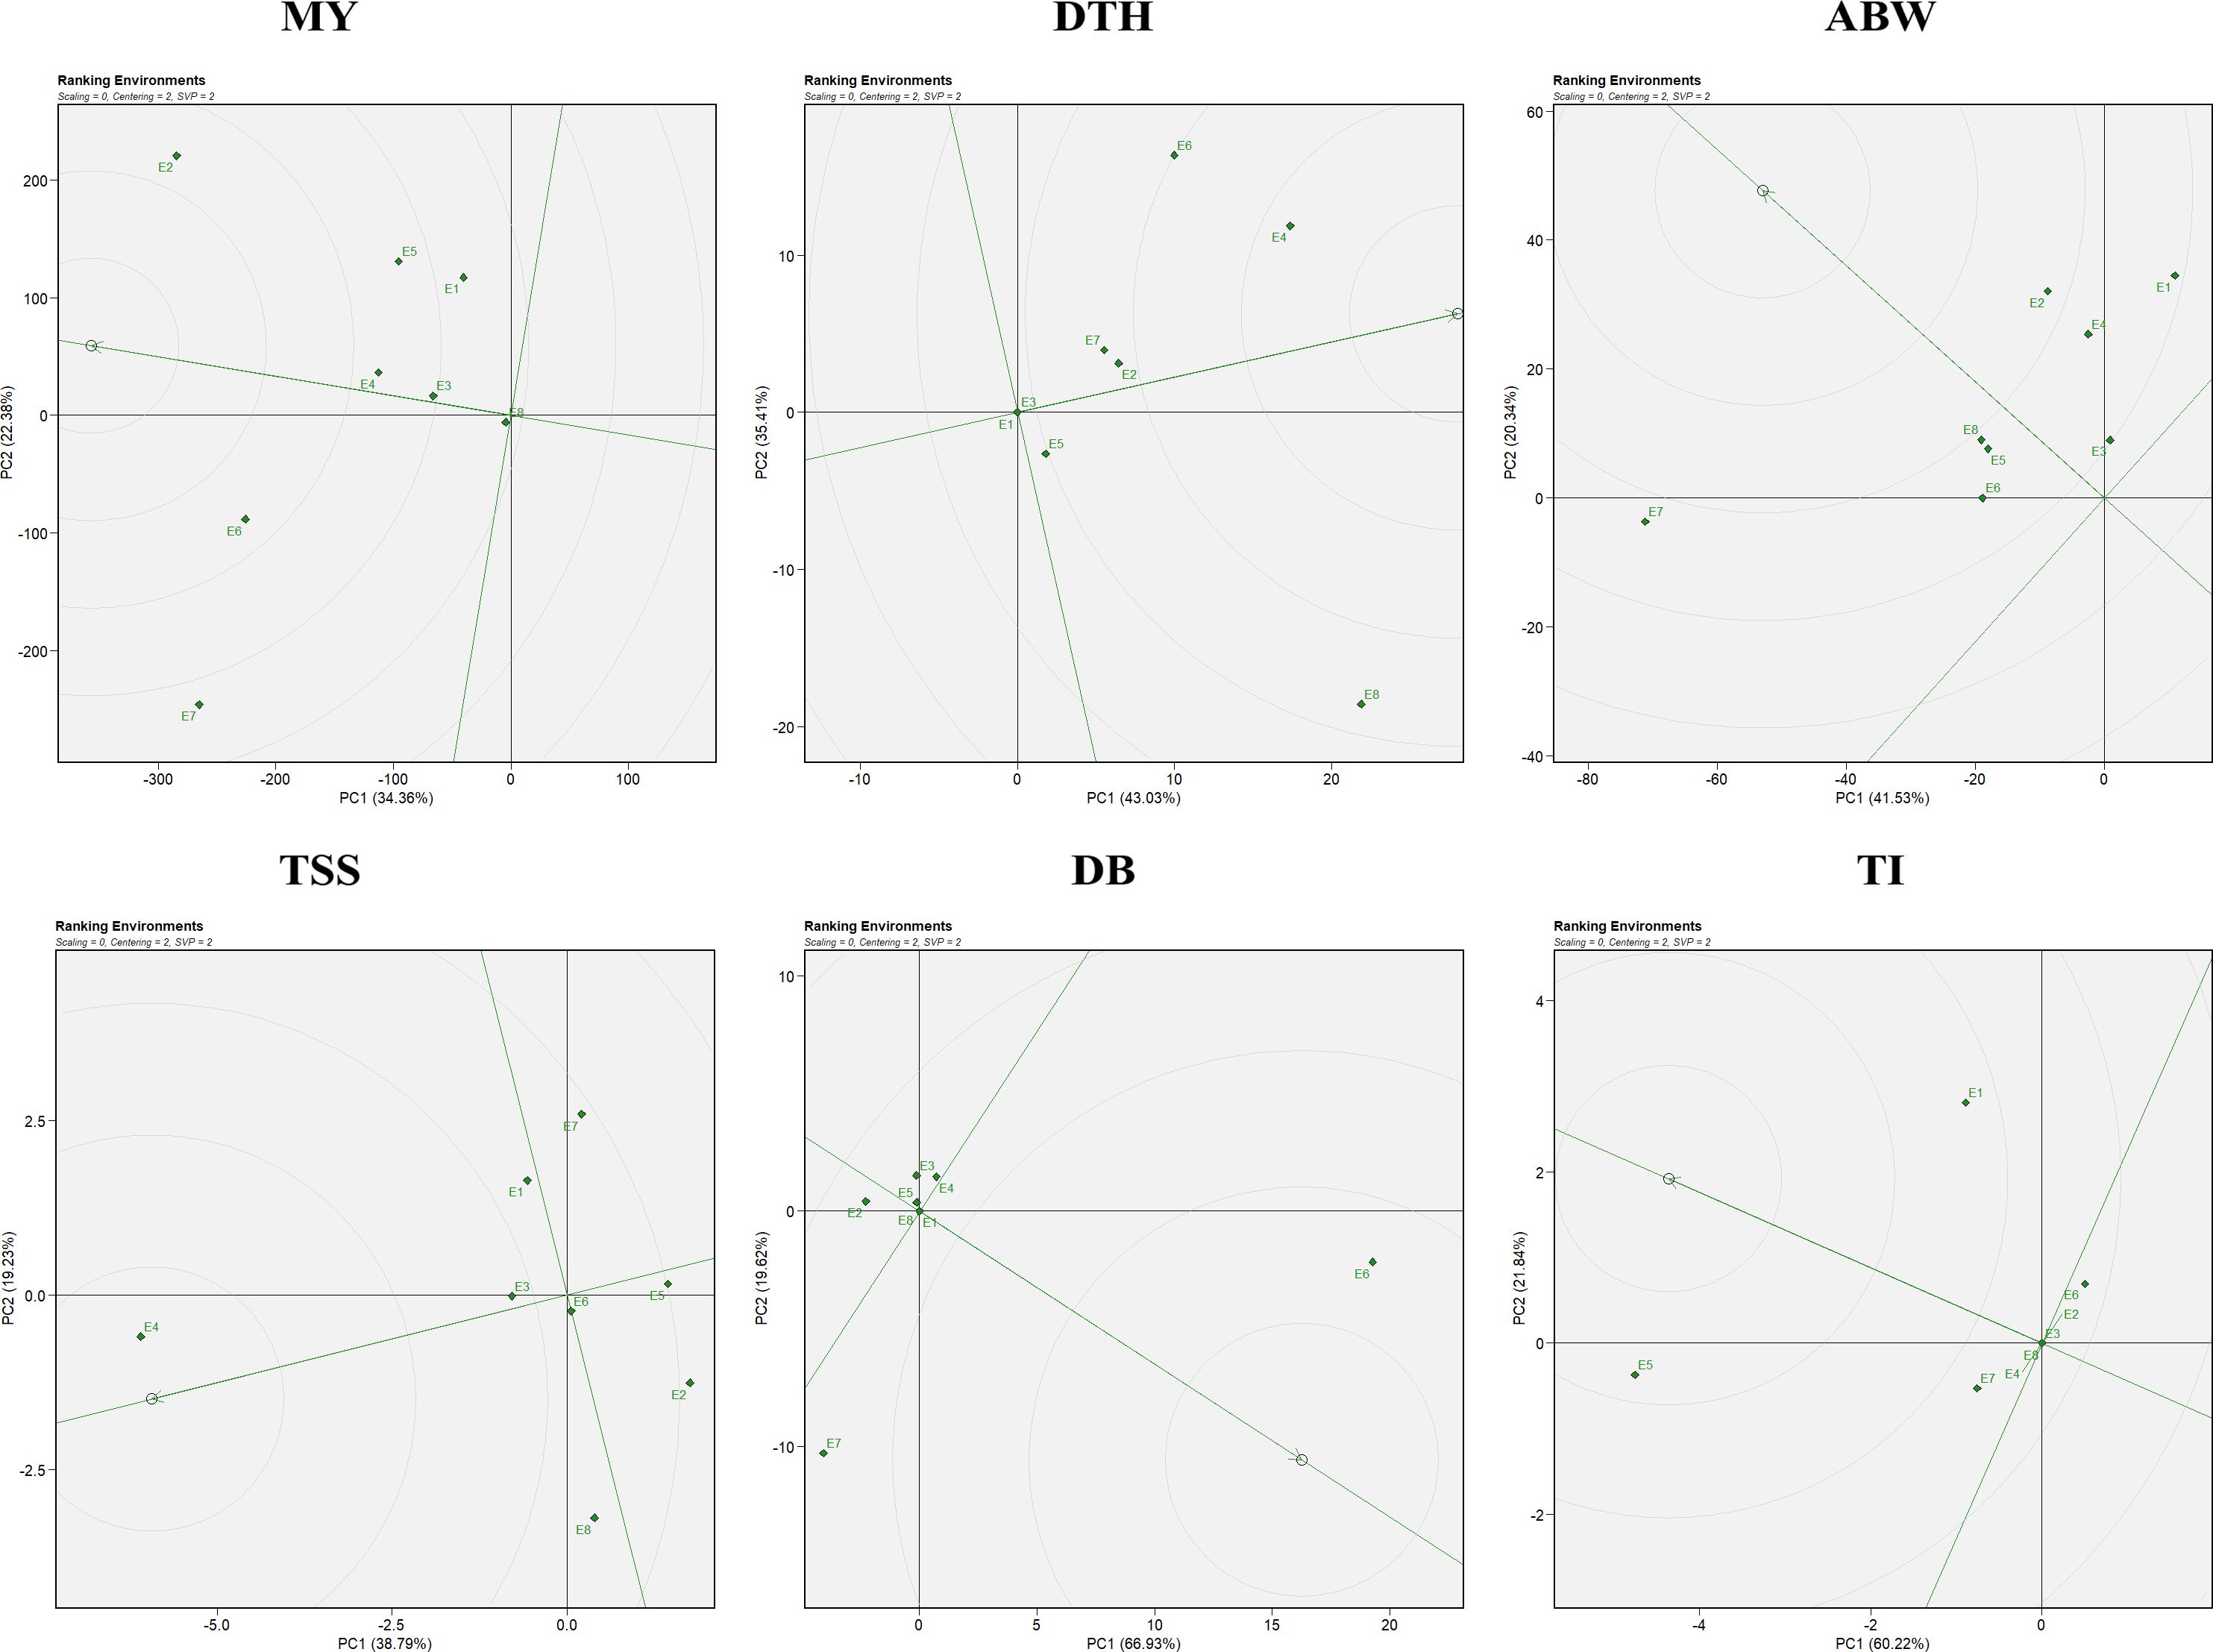
Figure 6. Ranking environments view of the GGE biplot for the evaluated traits: MY: marketable yield; DTH, days to harvest; ABW, average bulb weight; TSS, total soluble solids; DB, double bulb formation; and TI, thrips incidence.
3.3 Genotype-by-yield × trait biplot
The genotype-by-yield × trait (GYT) biplot offers a more integrated assessment than the genotype × trait (GT) biplot by combining yield with each trait, thereby enabling a comprehensive evaluation of genotypic performance (Yan and Fregeau-Reid, 2018). The biplot revealed predominantly positive correlations among the yield–trait combinations, as indicated by the acute angles formed between vectors (Figure 7). Notably, yield × average bulb weight, yield × total soluble solids, yield × days to harvest, and yield × thrips incidence displayed strong positive associations, indicating that genotypes performing well in these combinations are likely to be high yielding with favorable trait profiles. The only exception was yield × double-bulb formation, which did not show a positive relationship, suggesting its limited contribution to overall yield performance and its potential role as a negative selection trait.
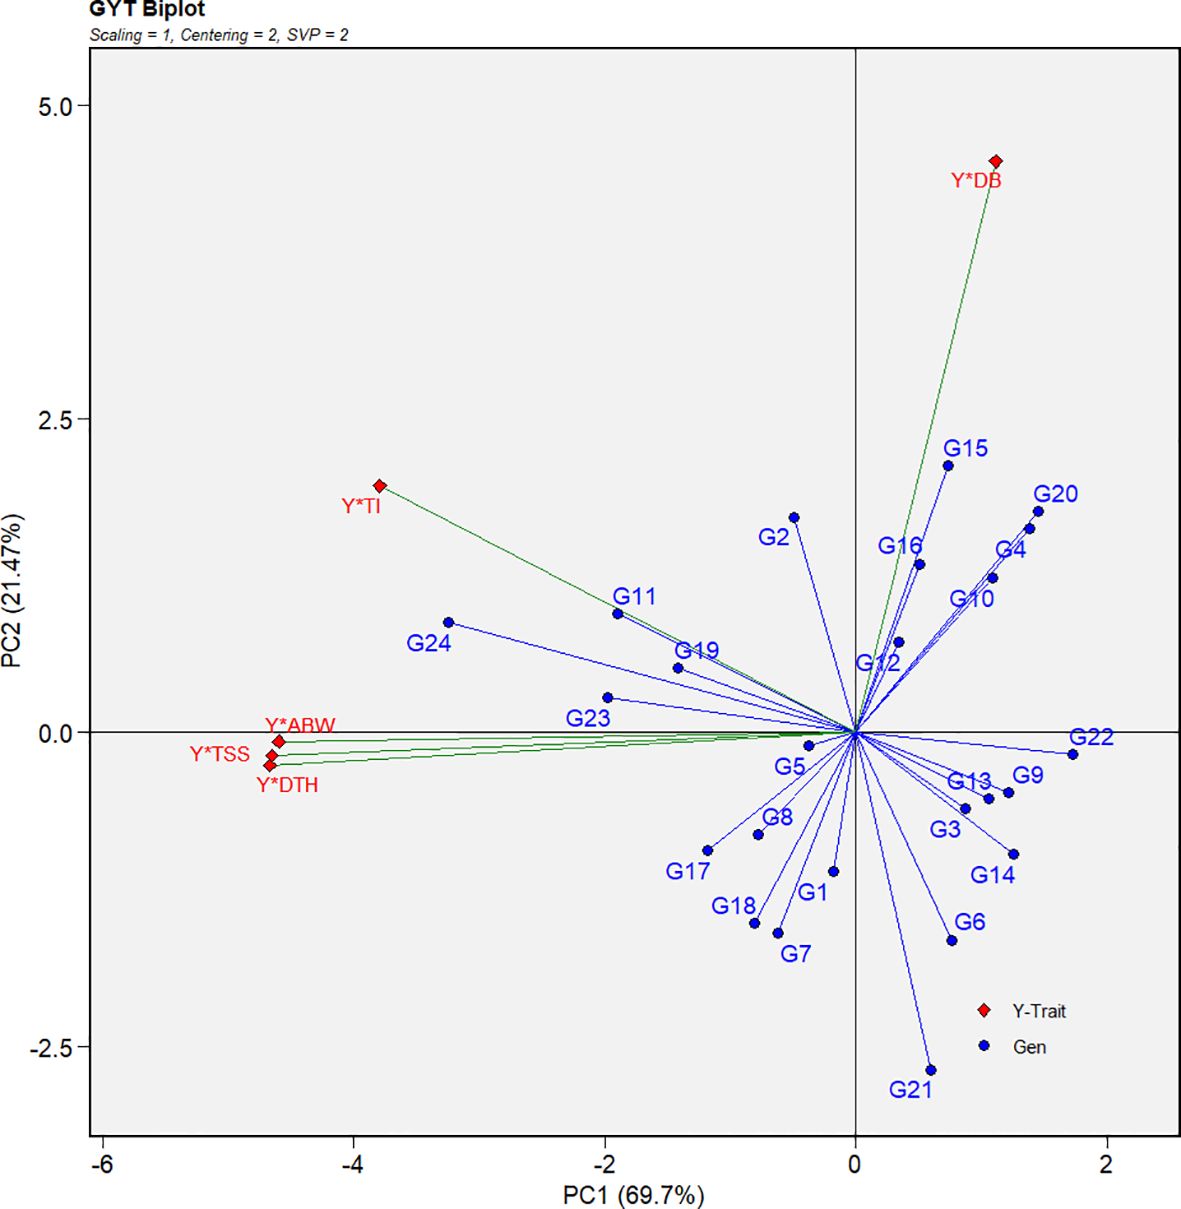
Figure 7. Genotype-by-yield × trait (GYT) biplot illustrating yield-trait associations and multi-trait performance for 24 red onion genotypes evaluated across eight rabi environments. Traits: DTH (days to harvest), ABW (average bulb weight), TSS (total soluble solids), DB (double bulb formation), and TI (thrips incidence).
3.4 Multi-trait genotype-ideotype distance index and factor analysis
The multi-trait genotype-ideotype distance index (MGIDI) is a robust multivariate selection tool that ranks genotypes based on their proximity to an ideotype—an ideal genotype that combines desirable performance across all target traits. By integrating multiple traits using principal component analysis, MGIDI facilitates the identification of genotypes with balanced and superior performance (Olivoto and Nardino, 2021).
MGIDI analysis identified G24 (Bhima Shakti), G11 (RO-1672), G23 (Bhima Kiran), and G19 (RO-1773) as the most promising genotypes (Figure 8). These genotypes, highlighted with red circles, exhibited the shortest distances from the ideotype, indicating high adaptability and superior performance across diverse environments. These selections suggest strong potential for improving overall onion productivity and trait integration.
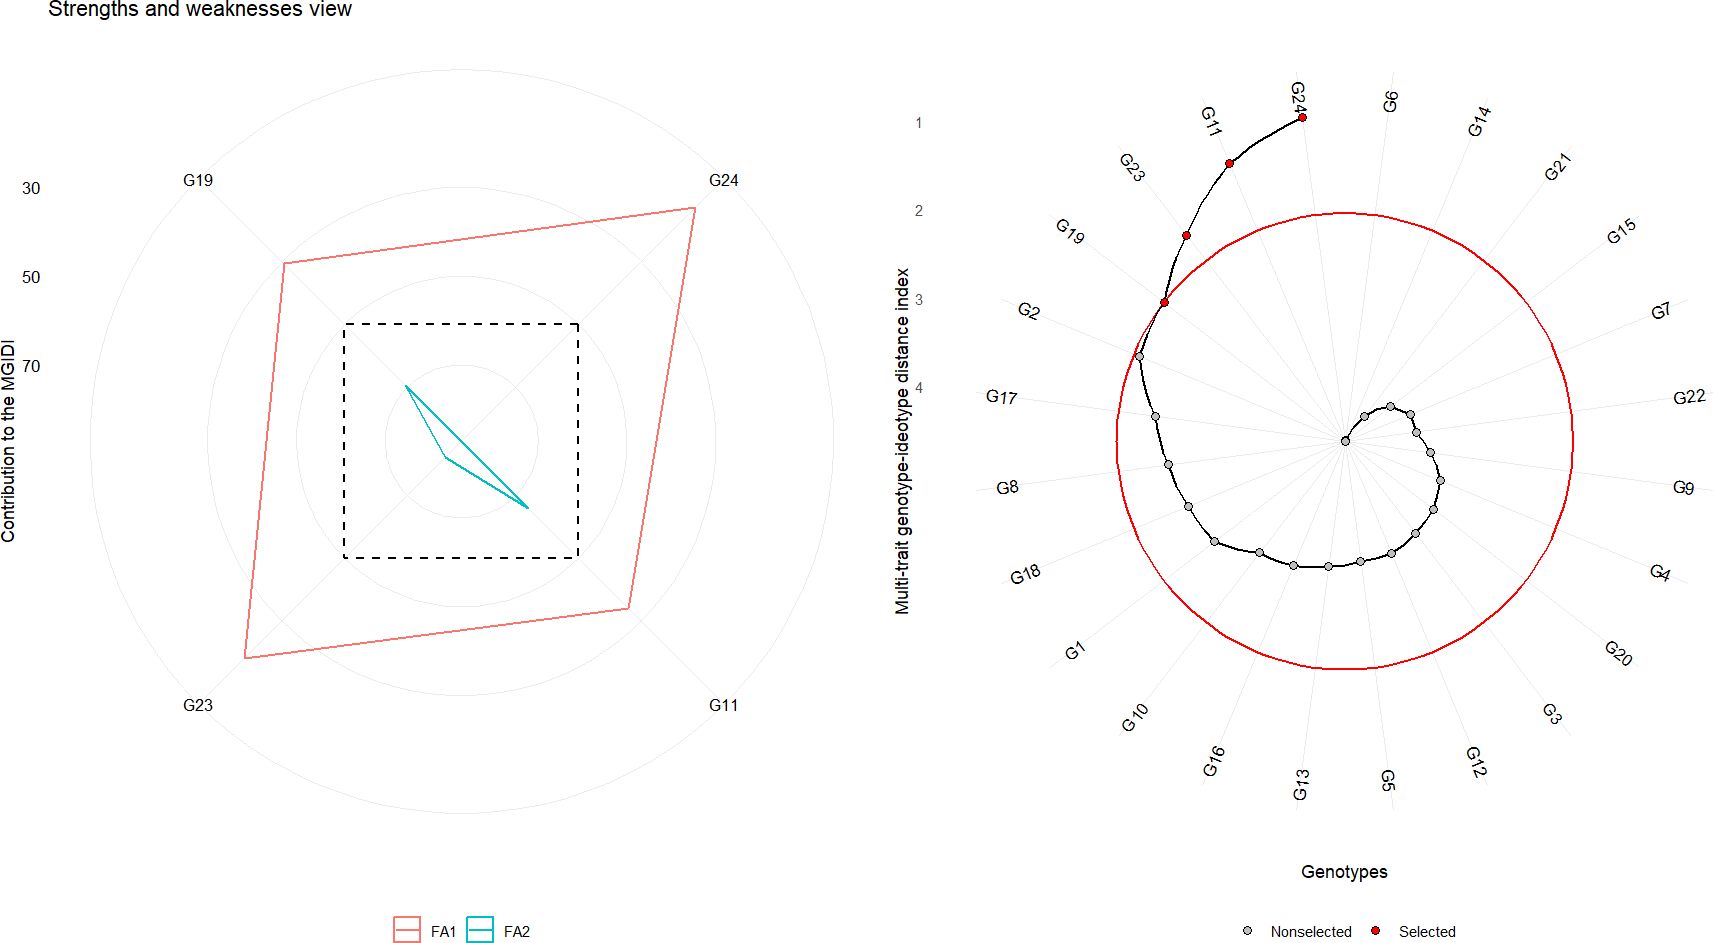
Figure 8. Multi-trait selection of 24 red onion genotypes across eight rabi environments using the MGIDI. Left panel: Strengths and weaknesses view showing the contribution of each trait to MGIDI for the first two factors (FA1 and FA2). Right panel: Genotype-ideotype distance plot, with genotypes closer to the red circle representing selections approaching the ideotype. Selected genotypes are shown in red dots; non-selected genotypes are shown in black dots.
The selection differential based on MGIDI revealed considerable variability in expected genetic gain across the studied traits (Table 5). High communalities were observed for average bulb weight and thrips incidence, followed by marketable yield and double-bulb formation, whereas the lowest communalities were recorded for days to harvest and TSS. High uniqueness was observed for TSS, followed by days to harvest, double-bulb formation, and marketable yield, whereas lower uniqueness was recorded for average bulb weight and thrips incidence. The selection differential was highest for marketable yield, followed by average bulb weight and days to harvest, and lowest for TSS and thrips incidence. The greatest genetic gains were observed for marketable yield (14.0%) and average bulb weight (8.34%), demonstrating the effectiveness of MGIDI-based selection in enhancing key productivity traits. Moderate improvements were noted in days to harvest (0.96%), thrips incidence (0.72%), and TSS (0.58%). Conversely, negative genetic gains were observed for double-bulb formation (–2.83%), which is advantageous since reductions in this trait are desirable for improving bulb quality. Overall, sense of gain was positive for all traits (Table 5).
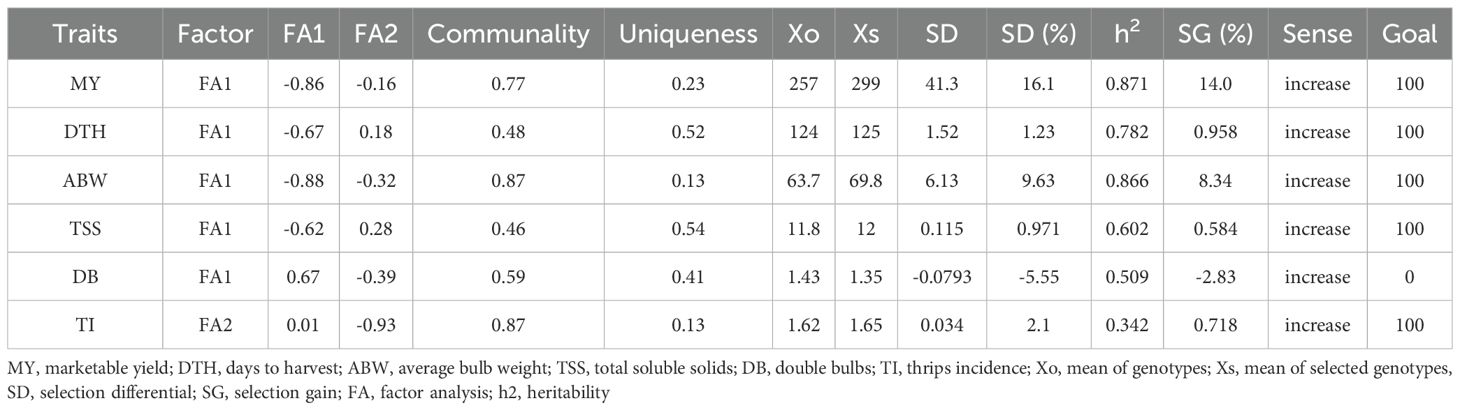
Table 5. Factor analysis and selection differential for bulb yield and related traits in red onion genotypes.
Furthermore, genotypes G24 (Bhima Shakti), G23 (Bhima Kiran), G19 (RO-1773), and G11 (RO-1672) were closely associated with Factor 1 (FA1), which encapsulated favorable contributions from most traits except thrips incidence. Notably, none of the selected genotypes were linked to Factor 2 (FA2), which primarily represented high thrips incidence—an undesirable trait. This indicates that the top-performing genotypes not only excelled in productivity-related attributes but also displayed natural resistance to thrips.
3.5 AMMI biplot analysis
The analysis of variance (ANOVA) from the AMMI model indicated that the mean sum of squares was significant (P < 0.05) for environments, genotypes, genotype × environment (G × E) interaction effects, and all principal components (PCs) in the case of marketable yield, average bulb weight, and TSS. For double-bulb formation, all sources of variation were significant except replication and PC7. In contrast, for days to harvest, replication, PC5, PC6, and PC7 were non-significant, while all other sources showed significant effects. For thrips incidence, significant variation was observed for environments, genotypes, G × E interaction, PC1, and PC2 (Table 6). The AMMI1 biplot displays PC1 on the vertical axis, representing the extent of GEI (Figure 9). Genotypes or environments with PC1 scores near zero are considered less affected by interaction effects. For marketable yield, environments such as E4, E8, and E3; for days to harvest, E3 and E1; for average bulb weight, E8 and E6; for TSS, E1 and E3; for double-bulb formation, E8; and for thrips incidence, E7 and E1 had PC1 values close to zero, indicating minimal interaction. Similarly, genotypes showing stable performance with PC1 values near zero included G8 (RO-1657), G16 (RO-1758), and G13 (RO-1747) for marketable yield; G12 (RO-1741), G6 (RO-1642), and G7 (RO-1654) for days to harvest; G5 (RO-1625) and G18 (RO-1770) for average bulb weight; G21 (RO-1784), G15 (RO-1757), and G12 (RO-1741) for TSS; G11 (RO-1672), G5 (RO-1625), and G21 (RO-1784) for double-bulb formation; and G2 (RO-1620), G11 (RO-1672), and G24 (Bhima Shakti) for thrips incidence, suggesting limited sensitivity to environmental variability.
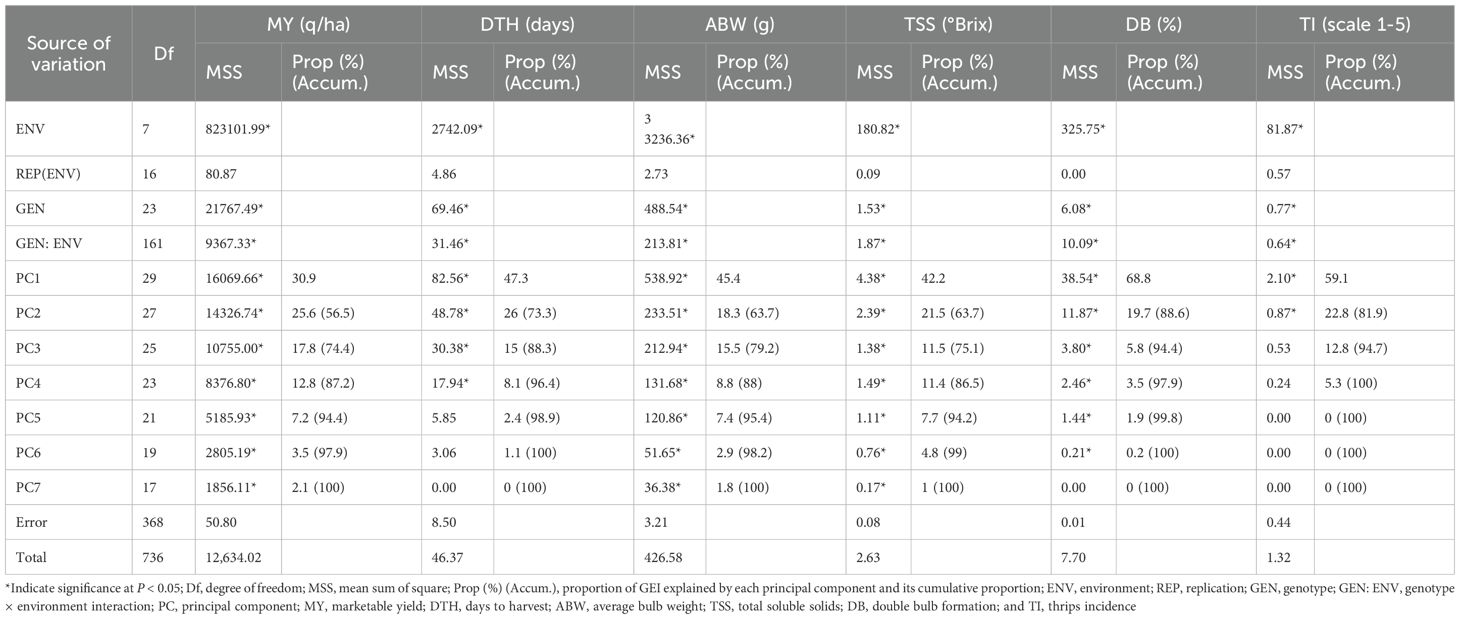
Table 6. Combined analysis of variance using AMMI biplot approach.
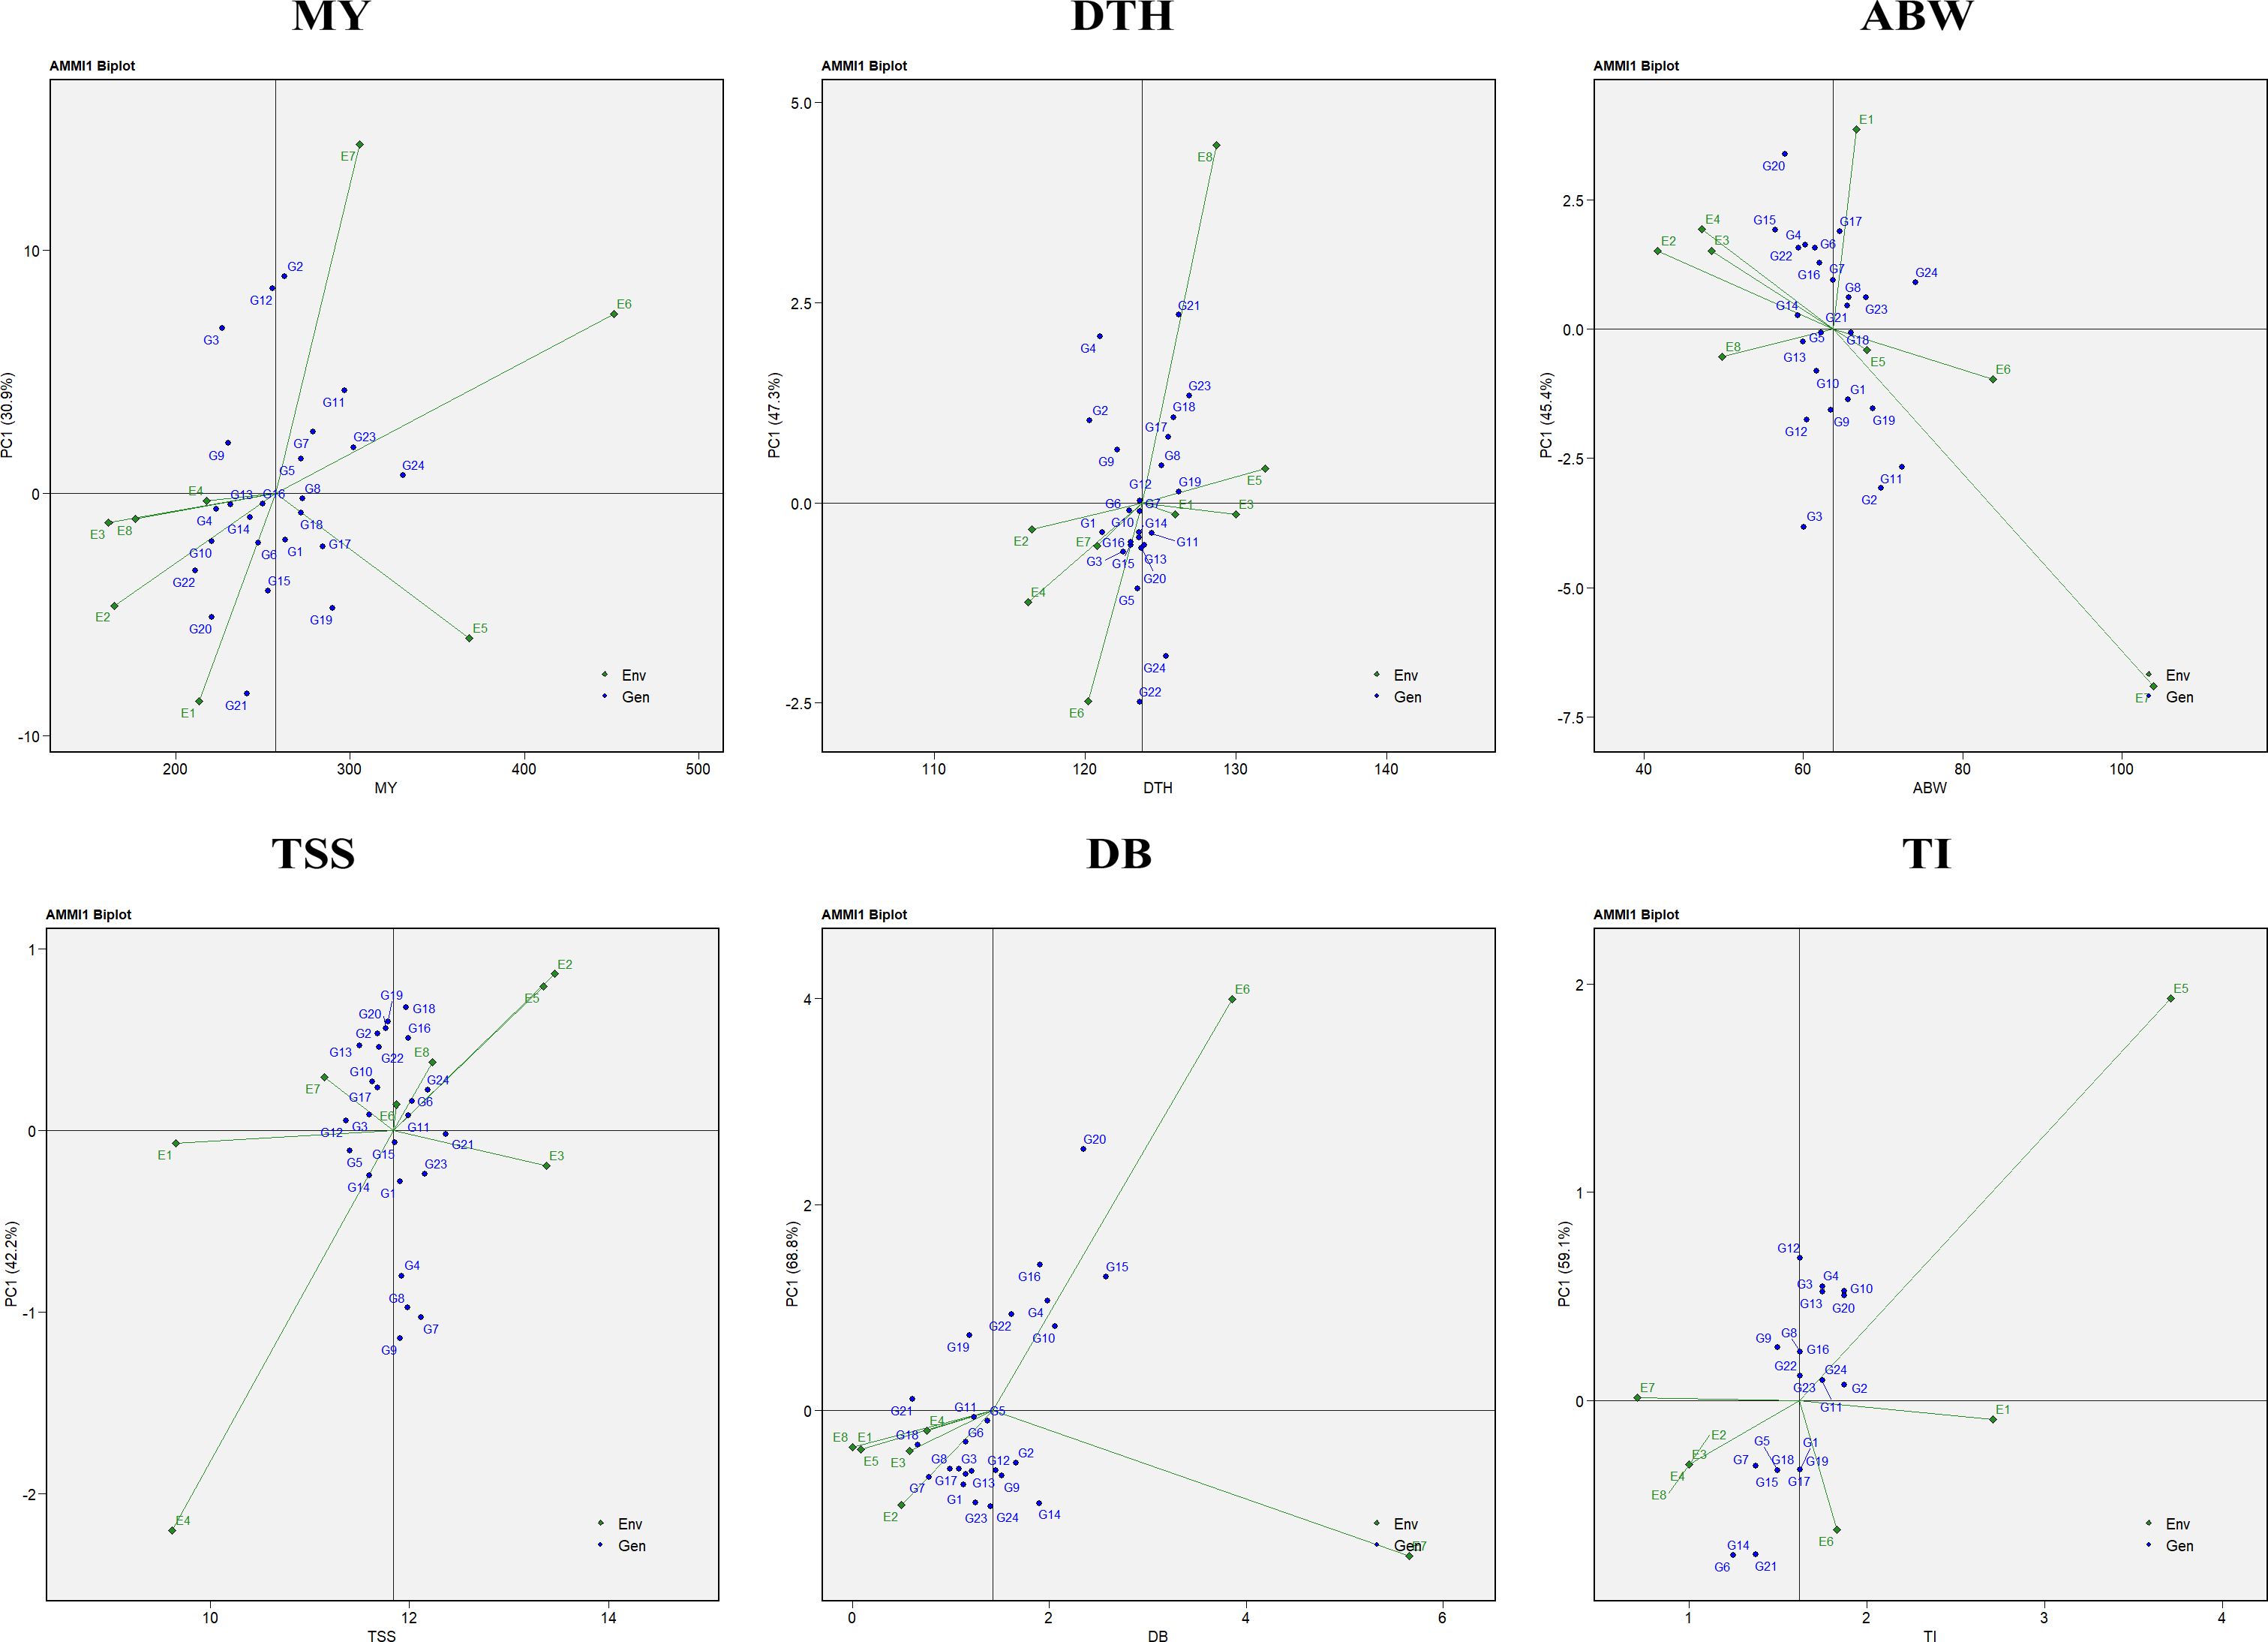
Figure 9. AMMI-1 biplot representation of onion genotypes across eight diverse environments for the evaluated traits: MY, marketable yield; DTH, days to harvest; ABW, average bulb weight; TSS, total soluble solids; DB, double bulb formation; and TI, thrips incidence.
The AMMI2 biplot, incorporating both the first and second principal components (PC1 and PC2), provided a comprehensive understanding of genotype stability and G×E interactions. In this study, PC1 and PC2 together explained 56.5% of the variation for marketable yield, 81.9% for days to harvest, 73.3% for average bulb weight, 63.7% for TSS, 63.7% for double-bulb formation, and 84.0% for thrips incidence (Figure 10). Genotypes located near the origin, where both PC1 and PC2 scores are close to zero, were considered more stable due to their minimal interaction with environmental variation.
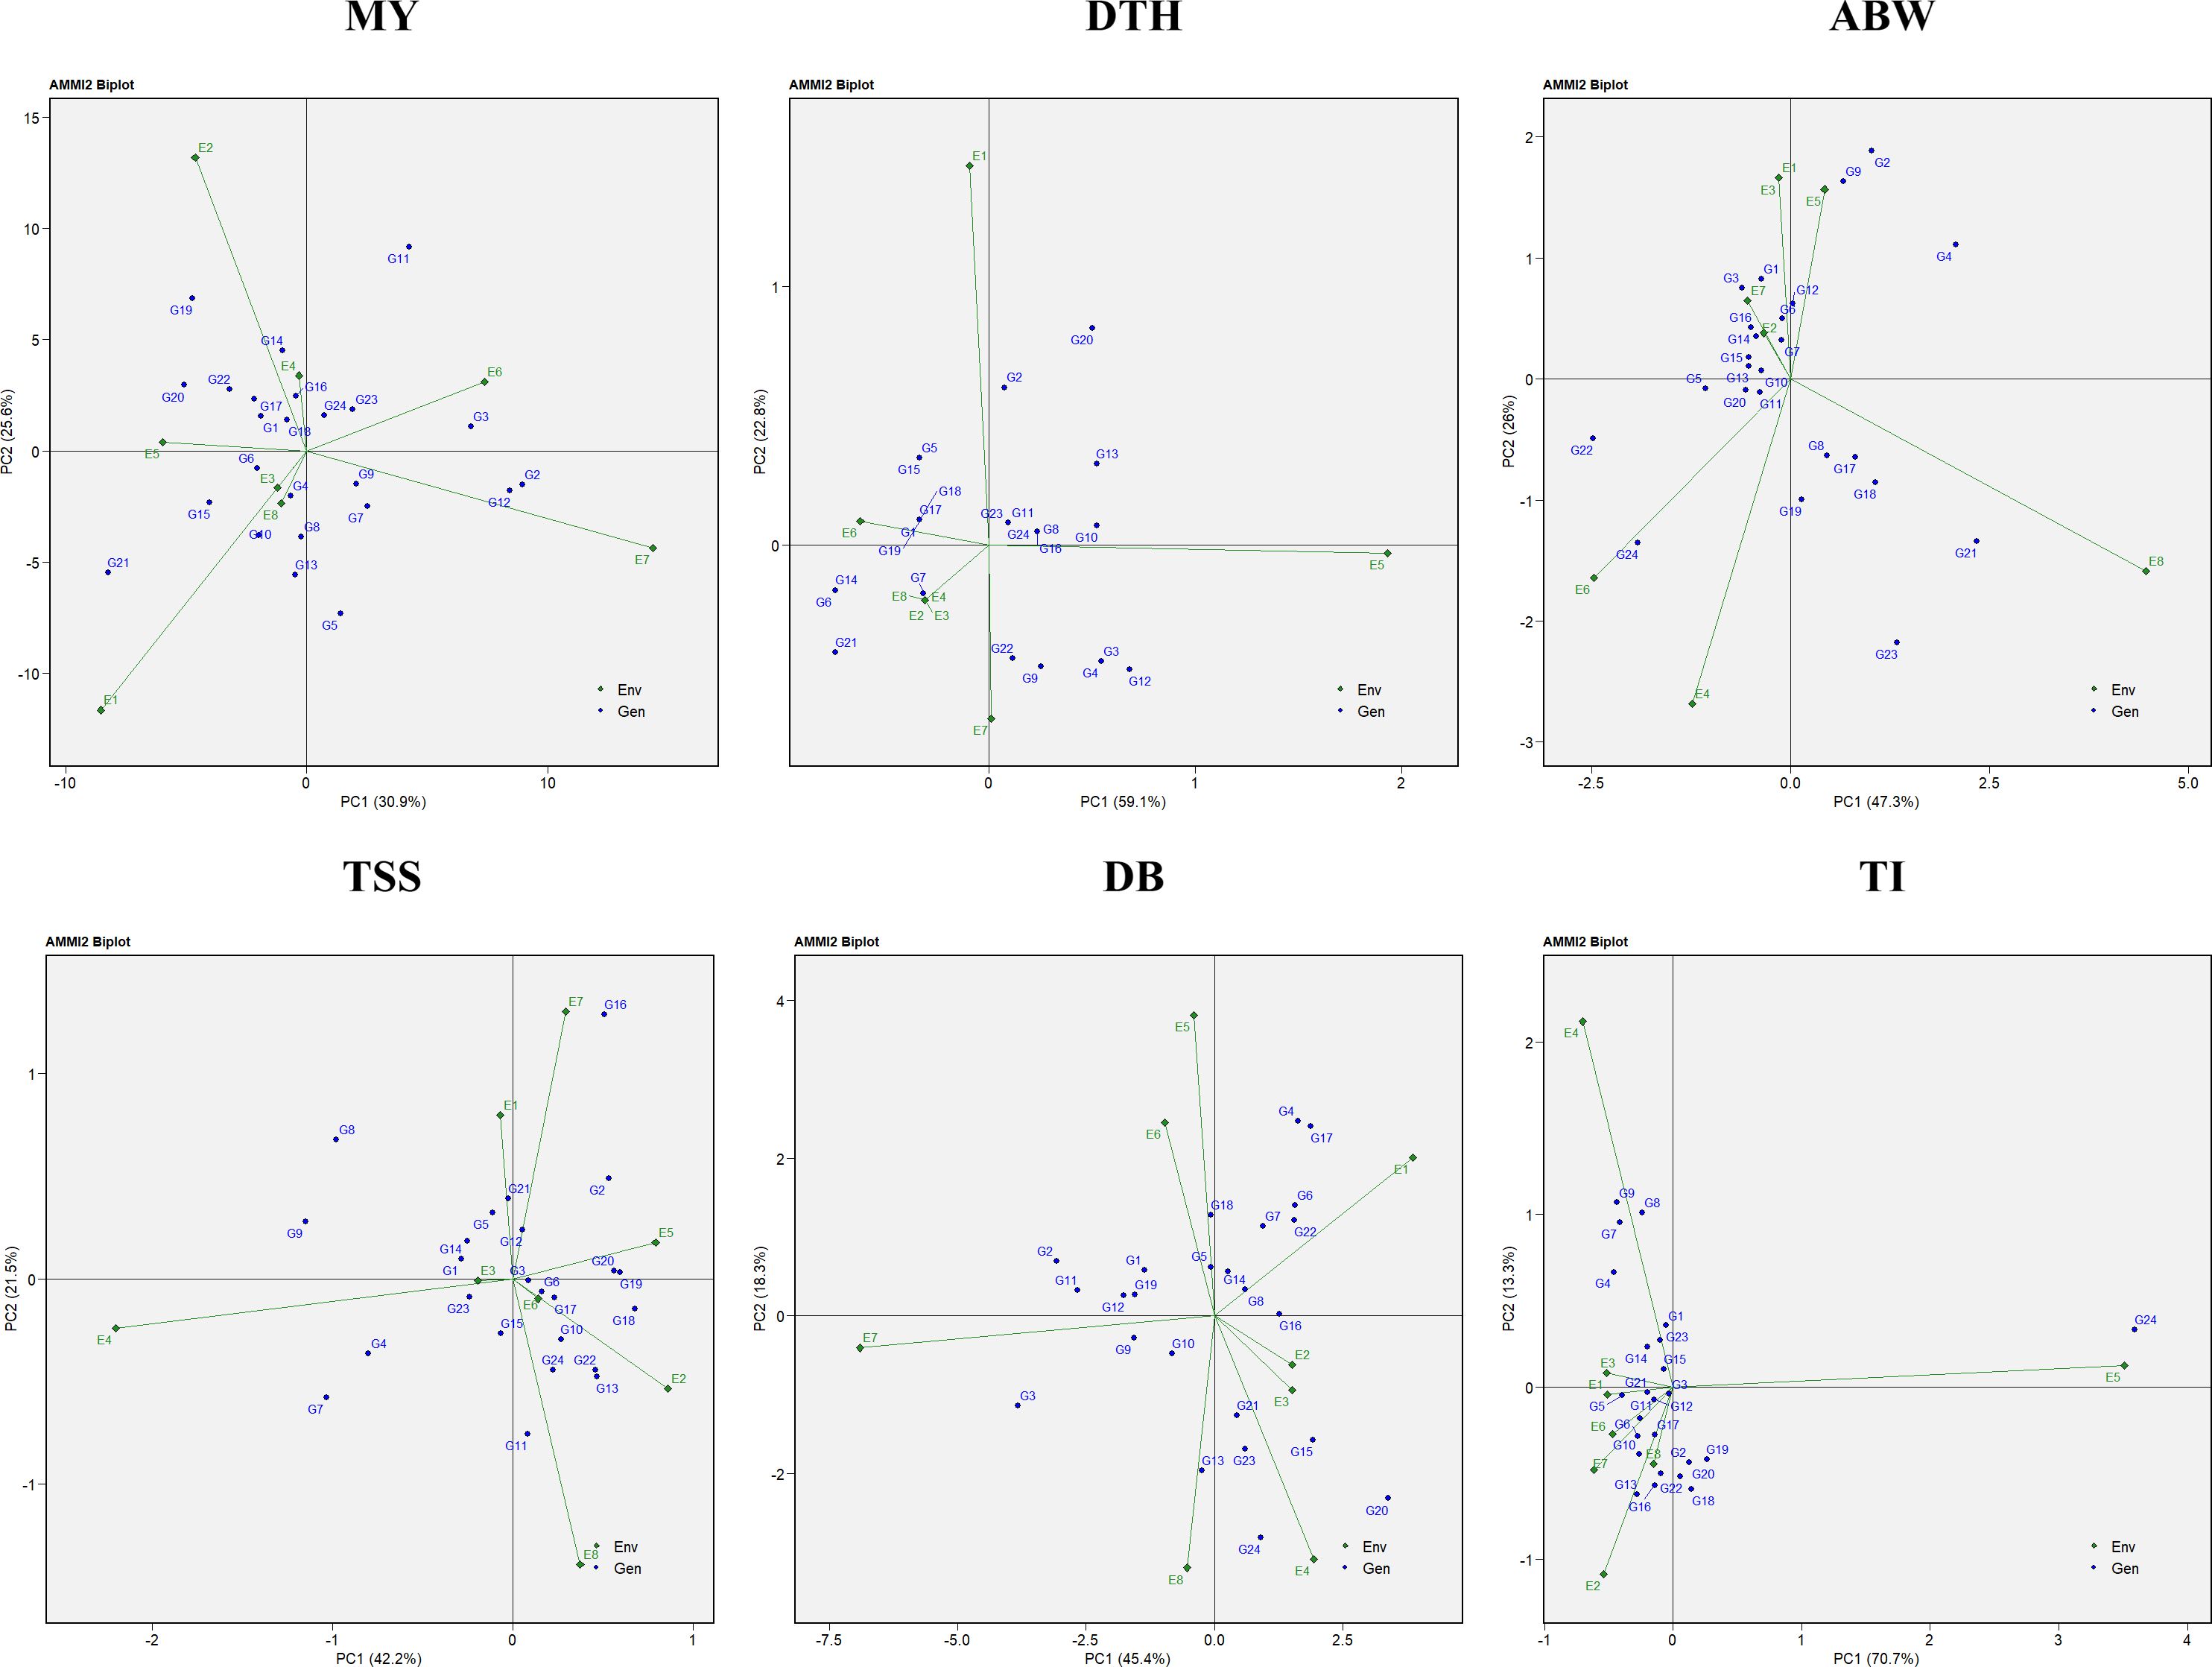
Figure 10. AMMI-2 biplot representation of onion genotypes across eight diverse environments for the evaluated traits: MY, marketable yield; DTH, days to harvest; ABW, average bulb weight; TSS, total soluble solids; DB, double bulb formation; and TI, thrips incidence.
Environments with shorter vector lengths, indicating weaker interactions, included E3, E8, and E4 for marketable yield; E2, E3, E4, and E8 for days to harvest; E2 and E7 for average bulb weight; E3 and E6 for TSS; E2 and E3 for double-bulb formation; and E1, E3, E6, and E8 for thrips incidence. Their proximity to the origin suggests they are suitable for identifying genotypes with consistent performance.
Similarly, stable genotypes located near the origin were G18 (RO-1770) and G24 (Bhima Shakti) for marketable yield; G11 (RO-1672), G23 (Bhima Kiran), and G24 (Bhima Shakti) for days to harvest; G10 (RO-1665) and G11 (RO-1672) for average bulb weight; G3 (RO-1621) and G6 (RO-1642) for TSS; G8 (RO-1657) and G14 (RO-1751) for double-bulb formation; and G3 (RO-1621) and G15 (RO-1757) for thrips incidence, highlighting their potential for use in future breeding programs targeting stable performance across diverse environments.
4 Discussion
Onion is predominantly an outcrossing species, which promotes extensive genetic variability among genotypes. This intrinsic variability underpins both the potential for rapid genetic gain through hybridization and the pronounced GEI commonly observed in multilocation trials. Stability and adaptability assessments help identify consistently performing genotypes across varying environmental conditions (Becker and Leon, 1988). Environmental variation across locations and years generates significant GEI, complicating selection and necessitating robust multi-environment analyses (Annicchiarico, 2002; Yan and Kang, 2003). Such GEI effects have been reported in onion and other vegetable crops (Cuartero and Cubero, 1982; Yildirim and Caliskan, 1985; Khar et al., 2007; Dia et al., 2018; Tahir et al., 2020; Tignegre et al., 2022; Gupta et al., 2024a). The identification of genotypes with both high mean performance and stability is therefore crucial for the development of cultivars suited to variable agro-climatic regions (Gupta et al., 2022). Onion genotypes are evaluated in multi-environment trials (METs) to identify suitable agro-climatic zones for the release and large-scale cultivation of varieties with consistent performance. Studies on GEI thus provide valuable preliminary insights for guiding breeding strategies.
Our study aimed to evaluate how the combination of BLUPs, GGE, and AMMI can identify stable and superior onion genotypes. Combined ANOVA for both GGE and AMMI showed significant GEI at P < 0.05 for all traits evaluated in the tested onion genotypes (Tables 4, 6). This strengthened the predictive accuracy of BLUPs, GGE, and AMMI analyses and enabled the identification of genotypes with either broad or specific adaptability across environments (Akter et al., 2015). The AMMI model captures both additive and multiplicative components of variation, whereas the GGE biplot focuses on genotype and G × E effects, offering better visualization of performance and stability (Gauch, 2006; Yan and Tinker, 2006; Yan et al., 2007). Genotype performance was evaluated using BLUP-derived values rather than simple means, as BLUP provides more accurate and unbiased predictions by accounting for random effects and variance components (Nardino et al., 2016; Sood et al., 2020; Verma and Singh, 2021; Taleghani et al., 2023).
To assess stability, adaptability, and performance simultaneously, the harmonic mean of relative performance of genotypic values (HMRPGV) was employed (Table 3). Although HMGV and RPGV can be reported separately, HMRPGV alone was preferred as it integrates both measures into a single, robust index, offering a more reliable and concise criterion for genotype selection across environments (Rodovalho et al., 2015; Peixoto et al., 2021). These findings are in agreement with previous reports (Aina et al., 2009; Tahir et al., 2020; Gupta et al., 2024a, 2024b; Tiwari et al., 2025). The BLUP stability parameters were highly consistent with overall genotype rankings, indicating stable performance across traits and suggesting a strong association between BLUP estimates and yield. Genotypes G24 (Bhima Shakti), G23 (Bhima Kiran), G11 (RO-1672), G19 (RO-1773), and G17 (RO-1769) were identified as stable genotypes with high marketable yield. Similar patterns have been reported in other crops, including sunflower (Aboye and Edo, 2024), soybean (Freiria et al., 2018), finger millet (Anuradha et al., 2022), and lentil (Hossain et al., 2023).
Using GGE biplots (Figure 2), several genotypes—including G4 (RO-1622), G24 (Bhima Shakti), G13 (RO-1747), and G8 (RO-1657)—were identified as stable performers for marketable yield. Such stable performers not only hold promise for direct varietal release but also serve as valuable parental lines in hybrid and OPV breeding programs aimed at enhancing yield stability (John et al., 2025). The identification of stable genotypes has been reported in various crops such as wheat (Omrani et al., 2022), winter lentils (Hossain et al., 2023), sorghum (Wang et al., 2023), and tomato (Tiwari et al., 2025).
The which-won-where view of the GGE biplot (Figure 3) helps identify winning genotypes, the presence of crossovers, separate mega-environments, and genotypes adapted to specific locations (Yan et al., 2000). Three mega-environments were identified, with G11 (RO-1672) and G24 (Bhima Shakti) emerging as winning genotypes in four of the eight locations (E2, E3, E4, and E6) for marketable yield. Similar findings in onion and other crops have emphasized the role of mega-environment analysis in capturing environmental heterogeneity and guiding genotype recommendations (Erdemci, 2018; Daemo et al., 2023; Mitrovia et al., 2012; Rad et al., 2013; Vaezi et al., 2017). However, it is important to note that mega-environment patterns may vary across years due to seasonal and climatic fluctuations. The crossover interactions observed indicate that different genotypes perform best in different environments, leading to mega-environment formation. While the current analysis used data from two consecutive rabi seasons at the same eight locations, further validation over additional years would strengthen confidence in the stability and repeatability of these mega-environments for long-term genotype recommendations (Aboye and Edo, 2024).
The discriminativeness vs. representativeness view of the GGE biplot (Figure 4) identifies ideal test environments—those that effectively differentiate genotypes and represent the overall target environment. Environments E6 (ICAR–DOGR, Pune) and E4 (JNKVV, Jabalpur) were the most effective in discriminating among genotypes and representing overall test conditions for onion trait evaluation.
The ranking view of the GGE biplot (Figure 5) displays genotypes based on their mean performance and stability. Genotypes located closer to the ideal genotype position, represented at the center of the concentric circles, are considered both high performing and stable across environments (Yan and Kang, 2003). For yield performance, genotypes G24 (Bhima Shakti), followed by G11 (RO-1672), G23 (Bhima Kiran), G17 (RO-1769), and G19 (RO-1773), were recognized as the most promising (Enyew et al., 2021; Omrani et al., 2022).
Similarly, the ranking environment’s view in the GGE biplot (Figure 6) evaluates environments based on their mean performance and representativeness. Those closest to the ideal environment, located near the center of the concentric circles on the AEC axis, are considered most suitable for genotype evaluation (Yan et al., 2007). Based on the ranking view of the GGE biplot, the most suitable environments were E6>E2>E4 for marketable yield; E2> E8 >E4 for average bulb weight; and E4>E3> E6 for TSS. The influence of environments on genotype selection and the identification of ideal environments has also been reported in other studies (Esan et al., 2023; Tiwari et al., 2025).
Since the GT biplot was less effective for multi-trait selection, the GYT biplot was applied by integrating yield with each trait, thereby capturing positive associations between traits (Figure 7; Yan and Fregeau-Reid, 2018). To complement this, the MGIDI index ranked genotypes based on their distance from an ideal ideotype, enabling more accurate multi-trait selection (Figure 8; Olivoto and Nardino, 2021). Both approaches consistently identified G24 (Bhima Shakti), G11 (RO-1672), G23 (Bhima Kiran), and G19 (RO-1773) as stable, high-yielding genotypes, in agreement with earlier reports (Habib et al., 2024; Yue et al., 2022).
Moreover, the AMMI model was employed in this study to assess GEI and evaluate genotype stability (Figures 9, 10). AMMI was used alongside GGE because, while GGE effectively visualizes which-won-where patterns and mega-environments, AMMI provides statistical partitioning of main and interaction effects, improving stability accuracy (Purchase, 1997; Yan and Kang, 2003; Gauch, 2013). Environments with shorter vectors and closer proximity to the origin are considered more reliable for selecting widely adaptable genotypes (Gauch, 2006). This study identified stable genotypes G18 (RO-1770) and G24 (Bhima Shakti), along with environments E8 (TNAU, Coimbatore) and E4 (JNKVV, Jabalpur), as the most suitable for yield. Similar use of AMMI-based stability analysis has been reported in groundnut and wheat (Kebede and Getahun, 2017; Omrani et al., 2022).
Based on the results of multivariate analyses using GGE, AMMI biplots, and BLUP, the genotypes Bhima Shakti (G24), RO-1672 (G11), Bhima Kiran (G23), and RO-1773 (G19) exhibited stable and superior performance across eight diverse testing environments (Figure 11). These analytical approaches effectively unraveled the complexity of genotype × environment interactions, aiding in the selection of widely adapted and desirable genotypes. Therefore, these genotypes are considered well suited for cultivation during the rabi season.
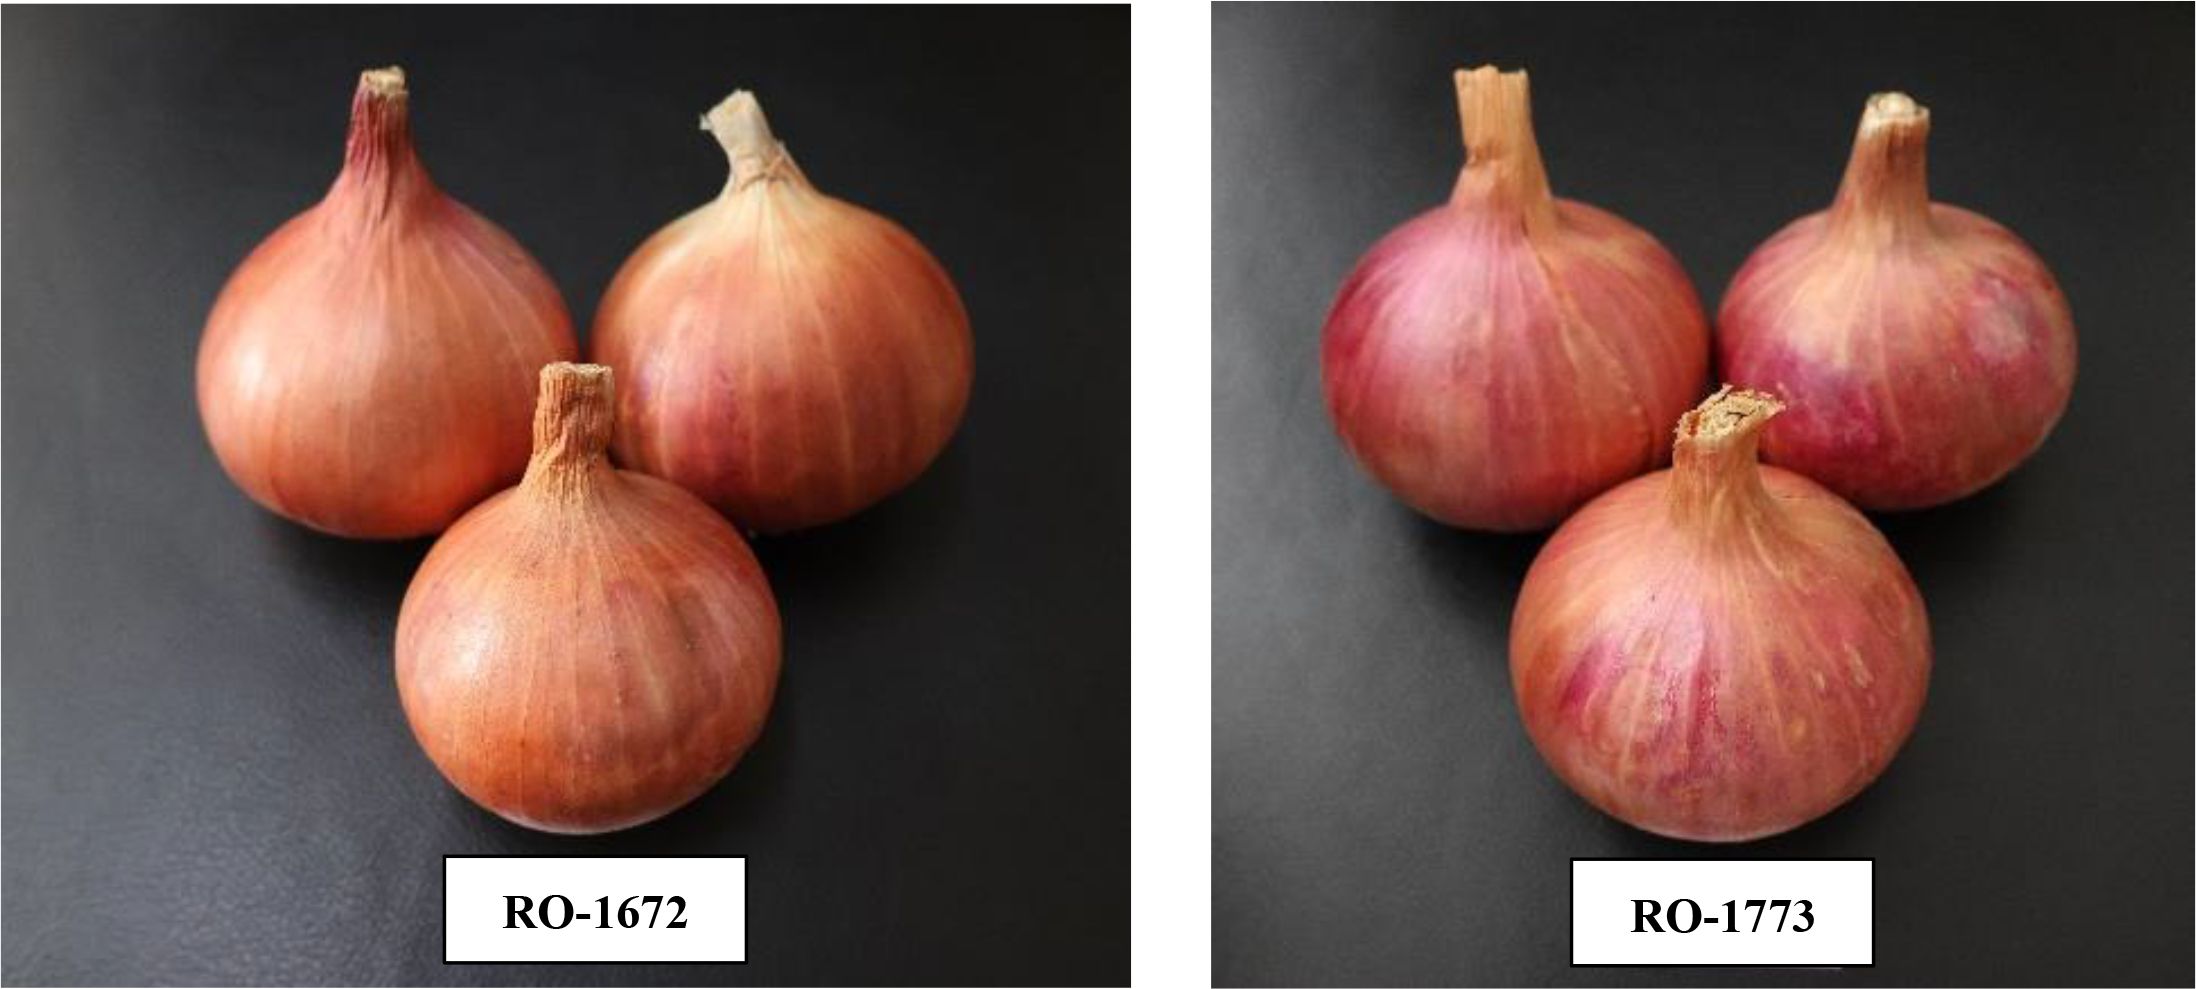
Figure 11. Promising onion genotypes exhibiting stable and superior performance across eight diverse test environments.
5 Conclusion
The combined use of BLUP, GGE biplot, AMMI, and multivariate selection indices (MGIDI and GYT) effectively distinguished yield potential, stability, and multi-trait performance among 24 red onion genotypes evaluated across eight rabi environments. For marketable yield, genotypes G24 (Bhima Shakti), G11 (RO-1672), G23 (Bhima Kiran), G17 (RO-1769), and G19 (RO-1773) were consistently superior. Early maturity was observed in G2 (RO-1620) and G4 (RO-1622), while higher average bulb weight was recorded in G24, G11, G19, and G23. Genotypes G7 (RO-1654), G4 (RO-1622), and G9 (RO-1664) performed best for TSS; G17 (RO-1769) and G18 (RO-1770) exhibited fewer double bulbs; and G6 (RO-1642), G14 (RO-1751), and G21 (RO-1784) showed reduced thrips incidence.
Environment E6 was identified as most suitable for yield and double-bulb traits, E4 for days to harvest and TSS, E8 for average bulb weight, and E5 for thrips resistance. The MGIDI ranking further confirmed G24 (Bhima Shakti), G11 (RO-1672), G23 (Bhima Kiran), and G19 (RO-1773) as the most promising multi-trait genotypes, holding strong potential to enhance onion productivity during the rabi season in India.
This study demonstrates that combining BLUP with graphical approaches (GGE/AMMI) and multi-trait indices (MGIDI/GYT) yields robust, actionable selection decisions for onion breeding. Based on these findings, Bhima Shakti, RO-1672, Bhima Kiran, and RO-1773 are recommended as priority candidates for advancement in breeding programs and large-scale evaluation under farmer field conditions. Future studies should focus on incorporating molecular approaches to dissect stability and multi-trait expression in these promising lines, thereby accelerating the development of stable, high-yielding onion cultivars suited to diverse rabi environments.
Data availability statement
The original contributions presented in the study are included in the article/Supplementary Material. Further inquiries can be directed to the corresponding author.
Author contributions
AJG: Conceptualization, Data curation, Formal Analysis, Investigation, Methodology, Project administration, Supervision, Validation, Visualization, Writing – original draft, Writing – review & editing. KVA: Data curation, Formal Analysis, Methodology, Writing – original draft. AB: Writing – review & editing. SK: Data curation. PH: Data curation. RK: Writing – review & editing. VM: Data curation, Methodology, Writing – review & editing.
Funding
The author(s) declare financial support was received for the research and/or publication of this article. Authors gratefully thanks to the networking centers of All India Network Research Project on Onion and Garlic [AINRPOG], ICAR-Directorate of Onion and Garlic Research, Pune for their support and technical inputs. This work was financially supported by Indian Council of Agricultural Research, New Delhi.
Acknowledgments
The authors sincerely acknowledge networking centres of AINRPOG, ICAR-DOGR for their support and technical inputs. This work was financially supported by Indian Council of Agricultural Research, New Delhi.
Conflict of interest
The authors declare that the research was conducted in the absence of any commercial or financial relationships that could be construed as a potential conflict of interest.
Generative AI statement
The author(s) declare that no Generative AI was used in the creation of this manuscript.
Any alternative text (alt text) provided alongside figures in this article has been generated by Frontiers with the support of artificial intelligence and reasonable efforts have been made to ensure accuracy, including review by the authors wherever possible. If you identify any issues, please contact us.
Publisher’s note
All claims expressed in this article are solely those of the authors and do not necessarily represent those of their affiliated organizations, or those of the publisher, the editors and the reviewers. Any product that may be evaluated in this article, or claim that may be made by its manufacturer, is not guaranteed or endorsed by the publisher.
Supplementary material
The Supplementary Material for this article can be found online at: https://www.frontiersin.org/articles/10.3389/fpls.2025.1694946/full#supplementary-material
References
Aboye, B. M. and Edo, M. A. (2024). Exploring genotype by environment interaction in sunflower using genotype plus genotype by environment interaction (GGE) and best linear unbiased prediction (BLUP) approaches. Discov. Appl. Sci. 6, 431. doi: 10.1007/s42452-024-06136-1
Aina, O. O., Dixon, A. G. O., Paul, I., and Akinrinde, E. A. (2009). G×E interaction effects on yield and yield components of cassava (landraces and improved) genotypes in the savanna regions of Nigeria. Afr. J. Biotechnol. 8, 4933–4945. doi: 10.4314/ajb.v8i19.65196
Ajay, B. C., Aravind, J., Abdul Fiyaz, R., Bera, S. K., Narendra, K., Gangadhar, K., et al. (2018). Modified AMMI stability index (MASI) for stability analysis. ICAR-DOGR Newslett. 18, 4–5.
Akter, A., Hasan, M. J., Kulsum, U., Rahman, M. H., Khatun, M., and Islam, M. R. (2015). GGE biplot analysis for yield stability in multi-environment trials of promising hybrid rice (Oryza sativa L.). Bangladesh Rice J. 19, 1–8. doi: 10.3329/brj.v19i1.25213
Annicchiarico, P. (2002). Genotype x environment interactions - challenges and opportunities for plant breeding and cultivar recommendations (Rome, Italy: United Nations (FAO)). Available online at: http://www.fao.org/docrep/005/y4391e/y4391e00. (Accessed July 31, 2025).
Anuradha, N., Patro, T. S. S. K., Singamsetti, A., Sandhya Rani, Y., Triveni, U., Nirmala Kumari, A., et al. (2022). Comparative study of AMMI- and BLUP-based simultaneous selection for grain yield and stability of finger millet [Eleusine coracana (L.) Gaertn.] genotypes. Front. Plant Sci. 6. doi: 10.3389/fpls.2021.786839
Barnoh, F. K. (2021). Effect of bulb size and bulb cutting on growth and yield of onion (Allium cepa L.) in two ecological zones of Ghana. University of Education Winneba, Winneba (IL. Available online at: http://41.74.91.244:8080/handle/123456789/3242. (Accessed August 2, 2025).
Becker, H. C. and Leon, J. I. (1988). Stability analysis in plant breeding. Plant Breed 101, 1–23. doi: 10.1111/j.1439-0523.1988.tb00261.x
Chaudhry, U. K., Junaid, M. D., Gokce, Z. N. O., and Gokce, A. F. (2023). “Impact of biotic and abiotic stresses on onion production: potential mitigation approaches in modern era,” in Smart plant breeding for vegetable crops in post-genomics era Singapore (Springer Nature, Singapore), 143–162. doi: 10.1007/978-981-19-5367-5_7
Cuartero, J. and Cubero, J. I. (1982). Genotype-environment interaction in tomato. Theor. Appl. Genet. 61, 273–277. doi: 10.1007/BF00273785
Daemo, B. B., Belew Yohannes, D., Mulualem Beyene, T., and Gebreselassie Abtew, W. (2023). AMMI and GGE biplot analyses for mega environment identification and selection of some high-yielding cassava genotypes for multiple environments. Int. J. Agron. 1), 6759698. doi: 10.1155/2023/6759698
DeLacy, I. H., Basford, K. E., Cooper, M., Bull, J. K., and McLaren, C. G. (1996). “Analysis of multi-environment trials-An historical perspective,” in Plant Adaptation and Crop Improvement, Wallingford, UK: CAB International 39–124.
De Resende, M. D. V. and De Resende, M. D. V. (2002). Genetica biometrica e estatistica no melhoramento de plantas perenes. Available online at: http://www.alice.cnptia.embrapa.br/alice/handle/doc/306061.
Dhotre, M., Nithin, K. N., Kolluru, R., and Desai, S. (2025). “Recurring onion and tomato crises in India: a critical analysis and future perspectives,” in Emerging trends in food and agribusiness marketing, 123–160.
Dia, M., Wehner, T. C., Elmstrom, G. W., Gabert, A., Motes, J. E., Staub, J. E., et al. (2018). Genotype x environment interaction for yield of pickling cucumber in 24 US environments. Open Agric. 3, 1–16. doi: 10.1515/opag-2018-0001
Dos Santos, P. R., de Oliveira, T. R. A., Skeen-Hurtado, P., Nascimento, M. R., da Silva Costa, K. D., Araújo, E. R., et al. (2019). Analise baseada em GGE Biplot e REML/BLUP da estabilidade de produçao e adaptabilidade para feijoeiro comum em ensaios multi-ambientais. Rev. Bras. Cienc. Agrar. (Agraria). 14, 5657.
Enyew, M., Feyissa, T., Geleta, M., Tesfaye, K., Hammenhag, C., and Carlsson, A. S. (2021). Genotype by environment interaction, correlation, AMMI, GGE biplot and cluster analysis for grain yield and other agronomic traits in sorghum (Sorghum bicolor L. Moench). PloS One 16, e0258211. doi: 10.1371/journal.pone.0258211
Erdemci, I. (2018). Investigation of genotype× environment interaction in chickpea genotypes using AMMI and GGE biplot analysis. Turk. J. Field. Crops. 23, 20–26. doi: 10.17557/tjfc.414846
Esan, V. I., Oke, G. O., Ogunbode, T. O., and Obisesan, I. A. (2023). AMMI and GGE biplot analyses of Bambara groundnut [Vigna subterranea (L.) Verdc.] for agronomic performances under three environmental conditions. Front. Plant Sci. 13. doi: 10.3389/fpls.2022.997429
Farshadfar, E. (2008). Incorporation of AMMI stability value and grain yielding a single non-parametric index (GSI) in bread wheat. Pakistan J. Biol. Sci. 11, 1791–1796. doi: 10.3923/pjbs.2008.1791.1796
Freiria, G. H., Goncalves, L. S. A., Furlan, F. F., Fonseca Junior, N. D. S., Lima, W. F., and Prete, C. E. C. (2018). Statistical methods to study adaptability and stability in breeding lines of food-type soybeans. Bragantia. 77, 253–264. doi: 10.1590/1678-4499.2017076
Gauch, H. G. (2006). Statistical analysis of yield trials by AMMI and GGE. Crop Sci. 46, 1488–1500. doi: 10.2135/cropsci2005.07-0193
Gauch, H. G., Jr. (2013). A simple protocol for AMMI analysis of yield trials. Crop Sci. 53, 1860–1869. doi: 10.2135/cropsci2013.04.0241
Gokce, A. F., Kaya, C., Serçe, S., and Ozgen, M. (2010). Effect of scale color on the antioxidant capacity of onions. Sci. Hortic. 123, 431–435. doi: 10.1016/j.scienta.2009.11.007
Gupta, A. J., Anandhan, S., Manjunathagowda, D. C., Benke, A. P., Mahajan, V., Kad, S. K., et al. (2022). Complement test for distinctiveness, uniformity and stability testing of kharif onion (Allium cepa L.) varieties. Genet. Resour. Crop Evol. 69, 2217–2229. doi: 10.1007/s10722-022-01372-z
Gupta, A. J., Benke, A. P., Mahajan, V., Chauhan, H., and Singh, M. (2024a). Assessment of genetic diversity and stability performance of 38 genotypes of onion (Allium cepa L.). J. Hortic. Sci. Biotechnol. 99, 560–569. doi: 10.1080/14620316.2024.2315941
Gupta, A. J., Gorrepati, K., Bibwe, B., Kaldate, S., Volaguthala, S., and Mahajan, V. (2025a). Studies on biochemical and nutraceutical profiling of 43 Indian onion (Allium cepa L.) genotypes. J. Food Meas. Charact. 19, 6614–6624. doi: 10.1007/s11694-025-03425-0
Gupta, A. J., Kaldate, S., Volaguthala, S., and Mahajan, V. (2025b). Onion nutritional and nutraceutical composition and therapeutic potential of its phytochemicals assessed through preclinical and clinical studies. J. Funct. Foods. 129, 106889. doi: 10.1016/j.jff.2025.106889
Gupta, A. J., Khade, Y. P., Benke, A. P., Mainkar, P., Gedam, P. A., Mahajan, V., et al. (2024b). Assessing onion genotypes stability and potential in diverse Indian environments. Cogent Food Agric. 10, 2360606. doi: 10.1080/23311932.2024.2360606
Habib, M. A., Azam, M. G., Haque, M. A., Hassan, L., Khatun, M. S., Nayak, S., et al. (2024). Climate-smart rice (Oryza sativa L.) genotypes identification using stability analysis, multi-trait selection index, and genotype-environment interaction at different irrigation regimes with adaptation to universal warming. Sci. Rep. 14, 13836. doi: 10.1038/s41598-024-64808-9
Hassan, N. H. S. (2015). Consumer preference implications on onion suppliers. Int. J. Econ. Manage. Sci. 4, 2. doi: 10.4172/2162-6359.1000281
Hiremath, S. M. and Mantur, S. M. (2018). Assessment of onion varieties for late kharif. Int. J. Agric. Sci. 14, 102–105. doi: 10.15740/has/ijas/14.1/102-105
Hossain, M. A., Sarker, U., Azam, M. G., Kobir, M. S., Roychowdhury, R., Ercisli, S., et al. (2023). Integrating BLUP, AMMI, and GGE models to explore GE interactions for adaptability and stability of winter lentils (Lens culinaris Medik.). Plants. 12, 2079. doi: 10.3390/plants12112079
Jambhulkar, N. N., Bose, L. K., and Singh, O. N. (2014). AMMI stability index for stability analysis Vol. 35 (Cuttack, Orissa: Central Rice Research Institute), 15–15.
John, B. A., Ramaswamy, S., Swaminathan, M., Dharmalingam, K., Mahalingam, G., Raman, P., et al. (2025). Comparative analysis of stability models for identifying rice inter-subspecific breeding lines adapted to different temperature regimes for exploitation in hybrid breeding. BMC Plant Biol. 25, 563. doi: 10.1186/s12870-025-06484-z
Kebede, B. A. and Getahun, A. (2017). Adaptability and stability analysis of groundnut genotypes using AMMI model and GGE-biplot. J. Crop Sci. Biotechnol. 20, 343–349. doi: 10.1007/s12892-017-0061-0
Khar, A., Devi, A. A., Mahajan, V., and Lawande, K. E. (2007). Stability analysis of some elite onion lines in late kharif season. Indian J. Hortic. 64, 415–419.
Khokhar, K. M. (2017). Environmental and genotypic effects on bulb development in onion-a review. J. Hortic. Sci. Biotechnol. 92, 448–454. doi: 10.1080/14620316.2017.1314199
Mitrovia, B., Treski, S., Stojakovia, M., Ivanovia, M., and Bekavac, G. (2012). Evaluation of experimental maize hybrids tested in multi-location trials using AMMI and GGE biplot analyses. Turk. J. Field Crops. 17, 35–40.
Muhie, S. H. (2022). Preharvest production practices, and postharvest treatment and handling methods for best quality onion bulbs. J. Hortic. Sci. Biotechnol. 97, 552–559. doi: 10.1080/14620316.2022.2041493
Nardino, M., Baretta, D., Carvalho, I. R., Olivoto, T., Follmann, D. N., Szareski, V. J., et al. (2016). Restricted maximum likelihood/best linear unbiased prediction (REML/BLUP) for analyzing the agronomic performance of corn. Afr. J. Agric. Res. 11, 4864–4872. doi: 10.5897/AJAR2016.11691
Olivoto, T., Lucio, A. D. C., da Silva, J. A. G., Marchioro, V. S., de Souza, V. Q., and Jost, E. (2019). Mean performance and stability in multi-environment trials I: combining features of AMMI and BLUP techniques. Agron. J. 111, 1–12. doi: 10.2134/agronj2019.03.0220
Olivoto, T. and Nardino, M. (2021). MGIDI: Toward an effective multivariate selection in biological experiments. Bioinformatics 37, 1383–1389. doi: 10.1093/bioinformatics/btaa981
Omrani, A., Omrani, S., Khodarahmi, M., Shojaei, S. H., Illes, A., Bojtor, C., et al. (2022). Evaluation of grain yield stability in some selected wheat genotypes using AMMI and GGE biplot methods. Agronomy. 12, 1130. doi: 10.3390/agronomy12051130
Pareek, S., Sagar, N. A., Sharma, S., and Kumar, V. (2017). “Onion (Allium cepa L.),” in Fruit and Vegetable Phytochemicals: Chemistry and Human Health, Hoboken, NJ, USA: Willey-Black well 2nd ed., 1145–1162. doi: 10.1002/9781119158042.ch58
Peixoto, M. A., Evangelista, J. S. P. C., Alves, R. S., Farias, F. J. C., Carvalho, L. P., Teodoro, L. P. R., et al. (2021). Models for optimizing selection based on adaptability and stability of cotton genotypes. Ciencia Rural. 51, 530. doi: 10.1590/0103-8478cr20200530
Purchase, J. L. (1997). Parametric analysis to describe genotype × environment interaction and yield stability in winter wheat. Bloemfontein, South Africa: University of the Orange Free State.
Rad, M. N., Kadir, M. A., Rafii, M. Y., Jaafar, H. Z., Naghavi, M. R., and Ahmadi, F. (2013). Genotype environment interaction by AMMI and GGE biplot analysis in three consecutive generations of wheat (Triticum aestivum) under normal and drought stress conditions. Aust. J. Crop Sci. 7, 956.
Ratnarajah, V. and Gnanachelvam, N. (2021). Effect of abiotic stress on onion yield: a review. Adv. Technol. 1, 147–160. doi: 10.31357/ait.v1i1.4876
Rodovalho, M. D. A., Coan, M. M., Scapim, C. A., Pinto, R. J., and Contreras-Soto, R. I. (2015). Comparison of HMRPGV, Lin and Binn’s, and Annichiarico’s methods for maize hybrid selection for high and stable yield. Maydica 60, 10.
Romagosa, I., Borras-Gelonch, G., Slafer, G., and van Eeuwijk, F. (2013). “Genotype by environment interaction and adaptation,” in Sustainable Food Production (Springer, New York), 846–870. doi: 10.1007/978-1-4614-5797-8_199
Sharma, S., Khar, A., Khosa, J. S., Mandal, S., and Malla, S. (2024). Recent advances in molecular genetics of onion. Horticulturae 10, 256. doi: 10.3390/horticulturae10030256
Singh, H. and Khar, A. (2022). Potential of onion (Allium cepa) as traditional therapeutic and functional food: an update. Indian J. Agric. Sci. 92, 1291–1297. doi: 10.56093/ijas.v92i11.123235
Smith, C. M., Khan, Z. R., and Pathak, M. D. (1994). Techniques for evaluating insect resistance in crop plants (Boca Raton, Florida, USA: CRC Press).
Sood, S., Bhardwaj, V., Kumar, V., and Gupta, V. K. (2020). BLUP and stability analysis of multi-environment trials of potato varieties in sub-tropical Indian conditions. Heliyon 6, e05525. doi: 10.1016/j.heliyon.2020.e05525
Tahir, M., Aleem, S., Munawar, M., Parveen, N., Amin, E., Aslam, R., et al. (2020). GGE biplot an effective tool to study genotype and genotype × environment interaction; a case study in onion (Allium cepa L.). Pakistan J. Agric. Sci. 57, 1565–1571. doi: 10.21162/PAKJAS/20.9919
Taleghani, D., Rajabi, A., Saremirad, A., and Fasahat, P. (2023). Stability analysis and selection of sugar beet (Beta vulgaris L.) genotypes using AMMI, BLUP, GGE biplot and MTSI. Sci. Rep. 13, 10019. doi: 10.1038/s41598-023-37084-7
Tignegre, J.B.D.L.S., Traore, A. S., Konate, M., Zaato, P. A., Diarra, B. G., Hanson, P., et al. (2022). Bulb yield stability study of onion lines over locations and seasons in Ghana and Mali. Agron. 12, 3037. doi: 10.3390/agronomy12123037
Tiwari, J. K., Rai, N., Singh, M. K., Reddy, Y. S., and Kumar, R. (2025). Delineating genotype × environment interaction for horticultural traits in tomato using GGE and AMMI biplot analysis. Sci. Rep. 15, 23796. doi: 10.1038/s41598-025-09021-y
Vaezi, B., Pour-Aboughadareh, A., Mohammadi, R., Armion, M., Mehraban, A., Hossein-Pour, T., et al. (2017). GGE biplot and AMMI analysis of barley yield performance in Iran. Cereal Res. Commun. 45, 500–511. doi: 10.1556/0806.45.2017.019
Verma, A. and Singh, G. P. (2021). Stability, adaptability analysis of wheat genotypes by AMMI with BLUP for restricted irrigated multi-location trials in peninsular zone of India. Agric. Sci. 12, 198–212. doi: 10.4236/as.2021.123013
Wang, R., Wang, H., Huang, S., Zhao, Y., Chen, E., Li, F., et al. (2023). Assessment of yield performances for grain sorghum varieties by AMMI and GGE biplot analyses. Front. Plant Sci. 14. doi: 10.3389/fpls.2023.1261323
Yan, W. and Fregeau-Reid, J. (2018). Genotype by yield*trait (GYT) biplot: a novel approach for genotype selection based on multiple traits. Sci. Rep. 8, 8242. doi: 10.1038/s41598-018-26432-2
Yan, W., Hunt, L. A., Sheng, Q., and Szlavnics, Z. (2000). Cultivar evaluation and mega-environment investigation based on the GGE biplot. Crop Sci. 40, 597–605. doi: 10.2135/cropsci2000.403597x
Yan, W. and Kang, M. S. (2003). GGE Biplot Analysis: A Graphical Tool for Breeders, Geneticists, and Agronomists. 1st ed. (Boca Raton, FL: CRC Press). doi: 10.1201/9781420040371
Yan, W. K., Kang, M. S., Ma, B., Woods, S., and Cornelius, P. L. (2007). GGE biplot vs. AMMI analysis of genotype-by-environment data. Crop Sci. 47, 643–655. doi: 10.2135/cropsci2006.06.0374
Yan, W. and Tinker, N. A. (2006). Biplot analysis of multi-environment trial data: Principles and applications. Can. J. Plant Sci. 86, 623–645. doi: 10.4141/P05-169
Yildirim, M. B. and Caliskan, C. F. (1985). Genotype × environment interactions in potato (Solanum tuberosum L.). Am. Potato J. 62, 371–375. doi: 10.1007/BF02855608
Yue, H., Wei, J., Xie, J., Chen, S., Peng, H., Cao, H., et al. (2022). A study on genotype-by-environment interaction analysis for agronomic traits of maize genotypes across Huang-Huai-Hai region in China. Phyton 91, 57. doi: 10.32604/phyton.2022.017308
Keywords: onion, stability, GEI, GGE biplot, AMMI biplot, MGIDI, GYT, BLUP
Citation: Gupta AJ, Aribenchi KV, Benke A, Kaldate S, Hulagannavar P, Kale R and Mahajan V (2025) Stability and adaptability assessment of red onion genotypes using AMMI, GGE, BLUP, and multivariate indices. Front. Plant Sci. 16:1694946. doi: 10.3389/fpls.2025.1694946
Received: 29 August 2025; Accepted: 26 September 2025;
Published: 22 October 2025.
Edited by:
Mohan Lal, North East Institute of Science and Technology (CSIR), IndiaCopyright © 2025 Gupta, Aribenchi, Benke, Kaldate, Hulagannavar, Kale and Mahajan. This is an open-access article distributed under the terms of the Creative Commons Attribution License (CC BY). The use, distribution or reproduction in other forums is permitted, provided the original author(s) and the copyright owner(s) are credited and that the original publication in this journal is cited, in accordance with accepted academic practice. No use, distribution or reproduction is permitted which does not comply with these terms.
*Correspondence: Amar Jeet Gupta, Z3VwdGFhajc1QHlhaG9vLmNvLmlu