 Rui Yang1†Qianyun Wang1†Yuhong Ren1Yongcheng Li1
 Jiajie Wang1
 Daling Feng1
 Wei Ma1
 Na Li2*
 Lei Yang1*
 Jianjun Zhao1*
- 1State Key Laboratory of North China Crop Improvement and Regulation, Key Laboratory of Vegetable Germplasm Innovation and Utilization of Hebei, Collaborative Innovation Center of Vegetable Industry in Hebei, College of Horticulture, Hebei Agricultural University, Baoding, China
- 2School of Breeding and Multiplication (Sanya Institute of Breeding and Multiplication), Hainan University, Sanya, China
The heading leaves of Chinese cabbage (Brassica rapa L. ssp. pekinensis) represent a critical agronomic trait that serves as the primary economic organ in Chinese cabbage. Leaf morphogenesis, a complex developmental process, is fundamentally regulated by ethylene, a phytohormone with concentration-dependent effects on plant growth. It is known that high ethylene concentrations promote leaf elongation through cell expansion and that supraoptimal levels exert inhibitory effects on growth, but the underlying mechanisms remain unclear. In this study, a forward genetics approach was employed to elucidate the genetic and molecular bases of leaf size regulation using the small-leaf mutant mini35 and its wild-type counterpart A03. Through MutMap-based positional cloning, the causal gene was identified. Transcriptome profiling was conducted to analyze differentially expressed genes. Exogenous ethylene application (20–60 mg/L) was performed to evaluate its effects on leaf development. BrSQE1, encoding squalene epoxidase 1, as the causal gene localized to chromosome A09 through MutMap-based positional cloning. Transcriptome profiling revealed significant enrichment of differentially expressed genes in the ethylene signaling pathways. Exogenous ethylene application (20–60 mg/L) showed dose-dependent effects, with low concentrations primarily suppressing cell proliferation and higher concentrations inhibiting both cell division and expansion processes. Taken together, our findings elucidate the mechanism of ethylene-mediated leaf size regulation and provide valuable genetic resources for molecular breeding aimed at optimizing heading leaf formation in Brassica crops.
Introduction
Chinese cabbage (Brassica rapa subsp. pekinensis) is one of the most important vegetable crops in China, with plant size being predominantly determined by leaf size. Although environmental factors can influence leaf growth and the final leaf area, these effects are constrained by the genetic foundation of the plant. Therefore, identifying key genes regulating leaf size in Chinese cabbage and elucidating their mechanisms of action are crucial for advancing molecular breeding efforts of this crop.
Plant leaf development initiates from the leaf primordium and proceeds through two overlapping stages, culminating in the formation of mature leaves (De Veylder et al., 2001; Breuninger and Lenhard, 2010; Efroni et al., 2010). The first phase involves active cell proliferation within the leaf primordia, while the second is characterized by the cessation of cell division and leaf enlargement primarily through cell expansion (Lv et al., 2023). Current evidence indicates that the final leaf size and shape are determined using six factors: the number of cells in the leaf primordium, the rate and duration of cell proliferation, the extent of meristematic tissue division, and the rate and duration of cell expansion (Gonzalez et al., 2012). Cell numbers in the leaf primordia are widely recognized as critical in defining ultimate leaf size (Poethig and Sussex, 1985; Dolan and Poethig, 1998). The rate and duration of cell proliferation are closely associated with the leaf primordial cell number, collectively serving as early determinants of leaf size, a process in which cyclins play a central role (Inzé and De Veylder, 2006). Following the cessation of cell division, cell expansion becomes the dominant process. Notably, the presumptive meristem retains a considerable division capacity, permitting additional rounds of cell division (Lv et al., 2023). The presumptive meristem may regulate the cell cycle by modulating the expression of DNA-binding proteins, such as PEAPOD (PPD), which could influence the duration of the cell division phase and, consequently, impact the final leaf size (Geisler et al., 2000; White, 2006; Fisher and Turner, 2007; Peterson et al., 2010; Wang et al., 2016). In the final stage of leaf enlargement, the rate and duration of cell expansion are key determinants of the extent of cellular enlargement, ultimately leading to the formation of a mature functional leaf.
Ethylene, the only known gaseous phytohormone, plays pivotal roles in various aspects of plant growth and development (Wang et al., 2025), including promoting seed germination, inhibiting root elongation, stimulating root hair development, and mediating the senescence and abscission of flowers and leaves (Chang, 2016). The biosynthesis of ethylene uses methionine as a precursor and proceeds via two key intermediates, S-adenosylmethionine (SAM) and 1-aminocyclopropane-1-carboxylic acid (ACC), with sequential catalysis by three enzymes: S-adenosylmethionine synthase (SAMS), 1-aminocyclopropane-1-carboxylic acid synthase (ACS; the core rate-limiting enzyme), and 1-aminocyclopropane-1-carboxylic acid oxidase (ACO). Specifically, SAMS first facilitates the conversion of methionine and ATP into SAM; ACS then cleaves SAM into 5′-methylthioadenosine (MTA) and ACC; finally, ACO catalyzes ACC to synthesize ethylene, where the activities of ACS and ACO are the core links regulating ethylene synthesis. For ethylene signal transduction, with the assistance of copper ions, the process initiates when ethylene molecules bind to receptors such as ETR1 and ERS1 on the endoplasmic reticulum membrane, which inactivates the negative regulatory CTR1 complex. This inactivation prevents CTR1 from phosphorylating the downstream EIN2 protein, allowing EIN2 to avoid degradation and become activated; subsequently, the carboxyl-terminal domain of EIN2 (EIN2 CEND) is cleaved and translocates into the nucleus. Once in the nucleus, EIN2 CEND inhibits the EBF1/2-mediated ubiquitin-dependent degradation of transcription factors EIN3/EIL1, promoting their accumulation in the nucleus and ultimately activating the expression of downstream target genes to trigger ethylene-related physiological responses (Chien and Yoon, 2024; Li et al., 2025). Although previous studies have suggested that ethylene modulates cell cycle progression by suppressing CDKA1 activity, potentially through post-transcriptional regulation, the precise mechanistic basis of this interaction remains unclear (Skirycz et al., 2011). Ethylene response factors (ERFs), which encode transcription factors from the AP2/ERF superfamily, are central components of the ethylene signaling pathway and regulate the transcription of ethylene-responsive genes (Müller and Munné-BOSCH, 2015). The ERF family is involved in the regulation of various physiological processes (Liu et al., 2018; Deng et al., 2022; Guo et al., 2022). In Chinese cabbage, the overexpression of BrERF4 in Arabidopsis has been shown to inhibit cell expansion, leading to smaller leaves (Park et al., 2012). In this study, we identified a leaf size reduction mutant, mini35, derived from an ethyl methanesulfonate (EMS)-mutagenized Chinese cabbage mutant library. This mutation may be linked to the upregulation of ERF expression, which suppresses cell division, a process likely regulated by the expression of Squalene Epoxidase 1 (SQE1).
Results
Phenotypic characterization of the mini35 mutant
A leaf size reduction mutant, mini35, was identified from an EMS-mutagenized Chinese cabbage mutant library (Figures 1A, B). Phenotypic characterization was performed across multiple developmental stages, including the rosette, folding, heading, and harvest stages. As the results showed, the mini35 mutant exhibited significant reductions in maximum leaf length, maximum leaf width, plant spread, and total leaf number compared with those of the wild type (WT) (Figures 1C–F). The measurement of leaf area further confirmed that the leaf size of mini35 was considerably smaller than that of the WT (Figures 2C, D). However, microscopic observation of the leaf palisade mesophyll cells’ size revealed no significant differences between mini35 and the WT (Figures 2A, B, E). These results indicate that the reduced leaf size in mini35 is attributable to impaired cell division during leaf development, leading to a decrease in total cell number per leaf.
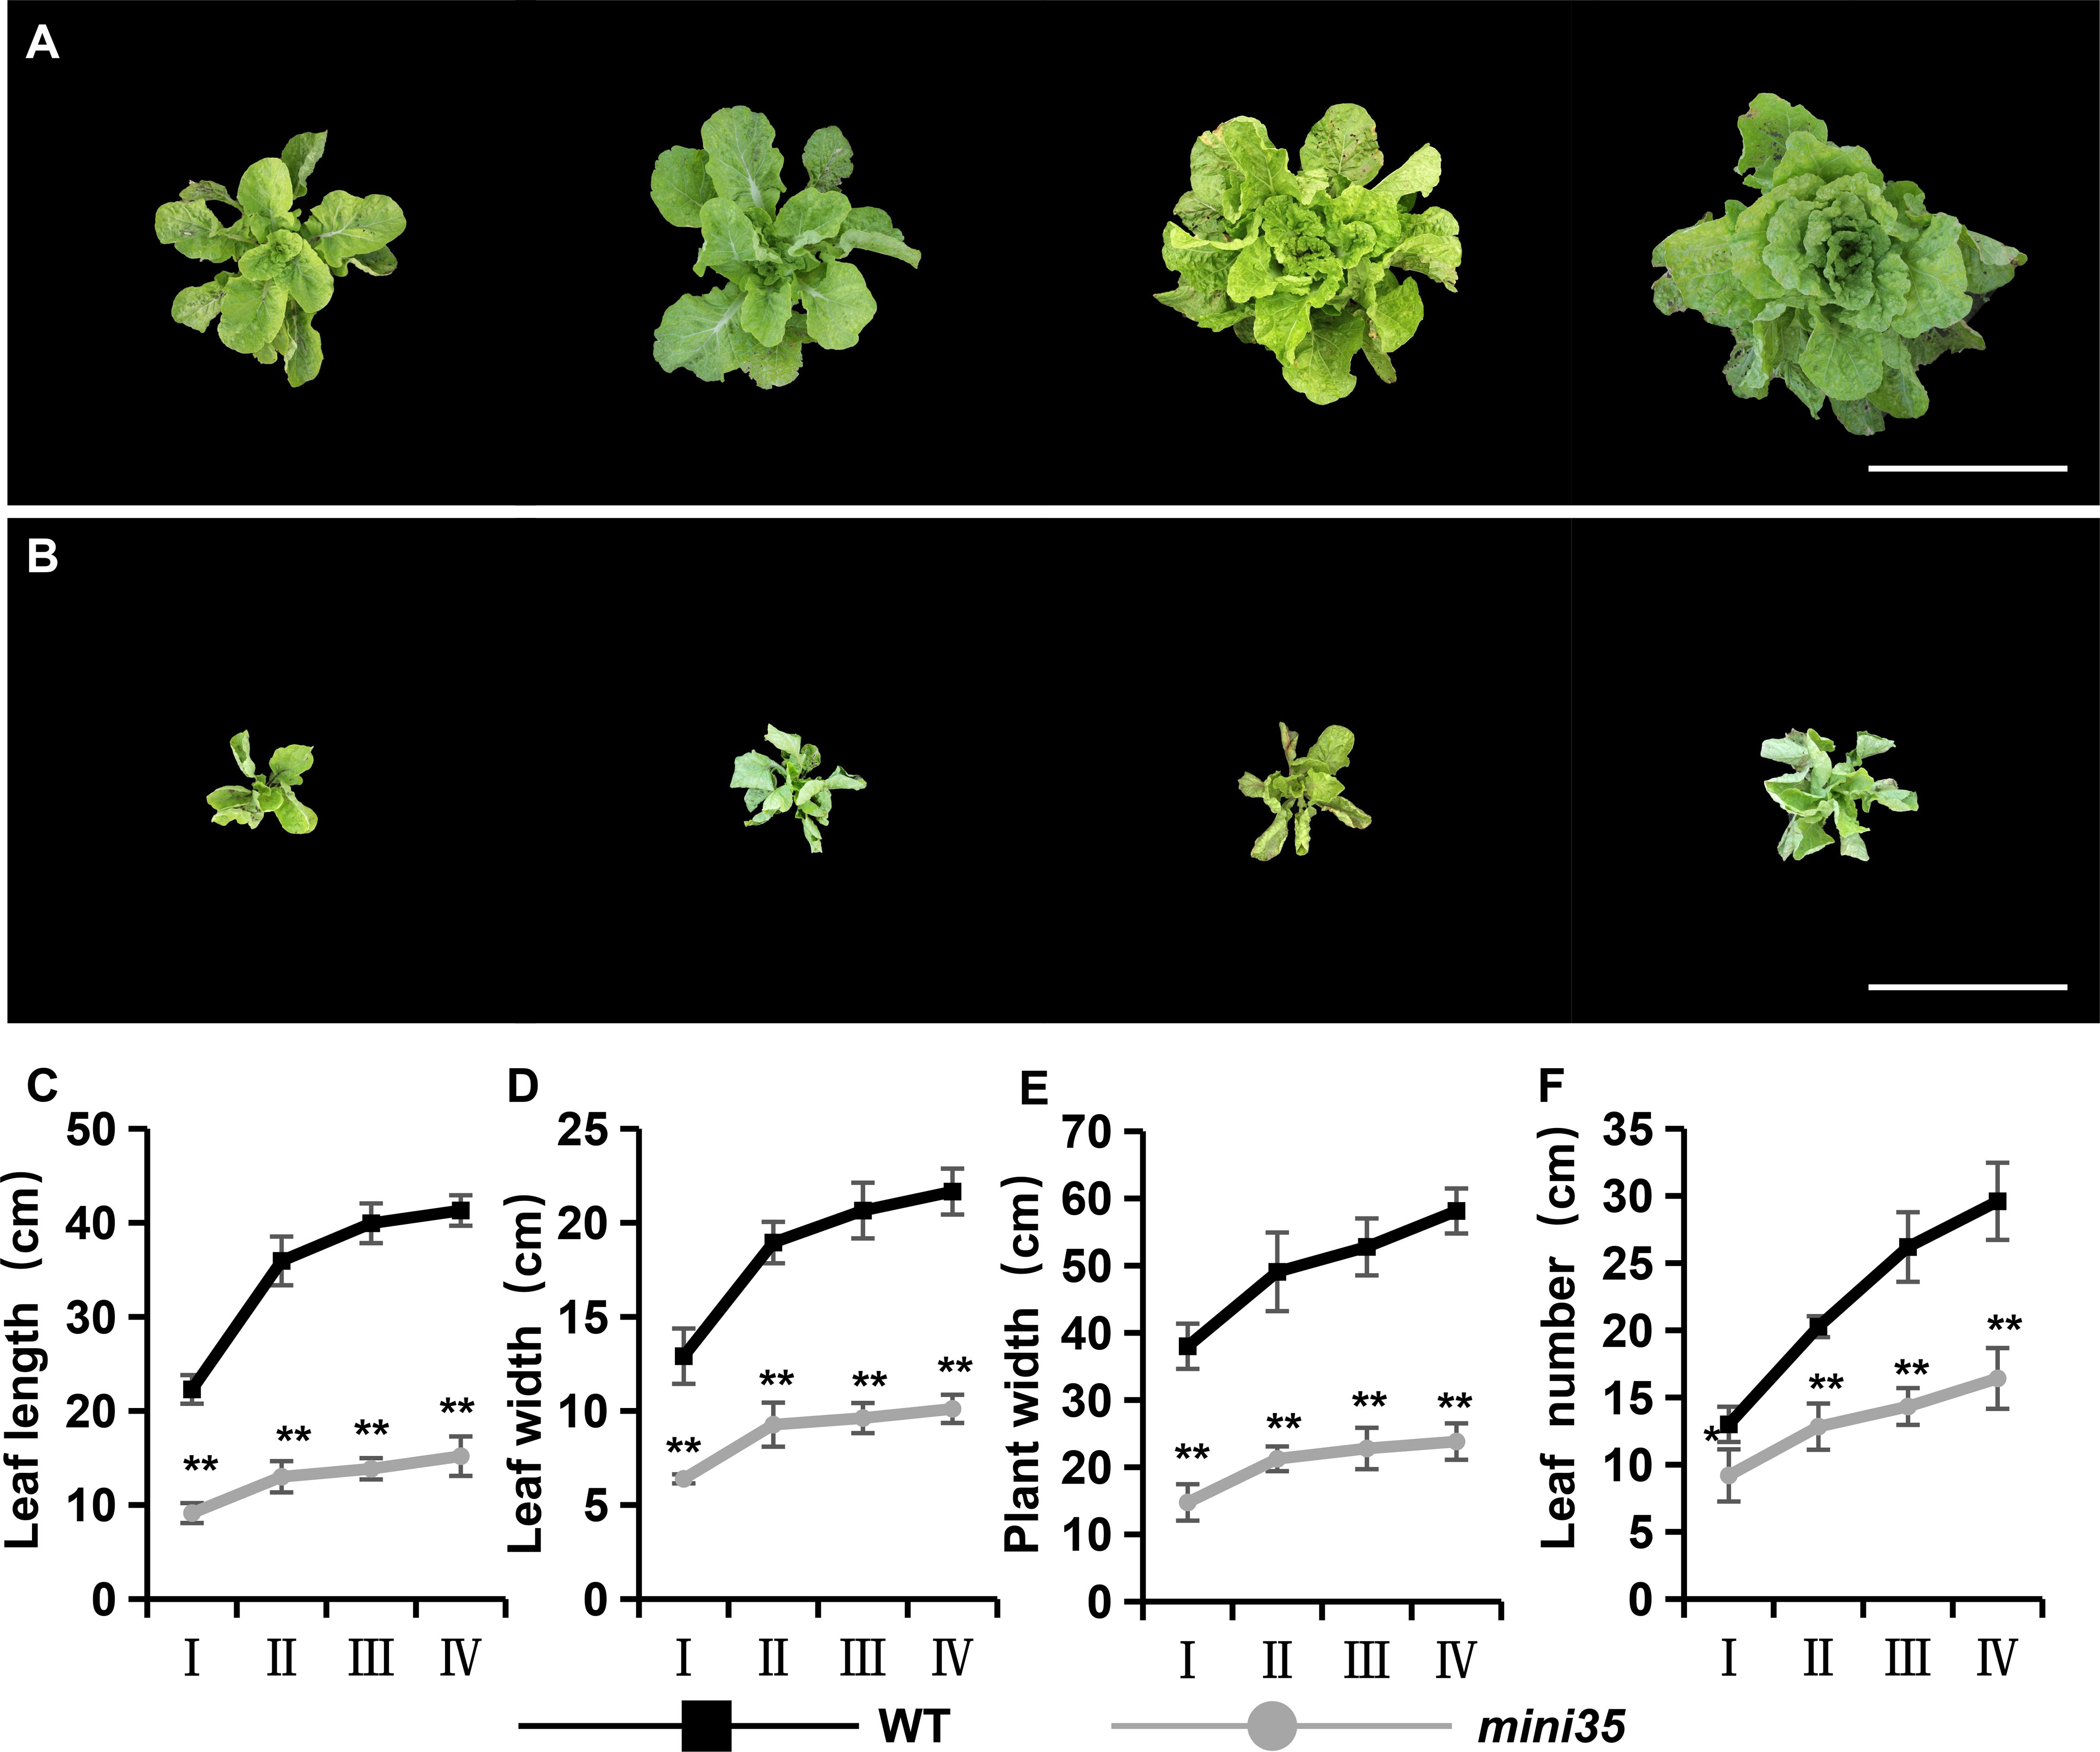
Figure 1. Plant phenotypes of the wild type (WT) and mini35. (A, B) Plant phenotypes of WT (A) and mini35 (B) plants at the rosette stage, folding stage, heading stage, and harvest stage. Scale bars = 50 cm. (C–F) Dynamic growth measurements of plant leaf length (C), leaf width (D), plant width (E), and leaf length (F) in WT and mini35. Abscissa: I, rosette stage; II, folding stage; III, heading stage; and IV, harvest stage. The values are given as the mean (n = 20) ± SD. *p < 0.05, **p < 0.01. A Student’s t-test was used for comparisons between phenotypes.
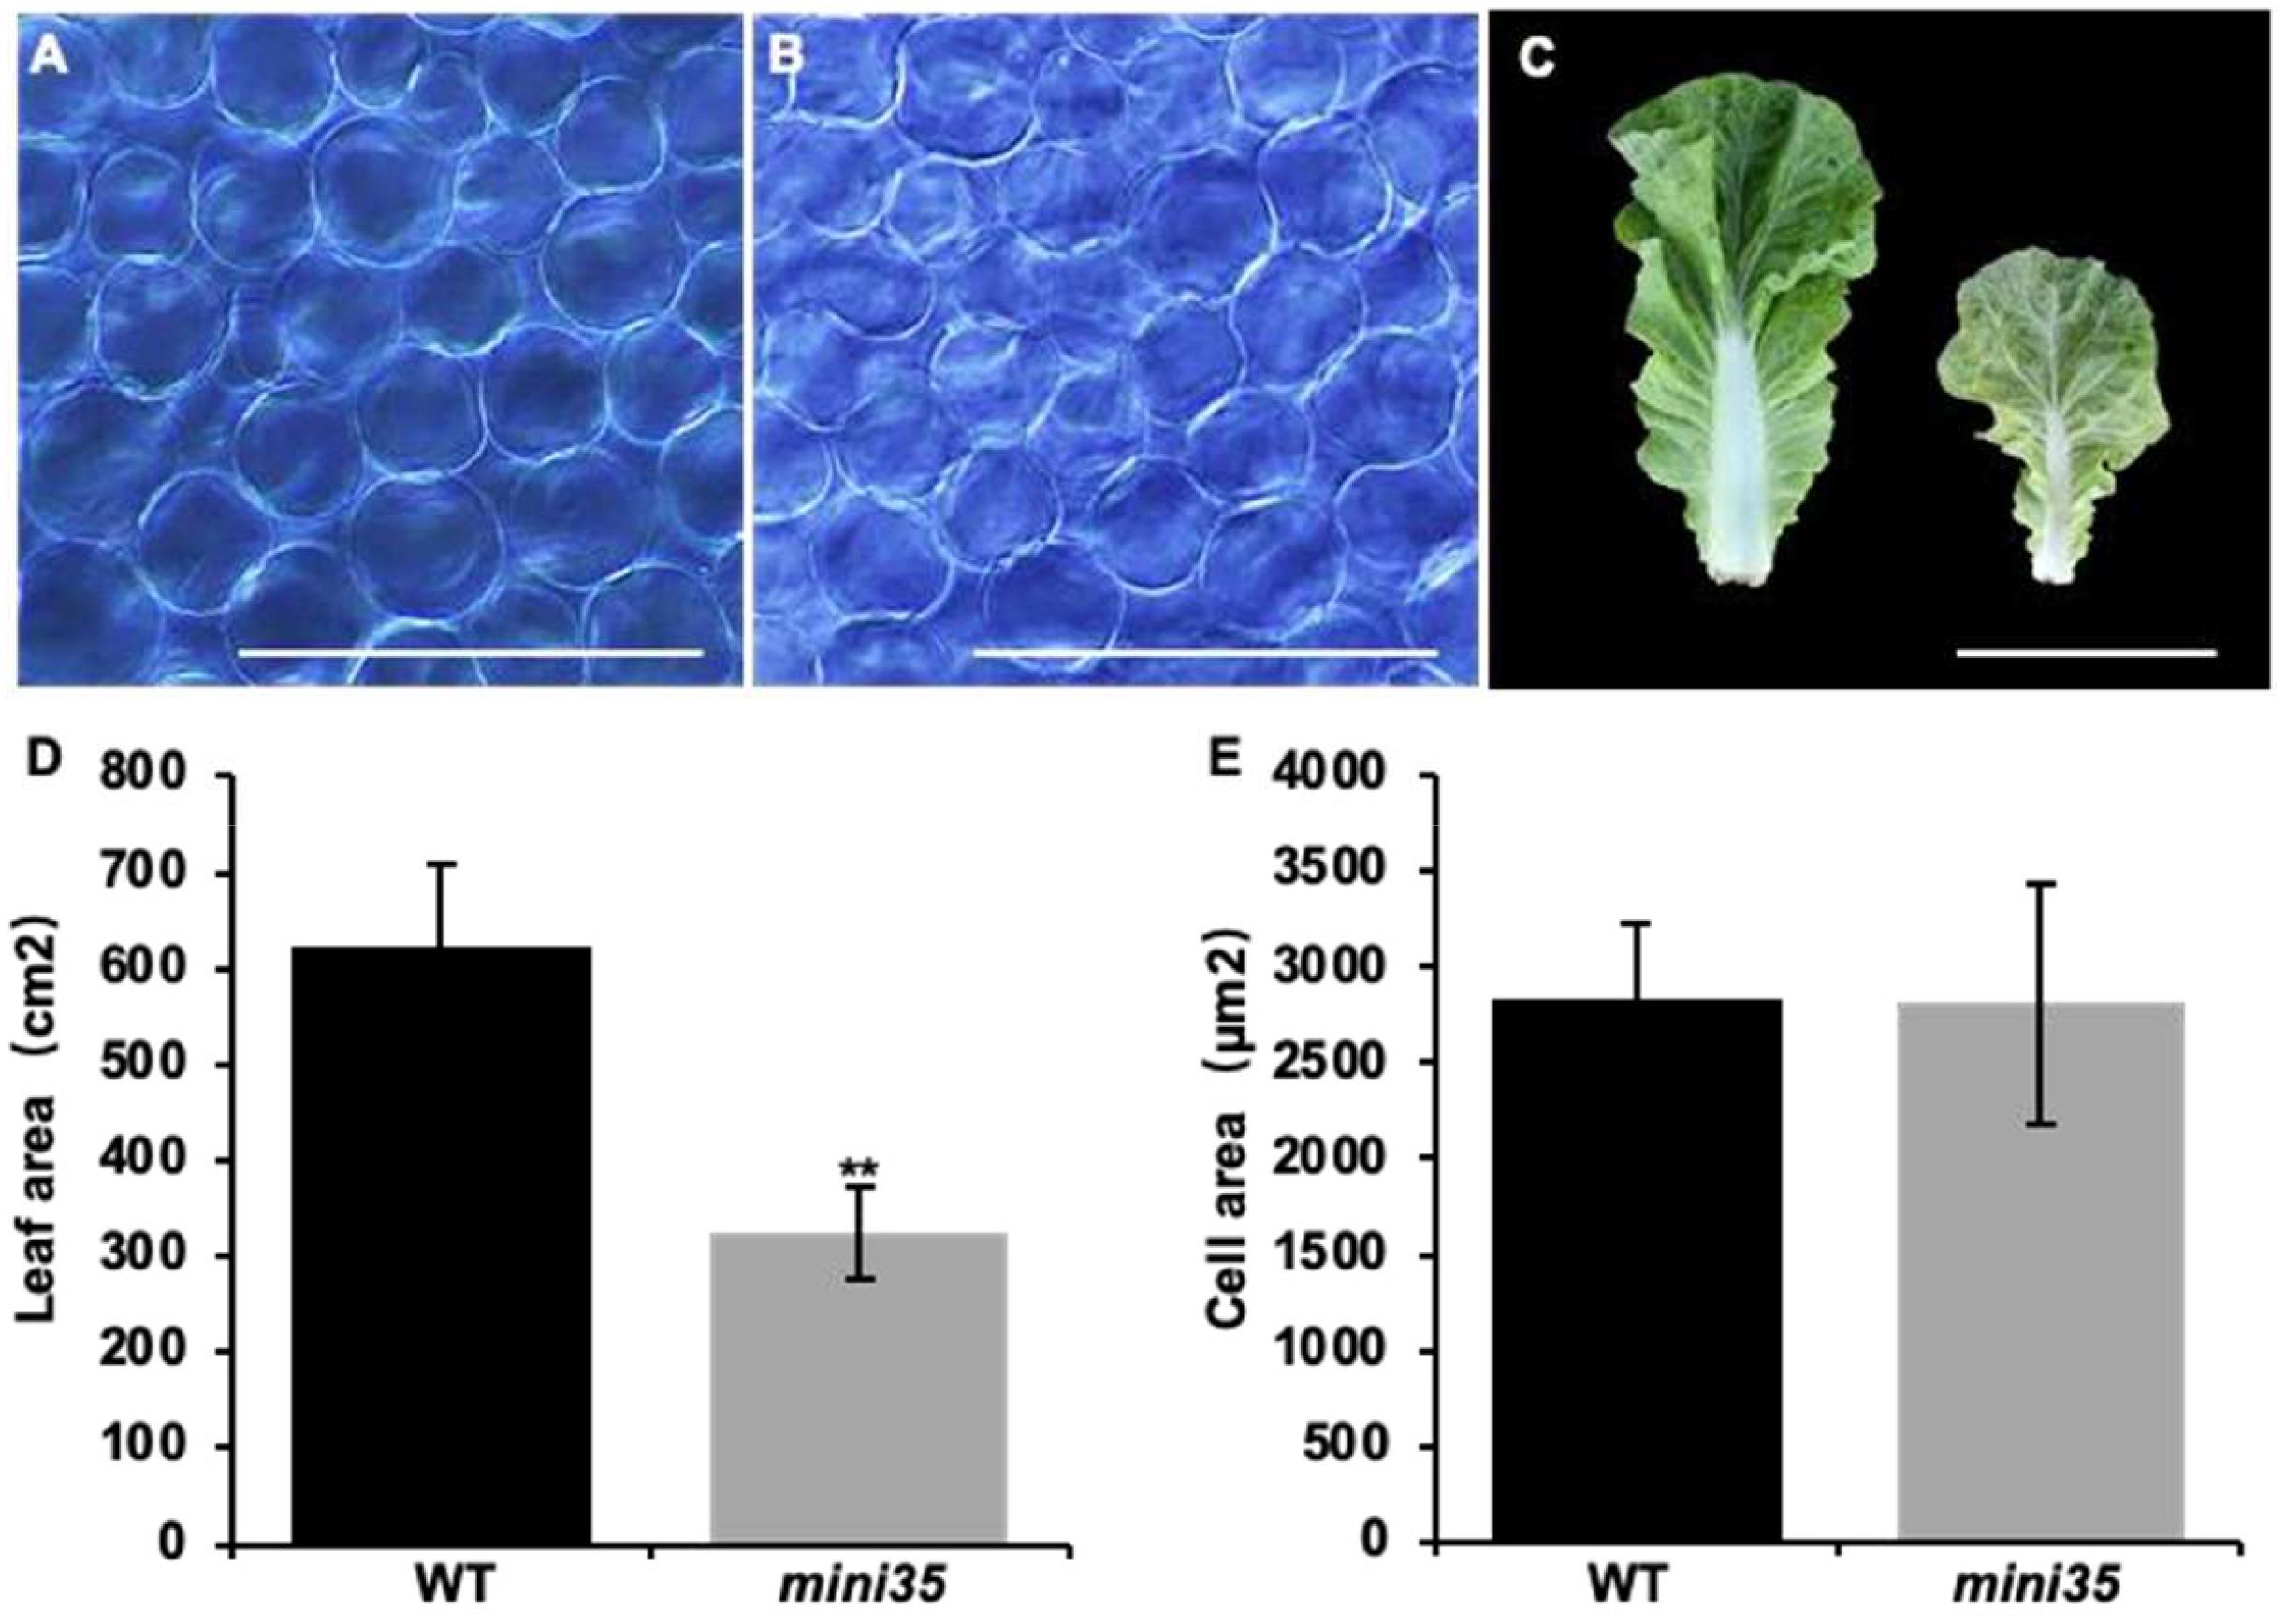
Figure 2. Cell area of the WT and mini35. (A) Cell area of WT. Scale bar = 200 μm. (B) Cell area of mini35. Scale bar = 200 μm. (C) Leaves from WT (left) and mini35 plants. Images show the maximal leaf at the folding stage. Scale bar = 20 cm. (D) WT and mini35 leaf areas. The values are given as the mean (n = 10) ± SD. A Student’s t-test was used to compare WT and mini35. **p < 0.01. (E) WT and mini35 cell areas. The values are given as the mean (n = 10) ± SD. A Student’s t-test was used to compare WT and mini35. **p < 0.01. WT, wild type.
Genetic analysis and map-based cloning of the mini35 mutant gene
Genetic analysis was conducted to elucidate the inheritance pattern of the small-leaf phenotype in the mini35 mutant. Crosses between mini35 and the WT revealed that all F1 progeny exhibited the wild-type phenotype. In the F2 population, segregation of large and small plants was observed. The chi-square analysis of these two independent F2 populations (mini35 F2–1 and mini35 F2-2) yielded values of 2.4 and 0.26 (p > 0.05), consistent with a 3:1 Mendelian ratio. These findings indicate that the small-plant trait is controlled by a single recessive nuclear gene (Table 1).
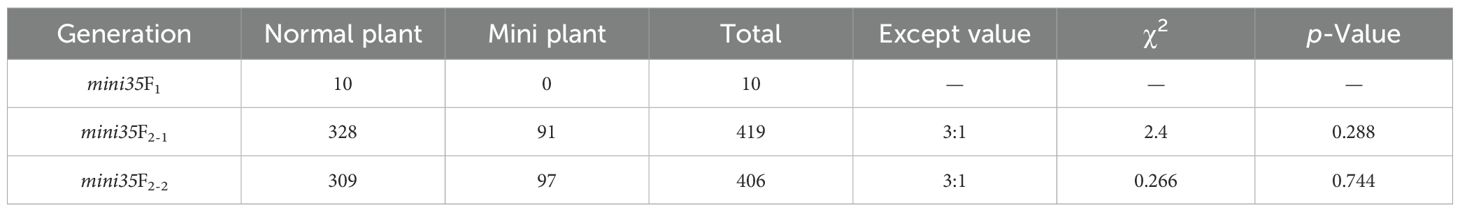
Table 1. Genetic analysis of mini35.
To identify the candidate gene of the mini35 mutant, MutMap analysis was performed on the F2 population derived from a cross between mini35 and the WT. Thirty individual plants with the WT and mini35 phenotypes were selected and pooled separately for genome resequencing. The resulting reads were aligned to the reference genome of WT (A03). Filtering based on Single Nucleotide Polymorphism (SNP) index (≥0.8) identified two candidate regions on chromosome A09, spanning 10–24 and 37.5–45.7 Mb (Figure 3A). Within these intervals, non-synonymous mutations with a ΔSNP index > 0.5 were selected, yielding seven candidate genes (Table 2).
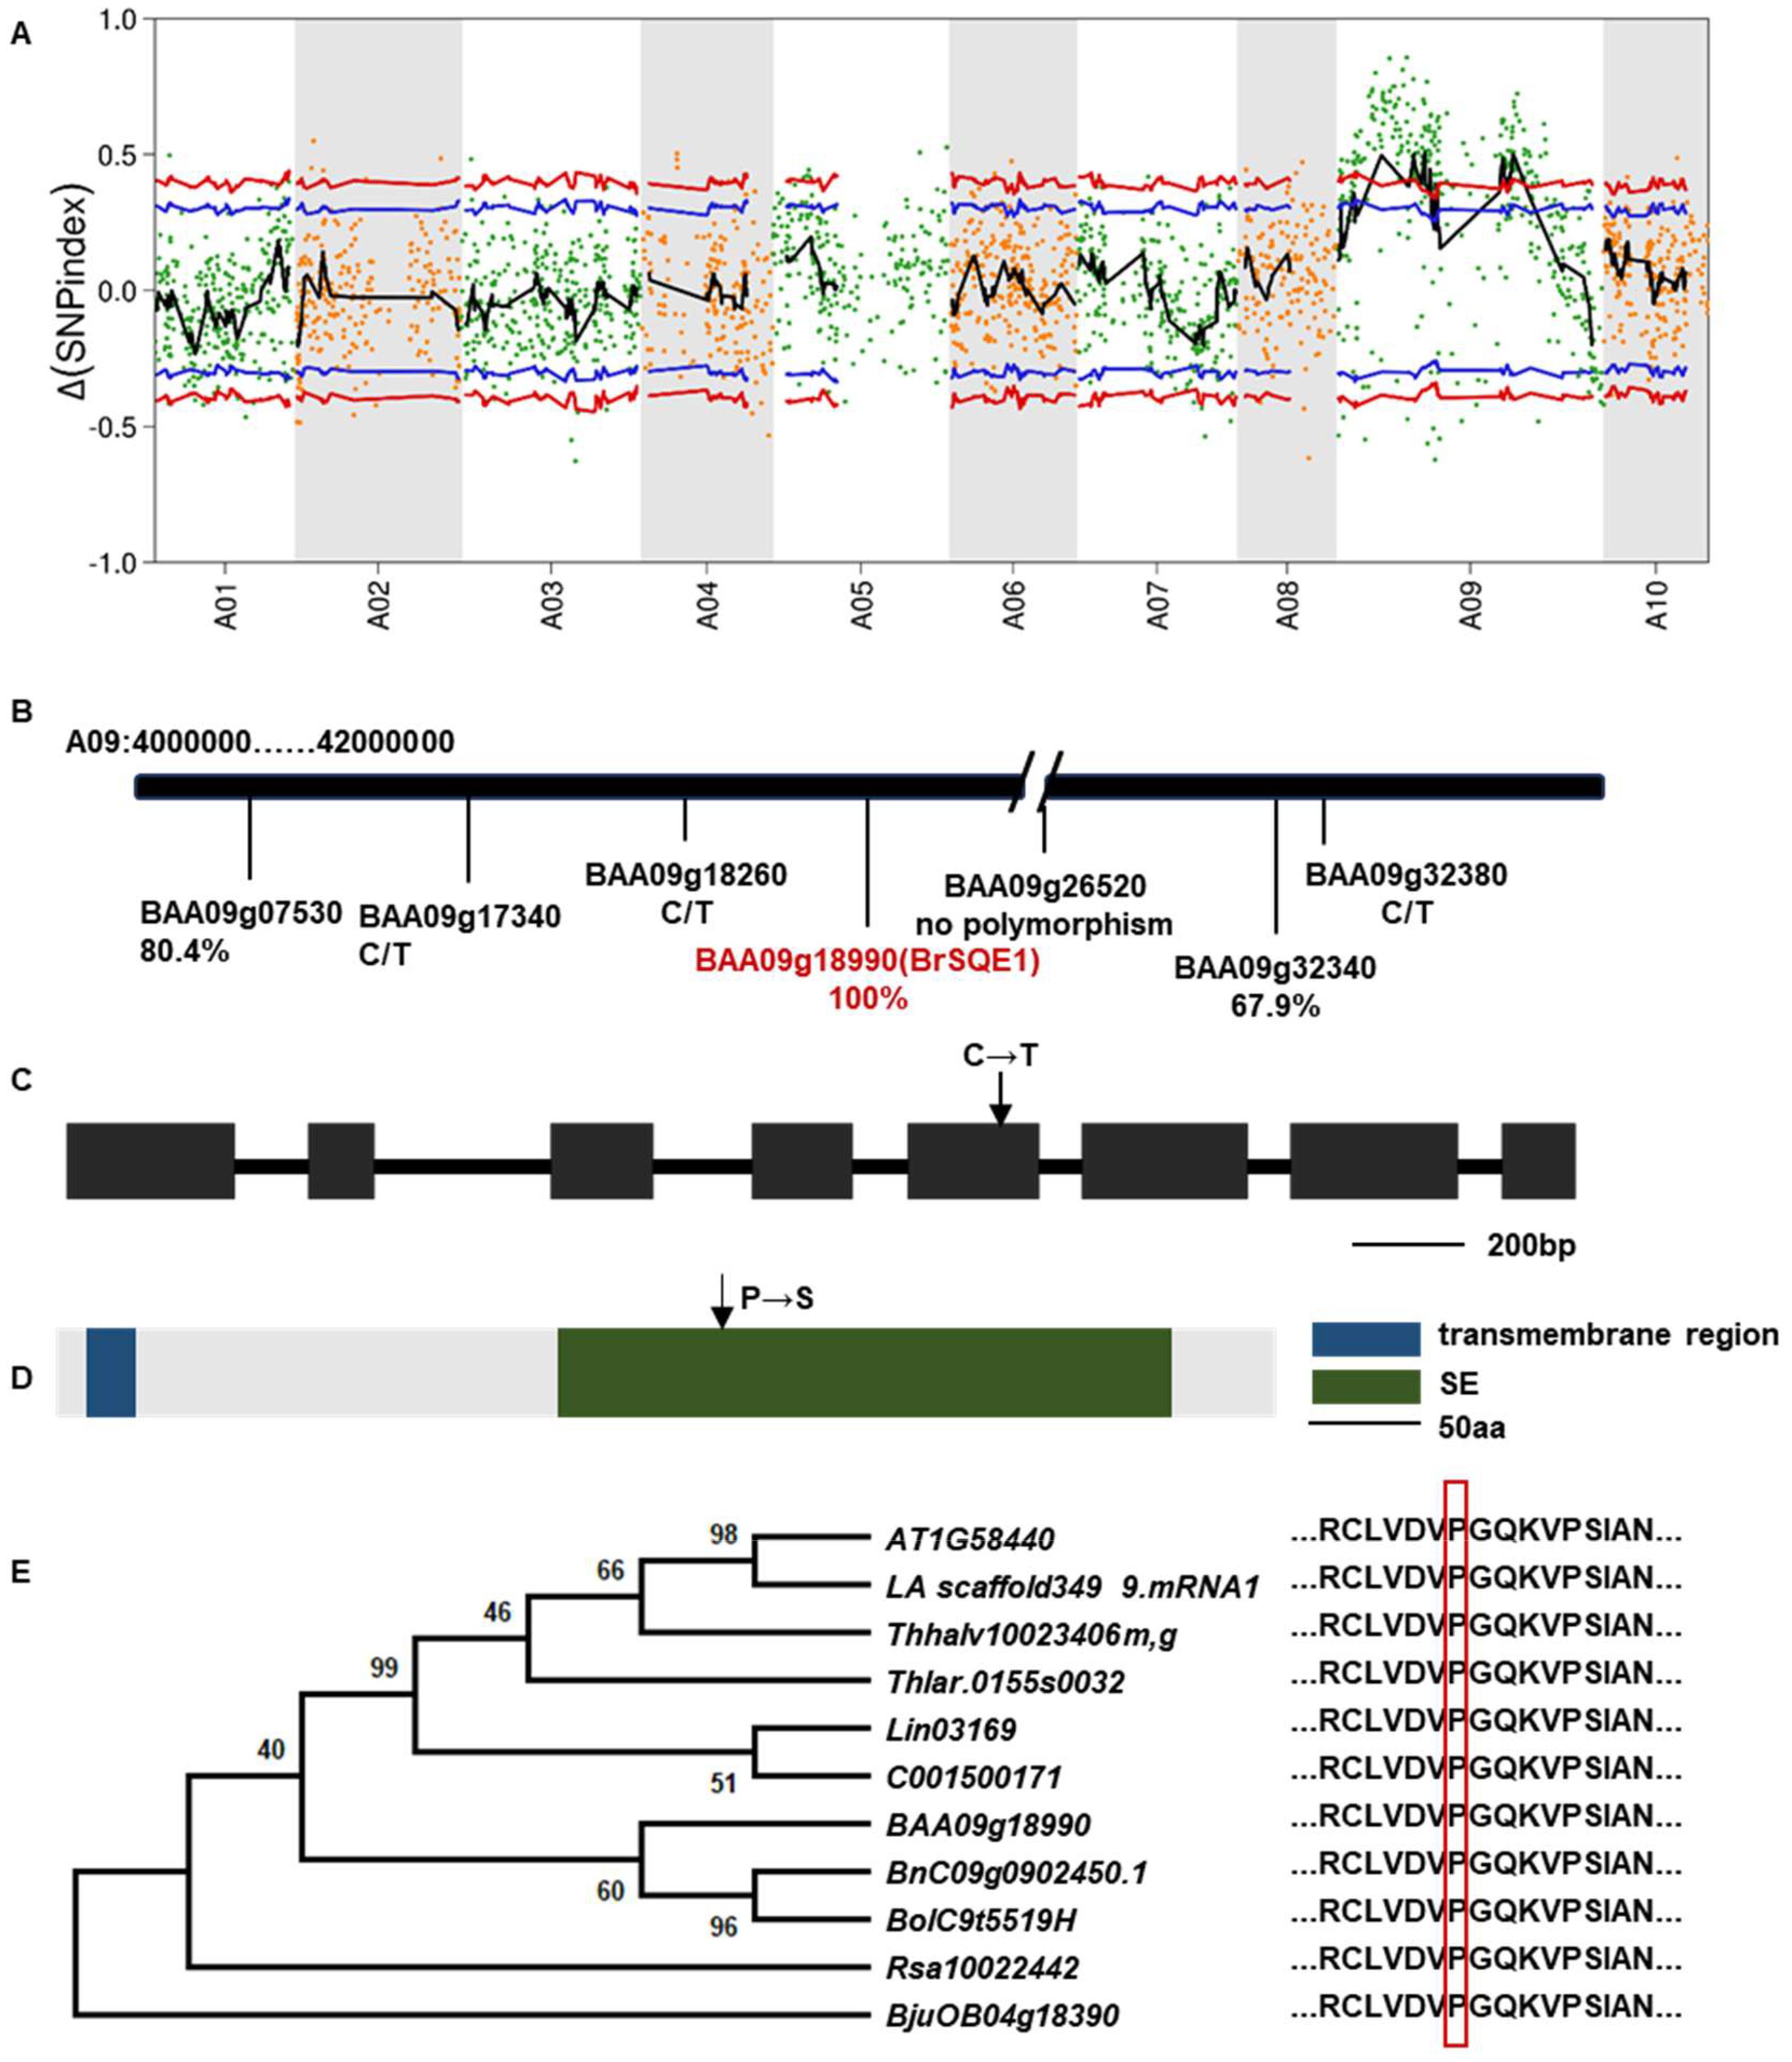
Figure 3. Identification of candidate loci for mini35. (A) Identification of genomic regions harboring causal mutations for mini35 using MutMap. SNP index plots for mini35 showing 10 chromosomes. Each symbol corresponds to an SNP, and the x-axis corresponds to the chromosomal position. The black regression line is the average value of the SNP index based on a sliding window analysis. SNPs on the WT chromosome marked by a red circle are the predicted causal mutations for mini35. (B) The chromosomal positions of six mutant genes were identified using MutMap. The key gene BAA09g18990 (BrSQE1), labeled in red, was identified as closely associated with leaf size in the results of the target SNP. The correlations with leaf size are indicated beneath the SNP or gene, and C/T indicates the SNPs that are heterozygous genotypes in mini35. (C) Schematic diagram of BrSQE1 and SNPs in mini35 mutant genes. Black boxes represent exons (scale bar = 200 bp). The arrow indicates the mutation site in mini35 mutant. (D) Protein domain architecture of BrSQE1. Scale bar = 50 aa. The arrow indicates the mutation site in mini35 mutant. (E) Phylogenetic analysis of BrSQE1 (marked with a red diamond) and other SQEs of the Brassicaceae (Brassica napus, Brassica oleracea, Isatis indigotica, Leavenworthia alabamica, Raphanus sativus, Schrenkiella parvula, Thlaspi arvense, Thellungiella halophila, and Brassica juncea) using SQE1 protein domains. The SQE1 protein sequence is shown on the right. The vertical red box shows the amino acid that is altered in the mini35 mutant. The data showed that the mutation sites were highly conserved in Brassicaceae crops. A phylogenetic tree was constructed via the neighbor-joining method. ClustalW in MEGA was used for multiple alignment using the default setting and phylogenetic construction. WT, wild type; SQEs, squalene epoxidases.
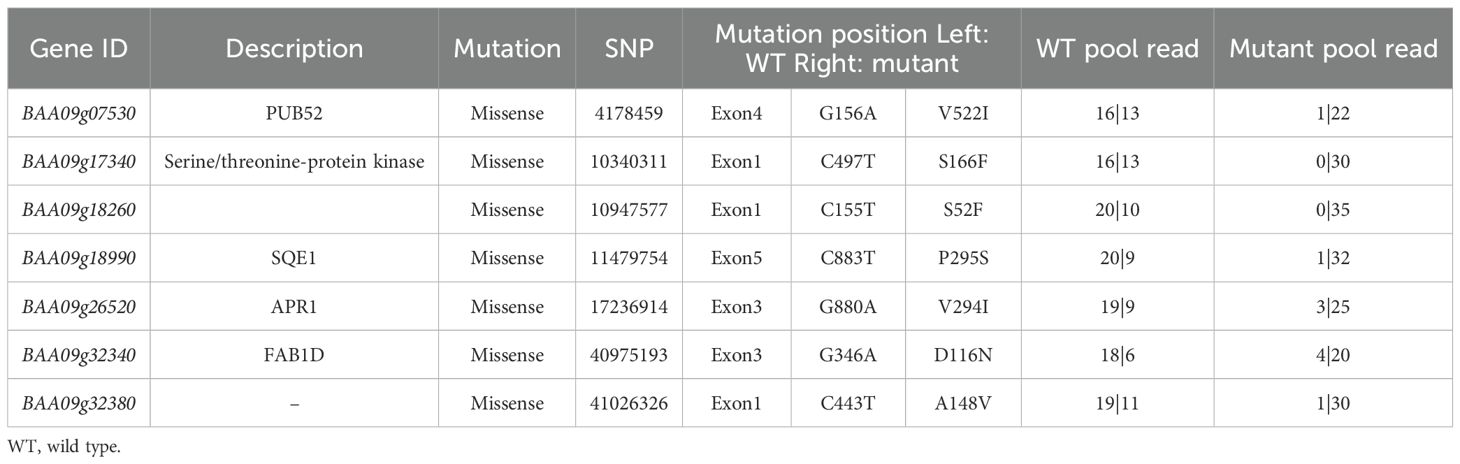
Table 2. Mutation spectrum of eight mutant genes selected in the mini35 candidate genomic region identified using MutMap sequencing.
Kompetitive Allele Specific PCR (KASP) analysis was performed to genotype the seven candidate SNP loci in all F2 individuals. Among these, the locus BAA09g26520 (A09:17,236,914) did not exhibit polymorphisms in the F2 population. Three other SNP loci, BAA09g17340 (A09:10,340,311), BAA09g18260 (A09:10,947,577), and BAA09g32380 (A09:41,026,326), were heterozygous in mini35, thus excluding them as potential candidate genes. Although BAA09g07530 (A09: 4,178,459) and BAA09g32340 (A09:40,975,193) showed phenotypic correlation rates of 80.4% and 67.9%, respectively, they were not pursued enough as candidates. Notably, the SNP in BAA09g18990 (A09:11,479,754) showed complete co-segregation with the small-leaf phenotype. Therefore, BAA09g18990 was considered the candidate gene responsible for the mini35 small-leaf phenotype. Gene annotation revealed that BAA09g18990 is homologous to SQE1 in Arabidopsis and was thus designated BAA09g18990 as BrSQE1 (Figure 3B).
Structural and evolutionary analyses of the BrSQE1 gene
Further analysis of the BrSQE1 gene revealed that it is composed of eight exons, with the causal mutation located in the fifth exon (883 bp), where a C-to-T transition results in a non-synonymous substitution (Table 2, Figure 3C). Protein sequence analysis indicated that BrSQE1 contains an N-terminal transmembrane domain and a functional squalene epoxidase (SE) domain. A single amino acid substitution occurs at position 295, where proline (P) is replaced by serine (S) (Figure 3D). To assess the evolutionary conservation of BrSQE1, we performed a comparative analysis across multiple cruciferous species, including Brassica napus, Brassica oleracea, Isatis indigotica, Leavenworthia alabamica, Raphanus sativus, Schrenkiella parvula, Thlaspi arvense, Thellungiella halophila, and Brassica juncea. The results showed that the SQE1 gene is present as a single-copy gene in these species, and the P295S mutation site is extremely conserved among them (Figure 3E). These findings suggest that the function of SQE1 is likely conserved within the cruciferous family.
Silencing the BrSQE1 gene reduces plant size in Chinese cabbage
To further investigate the biological function of the BrSQE1 in regulating plant architecture, we performed virus-induced gene silencing (VIGS) targeting the BrSQE1 gene in WT plants, with an empty vector (pTY-S) as a negative control. Phenotypic analysis showed that BrSQE1-silenced plants (pTY-BrSQE1) developed significantly fewer leaves compared to the negative control plants (pTY-S) (Figures 4A, B). Consistent with this, measurement of the sixth true leaf indicated a pronounced reduction in leaf area upon BrSQE1 silencing in plants (Figure 4C). We confirmed the silencing efficiency of BrSQE1 using quantitative real-time PCR (qRT-PCR), which indicated a significant decrease in BrSQE1 transcript levels in pTY-BrSQE1 plants relative to the control (Figure 4D). Collectively, these results suggest that BrSQE1 plays a critical role in leaf development and overall plant size regulation in Chinese cabbage.
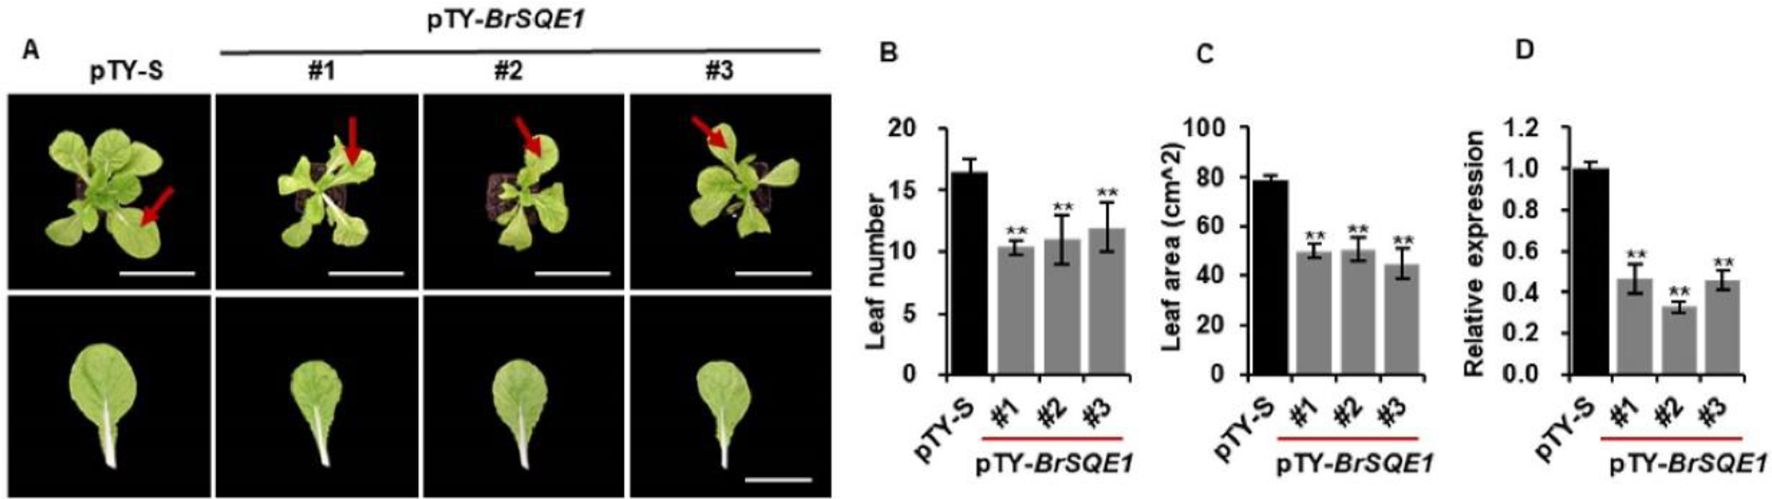
Figure 4. Silencing of BrSQE1 reduces plant size of Chinese cabbage. (A) Phenotypes of pTY-S and BrSQE1-silenced (pTY-BrSQE1) plants (top) and the sixth leaf (bottom). Bars = 10 cm. Images were digitally extracted for comparison. VIGS of BrSQE1 was performed on Chinese cabbage plantlets at 5 days after seed germination in the greenhouse. Plants were photographed 30 days after VIGS. (B) Leaf number of plant after BrSQE1 was silenced at 30 days after VIGS. Data are shown as means ± SD (N = 3). **p < 0.01 indicates statistical significance by Student’s t-tests. (C) Area of the sixth leaf after BrSQE1 was silenced at 30 days after VIGS. Data are shown as means ± SD (N = 3). **p < 0.01 indicates statistical significance by Student’s t-tests. (D) Silencing efficiency assessment of BrSQE1. Data are shown as means ± SD (n = 3). **p < 0.01 indicates statistical significance by Student’s t-tests. VIGS, virus-induced gene silencing.
In the mini35 mutant, significant alterations were observed in the ethylene response pathway
To elucidate the molecular mechanisms underlying the reduced leaf size in mini35, we performed transcriptome sequencing on 10-day-old seedlings of both WT and mini35. Comparative analysis identified 276 differentially expressed genes (DEGs), with 181 upregulated and 95 downregulated in mini35 (|log2Foldchange| > 1, padj < 0.05) (Figure 5A). The Kyoto Encyclopedia of Genes and Genomes (KEGG) pathway enrichment analysis of DEGs revealed significant enrichment (padj < 0.5) in four pathways, including “phenylpropanoid biosynthesis”, “glutathione metabolism”, “MAPK signaling pathway-plant”, and “plant hormone signal transduction” (Figure 5B). Next, we focused particularly on the “plant hormone signal transduction” pathway, in which nine DEGs were identified, including seven upregulated and two downregulated genes. Among these, five upregulated genes were significantly associated with the ethylene signaling pathway. These included two copies of BrERF15 (BrERF15–1 and BrERF15-2), two copies of BrERF59 (BrERF59–1 and BrERF59-2), and one copy of BrERF1, all of which function downstream in ethylene signaling (Supplementary Table S1, Figure 5C). Furthermore, to validate whether their upregulation was directly linked to BrSQE1 dysfunction, we examined the expression of these BrERFs in BrSQE1-silenced plants (pTY-BrSQE1) and empty vector controls (pTY-S). qRT-PCR results confirmed that silencing of BrSQE1 significantly elevated the transcript levels of BrERF1, BrERF15-1, BrERF15-2, BrERF59-1, and BrERF59-2 (Figure 5D). These findings strongly suggest that the mutation in BrSQE1 leads to the upregulation of key ethylene-responsive transcription factors, which may contribute to the leaf size phenotype by inhibiting cell proliferation.
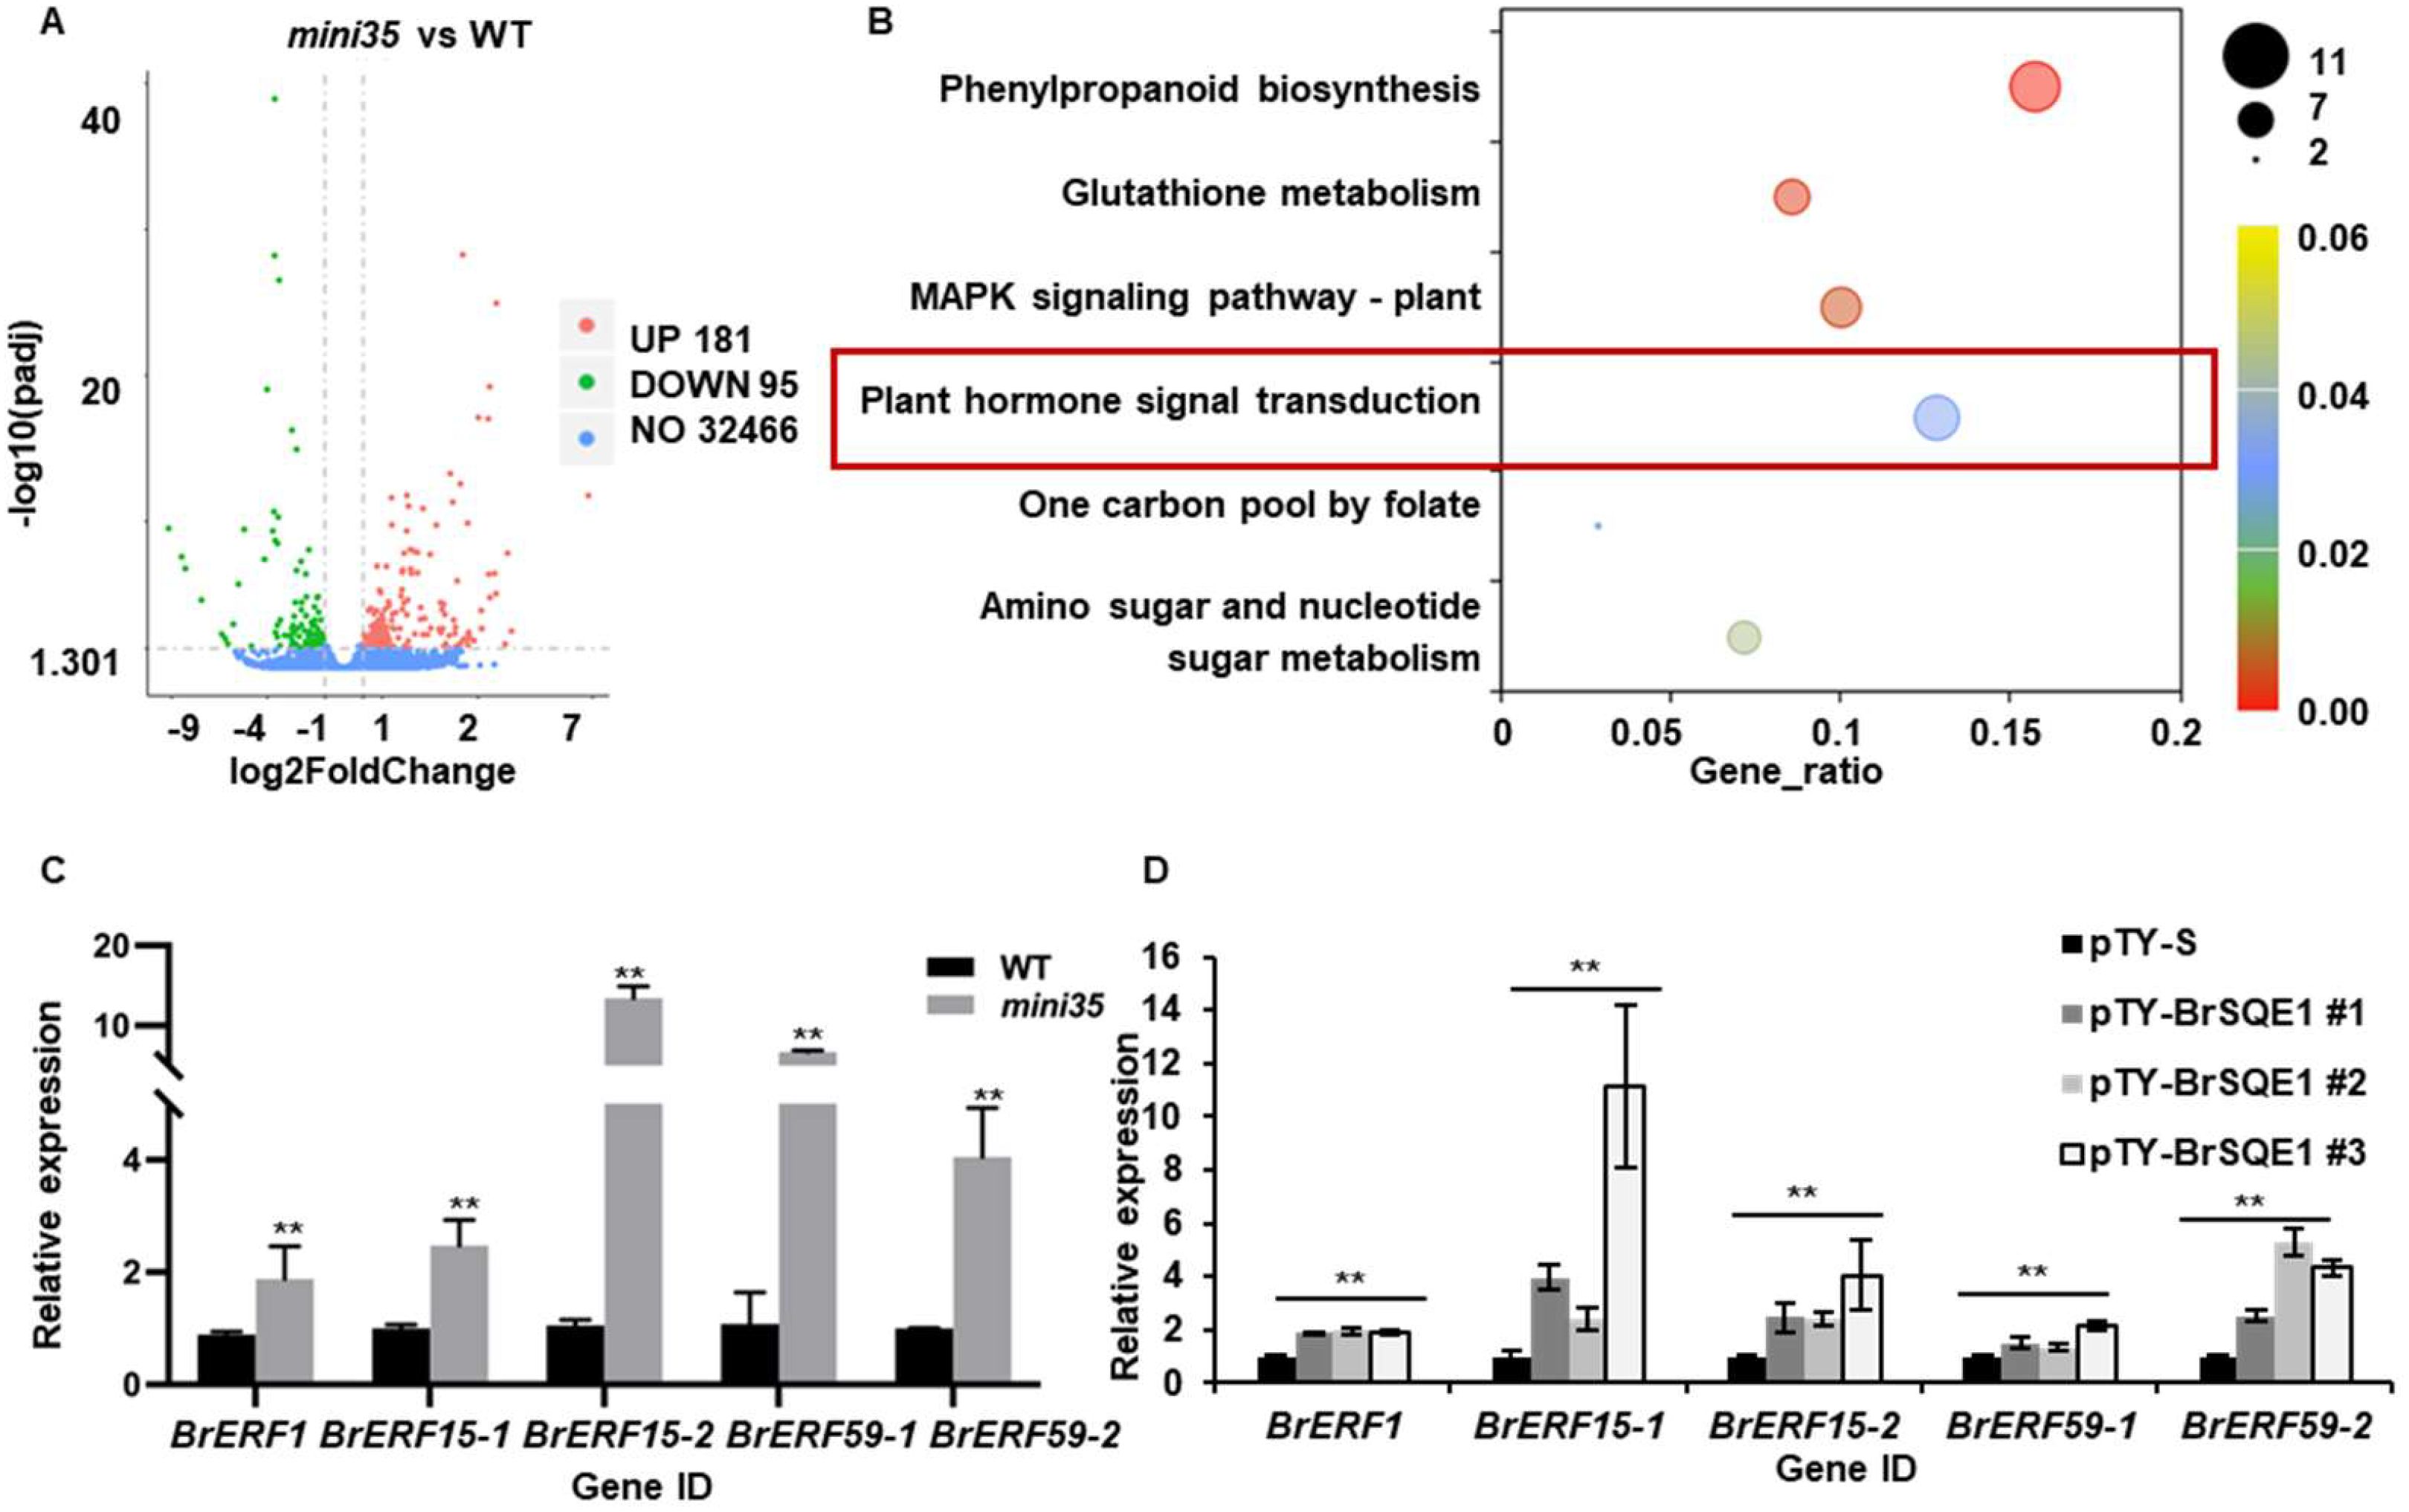
Figure 5. Ethylene-related gene expression was upregulated in mini35. (A) Volcano plot showing the number of significantly regulated genes (two-tailed p < 0.05, and fold change >1). Statistical significance was analyzed using multiple t-tests with correction for multiple comparisons. (B) The significantly different KEGG pathways were analyzed in mini35 and WT. The vertical axis represents the pathway name, the horizontal axis represents the GeneRadio, the size of dots in the pathway represents the number of DEGs, and the p-adjust value is reflected by the color of the dots. (C) Relative expression of the ethylene signaling pathway gene Fragments Per Kilobase of exon model per Million mapped fragments (FPKM) by RNA-seq. Student’s t-test compared with WT. **p < 0.01. (D) Relative expression of the ethylene signaling pathway gene of pTY-BrSQE1. Student’s t-test compared with WT. **p < 0.01. WT, wild type.
Ethylene inhibits cell division and cell expansion in Chinese cabbage leaves
Given the significant changes observed in the ethylene signaling pathway in the mini35 mutant, this study sought to investigate whether ethylene directly influences cell division during leaf development in Chinese cabbage. The WT plants were treated with a gradient of exogenous ethylene concentrations (0, 20, 40, 60, 80, and 100 mg/L) via daily foliar spray for 8 days starting from cotyledon expansion. Subsequent measurement of the first true leaf area demonstrated a concentration-dependent decrease in leaf size with increasing exogenous ethylene concentration, confirming the inhibitory role of ethylene in leaf development (Figures 6A–F, M). Examination of the leaf mesophyll cells revealed no significant difference in cell area between the treated and control plants at 20 and 40 mg/L ethylene. In contrast, with treatments ranging from 60 to 100 mg/L, the mesophyll cell area was significantly reduced compared to that of the control group. These results suggest that low concentrations of ethylene predominantly inhibit cell division, thereby reducing leaf area, whereas higher concentrations suppress both cell division and cell expansion (Figures 6G–L, M). In addition, exogenous ethylene treatment induces the expression of BrERF1, BrERF15-1, BrERF15-2, BrERF59-1, and BrERF59-2 (Figure 6N).
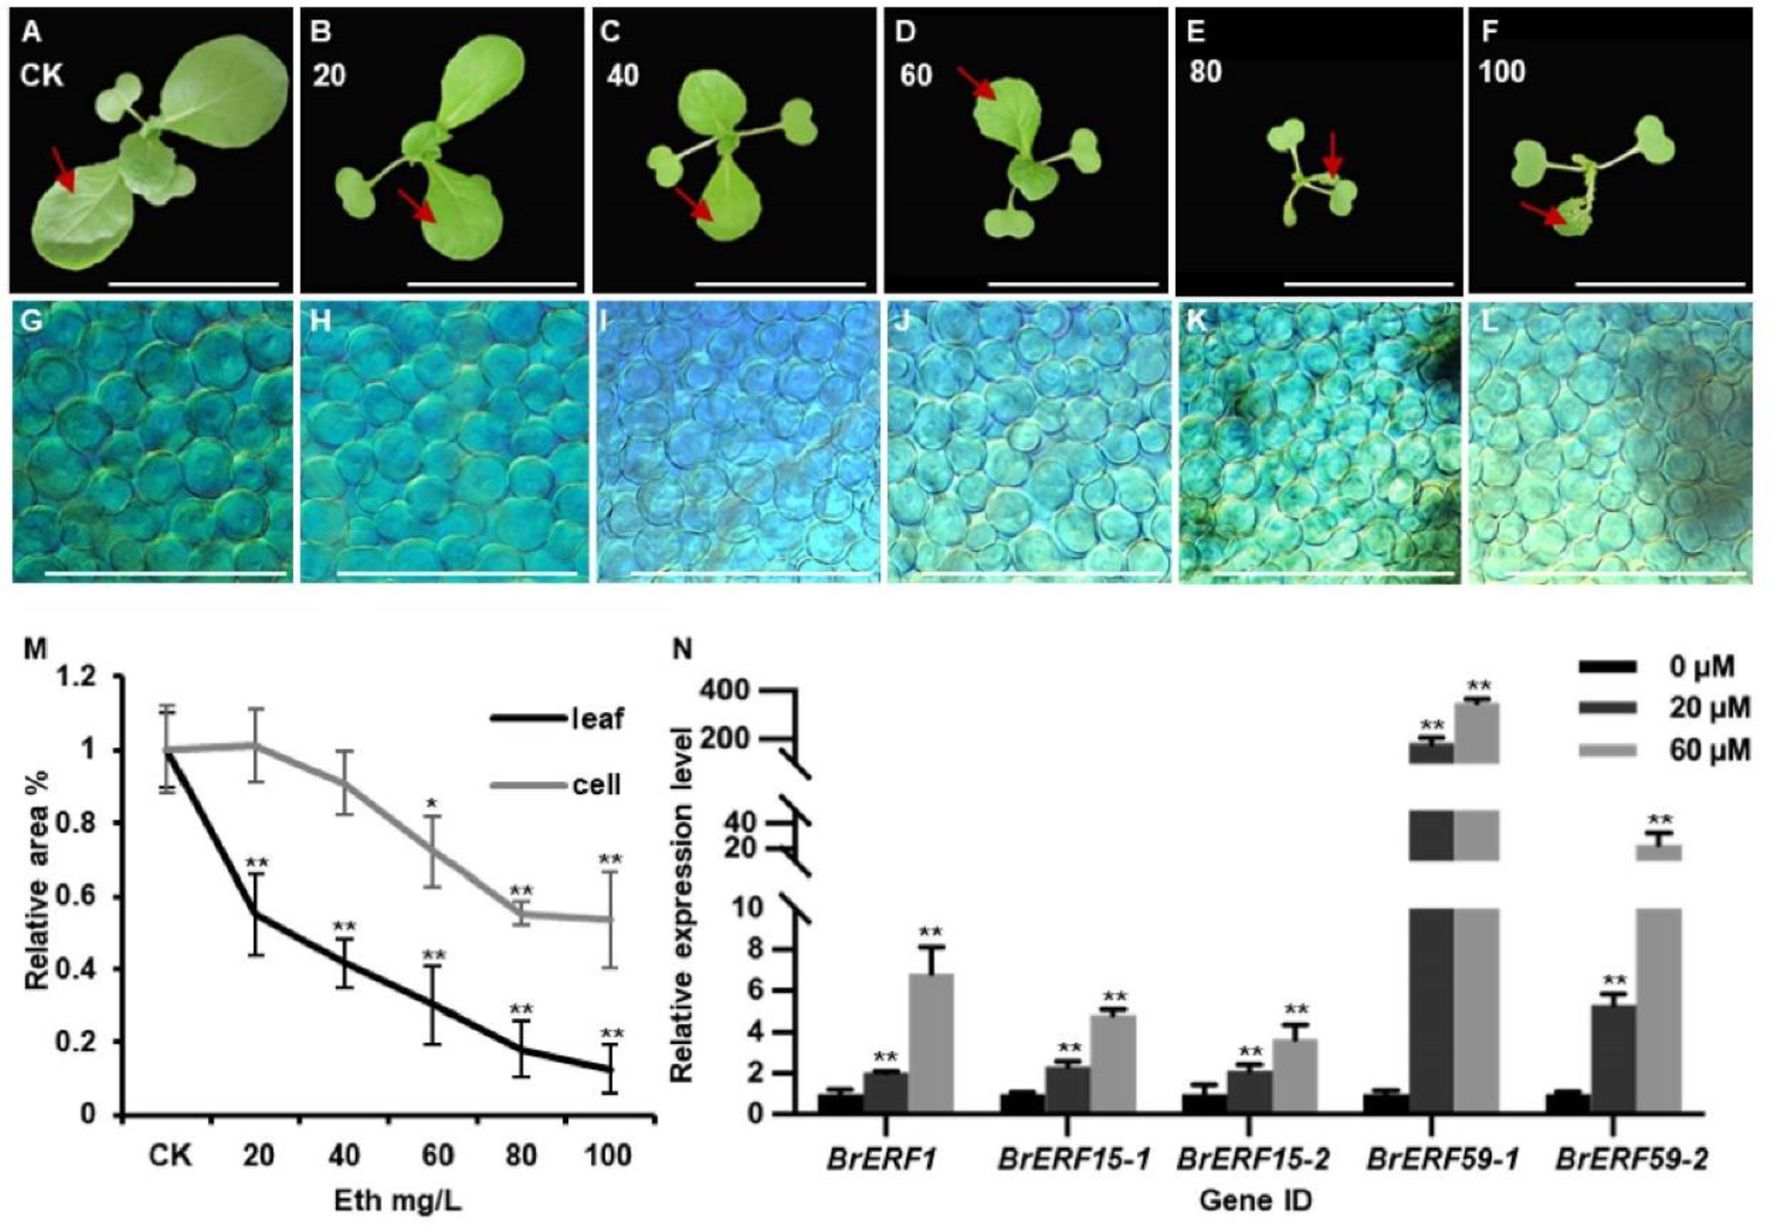
Figure 6. Ethylene inhibits leaf development in Chinese cabbage leaves. (A–F) Seven-day-old WT seedlings were treated with different concentrations of ethylene ranging from 0 to 100 mg/L. Bars = 10 cm. The first leaf of WT plant treated with 0–100 mg/L ethylene was used to assess the cell size. (G–L) The cell size of the first leaf of WT plant treated with 0–100 mg/L. Bars = 200 mm. (M) Statistics of leaf size and cell size of seedlings are shown in panels (A–F) (leaf) and (G–L) (cell). The leaf or cell area in the absence of ethylene was set as 100% for each genotype. Error bars are ± SD from three biological replicates (N > 5). Significance was determined using ANOVA. *p < 0.05, **p < 0.01. (N) Transcript levels of ERF1, ERF15, and ERF59 in leaves of WT seedlings treated with DMSO or Eth. Error bars, SD (n = 3). Significance was determined using ANOVA. *p < 0.05, **p < 0.01. WT, wild type.
Discussion
RNA-seq analysis revealed significant perturbations in three critical pathways: phenylpropanoid biosynthesis, glutathione metabolism, and MAPK signaling pathway-plant. Specifically, in the mini35 mutant, the expression levels of all DEGs within these three pathways were significantly upregulated. Quantitatively, this included 10 DEGs in the phenylpropanoid biosynthesis pathway, six DEGs in the glutathione metabolism pathway, and seven DEGs in the plant MAPK signaling pathway. Further functional annotation showed that all 10 DEGs in the phenylpropanoid biosynthesis pathway were associated with lignin biosynthesis (see Supplementary Tables S3–S5). Lignin biosynthesis is indispensable for plant growth and development, relying on the coordinated action of multiple enzymes; among these, peroxidase (POD) serves as the core catalytic enzyme. Notably, every DEG in this pathway encodes a protein belonging to the peroxidase superfamily. These peroxidases mediate the dehydrogenative polymerization of lignin monomers, a reaction critical for the final assembly of macromolecular lignin (Jia et al., 2015). In the glutathione metabolism pathway, GSTF2, GSTF3, and GSTU4 are members of the glutathione S-transferase (GST) family. Prior studies have established that GST family proteins play pivotal roles in regulating plant secondary metabolism, modulating growth and developmental processes, and mediating responses to environmental stresses (Yuan et al., 2024). Additionally, the plant MAPK signaling pathway shares partial gene overlap with the ethylene signaling pathway. The overlapping genes identified in this analysis were BrERF1, BrERF15-1/2, and BrERF59-1/2.
Ethylene, as one of the first discovered plant hormones, is an essential endogenous regulator that profoundly influences plant growth and development. It affects multiple facets of the plant lifecycle, including seed germination, root hair development, seedling growth, leaf and petal abscission, fruit ripening, and organ senescence (An et al., 2020; Zhao et al., 2021; Huang et al., 2023). At low ethylene concentrations, the leaf elongation rate increases (Fiorani et al., 2002), and primary leaves enlarge (Lee and Reid, 1997). However, excessive ethylene inhibits plant growth (Burg and Burg, 1968; Vogel et al., 1998; Qu et al., 2007). Our findings in the mini35 mutant align with this dual role, demonstrating that enhanced ethylene signaling is associated with repressed cell division.
In Arabidopsis, the SQE1 gene encodes a protein with squalene epoxidase activity. Sterols are synthesized from isopentenyl diphosphate (IPP), which is further converted into linear 30-carbon squalene (Phillips et al., 2006; Zhu et al., 2021). Squalene (SQ) is then oxidized by squalene epoxidase (SQE) to form 2,3-oxidosqualene, which is further transformed into cyclic enol by cycloartenol synthase (CAS) and eventually alkylated into plant sterols. Therefore, mutations in this gene can ultimately affect sterol synthesis (Rasbery et al., 2007). However, we measured the content of ACC, the prerequisite for ethylene synthesis in mini35, and found that ACC did not change significantly compared with the wild type (Supplementary Figure S1). Research in Arabidopsis has shown that the sqe1 mutant exhibits reduced stomatal conductance under low humidity and altered root architecture, with roots being 60% shorter than those of WT plants and generating more lateral roots. These mutants are stunted, and their leaves are yellowish-green (Posé et al., 2009). Additionally, the presence of an ethylene-responsive element (GCTGT/GC/A) in the SQE1 promoter suggests that its transcription is regulated by ethylene (Wang et al., 2020). However, the underlying feedback regulation of ethylene signaling by SQE1 had not been previously reported. In this study, we revealed that BrSQE1 is a single-copy gene with high evolutionary conservation across Brassicaceae species. This indicates that SQE1 may have a conserved function in Brassicaceae crops. Genetic and molecular analyses confirmed that a recessive mutation in BrSQE1 is responsible for the small-leaf phenotype in mini35, and silencing BrSQE1 in WT Chinese cabbage recapitulated the mutant phenotype, underscoring its crucial role in leaf development.
The ethylene signaling pathway involves numerous ERF transcription factors, which either promote (ERF6, ERF8, ERF9, ERF11, and ERF98) or inhibit (ERF2, ERF59, and RAP2.6 L) growth (Lee et al., 2015). For instance, the overexpression of AtERF15 or AtERF1 in Arabidopsis results in growth retardation (Lee et al., 2015). AtERF1-overexpressing lines show no significant changes in the number of meristem cells, suggesting that changes in cell size may contribute to reduced plant size (Mao et al., 2016). AtERF15-overexpressing lines exhibit growth retardation primarily in the early stages of seedling growth, likely because its expression is higher in the embryo and roots than in the leaves (Lee et al., 2015).
In Chinese cabbage, studies of ERFs have been based mainly on ectopic expression results in Arabidopsis. For example, overexpressing Chinese cabbage BrERF4 in Arabidopsis suppresses cell expansion and reduces leaf size (Park et al., 2012). In Arabidopsis, BrERF4 overexpression downregulates the expression of AtEXPA5 and AtEXPA10, revealing that BrERF4 limits cell expansion by inhibiting EXP gene expression (Park et al., 2012), mirroring the conserved role of ERFs in cell wall modulation. In this study, the leaf area of the mini35 mutant is reduced, while the palisade tissue cell area shows no significant change, suggesting that the primary cause of impaired leaf growth in the mini35 mutant is a reduction in cell number. Transcriptome analysis revealed increased expression of BrERF1, BrERF15, and BrERF59. Furthermore, external ethylene treatment confirmed that low concentrations of ethylene primarily inhibit cell proliferation. Therefore, in the mini35 mutant, the upregulation of ERFs likely inhibits cell proliferation in the leaves, leading to a smaller leaf size.
Conclusions
In summary, our study demonstrates that the BrSQE1 mutation in the mini35 mutant enhances the expression of ethylene response factors, leading to the inhibition of cell division and reduced leaf size in Chinese cabbage. These findings provide new insights into the molecular mechanisms of ethylene-mediated leaf development and offer valuable genetic resources for improving plant architecture in Brassica crops through molecular breeding.
Materials and methods
The heading of materials and methods
A mutant library of Chinese cabbage was created via EMS mutagenesis of the WT doubled haploid line. A mutant with a small leaf (mini35) was isolated from the M6 generation. F1 and F2 generations were developed from the cross between A03 and the mini35 mutant and were used for the genetic analysis of leaf size.
Differential interference contrast microscopy
For leaf cell size observation, the maximum outer leaves of 30-day-old plants were harvested and cleared in clearing solution (80 g chloral hydrate, 30 mL water, and 10 mL glycerol) for 5–7 days. The samples were examined using a Differential Interference Contrast (DIC) microscope (DM2500; Leica, Wetzlar, Germany) and photographed using a cooled Charged-Coupled Device (CCD) digital imaging system (BH2; Olympus, Tokyo, Japan).
Inheritance of the mutant trait
The mutant mini35, WT, F1 lines, and 200 F2 lines were grown and phenotyped in August 2021. The number of plants with small leaves was counted, and a chi-square test was performed.
Candidate mutant genes mapping by MutMap and KASP
Using fresh leaves from 32 F2 lines with small leaves and 30 WT individuals from the cross between the WT and the mini35 mutant, genomic DNA was extracted using the Cetyltrimethylammonium Bromide (CTAB) method, and equal amounts of DNA from each plant were pooled for the mutant and WT. The two DNA sample pools were sent to Guangzhou Biologic Biotechnology Co., Ltd., Guangzhou, China, for resequencing using the Illumina HiSeq™ 2500 instrument, San Diego, California. Approximately 15 GB of high-quality read data corresponding to 30× coverage of the genome was obtained for each pooled sample. Low-quality reads, in which >50% of the bases had phred quality scores of ≤20, were removed. Filtered reads were aligned to the reference B. rapa Chiifu genome (http://brassicadb.org/brad/index.php, v3.0) using BWA (0.7.12) with the MEM algorithm. The KASP result was used to analyze the ratio of SNPs for leaf size types.
RNA-seq analysis
The total RNA of leaf sections was extracted using the Super Total RNA Extraction Kit Eastep®, Shanghai Promega Biological Products Co., Ltd., Shanghai, China. RNA purity and concentration were assessed using a NanoPhotometer® spectrophotometer (IMPLEN, Munich, Germany) and a Qubit® RNA Assay Kit with a Qubit 2.0 Fluorometer (Life Technologies, Carlsbad, USA). The cDNA library was prepared and sequenced as previously described. RNA-seq data analysis was conducted according to previously described methods (Zhang et al., 2022). The original data were filtered to obtain clean data, and then Q20, Q30, and guanine-cytosine content (GC content), which refers to the percentage of guanine (G) and cytosine (C) bases among all bases in the transcriptome sequence. GC content analyses were conducted on the clean data. All subsequent analyses were high-quality based on the clean data. HISAT2 was used to align the paired-end clean reads to the Chiffu reference genome version 3.0, obtaining the location information on the reference genome (Kim et al., 2019). The detection and analysis of sample data variation sites were completed using the GATK (4.1.1.0) software, and the annotation analysis of variation sites was accomplished using the SnpEff (4.3.1q) software (Mckenna et al., 2010). The Gene Ontology (GO) and KEGG functional enrichment analyses of the differentially expressed genes were conducted using the clusterProfiler software (Yu et al., 2012). The significance threshold for GO and KEGG functional enrichment analyses was set as padj < 0.05 after correction.
Quantitative real-time PCR
Total RNA (1 μg per sample) was reverse-transcribed into first-strand cDNA using the PrimeScript™ RT Reagent Kit with gDNA Eraser (TAKARA, Dalain, China). qRT-PCR was performed using SYBR Green Master Mix (Vazyme, Nanjing, China) on a LightCycler® 96 instrument (Roche, Basel, Switzerland). Each sample was analyzed in triplicate, with three biological and three technical replicates. The thermal cycling protocol consisted of an initial denaturation step at 95 °C for 10 min, followed by 40 cycles of denaturation at 95 °C for 10 s, annealing at 57 °C for 10 s, and extension at 72 °C for 10 s. Following amplification, a melting curve analysis was conducted by heating to 95 °C for 10 s, cooling to 60 °C for 60 s, and then heating to 97 °C for 1 s. Relative gene expression levels between WT and mini35 plants were calculated using the 2−ΔΔCt method and normalized to the internal control gene, Chinese cabbage actin7 (BraA10g007890). Gene-specific primers used for qRT-PCR are provided in Supplementary Table S2.
VIGS in Chinese cabbage
A 40-bp sequence of BrSQE1 was designed and reverse-complemented to generate an 80-bp palindromic sequence (5′-CTGATCCTCTCTCCCCTTCGGAACAG CTCTGCTATGTCCATGGACATAGCAGAGCTGTTCCGAAGGGGAGAGAGGATCAG-3′). Silencing sequence is listed in Supplementary Table S6. The BrSQE1-silencing vector (pTY-BrSQE1) was synthesized and constructed by GeneScript (Nanjing, China) following the method described in a previous study (J. Yu et al., 2018). The empty pTY vector was used as the negative control, while the pTY-BrPDS vector served as the positive control. Two-week-old Pak-choi seedlings were used for the VIGS assay. Briefly, 5 μg of each vector (pTY-BrSQE1, pTY-BrPDS, and empty pTY vector) was coated onto gold particles and bombarded into Chinese cabbage leaves using a PDS1000/He gene gun (Bio-Rad, Hercules, CA, USA) according to the protocol described (Hamada et al., 2017). One month later, qPCR was performed to verify the silencing efficiency of BrSQE1, BrERF1, BrERF59-1, BrERF59-2, BrERF15-1, and BrERF15–2 in Chinese cabbage.
Ethylene treatment
To investigate the ethylene-mediated regulation of leaf development, 100 A03 and 100 mini35 mutant plants were cultivated under controlled conditions. After cotyledon expansion, the plants were subjected to foliar spray applications of exogenous ethylene solutions at various concentrations (0, 20, 40, 60, 80, or 100 mg/L) once daily for 7 days. Leaf size parameters were measured at 7 days posttreatment. For cellular phenotyping, palisade mesophyll cell size was measured from differential interference contrast images (Xia et al., 2013).
Data availability statement
Transcriptome sequencing data of WT and mini35 are under the Genome Sequence Archive (GSA, https://ngdc.cncb.ac.cn/gsa/) with a BioProject number PRJCA047937.
Author contributions
RY: Formal Analysis, Data curation, Writing – original draft. QW: Data curation, Writing – original draft, Formal Analysis. YR: Writing – review & editing, Investigation. YL: Writing – review & editing, Investigation. JW: Writing – review & editing, Formal Analysis. DF: Resources, Writing – review & editing. WM: Writing – review & editing. NL: Funding acquisition, Supervision, Writing – review & editing. LY: Writing – review & editing, Funding acquisition, Supervision. JZ: Funding acquisition, Project administration, Writing – review & editing, Supervision, Writing – original draft.
Funding
The author(s) declared financial support was received for this work and/or its publication. This work was supported by National Natural Science Foundation of China (Grant No.32172594), Hebei Natural Science Foundation (Grant No.C2024204025, No.2024HBQZYCSB012) and S&TProgram ofHebei (Grant No.23567601H).
Acknowledgments
The authors would like to express their sincere gratitude to the Hebei International Joint Research Center of Vegetable Functional Genomics and the International Joint R&D Center of Hebei Province in Modern Agricultural Biotechnology for providing high-quality scientific research platforms and technical support, which have been crucial for the successful completion of this study.
Conflict of interest
The authors declare that the research was conducted in the absence of any commercial or financial relationships that could be construed as a potential conflict of interest.
Generative AI statement
The author(s) declare that no Generative AI was used in the creation of this manuscript.
Any alternative text (alt text) provided alongside figures in this article has been generated by Frontiers with the support of artificial intelligence and reasonable efforts have been made to ensure accuracy, including review by the authors wherever possible. If you identify any issues, please contact us.
Publisher’s note
All claims expressed in this article are solely those of the authors and do not necessarily represent those of their affiliated organizations, or those of the publisher, the editors and the reviewers. Any product that may be evaluated in this article, or claim that may be made by its manufacturer, is not guaranteed or endorsed by the publisher.
Supplementary material
The Supplementary Material for this article can be found online at: https://www.frontiersin.org/articles/10.3389/fpls.2025.1702939/full#supplementary-material
Supplementary Figure 1 | Gene of phenylpropanoid biosynthesis pathway、glutathione metabolism pathway and MAPK signaling pathway—plant expression was up-regulated in mini35. (A) Phenylpropanoid biosynthesis pathway diagram. Red boxes represent genes that are up-regulated. (B) Reletive expression of phenylpropanoid biosynthesis pathway gene in WT and mini35. (n = 3) ± SD, Student’s t test compared with WT. (**) P < 0.01. (C) Heatmap of FPKM values for genes involved in the MAPK signaling pathway – plant pathway in WT and mini35. (n = 3) ± SD, (**) P < 0.01. (D) Heatmap of FPKM values for genes involved in the glutathione metabolism pathway in WT and mini35. (n = 3) ± SD, (**) P < 0.01.
Supplementary Figure 2 | The ACC levels in WT and mini35. Error bars are ± SD from three biological replicates (n>5). Significance was determined by ANOVA.
Supplementary Table 1 | Gene FPKM of Ethylene signaling pathway by RNA-seq.
Supplementary Table 2 | Primers used in this article.
Supplementary Table 3 | Differentially expressed genes in phenylpropanoid biosynthesis.
Supplementary Table 4 | Differentially expressed genes in glutathione metabolism.
Supplementary Table 5 | Differentially expressed genes in MAPK signaling pathway– plant.
Supplementary Table 6 | BrSQE1 VIGS silence sequence.
References
An, J., Althiab Almasaud, R., Bouzayen, M., Zouine, M., and Chervin, C. (2020). Auxin and ethylene regulation of fruit set. Plant Sci. 292, 110381. doi: 10.1016/j.plantsci.2019.110381
Breuninger, H. and Lenhard, M. (2010). Control of tissue and organ growth in plants. Curr. Top. Dev. Biol. 91, 185–220. doi: 10.1016/S0070-2153(10)91007-7
Burg, S. P. and Burg, E. A. (1968). Ethylene formation in pea seedlings; its relation to the inhibition of bud growth caused by indole-3-acetic Acid. Plant Physiol. 43, 1069–1074. doi: 10.1104/pp.43.7.1069
Chang, C. (2016). Q&A: How do plants respond to ethylene and what is its importance? BMC Biol. 14, 7. doi: 10.1186/s12915-016-0230-0
Chien, Y. C. and Yoon, G. M. (2024). Subcellular dynamics of ethylene signaling drive plant plasticity to growth and stress: Spatiotemporal control of ethylene signaling in Arabidopsis. Bioessays 46, e2400043. doi: 10.1002/bies.202400043
Deng, H., Chen, Y., Liu, Z., Liu, Z., Shu, P., Wang, R., et al. (2022). SlERF.F12 modulates the transition to ripening in tomato fruit by recruiting the co-repressor TOPLESS and histone deacetylases to repress key ripening genes. Plant Cell 34, 1250–1272. doi: 10.1093/plcell/koac025
De Veylder, L., Beeckman, T., Beemster, G. T., Krols, L., Terras, F., Landrieu, I., et al. (2001). Functional analysis of cyclin-dependent kinase inhibitors of Arabidopsis. Plant Cell 13, 1653–1668. doi: 10.1105/TPC.010087
Dolan, L. and Poethig, R. (1998). Clonal analysis of leaf development in cotton. Am. J. Bot. 85, 315. doi: 10.2307/2446322
Efroni, I., Eshed, Y., and Lifschitz, E. (2010). Morphogenesis of simple and compound leaves: a critical review. Plant Cell 22, 1019–1032. doi: 10.1105/tpc.109.073601
Fiorani, F., Bögemann, G. M., Visser, E. J., Lambers, H., and Voesenek, L. A. (2002). Ethylene emission and responsiveness to applied ethylene vary among Poa species that inherently differ in leaf elongation rates. Plant Physiol. 129, 1382–1390. doi: 10.1104/pp.001198
Fisher, K. and Turner, S. (2007). PXY, a receptor-like kinase essential for maintaining polarity during plant vascular-tissue development. Curr. Biol. 17, 1061–1066. doi: 10.1016/j.cub.2007.05.049
Geisler, M., Nadeau, J., and Sack, F. D. (2000). Oriented asymmetric divisions that generate the stomatal spacing pattern in arabidopsis are disrupted by the too many mouths mutation. Plant Cell 12, 2075–2086. doi: 10.1105/tpc.12.11.2075
Gonzalez, N., Vanhaeren, H., and Inzé, D. (2012). Leaf size control: complex coordination of cell division and expansion. Trends Plant Sci. 17, 332–340. doi: 10.1016/j.tplants.2012.02.003
Guo, H., Mao, M., Deng, Y., Sun, L., Chen, R., Cao, P., et al. (2022). Multi-Omics analysis reveals that SlERF.D6 synergistically regulates SGAs and fruit development. Front. Plant Sci. 13, 860577. doi: 10.3389/fpls.2022.860577
Hamada, H., Linghu, Q., Nagira, Y., Miki, R., Taoka, N., and Imai, R. (2017). An in planta biolistic method for stable wheat transformation. Sci. Rep. 7, 11443. doi: 10.1038/s41598-017-11936-0
Huang, J., Zhao, X., Bürger, M., et al. (2023). The role of ethylene in plant temperature stress response. Trends Plant Sci. 28, 808–824. doi: 10.1016/j.tplants.2023.03.001
Inzé, D. and De Veylder, L. (2006). Cell cycle regulation in plant development. Annu. Rev. Genet. 40, 77–105. doi: 10.1146/annurev.genet.40.110405.090431
Jia, X. L., Wang, G. L., Xiong, F., Yu, X. R., Xu, Z. S., Wang, F., et al. (2015). De novo assembly, transcriptome characterization, lignin accumulation, and anatomic characteristics: novel insights into lignin biosynthesis during celery leaf development. Sci. Rep. 5, 8259. doi: 10.1038/srep08259
J. Yu, L.-W. G., Yang, Y., Xiao, D., Liu, T.-K., Li, Y., Hou, X.-L., et al. (2018). Efficient virus-induced gene silencing in Brassica rapa using a turnip yellow mosaic virus vector. Biol. Plant 62, 826–834. doi: 10.1007/s10535-018-0803-6
Kim, D., Paggi, J. M., Park, C., Bennett, B., and Salzberg, S. L. (2019). Graph-based genome alignment and genotyping with HISAT2 and HISAT-genotype. Nat. Biotechnol. 37, 907–915. doi: 10.1038/s41587-019-0201-4
Lee, S. B., Lee, S. J., and Kim, S. Y. (2015). AtERF15 is a positive regulator of ABA response. Plant Cell Rep. 34, 71–81. doi: 10.1007/s00299-014-1688-2
Lee, S. H. and Reid, D. M. (1997). The role of endogenous ethylene in the expansion of Helianthus annuus leaves. Can. J. Bot. 75, 501–508. doi: 10.1139/b97-054
Li, D., Zeng, S., Dai, R., and Chen, K. (2025). Slow and steady wins the race: the negative regulators of ethylene biosynthesis in horticultural plants. Hortic. Res. 12, uhaf108. doi: 10.1093/hr/uhaf108
Liu, M., Chen, Y., Chen, Y., Shin, J. H., Mila, I., Audran, C., et al. (2018). The tomato Ethylene Response Factor Sl-ERF.B3 integrates ethylene and auxin signaling via direct regulation of Sl-Aux/IAA27. New Phytol. 219, 631–640. doi: 10.1111/nph.15165
Lv, Z., Zhao, W., Kong, S., Li, L., and Lin, S. (2023). Overview of molecular mechanisms of plant leaf development: a systematic review. Front. Plant Sci. 14, 1293424. doi: 10.3389/fpls.2023.1293424
Mao, J. L., Miao, Z. Q., Wang, Z., Yu, L. H., Cai, X. T., and Xiang, C. B. (2016). Correction: Arabidopsis ERF1 mediates cross-talk between ethylene and auxin biosynthesis during primary root elongation by regulating ASA1 expression. PloS Genet. 12, e1006076. doi: 10.1371/journal.pgen.1006076
McKenna, A., Hanna, M., Banks, E., Sivachenko, A., Cibulskis, K., Kernytsky, A., et al. (2010). The Genome Analysis Toolkit: a MapReduce framework for analyzing next-generation DNA sequencing data. Genome Res. 20, 1297–1303. doi: 10.1101/gr.107524.110
Müller, M. and Munné-BOSCH, S. (2015). Ethylene response factors: A key regulatory hub in hormone and stress signaling. Plant Physiol. 169, 32–41. doi: 10.1104/pp.15.00677
Park, J. B., Sendon, P. M., Kwon, S. H., Seo, H. S., Park, S. K., Kim, J. H., et al. (2012). Overexpression of stress-related genes, BrERF4 and AtMYB44, in Arabidopsis thaliana alters cell expansion but not cell proliferation during leaf growth. J. Plant Biol. 55, 406–412. doi: 10.1007/s12374-012-0114-y
Peterson, K. M., Rychel, A. L., and Torii, K. U. (2010). Out of the mouths of plants: the molecular basis of the evolution and diversity of stomatal development. Plant Cell 22, 296–306. doi: 10.1105/tpc.109.072777
Phillips, D. R., Rasbery, J. M., Bartel, B., and Matsuda, S. P. (2006). Biosynthetic diversity in plant triterpene cyclization. Curr. Opin. Plant Biol. 9, 305–314. doi: 10.1016/j.pbi.2006.03.004
Poethig, R. S. and Sussex, I. M. (1985). The cellular parameters of leaf development in tobacco: a clonal analysis. Planta 165, 170–184. doi: 10.1007/BF00395039
Posé, D., Castanedo, I., Borsani, O., Nieto, B., Rosado, A., Taconnat, L., et al. (2009). Identification of the Arabidopsis dry2/sqe1–5 mutant reveals a central role for sterols in drought tolerance and regulation of reactive oxygen species. Plant J. 59, 63–76. doi: 10.1111/j.1365-313X.2009.03849.x
Qu, X., Hall, B. P., Gao, Z., and Schaller, G. E. (2007). A strong constitutive ethylene-response phenotype conferred on Arabidopsis plants containing null mutations in the ethylene receptors ETR1 and ERS1. BMC Plant Biol. 7, 3. doi: 10.1186/1471-2229-7-3
Rasbery, J. M., Shan, H., LeClair, R. J., Norman, M., Matsuda, S. P., and Bartel, B. (2007). Arabidopsis thaliana squalene epoxidase 1 is essential for root and seed development. J. Biol. Chem. 282, 17002–17013. doi: 10.1074/jbc.M611831200
Skirycz, A., Claeys, H., De Bodt, S., Oikawa, A., Shinoda, S., Andriankaja, M., et al. (2011). Pause-and-stop: the effects of osmotic stress on cell proliferation during early leaf development in Arabidopsis and a role for ethylene signaling in cell cycle arrest. Plant Cell 23, 1876–1888. doi: 10.1105/tpc.111.084160
Vogel, J. P., Woeste, K. E., Theologis, A., and Kieber, J. J. (1998). Recessive and dominant mutations in the ethylene biosynthetic gene ACS5 of Arabidopsis confer cytokinin insensitivity and ethylene overproduction, respectively. Proc. Natl. Acad. Sci. U.S.A. 95, 4766–4771. doi: 10.1073/pnas.95.8.4766
Wang, L., Ko, E. E., Tran, J., and Qiao, H. (2020). TREE1-EIN3-mediated transcriptional repression inhibits shoot growth in response to ethylene. Proc. Natl. Acad. Sci. U.S.A. 117, 29178–29189. doi: 10.1073/pnas.2018735117
Wang, Z., Li, N., Jiang, S., Gonzalez, N., Huang, X., Wang, Y., et al. (2016). SCF(SAP) controls organ size by targeting PPD proteins for degradation in Arabidopsis thaliana. Nat. Commun. 7, 11192. doi: 10.1038/ncomms11192
Wang, X., Wen, H., Suprun, A., and Zhu, H. (2025). Ethylene signaling in regulating plant growth, development, and stress responses. Plants (Basel) 14 (3). doi: 10.3390/plants14030309
White, D. W. (2006). PEAPOD regulates lamina size and curvature in Arabidopsis. Proc. Natl. Acad. Sci. U.S.A. 103, 13238–13243. doi: 10.1073/pnas.0604349103
Xia, T., Li, N., Dumenil, J., Li, J., Kamenski, A., Bevan, M. W., et al. (2013). The ubiquitin receptor DA1 interacts with the E3 ubiquitin ligase DA2 to regulate seed and organ size in Arabidopsis. Plant Cell 25, 3347–3359. doi: 10.1105/tpc.113.115063
Yu, G., Wang, L. G., Han, Y., and He, Q. Y. (2012). clusterProfiler: an R package for comparing biological themes among gene clusters. Omics 16, 284–287. doi: 10.1089/omi.2011.0118
Yuan, L., Dang, J., Zhang, J., Wang, L., Zheng, H., Li, G., et al. (2024). A glutathione S-transferase regulates lignin biosynthesis and enhances salt tolerance in tomato. Plant Physiol. 196, 2989–3006. doi: 10.1093/plphys/kiae504
Zhang, X., Ma, W., Liu, M., Li, X., Li, J., Lu, Y., et al. (2022). OCTOPUS regulates BIN2 to control leaf curvature in Chinese cabbage. Proc. Natl. Acad. Sci. U.S.A. 119, e2208978119. doi: 10.1073/pnas.2208978119
Zhao, H., Yin, C. C., Ma, B., Chen, S. Y., and Zhang, J. S. (2021). Ethylene signaling in rice and Arabidopsis: New regulators and mechanisms. J. Integr. Plant Biol. 63, 102–125. doi: 10.1111/jipb.13028
Keywords: leaf size, BrSQE1, ethylene, Chinese cabbage, mutant
Citation: Yang R, Wang Q, Ren Y, Li Y, Wang J, Feng D, Ma W, Li N, Yang L and Zhao J (2025) BrSQE1 and the ethylene signaling pathway suppress cell division to regulate plant size in Chinese cabbage (Brassica rapa subsp. pekinensis). Front. Plant Sci. 16:1702939. doi: 10.3389/fpls.2025.1702939
Received: 10 September 2025; Accepted: 29 October 2025;
Published: 11 December 2025.
Edited by:
Xiaodong Yang, Yangzhou University, ChinaReviewed by:
Wenna Zhang, China Agricultural University, ChinaMing Zheng, Chinese Academy of Agricultural Sciences, China
Copyright © 2025 Yang, Wang, Ren, Li, Wang, Feng, Ma, Li, Yang and Zhao. This is an open-access article distributed under the terms of the Creative Commons Attribution License (CC BY). The use, distribution or reproduction in other forums is permitted, provided the original author(s) and the copyright owner(s) are credited and that the original publication in this journal is cited, in accordance with accepted academic practice. No use, distribution or reproduction is permitted which does not comply with these terms.
*Correspondence: Jianjun Zhao, amp6MTk3MUBhbGl5dW4uY29t; Na Li, MTM1MjEyNTE0MjFAMTYzLmNvbQ==; Lei Yang, cG9wcmF5MjAyMkAxNjMuY29t
†These authors have contributed equally to this work