 Xiaoshuang Wei1,2Zesheng Wei1,2Mingchong Yang1,2Qiang Chen1,2Jingzhen Wang1,2,3Liyan Zhao1,2,3Xia Zhang1,2
 Lingqiang Wang1,2,3
 Lihua Hu1,2*
- 1State Key Laboratory of Conservation and Utilization of Subtropical Agricultural Biological Resources, Guangxi University, Nanning, China
- 2Guangxi Key Laboratory of Sugarcane Biology, College of Agriculture, Guangxi University, Nanning, China
- 3College of Plant Science and Technology, Huazhong Agricultural University, Wuhan, China
Sugarcane is the most critical sugar and bioenergy crop. Cellulose synthase (CESA) genes are involved in cellulose synthesis, playing a significant role in plant growth and development, as well as in secondary metabolism. In this study, we systematically analyzed the CESA gene family in Sugarcane (Saccharum spontaneum), recognizing 30 members. 32 pairs of segmental duplication events contributed mainly to the expansion of this superfamily. In addition to plant hormones, stress-responsive and growth-related cis-acting elements were identified in SsCESA gene promoters, along with many MYB, NAC, and WRKY transcription factor binding sites. Transcriptomic data showed that most SsCESA transcripts were higher in stems and leaf transitional parts. qRT-PCR assays confirmed that SsCESA genes could respond to cold, heat, and salt stress. GFP subcellular localization assays exhibited that SsCESA4 and SsCESA9 proteins were localized at the Golgi apparatus. Finally, EMSA experiments confirmed that SsNST1 could bind to the promoters of SsCESA4, SsCESA7, and SsCESA9. This research elucidates the evolutionary patterns and functional characteristics of the SsCESA gene family in sugarcane, providing a basis for future investigations into its mechanism of action.
1 Introduction
Sugarcane is the most crucial sugar and bioenergy crop, accounting for 80% of global sugar production and 40% of ethanol production (Grivet and Arruda, 2002; Lam et al., 2009). There is increasing focus on using sugarcane biomass for second-generation biofuels from lignocellulosic materials (Hans et al., 2023). Sugarcane achieves the highest dry biomass yield, amounting to nearly 39 tons per hectare annually, surpassing other crops such as miscanthus, corn, and switchgrass (Kandel et al., 2018; Ain et al., 2022). A comprehensive analysis of the genetic basis of the components that comprise sugarcane biomass and stalk lodging resistance is essential to increase yield (Li et al., 2023).
The growth, biomass formation, and mechanical strength of sugarcane stalks are closely linked to the regulation of intrinsic cell wall biosynthesis. In addition, the cell wall serves as the primary defense in plants, acting as a barrier against environmental changes (Son et al., 2025). It consists of the primary and secondary walls. The primary wall is a thin layer formed during cell division and elongation, while the secondary wall is thicker and serves specific cell types with specialized functions. Cellulose, hemicellulose, and lignin constitute the major components of the secondary cell wall (Zhong and Ye, 2015). Cellulose is a strong, effectively irreversible C-sink in plants, and increasing cellulose in stalk walls could improve stalk strength and harvest index (Appenzeller et al., 2004; Salimi et al., 2024). During sugarcane culm maturation, cellulose synthesis is regulated by the coordinated expression of genes, including those encoding cellulose synthases and cellulose synthase-like proteins (Casu et al., 2007; Casu et al., 2015). Also, there is a strong association between CESA expression and cell wall metabolism, suggesting a shift in the timing of carbon partitioning in the apical culms of sugarcane (Hosaka et al., 2021). These genes are closely related to plant height, tillering, and stress resistance.
Cellulose is synthesized at the plasma membrane. The biosynthesis of cellulose comprises three key stages: initiation of the beta-1,4-glucan chain, elongation of the chain, and assembly of microfibrils (Turner and Kumar, 2017). Many genes have been characterized that contribute to the formation of cellulose synthase complexes (CSCs) (Li et al., 2014; Polko and Kieber, 2019). The cellulose synthase gene (CESA) family, part of the cellulose synthase-like superfamily, plays a key role in cellulose biosynthesis. CESA genes in higher plants were initially identified in elongating cotton (Gossypium hirsutum) fibers (Pear et al., 1996). Subsequently, the gene family discovered in cotton and rice (Oryza sativa) was designated as CESA (Little et al., 2018). The CESA protein sequence is highly conserved and contains GT2 and ZF domains, with eight transmembrane domains distributed into two regions: two spanning the N-terminal region and six spanning the C-terminal region (Kurek et al., 2002; Kaur et al., 2016). CSC is a rosette-like structure and consists of six globular protein complexes, with each complex containing several structurally similar CESA subunits. AtCESA1, AtCESA3, and AtCESA6 in Arabidopsis and OsCESA1, OsCESA3, and OsCESA8 in rice which have been identified for primary cell wall (PCW) formation, whereas AtCESA4, AtCESA7, and AtCESA8 and OsCESA4, OsCESA7, and OsCESA9 are responsible for cellulose biosynthesis in the secondary cell walls (SCW), respectively (Tanaka et al., 2003; Taylor et al., 2003; Persson et al., 2007; Wang et al., 2010).
CESA genes play significant roles in plant growth and development and in secondary metabolism. Decreased cellulose production results in lignin formation, which is partially regulated by jasmonic acid, ethylene, and additional signaling pathways (Mielke and Gasperini, 2019; Zhou et al., 2024). Numerous CESA mutants exhibit severe defects in cellulose synthesis. In Populus trichocarpa, the complete loss of PtrCesA4, 7A/B, or 8A/B results in a 90% decrease in cellulose content (Xu et al., 2021). Also, mutations in CESA4 cause a 37–67% reduction in cellulose content in poplar (Nayeri et al., 2022). The cellulose content in culms of OsCESA4, OsCESA7, and OsCESA9 null mutants was significantly reduced (8.9%–25.5% of wild-type) (Tanaka et al., 2003). Nevertheless, overexpression of three PCW AtCESA6-like genes (AtCESA2, AtCESA5, and AtCESA6) significantly promotes plant growth and increases biomass accumulation by enhancing cell expansion and thickening cell walls in transgenic Arabidopsis (Hu et al., 2018). When plants are under stress, cellulose undergoes remodeling by altering its biosynthesis processes, which involves modulating the activities of CSCs and CESA gene expression (Zhang et al., 2025a). Disruption of AtCesA8/IRX1 enhances tolerance to drought and osmotic stress (Chen et al., 2005). Mutants of AtCESA8 and AtCESA3 exhibit increased resistance to salt stress. The OsCESA9/OsCESA9D387N heterozygous plants increase salt tolerance by scavenging and detoxifying ROS, and this effect is indirectly reflected in the expression of related genes (Ye et al., 2021). The expression of CESA genes is precisely controlled by transcription factor networks. In banana, MaNAC1 activates MaCESA7 and MaCESA6B, thus increasing cellulose at low temperature (Yin et al., 2024). In cotton, GhFSN subclade (GhFSN1A and GhVNI1A) activates the GhCESA (Chen et al., 2025).
Some studies focus on the CESA gene family involved in cellulose production in crops and trees, covering gene identification, activity, and function (Guo et al., 2021; Zhang et al., 2021a; Sod et al., 2023; Wang et al., 2023). However, there are no reports on this gene family in sugarcane, and the regulatory network underlying cell wall biosynthesis is also poorly understood. Studies of CESA genes provide a foundation for uncovering mechanisms of plant cell wall biosynthesis, as CESAs can serve as marker genes to identify new genes involved (Polko and Kieber, 2019). Using marker genes, co-expression analysis, EMSA, and Y1H can reveal roles of transcription factors in regulating genes and in the biosynthesis of plant cell walls (Ruprecht and Persson, 2012; Taylor-Teeples et al., 2015; Zhang et al., 2025b).To investigate the potential role of sugarcane CESA genes in growth, development, and stress responses, we identified and analyzed all CESA genes in the sugarcane (S. spontaneum) (AP85-441) genome. The sequence, structure, evolution, and expression pattern of these genes were systematically studied. The subcellular localization of SsCESA4 and SsCESA9 proteins further strengthened the function of the CESAs in cellulose biosynthesis. Additionally, the transcription factor SsNST1 was shown to bind the promoters of SsCESA4, SsCESA7, and SsCESA9. This study classifies the CESA genes in sugarcane growth, development, and stress response, offering potential for genetic improvement.
2 Result
2.1 Identification and distribution of SsCESA genes in the S. spontaneum genome
A total of 30 CESA family genes were found in the sugarcane S. spontaneum genome. The SsCESA gene was named based on its homolog in rice, and each CESA gene in sugarcane has one to four copies. Therefore, each gene copy is identified by a number and a letter following the gene name (Figure 1 & Table 1). Sspon.03G0006400, Sspon.01G0026480, and Sspon.02G0014520 can be clustered with OsCESA4, OsCESA7, OsCESA9, and their Arabidopsis counterparts, AtCESA4, AtCESA7, and AtCESA8, related to secondary cell walls. These were named SsCESA4, SsCESA7, and SsCESA9. Sspon.02G0019920-1A, Sspon.02G0019920-2C and Sspon.02G0019930-1P clustered in the same clade as OsCESA3 and OsCESA5 of rice (Figure 1). Thus, we designated them as SsCESA3.1-1A, SsCESA3.1-2C, and SsCESA3.2-1P, respectively. Moreover, there is no SsCESA5 in S. spontaneum. Sspon.08G0005550-1A/3C/4D/1T did not cluster with any CESA members of rice or Arabidopsis (Figure 1). Furthermore, OsCESA10 &CESA11 were found to contain only a CS domain, and CESA10 clustered with CESA-like proteins in rice (OsCSLs) (Wang et al., 2010). Therefore, Sspon.08G0005550 was designated as SsCESA12.Sspon.03G0025370-1A clusters with AtCESA1 and AtCESA10. AtCESA1, AtCESA3, and AtCESA6 in Arabidopsis, and OsCESA1, OsCESA3, and OsCESA8 in rice, are associated with the primary cell wall. Sspon.07G0011830-1A/2C and Sspon.07G0025770-1B/2D have higher homology with OsCESA1, so they are respectively named SsCESA1.1-1A/2C and SsCESA1.2-1B/2D. Sspon.03G0025370-1A does not belong to CESA1 members, but it is close to AtCESA10, so it was temporarily named SsCESA10-1A(t), with “t” being the abbreviation of “temporarily”. Except for the relatively short amino acid sequences of SsCESA8.1-3C, SsCESA9-2B, SsCESA9-4D, and SsCESA12-1T, the amino acid sequences of the remaining SsCESA are approximately 1000 amino acids in length (Table 1). All SsCESA proteins were predicted to be hydrophilic proteins (Table 1). To predict the subcellular localization of the SsCESA protein, we utilized WoLF PSORT and LocTree3 (Goldberg et al., 2014) (Supplementary Table 1). The WoLF PSORT indicated that nearly all proteins are localized to plastids. The LocTree3 indicated that the SsCESA proteins are more likely to be located in the cell membrane, endoplasmic reticulum, and Golgi apparatus. Furthermore, the possibility of SsCESA1, SsCESA3, SsCESA8, SsCESA4, and SsCESA10(t) proteins being located in the Golgi apparatus is higher than in the cell membrane.

Figure 1. The phylogenetic relationships among CESA proteins of sugarcane, rice, and Arabidopsis.

Table 1. Basic information of SsCESA.
The 30 SsCESA genes were unevenly distributed across 18 chromosomes (Figure 2). These genes are found only on chromosomes Chr1, Chr2, Chr3, Chr7, and Chr8, with the highest number on Chr2, which has 13 genes.
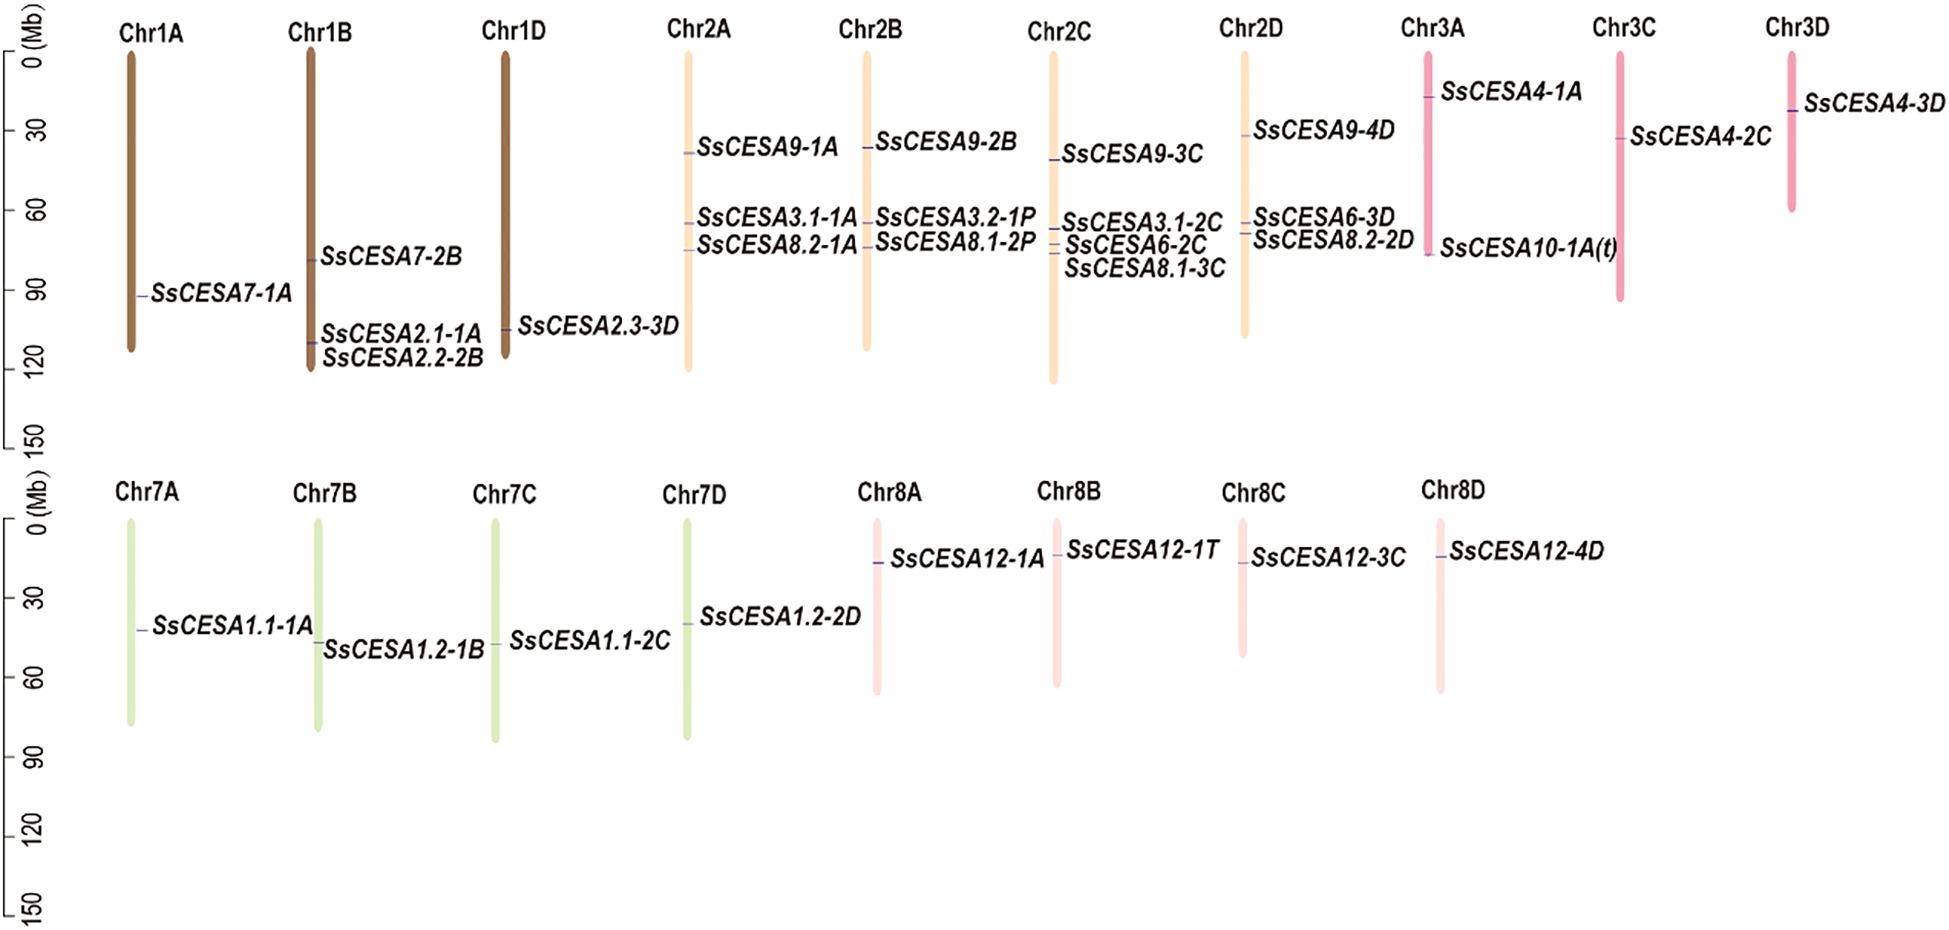
Figure 2. Distribution of the SsCESA gene family members on S. spontaneum chromosomes.
2.2 Motifs, conserved domains, and gene structure of the SsCESA gene family
Analysis of conserved protein motifs shows the SsCESA gene family comprises 30 motifs. All SsCESA proteins include motifs 12 and 13; most also contain motifs 1, 3, 5, 8, and 11. (Figure 3A). Additionally, specific motifs are gene-specific, such as motif 21 in SsCESA12, motif 28 in SsCESA4, and motif 25 in SsCESA9 (Figure 3A).

Figure 3. Motifs, conserved domains, and gene structure of the CESA gene family among S. spontaneum, rice, and Arabidopsis. (A) Analysis of conserved motifs of SsCESA, OsCESA, and AtCESA proteins. 30 conserved protein motifs are exhibited in different colors. (B) Domain analysis in SsCESA, OsCESA, and AtCESA proteins. (C) Gene-structure of the SsCESA, OsCESA, and AtCESA gene family, CDS depicted by green, UTR by yellow, whereas straight lines represent introns.
Five conserved domains were also detected in the SsCESA, OsCESA, and AtCESA proteins (Figure 3B). All the CESA proteins contained zf-UDP and Cellulose_synt domain. Transmembrane domains are exclusively detected in SsCESA1, SsCESA3, SsCESA6, and SsCESA9 proteins (Figure 3B). All CESA proteins, except for SsCESA12-1T, SsCESA9-2B/4D, SsCESA8.1-2C, SsCESA3.2-3D, and SsCESA3.1-2C, contain a complete GT2 domain.
The SsCESA genes have a relatively high number of exons, ranging from 5 to 14 (Figure 3C). SsCESA1, SsCESA3, SsCESA4, SsCESA6, and SsCESA8 show a high degree of similarity in gene structure to the rice and Arabidopsis genes within their respective clades. All those results showed that partial CESA family members are evolutionarily conserved in rice, Arabidopsis thaliana, and S. spontaneum.
2.3 Evolutionary and collinearity analysis of SsCESA genes
The collinearity analysis revealed 32 pairs of segmental duplication events involving 30 SsCESA genes in S. spontaneum. Multiple genes were identified for SsCESA1, SsCESA2, SsCESA3, and SsCESA8, collinearity was also detected between SsCESA1.1 and SsCESA1.2, SsCESA2.1 and SsCESA2.1, SsCESA3.1 and SsCESA3.2, as well as SsCESA8.1 and SsCESA8.2 (Figure 4A; Supplementary Table 2). This finding suggests that the members of the SsCESA gene family were amplified via the segmental duplication.
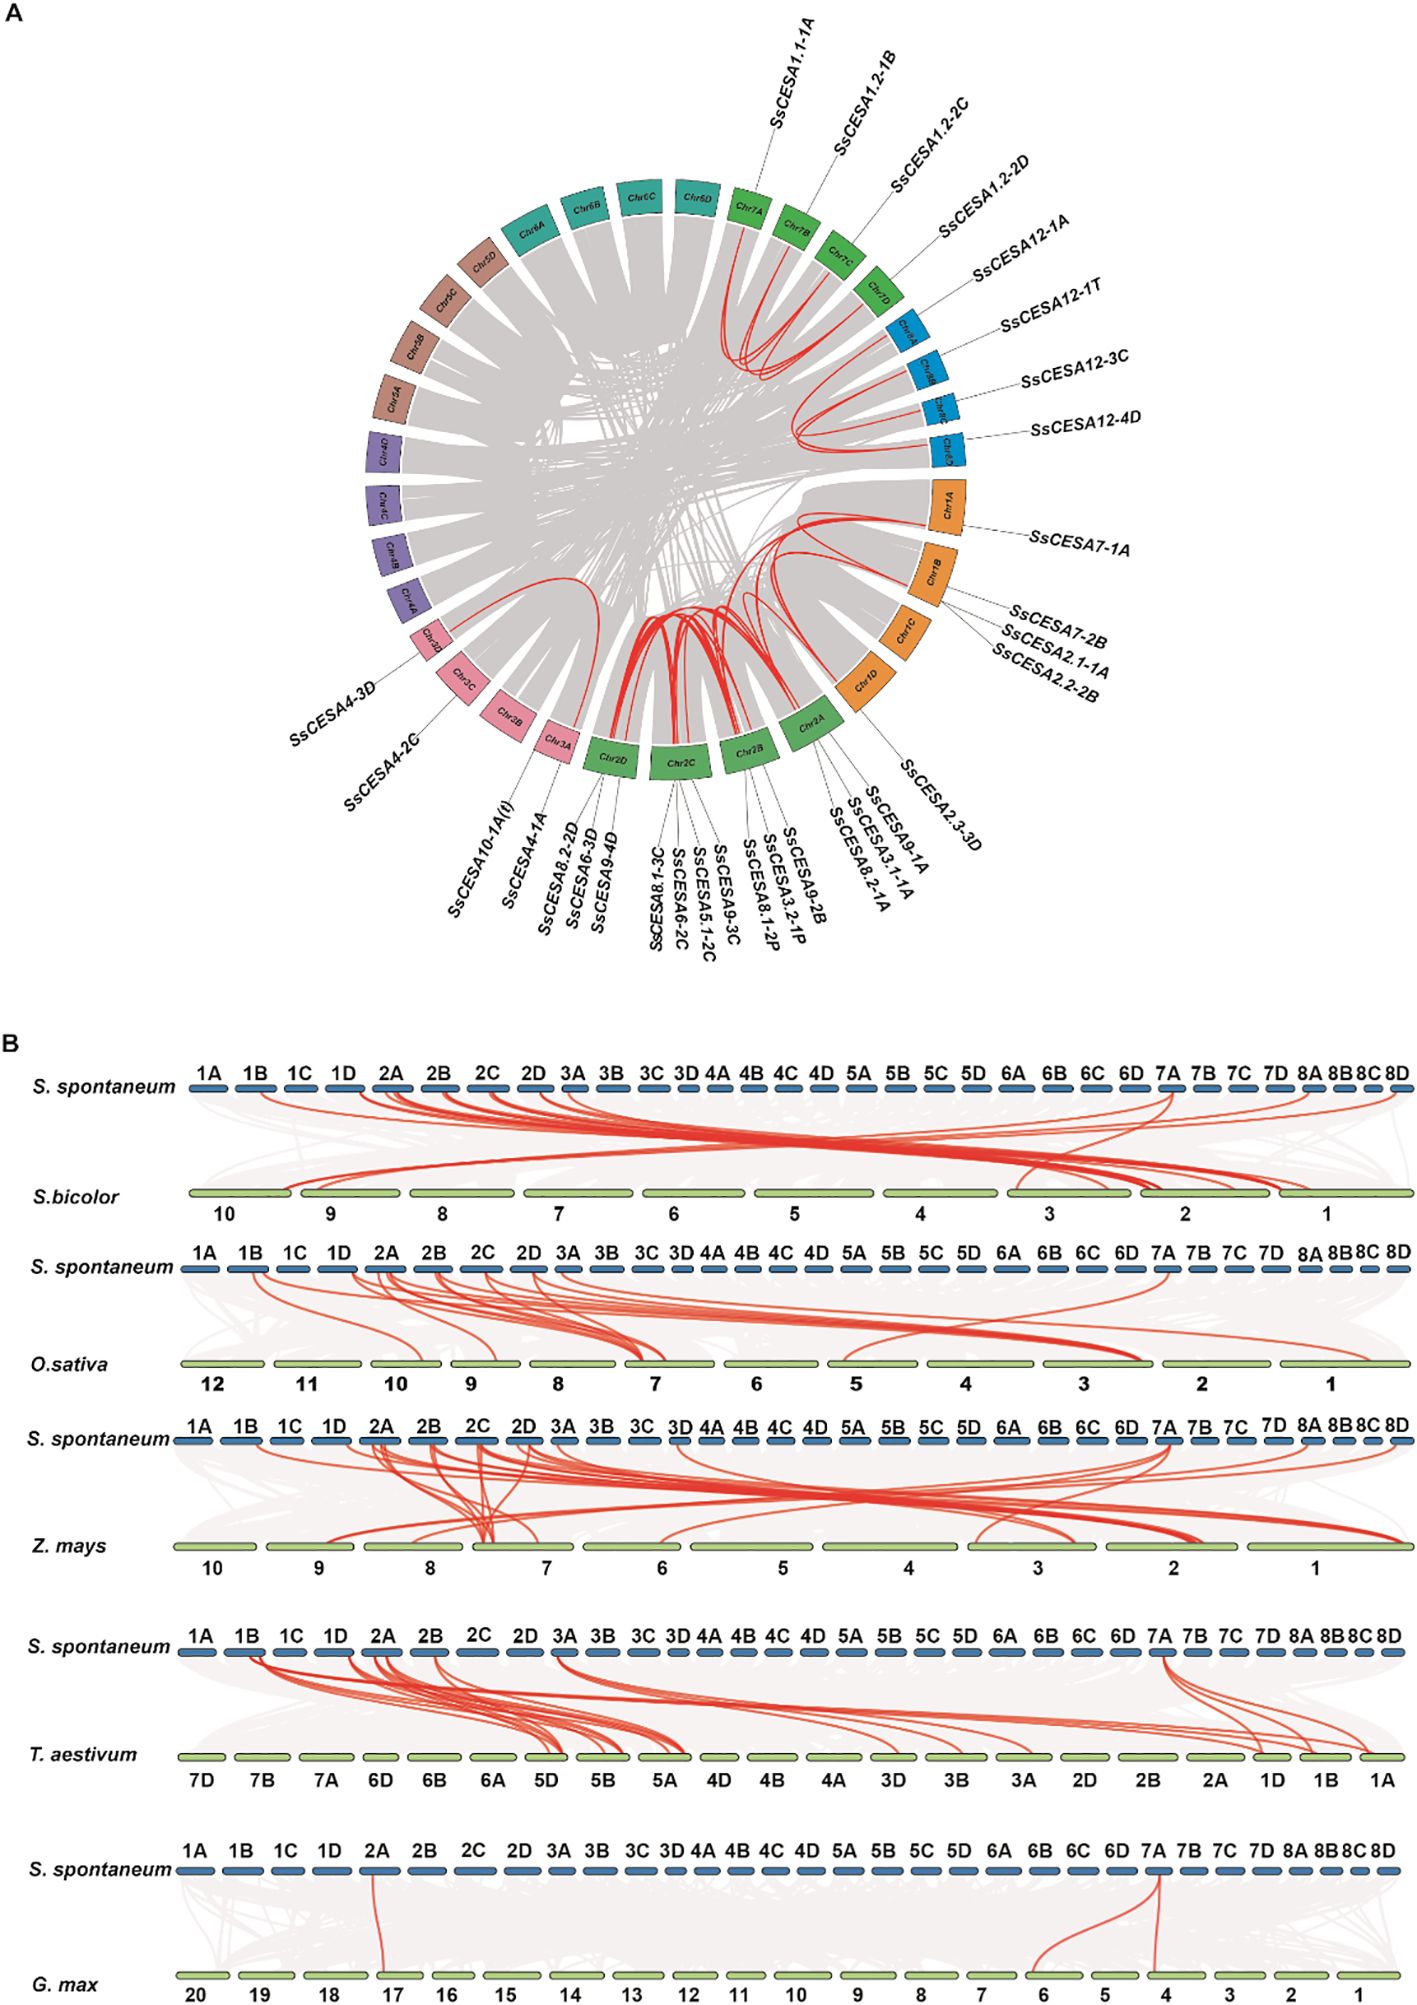
Figure 4. Collinear relationships of the SsCESAs within its genome and with Sorghum bicolor, Oryza sativa, Zea mays, Triticum aestivum, and Glycine max. (A) Collinear Analysis within the SsCESA Gene Family. The red lines represent the collinear associations among SsCESA genes, while the gray lines depict the collinear relationships across all genes. (B) Collinearity analysis of SsCESAs genes in comparison with Sorghum bicolor, Oryza sativa, Zea mays, Triticum aestivum, and Glycine max. The red lines represent collinear associations among SsCESA genes across species, while the gray lines depict overall collinear gene relationships between the two species.
To better understand the evolutionary relationships of the SsCESA gene family across species, we performed collinearity analysis with the CESA proteins from S. spontaneum, four monocotyledonous plants (Sorghum bicolor, Oryza sativa, Zea mays, and Triticum aestivum), and a dicotyledonous plant (Glycine max). Syntenic analyses were performed across these genomes and showed that there were 20 collinear events between S. spontaneum and sorghum, 17 with rice, 27 with maize, 23 with wheat, and only 3 with soybean (Figure 4B; Supplementary Tables 3–7). Collinearity events were detected for SsCESA1, SsCESA2, SsCESA4, SsCESA7, SsCESA8, and SsCESA9 across the four monocotyledonous species. These results indicate that the SsCESA gene family is relatively conserved and that SsCESA genes are more closely related to those in Z. mays than to those in Sorghum bicolor.
2.4 Predicting cis-acting regulatory elements in the promoter regions of the SsCESA gene family
Cis-acting regulatory elements serve as crucial molecular regulators, playing a key role in transcriptional control by modulating a complex, dynamic network of gene expression. This network governs a wide range of biological functions, such as responses to abiotic stress, hormonal signaling, and developmental mechanisms (Yamaguchi-Shinozaki and Shinozaki, 2005). Four hormone-response elements, namely MeJA-responsiveness, ABA-responsiveness, auxin-responsiveness, and gibberellin-responsiveness, were investigated in this study. Among them, the largest number of cis-acting elements is associated with MeJA-responsiveness, totaling 147 (Figure 5A). For stress responses, the number of cis-acting elements related to drought induction is the largest, reaching 199 (Figure 5B). These results suggest that SsCESA plays a crucial role in response to drought stress. Among the classifications of cis-acting elements associated with growth and development, those related to light response exhibit the highest proportion (Figure 5C). The NAC, MYB, and WRKY transcription factor families are prominent. They regulate downstream genes via SNBE sites, MYB binding sites, and W–box elements, respectively (Dubos et al., 2010; Rushton et al., 2012; Nuruzzaman et al., 2013). When predicting the cis-acting elements in the promoter region of SsCESA, we found that, except for SsCESA1.1-2C, the promoters of the other genes have at least two MYB binding sites (Figure 5D). In addition to SsCESA2.2-2B, the promoter regions of all other genes contain SNBE sites. We have also identified W-box elements in the promoter regions of SsCESA2, SsCESA3, SsCESA6, SsCESA7, SsCESA9, and SsCESA12. These results suggest that NAC, MYB, and WRKY transcription factors may regulate SsCESA.
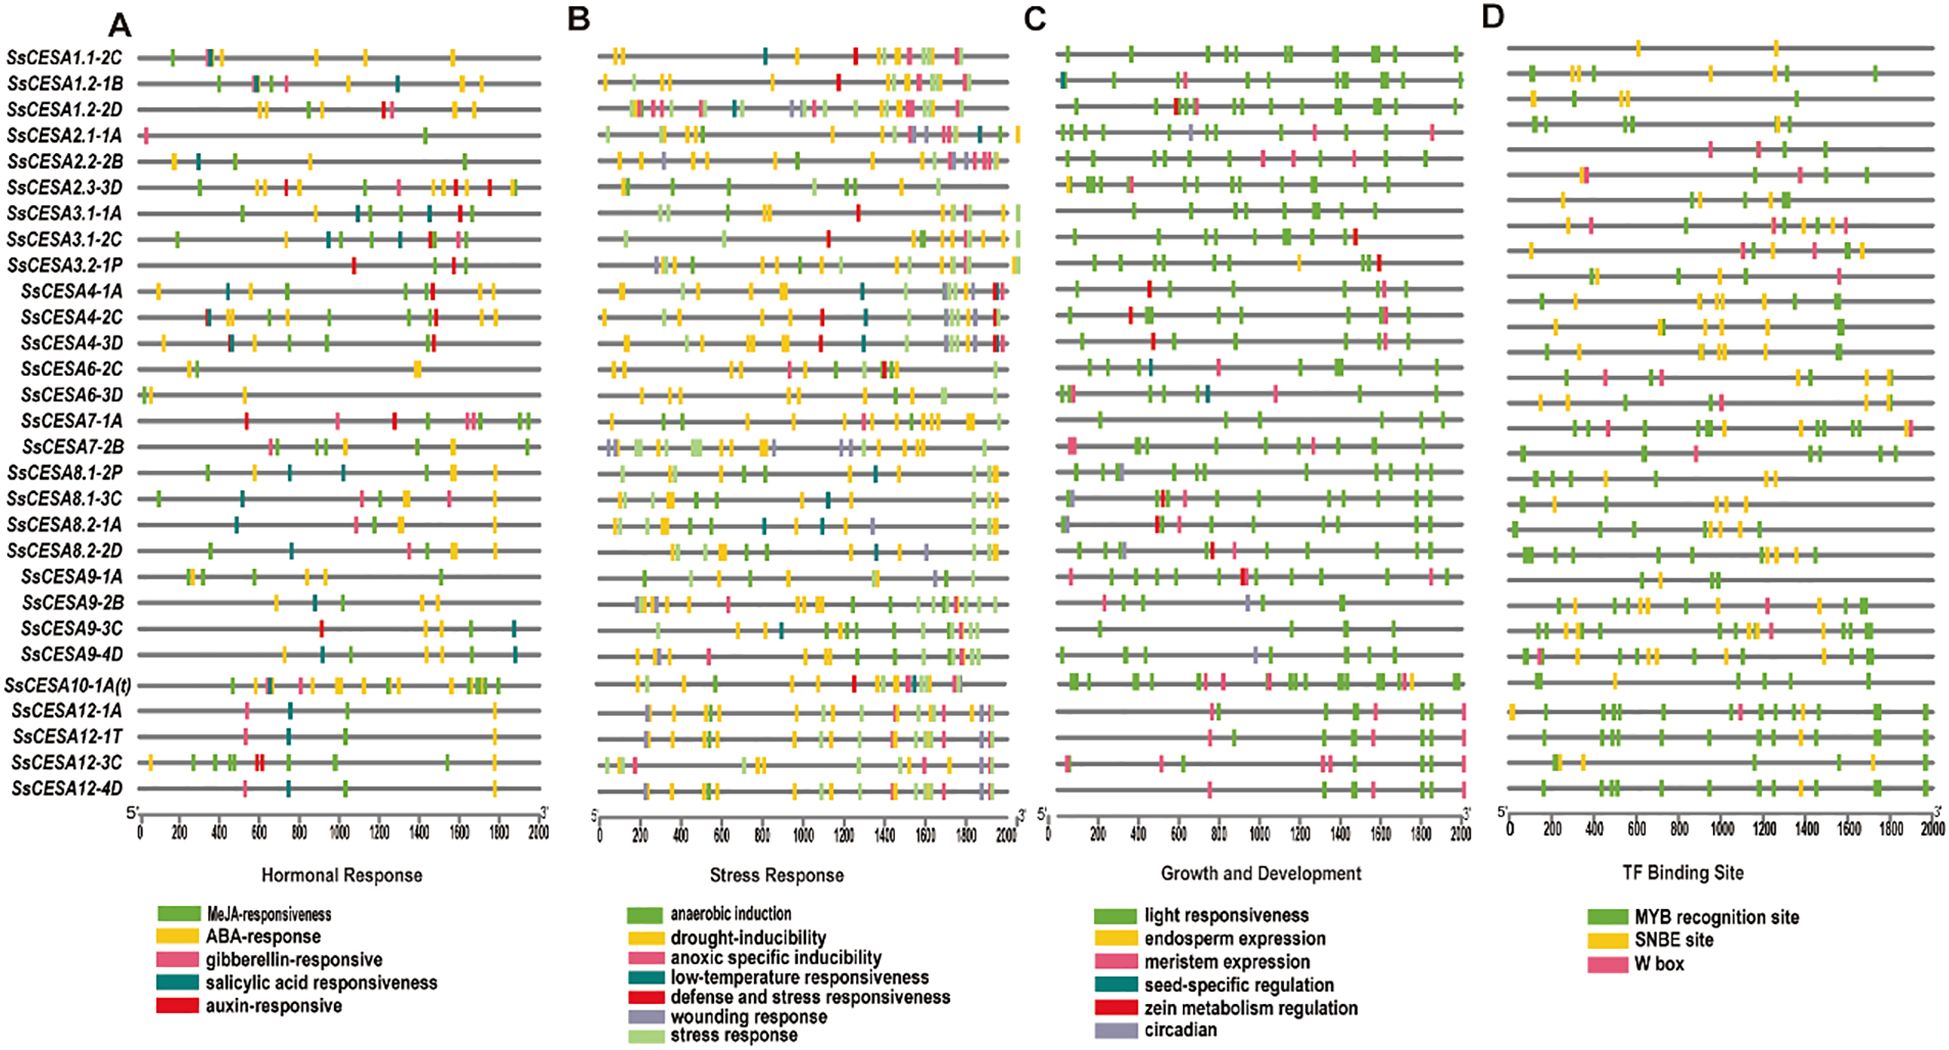
Figure 5. Cis-acting regulatory element (CRE) distribution on the predicted promoter regions of SsCESA genes. (A) Hormonal responsiveness. (B) Stress responsiveness. (C) Growth and development. (D) TF binding site.
2.5 SsCESA gene expression in growth and development
We utilized three publicly available transcriptomic datasets of S. spontaneum to investigate the expression pattern of the SsCESA gene. Almost all the SsCESA genes exhibited their highest expression levels during the transitional phase of leaf development (Figure 6A; Supplementary Table 9).

Figure 6. SsCESA gene expression pattern (A) Leaf developmental gradient. (B) Circadian rhythms. (C) Tissues at different developmental stages. The color scale on the right side of each heatmap represents relative gene expression levels, with red indicating higher expression, green indicating lower expression, and black indicating intermediate expression. (D) The expression levels of the SsCESA gene across various tissues were analyzed using quantitative real-time PCR (qRT-PCR).
Except for SsCESA2.1-1A and SsCESA2.2-2B, which exhibit relatively high expression levels in the circadian rhythm expression profiles, these genes might play crucial roles in regulating the circadian rhythm (Figure 6B; Supplementary Table 8). The expression levels of the remaining SsCESA genes are relatively low. Among them, the FPKM (Fragments Per Kilobase of exon per Million reads mapped) values of SsCESA9-1A/2B/3C/4D are close to zero (Figure 6B; Supplementary Table 8), and the SsCESA4, SsCESA7, and SsCESA9 also cluster together. The CESA gene family that regulates cellulose formation has been found to exhibit predominant expression in the stems, particularly within the xylem tissue, across various plant species, such as Triticum aestivum (Kaur et al., 2016), Miscanthus × giganteus (Zeng et al., 2020), and Linum usitatissimum (Mokshina et al., 2014). We further observed that the SsCESA genes demonstrated relatively high expression levels in the stem across all stages. Notably, their expression peaked in mature stems (Figure 6C; Supplementary Table 9). In addition, SsCESA4, SsCESA7, and SsCESA9 clustered together, while SsCESA1, SsCESA3, and SsCESA8 formed another cluster. All of these results suggest that SsCESA4, SsCESA7, and SsCESA9 in S. spontaneum exhibit similar spatio-temporal expression patterns.
To confirm the expression patterns of SsCESA across growth and development, we collected eight tissue types at various stages. We conducted qRT-PCR tests to verify the expression of the SsCESA gene family. SsCESA4/7/9 was expressed at higher levels in the young stems and mature stems, consistent with the transcriptional profiles associated with growth and developmental processes (Figures 6C, D). The expression levels of SsCESA1, SsCESA3, SsCESA6, SsCESA8, and SsCESA12 are relatively high in mature leaves.
SsCESA1, SsCESA3, and SsCESA8 proteins display relatively high homology with the CESA proteins related to the primary cell walls of rice (OsCESA1, OsCESA3, and OsCESA8) and Arabidopsis thaliana (AtCESA1, AtCESA3, and AtCESA6) (Figure 1). Additionally, co-expression analysis indicates that SsCESA1, SsCESA3, and SsCESA8 share similar expression patterns. Higher expression of SsCESA1, SsCESA3, and SsCESA8 occurs in rapidly elongating tissues like the basal parts of leaves, seedling leaves, and young stems, indicating their role in primary cell wall biosynthesis, as supported by their high homology with primary cell wall-related CESAs in rice and Arabidopsis. SsCESA4, SsCESA7, and SsCESA9 are more expressed in maturing stems, aligning with their role in secondary cell wall thickening. However, their low expression in young internodes (PCW-dominant stage) suggests dynamic regulation during sugarcane stem maturation. Arabidopsis mutants of AtCESA4/7/8 (SCW CESAs) exhibit collapsed xylem vessels (Turner and Somerville, 1997), highlighting the conservation of SCW-related CESA function in dicots and monocots. Combined with the co-expression analysis of the three transcriptome databases, it was found that SsCESA4, SsCESA7, and SsCESA9 cluster together and have relatively high expression levels in the stem. Therefore, we speculate that SsCESA4, SsCESA7, and SsCESA9 are associated with the secondary cell wall. These results suggest that CESA genes play a crucial role in the development of stems. Moreover, CESA genes with similar functions exhibit the same co-expression pattern.
2.6 SsCESA gene expression in stress responses
The cell wall serves as the primary defense mechanism in plants, acting as a protective barrier against external environmental fluctuations (Son et al., 2025). Cellulose synthase (CESA) is the core enzyme responsible for cellulose biosynthesis in plants, and its activity directly determines the mechanical strength and function of the cell wall (Richmond, 2000). We examined the expression levels of SsCESA genes under cold (6°C), heat (45°C), and salt stress (150 mmol/L) conditions. Following cold treatment, the expression levels of SsCESA1, SsCESA2, SsCESA3, SsCESA4, and SsCESA10(t) were quickly induced. Specifically, the expression levels of SsCESA1.1 and SsCESA10(t) peaked at 6 hours and then decreased by 12 hours. Conversely, the expression levels of SsCESA3 and SsCESA4 peaked at 12 hours and returned to baseline by 24 hours (Figure 7A). SsCESA6, SsCESA7, SsCESA8, SsCESA9, and SsCESA12 were all suppressed in expression under cold stress, with their levels being the lowest at 6 hours (Figure 7A). When plants are subjected to heat stress, only SsCESA10(t), SsCESA3, and SsCESA12 are rapidly induced for expression at 6 hours. The expressions of the remaining genes are inhibited, reaching their lowest levels at 12 hours, except for SsCESA4 (Figure 7B). Under salt stress, all SsCESA genes except SsCESA2 were repressed (Figure 7C). These results indicate that the SsCESA gene family displays distinct expression patterns in response to cold, heat, and salt stresses.
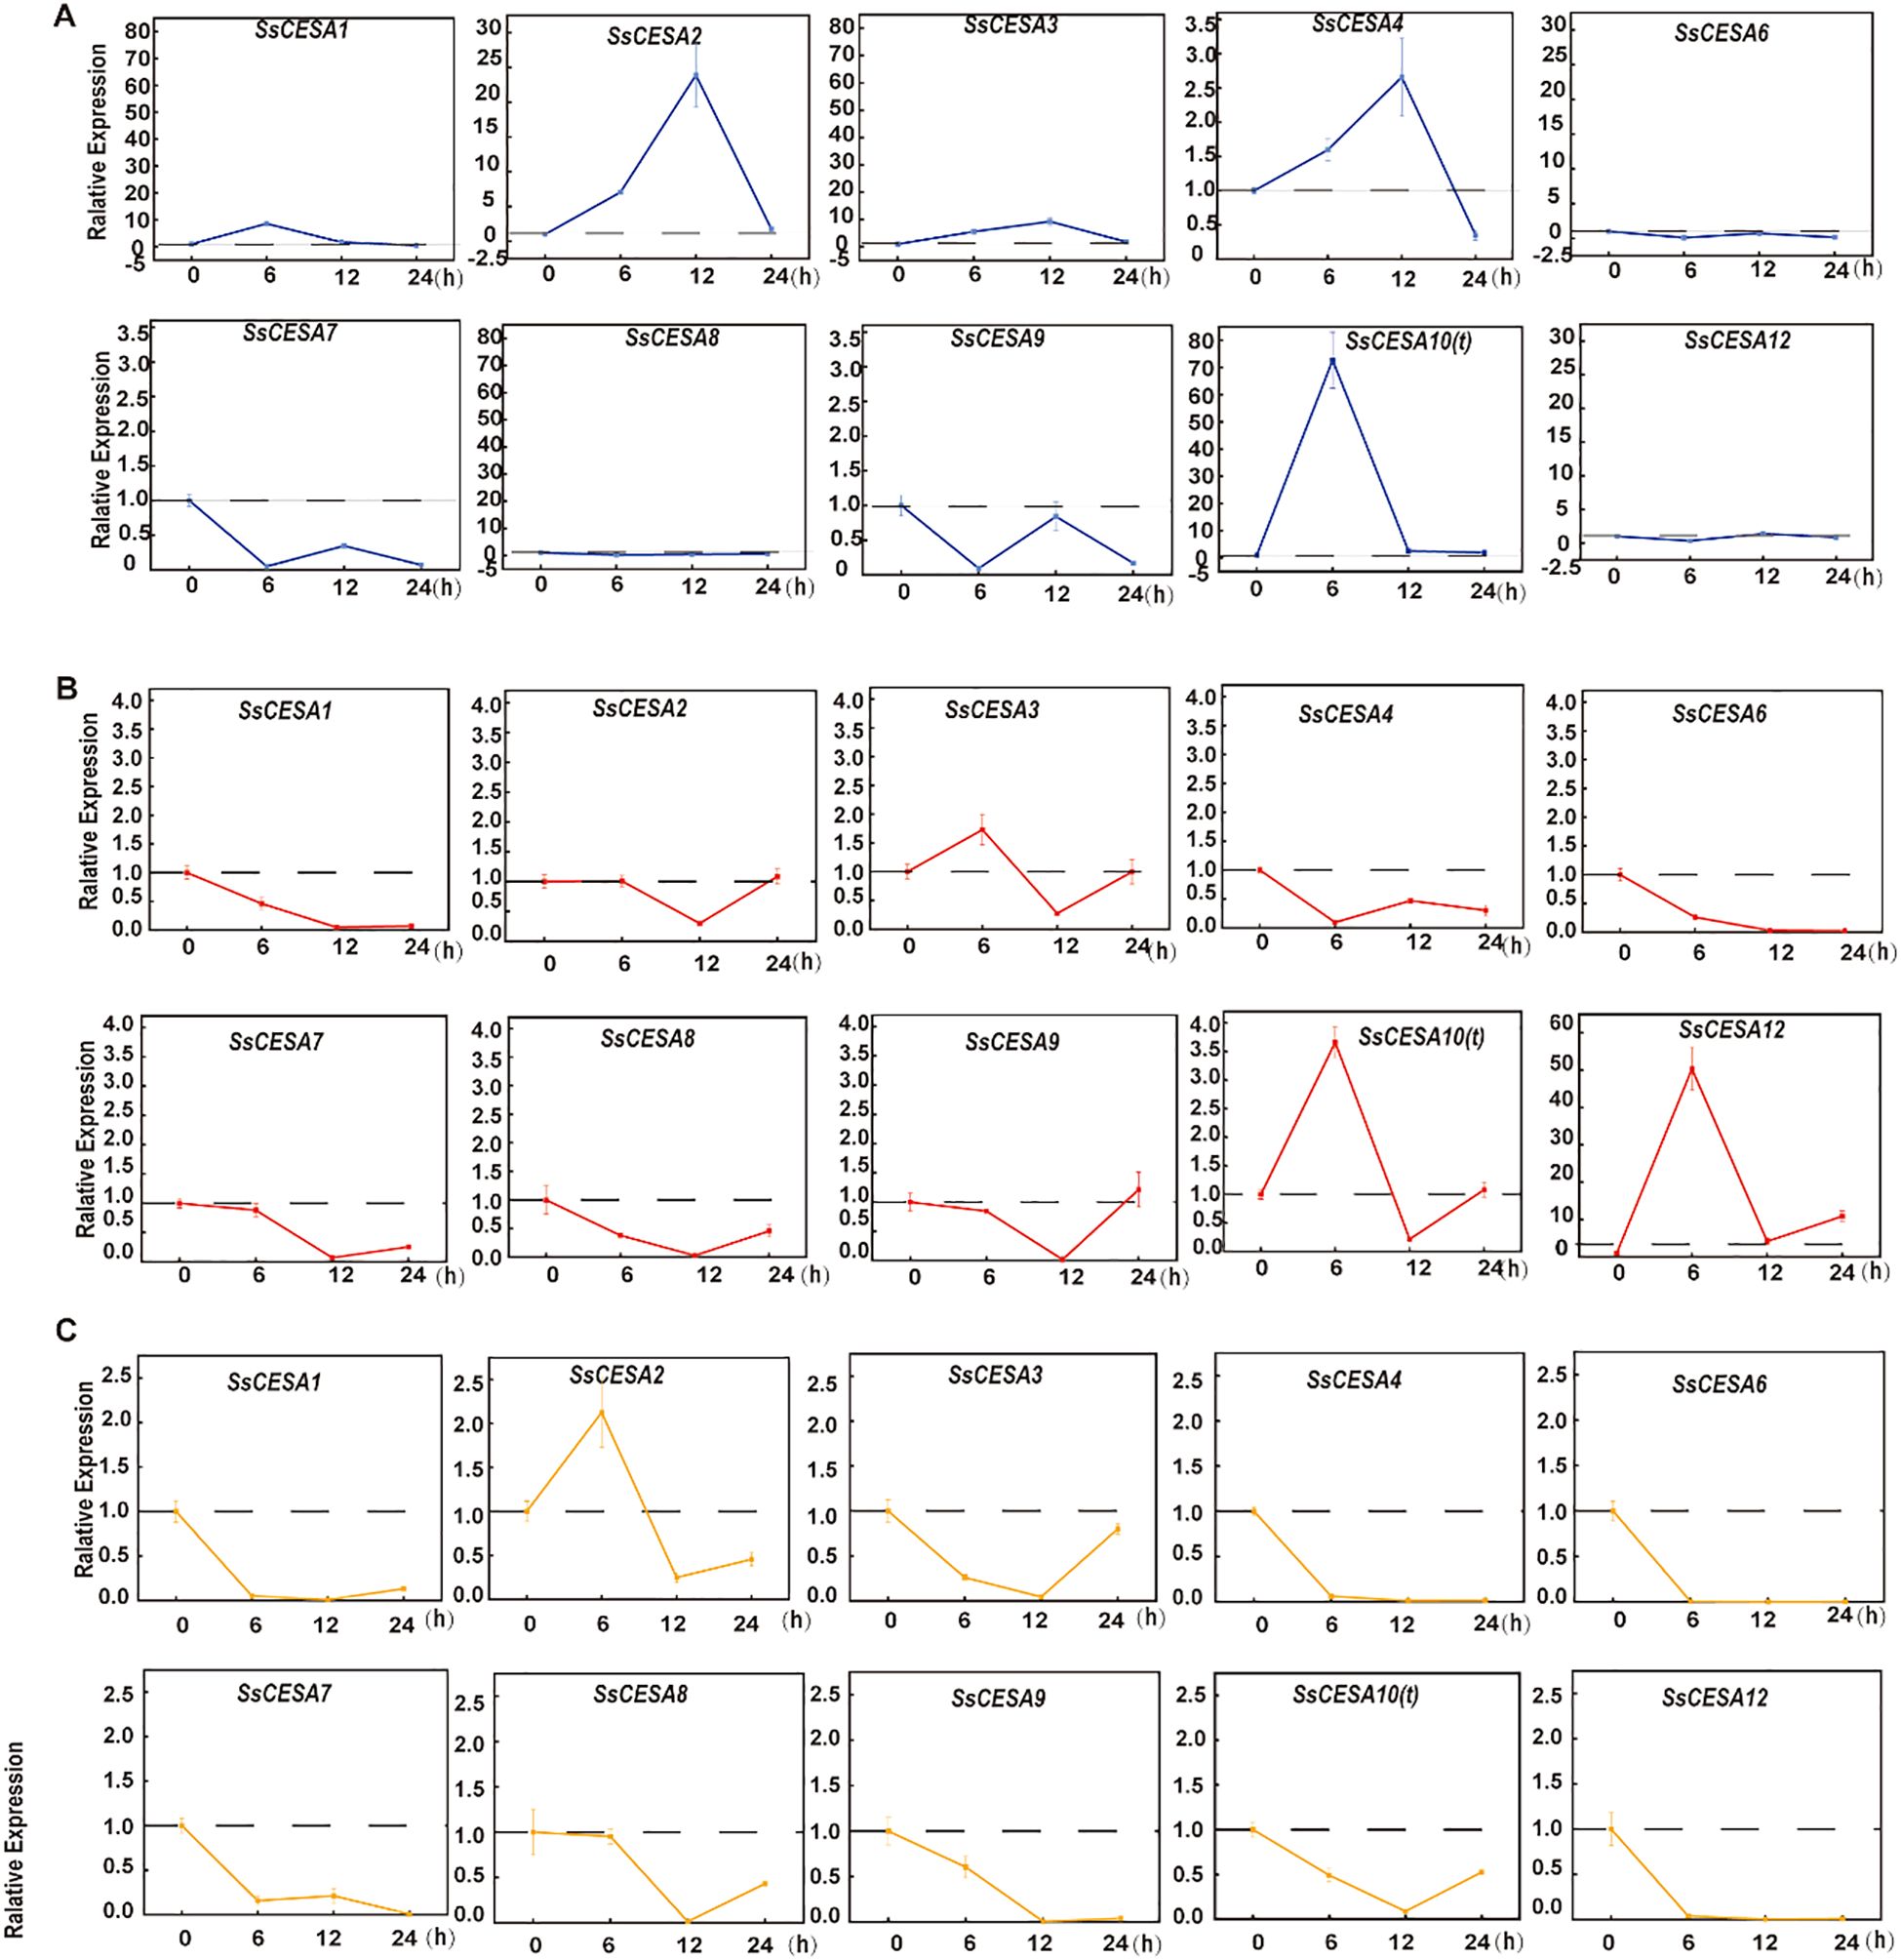
Figure 7. Analysis of the expression patterns of SsCESA genes using qRT-PCR at time points 0, 6, 12, and 24 hours under (A) Cold stress. (B) Heat stress. (C) Salt stress.
2.7 Subcellular localization of SsCESA genes
To further validate the subcellular localization of SsCESA proteins, we cloned SsCESA4 and SsCESA9 and performed transient transformation in tobacco leaves. We used the membrane protein marker “cubilin” to co-localize with SsCESA4-GFP. SsCESA4-GFP showed a punctate distribution, mainly on the cell membrane (Figure 8A). CESA proteins were reported to form complexes called CSCs within the endoplasmic reticulum or the Golgi apparatus (McFarlane et al., 2014). We conducted co-localization experiments of SsCESA4-GFP and SsCESA9-GFP with a Golgi marker, GM130, which showed that both proteins are located in the Golgi apparatus (Figure 8B). This supports the idea that cellulose synthase (CESA) complexes are likely to form in the endoplasmic reticulum (ER) and/or the Golgi apparatus. CESAs are also found in small post-Golgi structures (small CESA compartments, smaCCs) and are eventually transported to the plasma membrane, where cellulose is ultimately synthesized (Polko and Kieber, 2019; McFarlane et al., 2021).

Figure 8. Subcellular localization of the SsCESA4 and SsCESA9 proteins in tobacco leaves. (A) 35s: GFP and SsCESA4: GFP co-localization with the cell membrane marker cubilin, respectively. (B) 35s: GFP, SsCESA4: GFP, and SsCESA9: GFP co-localization with golgi marker, respectively.
2.8 SsNST1 binds to the SNBE sites in the promoters of SCW-CESA genes
SNBE sites were identified within the promoter sequences of nearly all SsCESA members (Figure 5D). Seven, one, and eleven SNBE sites were identified in the promoters of SsCESA4, SsCESA7, and SsCESA9, respectively (Figure 9). The SNBE sites are binding sites associated with the secondary cell wall for NAC transcription factors. We selected one SNBE site from each of the three genes for validation. EMSA experiments demonstrated that NST1 can bind to the promoters of SsCESA4, SsCESA7, and SsCESA9 via the SNBE sites (Figure 9).
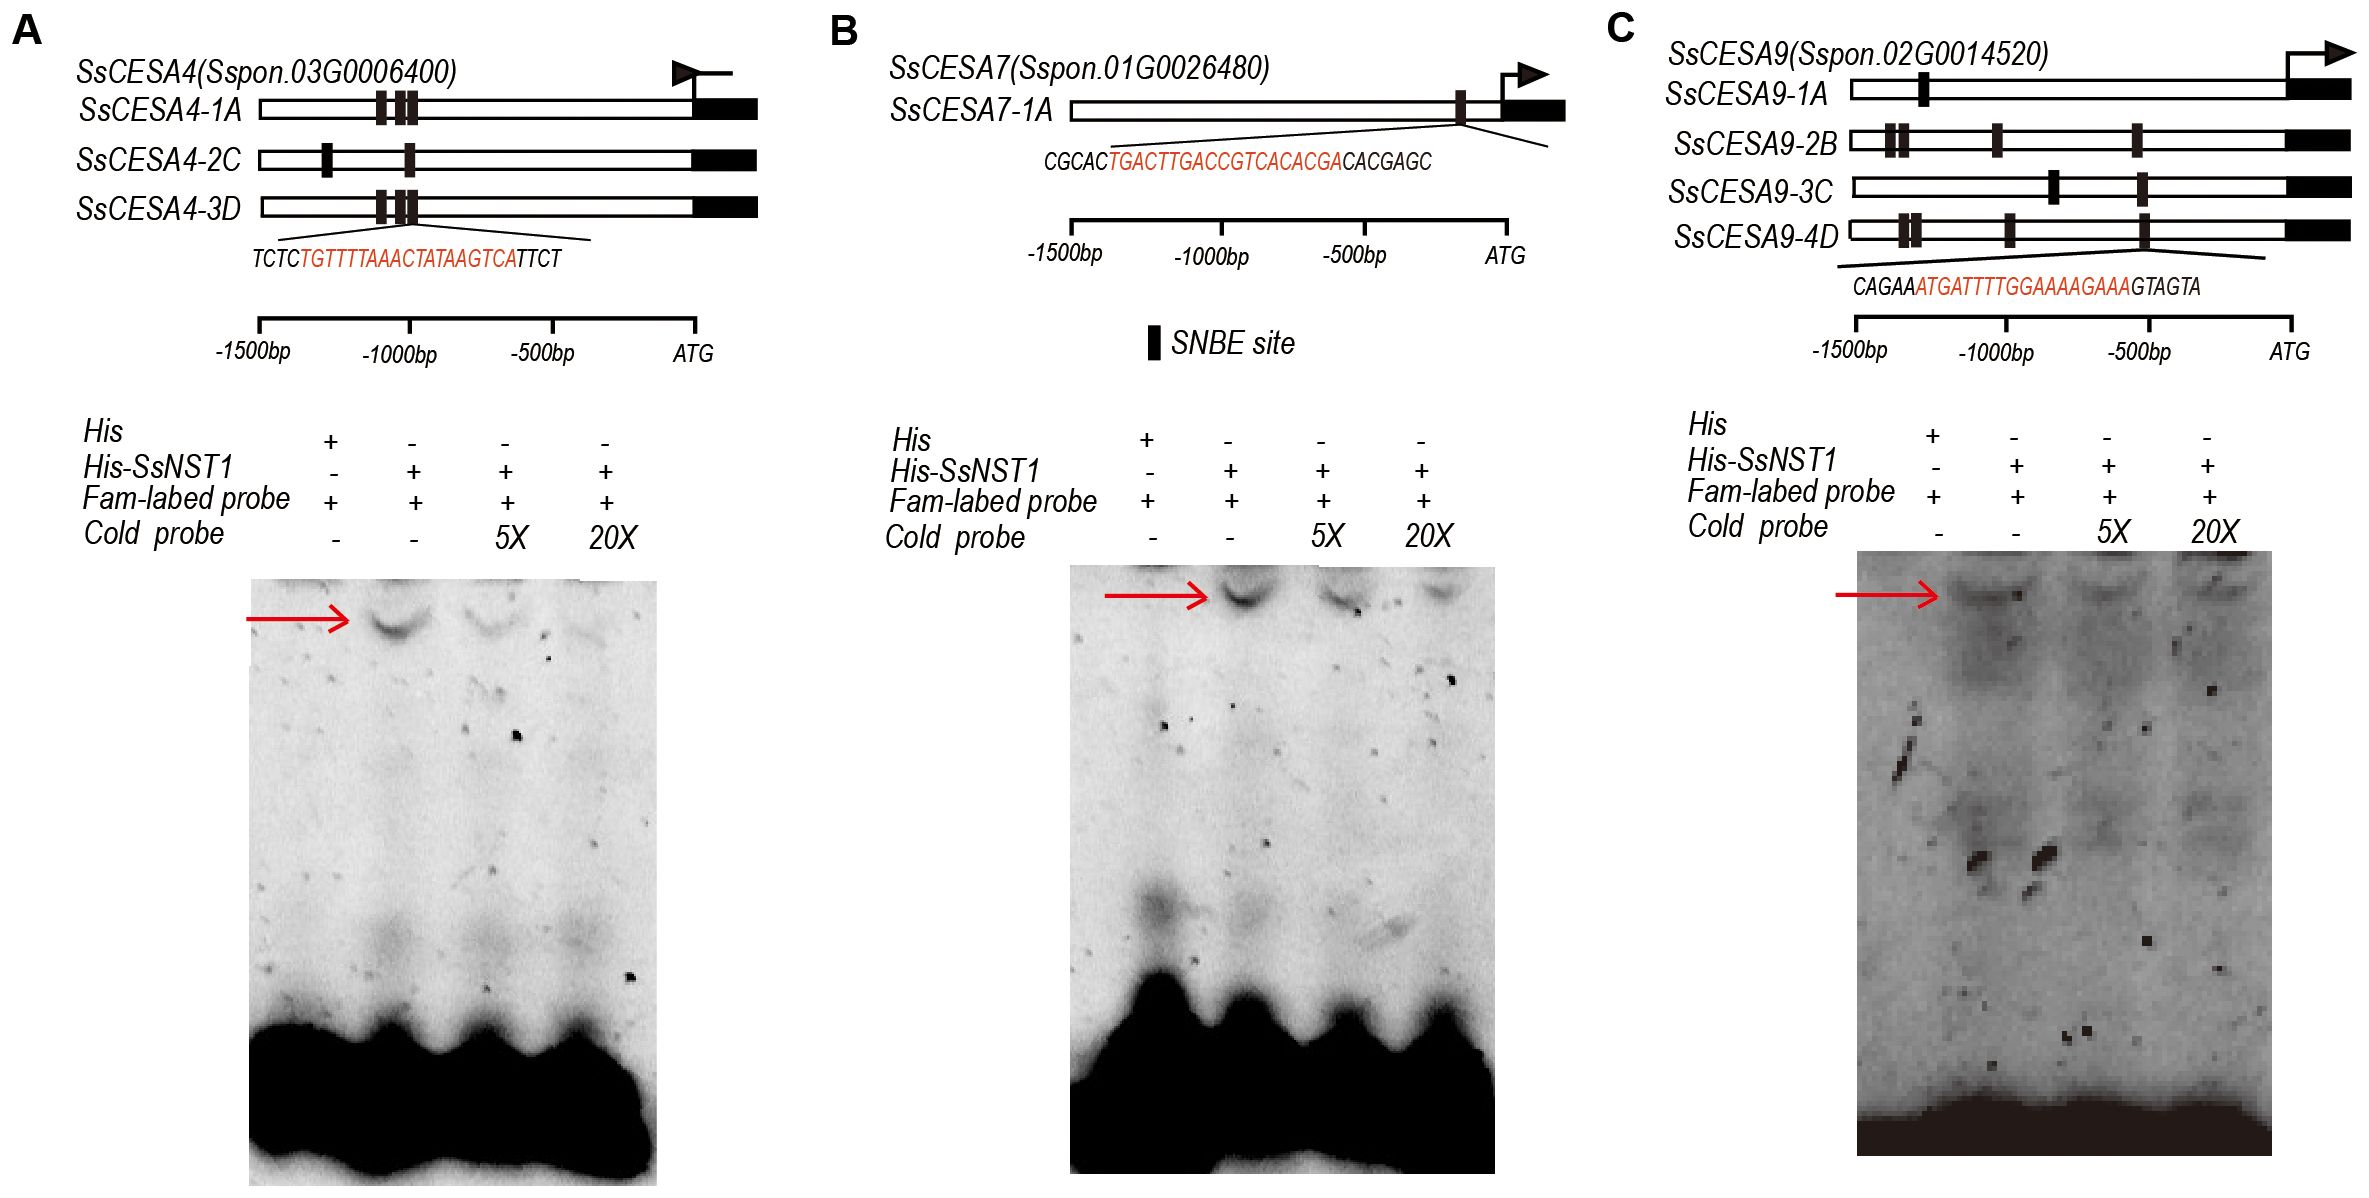
Figure 9. SsNST1 binds to the SNBE sites in the promoters of SCW-CESA genes (A) The promoters of SsCESA4. (B) The promoters of SsCESA7. (C) The promoters of SsCESA9. The dark rectangles indicate the locations and the sequences of the SNBE sites in the promoters of SsCESA4, SsCESA7, and SsCESA9, detected by PlantPAN 4.0. An EMSA assay to test the binding of SsNST1 to the target genes.
3 Discussion
Sugarcane is a vital sugar and bioenergy crop, contributing to over 80% of global sugar production and serving as a key feedstock for renewable energy solutions such as ethanol and bioelectricity (Leal and Nogueira, 2014). Cellulose, as the primary component of the cell wall, assumes a vital role in plant growth and development. CESA genes are essential members of the CESA/CSL supergene family and are involved in cellulose biosynthesis (Li et al., 2014; Polko and Kieber, 2019). Among its progenitors, S. spontaneum contributes approximately 20% of the genetic background to commercial sugarcane (Glassop et al., 2021). The CESA genes have been predominantly investigated in model plants, while few in-depth studies have been conducted on other non-model plants (Pear et al., 1996; Richmond, 2000; Zhang et al., 2021a, 2021). CESA gene family members have been reported in economic crops and forest trees in recent years (Huang et al., 2022; Liu et al., 2022; Niu et al., 2023; Sod et al., 2023; Wang et al., 2023). However, despite the release of genomic information for S. spontaneum and for other sugarcane types, knowledge about the SsCESA genes remains limited.
We identified 30 members of the SsCESA gene family in the sugarcane (AP85-441) genome through HMM searching (Table 1). Given the tetraploid genome of AP85-441, 15 genes were discovered. Meanwhile, SsCESA12(Sspon.08G0005550) is unique to S. spontaneum and does not cluster with any members of rice or Arabidopsis. Since AP85-441 (S. spontaneum) is a tetraploid, there are usually one to four corresponding alleles for each of the typical CESA genes, such as SsCESA4 (Sspon. 03G0006400), SsCESA7(Sspon.01G0024680), SsCESA9 (Sspon.02G0014520), and SsCESA12(Sspon.08G0005550). This indicates that the major CESA genes are conserved in S. spontaneum, although the number of alleles does not match the genome ploidy. Through intraspecific synteny analysis, it was found that there are no tandem duplication events among the SsCESA gene family and 13 pairs of segmental duplication events among SsCESA1, SsCESA3, and SsCESA8. This indicates that the genes associated with the primary cell wall in S. spontaneum have undergone expansion through segmental duplication. The members of the SsCESA gene family exhibit the highest number of collinearity events with those of maize. This is associated with the fact that both S. spontaneum and maize are classified within the Panicoideae subfamily and the Andropogoneae tribe, and are polyploids (Grass Phylogeny Working, 2012).
Analysis of cis-acting elements in the promoter region reveals that SsCESA may be regulated by hormones and abiotic stresses. We identified many MYB transcription factor (TF) binding sites in the SsCESA promoter, potentially linked to the NAC-MYB-secondary cell wall regulatory network. It has been reported that the AtMYB46 protein directly binds to the promoters of the three CESA genes (CESA4, CESA7, and CESA8) both in vitro and in vivo (Kim et al., 2013). PagMYB216 and OsMYB61, homologous genes of AtMYB61, stimulate the synthesis of three SCW CESA genes through their interaction with GAMYB motifs (Woodger et al., 2003; Huang et al., 2015; Wei et al., 2019). GhMYB7 and GhMYB46_D13 directly bind to three different cis-elements in the promoters of GhCESA4, GhCESA7, and GhCESA8, thereby regulating the synthesis of secondary cell wall cellulose in cotton fibers (Huang et al., 2021). Additionally, seven homologous pairs within the GhFSN (fiber secondary cell wall-related NAC1) subclade, including GhFSN1A, GhFSN2D, GhFSN3A, GhFSN4A, GhFSN5D, GhFSN6A, GhVND4D, and GhVNI1A, can form pairwise heterodimers that work together to activate GhCESA genes and promote cellulose biosynthesis (Chen et al., 2025). Moreover, we detected SNBE sites and a W-box in the SsCESA promoter, suggesting that NAC and WRKY TFs may directly regulate SsCESA. It has been demonstrated that AtNST2 can bind to the promoter of AtCESA4 (Taylor et al., 2003; Ohashi-Ito et al., 2010). EMSA experiments demonstrated that SsNST1 can directly bind to the promoters of SsCESA4, SsCESA7, and SsCESA9 (Figure 9). The expression levels of AtCESA7 (IRX3) and AtCESA4 (IRX5) are downregulated in the atnst1, atnst3 double mutant (Mitsuda et al., 2007). MANAC1, which is the homolog of SND2, NST1 and SND1, can directly bind to and activate the MACESA6B and MaCESA7 (Yin et al., 2024). All these results indicate that NAC transcription factors can activate the expression of downstream CESA genes. Therefore, we speculate that SsNST1 activates the expression of SsCESA4, SsCESA7 and SsCESA9. However, to verify our speculation, a large number of in vivo and in vitro experiments as well as the construction of SsNST1 genetic materials are still needed. Meanwhile, more experimental evidence is required to confirm that WRKY TFs can directly regulate the SsCESA gene.
Co-expression patterns can reveal networks of functionally related genes, providing a deeper understanding of the processes involved in the production of multiple gene products (Wang et al., 2019). The SsCESA genes showed higher expression in mature stems than in leaves or leaf roll tissues (Figure 6C), suggesting a potential role in regulating biological processes related to stem development. This result aligns with the finding that OsCESA exhibits a relatively high expression level in rice stems, and the discovery that the SbCESA genes related to the primary and secondary cell walls reach their peak in sorghum stems at 75 days (Shakoor et al., 2014; Wang et al., 2016). Thus, the CESA genes in plants are essential for cellulose synthesis, which helps maintain the mechanical strength of the stem. Notably, through homology alignment with rice and Arabidopsis thaliana, as well as transcriptomic co-expression analysis, we indicate that SsCESA4, SsCESA7, and SsCESA9 are associated with the secondary cell wall, whereas SsCESA1, SsCESA3, and SsCESA8 may be related to the primary cell wall. Since primary and secondary growth are vital stages in plant development, secondary growth involves lignin synthesis and the activation of secondary metabolic pathways. Understanding the roles of various CESA members in these processes is essential for the next step in understanding biomass and yield formation in sugarcane. This is especially important for future research, as deleting or mutating primary cell wall genes may lead to events such as plant death. Therefore, future studies can use secondary cell wall-related genes as markers (such as SsCESA4, SsCESA7, and SsCESA9 in this study) to examine how cell wall biosynthesis is regulated in sugarcane.
Abiotic stress, such as salinity, drought, and extremes of hot and cold temperatures, is believed to contribute to as much as 60% of yield reductions across multiple crop species (Ranjan et al., 2025). Cellulose is the primary structural component of plant cell walls and is the most prevalent biopolymer on the planet. Under cold stress, SsCESA1 - SsCESA4 could be activated (Figure 7A). MaCESA7 and MaCESA6B were activated, resulting in an enhanced cellulose content during low-temperature stress (Yin et al., 2024). As an essential transcription factor in the cold regulatory pathway, the relationship between CBF (C-repeat Binding Factor) and CESA gene expression has not yet been reported. More experiments are needed for future verification. Most SsCESAs were downregulated under abiotic stress. Both rice and Miscanthus exhibited higher cellulose content in frost-sensitive genotypes compared to frost-tolerant ones (Domon et al., 2013; Xu et al., 2020). Meanwhile, mutations or RNA interference in the cellulose synthase gene can reduce cellulose levels and increase salt stress resistance (Li et al., 2017; Ye et al., 2021). However, ZmRR1 positively regulates the expression of ZmDREB1 and CESA genes, thereby enhancing chilling tolerance (Zeng et al., 2021). Under heavy metal stress, CESA can enhance tolerance by increasing cellulose synthesis via hormone signaling (Kesten et al., 2017). The roles of cell wall-related genes in stress and hormone responses are a valuable area of study, from CSLD4’s salt tolerance to brittle stem genes, reported in model plants Arabidopsis and Rice (Ma et al., 2021; Zhao et al., 2022; Xu et al., 2023). When stressed, the variation in cellulose content makes the cell wall more plastic, allowing it to resist external changes. The findings on SsCESA genes and stress responses in sugarcane are worth exploring further.
4 Conclusions
This study for the first time deciphered the phylogeny, gene structure, cis-regulatory elements, and expression patterns of the SsCESA gene family in sugarcane (S. spontaneum). A total of 30 SsCESA genes were identified and distributed across 18 chromosomes. SsCESA genes exhibited extremely high expression levels in the stems and transitional parts of leaves. Moreover, SsCESA4, SsCESA7, and SsCESA9 are mainly expressed at higher levels in mature stems, whereas SsCESA1, SsCESA3, and SsCESA8 are expressed at higher levels in tender tissues (the basal parts of the leaves and the leaves of seedlings), indicating their roles in PCW and SCW, respectively. qRT-PCR experiments show that almost all SsCESA genes respond rapidly to cold, salt, and heat stress, suggesting they play a key role under stress. In addition, the SCW CESA proteins were further investigated and found to be localized in the Golgi apparatus. Transcription factor SsNST1 can bind to the SNBE site in the promoters of all three SCW CESA genes (SsCESA4, SsCESA7, and SsCESA9). Our results offer insights into the functional analysis of SsCESA genes and their regulation. SsCESA4/7/9 are closely associated with secondary cell wall and cellulose biosynthesis. In sugarcane energy, upregulating these genes boosts cellulose, lowering ethanol costs. Higher cellulose also strengthens stems, improving lodging resistance.
5 Materials and methods
5.1 Plant materials
Stem and leaf tissues were collected from 35-day-old sugarcane seedlings of S. spontaneum (SES-208, 2n = 8x = 64). Samples including leaf roll, leaf, top internode (internode 3), maturing internode (internode 6), and mature internode (internode 9) were harvested from both 9-month-old and 12-month-old mature S. spontaneum plants, following the previously established methodology (Zhang et al., 2016; Chen et al., 2017; Li et al., 2020).
The sampling material for the transcriptome of the leaf development gradient was taken from the second leaves of 11-day-old S. spontaneum seedlings and cut into 15 segments, each5 cm long, following the method below (Li et al., 2010, 2020).
The material for the circadian rhythm transcriptome data was collected from the middle 4 cm of the first leaf of S. spontaneum in the experimental field of Fujian Agriculture and Forestry University. Sampling was conducted every 2 hours (6:00, 8:00, 10:00, 12:00, 14:00, 16:00, 18:00, 20:00, 22:00, 24:00, 2:00, 4:00) from March 2nd to 3rd, 2017, during the sugar accumulation stage (Ming et al., 2015; Li et al., 2020).
For the eight organizations conducting RT-qPCR experiments, the young and mature leaves and maturing stems were all from the germplasm resource pool at Guangxi University. The young leaves were taken from the leaves that had not fully unfolded from the apical meristem, and the mature leaves were the first leaves. The young stems and mature stems were taken from the first internode and second internode of S. spontaneum (counting from the top of the biological end downwards), respectively. The young leaves were placed in the callus induction medium (MS + 3 mg/L 2,4-D + 6 g/L agar) and kept in the dark for 1 month. Samples were taken when small, granular protrusions appeared on the leaf surface; these were the callus samples. The stem segments with buds were cut into uniform small pieces and then hydroponically cultured in the dark. Samples of the buds and newly grown young roots were taken respectively after 2 days and 7 days. The seedlings were the plants that had been hydroponically cultivated for two weeks using the stems of S. spontaneous.
S. spontaneous (AP85-441) seedlings were used for cold, heat, and salt stress experiments. We used stems of sugarcane S. spontaneum that were collected from the field. The buds were preserved, and the stems were evenly cut into segments of equal length. After two weeks of hydroponic cultivation, seedlings with similar growth status and size were selected for stress treatment. For heat treatment, the seedlings were placed in an incubator maintained at 45 °C. During the cold treatment, the seedlings were placed in an incubator set at 6 °C for treatment. For the salt stress treatment, the seedlings were immersed in a 150 mmol/L sodium chloride solution. All samples were collected at 0-, 6-, 12-, and 24 hours post-treatment, respectively. Five seedlings were combined into one pooled sample for RNA extraction.
5.2 Identification of SsCESA gene family in S. spontaneum
The Hidden Markov models (HMM) of the Glycos_transf_2 domain (PF00535) and the Cellulose synthase domain (PF03552) were downloaded from the Pfam database (http://pfam.xfam.org/) (Finn et al., 2016). The entire protein sequences of S. spontaneum were searched using HMMER software (v3.0) with an E-value set to 1×10⁻⁵, yielding preliminary candidate sequences. Subsequently, the candidate sequences were analyzed in the CDD (https://www.ncbi.nlm.nih.gov/cdd/) and SMART (http://smart.embl.de/) databases to confirm the conserved domains, retaining protein sequences that contained the Ring and Cellulose synthase domains (Letunic et al., 2020). Sequences with non-typical conserved domains or incomplete structures were removed, resulting in the identification of the final gene members.
5.3 Phylogenetic analyses of SsCESA proteins
The phylogenetic trees were constructed based on the candidate protein sequences of S. spontaneum, as well as the CESA proteins of rice and A. thaliana. The evolutionary tree of SsCESA protein sequences was constructed using the maximum likelihood (ML) method in MEGA7 (Kumar et al., 2016). The alignment method was Clustal W, the Bootstrap value was 1,000, and the model used was JTT+G. As both S. spontaneum and rice are monocotyledonous plants and share a closer phylogenetic relationship, the naming of SsCESA in S. spontaneum is based on that of rice.
5.4 Analysis of motifs, conserved domains, and gene structures in the SsCESA gene family
The protein sequences of the SsCESA were uploaded to the MEME website (http://meme-suite.org/tools/meme) for the prediction of conserved protein motifs (Bailey et al., 2009). The number of conserved motifs was set to 30, and the length of the conserved motifs was set to range from 5 to 200 amino acids. The gene structure was depicted using the gff3 file in TBtools. Protein domains were obtained from the SMART website (https://smart.embl.de) (Letunic et al., 2020). Subsequently, a combined graph encompassing the gene structure, conserved motifs, and domains was generated in TBtools (Chen et al., 2023).
5.5 Chromosomal localization and synteny analysis of SsCESA genes
Utilizing the genome annotation file of S. spontaneum, the chromosomal locations of the SsCESA gene family were visualized using Tbtools (Chen et al., 2023).
To deeper into the intraspecific synteny of the SsCESA genes, the syntenic gene pairs of SsCESA were identified via MCscanX analysis (Wang et al., 2012). Subsequently, the synteny circos plot was visualized using the “Advanced Circos” module within the TBtools software (Chen et al., 2023).
To further investigate the interspecific evolutionary relationships of SsCESA, five representative species were selected: Oryza sativa (rice), Glycine max (soybean), Sorghum bicolor (sorghum), Triticum aestivum (wheat), and Zea mays (maize). Collinearity analysis was performed with SsCESA from Saccharum spontaneum. The collinearity relationships among species were analyzed and visualized using TBtools software (Chen et al., 2023).
5.6 Predicting cis-acting regulatory elements in the promoter regions of the SsCESA gene family
The promoter sequences of SsCESA genes, extending 2000 bp upstream from the translational initiation codon (ATG), were retrieved from the S. spontaneum L. genome. Hormonal responsiveness, stress responsiveness, and growth and development-related cis-acting elements within these promoter regions were identified using the PlantCARE database (https://bioinformatics.psb.ugent.be/webtools/plantcare/html/Menu.html) (Lescot et al., 2002).The SNBE site([TA]NN[CT][TCG]TNNNNNNNA[AC]GN[ACT][AT]), the W-box (TTGAC[C/T]), and the MYB binding site([T/C]AAC[T/G] or CAAC) were searched in the PlantPAN 4.0 (https://plantpan.itps.ncku.edu.tw/plantpan4/index.html) (Chow et al., 2024). Ultimately, Tbtools was employed for image visualization.
5.7 Investigation of SsCESA gene expression patterns in S. spontaneum using public RNA sequencing
Since the nomenclature of S. spontaneum genes in the v20190103 genome differs from that in the Sugarcane Genome Database (SGD https://sugarcane.gxu.edu.cn/), we aligned the protein sequences of SsCESA from the v20190103 genome in the SGD to obtain the corresponding gene IDs (Zhang et al., 2018). We retrieved the gene expression levels of SsCESA from three publicly available transcriptome datasets on the SGD website, specifically those related to leaf development, circadian rhythm, and growth and development. The average value of the three replicates in the transcriptome data was calculated. Then, the data were subjected to logarithmic transformation and normalization procedures. Finally, we utilized the heatmap function in TBtools for visualization (Chen et al., 2023).
5.8 RNA extraction and RT-qPCR
Total RNA of seedlings and tissues was extracted using Trizol (R401, Vazyme, China). First-strand cDNA was generated using the TransScript All-in-One First-Strand cDNA Synthesis SuperMix for qPCR, which includes a one-step gDNA removal process (R323, Vazyme, China). Real-time qPCR was conducted using SYBR Green (Q713, Vazyme, China) on a Multicolor Real-Time PCR Detection System (Roche 480). The GADPH gene was chosen as an internal reference gene for normalization, and three biological replicates were employed (Ling et al., 2014). Relative gene expression levels were determined using the 2^-ΔΔCt method. A list of primers used in the RT-qPCR is provided in Supplementary Table 11.
5.9 Subcellular localization
Transient expression assays in Nicotiana benthamiana leaves were conducted using the agroinfiltration method, as outlined in Sparkes et al. To confirm subcellular localization, co-localization experiments were performed using specific organelle markers, including mCherry-Cubilin (a membrane marker). Fluorescence signals from GFP and mCherry were detected and recorded using a confocal laser scanning microscope (GFP: excitation at 488 nm, emission detected between 493–598 nm; mCherry: excitation at 587 nm, emission detected between 600–650 nm). A list of primers used in the subcellular localization is provided in Supplementary Table 11.
5.10 Electrophoretic Mobility Shift Assay
The entire coding sequence of SsNST1, tagged with a His tag, was cloned into the Escherichia coli strain BL21 to generate the His-SsNST1 recombinant protein. General Biol Company (Anhui, China) synthesized the 5′ 6-FAM-labeled probes. EMSA was performed as previously described (Gao et al., 2019). The DNA signals were detected using a fluorescence imaging system (Bio-Rad, California, USA). The probe DNA sequences are provided in Supplementary Table 11.
Data availability statement
The original contributions presented in the study are included in the article/Supplementary Material. Further inquiries can be directed to the corresponding author.
Author contributions
XW: Data curation, Methodology, Writing – original draft, Software, Formal analysis. ZW: Data curation, Writing – original draft, Software, Investigation, Conceptualization. MY: Formal analysis, Supervision, Project administration, Writing – review & editing, Methodology. QC: Conceptualization, Project administration, Validation, Writing – review & editing, Formal analysis. JW: Formal analysis, Writing – review & editing, Supervision, Methodology, Data curation. LZ: Conceptualization, Writing – review & editing, Data curation, Investigation, Software. XZ: Supervision, Project administration, Writing – review & editing. LW: Writing – review & editing, Funding acquisition, Visualization, Project administration, Resources, Validation. LH: Writing – review & editing, Validation, Funding acquisition, Project administration, Visualization, Resources.
Funding
The author(s) declared that financial support was received for this work and/or its publication. This research was funded by the Guangxi Natural Science Foundation Project (grant numbers 2024GXNSFAA010171, 2022GXNSFAA035479, 2020GXNSFDA238027), Guangxi Science and Technology Support Initiative (Guike AD25069107), and the Department of Education of Guangxi Zhuang Autonomous Region.
Conflict of interest
The authors declare that the research was conducted in the absence of any commercial or financial relationships that could be construed as a potential conflict of interest.
Generative AI statement
The author(s) declare that no Generative AI was used in the creation of this manuscript.
Any alternative text (alt text) provided alongside figures in this article has been generated by Frontiers with the support of artificial intelligence and reasonable efforts have been made to ensure accuracy, including review by the authors wherever possible. If you identify any issues, please contact us.
Publisher’s note
All claims expressed in this article are solely those of the authors and do not necessarily represent those of their affiliated organizations, or those of the publisher, the editors and the reviewers. Any product that may be evaluated in this article, or claim that may be made by its manufacturer, is not guaranteed or endorsed by the publisher.
Supplementary material
The Supplementary Material for this article can be found online at: https://www.frontiersin.org/articles/10.3389/fpls.2025.1708654/full#supplementary-material
References
Ain, N. U., Haider, F. U., Fatima, M., Habiba., Zhou, Y., and Ming, R. (2022). Genetic Determinants of Biomass in C(4) Crops: Molecular and Agronomic Approaches to Increase Biomass for Biofuels. Front Plant Sci 13, 839588. doi: 10.3389/fpls.2022.839588
Appenzeller, L., Doblin, M., Barreiro, R., Wang, H., Niu, X., Kollipara, K., et al. (2004). Cellulose synthesis in maize: isolation and expression analysis of the cellulose synthase (CesA) gene family. Cellulose11, 287–299. doi: 10.1023/B:CELL.0000046417.84715.27
Bailey, T. L., Boden, M., Buske, F. A., Frith, M., Grant, C. E., Clementi, L., et al. (2009). MEME Suite: tools for motif discovery and searching. Nucleic Acids Res. 37, W202–W208. doi: 10.1093/nar/gkp335
Casu, R. E., Jarmey, J. M., Bonnett, G. D., and Manners, J. M. (2007). Identification of transcripts associated with cell wall metabolism and development in the stem of sugarcane by Affymetrix GeneChip Sugarcane Genome Array expression profiling. Funct Integr Genomics7, 153–167. doi: 10.1007/s10142-006-0038-z
Casu, R. E., Rae, A. L., Nielsen, J. M., Perroux, J. M., Bonnett, G. D., and Manners, J. M. (2015). Tissue-specific transcriptome analysis within the maturing sugarcane stalk reveals spatial regulation in the expression of cellulose synthase and sucrose transporter gene families. Plant Molecular Biology89, 607–628. doi: 10.1007/s11103-015-0388-9
Chen, Z., Hong, X., Zhang, H., Wang, Y., Li, X., Zhu, J.-K., et al. (2005). Disruption of the cellulose synthase gene, AtCesA8/IRX1, enhances drought and osmotic stress tolerance in Arabidopsis. Plant J. 43, 273–283. doi: 10.1111/j.1365-313X.2005.02452.x
Chen, F., Qiao, M. F., Chen, L., Liu, M., Luo, J. W., Gao, Y. N., et al. (2025). Dimerization among multiple NAC proteins mediates secondary cell wall cellulose biosynthesis in cotton fibers. Plant J. 121, e17223. doi: 10.1111/tpj.17223
Chen, C., Wu, Y., Li, J., Wang, X., Zeng, Z., Xu, J., et al. (2023). TBtools-II: A &x201c;one for all, all for one&x201d; bioinformatics platform for biological big-data mining. Mol. Plant 16, 1733–1742. doi: 10.1016/j.molp.2023.09.010
Chen, Y., Zhang, Q., Hu, W., Zhang, X., Wang, L., Hua, X., et al. (2017). Evolution and expression of the fructokinase gene family inSaccharum. BMC Genomics 18, 197. doi: 10.1186/s12864-017-3535-7
Chow, C.-N., Yang, C.-W., Wu, N.-Y., Wang, H.-T., Tseng, K.-C., Chiu, Y.-H., et al. (2024). PlantPAN 4.0: updated database for identifying conserved non-coding sequences and exploring dynamic transcriptional regulation in plant promoters. Nucleic Acids Res. 52, D1569–D1578. doi: 10.1093/nar/gkad945
Domon, J.-M., Baldwin, L., Acket, S., Caudeville, E., Arnoult, S., Zub, H., et al. (2013). Cell wall compositional modifications of Miscanthus ecotypes in response to cold acclimation. Phytochemistry 85, 51–61. doi: 10.1016/j.phytochem.2012.09.001
Dubos, C., Stracke, R., Grotewold, E., Weisshaar, B., Martin, C., and Lepiniec, L. (2010). MYB transcription factors in Arabidopsis. Trends Plant Sci. 15, 573–581. doi: 10.1016/j.tplants.2010.06.005
Finn, R. D., Coggill, P., Eberhardt, R. Y., Eddy, S. R., Mistry, J., Mitchell, A. L., et al. (2016). The Pfam protein families database: towards a more sustainable future. Nucleic Acids Res. 44, D279–D285. doi: 10.1093/nar/gkv1344
Gao, J., Yan, S., Yu, H., Zhan, M., Guan, K., Wang, Y., et al. (2019). Sweet sorghum (Sorghum bicolor L.) SbSTOP1 activates the transcription of a β-1,3-glucanase gene to reduce callose deposition under Al toxicity: A novel pathway for Al tolerance in plants. Biosci. Biotechnol. Biochem. 83, 446–455. doi: 10.1080/09168451.2018.1540290
Glassop, D., Perroux, J., and Rae, A. (2021). Differences in sugarcane stool branching within Saccharum spontaneum genotypes and compared toSaccharum officinarum and commercial varieties. Euphytica 217, 50. doi: 10.1007/s10681-021-02789-w
Goldberg, T., Hecht, M., Hamp, T., Karl, T., Yachdav, G., Ahmed, N., et al. (2014). LocTree3 prediction of localization. Nucleic Acids Res. 42, W350–W355. doi: 10.1093/nar/gku396
Grass Phylogeny Working, G., II (2012). New grass phylogeny resolves deep evolutionary relationships and discovers C4 origins. New Phytol. 193, 304–312. doi: 10.1111/j.1469-8137.2011.03972.x
Grivet, L. and Arruda, P. (2002). Sugarcane genomics: depicting the complex genome of an important tropical crop. Current Opinion in Plant Biology5, 122–127. doi: 10.1016/S1369-5266(02)00234-0
Guo, Y., Wen, L., Chen, J., Pan, G., Wu, Z., Li, Z., et al. (2021). Comparative transcriptomic analysis identifies key cellulose synthase genes (CESA) and cellulose synthase-like genes (CSL) in bast fiber development stage of flax (Linum usitatissimum L.). doi: 10.21203/rs.3.rs-424208/v1
Hans, M., Lugani, Y., Chandel, A. K., Rai, R., and Kumar, S. (2023). Production of first- and second-generation ethanol for use in alcohol-based hand sanitizers and disinfectants in India. Biomass Conversion and Biorefinery13, 7423–7440. doi: 10.1007/s13399-021-01553-3
Hosaka, G. K., Correr, F. H., da Silva, C. C., Sforça, D. A., Barreto, F. Z., Balsalobre, T. W. A., et al. (2021). Temporal Gene Expression in Apical Culms Shows Early Changes in Cell Wall Biosynthesis Genes in Sugarcane. Front Plant Sci 12, 736797. doi: 10.3389/fpls.2021.736797
Hu, H., Zhang, R., Tao, Z., Li, X., Li, Y., Huang, J., et al. (2018). Cellulose synthase mutants distinctively affect cell growth and cell wall integrity for plant biomass production in Arabidopsis. Plant Cell Physiol. 59, 1144–1157. doi: 10.1093/pcp/pcy050
Huang, J., Chen, F., Guo, Y., Gan, X., Yang, M., Zeng, W., et al. (2021). GhMYB7 promotes secondary wall cellulose deposition in cotton fibres by regulating GhCesA gene expression through three distinct cis-elements. New Phytol. 232, 1718–1737. doi: 10.1111/nph.17612
Huang, D., Wang, S., Zhang, B., Shang-Guan, K., Shi, Y., Zhang, D., et al. (2015). A gibberellin-mediated DELLA-NAC signaling cascade regulates cellulose synthesis in rice. Plant Cell 27, 1681–1696. doi: 10.1105/tpc.15.00015
Huang, H., Zhao, S., Chen, J., Li, T., Guo, G., Xu, M., et al. (2022). Genome-wide identification and functional analysis of Cellulose synthase gene superfamily in Fragaria vesca. Front. Plant Sci. 13. doi: 10.3389/fpls.2022.1044029
Kandel, R., Yang, X., Song, J., and Wang, J. (2018). Potentials, Challenges, and Genetic and Genomic Resources for Sugarcane Biomass Improvement. Front Plant Sci9, 151. doi: 10.3389/fpls.2018.00151
Kaur, S., Dhugga, K. S., Gill, K., and Singh, J. (2016). Novel Structural and Functional Motifs in cellulose synthase (CesA) Genes of Bread Wheat (Triticum aestivum, L.). PloS One 11, e0147046. doi: 10.1371/journal.pone.0147046
Kesten, C., Menna, A., and Sánchez-Rodríguez, C. (2017). Regulation of cellulose synthesis in response to stress. Curr. Opin. Plant Biol. 40, 106–113. doi: 10.1016/j.pbi.2017.08.010
Kim, W.-C., Ko, J.-H., Kim, J.-Y., Kim, J., Bae, H.-J., and Han, K.-H. (2013). MYB46 directly regulates the gene expression of secondary wall-associated cellulose synthases in Arabidopsis. Plant J. 73, 26–36. doi: 10.1111/j.1365-313x.2012.05124.x
Kumar, S., Stecher, G., and Tamura, K. (2016). MEGA7: molecular evolutionary genetics analysis version 7.0 for bigger datasets. Mol. Biol. Evol. 33, 1870–1874. doi: 10.1093/molbev/msw054
Kurek, I., Kawagoe, Y., Jacob-Wilk, D., Doblin, M., and Delmer, D. (2002). Dimerization of cotton fiber cellulose synthase catalytic subunits occurs via oxidation of the zinc-binding domains. Proc. Natl. Acad. Sci. U.S.A. 99, 11109–11114. doi: 10.1073/pnas.162077099
Lam, E., Shine, J., Jr., Da Silva, J., Lawton, M., Bonos, S., Calvino, M., et al. (2009). Improving sugarcane for biofuel: engineering for an even better feedstock. GCB Bioenergy 1, 251–255. doi: 10.1111/j.1757-1707.2009.01016.x
Leal, M. and Nogueira, L. (2014). The sustainability of sugarcane ethanol: the impacts of the production model. Chem. Eng. Trans. 37, 835–840. doi: 10.3303/CET1437140
Lescot, M., Déhais, P., Thijs, G., Marchal, K., Moreau, Y., Van De Peer, Y., et al. (2002). PlantCARE, a database of plant cis-acting regulatory elements and a portal to tools for in silico analysis of promoter sequences. Nucleic Acids Res. 30, 325–327. doi: 10.1093/nar/30.1.325
Letunic, I., Khedkar, S., and Bork, P. (2020). SMART: recent updates, new developments and status in 2020. Nucleic Acids Res. 49, D458–D460. doi: 10.1093/nar/gkaa937
Li, S., Bashline, L., Lei, L., and Gu, Y. (2014). Cellulose synthesis and its regulation. Arabidopsis Book 12, e0169. doi: 10.1199/tab.0169
Li, X., Li, Y., Wei, A., Wang, Z., Huang, H., Huang, Q., et al. (2023). Integrated transcriptomic and proteomic analyses of two sugarcane (Saccharum officinarum Linn.) varieties differing in their lodging tolerance. BMC Plant Biology23, 601. doi: 10.1186/s12870-023-04622-z
Li, Z., Hua, X., Zhong, W., Yuan, Y., Wang, Y., Wang, Z., et al. (2020). Genome-wide identification and expression profile analysis of WRKY family genes in the autopolyploid Saccharum spontaneum. Plant Cell Physiol. 61, 616–630. doi: 10.1093/pcp/pcz227
Li, P., Ponnala, L., Gandotra, N., Wang, L., Si, Y., Tausta, S. L., et al. (2010). The developmental dynamics of the maize leaf transcriptome. Nat. Genet. 42, 1060–1067. doi: 10.1038/ng.703
Li, S., Zhang, L., Wang, Y., Xu, F., Liu, M., Lin, P., et al. (2017). Knockdown of a cellulose synthase gene BoiCesA affects the leaf anatomy, cellulose content and salt tolerance in broccoli. Sci. Rep. 7, 41397. doi: 10.1038/srep41397
Ling, H., Wu, Q., Guo, J., Xu, L., and Que, Y. (2014). Comprehensive selection of reference genes for gene expression normalization in sugarcane by real time quantitative rt-PCR. PloS One 9, e97469. doi: 10.1371/journal.pone.0097469
Little, A., Schwerdt, J. G., Shirley, N. J., Khor, S. F., Neumann, K., O'Donovan, L. A., et al. (2018). Revised phylogeny of the cellulose synthase gene superfamily: insights into cell wall evolution. Plant Physiol. 177, 1124–1141. doi: 10.1104/pp.17.01718
Liu, X., Zhang, H., Zhang, W., Xu, W., Li, S., Chen, X., et al. (2022). Genome-wide bioinformatics analysis of Cellulose Synthase gene family in common bean (Phaseolus vulgaris L.) and the expression in the pod development. BMC Genomic Data 23, 9. doi: 10.1186/s12863-022-01026-0
Ma, X., Li, C., Huang, R., Zhang, K., Wang, Q., Fu, C., et al. (2021). Rice brittle culm19 encoding cellulose synthase subunit CESA4 causes dominant brittle phenotype but has no distinct influence on growth and grain yield. Rice 14, 95. doi: 10.1186/s12284-021-00536-2
McFarlane, H. E., Döring, A., and Persson, S. (2014). The cell biology of cellulose synthesis. Annu. Rev. Plant Biol. 65, 69–94. doi: 10.1146/annurev-arplant-050213-040240
McFarlane, H. E., Mutwil-Anderwald, D., Verbančič, J., Picard, K. L., Gookin, T. E., Froehlich, A., et al. (2021). A G protein-coupled receptor-like module regulates cellulose synthase secretion from the endomembrane system in Arabidopsis. Dev. Cell 56, 1484–1497.e1487. doi: 10.1016/j.devcel.2021.03.031
Mielke, S. and Gasperini, D. (2019). Interplay between plant cell walls and jasmonate production. Plant Cell Physiol. 60, 2629–2637. doi: 10.1093/pcp/pcz119
Ming, R., VanBuren, R., Wai, C. M., Tang, H., Schatz, M. C., Bowers, J. E., et al. (2015). The pineapple genome and the evolution of CAM photosynthesis. Nat. Genet. 47, 1435–1442. doi: 10.1038/ng.3435
Mitsuda, N., Iwase, A., Yamamoto, H., Yoshida, M., Seki, M., Shinozaki, K., et al. (2007). NAC transcription factors, NST1 and NST3, are key regulators of the formation of secondary walls in woody tissues of Arabidopsis. Plant Cell 19, 270–280. doi: 10.1105/tpc.106.047043
Mokshina, N., Gorshkova, T., and Deyholos, M. K. (2014). Chitinase-like (CTL) and cellulose synthase (CESA) gene expression in gelatinous-type cellulosic walls of flax (Linum usitatissimum L.) bast fibers. PloS One 9, e97949. doi: 10.1371/journal.pone.0097949
Nayeri, S., Baghban Kohnehrouz, B., Ahmadikhah, A., and Mahna, N. (2022). CRISPR/Cas9-mediated P-CR domain-specific engineering of CESA4 heterodimerization capacity alters cell wall architecture and improves saccharification efficiency in poplar. Plant Biotechnol. J. 20, 1197–1212. doi: 10.1111/pbi.13803
Niu, N., Zhang, Y., Li, S., Meng, X., Liu, M., Wang, H., et al. (2023). Genome-wide characterization of the cellulose synthase gene family in Ziziphus jujuba reveals its function in cellulose biosynthesis during fruit development. Int. J. Biol. Macromol 239, 124360. doi: 10.1016/j.ijbiomac.2023.124360
Nuruzzaman, M., Sharoni, A. M., and Kikuchi, S. (2013). Roles of NAC transcription factors in the regulation of biotic and abiotic stress responses in plants. Front. Microbiol. 4. doi: 10.3389/fmicb.2013.00248
Ohashi-Ito, K., Oda, Y., and Fukuda, H. (2010). Vascular-related nac-domain6 directly regulates the genes that govern programmed cell death and secondary wall formation during xylem differentiation. Plant Cell 22, 3461–3473. doi: 10.1105/tpc.110.075036
Pear, J. R., Kawagoe, Y., Schreckengost, W. E., Delmer, D. P., and Stalker, D. M. (1996). Higher plants contain homologs of the bacterial celA genes encoding the catalytic subunit of cellulose synthase. Proc. Natl. Acad. Sci. U.S.A. 93, 12637–12642. doi: 10.1073/pnas.93.22.12637
Persson, S., Paredez, A., Carroll, A., Palsdottir, H., Doblin, M., Poindexter, P., et al. (2007). Genetic evidence for three unique components in primary cell-wall cellulose synthase complexes in Arabidopsis. Proc. Natl. Acad. Sci. 104, 15566–15571. doi: 10.1073/pnas.0706592104
Polko, J. K. and Kieber, J. J. (2019). The regulation of cellulose biosynthesis in plants. Plant Cell 31, 282–296. doi: 10.1105/tpc.18.00760
Ranjan, S., Padhan, S. R., Kumar, S., Sow, S., Roy, D. K., Sahoo, R., et al. (2025). “Impact of climate change and abiotic stresses on food crop production,” in Climate-Smart Agricultural Technologies: Approaches for Field Crops Production Systems. Eds. Pramanick, B., Singh, S. V., Maitra, S., Celletti, S., and Hossain, A. (Springer Nature Singapore, Singapore), 71–88.
Richmond, T. (2000). Higher plant cellulose synthases. Genome Biol. 1, reviews3001.3001. doi: 10.1186/gb-2000-1-4-reviews3001
Ruprecht, C. and Persson, S. (2012). Co-expression of cell-wall related genes: new tools and insights. Front. Plant Sci. 3. doi: 10.3389/fpls.2012.00083
Rushton, D. L., Tripathi, P., Rabara, R. C., Lin, J., Ringler, P., Boken, A. K., et al. (2012). WRKY transcription factors: key components in abscisic acid signalling. Plant Biotechnol. J. 10, 2–11. doi: 10.1111/j.1467-7652.2011.00634.x
Salimi, M., El Idrissi, A., Channab, B.-E., Essamlali, Y., Firouzabadi, A. G., Beygi, M., et al. (2024). Cellulose-based controlled release fertilizers for sustainable agriculture: recent trends and future perspectives. Cellulose 31, 10679–10726. doi: 10.1007/s10570-024-06273-1
Shakoor, N., Nair, R., Crasta, O., Morris, G., Feltus, A., and Kresovich, S. (2014). A Sorghum bicolorexpression atlas reveals dynamic genotype-specific expression profiles for vegetative tissues of grain, sweet and bioenergy sorghums. BMC Plant Biol. 14, 35. doi: 10.1186/1471-2229-14-35
Sod, B., Xu, L., Liu, Y., He, F., Xu, Y., Li, M., et al. (2023). Genome-wide identification and expression analysis of the cesA/csl gene superfamily in alfalfa (Medicago sativa L.). Agriculture 13, 1658. doi: 10.3390/agriculture13091658
Son, S., Im, J. H., Ko, J.-H., and Han, K.-H. (2025). Editorial: Role of plant cell wall in biotic and abiotic stress resistance. Front. Plant Sci. 16. doi: 10.3389/fpls.2025.1617371
Tanaka, K., Murata, K., Yamazaki, M., Onosato, K., Miyao, A., and Hirochika, H. (2003). Three distinct rice cellulose synthase catalytic subunit genes required for cellulose synthesis in the secondary wall. Plant Physiol. 133, 73–83. doi: 10.1104/pp.103.022442
Taylor, N. G., Howells, R. M., Huttly, A. K., Vickers, K., and Turner, S. R. (2003). Interactions among three distinct CesA proteins essential for cellulose synthesis. Proc. Natl. Acad. Sci. 100, 1450–1455. doi: 10.1073/pnas.0337628100
Taylor-Teeples, M., Lin, L., De Lucas, M., Turco, G., Toal, T. W., Gaudinier, A., et al. (2015). An Arabidopsis gene regulatory network for secondary cell wall synthesis. Nature 517, 571–575. doi: 10.1038/nature14099
Turner, S. and Kumar, M. (2017). Cellulose synthase complex organization and cellulose microfibril structure. Philos. Trans. R. Soc. A: Mathematical Phys. Eng. Sci. 376, 20170048. doi: 10.1098/rsta.2017.0048
Turner, S. R. and Somerville, C. R. (1997). Collapsed xylem phenotype of Arabidopsis identifies mutants deficient in cellulose deposition in the secondary cell wall. Plant Cell 9, 689–701. doi: 10.1105/tpc.9.5.689
Wang, L., Guo, K., Li, Y., Tu, Y., Hu, H., Wang, B., et al. (2010). Expression profiling and integrative analysis of the CESA/CSL superfamily in rice. BMC Plant Biol. 10, 282. doi: 10.1186/1471-2229-10-282
Wang, C., Huang, A., He, W., Ou, Y., Lu, W., Lin, Y., et al. (2023). Genome-wide identification and expression analysis of cesA gene family in Corymbia citriodora. Forests 14, 618. doi: 10.3390/f14030618
Wang, D., Qin, Y., Fang, J., Yuan, S., Peng, L., Zhao, J., et al. (2016). A missense mutation in the zinc finger domain of osCESA7 deleteriously affects cellulose biosynthesis and plant growth in rice. PloS One 11, e0153993. doi: 10.1371/journal.pone.0153993
Wang, Y., Tang, H., DeBarry, J. D., Tan, X., Li, J., Wang, X., et al. (2012). MCScanX: a toolkit for detection and evolutionary analysis of gene synteny and collinearity. Nucleic Acids Res. 40, e49–e49. doi: 10.1093/nar/gkr1293
Wang, T., Zhang, J., and Huang, K. (2019). Generalized gene co-expression analysis via subspace clustering using low-rank representation. BMC Bioinf. 20, 196. doi: 10.1186/s12859-019-2733-5
Wei, K., Zhao, Y., Zhou, H., Jiang, C., Zhang, B., Zhou, Y., et al. (2019). PagMYB216 is involved in the regulation of cellulose synthesis in Populus. Mol. Breed. 39, 65. doi: 10.1007/s11032-019-0970-y
Woodger, F. J., Gubler, F., Pogson, B. J., and Jacobsen, J. V. (2003). A Mak-like kinase is a repressor of GAMYB in barley aleurone. Plant J. 33, 707–717. doi: 10.1046/j.1365-313X.2003.01663.x
Xu, W., Cheng, H., Zhu, S., Cheng, J., Ji, H., Zhang, B., et al. (2021). Functional understanding of secondary cell wall cellulose synthases in Populus trichocarpa via the Cas9/gRNA-induced gene knockouts. New Phytol. 231, 1478–1495. doi: 10.1111/nph.17338
Xu, Y., Hu, D., Hou, X., Shen, J., Liu, J., Cen, X., et al. (2020). OsTMF attenuates cold tolerance by affecting cell wall properties in rice. New Phytol. 227, 498–512. doi: 10.1111/nph.16549
Xu, S., Zhang, M., Ye, J., Hu, D., Zhang, Y., Li, Z., et al. (2023). Brittle culm 25, which encodes an UDP-xylose synthase, affects cell wall properties in rice. Crop J. 11, 733–743. doi: 10.1016/j.cj.2022.11.011
Yamaguchi-Shinozaki, K. and Shinozaki, K. (2005). Organization of cis-acting regulatory elements in osmotic- and cold-stress-responsive promoters. Trends Plant Sci. 10, 88–94. doi: 10.1016/j.tplants.2004.12.012
Ye, Y., Wang, S., Wu, K., Ren, Y., Jiang, H., Chen, J., et al. (2021). A semi-dominant mutation in OsCESA9 improves salt tolerance and favors field straw decay traits by altering cell wall properties in rice. Rice 14, 19. doi: 10.1186/s12284-021-00457-0
Yin, Q., Qin, W. Q., Zhou, Z. B., Wu, A. M., Deng, W., Li, Z. G., et al. (2024). Banana MaNAC1 activates secondary cell wall cellulose biosynthesis to enhance chilling resistance in fruit. Plant Biotechnol. J. 22, 413–426. doi: 10.1111/pbi.14195
Zeng, R., Li, Z., Shi, Y., Fu, D., Yin, P., Cheng, J., et al. (2021). Natural variation in a type-A response regulator confers maize chilling tolerance. Nat. Commun. 12, 4713. doi: 10.1038/s41467-021-25001-y
Zeng, X., Sheng, J., Zhu, F., Zhao, L., Hu, X., Zheng, X., et al. (2020). Differential expression patterns reveal the roles of cellulose synthase genes (CesAs) in primary and secondary cell wall biosynthesis in Miscanthus × giganteus. Ind. Crops Prod 145, 112129. doi: 10.1016/j.indcrop.2020.112129
Zhang, L., Gao, C., Gao, Y., Yang, H., Jia, M., Wang, X., et al. (2025a). New insights into plant cell wall functions. J. Genet. Genomics 52, 1308–1324. doi: 10.1016/j.jgg.2025.04.013
Zhang, Q., Hu, W., Zhu, F., Wang, L., Yu, Q., Ming, R., et al. (2016). Structure, phylogeny, allelic haplotypes and expression of sucrose transporter gene families inSaccharum. BMC Genomics 17, 88. doi: 10.1186/s12864-016-2419-6
Zhang, S., Jiang, Z., Chen, J., Han, Z., Chi, J., Li, X., et al. (2021a). The cellulose synthase (CesA) gene family in fourGossypiumspecies: phylogenetics, sequence variation and gene expression in relation to fiber quality in Upland cotton. Mol. Genet. Genomics 296, 355–368. doi: 10.1007/s00438-020-01758-7
Zhang, X., Li, H., Zhao, C., Wu, Y., and Lu, X. (2025b). ZmMYB92 modulates secondary wall cellulose synthesis in maize. Plant J. 122, e70296. doi: 10.1111/tpj.70296
Zhang, X., Xue, Y., Guan, Z., Zhou, C., Nie, Y., Men, S., et al. (2021b). Structural insights into homotrimeric assembly of cellulose synthase CesA7 from Gossypium hirsutum. Plant Biotechnol. J. 19, 1579–1587. doi: 10.1111/pbi.13571
Zhang, J., Zhang, X., Tang, H., Zhang, Q., Hua, X., Ma, X., et al. (2018). Allele-defined genome of the autopolyploid sugarcane Saccharum spontaneum L. Nat. Genet. 50, 1565–1573. doi: 10.1038/s41588-018-0237-2
Zhao, H., Li, Z., Wang, Y., Wang, J., Xiao, M., Liu, H., et al. (2022). Cellulose synthase-like protein OsCSLD4 plays an important role in the response of rice to salt stress by mediating abscisic acid biosynthesis to regulate osmotic stress tolerance. Plant Biotechnol. J. 20, 468–484. doi: 10.1111/pbi.13729
Zhong, R. and Ye, Z.-H. (2015). Secondary cell walls: biosynthesis, patterned deposition and transcriptional regulation. Plant Cell Physiol. 56, 195–214. doi: 10.1093/pcp/pcu140
Keywords: sugarcane, cell wall, cellulose synthase, gene family, phylogenetic analysis, stem
Citation: Wei X, Wei Z, Yang M, Chen Q, Wang J, Zhao L, Zhang X, Wang L and Hu L (2025) Genome-wide analysis of the cellulose synthase gene family in autopolyploid sugarcane (Saccharum spontaneum). Front. Plant Sci. 16:1708654. doi: 10.3389/fpls.2025.1708654
Received: 19 September 2025; Accepted: 18 November 2025; Revised: 10 November 2025;
Published: 09 December 2025.
Edited by:
Bingsong Zheng, Zhejiang Agriculture and Forestry University, ChinaReviewed by:
Zilin Wu, Guangdong Academy of Sciences, ChinaXiaoba Wu, Information and Communication Technologies Centre (CSIRO), Australia
Copyright © 2025 Wei, Wei, Yang, Chen, Wang, Zhao, Zhang, Wang and Hu. This is an open-access article distributed under the terms of the Creative Commons Attribution License (CC BY). The use, distribution or reproduction in other forums is permitted, provided the original author(s) and the copyright owner(s) are credited and that the original publication in this journal is cited, in accordance with accepted academic practice. No use, distribution or reproduction is permitted which does not comply with these terms.
*Correspondence: Lihua Hu, aHVsaWh1YUBneHUuZWR1LmNu