 Zengzhi Si
 Jiuting Guo
- Hebei Key Laboratory of Crop Stress Biology, Hebei Normal University of Science and Technology, Qinhuangdao, Hebei, China
The GATA transcription factors regulate plant growth, development, and stress responses, but our knowledge of their functions in sweetpotato and related Ipomoea species remains limited. Through analytical methods of bioinformatics, this study identified 410 GATA genes across seven sequenced Ipomoea species: sweetpotato (158), I. trifida (54), I. triloba (62), I. nil (39), I. purpurea (32), I. cairica (32), and I. aquatica (33). Phylogenetic analysis revealed that these GATA genes clustered into four distinct subfamilies (I-IV). Chromosomal mapping showed an uneven distribution pattern, with complete absence of GATA genes on certain chromosomes in each species. Duplication analysis indicated differential expansion mechanisms: tandem duplications primarily drove GATA gene expansion in I. triloba, I. trifida, and I. nil, whereas segmental duplications were predominant in sweetpotato and I. cairica. Promoter analysis identified multiple stress-responsive cis-regulatory elements, including ABRE, ARE, CGTCA-motif, GC-motif, LTR, MBS, TCA-element, TC-rich repeats, and TGACG-motif. Expression profiling under various stresses (salt, drought, Ceratocystis fimbriata and Ditylenchus destructor) detected 29–60 differentially expressed GATA genes (DEGs). Three representative DEGs (IbGATA33, IbGATA38, and IbGATA126) were validated by qRT-PCR, with results corroborating the transcriptome data. This study may contribute to further understanding of the evolution and function of GATA genes among the Ipomoea species, including sweetpotato.
1 Introduction
Plants undergo intricate biological processes throughout their life cycle, including seed germination, vegetative growth, reproductive development, and responses to stresses. These processes are precisely regulated by multi-layered molecular networks, in which transcription factors serve as central regulators of gene expression by specifically binding to promoter regions of target genes, thereby activating or suppressing downstream functional gene expression (Todeschini et al., 2014). Among transcriptional regulators, GATA-family transcription factors have been increasingly recognized as crucial molecular players that orchestrate diverse physiological processes in plants, including but not limited to growth regulation, developmental programming, and sophisticated stress adaptation responses (Schwechheimer et al., 2022).
GATA transcription factors are widely distributed across eukaryotes, including animals, plants, and fungi, and play pivotal roles in critical physiological processes (Zhao et al., 2023). In 1988, Evans et al. first identified GATA factor in chicken erythrocytes, demonstrating its role in hematopoiesis through regulation of globin gene expression (Evans et al., 1988). Subsequently, the first plant GATA gene NTL1, involved in nitrogen metabolism, was cloned from tobacco (Daniel-Vedele and Caboche, 1993). Thereafter, extensive research has revealed the crucial involvement of GATA transcription factors in modulating plant growth, development, and abiotic stress tolerance mechanisms.
In Arabidopsis thaliana, GATA2 transcription factor orchestrates photomorphogenesis and serves as a critical component in light signaling pathways (Luo et al., 2010); ectopic overexpression of AtGNC or AtCGA1 significantly enhances chloroplast biogenesis in both hypocotyl cortex and root pericycle cells of Arabidopsis (Zhang et al., 2020). In rice, NECK LEAF 1, a GATA type transcription factor, modulates organogenesis by regulating the expression of multiple regulatory genes during reproductive development (Wang et al., 2009); OsGATA12 overexpression restricts leaf and tiller development, thereby affecting yield-related characteristics (Lu et al., 2017); and OsGATA7 coordinates brassinosteroid-mediated architectural modifications that influence both grain morphology and yield parameters (Zhang et al., 2018). In wheat, functional characterization reveals that TaGATA1 positively regulates wheat resistance to Rhizoctonia cerealis, as evidenced by enhanced disease tolerance in overexpression lines and increased susceptibility in silenced plants (Wei et al., 2023). Additionally, heterologous expression of soybean GmGATA58 in Arabidopsis enhances leaf chlorophyll accumulation while simultaneously inhibiting plant growth and reducing yield (Zhang et al., 2020); transgenic overexpression of SlGATA17 in tomato enhances drought tolerance through modulation of phenylpropanoid biosynthesis pathway activity (Zhao et al., 2021b); IbGATA24 overexpression in sweetpotato plants establishes a molecular module with COP9-5a to coordinately enhance abiotic stress tolerance against both water deficit and high salinity conditions (Zhu et al., 2022).
GATA transcription factors derive their nomenclature from their conserved ability to recognize and bind the canonical (T/A)GATA(A/G) consensus sequence within promoter regions of target genes (Omichinski et al., 1993). These transcription factors contain a characteristic type-IV zinc finger domain featuring the conserved CX2CX17−20CX2C motif, with an adjacent basic region that mediates DNA binding (Reyes et al., 2004). A conserved GATA-type zinc finger domain containing 17–18 residues in the binding loop is characteristic of animal and fungal GATA transcription factors, whereas plant GATA factors typically exhibit an extended loop of 17–20 residues (Reyes et al., 2004; Park et al., 2006; Gupta et al., 2017). Systematic analysis of conserved structural motifs and phylogenetic relationships divides plant GATA transcription factors into four evolutionarily distinct classes (Reyes et al., 2004).
Given the importance of the GATA transcription factors in plants, they have been characterized across diverse plant lineages, including 29 in Arabidopsis (Reyes et al., 2004), 28 in rice (Reyes et al., 2004), 79 in wheat (Feng et al., 2022), 88 in tetraploid potato (Zhang et al., 2024), 38 in poplar (Zhao et al., 2023), 24 in melon (Zheng et al., 2024b), 24 in onion (Bose et al., 2025), and so on. As discussed above, the number of GATA genes varied greatly in the genomes of different species. Additionally, cross-species comparative genomics approaches have been conducted, for instance, in five Solanaceae species (Lycium barbarum, Solanum lycopersicum, Capsicum annuum, Solanum tuberosum, and Solanum melongena) (Zhang et al., 2023), in seven Orchidaceae species (Phalaenopsis equestris, Cymbidium goeringii, C. ensifolium, Dendrobium catenatum, D. chrysotoxum, D. nobile, and Gastrodia elata) (Zheng et al., 2024c), and in seven Populus species (P. tremuloides, P. tremula, P. tremula x alba, P. pruinosa, P. euphratica, P. trichocarpa and P. deltoides) (Kim et al., 2021b). These investigations systematically characterize GATA gene functions across phylogenetically diverse species, establishing both fundamental evolutionary insights and practical genetic reservoirs for plant enhancement programs targeting yield improvement and environmental stress adaptation.
Ipomoea, the most species-rich genus in the Convolvulaceae family, comprises approximately 600–700 species with a cosmopolitan distribution (Austin et al., 2015). This taxon holds significant economic value across agricultural, pastoral, and industrial sectors (Liu, 2011). Taking sweetpotato as an example, as the seventh most important crop worldwide, it serves as both an indispensable food and feed crop and a primary industrial raw material for energy production (Liu, 2011; 2017). Despite the importance of GATA transcription factors and Ipomoea species, comparative analyses of these factors across Ipomoea species remain limited.
This study conducted a genome-wide comparative analysis of the GATA gene family in seven Ipomoea species. A total of 158, 54, 62, 39, 32, 32 and 33 GATA genes were identified from sweetpotato (I. batatas), I. trifida, I. triloba, I. nil, I. purpurea, I. cairica and I. aquatica, respectively. An extensive characterization of the GATA gene family was performed, including analyses of gene structure, conserved protein motifs, phylogenetic relationships, chromosomal localization, gene duplication events, syntenic relationships, and evolutionary selection pressure (Ka/Ks ratios). Subsequently, tissue-specific and stress-responsive RNA-seq datasets were employed to analyze the expression patterns of these genes. The results revealed that 98 differentially expressed genes (DEGs) in sweetpotato, and three of them were subsequently validated through quantitative reverse-transcription PCR (qRT-PCR). This study provides fundamental genomic insights into Ipomoea GATA gene functions, establishing a crucial knowledge base for sequential investigations of their biological roles while facilitating molecular breeding applications in sweetpotato improvement programs.
2 Results
2.1 Identification of the GATA genes in the seven Ipomoea species
Genome-wide analysis identified 410 GATA genes across seven Ipomoea species: 158 in sweetpotato (IbGATA1-158), 54 in I. trifida (ItfGATA1-54), 62 in I. triloba (ItbGATA1-62), 39 in I. nil (InGATA1-39), 32 each in I. purpurea (IpGATA1-32) and I. cairica (IcGATA1-32), and 33 in I. aquatica (IaGATA1-33), representing 0.09%, 0.12%, 0.13%, 0.09%, 0.10%, 0.08%, and 0.06% of their respective genomes (Supplementary File 1: Supplementary Table S1). Comparative analysis revealed that the average protein length was 301.26 amino acids (range: 95–992 aa), with I. cairica showing the longest average (341.44 aa; range: 143–851 aa), followed by I. purpurea (336.06 aa; 151–930 aa), I. aquatica (327.79 aa; 148–543 aa), I. trifida (310.89 aa; 133–540 aa), I. triloba (302.35 aa; 95–540 aa), I. nil (290.97 aa; 139–535 aa), and sweetpotato (279.36 aa; 134–992 aa). Exon analysis showed an average of 4.16 exons per gene (range: 1-21), with I. cairica again having the highest average (4.62), followed by I. purpurea (4.56), I. triloba (4.53), I. nil (4.41), I. trifida (4.22), I. aquatica (4.09), and sweetpotato (3.77) (Supplementary File 1: Supplementary Table S1). The physicochemical characterization of Ipomoea GATA transcription factors revealed an average molecular weight of 32,968.81 Da (range: 10,952.43-107,174.11 Da), with isoelectric points averaging 7.60 (range: 4.67-10.80) and hydropathicity values averaging -0.64 (range: -1.20 to -0.24). Subcellular localization predictions indicated predominant nuclear localization (329 proteins, 80.24%), with minority distributions in chloroplasts (64, 15.60%), cytoplasm (9, 2.20%), and mitochondria (4, 0.98%). Singular instances were predicted for cytoplasmplasm, endoplasmic reticulum, extracellular space, and peroxisomes (Supplementary File 1: Supplementary Table S1).
2.2 Phylogenetic analysis of the Ipomoea GATA genes
To elucidate the phylogenetic relationships of GATA genes in Ipomoea species, we constructed a phylogenetic tree using aligned protein sequences from 408 Ipomoea GATA genes (after excluding two problematic sweetpotato genes, IbGATA10 and IbGATA19) and 29 Arabidopsis thaliana reference genes (Figure 1). The 437 analyzed genes clustered into four distinct groups (I-IV), with group I being predominant (208 genes, 47.60%), followed by group II (101, 23.11%), group III (88, 20.14%), and group IV (40, 9.15%). Species-specific distribution patterns revealed consistent grouping tendencies: sweetpotato (156 genes) showed 48.08% in group I, 25.64% in II, 18.59% in III, and 7.69% in IV; I. trifida (54 genes) distributed as 50.00%, 16.67%, 24.07%, and 9.26%; I. triloba (62 genes) as 46.77%, 17.74%, 27.42%, and 8.06%; I. nil (39 genes) as 46.15%, 17.95%, 20.51%, and 15.38%; while I. purpurea, I. cairica (each 32 genes), and I. aquatica (33 genes) exhibited similar distributions ranging 45.45-46.88% in group I, 24.24-25.00% in II, 18.18-18.75% in III, and 7.69-12.12% in IV.
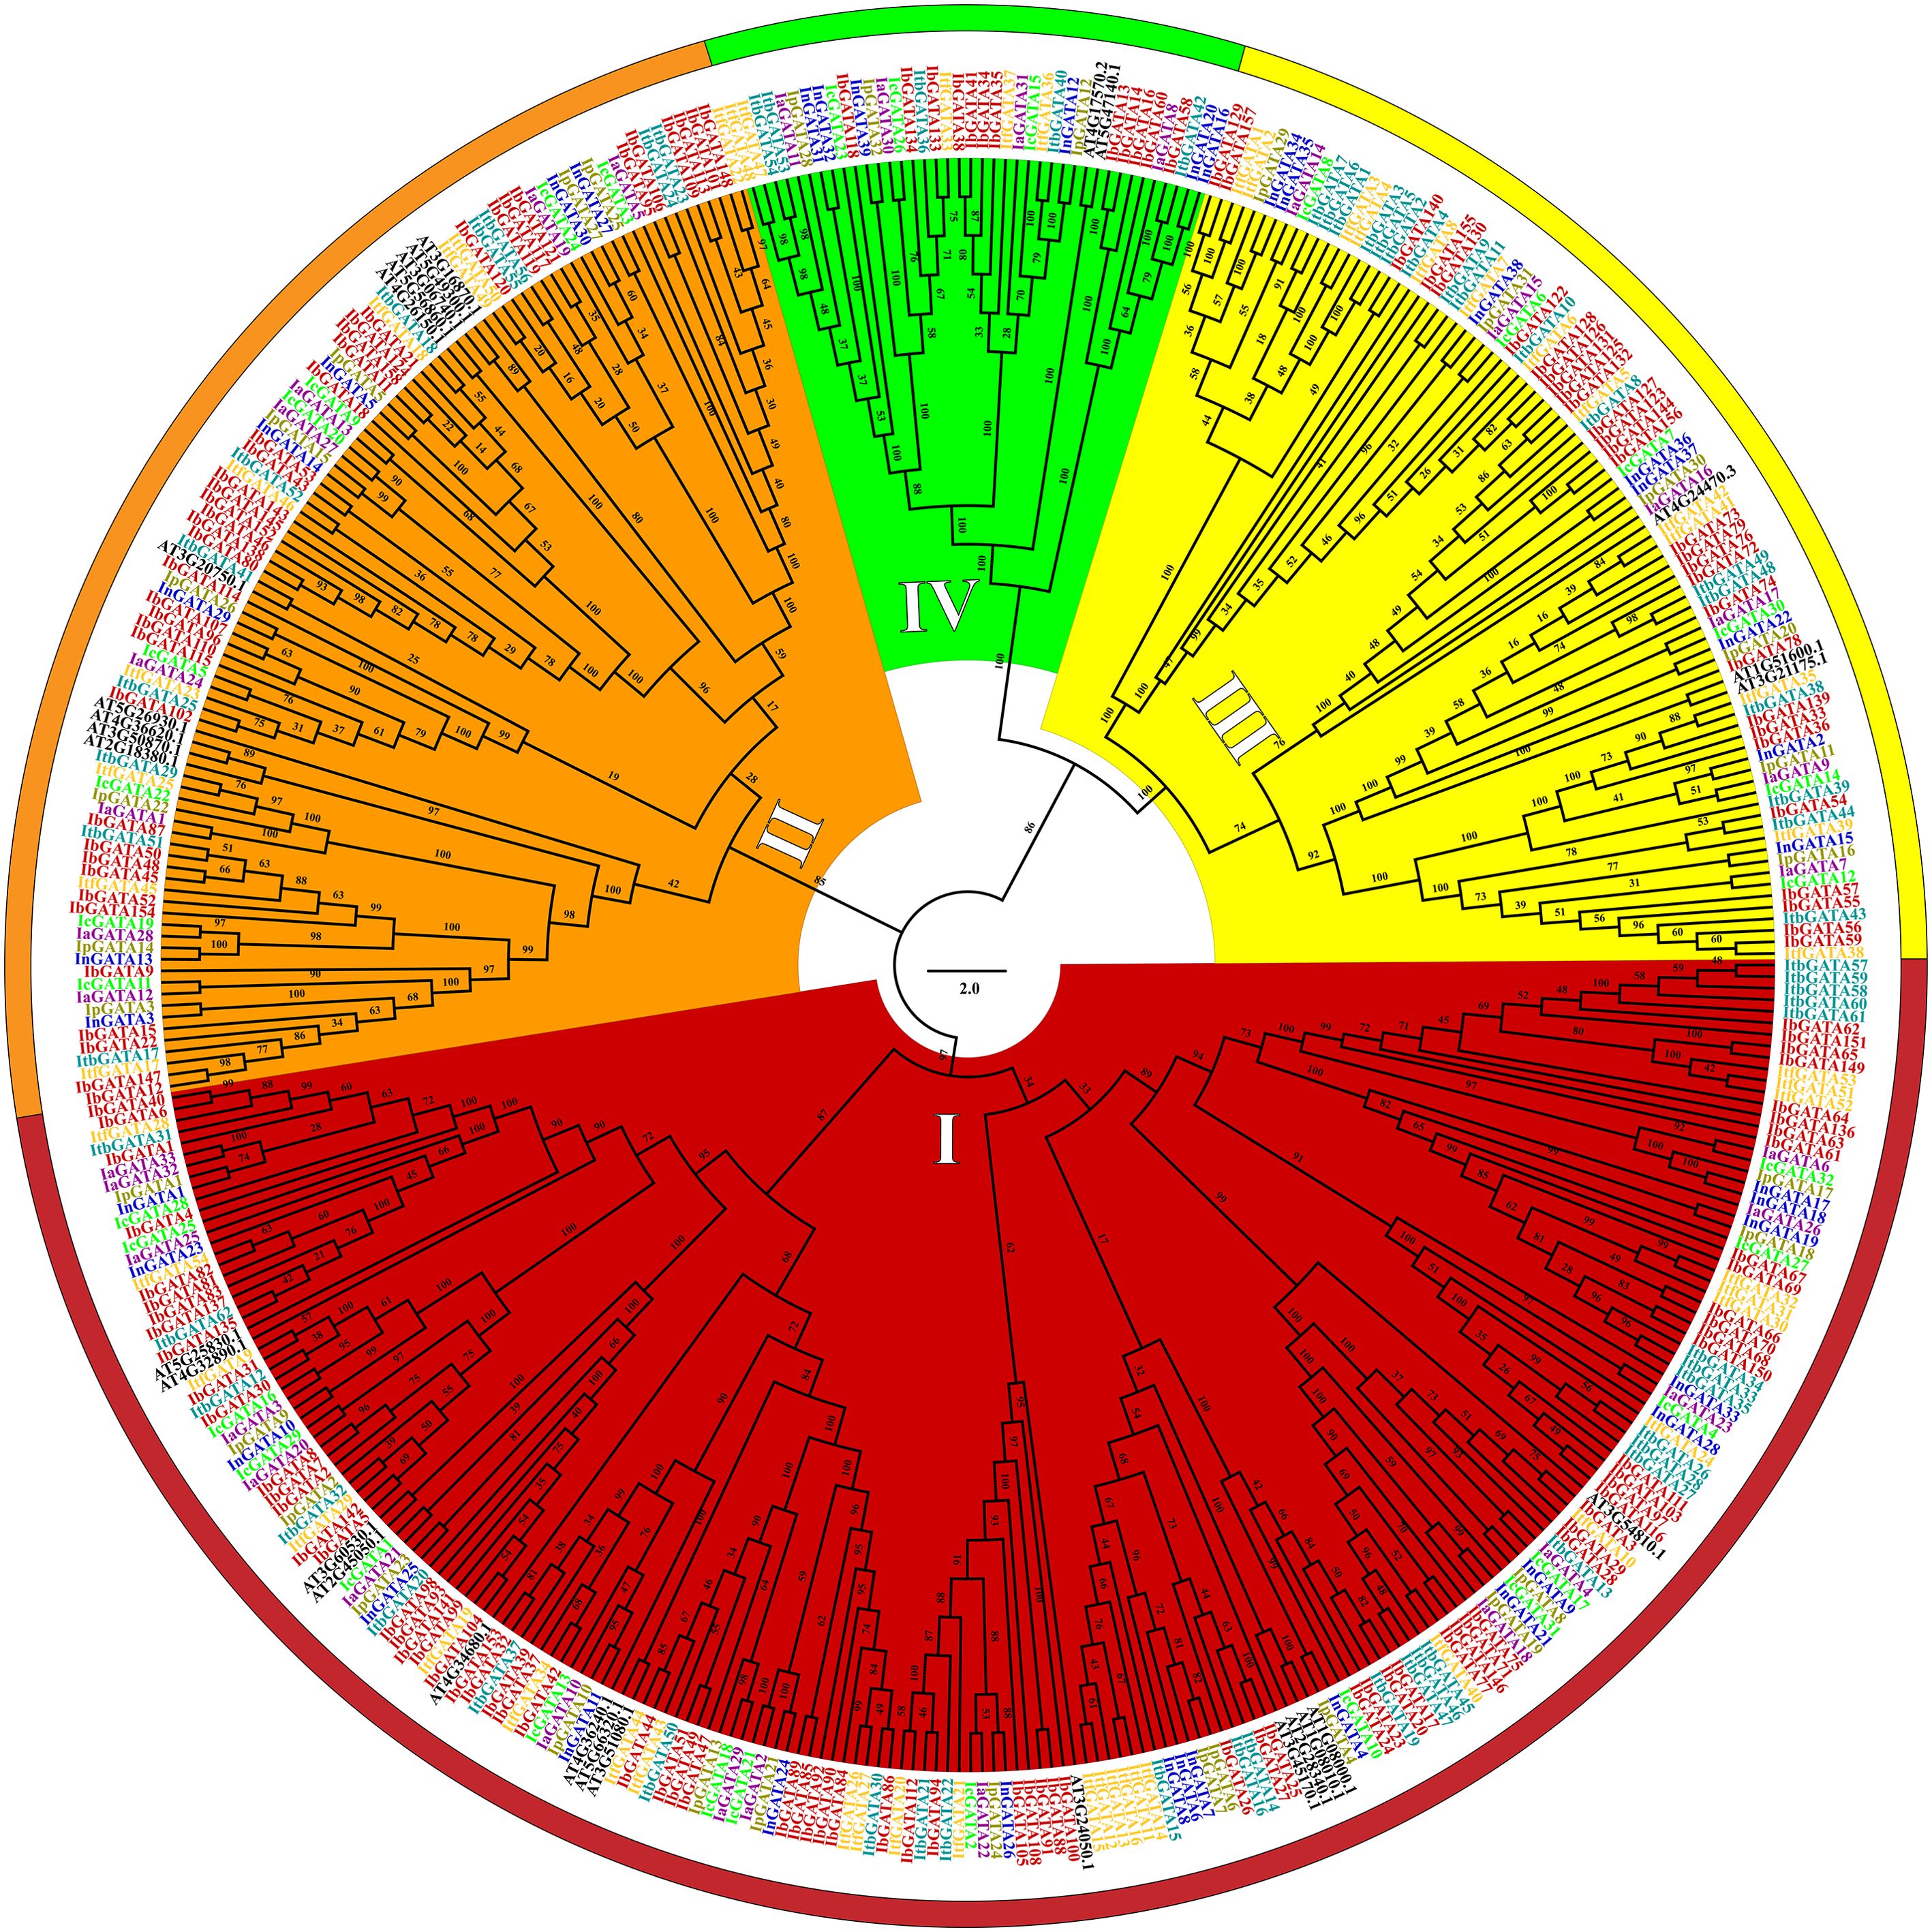
Figure 1. Phylogenetic tree of the GATA genes in sweetpotato, I. trifida, I. triloba, I. nil, I. purpurea, I. cairica, I. aquatica, and Arabidopsis. The GATA gene names of Sweetpotato, I. trifida, I. triloba, I. nil, I. purpurea, I. cairica, I. aquatica, and Arabidopsis were colored red, orange, teal, blue, brass, green, purple and black, respectively. Red, orange, yellow, and green represent the phylogenetic group I, II, III, and IV, respectively.
2.3 Conserved motifs and structures of the Ipomoea GATA genes
To characterize GATA proteins in Ipomoea species, we analyzed their conserved domain sequences, revealing a type IV zinc finger motif (C-X2-C-X18/20-C-X2-C) similar to other plants (Supplementary File 2: Supplementary Figure S1). Group I, II, and IV proteins share a C-X2-C-X18-C-X2-C pattern, while class III uniquely possesses a C-X2-C-X20-C-X2-C variant (Supplementary File 2: Supplementary Figure S1). Beyond conserved cysteines, this domain exhibits multiple conserved residues potentially involved in cis-element recognition, along with group-specific amino acid variations that may reflect functional divergence (Figure 2). Structural analysis confirmed the conserved architecture of four β sheets and one α helix in Ipomoea GATA domains, consistent with Arabidopsis findings (Figure 2).
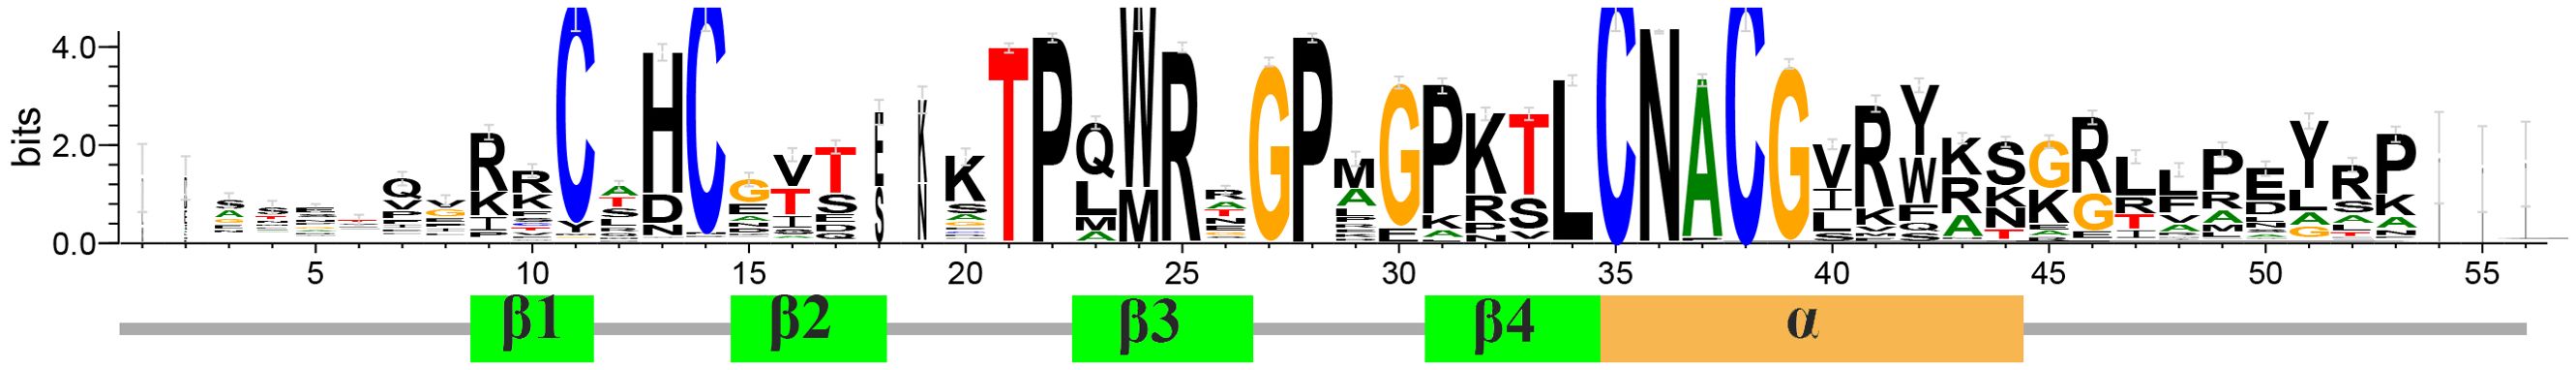
Figure 2. Logo plot and secondary structure annotation of the conserved GATA domain sequences.
2.4 Structural and motif analysis of GATA genes in Ipomoea species
In Ipomoea GATA proteins, 20 distinct motifs were identified, with motif-1 (GATA domain) being the most prevalent (403 proteins, 98.77%) and conserved (Figure 3; Supplementary File 3: Supplementary Figure S2). Subsequent motifs showed decreasing frequencies: motif 7 (46.81%), motif 3 (44.61%), motif 5 (43.63%), motif 14 (32.60%), and motif 10 (32.11%). Phylogenetically related groups shared conserved motif patterns (Supplementary File 3: Supplementary Figure S2). Most GATA genes contained multiple exons (minimum one intron), with Groups I and II averaging 2.7 and 2.6 exons respectively. Group I predominantly contained 2-exon genes (43.81%), while Group II favored 3-exon configurations (45.41%). In contrast, Groups III and IV exhibited substantially higher exon counts (averaging 8.2 and 6.2 respectively), with 7-exon (42.35%) and 8-exon (50.00%) architectures being most common in each group (Figure 3; Supplementary File 1: Supplementary Table S1). Motif annotation revealed that most motifs lacked significant functional annotation, with three notable exceptions: motif 1 was identified as the GATA domain, motif 2 as the CCT motif, and motif 4 as the TIFY domain (Supplementary File 4: Supplementary Table S2).
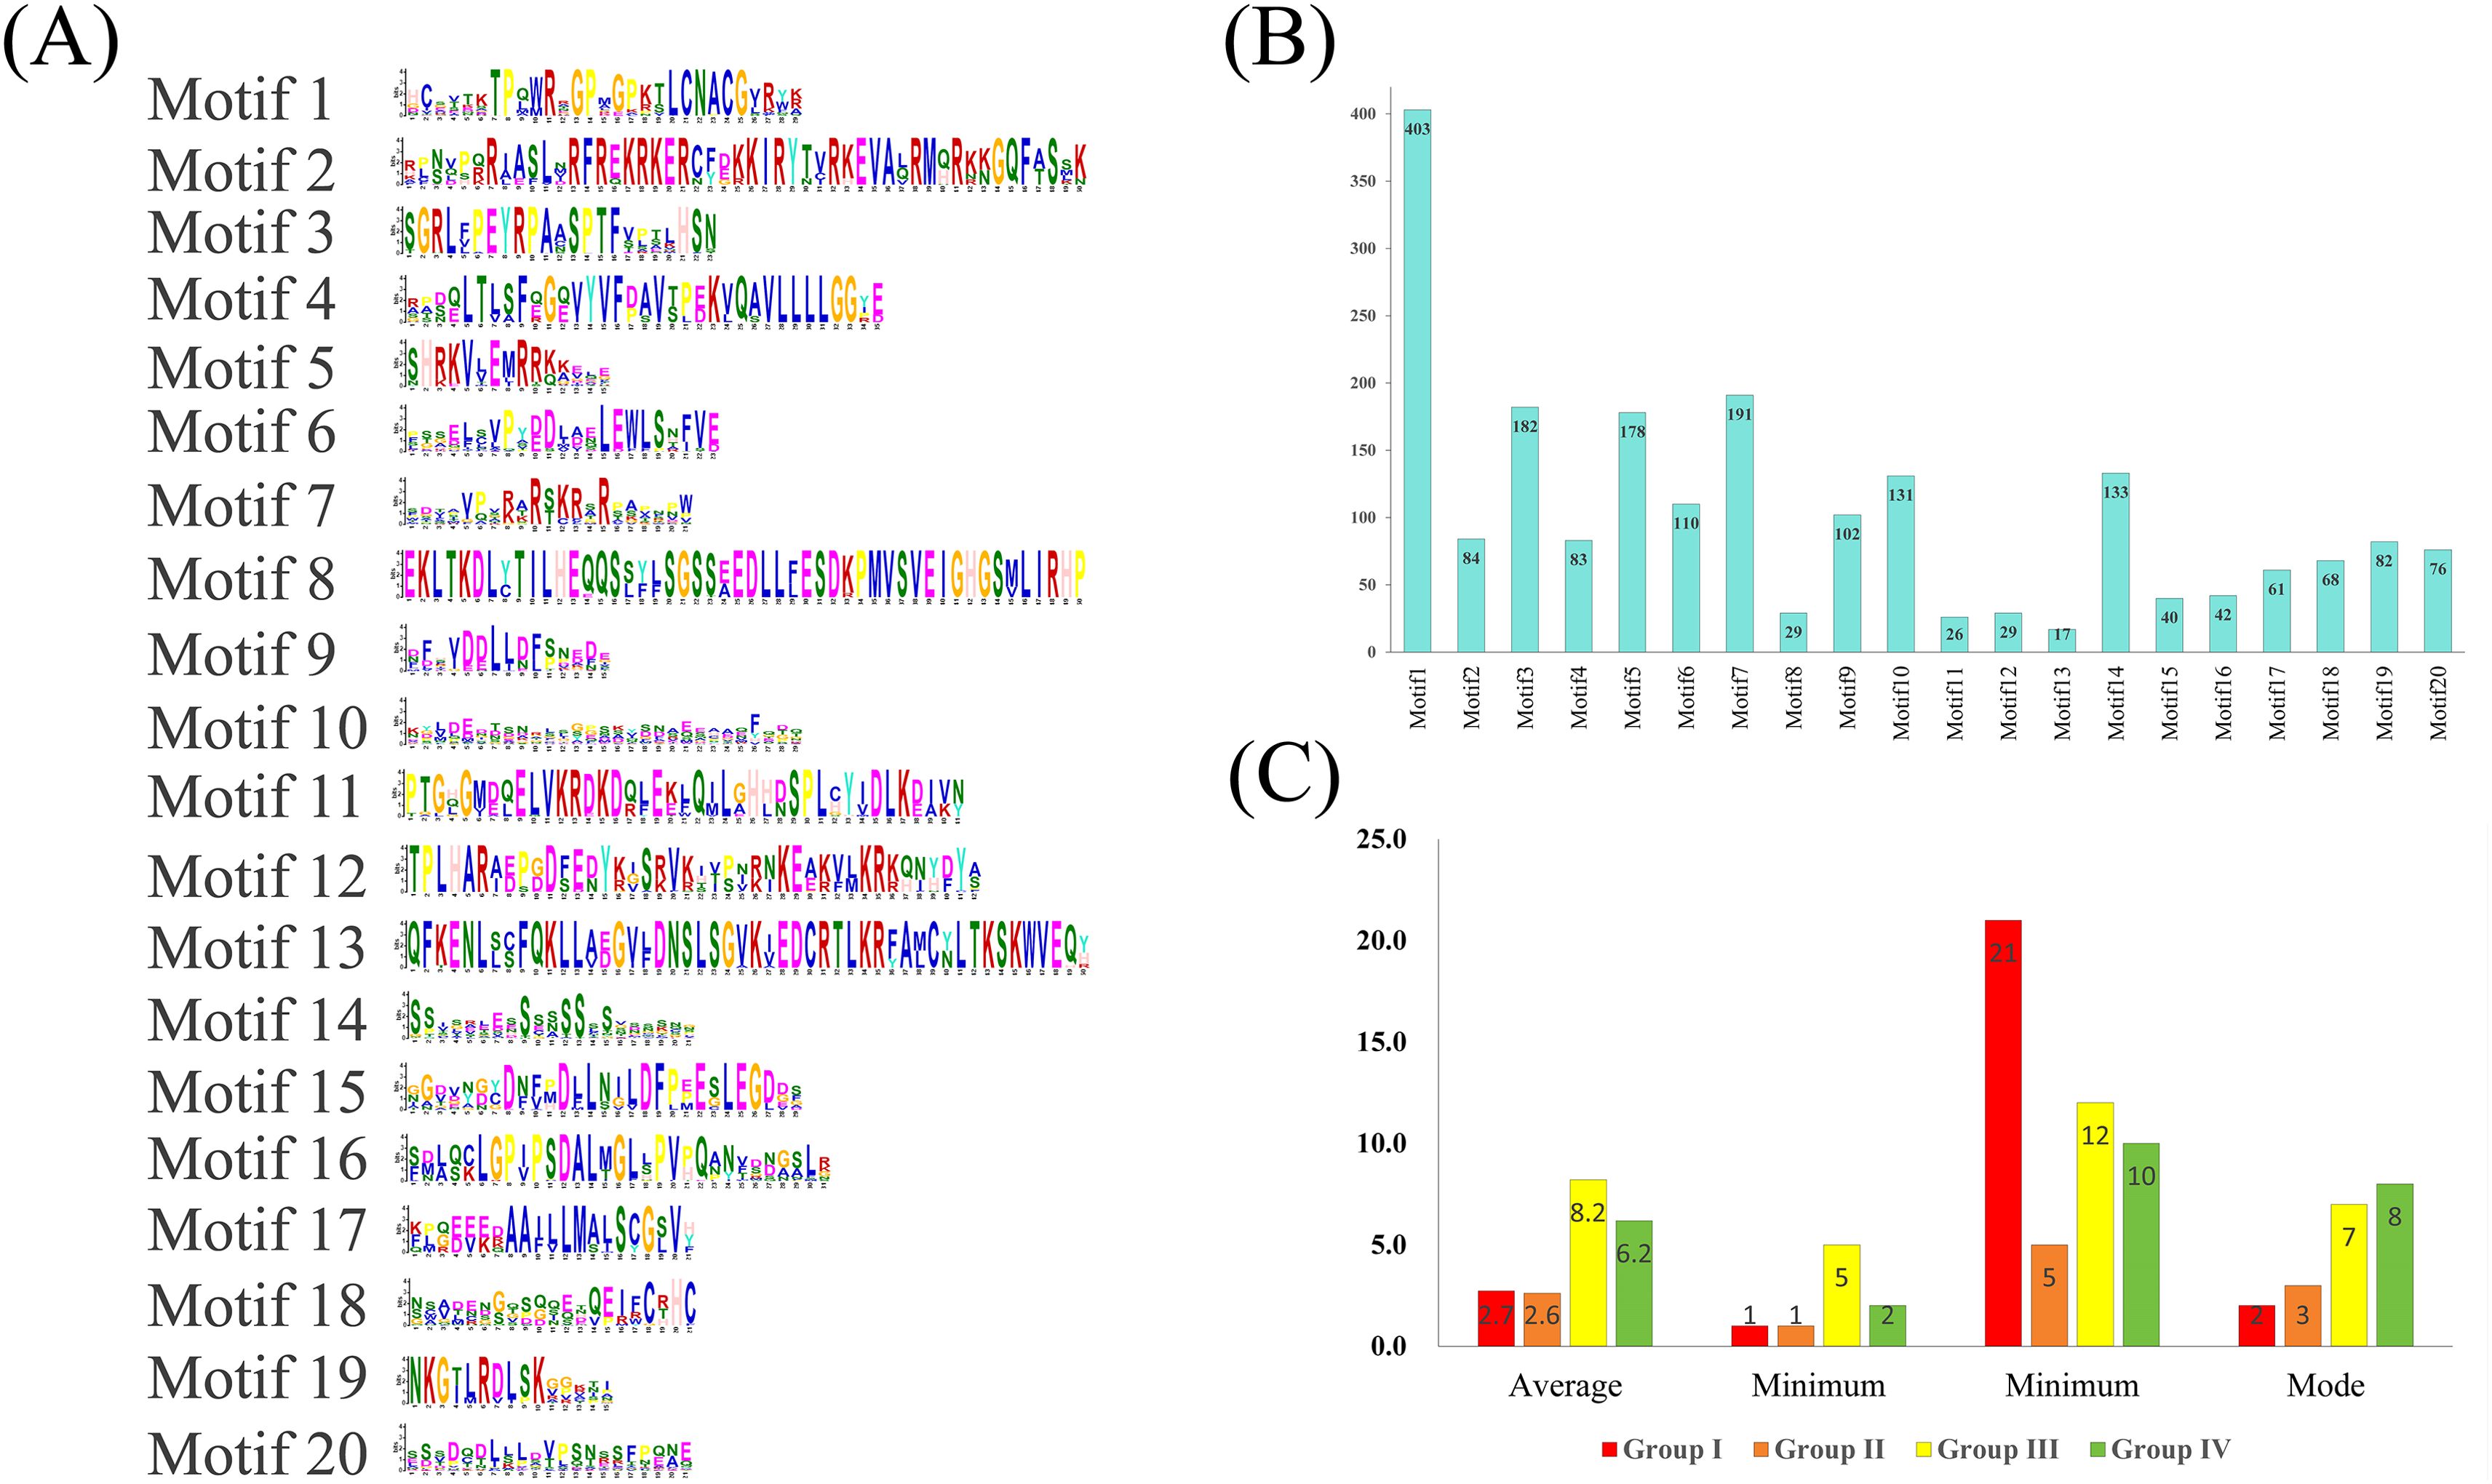
Figure 3. Structural characterization of Ipomoea GATA proteins. (A) Distribution of 20 conserved motifs (numbered 1-20) across protein sequences. (B) Frequency analysis of motif occurrence in protein sequences. (C) Exon architecture statistics (mean, range, and mode) across phylogenetic groups.
2.5 Chromosomal location analysis of the Ipomoea GATA genes
All Ipomoea GATA genes were successfully mapped across the chromosomes of seven Ipomoea species, with the exception of 24 IbGATAs and 3 IaGATAs located in unassembled scaffolds (Figure 4). The chromosomal distribution of these genes showed significant variation. In sweet potato (Ipomoea batatas), for example, chromosomes IbChr12b, IbChr12a, IbChr4a, IbChr2c, IbChr12c, IbChr12d, and IbChr14f contained 6, 5, 4, 4, 4, 4, and 4 IbGATAs respectively. In contrast, no IbGATAs were detected on multiple chromosomes including IbChr3a, IbChr3b, IbChr5b, IbChr8b, IbChr15b, IbChr6c, IbChr15d, and several chromosomes from the e and f series (IbChr1e to IbChr15f, excluding those already mentioned). This uneven distribution pattern was similarly observed in other Ipomoea species (Figure 4).
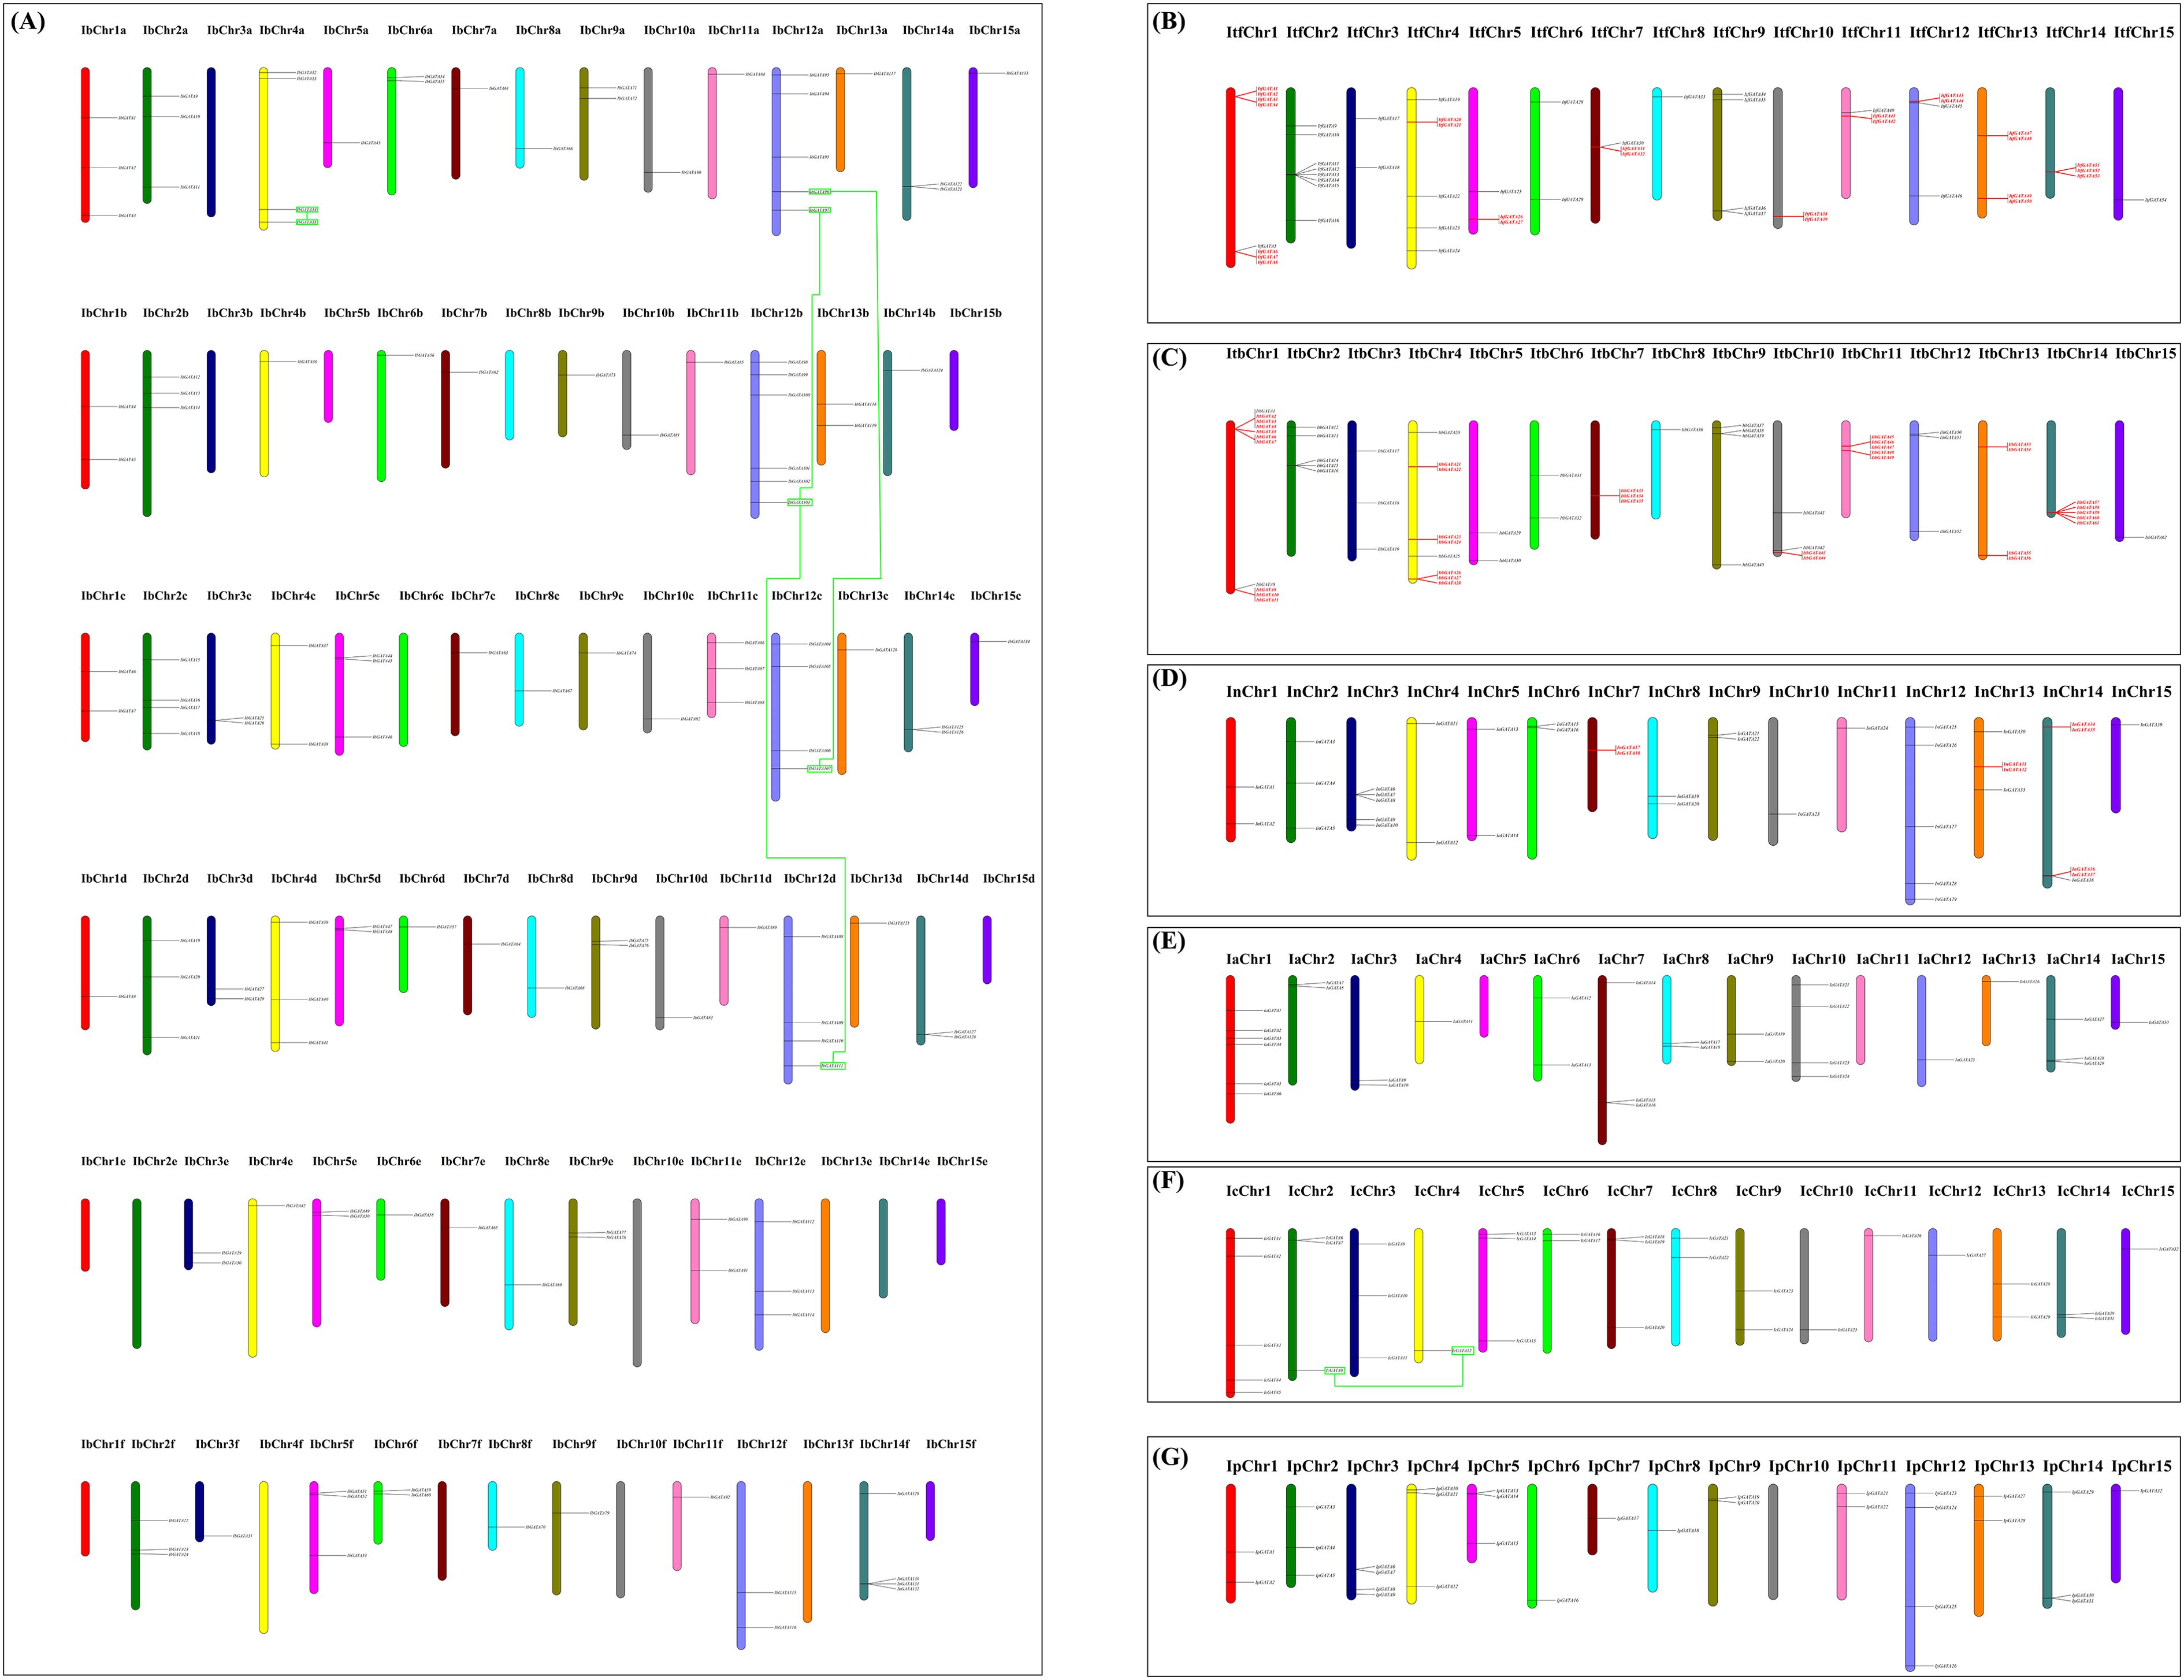
Figure 4. Distribution of GATA genes across the chromosomes of seven Ipomoea species. (A) Sweetpotato; (B) I. trifida; (C) I. triloba; (D) I. nil.; (E) I. purpurea; (F) I. cairica; (G) I. aquatica. The red color indicates the tandemly duplicated GATA genes; the green rectangular boxes connected by green lines indicates the segmentally duplicated GATA genes.
2.6 Duplication pattern analysis of the Ipomoea GATA genes
To investigate the evolutionary patterns of Ipomoea GATA genes, we analyzed gene duplication events using MCScanX software (Figure 4; Supplementary File 5: Supplementary Table S3). The analysis revealed tandem duplications in three species: 21 gene pairs in I. triloba, 15 in I. trifida, and 4 in I. nil, with no tandem duplications detected in other Ipomoea species. Segmentally duplicated GATA genes were found only in sweetpotato (4 pairs) and I. cairica (1 pair). Phylogenetic classification showed these duplicated genes distributed across four groups: 21 pairs (2 segmental, 19 tandem) in group I, 4 pairs (1 segmental, 3 tandem) in group II, 16 pairs (1 segmental, 15 tandem) in group III, and 4 pairs (1 segmental, 3 tandem) in group IV (Figure 4; Supplementary File 5: Supplementary Table S3).
2.7 Syntenic analysis of GATA genes in the genomes of the seven Ipomoea species
To determine the evolutionary mechanism of Ipomoea GATA genes, comparative synteny maps of the seven Ipomoea species were constructed (Figure 5). A total of 321 Ipomoea GATA genes (124 IbGATAs, 35 ItfGATAs, 37 ItbGATAs, 32 InGATAs, 31 IpGATAs, 32 IcGATAs, and 30 IaGATAs) that formed 2104 ortholog pairs were detected in the seven Ipomoea species (Figure 5; Supplementary File 6: Supplementary Table S4). Of these ortholog pairs, sweetpotato and I. cairica harbored the most ortholog GATA gene pairs (226 pairs), followed by sweetpotato and I. aquatica (214 pairs), sweetpotato and I. purpurea (196 pairs), sweetpotato and I. trifida (190 pairs), sweetpotato and I. triloba (185 pairs), sweetpotato and I. nil (169 pairs), I. trifida and I. cairica (128 pairs), and the others (50–66 pairs). The ortholog GATA genes were distributed in all of the subfamilies (group I-IV) (Supplementary File 6: Supplementary Table S4). In most cases (1759 of 2104, 83.60%), the two of ortholog GATA genes were from the same subfamily (Supplementary File 6: Supplementary Table S4).
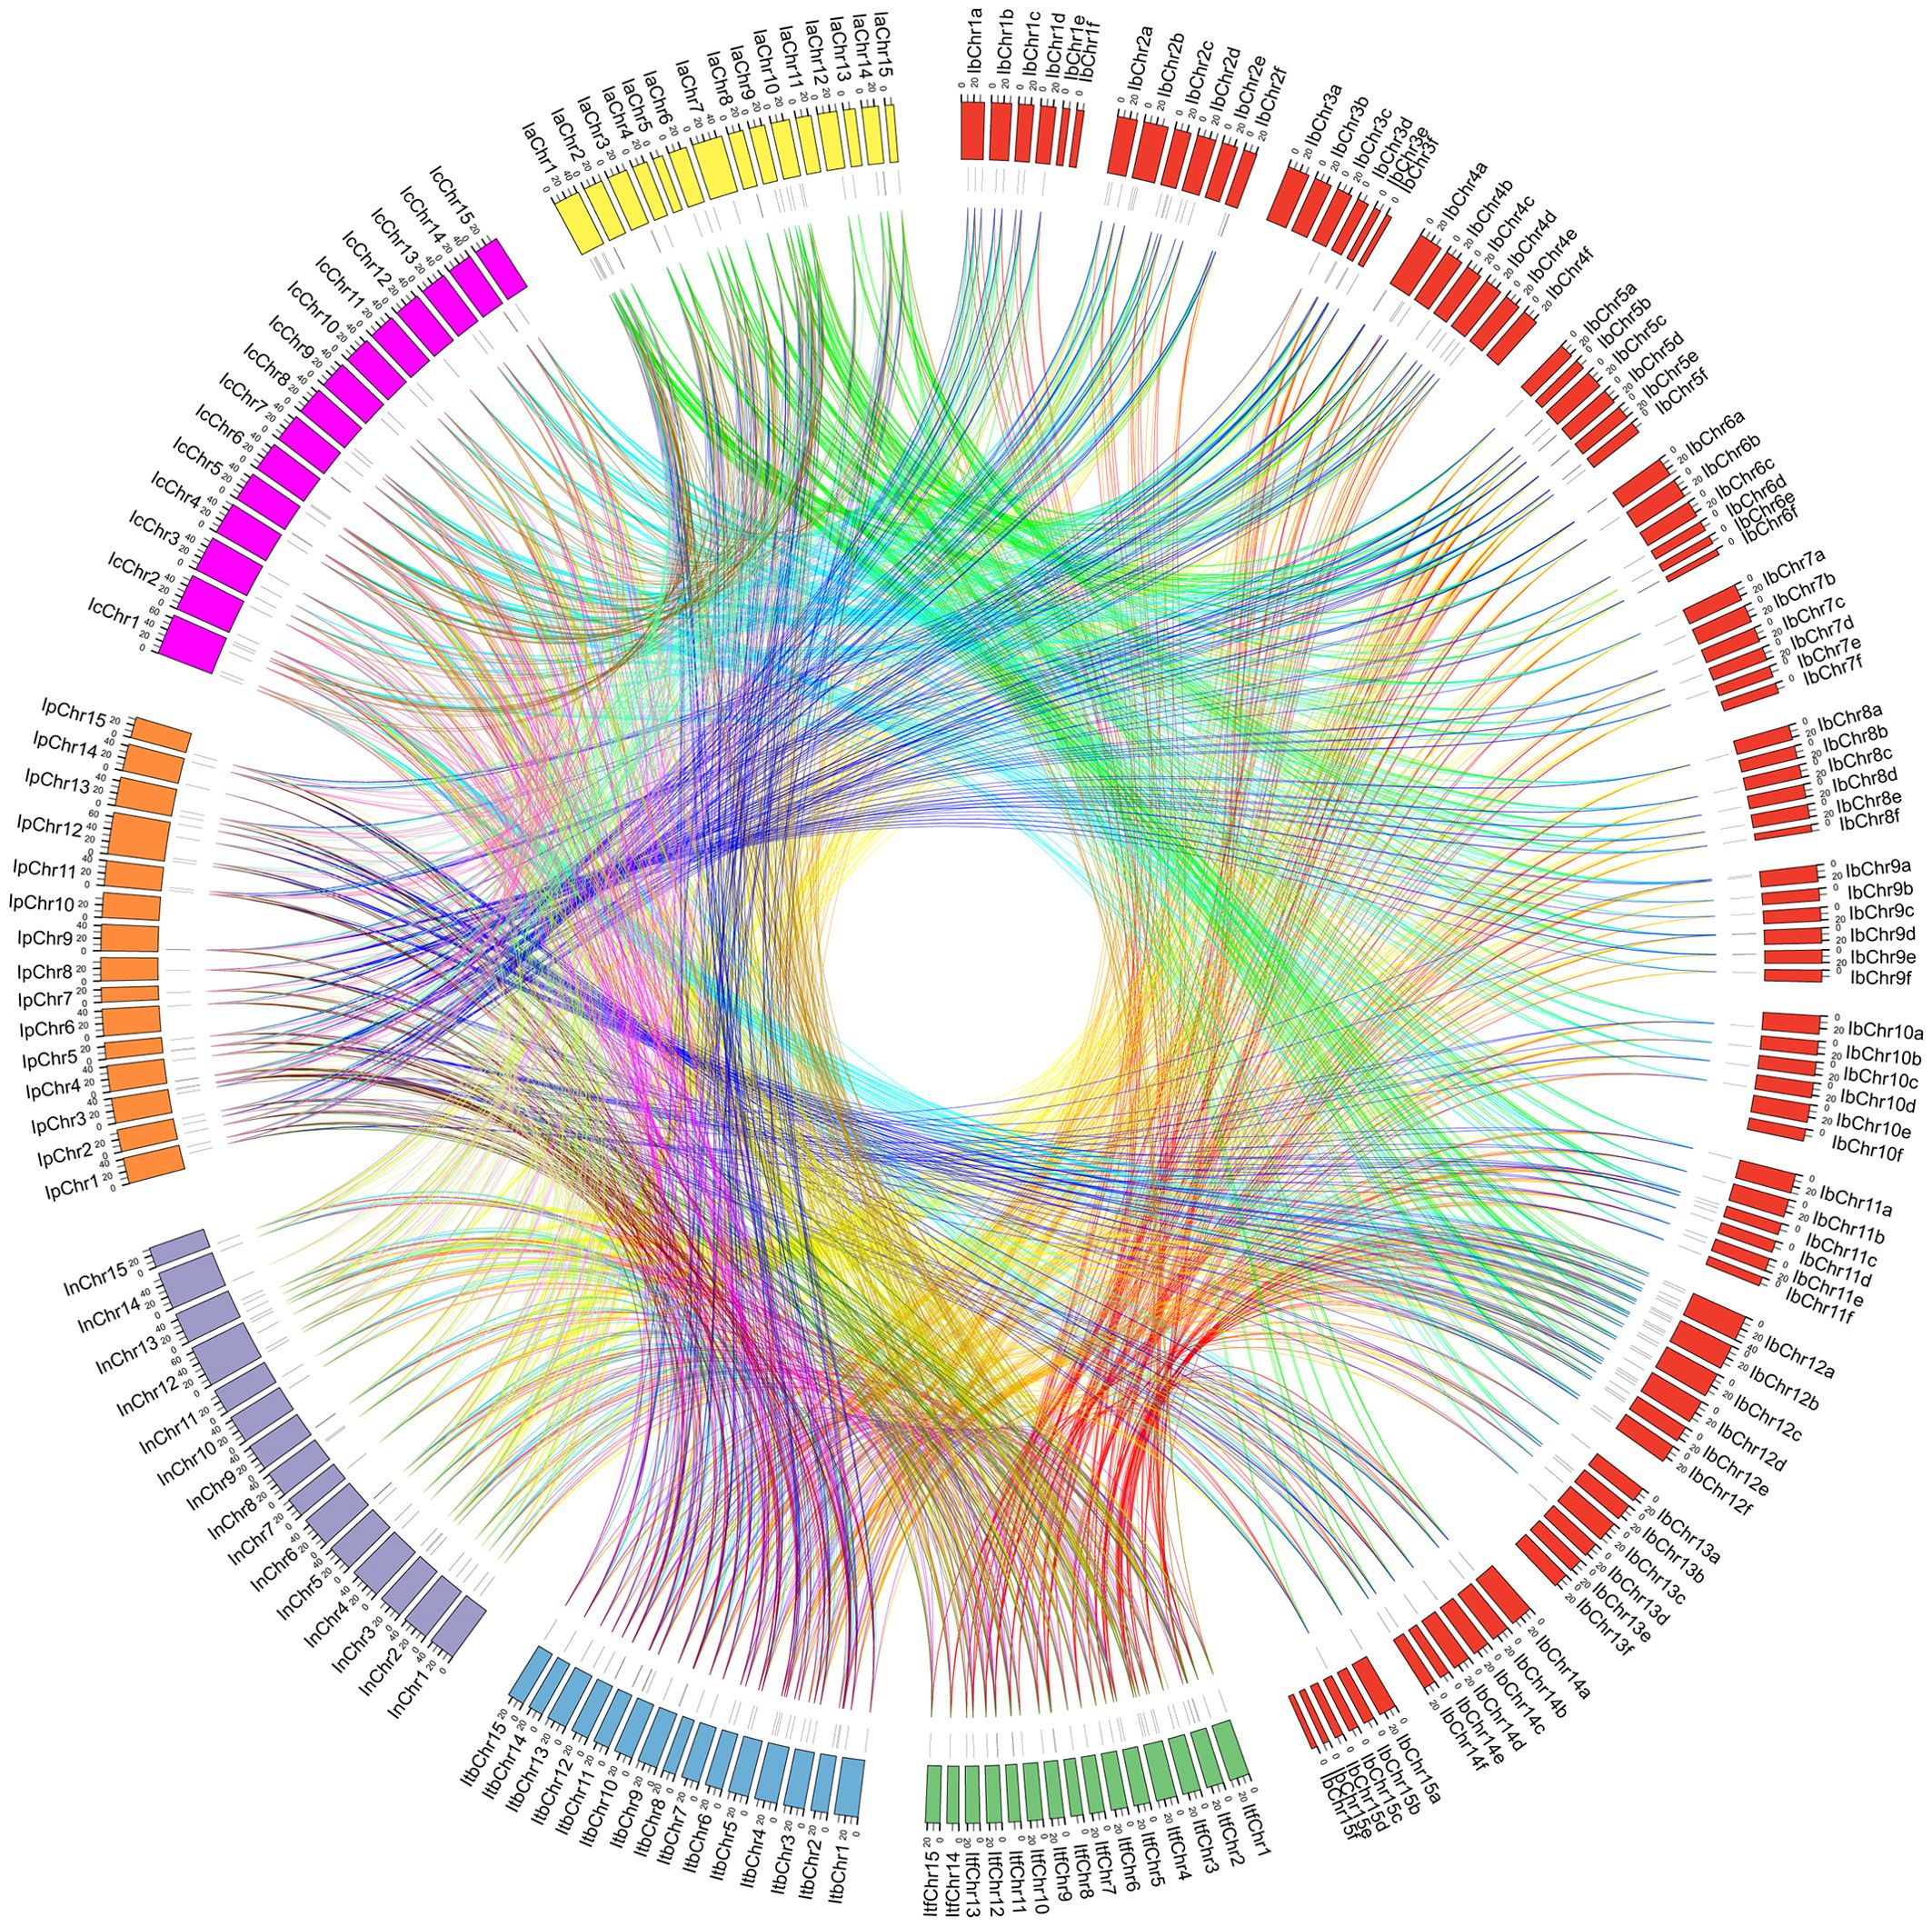
Figure 5. Syntenic analyses of GATA genes in the genomes of Ipomoea species. Chromosomal distribution in the seven Ipomoea species. The outer circle represents the haploid chromosomes of sweet potato (I. batatas) (red), I. trifida (green), I. triloba (cornflower blue), I. nil (medium purple), I. purpurea (orange), I. cairica (magenta) and I. aquatica (yellow), respectively. The second circle (black) represents the matches of GATA genes with the genome of the Ipomoea species. Colorful lines show the collinear GATA gene pairs in the whole genome of the Ipomoea species.
A total of 199 GATA genes (79 from sweet potato, 20 from I. trifida, 20 from I. triloba, 20 from I. nil, 20 from I. purpurea, 20 from I. cairica, and 20 from I. aquatica) were identified as orthologous gene pairs among Ipomoea species (Figure 6; Supplementary File 7: Supplementary Table S5). Among these, 84 genes (42.21%) belonged to phylogenetic group I, 59 (29.65%) to group II, 48 (24.12%) to group III, and 8 (4.02%) to group IV (Supplementary File 7: Supplementary Table S5). Of the 79 sweet potato GATA genes, 17 originated from sub-genome A, 11 from B, 16 from C, 14 from D, 10 from E, and 11 from F (Figure 6; Supplementary File 7: Supplementary Table S5).
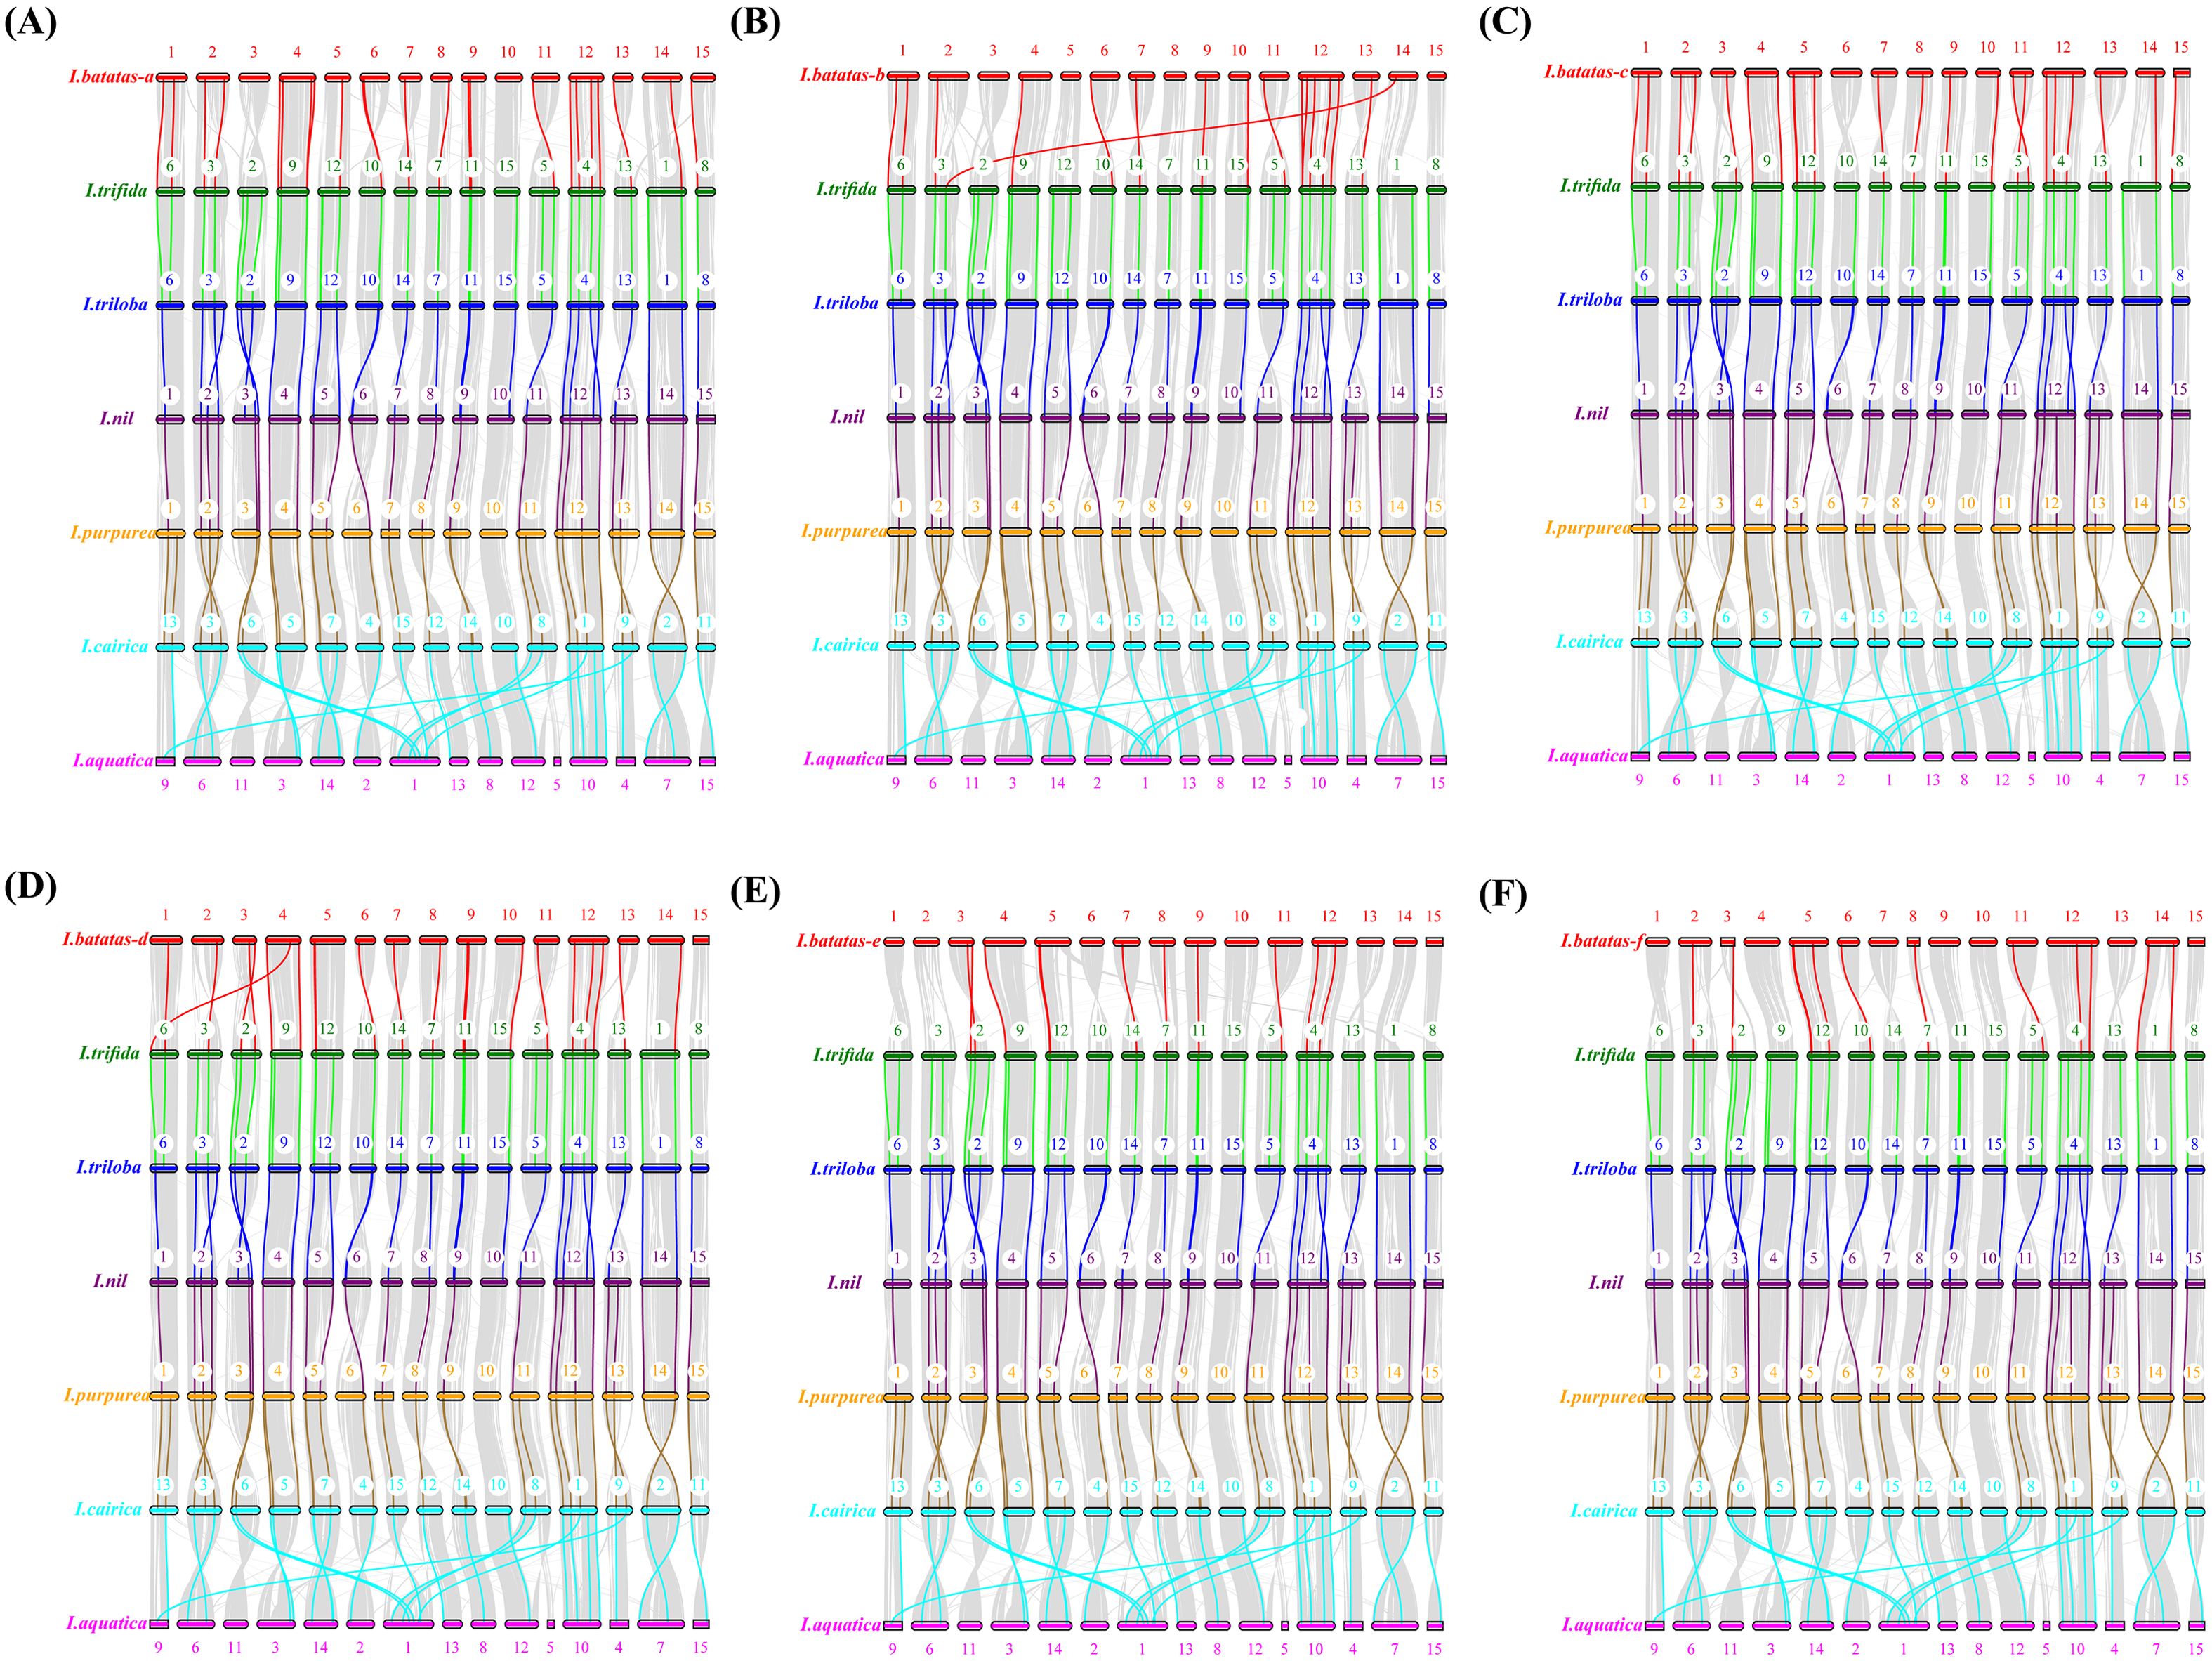
Figure 6. Schematic representation of syntenic genes among sweet potato (I. batatas), I. trifida, I. triloba, I. nil, I. purpurea, I. cairica and I. aquatica. (A–F) Schematic representation of syntenic genes among (A–F) sub-genome of sweetpotato, I. trifida, I. triloba, I. nil, I. purpurea, I. cairica and I. aquatica, respectively. The chromosomes of the seven Ipomoea species were reordered through collinearity for observation. The chromosomes of sweetpotato, I. trifida, I. triloba, and I. nil were colored with red, green, blue, purple, orange, cyan, and pink, respectively. Gray lines connect matched gene pairs, with GATA gene pairs highlighted in red, green, blue, purple, orange, and cyan, respectively.
2.8 Ka/Ks analysis of duplicated and syntenic Ipomoea GATA genes
To detect whether duplicate and syntenic GATA genes were under positive selection, Ka/Ks analysis was performed (Supplementary File 8: Supplementary Table S6). A total of 2149 gene pairs (5 segmental duplicated pairs, 40 segmental duplicated pairs, and 2104 collinear gene pairs) were analyzed, with Ka/Ks ratios successfully calculated for 1804 (83.94%) of them (Supplementary File 8: Supplementary Table S6). All duplicated and syntenic GATA genes, except for one tandem duplicated gene pair from I. trifida (ItfGATA20-ItfGATA21, Ka/Ks = 1.01), showed Ka/Ks ratios below one, suggesting that most had undergone purifying selection.
2.9 Stress-related regulatory elements analysis in promoter regions of the Ipomoea GATA genes
The 1,500 bp upstream regulatory regions of all Ipomoea GATA genes were used to explore stress-related regulatory elements. Various elements were detected. In this present investigation, ABRE, ARE, CGTCA-motif, GC-motif, LTR, MBS, TCA-element, TC-rich repeats, TGACG-motif were calculated (Supplementary File 9: Supplementary Figure S3). A total of 3552 elements in 398 Ipomoea GATA genes’ promoter regions were detected (Supplementary File 10: Supplementary Table S7). Of them, the largest one was ABRE (#819), followed by ARE (#758), TGACG-motif (#461), CGTCA-motif (#461), MBS (#341), TCA-element (#250), LTR (#216), GC-motif (#111), and TC-rich repeats (#105). The average investigated cis-element number of the Ipomoea GATA is 8.87 (Table 1). When compared the average investigated cis-element number of the phylogenetic group, group II was the largest (10.00), followed by group I (8.85), III (8.52), and IV (7.08). The average ABRE, CGTCA-motif, GC-motif, MBS, and TGACG-motif in the group II Ipomoea GATA genes’ promoter region were relatively larger than that in other groups (Table 1).
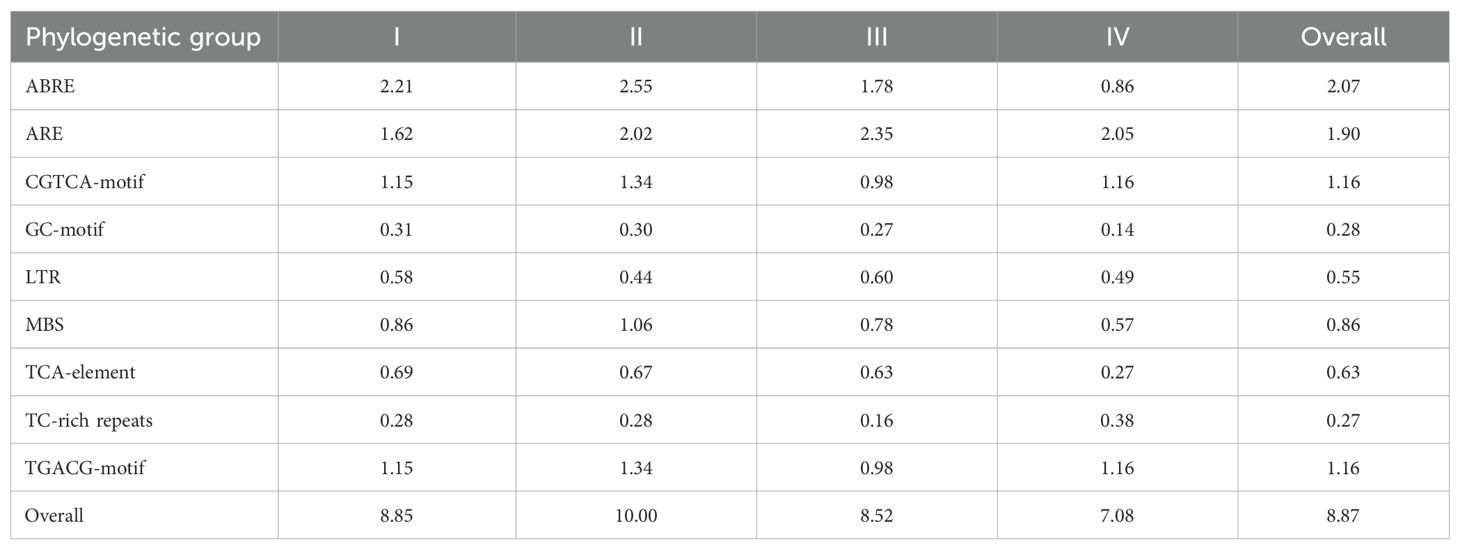
Table 1. The average cis-elements number in each phylogenetic group genes.
2.10 Expression patterns of the GATA genes in the sweetpotato
To explore GATA genes related to stress response, four transcriptome datasets covering abiotic stresses (salt and drought treatments) and biotic stresses (Ceratocystis fimbriata and Ditylenchus destructor infections) were analyzed (Figure 7). In the salt stress analysis, 29 GATA differentially expressed genes (DEGs) were identified and classified into two subclasses (A-1 and A-2) based on expression patterns (Figure 7A). Subclass A-1 (12 IbGATAs) showed predominant upregulation in controls but downregulation under salt stress, whereas subclass A-2 (17 IbGATAs) exhibited the opposite trend (Figure 7A). The drought stress analysis revealed 50 GATA DEGs, divided into subclasses B-1 (28 IbGATAs) and B-2 (22 IbGATAs). Subclass B-1 genes were downregulated in both control and stressed conditions of drought-sensitive genotype S26, but upregulated in drought-resistant genotype S01. Conversely, subclass B-2 genes displayed inverse expression patterns (Figure 7B). For Ceratocystis fimbriata infection, 60 GATA DEGs were grouped into subclasses C-1 (20 IbGATAs) and C-2 (40 IbGATAs). Subclass C-1 was downregulated in susceptible genotype Santiandao but upregulated in resistant Jikeshu20, with subclass C-2 showing reciprocal regulation (Figure 7C). The Ditylenchus destructor infection analysis detected 58 GATA DEGs, categorized into subclasses D-1 (28 IbGATAs) and D-2 (30 IbGATAs). Similar differential expression patterns were observed between susceptible Luxuan1hao and resistant Jikezi18 genotypes (Figure 7D). Cross-analysis identified 8 consistently detected DEGs (IbGATA117/119/126/146/33/37/38/62) across all datasets.
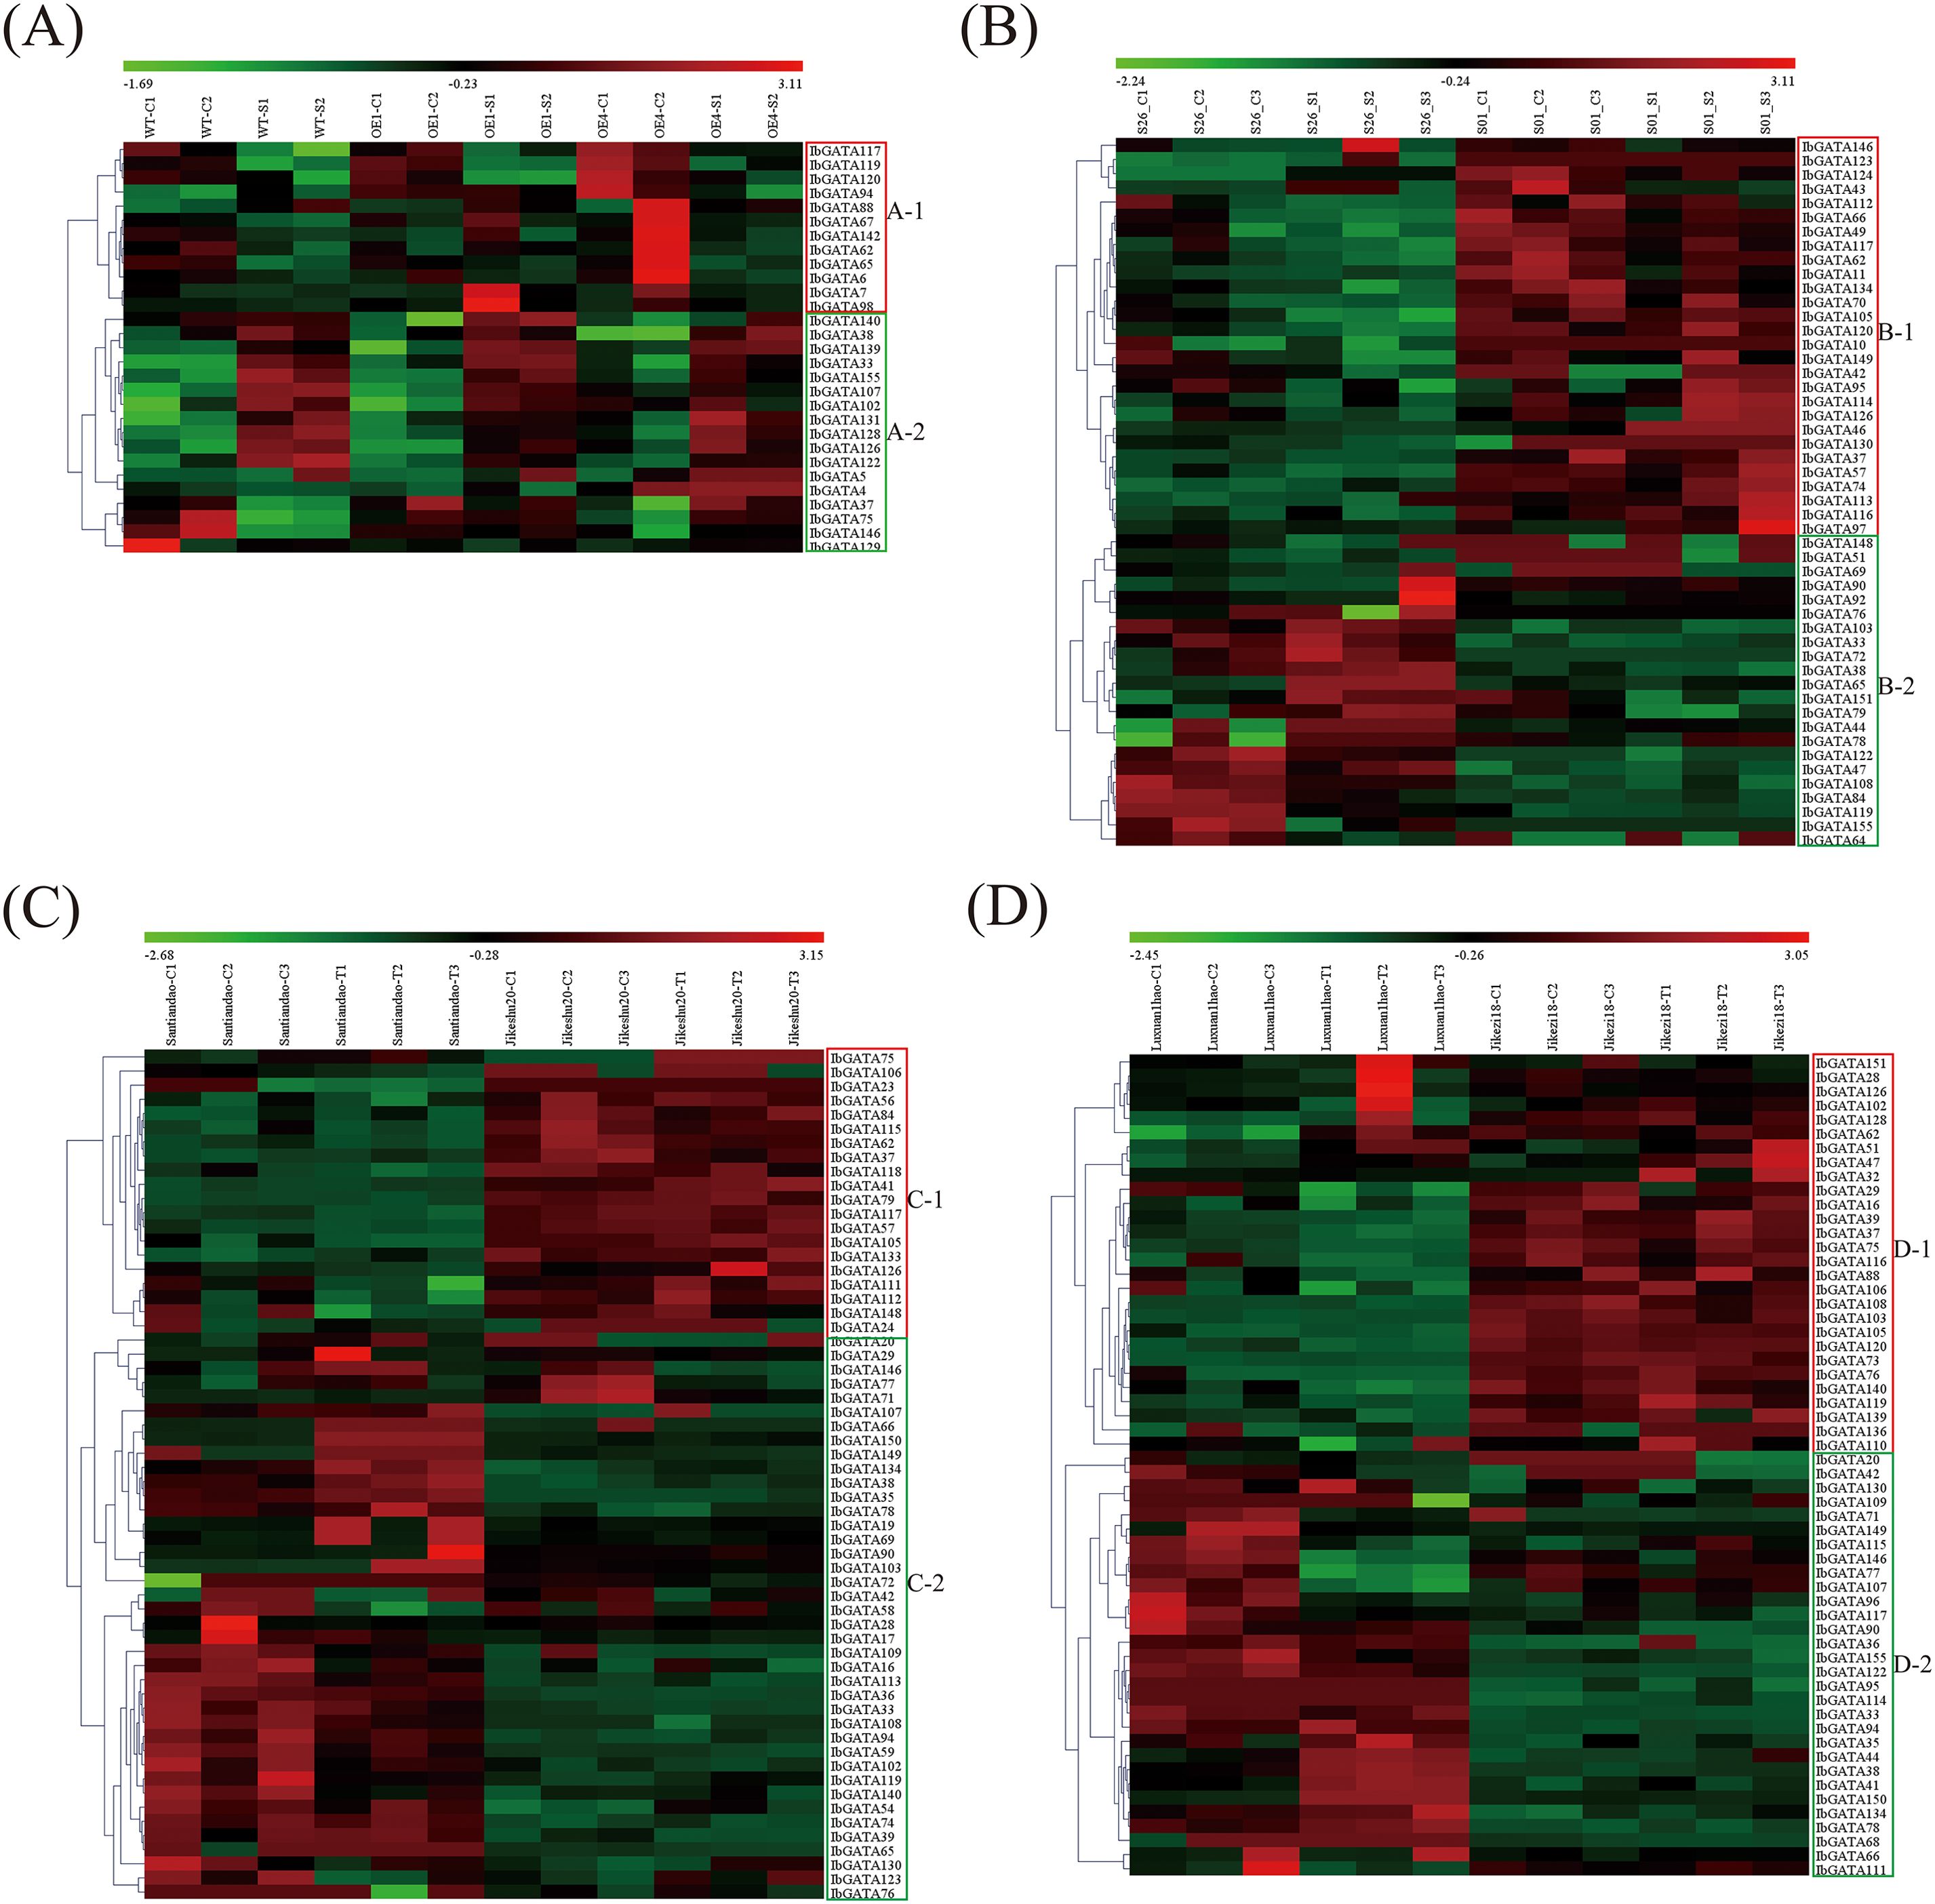
Figure 7. Heatmap of the expression profiles of sweetpotato differentially expressed genes (DEGs) in response to biotic and abiotic stresses. (A) DEGs in “WT”, “OE1” and “OE4” under control and salt treatment. (B) DEGs in “S26” and “S01” under control and drought treatment. (C) DEGs in “Santiandao” and “Jikeshu20” under control and Ceratocystis fimbriata infection treatment. (D) DEGs in “Luxuan1hao” and “Jikezi18” under control and Ditylenchus destructor infection treatment. C, control; T, treatment.
2.11 Expression analysis of sweetpotato GATA genes by quantitative reverse-transcription polymerase chain reaction
Based on transcriptome results, IbGATA33, IbGATA38, and IbGATA126 were selected for further analysis using qRT-PCR (Figure 8). Compared with the control condition (0 h), the transcripts of IbGATA33, IbGATA38, and IbGATA126 in Xushu32 were all upregulated after salt treatments, reaching peaks at 6 h (1.69-fold), 12 h (2.44-fold), and 6 h (3.29-fold), respectively; the transcripts of IbGATA126, IbGATA33, and IbGATA38 in JK328 were all upregulated after salt treatments, reaching peaks at 6 h (3.38-fold), 12 h (2.61-fold), and 12 h (2.81-fold), respectively (Figure 8A). Compared with the control condition (0 h), the transcripts of IbGATA33 and IbGATA38 in Xushu32 were upregulated after drought treatments, peaking at 6 h (1.53-fold) and 6 h (1.98-fold), respectively, while no significant change was observed in IbGATA126 transcripts; the transcripts of IbGATA33 and IbGATA38 in JK328 were downregulated after drought treatments, reaching lowest levels at 6 h (0.57-fold) and 6 h (0.44-fold), respectively, while IbGATA126 transcripts were upregulated, peaking at 6 h (2.99-fold) (Figure 8B). Compared with the control condition (0 h), IbGATA38 transcripts in Santiandao were upregulated after Ceratocystis fimbriata infection, peaking at 1 d (1.49-fold), while IbGATA126 transcripts were downregulated, reaching the lowest level at 1 d (0.44-fold), with no significant change in IbGATA33 transcripts. In Jikeshu20, IbGATA33 and IbGATA38 transcripts were downregulated after Ceratocystis fimbriata infection, reaching lowest levels at 6 h (0.32-fold) and 1 d (0.38-fold), respectively, while IbGATA126 transcripts were upregulated, peaking at 1 d (1.90-fold) (Figure 8C). Compared with the control condition (0 h), IbGATA33 and IbGATA38 transcripts in Luxuan1hao were upregulated after Ditylenchus destructor infection, peaking at 1 d (2.62-fold and 1.91-fold, respectively), while IbGATA126 transcripts were downregulated, reaching the lowest level at 1 d (0.45-fold). In Jikezi18, IbGATA33 and IbGATA38 transcripts were downregulated after Ditylenchus destructor infection, reaching lowest levels at 6 h (0.30-fold) and 1 d (0.36-fold), respectively, while IbGATA126 transcripts were upregulated, peaking at 6 h (2.15-fold) (Figure 8D).
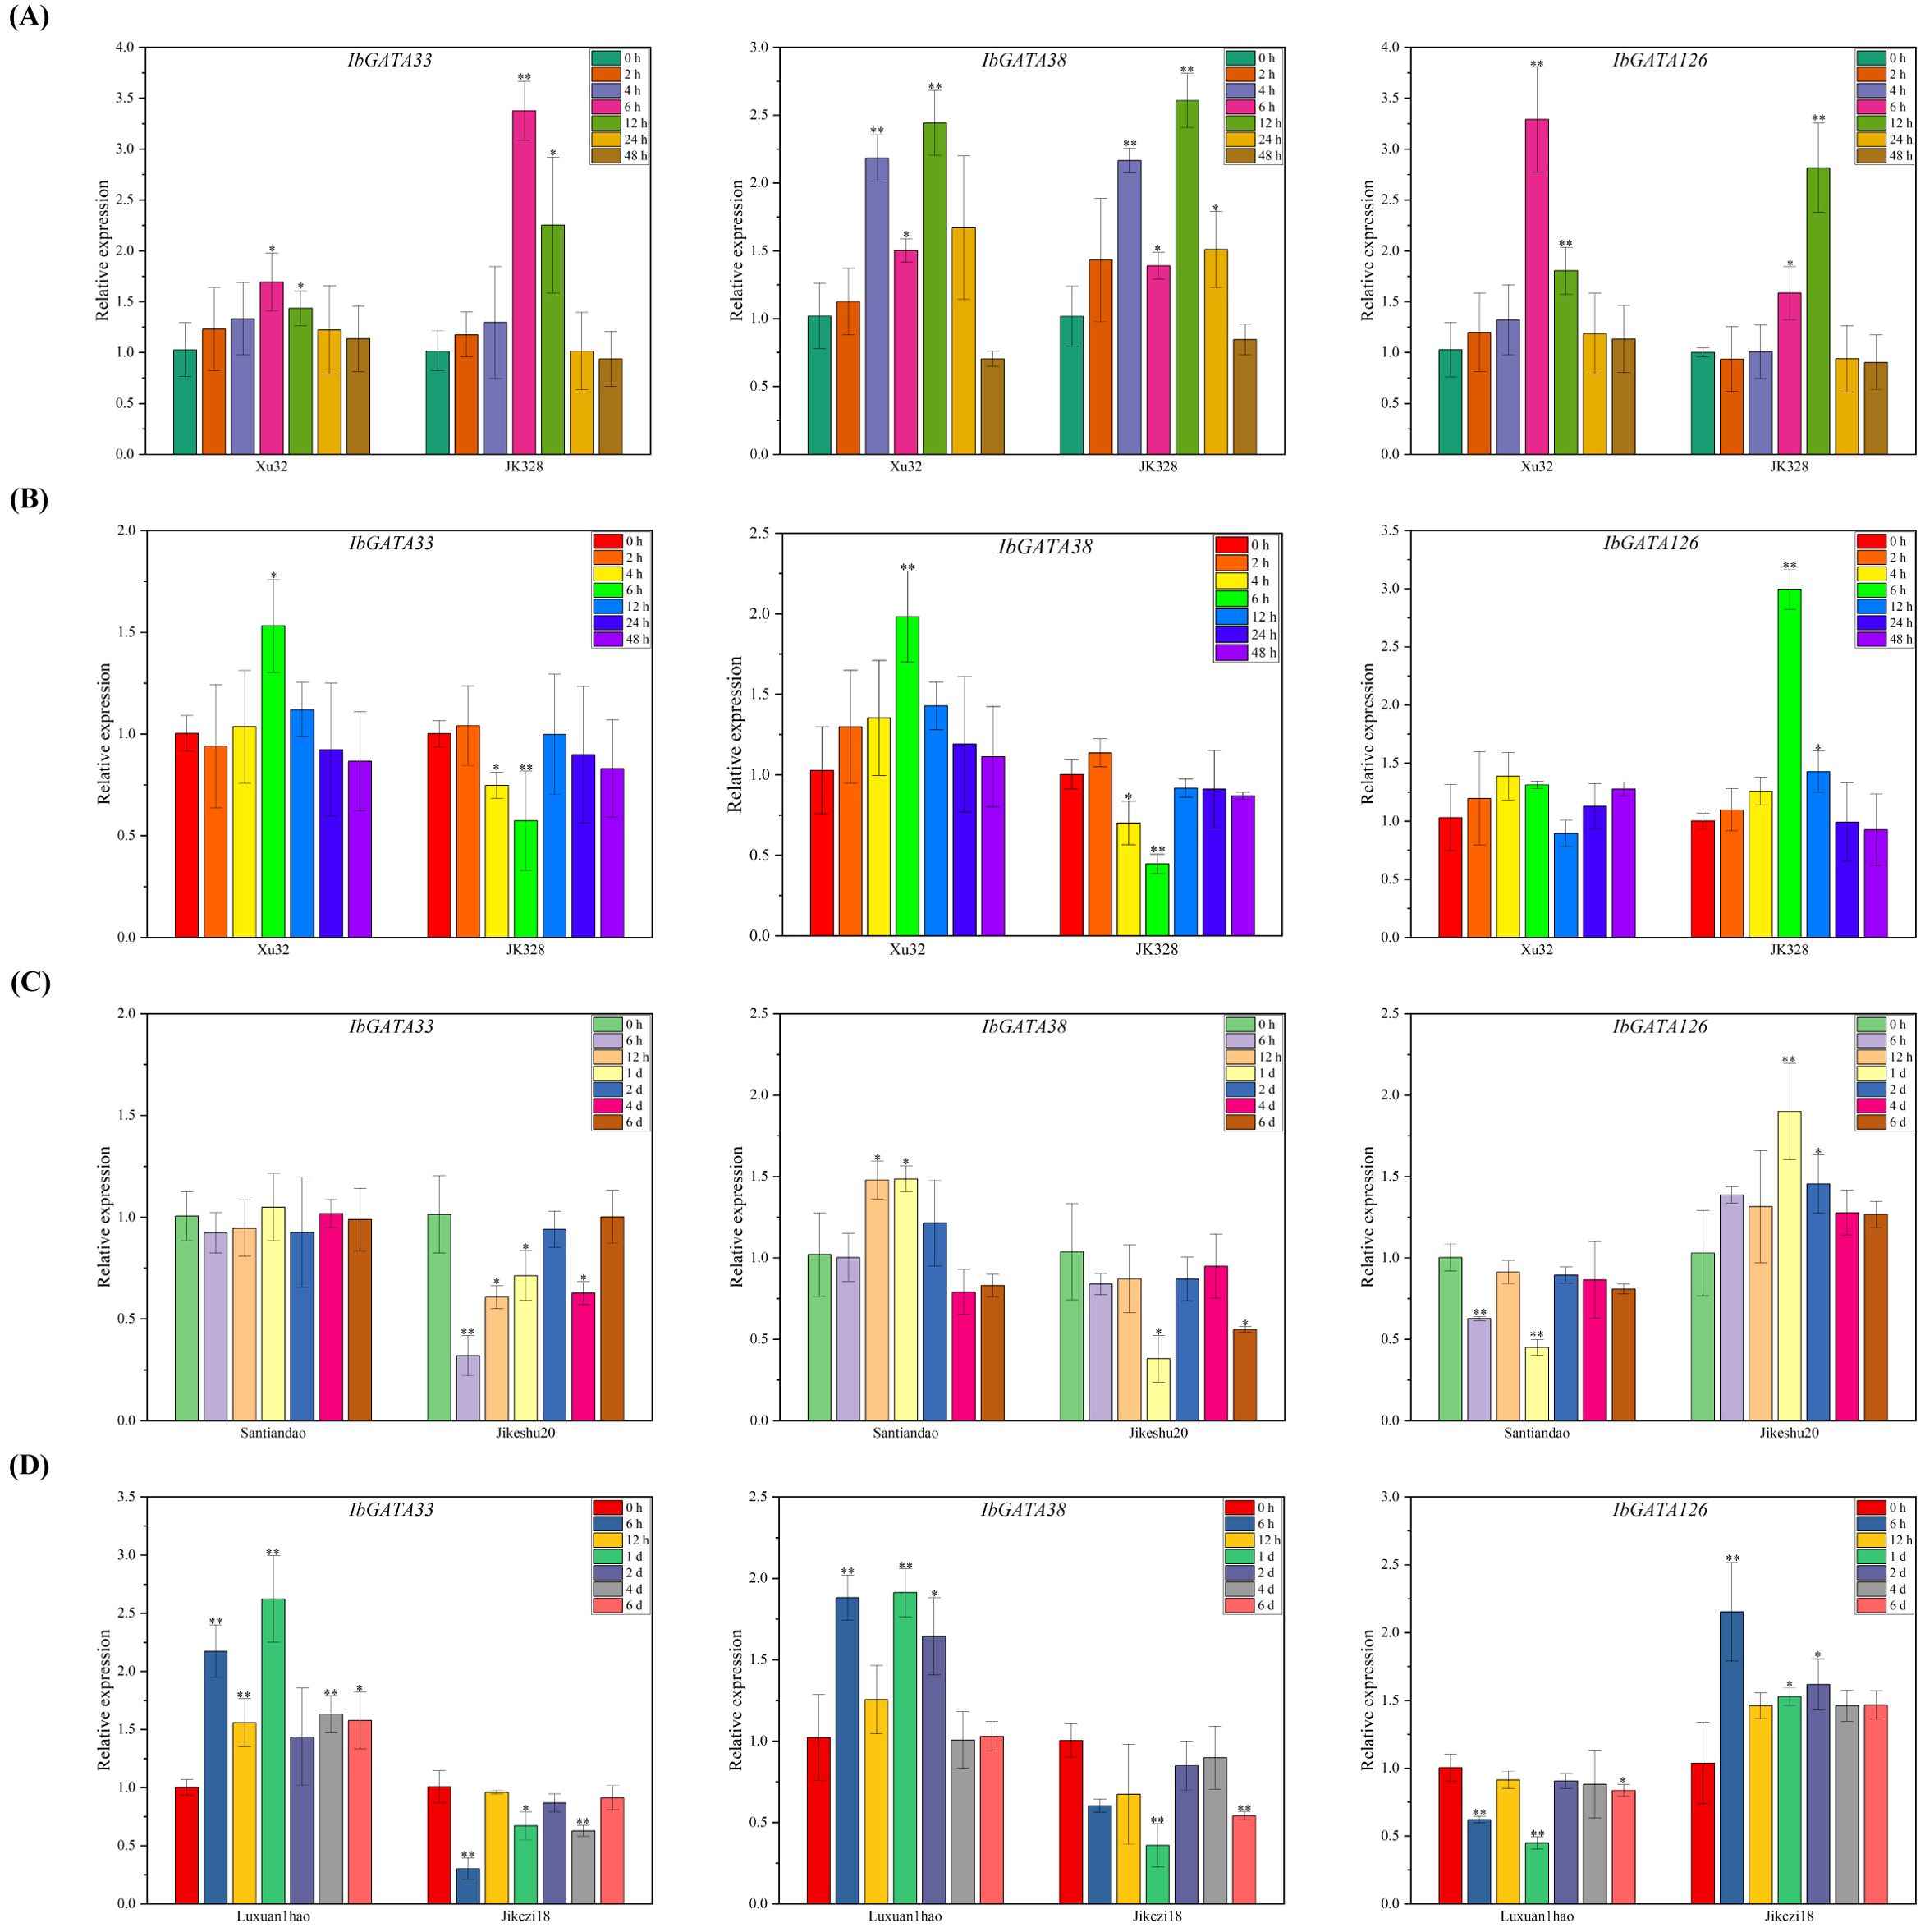
Figure 8. Expression analysis of IbGATA33, IbGATA38, and IbGATA126 in sweetpotato cultivars or lines. (A) Relative expression levels in leaves after different times of salt (86 mM NaCl) treatments. (B) Relative expression levels in leaves after different times of drought (30% PEG 6000) treatments. (C) Relative expression levels after different times of Ceratocystis fimbriata infection. (D) Relative expression levels in storage roots after Ditylenchus destructor infection. Denoted the significance of expression levels compared with control were as ∗<0.05, ∗∗<0.01. h, hours; d, day(s).
3 Discussion
Plant GATA transcription factors are key regulatory proteins governing growth, development, and environmental adaptation (Schwechheimer et al., 2022). Consequently, this gene family has garnered increasing research interest and undergone comprehensive characterization across diverse plant species, including Arabidopsis (Reyes et al., 2004), rice (Oryza sativa) (Reyes et al., 2004), wheat (Triticum aestivum) (Feng et al., 2022), potato (Solanum tuberosum) (Zhang et al., 2024), poplar (Populus spp.) (Zhao et al., 2023), melon (Cucumis melo) (Zheng et al., 2024b), onion (Allium cepa) (Bose et al., 2025), Solanaceae species (Zhang et al., 2023), Orchidaceae species (Zheng et al., 2024c), and Populus species (Kim et al., 2021b). The genus Ipomoea comprises 600–700 species, many of which have significant medicinal or ornamental value (Nimmakayala et al., 2011). However, the GATA gene family remains poorly characterized in Ipomoea species.
In the present study, we identified a total of 410 GATA genes across seven Ipomoea species. Analysis revealed variations in GATA gene family members among the studied species: sweet potato (I. batatas) contained 158 genes (0.09%), I. trifida 54 (0.12%), I. triloba 62 (0.13%), I. nil 39 (0.09%), I. purpurea 32 (0.10%), I. cairica 32 (0.08%), and I. aquatica 33 (0.06%). The corresponding genome sizes were 2,907.4 Mb (I. batatas), 373.4 Mb (I. trifida), 443.3 Mb (I. triloba), 750.0 Mb (I. nil), 602.0 Mb (I. purpurea), 733.0 Mb (I. cairica), and 511.5 Mb (I. aquatica). These findings suggest that GATA gene quantity is independent of genome size, a phenomenon previously observed in closely related species including Solanaceae (Zhang et al., 2023), Orchidaceae (Zheng et al., 2024c), and Populus (Kim et al., 2021b).
The phylogenetic analysis of GATA genes in seven Ipomoea species and Arabidopsis revealed four independent groups (I to IV) (Figure 1), consistent with findings in other plant species (Manzoor et al., 2021; Shi et al., 2022; Zhang et al., 2023). Compared to other plant species, the proportion of GATA genes in each phylogenetic group was distinct when using Arabidopsis GATA genes as a reference. For instance, in Rosaceae species, Group IV was the largest and Group I was the smallest (Manzoor et al., 2021); in longan and apple, Group II was the largest and Group I was the smallest (Zheng et al., 2024a); in Populus species and wheat, the distribution was similar to Ipomoea species, with Group I being the largest and Group IV the smallest (Kim et al., 2021b; Feng et al., 2022; Zhao et al., 2023). These results revealed that the ancestral GATA gene phylogenetic groups have undergone different expansion patterns across plant species (Lespinet et al., 2002).
The conserved GATA domain in Ipomoea comprises four β-sheets and one α-helix, featuring a type IV zinc finger motif (C-X2-C-X18/20-C-X2-C) (Supplementary File 2: Supplementary Figure S1, Figure 2). Group I, II, and IV proteins share a C-X2-C-X18-C-X2-C pattern, while class III uniquely possesses a C-X2-C-X20-C-X2-C variant (Supplementary File 2: Supplementary Figure S1). These findings align with conserved structural features observed in other plant species, including Arabidopsis (Reyes et al., 2004; Bi et al., 2005; Kim et al., 2021a), poplar (Zhao et al., 2023), wheat (Feng et al., 2022), and rice (Gupta et al., 2017). Through motif analysis and annotation of Ipomoea GATA proteins, 20 conserved motifs were identified (Figure 3; Supplementary File 4: Supplementary Table S2). Among these, only three motifs were annotated as GATA, CCT, and TIFY, respectively. Notably, motif 1 corresponds to the GATA domain, while the remaining motifs exhibit class-specific distribution patterns, suggesting potential functional diversification within this protein family. Consistent with findings in other plant species, CCT motifs are exclusively present in Group III, whereas TIFY motifs are restricted to Groups III and IV (Figure 3; Supplementary File 4: Supplementary Table S2). While the precise function of the CCT motif remains unclear, proteins containing this motif have been implicated in photoperiod sensing and circadian rhythm integration (Schwechheimer et al., 2022). In contrast, the TIFY motif is well-documented to participate in biological clock regulation and hormone signaling pathways (Peng et al., 2021).
Gene duplication events, including segmental and tandem duplications, play essential roles in gene family expansion and distribution in plants (Cannon et al., 2004; Kong et al., 2007; Jiang et al., 2013). Segmental duplications typically occur through polyploidy followed by chromosomal rearrangements, while tandem duplications arise within the same or neighboring intergenic regions (Jiang et al., 2013). In this study, the distribution of Ipomoea GATA genes was found to be uneven across chromosomes (Figure 4). Tandem duplications were detected only in I. triloba, I. trifida, and I. nil, while segmentally duplicated GATA genes were observed in sweetpotato and I. cairica (Figure 4; Supplementary File 5: Supplementary Table S3). These results suggest that Ipomoea GATA genes may have experienced distinct duplication mechanisms compared to other plant lineages (Kong et al., 2007).
This study identified 199 GATA orthologous genes across seven Ipomoea species, including 79 from sweet potato and 20 each from I. trifida, I. triloba, I. nil, I. purpurea, I. cairica, and I. aquatica. Synteny analysis of GATA genes in the seven Ipomoea species revealed strong collinearity despite chromosomal rearrangements and gene duplication events following divergence from their common ancestor (Yan et al., 2022). To elucidate the evolutionary dynamics of duplicated and syntenic GATA gene pairs, we conducted Ka/Ks analysis. The results demonstrated that nearly all GATA gene pairs exhibited a Ka/Ks ratio below 1, indicating predominant purifying (negative) selection during genome duplication and speciation events (Gaut and Doebley, 1997).
Regulatory elements are specific DNA sequences within the same DNA molecule that possess transcriptional regulation functions. Analyzing these elements can enhance our fundamental understanding of gene regulation (Baxter et al., 2012; Hernandez-Garcia and Finer, 2014). As anticipated, the promoters of the Ipomoea GATA genes contained numerous cis-regulatory elements involved in biotic and abiotic stress responses. These included ABRE, ARE, CGTCA-motif, GC-motif, LTR, MBS, TCA-element, TC-rich repeats, and TGACG-motif (Supplementary File 9: Supplementary Figure S3, Supplementray File 10:Supplementary Table S7). The abundance of these stress-related regulatory elements likely explains why a large proportion of GATA genes showed stress-responsive expression patterns in our analysis.
Research has reported that GATA genes participate in both plant developmental processes (Wang et al., 2009; Luo et al., 2010; Lu et al., 2017; Zhang et al., 2018, 2020) and stress response mechanisms (Zhao et al., 2021b; Zhu et al., 2022; Wei et al., 2023). In this study, we examined GATA gene expression patterns through analysis of RNA-seq data. Differential expression profiles were observed, with Ipomoea GATA genes showing distinct stress-responsive expression patterns (Figure 7). For stress response analysis, we selected four RNA-seq datasets comprising two abiotic (salt, drought) and two biotic (Ceratocystis fimbriata, Ditylenchus destructor) stress conditions. This analysis identified 29, 50, 60, and 58 differentially expressed GATA genes (DEGs) respectively (Figure 7). Subsequent qRT-PCR validation of three selected genes (IbGATA33, IbGATA38, IbGATA126) confirmed the RNA-seq expression patterns (Figure 8). The qRT-PCR validation revealed differential expression patterns of IbGATA33/38/126 genes. Under salt stress, all three genes were upregulated in both Xushu32 and JK328 cultivars, peaking at 6 h or 12 h (1.69- to 3.38-fold increase). During drought treatment, IbGATA33/38 were upregulated in Xushu32 but downregulated in JK328, whereas IbGATA126 exhibited opposite expression trends between the two cultivars. In pathogen responses: C. fimbriata infection induced upregulation of IbGATA38 (1.49-fold) and downregulation of IbGATA126 (0.44-fold) in Santiandao; D. destructor infection caused upregulation of IbGATA33/38 (1.91- to 2.62-fold) and downregulation of IbGATA126 (0.45-fold) in Luxuan1hao, while Jikezi18 displayed divergent trends. Based on these results, it is possible to predict that IbGATA33, IbGATA38, and IbGATA126 play important roles in abiotic and biotic stress responses, and their functions should be investigated in the near future.
4 Conclusions
We analyzed GATA genes in seven Ipomoea species (I. batatas:158, I. trifida:54, I. triloba:62, I. nil:39, I. purpurea:32, I. cairica:32, I. aquatica:33), classifying them into four clades (I-IV). Conserved motifs, gene structures, and chromosomal distributions were characterized, revealing tandem and segmental duplications drove family expansion. Among 199 orthologs, syntenic pairs showed Ka/Ks<1, indicating purifying selection. Stress treatments identified 29–60 differentially expressed GATA genes (salt/drought/pathogens). qRT-PCR validated three DEGs (IbGATA33, IbGATA38, IbGATA126), confirming transcriptome data. These results provide a comprehensive genomic analysis of the GATA transcription factor family across seven Ipomoea species, offering valuable insights into gene characteristics, phylogenetic relationships, chromosomal locations, duplication events, cis-regulatory elements, expression patterns, and stress responses. This analysis may facilitate the elucidation of evolutionary relationships, molecular mechanisms, and functional roles of GATA genes in Ipomoea species.
5 Methods
5.1 Data resources
Genomic data for seven Ipomoea species were obtained from public databases: sweetpotato genome (version 1) from Plant GARDEN (Yoon et al., 2022), I. trifida (v3) and I. triloba (v3) from GenBank BioProject PRJNA428214 and PRJNA428241 respectively (Wu et al., 2018), I. nil (v1.2) from GenBank BioProject BDFN01000001-BDFN01003416 (Hoshino et al., 2016), I. purpurea (v1) from CoGe platform (Zhao et al., 2021a), I. cairica (v1) from AGIS database (Jiang et al., 2022), and I. aquatica (v1) from BIGD (PRJCA002216) (Hao et al., 2021). Arabidopsis GATA protein sequences were acquired from TAIR (Reyes et al., 2004).
5.2 Identification of GATA genes in seven Ipomoea species
The identification of GATA domains was conducted through a dual-algorithm strategy. Initial screening was performed using HMMER 3.1b2 with default parameters to detect the conserved GATA domain (Pfam: PF00320) in all protein sequences. In parallel, BLASTP 2.2.28+ searches were executed using an extended GATA domain sequence as query (E-value cutoff: 1×10⁻¹⁰). Candidate sequences from both HMMsearch and BLASTP analyses were merged, and redundancy was eliminated through sequence identity clustering. Final validation involved HMMscan verification of putative GATA proteins against the Pfam-A database with a strict E-value threshold of 0.0001.
5.3 Molecular weight, isoelectric point and subcellular localization analysis of Ipomoea GATA proteins
The ExPASy proteomics server (http://www.expasy.ch/tools/pi_tool.html) was utilized to calculate key physicochemical parameters of GATA proteins, specifically molecular weight (MW) and isoelectric point (pI) (Artimo et al., 2012). For subcellular localization prediction of Ipomoea proteins, we employed WoLF PSORT (https://wolfpsort.hgc.jp/), a dedicated bioinformatics platform for protein localization analysis (Horton et al., 2007).
5.4 Sequence alignment and phylogenetic analysis of GATA proteins
To reconstruct the phylogenetic relationships among identified GATA proteins, initial multiple sequence alignment of complete protein sequences was executed using Clustal Omega (v1.2.4) (Sievers et al., 2011; Sievers and Higgins, 2018). The alignment output served as input for maximum likelihood analysis performed with IQ-TREE (v2.1.3) (Minh et al., 2020), incorporating model selection via ModelFinder (v2.0) (Kalyaanamoorthy et al., 2017) that determined the VT+F+R4 model as most appropriate. Tree topology robustness was evaluated through SH-aLRT and UFBoot2 analyses (1,000 replicates). Final tree visualization and annotation were accomplished using FigTree (v1.4.3) to optimize clarity.
5.5 Identification of conserved motifs of the GATA genes
To examine the structural motif diversity among the identified GATA genes, their protein sequences underwent thorough motif analysis via the web-based platform MEME SUITE (v5.5.3), available at https://meme-suite.org/meme/ (Bailey et al., 2009). The analysis was designed to detect a maximum of 20 unique motifs, with site distribution set to “any” (permitting motif occurrence at any sequence position). Default values were retained for all other parameters to maintain methodological consistency and alignment with conventional approaches. Ipomoea GATA protein conserved domains were aligned and graphically represented using Clustal Omega (v1.2.4) (Sievers et al., 2011; Sievers and Higgins, 2018). Further sequence conservation analysis and GATA domain secondary structure visualization were performed through WebLogo (v3.7.9) (Crooks et al., 2004).
5.6 Protein motif compositions and gene structures of Ipomoea GATA genes
Based on the motif analysis data obtained from MEME SUITE (v5.5.3) (with the minimum width of 6, maximum width of 20, the maximum number of motifs designed to identify 20 motifs and iterative cycles set to default), phylogenetic relationships, and genome annotation files (gff3), the identified Ipomoea GATA genes were analyzed using TBtools-II (v2.131) to determine their protein motif distributions and gene structures, with subsequent graphical representation (Chen et al., 2023).
5.7 Chromosome distribution and duplication pattern analysis of the GATA genes
Chromosomal localization of GATA genes across all seven Ipomoea species was executed using MapChart (v2.30) (Voorrips, 2002). To detect putative gene duplication events, genome-wide collinearity assessments were carried out with MCScanX (Wang et al., 2012). This process included intra-species protein sequence comparisons via BLASTP (v2.2.28+) under a strict E-value threshold (1e-10). Synteny relationships were graphically rendered using CIRCOS (v0.66) to produce detailed genomic maps (Krzywinski et al., 2009).
5.8 Syntenic analysis GATA genes in the seven Ipomoea genomes
We conducted comparative synteny analysis of the seven Ipomoea species with MCScan (Python version) under default parameters (Tang et al., 2024). High-confidence 1:1 syntenic blocks (gene pairs) were identified through gene model alignments generated by LAST (v1257) and stringent filtering. The JCVI package (Tang et al., 2015) was employed to visualize syntenic relationships as dot plots.
5.9 Ka/Ks analysis of duplicated and syntenic GATA genes
The evolutionary selection pressures on GATA transcription factors were evaluated by determining the nonsynonymous (Ka) to synonymous (Ks) substitution rate ratio (ω = Ka/Ks) for duplicated and syntenic gene pairs in seven Ipomoea species, employing TBtools (v1.108) (Chen et al., 2020).
5.10 Promoter analysis of GATA genes in the seven Ipomoea species
To detect potential cis-elements in the Ipomoea GATA genes, their 1,500-bp promoter sequences were analyzed using PLANTCARE (http://bioinformatics.psb.ugent.be/webtools/plantcare/html/, accessed 18 March 2023) (Lescot et al., 2002).
5.11 Expression profile of sweetpotato GATA genes
To analyze the expression patterns of sweet potato GATA genes, four transcriptome datasets—covering both abiotic and biotic stresses—were utilized. Two abiotic stress datasets (salt: PRJNA811431; drought: PRJNA999504) were sourced from NCBI, while two unpublished in-house datasets investigated resistance to C. fimbriata and D. destructor across four cultivars/lines: the susceptible “Santiandao” and resistant “Jikeshu20” for C. fimbriata, and the susceptible “Luxuan1hao” and resistant “Jikezi18” for D. destructor. Differentially expressed genes (DEGs) were defined by |log2FC| > 1 and FDR ≤ 5%, with mean log2FC values computed for each. Expression distributions were visualized via an FPKM-based heat map generated in MeV software (Howe et al., 2011).
5.12 RNA isolation and qRT-PCR analysis
Two groups of sweet potato cultivars underwent distinct stress treatments. For biotic stress assessment, the susceptible cultivar Santiandao and resistant line Jikeshu20 were infected with C. fimbriata (Muramoto et al., 2012), whereas the susceptible Luxuan1hao and resistant Jikezi18 were inoculated with D. destructor (Gao et al., 2011). Samples were harvested at seven post-inoculation intervals (0, 6, 12 hours; 1, 2, 4, 6 days), with uninoculated roots as controls. For abiotic stress, pre-cultured cuttings (25 cm, from 6-week-old field plants) of susceptible Xu32 and resistant JK328 were treated in Hoagland solution for three days before exposure to salt (86 mM NaCl vs 0 mM), or drought (30% PEG6000 vs 0%) (Hoagland and Arnon, 1950). Abiotic samples were collected at seven time points (0–48 hours). Total RNA was isolated via RNAprep Pure Plant Kit (Tiangen Biotech) and reverse-transcribed using Quantscript RT Kit (Tiangen Biotech). The stably expressed β-actin gene (Genbank AY905538) normalized DEG expression. All experiments included triplicate biological replicates per time point, with gene expression analyzed by the 2–ΔΔCt method (Schmittgen and Livak, 2008), and performed statistical analysis with one-way ANOVA. qRT-PCR followed published protocols, employing Primer-BLAST-designed primers (Supplementary File 11: Supplementary Table S8) (Ye et al., 2012; Zhai et al., 2016).
Data availability statement
The datasets presented in this study can be found in online repositories. The names of the repository/repositories and accession number(s) can be found in the article/Supplementary Material.
Author contributions
ZS: Conceptualization, Data curation, Formal analysis, Funding acquisition, Investigation, Methodology, Project administration, Resources, Software, Supervision, Validation, Visualization, Writing – original draft, Writing – review & editing. JG: Data curation, Formal analysis, Investigation, Methodology, Writing – original draft, Writing – review & editing. ZJ: Conceptualization, Funding acquisition, Project administration, Resources, Supervision, Writing – original draft, Writing – review & editing. FM: Formal analysis, Investigation, Methodology, Software, Writing – original draft, Writing – review & editing. WW: Formal analysis, Software, Writing – original draft, Writing – review & editing.
Funding
The author(s) declare financial support was received for the research and/or publication of this article. This work was funded by “Department of Science and Technology of Hebei Province, grant number 19226335D” and “Science Research Foundation of Hebei Normal University of Science and Technology, grant number 2021JK01”.
Acknowledgments
We would like to thank all the editors and reviewers for their efforts and their valuable comments.
Conflict of interest
The authors declare that the research was conducted in the absence of any commercial or financial relationships that could be construed as a potential conflict of interest.
Generative AI statement
The author(s) declare that no Generative AI was used in the creation of this manuscript.
Any alternative text (alt text) provided alongside figures in this article has been generated by Frontiers with the support of artificial intelligence and reasonable efforts have been made to ensure accuracy, including review by the authors wherever possible. If you identify any issues, please contact us.
Publisher’s note
All claims expressed in this article are solely those of the authors and do not necessarily represent those of their affiliated organizations, or those of the publisher, the editors and the reviewers. Any product that may be evaluated in this article, or claim that may be made by its manufacturer, is not guaranteed or endorsed by the publisher.
Supplementary material
The Supplementary Material for this article can be found online at: https://www.frontiersin.org/articles/10.3389/fpls.2025.1714791/full#supplementary-material
Supplementary Figure 1 | Multiple sequence alignment of conserved GATA domains in Ipomoea species. Identical or similar amino acid residues at each position are highlighted with distinct colors. The sequences are arranged according to their phylogenetic clustering patterns.
Supplementary Figure 2 | Integrated analysis of Ipomoea GATA genes. (A) Maximum Likelihood phylogenetic tree of Ipomoea GATA proteins, classified into four evolutionarily distinct subfamilies (I-IV). (B) Distribution of 20 conserved protein motifs identified by MEME suite, with color-coded annotation. Protein length scale provided. (C) Gene structure organization with exons (orange boxes), untranslated region (green boxes) and introns (black lines), scaled by the bottom ruler.
Supplementary Figure 3 | Cis-acting elements prediction in the Ipomoea GATA gene promoters. (A) Phylogenetic tree. (B) Cis-regulatory elements distribution. The 1500 bp upstream promoter regions of the Ipomoea GATA genes were subjected to cis-element analysis using PlantCARE software.
References
Artimo, P., Jonnalagedda, M., Arnold, K., Baratin, D., Csardi, G., De Castro, E., et al. (2012). ExPASy: SIB bioinformatics resource portal. Nucleic Acids Res. 40, W597–W603. doi: 10.1093/nar/gks400
Austin, D. F., Staples, G. W., and Simão-Bianchini, R. (2015). A synopsis of Ipomoea (Convolvulaceae) in the Americas: Further corrections, changes, and additions. Taxon 64, 625–633. doi: 10.12705/643.14
Bailey, T. L., Boden, M., Buske, F. A., Frith, M., Grant, C. E., Clementi, L., et al. (2009). MEME SUITE: tools for motif discovery and searching. Nucleic Acids Res. 37, W202–W208. doi: 10.1093/nar/gkp335
Baxter, L., Jironkin, A., Hickman, R., Moore, J., Barrington, C., Krusche, P., et al. (2012). Conserved noncoding sequences highlight shared components of regulatory networks in dicotyledonous plants. Plant Cell 24, 3949–3965. doi: 10.1105/tpc.112.103010
Bi, Y. M., Zhang, Y., Signorelli, T., Zhao, R., Zhu, T., and Rothstein, S. (2005). Genetic analysis of Arabidopsis GATA transcription factor gene family reveals a nitrate-inducible member important for chlorophyll synthesis and glucose sensitivity. Plant J. 44, 680–692. doi: 10.1111/j.1365-313X.2005.02568.x
Bose, C., Das, P. K., Roylawar, P., Rupawate, P., Khandagale, K., Nanda, S., et al. (2025). Identification and analysis of the GATA gene family in onion (Allium cepa L.) in response to chromium and salt stress. BMC Genomics 26, 1–15. doi: 10.1186/s12864-025-11251-3
Cannon, S. B., Mitra, A., Baumgarten, A., Young, N. D., and May, G. (2004). The roles of segmental and tandem gene duplication in the evolution of large gene families in Arabidopsis thaliana. BMC Plant Biol. 4, 10. doi: 10.1186/1471-2229-4-10
Chen, C., Chen, H., Zhang, Y., Thomas, H. R., Frank, M. H., He, Y., et al. (2020). TBtools: an integrative toolkit developed for interactive analyses of big biological data. Mol. Plant 13, 1194–1202. doi: 10.1016/j.molp.2020.06.009
Chen, C., Wu, Y., Li, J., Wang, X., Zeng, Z., Xu, J., et al. (2023). TBtools-II: A "one for all, all for one"bioinformatics platform for biological big-data mining. Mol. Plant 16, 1733–1742. doi: 10.1016/j.molp.2023.09.010
Crooks, G. E., Hon, G., Chandonia, J.-M., and Brenner, S. E. (2004). WebLogo: a sequence logo generator. Genome Res. 14, 1188–1190. doi: 10.1101/gr.849004
Daniel-Vedele, F. and Caboche, M. (1993). A tobacco cDNA clone encoding a GATA-1 zinc finger protein homologous to regulators of nitrogen metabolism in fungi. Mol. Gen. Genet. 240, 365–373. doi: 10.1007/BF00280388
Evans, T., Reitman, M., and Felsenfeld, G. (1988). An erythrocyte-specific DNA-binding factor recognizes a regulatory sequence common to all chicken globin genes. Proc. Natl. Acad. Sci. United States America 85, 5976–5980. doi: 10.1073/pnas.85.16.5976
Feng, X., Yu, Q., Zeng, J., He, X., and Liu, W. (2022). Genome-wide identification and characterization of GATA family genes in wheat. BMC Plant Biol. 22, 372. doi: 10.1186/s12870-022-03733-3
Gao, S., Yu, B., Yuan, L., Zhai, H., He, S., and Liu, Q. (2011). Production of transgenic sweetpotato plants resistant to stem nematodes using oryzacystatin-I gene. Scientia Hortic. 128, 408–414. doi: 10.1016/j.scienta.2011.02.015
Gaut, B. S. and Doebley, J. F. (1997). DNA sequence evidence for the segmental allotetraploid origin of maize. Proc. Natl. Acad. Sci. United States America 94, 6809–6814. doi: 10.1073/pnas.94.13.6809
Gupta, P., Nutan, K. K., Singla-Pareek, S. L., and Pareek, A. (2017). Abiotic stresses cause differential regulation of alternative splice forms of GATA transcription factor in rice. Front. Plant Sci. 8, 1944. doi: 10.3389/fpls.2017.01944
Hao, Y., Bao, W., Li, G., Gagoshidze, Z., Shu, H., Yang, Z., et al. (2021). The chromosome-based genome provides insights into the evolution in water spinach. Scientia Hortic. 289, 110501. doi: 10.1016/j.scienta.2021.110501
Hernandez-Garcia, C. M. and Finer, J. (2014). Identification and validation of promoters and cis-acting regulatory elements. Plant Sci. 217, 109–119. doi: 10.1016/j.plantsci.2013.12.007
Hoagland, D. R. and Arnon, D. I. (1938). The water-culture method for growing plants without soil. Calif. Agric. Exp. stn. Circ.
Horton, P., Park, K.-J., Obayashi, T., Fujita, N., Harada, H., Adams-Collier, C., et al. (2007). WoLF PSORT: protein localization predictor. Nucleic Acids Res. 35, W585–W587. doi: 10.1093/nar/gkm259
Hoshino, A., Jayakumar, V., Nitasaka, E., Toyoda, A., Noguchi, H., Itoh, T., et al. (2016). Genome sequence and analysis of the Japanese morning glory Ipomoea nil. Nat. Commun. 7, 13295. doi: 10.1038/ncomms13295
Howe, E. A., Sinha, R., Schlauch, D., and Quackenbush, J. (2011). RNA-seq analysis in MeV. Bioinformatics 27, 3209–3210. doi: 10.1093/bioinformatics/btr490
Jiang, S.-Y., González, J. M., and Ramachandran, S. (2013). Comparative genomic and transcriptomic analysis of tandemly and segmentally duplicated genes in rice. PloS One 8, e63551. doi: 10.1371/journal.pone.0063551
Jiang, F., Wang, S., Wang, H., Wang, A., Xu, D., Liu, H., et al. (2022). A chromosome-level reference genome of a Convolvulaceae species Ipomoea cairica. G3 12, jkac187. doi: 10.1093/g3journal/jkac187
Kalyaanamoorthy, S., Minh, B. Q., Wong, T. K., Von Haeseler, A., and Jermiin, L. S. (2017). ModelFinder: fast model selection for accurate phylogenetic estimates. Nat. Methods 14, 587–589. doi: 10.1038/nmeth.4285
Kim, M., Xi, H., and Park, J. (2021a). Genome-wide comparative analyses of GATA transcription factors among 19 Arabidopsis ecotype genomes: Intraspecific characteristics of GATA transcription factors. PloS One 16, e0252181. doi: 10.1371/journal.pone.0252181
Kim, M., Xi, H., Park, S., Yun, Y., and Park, J. (2021b). Genome-wide comparative analyses of GATA transcription factors among seven Populus genomes. Sci. Rep. 11, 16578. doi: 10.1038/s41598-021-95940-5
Kong, H., Landherr, L. L., Frohlich, M. W., Leebens-Mack, J., Ma, H., and Depamphilis, C. W. (2007). Patterns of gene duplication in the plant SKP1 gene family in angiosperms: evidence for multiple mechanisms of rapid gene birth. Plant J. 50, 873–885. doi: 10.1111/j.1365-313X.2007.03097.x
Krzywinski, M., Schein, J., Birol, I., Connors, J., Gascoyne, R., Horsman, D., et al. (2009). Circos: an information aesthetic for comparative genomics. Genome Res. 19, 1639–1645. doi: 10.1101/gr.092759.109
Lescot, M., Déhais, P., Thijs, G., Marchal, K., Moreau, Y., Van De Peer, Y., et al. (2002). PlantCARE, a database of plant cis-acting regulatory elements and a portal to tools for in silico analysis of promoter sequences. Nucleic Acids Res. 30, 325–327. doi: 10.1093/nar/30.1.325
Lespinet, O., Wolf, Y. I., Koonin, E. V., and Aravind, L. (2002). The role of lineage-specific gene family expansion in the evolution of eukaryotes. Genome Res. 12, 1048–1059. doi: 10.1101/gr.174302
Liu, Q. (2017). Improvement for agronomically important traits by gene engineering in sweetpotato. Breed. Sci. 67, 15–26. doi: 10.1270/jsbbs.16126
Lu, G., Casaretto, J. A., Ying, S., Mahmood, K., Liu, F., Bi, Y.-M., et al. (2017). Overexpression of OsGATA12 regulates chlorophyll content, delays plant senescence and improves rice yield under high density planting. Plant Mol. Biol. 94, 215–227. doi: 10.1007/s11103-017-0604-x
Luo, X.-M., Lin, W.-H., Zhu, S., Zhu, J.-Y., Sun, Y., Fan, X.-Y., et al. (2010). Integration of light-and brassinosteroid-signaling pathways by a GATA transcription factor in Arabidopsis. Dev. Cell 19, 872–883. doi: 10.1016/j.devcel.2010.10.023
Manzoor, M. A., Sabir, I. A., Shah, I. H., Wang, H., Yu, Z., Rasool, F., et al. (2021). Comprehensive comparative analysis of the GATA transcription factors in four Rosaceae species and phytohormonal response in Chinese pear (Pyrus bretschneideri) fruit. Int. J. Mol. Sci. 22, 12492. doi: 10.3390/ijms222212492
Minh, B. Q., Schmidt, H. A., Chernomor, O., Schrempf, D., Woodhams, M. D., Von Haeseler, A., et al. (2020). IQ-TREE 2: new models and efficient methods for phylogenetic inference in the genomic era. Mol. Biol. Evol. 37, 1530–1534. doi: 10.1093/molbev/msaa015
Muramoto, N., Tanaka, T., Shimamura, T., Mitsukawa, N., Hori, E., Koda, K., et al. (2012). Transgenic sweet potato expressing thionin from barley gives resistance to black rot disease caused by Ceratocystis fimbriata in leaves and storage roots. Plant Cell Rep. 31, 987–997. doi: 10.1007/s00299-011-1217-5
Nimmakayala, P., Vajja, G., and Reddy, U. K. (2011). “Ipomoea,” in Wild Crop Relatives: Genomic and Breeding Resources, ed. Kole, C. (Berlin: Springer), 123–132.
Omichinski, J. G., Clore, G. M., Schaad, O., Felsenfeld, G., Trainor, C., Appella, E., et al. (1993). NMR structure of a specific DNA complex of Zn-containing DNA binding domain of GATA-1. Science 261, 438–446. doi: 10.1126/science.8332909
Park, J., Kim, H., Kim, S., Kong, S., Park, J., Kim, S., et al. (2006). A comparative genome-wide analysis of GATA transcription factors in fungi. Genomics Inf. 4, 147–160.
Peng, W., Li, W., Song, N., Tang, Z., Liu, J., Wang, Y., et al. (2021). Genome-wide characterization, evolution, and expression profile analysis of GATA transcription factors in Brachypodium distachyon. Int. J. Mol. Sci. 22, 2026. doi: 10.3390/ijms22042026
Reyes, J. C., Muro-Pastor, M. I., and Florencio, F. J. (2004). The GATA family of transcription factors in Arabidopsis and rice. Plant Physiol. 134, 1718–1732. doi: 10.1104/pp.103.037788
Schmittgen, T. D. and Livak, K. (2008). Analyzing real-time PCR data by the comparative CT method. Nat. Protoc. 3, 1101–1108. doi: 10.1038/nprot.2008.73
Schwechheimer, C., Schröder, P. M., and Blaby-Haas, C. E. (2022). Plant GATA factors: their biology, phylogeny, and phylogenomics. Annu. Rev. Plant Biol. 73, 123–148. doi: 10.1146/annurev-arplant-072221-092913
Shi, M., Huang, Q., Wang, Y., Wang, C., Zhu, R., Zhang, S., et al. (2022). Genome-wide survey of the GATA gene family in camptothecin-producing plant Ophiorrhiza pumila. BMC Genomics 23, 256. doi: 10.1186/s12864-022-08484-x
Sievers, F. and Higgins, D. G. (2018). Clustal Omega for making accurate alignments of many protein sequences. Protein Sci. 27, 135–145. doi: 10.1002/pro.3290
Sievers, F., Wilm, A., Dineen, D., Gibson, T. J., Karplus, K., Li, W., et al. (2011). Fast, scalable generation of high-quality protein multiple sequence alignments using Clustal Omega. Mol. Syst. Biol. 7, 539. doi: 10.1038/msb.2011.75
Tang, H., Krishnakumar, V., Zeng, X., Xu, Z., Taranto, A., Lomas, J. S., et al. (2024). JCVI: A versatile toolkit for comparative genomics analysis. Imeta. 3 (4), e211. doi: 10.1002/imt2.211
Todeschini, A.-L., Georges, A., and Veitia, R. A. (2014). Transcription factors: specific DNA binding and specific gene regulation. Trends Genet. 30, 211–219. doi: 10.1016/j.tig.2014.04.002
Voorrips, R. (2002). MapChart: software for the graphical presentation of linkage maps and QTLs. J. heredity 93, 77–78. doi: 10.1093/jhered/93.1.77
Wang, Y., Tang, H., Debarry, J. D., Tan, X., Li, J., Wang, X., et al. (2012). MCScanX: a toolkit for detection and evolutionary analysis of gene synteny and collinearity. Nucleic Acids Res. 40, e49–e49. doi: 10.1093/nar/gkr1293
Wang, L., Yin, H., Qian, Q., Yang, J., Huang, C., Hu, X., et al. (2009). NECK LEAF 1, a GATA type transcription factor, modulates organogenesis by regulating the expression of multiple regulatory genes during reproductive development in rice. Cell Res. 19, 598–611. doi: 10.1038/cr.2009.36
Wei, X., Li, Y., Zhu, X., Liu, X., Ye, X., Zhou, M., et al. (2023). The GATA transcription factor TaGATA1 recruits demethylase TaELF6-A1 and enhances seed dormancy in wheat by directly regulating TaABI5. J. Integr. Plant Biol. 65, 1262–1276. doi: 10.1111/jipb.13437
Wu, S., Lau, K. H., Cao, Q., Hamilton, J. P., Sun, H., Zhou, C., et al. (2018). Genome sequences of two diploid wild relatives of cultivated sweetpotato reveal targets for genetic improvement. Nat. Commun. 9, 4580. doi: 10.1038/s41467-018-06983-8
Yan, M., Nie, H., Wang, Y., Wang, X., Jarret, R., Zhao, J., et al. (2022). Exploring and exploiting genetics and genomics for sweetpotato improvement: Status and perspectives. Plant Commun. 3, 100332. doi: 10.1016/j.xplc.2022.100332
Ye, J., Coulouris, G., Zaretskaya, I., Cutcutache, I., Rozen, S., and Madden, T. L. (2012). Primer-BLAST: a tool to design target-specific primers for polymerase chain reaction. BMC Bioinf. 13, 1–11. doi: 10.1186/1471-2105-13-S6-S1
Yoon, U.-H., Cao, Q., Shirasawa, K., Zhai, H., Lee, T.-H., Tanaka, M., et al. (2022). Haploid-resolved and chromosome-scale genome assembly in hexa-autoploid sweetpotato (Ipomoea batatas (L.) Lam). bioRxiv. doi: 10.1101/2022.12.25.521700
Zhai, H., Wang, F., Si, Z., Huo, J., Xing, L., An, Y., et al. (2016). A myo-inositol-1-phosphate synthase gene, IbMIPS1, enhances salt and drought tolerance and stem nematode resistance in transgenic sweet potato. Plant Biotechnol. J. 14, 592–602. doi: 10.1111/pbi.12402
Zhang, X., Fan, R., Yu, Z., Du, X., Yang, X., Wang, H., et al. (2024). Genome-wide identification of GATA transcription factors in tetraploid potato and expression analysis in differently colored potato flesh. Front. Plant Sci. 15, 1330559. doi: 10.3389/fpls.2024.1330559
Zhang, C., Huang, Y., Xiao, Z., Yang, H., Hao, Q., Yuan, S., et al. (2020). A GATA transcription factor from soybean (Glycine max) regulates chlorophyll biosynthesis and suppresses growth in the transgenic Arabidopsis thaliana. Plants 9, 1036. doi: 10.3390/plants9081036
Zhang, F., Wu, Y., Shi, X., Wang, X., and Yin, Y. (2023). Comparative analysis of the GATA transcription factors in five solanaceae species and their responses to salt stress in wolfberry (Lycium barbarum L.). Genes 14, 1943. doi: 10.3390/genes14101943
Zhang, Y. J., Zhang, Y., Zhang, L. L., Huang, H. Y., Yang, B. J., Luan, S., et al. (2018). OsGATA7 modulates brassinosteroids-mediated growth regulation and influences architecture and grain shape. Plant Biotechnol. J. 16, 1261. doi: 10.1111/pbi.12887
Zhao, F., Liu, H., Qiao, Q., Wang, Y., Zhang, D., Wang, S., et al. (2021a). Complete genome sequence of a novel varicosavirus infecting tall morning glory (Ipomoea purpurea). Arch. Virol. 166, 3225–3228. doi: 10.1007/s00705-021-05240-6
Zhao, K., Nan, S., Li, Y., Yu, C., Zhou, L., Hu, J., et al. (2023). Comprehensive analysis and characterization of the GATA gene family, with emphasis on the GATA6 transcription factor in poplar. Int. J. Mol. Sci. 24, 14118. doi: 10.3390/ijms241814118
Zhao, T., Wu, T., Pei, T., Wang, Z., Yang, H., Jiang, J., et al. (2021b). Overexpression of SlGATA17 promotes drought tolerance in transgenic tomato plants by enhancing activation of the phenylpropanoid biosynthetic pathway. Front. Plant Sci. 12, 634888. doi: 10.3389/fpls.2021.634888
Zheng, Q., Huang, Y., He, X., Zhang, M.-M., and Liu, Z.-J. (2024c). Genome-wide identification and expression pattern analysis of GATA gene family in orchidaceae. Genes 15, 915. doi: 10.3390/genes15070915
Zheng, K., Lu, J., He, X., Lan, S., Zhai, T., Cao, S., et al. (2024a). Genome-Wide identification and expression analysis of GATA family genes in Dimocarpus longan Lour. Int. J. Mol. Sci. 25, 731. doi: 10.3390/ijms25020731
Zheng, L., Tang, L., and Li, J. (2024b). Genome-wide identification of the GATA gene family in melon (Cucumis melo) and analysis of their expression characteristics under biotic and abiotic stresses. Front. Plant Sci. 15, 1462924. doi: 10.3389/fpls.2024.1462924
Keywords: Ipomoea species, GATA genes, phylogenetic analysis, chromosome location, duplication analysis, cis-regulatory elements, expression patterns, stresses response
Citation: Si Z, Guo J, Ji Z, Men F and Wang W (2025) Comparative analysis of the GATA transcription factors in seven Ipomoea species. Front. Plant Sci. 16:1714791. doi: 10.3389/fpls.2025.1714791
Received: 28 September 2025; Accepted: 03 November 2025;
Published: 19 November 2025.
Edited by:
Yinghui Li, University of Haifa, IsraelCopyright © 2025 Si, Guo, Ji, Men and Wang. This is an open-access article distributed under the terms of the Creative Commons Attribution License (CC BY). The use, distribution or reproduction in other forums is permitted, provided the original author(s) and the copyright owner(s) are credited and that the original publication in this journal is cited, in accordance with accepted academic practice. No use, distribution or reproduction is permitted which does not comply with these terms.
*Correspondence: Zengzhi Si, c2l6ZW5nemhpQDE2My5jb20=