 Ke He
Ke He Yuan Su
 Lei He3*
 Jianfei Xing
- 1College of Mechanical and Electronic Engineering, Northwest A & F University, Yangling, China
- 2College of Enology, Northwest A & F University, Yangling, China
- 3Mechanical Equipment Research Institut, Xinjiang Academy of Agricultural Reclamation Science, Shihezi, China
- 4College of Mechanical and Electrical Engineering, Tarim University, Alar, China
- 5College of engineering, China Agricultural University, Beijing, China
- 6Institute of Botany, Plant Physiology and Genetics, Academy of Sciences, Dushanbe, Tajikistan
Introduction: The soluble solids content (SSC), titratable acidity (TA), and pH are key indicators for evaluating the quality of table grapes during storage. Conventional detection methods are typically destructive and time-consuming. To address this limitation, visible-near infrared (Vis-NIR) spectroscopy was employed in this study to enable rapid and non-destructive quality assessment of fresh table grapes throughout the storage period.
Methods: Seedless White table grape samples were analyzed within the 200–1100 nm spectral range, and calibration models for key quality parameters (SSC, TA, and pH) were established. Three machine learning algorithms, partial least squares regression (PLSR), support vector machine (SVM), and extreme learning machine (ELM), were employed to develop spectral prediction models based on characteristic wavelengths selected using different feature extraction strategies, including the successive projection algorithm (SPA), uninformative variable elimination (UVE), and competitive adaptive reweighted sampling (CARS).
Results: The results demonstrate that the SNV-CARS-SVM models achieved excellent performance in predicting SSC with a root mean square errors (RMSEP) of 0.673, a coefficient of determination for the prediction data set (Rp) of 0.928 and an RPD of 3.311. Similarly, the SNV-SPA-SVM models exhibited excellent predictive accuracy for TA, yielding an RMSEP of 0.553, an Rp of 0.873, and an RPD of 2.662. Good performances were achieved with Rp of 0.758 and RMSEP of 0.113 with the SNV-CARS-PLSR model for pH.
Discussion: This study, for the first time, utilized Vis-NIR spectroscopy to achieve the simultaneous and rapid determination of multiple quality attributes in table grapes, providing a novel and efficient strategy for real-time and non-destructive quality evaluation during storage. The proposed approach showed considerable potential for rapid quality assessment and postharvest management of grapes. Future research will focus on expanding the diversity of grape cultivars and investigating various storage conditions to improve the robustness and transferability of the predictive model, thereby promoting the industrial validation and practical application of Vis-NIR spectroscopy in fruit quality monitoring.
1 Introduction
Grape is an important economic crop with dual purposes serving both fresh consumption and processing. It is rich in glucose, fructose, organic acids, amino acids, and essential minerals, which together contribute to its high nutritional value. The flavonoids and anthocyanins in grape skins possess strong antioxidant and anti-aging properties (Zeng et al., 2024; Ma et al., 2024). According to data from the China Agricultural Yearbook, the China vineyard area reached approximately 0.7 million hectares in 2020, encompassing grapes cultivated for fresh consumption, winemaking, drying, and juice production (Li et al., 2021). Meanwhile, China’s table grape export volume has reeched around 375,000 tons in 2022, ranking third globally, which demonstrating the vigorous development of the grape industry (Liu et al., 2024).
Table grape quality is a crucial factor influencing consumer preferences and market value. High-quality table grapes not only exhibit superior sensory attributes but also possess enhanced nutritional characteristics. In general, grape quality can be classified into external and internal physicochemical attributes. The internal quality parameters mainly include soluble solids content (SSC), titratable acidity (TA), and pH (Wu et al., 2024). Soluble solids content (SSC) reflects the sweetness and nutritional status of the fruit, titratable acidity (TA) affects flavor balance, and pH is closely related to storage stability and sensory perception. At present, the internal quality of grapes is primarily evaluated through conventional chemical analysis, including acid-base titration, refractometry, and Fehling solution titration. Although these methods provide high accuracy, they are destructive, labor-intensive, time-consuming, and prone to human error, thereby reducing overall efficiency (Guo et al., 2015; Ma et al., 2018; Pissard et al., 2021). Therefore, developing a rapid, accurate, and non-destructive method for determining SSC, TA, and pH in table grapes is crucial for quality assessment and postharvest management.
With the rapid development of agricultural information technologies, spectral analysis has become a powerful tool for non-destructive fruit quality assessment due to its speed, convenience, and reliability. Visible and near-infrared (Vis-NIR) spectroscopy enables quantitative prediction of internal quality parameters by analyzing the optical properties of fruit tissues (Roberto et al., 2018; Ncama et al., 2018). For example, in studies predicting grape quality, Dambergs et al. (2006) applied Vis-NIR spectroscopy to determine anthocyanins, pH, and SSC in wine grapes across multiple cultivars, vintages, and regions, developing predictive models with robust performance. Similarly, Xiao et al. (2018) employed Vis-NIR spectra to classify five ripening stages of different grape varieties, achieving classification accuracies of 90% and 100% for “Manicure Finger” and “Ugni Blanc,” respectively. These findings highlight the feasibility of near-infrared spectroscopy for grape quality assessment. The table grapes undergo a storage period from harvest to sale, during which their internal quality may change. However, most existing studies have focused on predicting the multiple qualities of table grapes at maturity (Xiao et al., 2018), while few studies on the detection of multiple parameters in table grapes during storage remain limited.
In light of the aforementioned limitations, this study aims to develop a rapid and non-destructive method for the simultaneous determination of multiple quality parameters in table grapes during storage using Vis-NIR spectroscopy. The specific objectives of this research are: (1) to acquire Vis-NIR spectral data alongside corresponding reference measurements of table grape quality parameters during storage; (2) to identify the most effective data preprocessing method for enhancing model performance through comparative analysis; and (3) to optimize predictive models by evaluating different modeling algorithms and wavelength selection strategies. This study seeks to advance table grape quality assessment from conventional destructive analyses toward intelligent, non-destructive evaluation, thereby improving quality control efficiency during table grape storage. The main steps of evaluation of quality parameters in table grape samples by Vis-NIR were schematically shown in Figure 1.
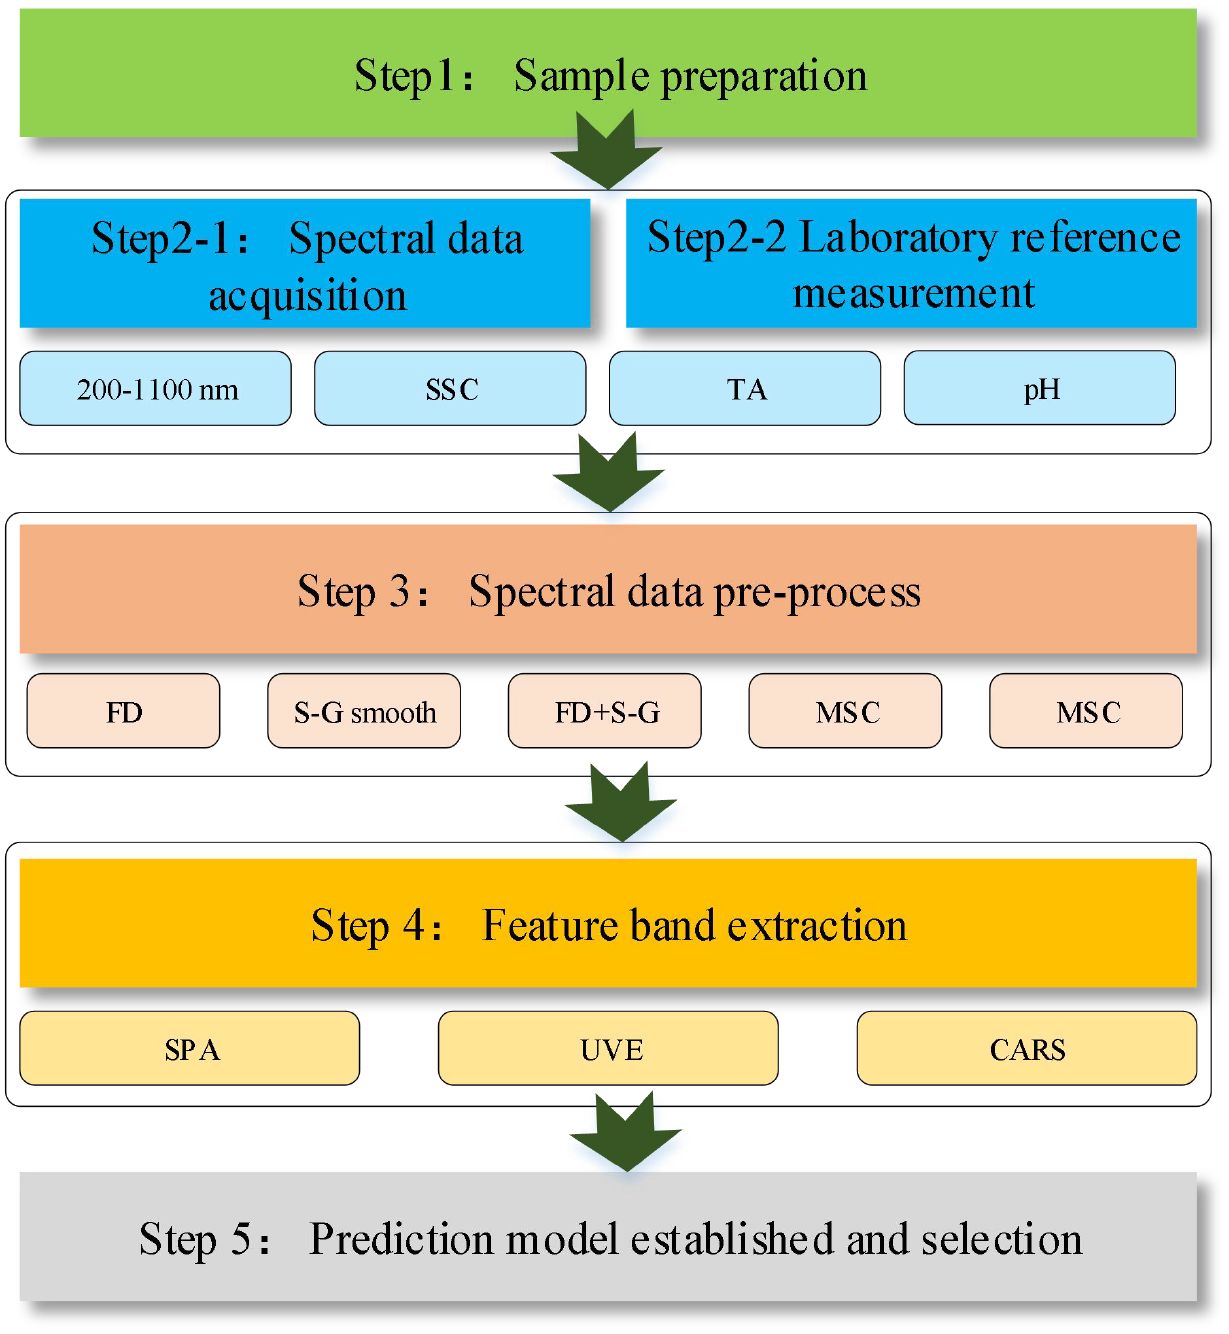
Figure 1. Schematic diagram illustrating the workflow of data processing.
2 Materials and methods
2.1 Experiment materials
The experimental material used in this study consisted of Seedless White table grapes (Vitis vinifera L.) harvested from the Caoxinzhuang Experimental Farm (34°18′0″ N; 108°5′23.9″ E) of Northwest A&F University in Yangling, Shaanxi Province. To prevent damage to the berries, individual grapes were carefully excised from the clusters using pruning shears, leaving a short section of the pedicel attached to minimize moisture loss. Uniform, undamaged berries of similar size were selected and divided into three groups. Grapes were stored for 15 days under three temperature conditions: cold storage (2.7 °C), refrigeration (10.0 °C), and room temperature (20.6 °C). For each measurement, nine berries per group were used for spectral data acquisition, while twenty berries were used to determine soluble solids content (SSC), titratable acidity (TA), and pH. In total, 145 sets of SSC, TA, pH, and spectral data were collected.
2.2 Vis-NIR spectroscopy detection acquisition
The spectral data were collected using a ATP3030 spectrometer system (Optosky Photonics Inc., Xiamen, China). The spectrometer system includes a halogen lamp (HL-2000), a dark chamber, a computer, and a spectrometer in the 200–1100 nm wavelength range with a resolution of 0.5 nm. The diffuse reflection whiteboard (WR-D97) and an optical fiber are also necessary for the experiment. The overall composition of the experimental system is shown in Figure 2. Data were acquired using Optosky Spectra software (V3.1.25) with a 1 ms integration time. Black and white reference measurements were performed and calibrated prior to data acquisition. Due to significant noise at the spectral front, only data within the 400–1100 nm range were retained, yielding 1508 variables per spectrum curve. Grape spectral data were collected under illumination from a tungsten halogen lamp. For each grape sample, spectra were acquired three times, and the mean value was used as the final spectral data for analysis.
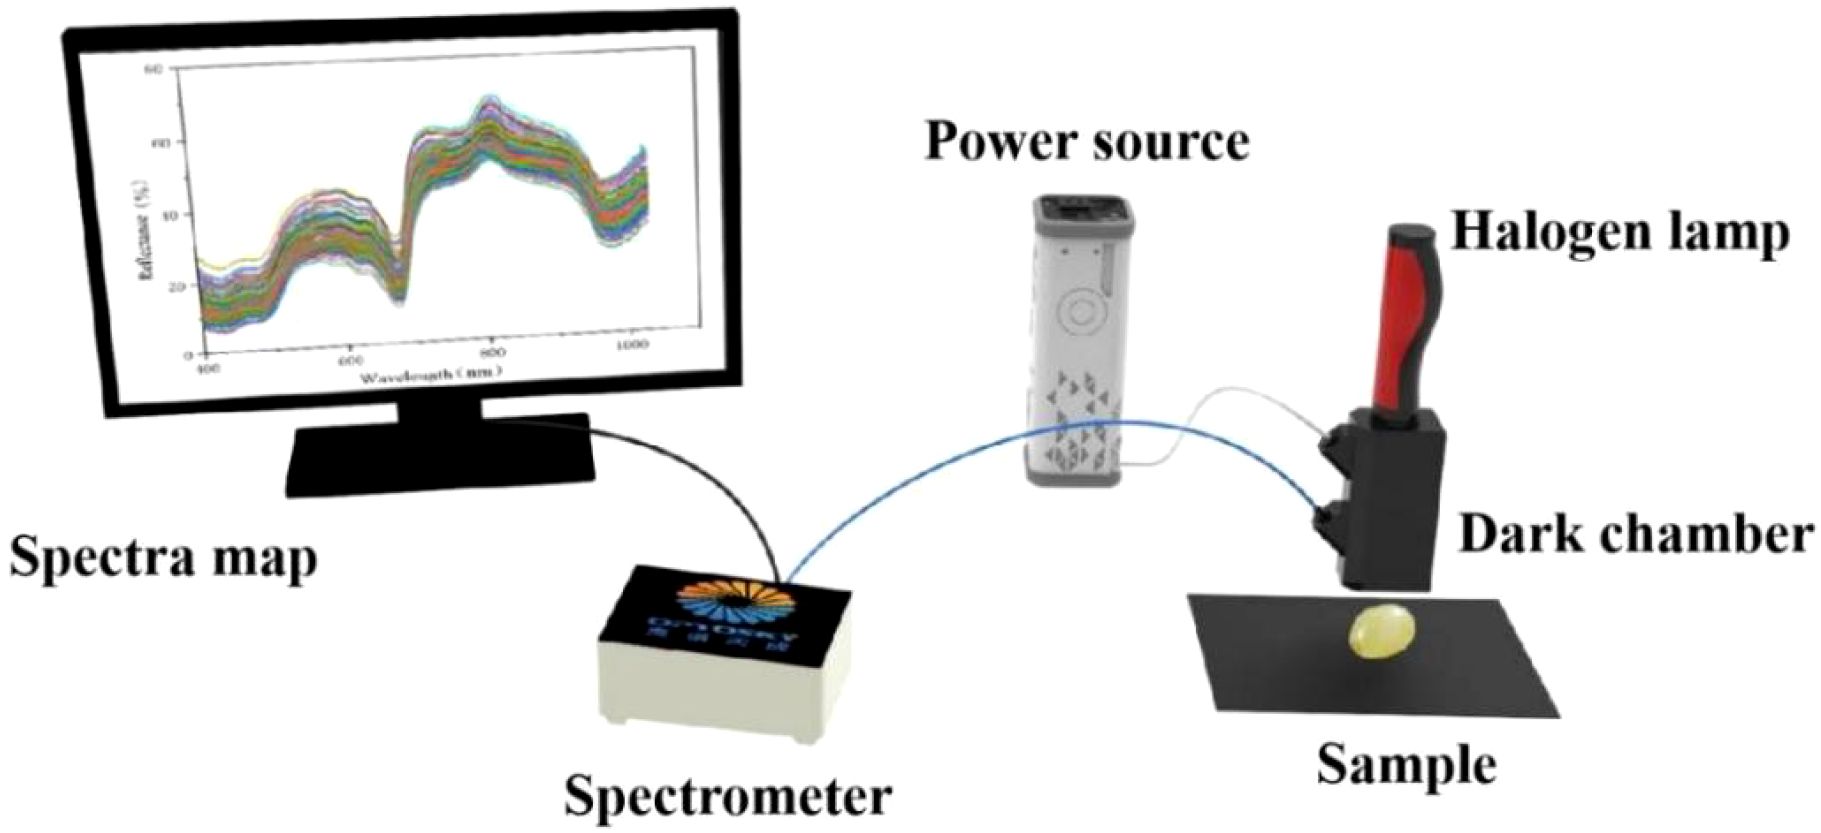
Figure 2. The Vis-NIR spectroscopy data acquisition system.
2.3 Laboratory reference measurement
The grape samples from each group were separated into skin, flesh, and seeds. The flesh was pressed and filtered through four layers of gauze to obtain grape juice, which was subsequently used to determine the soluble solids content (SSC), pH, and titratable acidity (TA). The SSC was measured using a digital handheld refractometer (ATAGO PAL-1, Japan). Each measurement was performed in triplicate, and the mean value was recorded for analysis (Su et al., 2025). The pH of the grape juice was determined using a calibrated pH meter. Prior to measurement, the instrument was standardized with buffer solutions of known pH values, and the electrode was subsequently immersed in the juice sample. The pH value was recorded after stabilization. Each sample was measured in triplicate, and the mean value was calculated for analysis (Liu et al., 2024). The titratable acidity (TA) of each sample was determined by potentiometric titration following the OIV “Wine and Grape Juice Analysis Method,” using a Mettler automatic potentiometric titrator. Prior to analysis, the titrator was calibrated. A 2 mL aliquot of grape juice was transferred into a beaker, to which 50 mL of distilled water was added. The electrode and magnetic stirrer were immersed in the solution, and titration was carried out with a standard sodium hydroxide solution. TA was expressed as tartaric acid equivalents. Each sample was measured in triplicate, with a maximum measurement error of 0.5 mL, and the mean value was recorded. Blank determinations were performed simultaneously, and the final TA values were corrected accordingly (Xing et al., 2025; Zhou et al., 2024).
2.4 Spectral data pre-process method
The collected spectral data are affected by multiple factors, including environmental conditions, instrument performance, and random noise, which may introduce redundant or irrelevant information and consequently reduce model stability and accuracy. To mitigate these effects and improve the reliability of subsequent analyses, preprocessing of the raw spectral data is therefore essential. In this study, five preprocessing methods were applied, including first derivative (FD), Savitzky-Golay convolutional smoothing (S-G), standard normal variate (SNV), and multivariate scatter correction (MSC). First derivative processing calculates the first derivative of the spectral data to enhance spectral features and minimize baseline shifts and offsets. (Ferreira et al., 2018). This method is particularly effective for complex spectral datasets, as it improves data accuracy and reliability, although it may also amplify noise. The S-G smoothing method, which is based on the least-squares polynomial fitting principle, is widely used for spectral smoothing (De-Lima et al., 2018). By fitting polynomials to local segments of the data, this method smooths the spectral curve and suppresses random noise, resulting in a more continuous and stable signal. The SNV transformation corrects for systematic shifts and scaling variations in spectral data, thereby standardizing the spectra and improving their comparability (Caramês et al., 2019). The MSC method effectively eliminates spectral distortions caused by variations in scattering intensity, thereby enhancing the correlation between spectral data and target attributes (Guo et al., 2011).
2.5 Feature band extraction method
The Vis-NIR spectroscopy produces a large volume of spectral data; however, such high-dimensional datasets are not ideal for real-time data acquisition and processing. Therefore, selecting a subset of optimal wavelengths that effectively represent the full spectrum is essential for reducing data dimensionality and improving the computational efficiency of modeling. In this study, three wavelength selection methods were employed. The successive projection algorithm (SPA) is an effective multivariate calibration method for variable selection, capable of identifying characteristic spectral bands and reducing collinearity among variables (Lu et al., 2019). The uninformative variable elimination (UVE) is a feature wavelength selection method that uses partial least squares regression coefficients to assess the importance of each wavelength. The UVE method accounts for both noise and physicochemical information during feature wavelength selection, thereby minimizing the risk of choosing variables that are insensitive to the target components (Zhang et al., 2020). The competitive adaptive reweighted sampling (CARS) efficiently reduces the dimensionality of the spectral data and identifies key variables to enhance model predictive performance (Zhang et al., 2022).
2.6 Model calibration
In this study, three regression algorithms, partial least squares regression (PLSR), support vector machine (SVM), and extreme learning machine (ELM), were applied and compared to develop predictive models for the quality parameters of Seedless White grape samples. The PLSR algorithm transforms raw spectral data into a set of orthogonal and independent latent variables that preserve the essential information of the original spectra. This approach effectively addresses collinearity in spectral data, suppresses noise interference, and allows simultaneous modeling of multiple response variables (Su et al., 2019). In the PLSR model, cross-validation was employed to determine the optimal number of latent variables. The SVM algorithm, a nonlinear modeling technique grounded in statistical learning theory, constructs an optimal hyperplane in a high-dimensional feature space to perform regression or classification. Its capability to handle nonlinear, high-dimensional, and highly correlated data offers strong generalization performance for complex spectral datasets (Yu et al., 2023).In this study, the support vector machine (SVM) employed the radial basis function (RBF) as its kernel, and the hyperparameters c and g were optimized using a grid search method. The ELM algorithm, a single-hidden-layer feedforward neural network model, randomly generates input-to-hidden layer weights and analytically determines output-layer weights, enabling rapid learning and prediction. This approach achieves high predictive accuracy while substantially improving computational efficiency, making it particularly suitable for large-scale spectral data analysis (Sun et al., 2023). By comparing these three algorithms, the most suitable model for predicting grape quality parameters was determined.
2.7 Evaluation of the indicators
To comprehensively assess a model’s predictive performance, commonly used metrics include the correlation coefficient of the calibration set (RC), the correlation coefficient of the prediction set (RP), the root mean square error of calibration (RMSEC), the root mean square error of prediction (RMSEP), and the ratio (RPD) of the prediction set standard deviation to RMSEP (Kamruzzaman et al., 2016; Xu et al., 2016; Zheng et al., 2019). For a spectral prediction model to achieve high predictive accuracy, the evaluation criteria typically include: (1) maximizing the correlation coefficients of the calibration and prediction sets (RC and RP) while minimizing the corresponding root mean square errors (RMSEC and RMSEP); (2) ensuring that the correlation coefficients and root mean square errors of the calibration and prediction sets are comparable, with RC slightly exceeding RP and RMSEC slightly less than RMSEP; and (3) attaining the highest ratio of performance to deviation (RPD) (Lu et al., 2019; Khoshnoudi-Nia and Moosavi-Nasab, 2019).
3 Results and discussion
3.1 Statistics of measured reference values
Developing spectral prediction models with high accuracy and reliability requires that the calibration and prediction datasets satisfy specific distributional criteria for reference measurements. The range of reference values in the calibration set should fully cover that of the prediction set. Furthermore, the mean and standard deviation of reference values in the calibration set should be slightly higher than or comparable to those in the prediction set (Su et al., 2025). In this study, 145 samples were divided into calibration and prediction sets at a ratio of 3:1 using the gradient concentration method to satisfy these requirements. The results were shown in Table 1, where the calibration set comprised 109 samples and the prediction set included 36 samples. The reference measurement ranges for SSC in the calibration and prediction sets were 9.23-22.73% and 11.40-22.07%, respectively; for TA in the calibration and prediction sets were 3.87-9.79 g/L and 3.96-9.79 g/L; and for pH in the calibration and prediction sets were 3.22-4.10 and 3.06-4.59, respectively. These results indicated that the calibration set fully encompassed the prediction set.
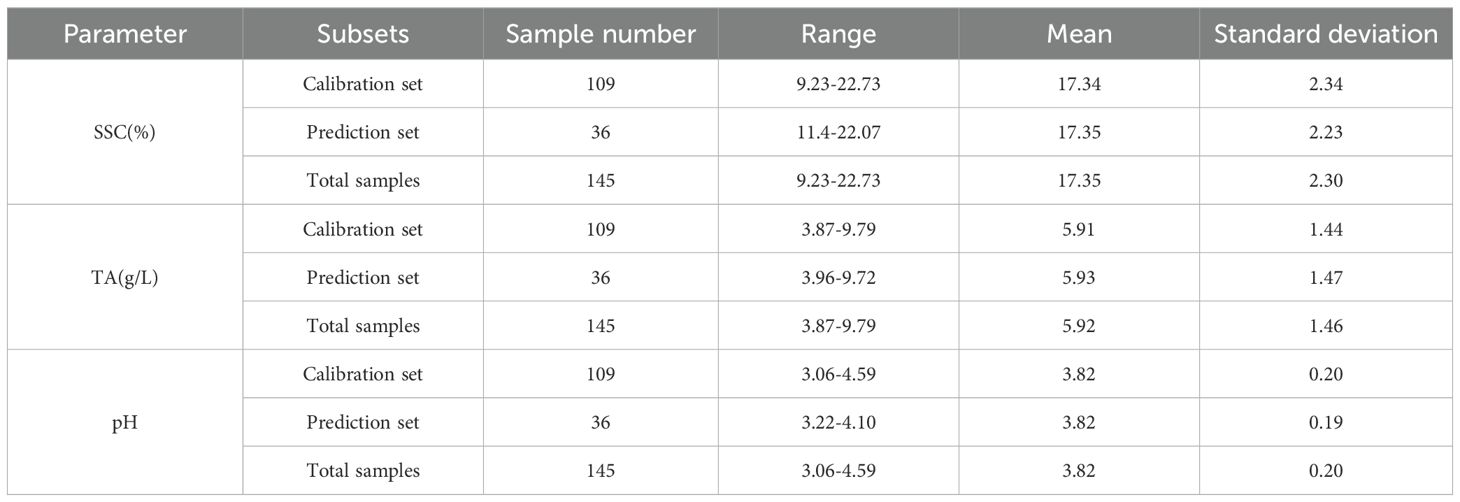
Table 1. Reference measurement of seedless white grape.
3.2 Spectral characterization of table grape
Figure 3 presents the original and preprocessed spectral curves of seedless white grapes. The spectral profiles of samples stored for different durations exhibit similar patterns without any obvious abnormal peaks, indicating that the spectral data of all 145 grape samples are consistent and free from significant anomalies. Nevertheless, variations in spectral reflectance intensity were observed, indicating the need for multivariate data analysis to clarify the relationship between near-infrared spectra and texture characteristics.Three prominent peaks were observed at 530–630 nm, 720 nm, and 810 nm, accompanied by two valleys at 670 nm and 970 nm. The yellow-green skin color of Seedless White grapes corresponds to the peak between 580 and 630 nm. The valley at 670 nm lies within the chlorophyll absorption region and may be associated with the absorption of carotenoids and chlorophyll. The absorption at 810 nm may be attributed to temperature-related optical path corrections, whereas the absorption at 970 nm corresponds to the stretching vibrations of carbohydrates and O-H bonds in water (Lin et al., 2024).
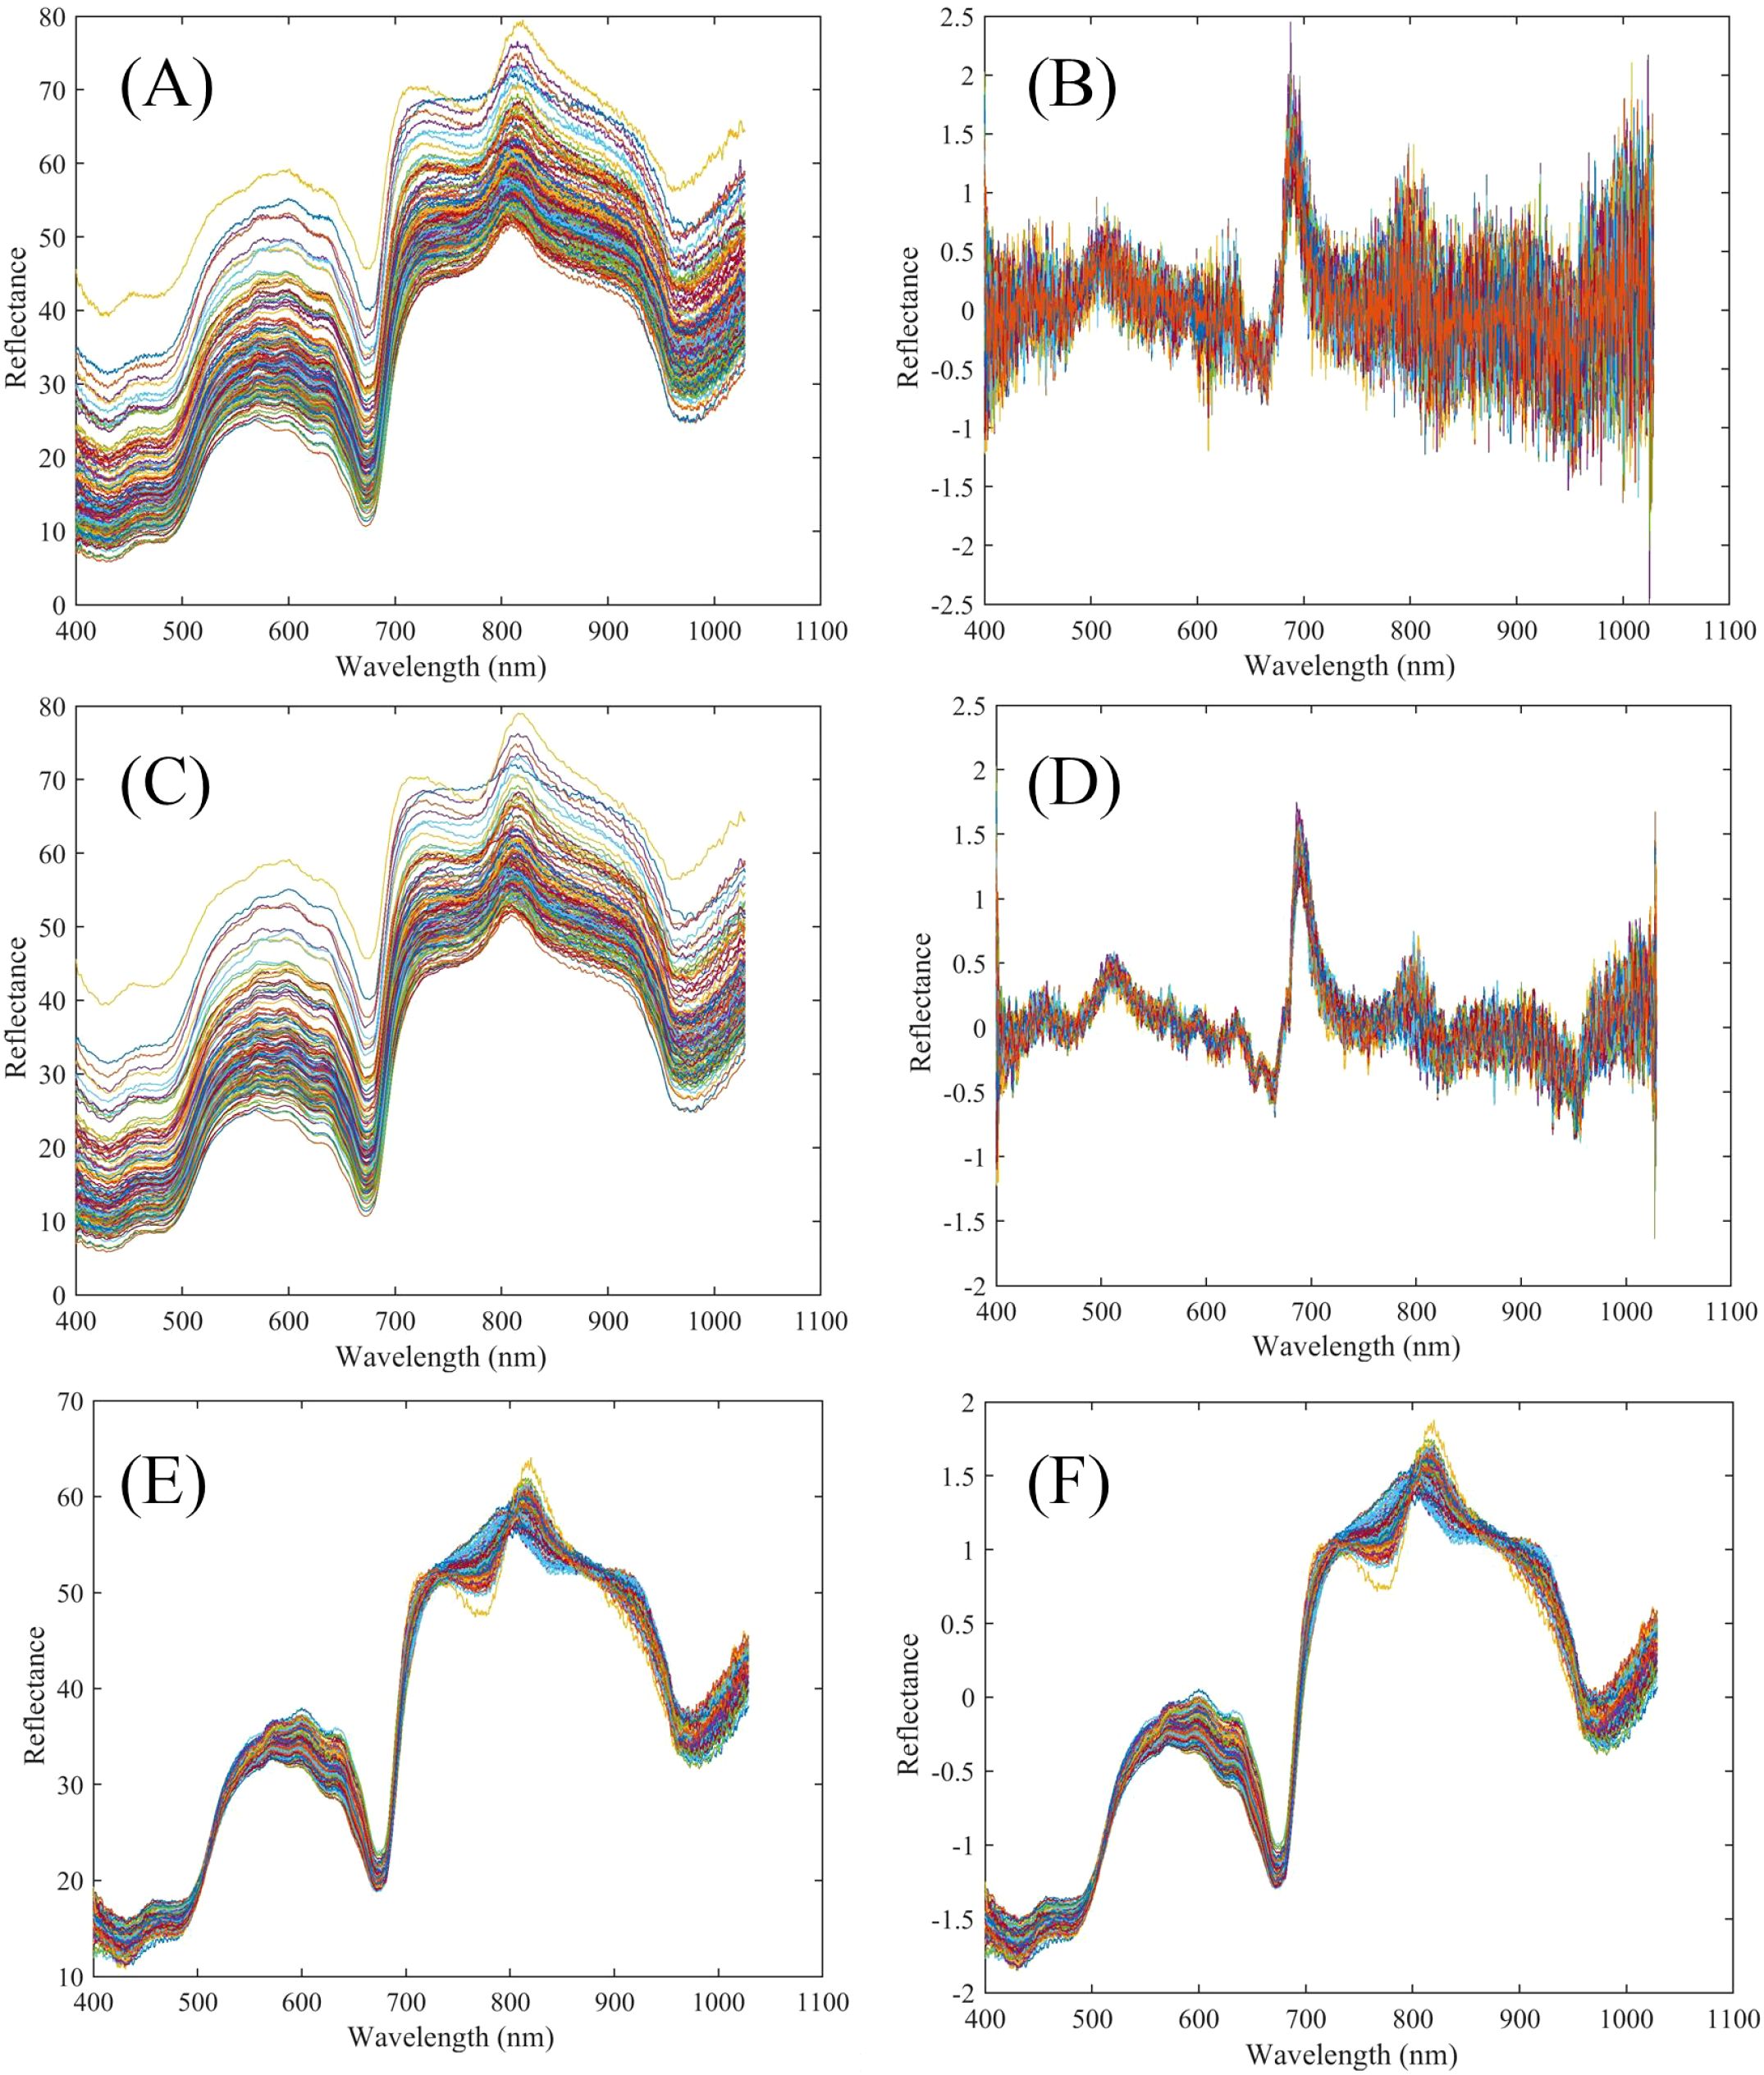
Figure 3. Grapes spectral reflectance curves (A) Raw spectral curve of grapes (B) FD preprocess spectral curve of grapes (C) S-G preprocess spectral curve of grapes (D) FD+S-G preprocess spectral curve of grapes (E) MSC preprocess spectral curve of grapes (F) SNV preprocess spectral curve of grapes.
3.3 Prediction models using full spectral range
In this study, five spectral preprocessing algorithms were applied to establish quantitative relationships between the reflectance spectral data matrix (X) and the reference variable (Y) across the entire spectral range via partial least squares regression (Xu et al., 2016). A linear regression model incorporating chemical composition and full-spectrum information was developed to predict the SSC, TA, and pH of seedless white grapes. As shown in Table 2, the FD preprocess method decreased the Rp and RPD values of the prediction model due to amplified spectral noise. In contrast, S-G smoothing, MSC, and SNV preprocessing methods yielded models with superior predictive performance compared with the model based on the raw spectra. Among these models, the model developed using SNV preprocessing achieved the highest prediction accuracy. The correlation coefficients (Rc and Rp), root mean square errors (RMSEC and RMSEP), and ratio of performance to deviation (RPD) for the SSC prediction model were 0.949, 0.897, 0.736, 0.984, and 2.266, respectively; for the TA prediction model, they were 0.877, 0.868, 0.690, 0.739, and 1.997, respectively; and for the pH prediction model, they were 0.759, 0.756, 0.129, 0.124, and 1.513, respectively. These findings indicated that the PLSR model developed using the SNV-preprocessed matrix provided the best predictive performance for determining the quality parameters of Seedless White grapes. Therefore, the SNV preprocessing methods could be effectively applied in subsequent analyses to extract valuable information regarding grape quality attributes.
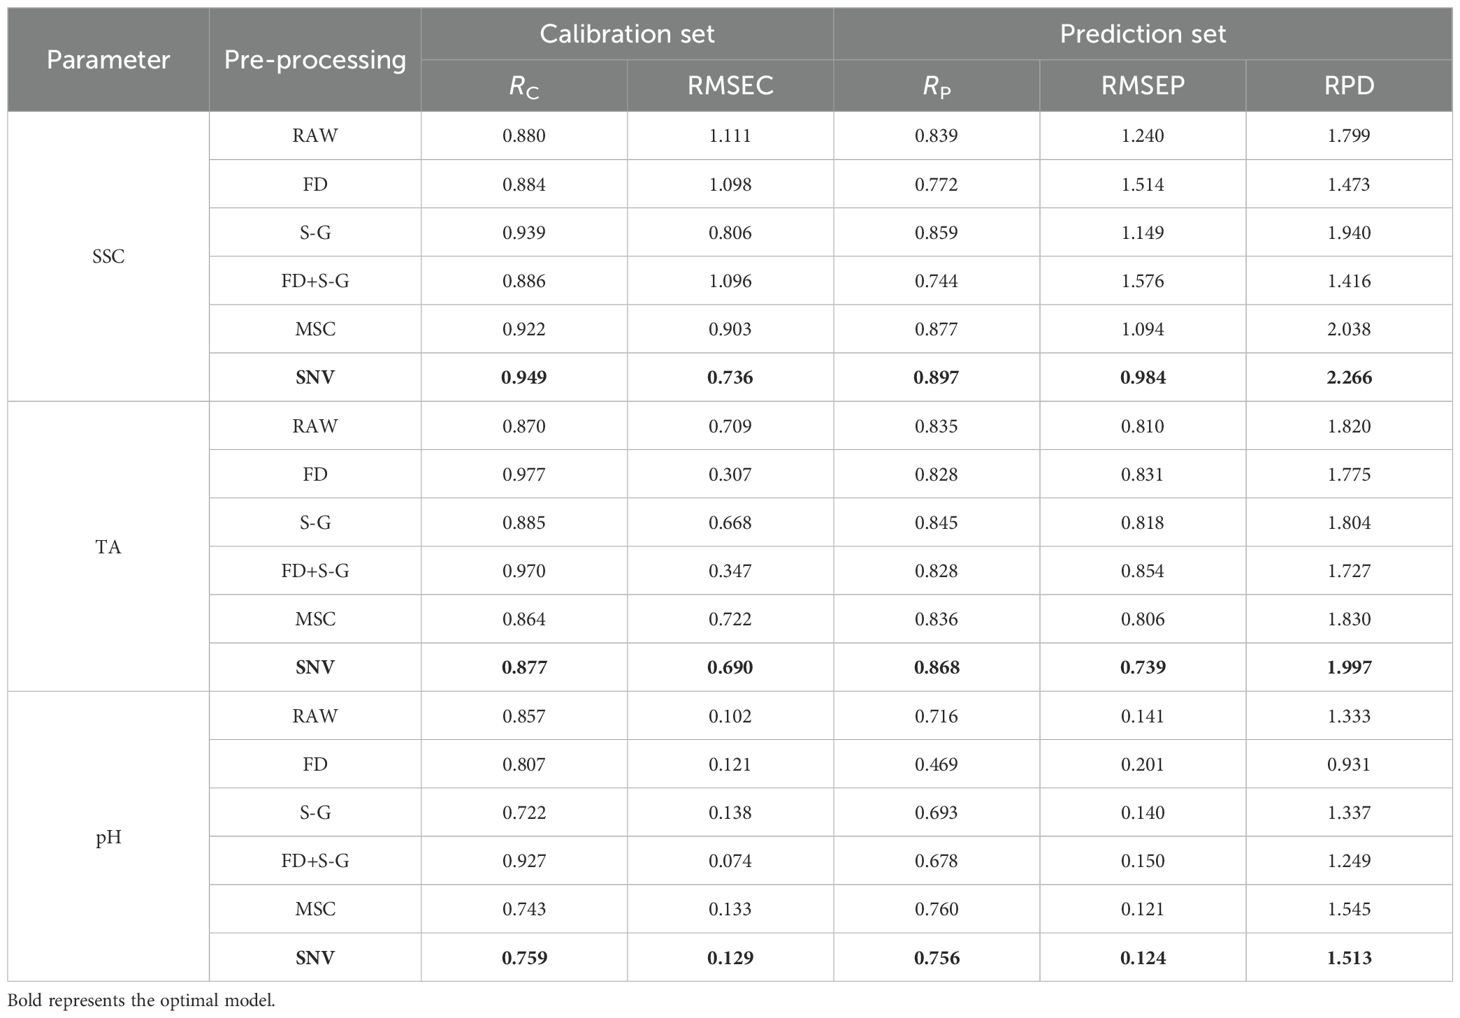
Table 2. Results of PLSR models based on different spectral pretreatments.
3.4 Selection of effective wavelengths
When using the SPA method to screen feature wavelengths, the maximum number of selected variables was set to 30. Figure 4 illustrated the feature wavelengths selected by the SPA for SSC, TA and pH in grapes. The corresponding wavelengths associated with SSC were 615, 261, 287, 780, 828, 979, 1108, 1114, 1133, 1135, 1138, 1140, 1142, 1144, 1150, 1165, 1196, 1331, and 1386 nm. The wavelengths associated with TA were 3, 105, 965, 990, 1127, 1136, 1138, 1144, 1146, 1156, 1163, 1165, 1170, 1174, 1184, 1196, 1340, 1374, 1495, and 1505 nm. The wavelengths associated with pH were 12, 309, 716, 1103, 1109, 1113, 1117, 1127, 1131, 1135, 1139, 1149, 1156, 1170, 1181, 1191, 1206, 1393, 1490, and 1499 nm. Notably, multiple variables within the 1000–1200 nm wavelength range were consistently selected for all three quality parameters, suggesting that this spectral region plays a critical role in constructing predictive models for grape quality assessment (Yang et al., 2022).
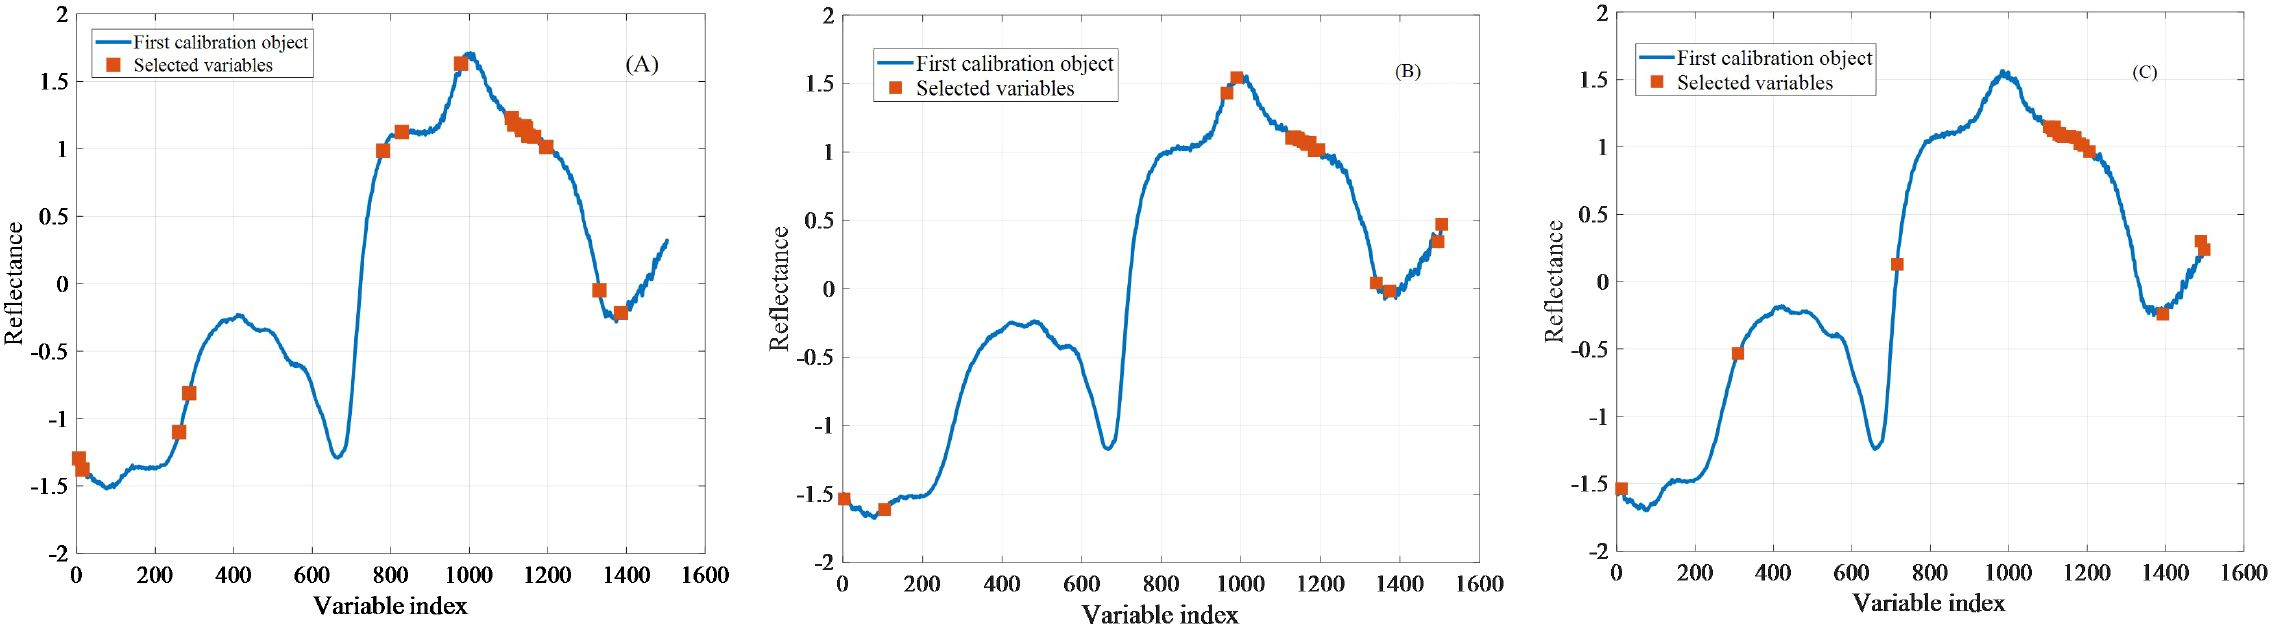
Figure 4. The effective variables of grape quality parameters selected by SPA method. The optimal subset of SSC, TA and pH contains 20, 20 and 20 variables respectively, displayed as solid rectangles in (A–C).
Figure 5 shows the distribution of feature wavelengths selected by the UVE method after SNV preprocessing. The horizontal axis corresponds to the spectral and noise matrix, whereas the vertical axis represents the stability t-value. Two parallel lines indicate the threshold limits: variables with stability values between these lines were excluded, whereas those exceeding the threshold were retained as feature wavelengths. After removing irrelevant variables, the number of feature variables associated with SSC, TA, and pH was reduced to 275, 98, and 239, respectively. Notably, the UVE-selected feature variables include wavelengths in the 1000–1200 nm range and meanwhile span nearly the entire spectral range.
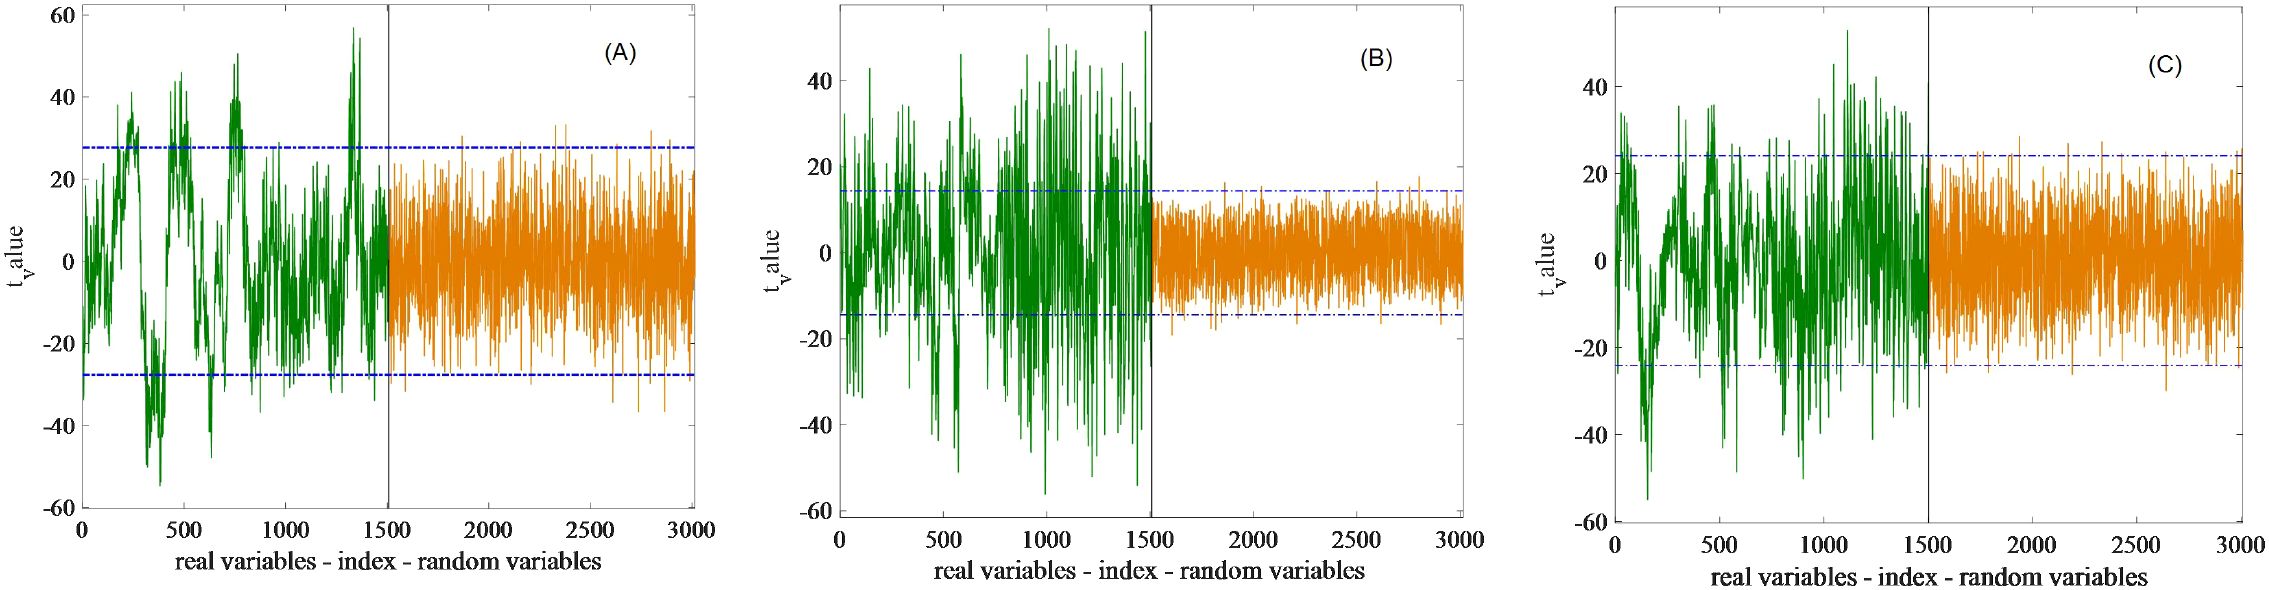
Figure 5. The effective variables of grape quality parameters selected by UVE method. The optimal subset of SSC, TA and pH contains 275, 98 and 239 variables respectively, displayed in (A–C).
Figure 6 illustrates the selection of characteristic wavelengths for grape quality parameters via the CARS algorithm. It depicts the relationship among the number of sampling runs, the number of selected wavelength variables, RMSECV values, and regression coefficient trajectories (Cheng et al., 2020; Fan et al., 2021). As the number of sampling runs increases, the efficiency of feature variable selection improves substantially, progressing from coarse to fine screening. The RMSECV value attains its minimum at the 48th sampling run. During the 1st to 48th sampling runs, the RMSECV value decreases, followed by an upward trend from the 49th to the 100th run, indicating that the CARS algorithm may have eliminated some critical information related to SSC. Ultimately, the CARS algorithm selected 57, 27, and 25 wavelengths for SSC, TA, and pH, respectively.
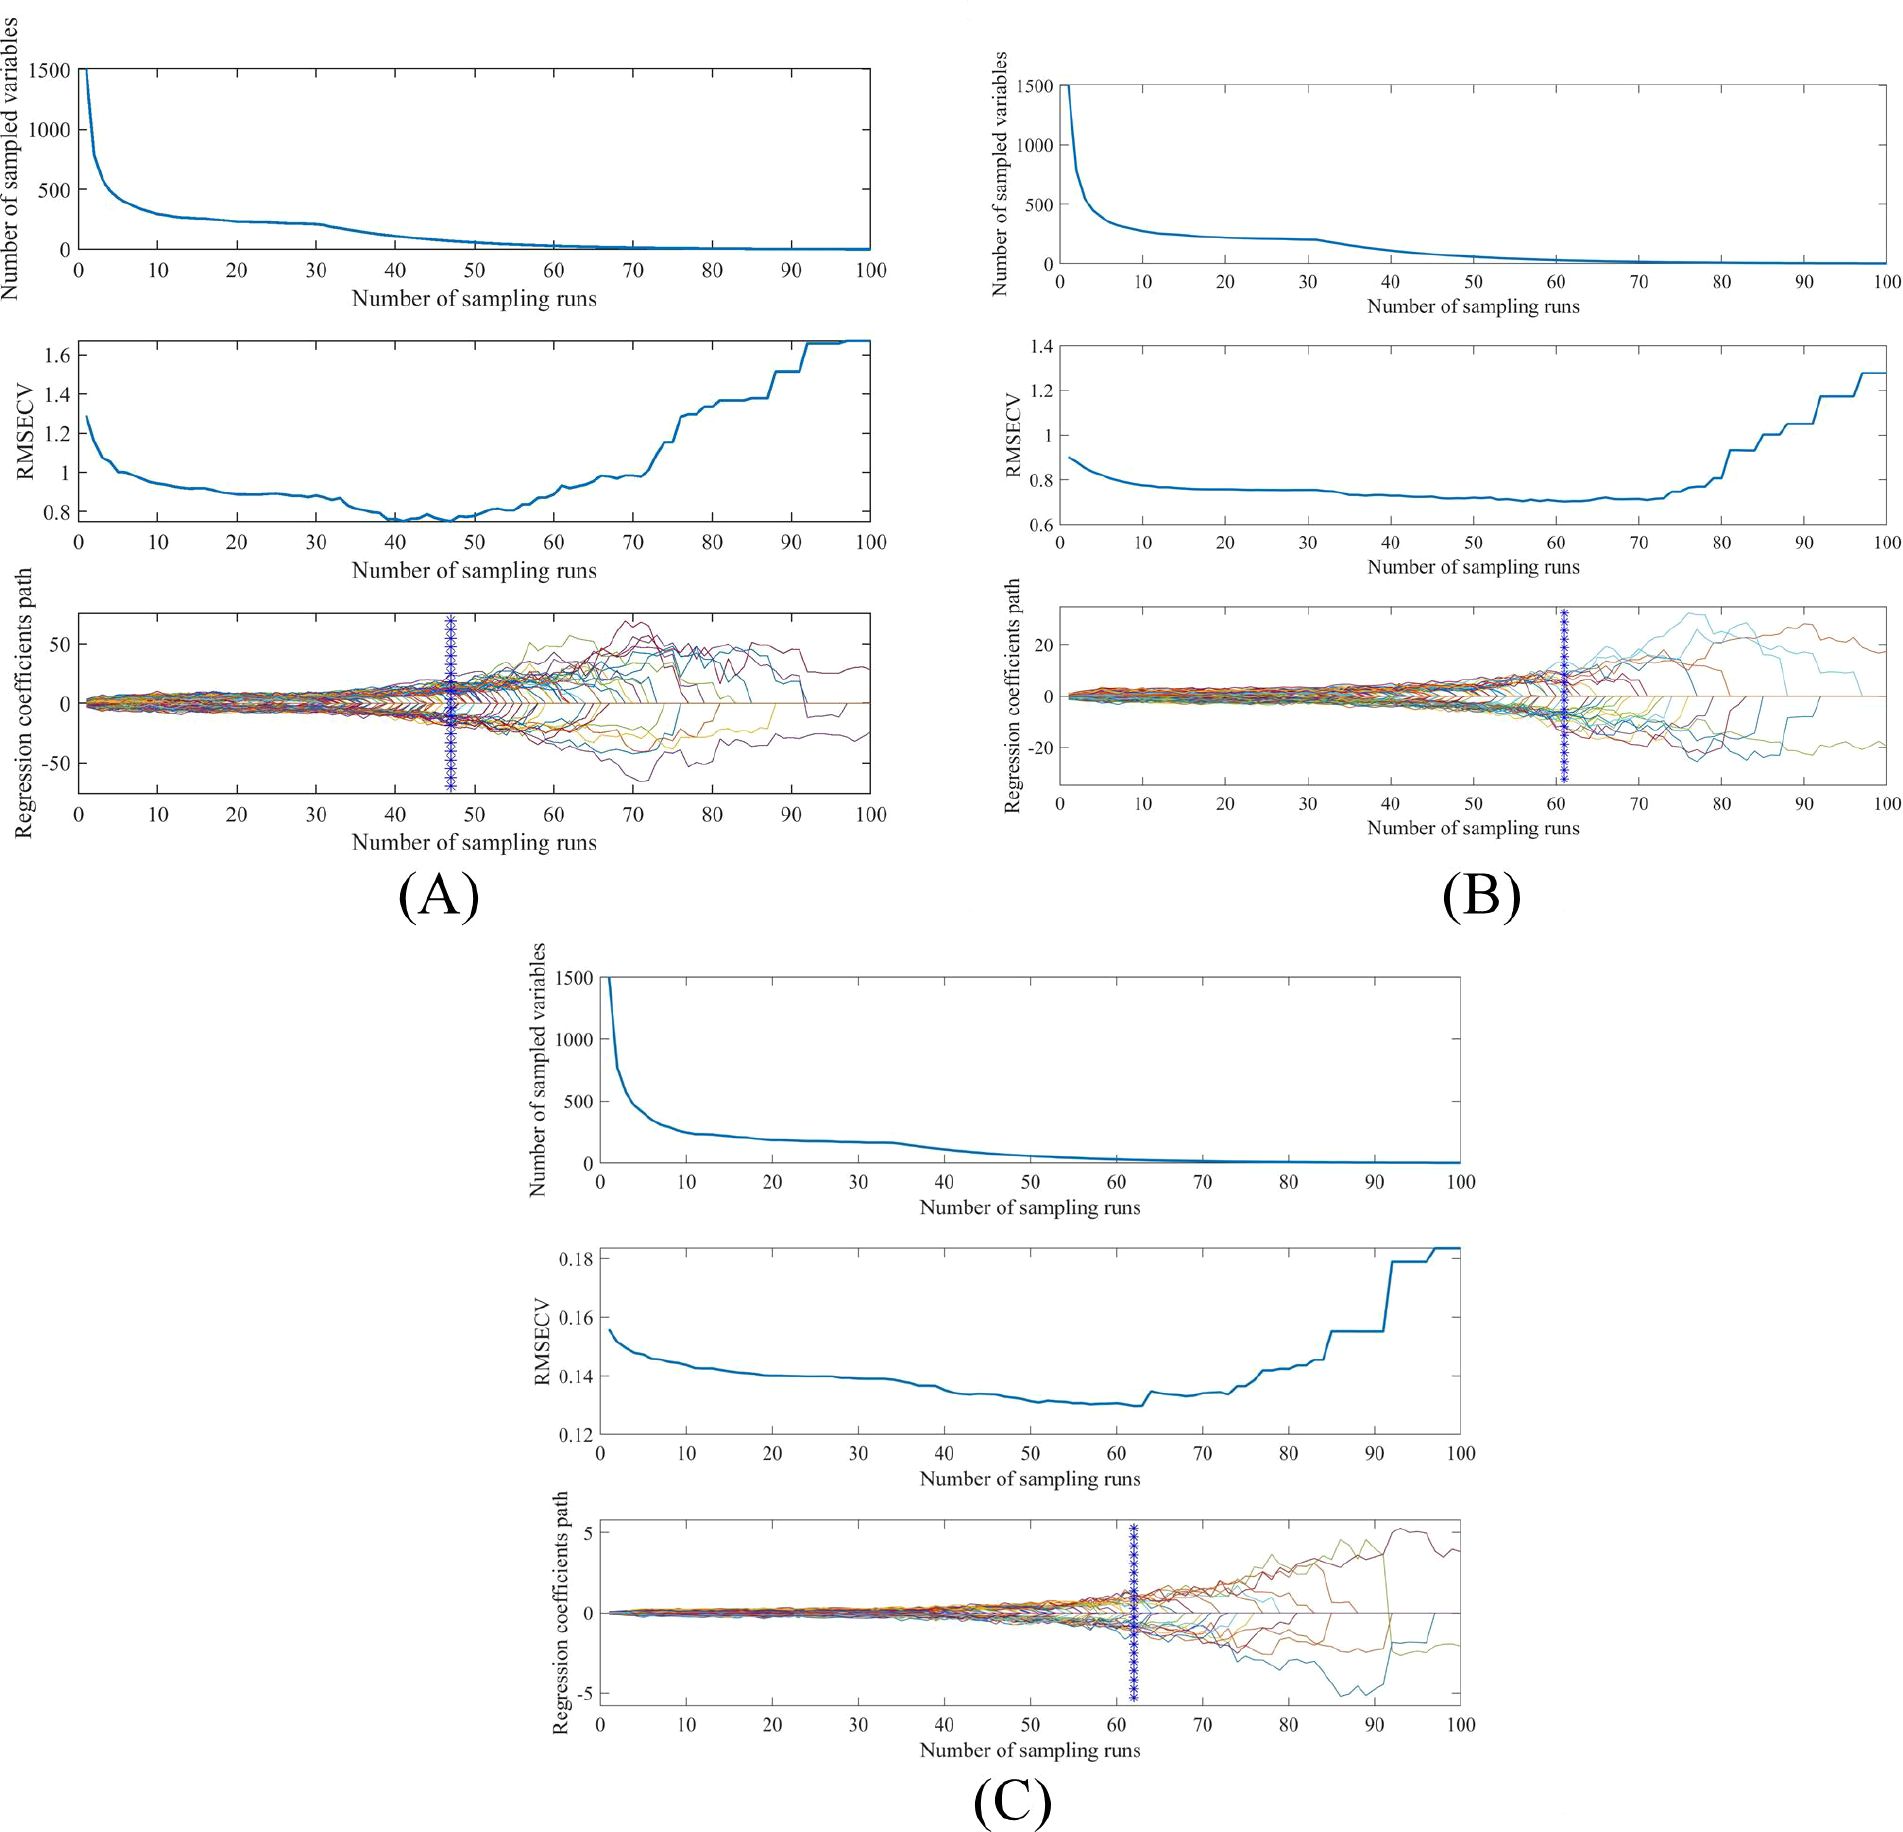
Figure 6. The effective variables of grape quality parameters selected by CARS method. The optimal subset of SSC, TA and pH contains 57, 27 and 25 variables respectively, displayed as solid rectangles in (A–C).
3.5 Prediction models using effective wavelengths
This study compares the performance of SVM, PLSR, and ELM models to determine the most effective modeling approach. Based on the prediction of quality parameters for seedless white grapes (Table 2), PLSR and SVM models constructed with feature wavelengths exhibited superior performance compared to the ELM model. ELM is fundamentally a linear least squares solution, rendering it susceptible to overfitting or oscillation when the input data contain substantial noise or multicollinearity. Furthermore, extreme learning machines exhibit limited generalization ability and stability due to the random initialization of input weights and hidden layer biases, as well as their sensitivity to noise and redundant features (Tang et al., 2016; Huang et al., 2012). In contrast, PLSR and SVM incorporate more sophisticated parameter optimization and feature selection mechanisms, resulting in greater modeling accuracy and robustness. In addition, Wan et al. (2020) reported that the predictive performance of nonlinear regression models generally exceeds that of linear models, with SVM models often outperforming PLSR models. Therefore, for the prediction of SSC and TA, the SVM model achieved the highest predictive performance.
The selection of feature wavelengths by different algorithms markedly influences model predictive performance (Table 3). Specifically, the SNV-CARS-SVM model achieved the most accurate prediction of SSC, with correlation coefficients (Rc and Rp) of 0.964 and 0.928 for the calibration and prediction sets, and root mean square errors (RMSEC and RMSEP) of 0.390 and 0.673, respectively. The model’s RPD value reached 3.311. For TA prediction, the SNV-SPA-SVM model performed optimally, with Rc and Rp values of 0.895 and 0.893, RMSEC and RMSEP of 0.418 and 0.553, and an RPD value of 2.622. The SNV-CARS-PLSR model exhibited the highest predictive performance for pH, with Rc and Rp values of 0.803 and 0.758, RMSEC and RMSEP of 0.120 and 0.113, and an RPD value of 1.655. The optimum model of SSC, TA and pH was displayed more intuitively by the scatter plots of Figure 7.
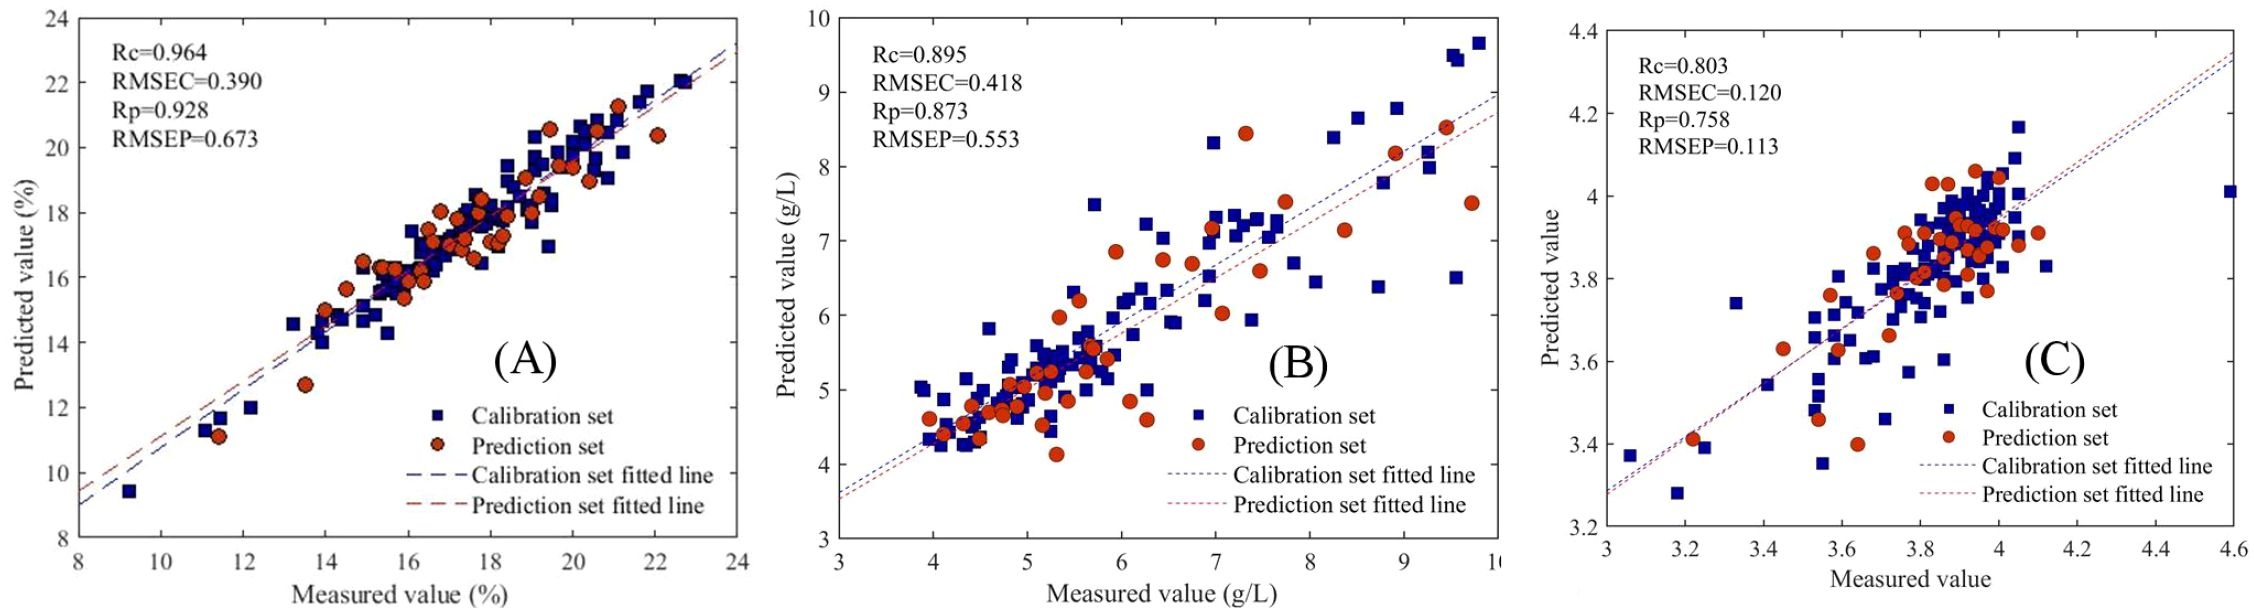
Figure 7. Correlation between measurement values and predicted values in the calibration set and prediction set (A) SSC (B) TA (C) pH.
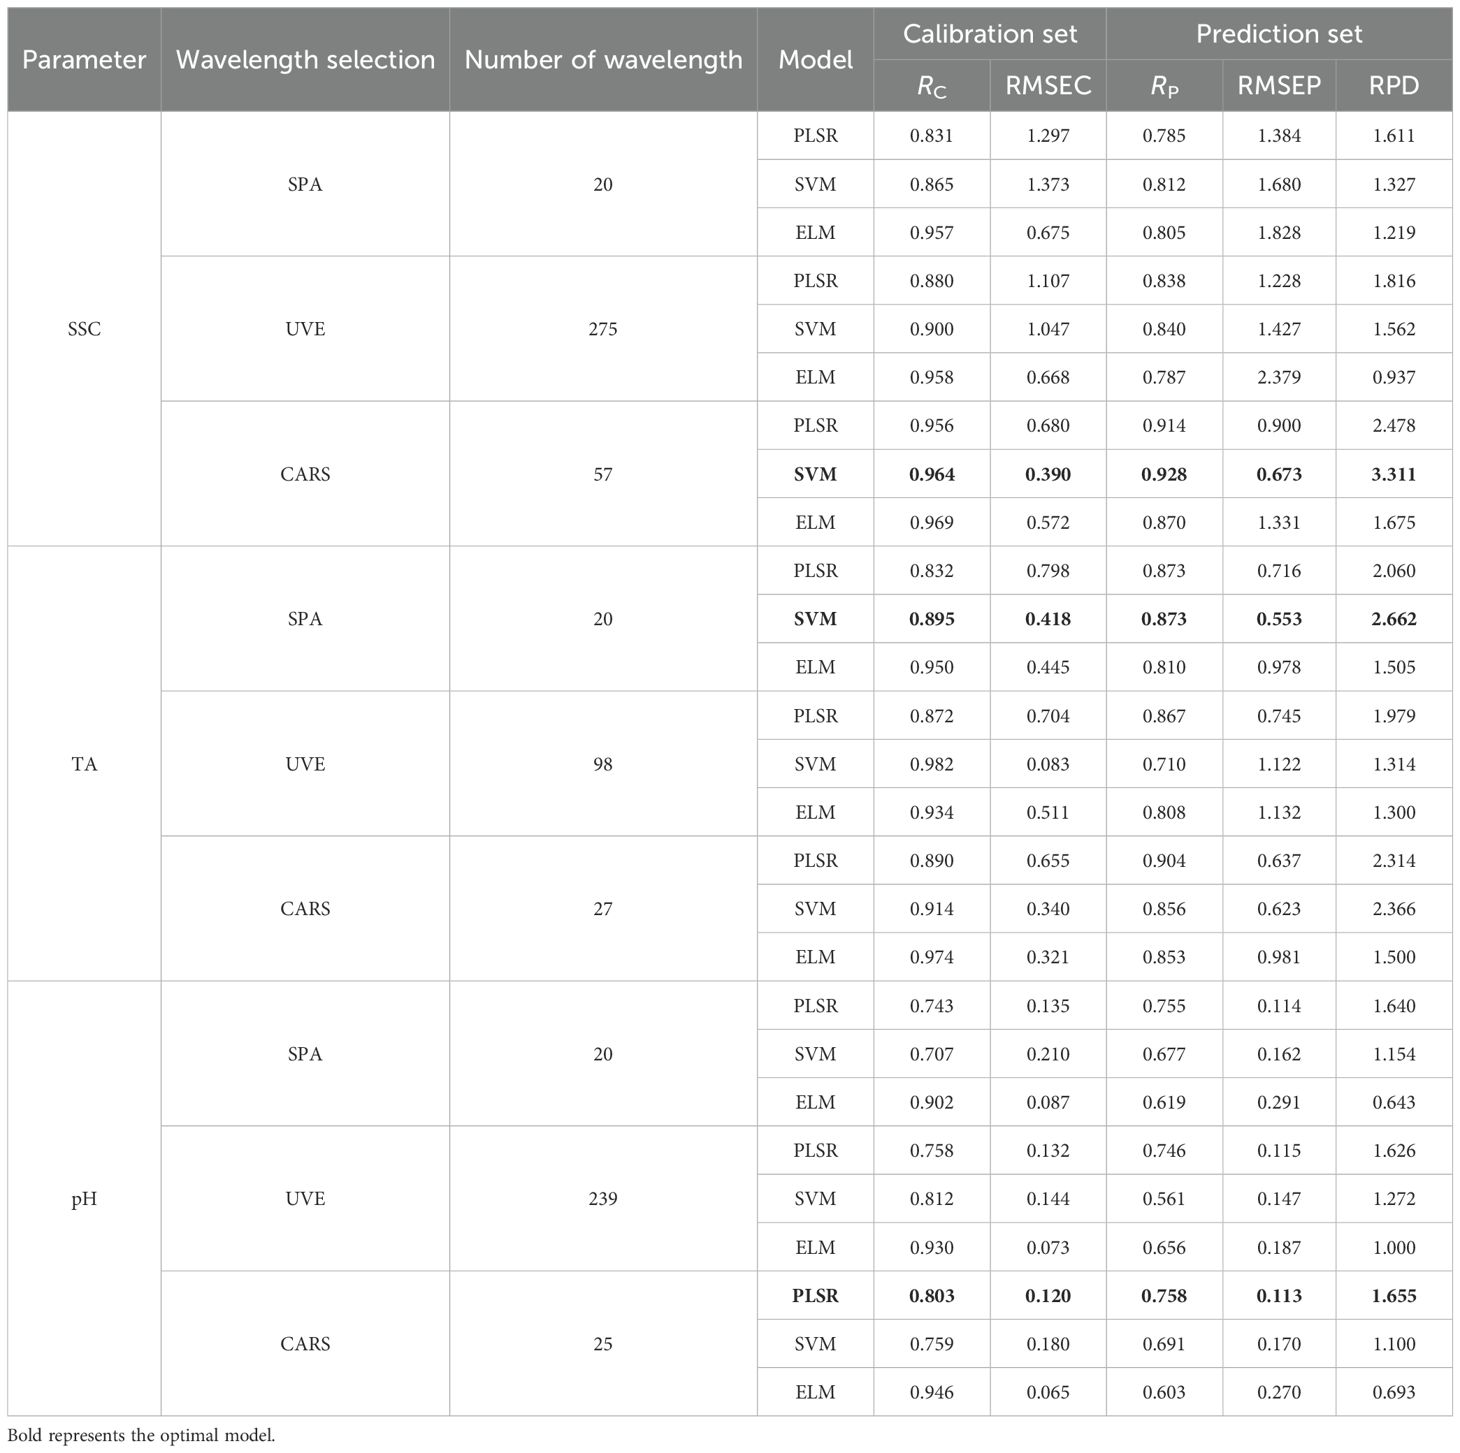
Table 3. Prediction of SSC, TA and pH based on different method in characteristic wavelengths.
Among the three quality parameters, pH prediction was less accurate than those of SSC and TA, primarily owing to differences in chemical properties and spectral responses. SSC and TA are closely associated with soluble sugars, organic acids, and other constituents exhibiting distinct absorption characteristics in the near-infrared region (e.g., vibrations and stretching of O-H, C-H, and C=O groups), rendering their concentration changes readily detectable in the spectra (Li et al., 2006). In contrast, pH reflects hydrogen ion activity rather than the concentration of specific chemical groups, yielding a more indirect and nonlinear relationship with spectral signals (Nicolaï et al., 2007). Furthermore, pH is influenced by multiple factors, including the type of organic acids, buffer systems, and ionic strength, which often exhibit weak or overlapping near-infrared absorption features (Koashi et al., 2003). Consequently, the spectral response of pH is weaker and less distinct, limiting the predictive capability of models compared with SSC and TA.
The table grape variety used in this study was Seedless White, a typical white cultivar with a thin peel, tender flesh, and sweet flavor. Accordingly, the developed prediction model primarily reflects quality variations in white grapes under different storage conditions. Its applicability to other cultivars, particularly red or purple types (e.g., Kyoho and Beauty Finger), requires further validation due to their higher anthocyanin and phenolic contents and distinct metabolic behaviors during storage. Future research will expand the sample set to include multiple varieties, color types, and production regions, enabling a more robust and generalizable predictive model.
While this study considered conditions representative of typical postharvest handling, grapes in practice may experience more complex environments, such as controlled-humidity or controlled-atmosphere storage, or fluctuating temperature and humidity. These factors can significantly affect physicochemical properties, sensory attributes, and metabolic activity. Further investigation into the influence of environmental factors, including temperature, humidity, gas composition, and light exposure, will support the development of a more comprehensive and accurate model, providing a scientific basis for optimizing storage management and preserving grape quality.
4 Conclusion
The soluble solids content (SSC), titratable acidity (TA), and pH are critical indicators for assessing the quality of table grapes during storage. This study aimed to develop a model for the rapid and non-destructive detection of these parameters in table grapes during storage using visible near infrared (Vis-NIR) spectroscopy. Through comparative experiments involving different spectral preprocessing techniques and feature wavelength selection algorithms, the optimized model achieved fast and non-destructive prediction of SSC, TA, and pH in Seedless White grapes, demonstrating superior performance. This research provides a new approach for rapid, non-destructive, and high-precision quality assessment of table grapes during storage. The findings offer practical significance for promoting the sustainable development of the grape industry.
Data availability statement
The raw data supporting the conclusions of this article will be made available by the authors, without undue reservation.
Author contributions
KH: Writing – original draft, Software, Formal Analysis. YS: Data curation, Methodology, Writing – original draft. LH: Methodology, Data curation, Writing – review & editing. CH: Conceptualization, Writing – review & editing, Methodology. JX: Supervision, Funding acquisition, Writing – review & editing. NA: Investigation, Writing – original draft.
Funding
The author(s) declare financial support was received for the research, authorship, and/or publication of this article. This research was supported financially by the Modern Agricultural Engineering Key Laboratory at Universities of Education Depart-ment of Xinjiang Uygur Autonomous Region (Project No. TDNG2024101 and TDNG2023102), the Natural Science Foundation of China project (32502348) and Key Field Science and Technology Research Project of Xinjiang Production and Construction Corps (2018AB016). Xinjiang Production and Construction Corps was not involved in the study design, collection, analysis, interpretation of data, the writing of this article, or the decision to submit it for publication.
Conflict of interest
The authors declare that the research was conducted in the absence of any commercial or financial relationships that could be construed as a potential conflict of interest.
Generative AI statement
The author(s) declare that no Generative AI was used in the creation of this manuscript.
Any alternative text (alt text) provided alongside figures in this article has been generated by Frontiers with the support of artificial intelligence and reasonable efforts have been made to ensure accuracy, including review by the authors wherever possible. If you identify any issues, please contact us.
Publisher’s note
All claims expressed in this article are solely those of the authors and do not necessarily represent those of their affiliated organizations, or those of the publisher, the editors and the reviewers. Any product that may be evaluated in this article, or claim that may be made by its manufacturer, is not guaranteed or endorsed by the publisher.
References
Caramês, E. T. S., Alamar, P. D., and Pallone, J. A. L. (2019). Detection and identification of açai pulp adulteration by NIR and MIR as an alternative technique: Control charts and classification models. Food Res. Int. 123, 704–711. doi: 10.1016/j.foodres.2019.06.006
Cheng, L., Liu, G., He, J., Wan, G., Ma, C., Ban, J., et al. (2020). Non-destructive assessment of the myoglobin content of Tan sheep using hyperspectral imaging. Meat Sci. 167, 107–988. doi: 10.1016/j.meatsci.2019.107988
Dambergs, R. G., Cozzolino, D., Cynkar, W. U., Janik, L., and Gishen, M. (2006). The determination of red grape quality parameters using the LOCAL algorithm. J. Near Infrared Spec 14, 71–79. doi: 10.1255/jnirs.593
De-Lima, G. F., Cardoso-Andrade, S. A., Da-Silva, V. H., and Honorato, F. A. (2018). Multivariate classification of UHT milk as to the presence of lactose using benchtop and portable NIR spectrometers. Food Anal. Method. 11, 2699–2706. doi: 10.1007/s12161-018-1253-7
Fan, N. Y., Liu, G. S., Wan, G. L., Ban, J. J., Yuan, R. R., Sun, Y. R., et al. (2021). A combination of nearinfrared hyperspectral imaging with two-dimensional correlation analysis for monitoring the content of biogenic amines in mutton. Int. J. Food Sci. Tech. 56, 3066–3075. doi: 10.1111/ijfs.14950
Ferrira, G. W. D., Roque, J. V., Soares, E. M. B., Silva, E. F., Vasconcelos, A. A., and Teofilo, R. F. (2018). Temporal decomposition sampling and chemical characterization of eucalyptus harvest residues using NIR spectroscopy and chemometric methods. Talanta, 188, 168–177. doi: 10.1016/j.talanta.2018.05.073
Guo, W. C., Fang, L. J., Liu, D. Y., and Wang, Z. W. (2015). Determination of soluble solids content and firmness of pears during ripening by using dielectric spectroscopy. Comput. Electron Agr. 117, 226–233. doi: 10.1016/j.compag.2015.08.012
Guo, Z. M., Chen, Q. S., Chen, L. P., Huang, W. Q., Zhang, C., and Zhao, C. J. (2011). Optimization of informative spectral variables for the quantification of EGCG in green tea using Fourier transform near-infrared (FT-NIR) spectroscopy and multivariate calibration. Appl. Spectrosc. 65, 1062–1067. doi: 10.1366/11-06287
Huang, G. B., Zhou, H. M., Ding, X. J., and Zhang, R. (2012). Extreme Learning Machine for Regression and Multiclass Classification. IEEE T Syst Man Cy B. 42 (2), 513–529. doi: 10.1109/TSMCB.2011.2168604
Kamruzzaman, M., Makino, Y., and Oshita, S. (2016). Parsimonious model development for real-time monitoring of moisture in red meat using hyperspectral imaging. Food Chem. 196, 1084–1091. doi: 10.1016/j.foodchem.2015.10.051
Khoshnoudi-Nia, S. and Moosavi-Nasab, M. (2019). Nondestructive determination of microbial., biochemical., and chemical changes in rainbow trout (Oncorhynchus mykiss) during refrigerated storage using hyperspectral imaging technique. Food Anal. Method. 12, 1635–1647. doi: 10.1007/s12161-019-01494-8
Koashi, K., Iwahashi, M., and Ozaki, Y. (2003). Band analysis of temperature-dependent near-infrared spectra of oleic acid in the pure liquid state by the analytic geometric approach. Appl. Spectrosc. 57, 1539–1550. doi: 10.1366/000370203322640189
Li, M. Z., Han, D. H., and Wang, X. (2006). Spectral analysis technology and its applications (Beijing: Science Press).
Li, X. H., Li, Y. J., Ma, X., Guo, J., Liu, H. Q., Zheng, G. Q., et al. (2021). Current situation and prospects of grape industry development in China. Fruit Trees South. China. 50, 161–166. doi: 10.13938/j.issn.1007-1431.20210379
Lin, J. J., Meng, Q. H., Wu, Z. F., Chang, H. J., Ni, C. Y., Qiu, Z. Q., et al. (2024). Fruit soluble solids content non- destructive detection based on visible/near infrared hyperspectral imaging in mango. J. Fruit Science. 41, 122–132. doi: 10.13925/j.cnki.gsxb.20230269
Liu, K. H., Zhang, R., Gao, Y. T., Zhang, H. J., Wen, J., Xue, L., et al. (2024). Present situation analysis and development countermeasures of grape industry in China. China Fruits. 7, 132–138. doi: 10.16626/j.cnki.issn1000-8047.2024.07.020
Liu, W. Z., Zhou, X. J., Ping, F. J., Su, Y., Ju, Y. L., and Yang, J. H. (2024). Detection of key indicators of ripening quality in table grapes based on Visible-near-infrared spectroscopy. Trans. Chin. Soc. Agric. Machinery. 55, 373–383. doi: 10.6401/j.issn.1000-1298.2024.020037
Lu, B., Liu, N. H., Li, H. L., Yang, K. F., Hu, C., Wang, X. F., et al. (2019). Quantitative determination and characteristic wavelength selection of available nitrogen in coco-peat by NIR spectroscopy. Soil Till Res. 191, 266–274. doi: 10.1016/j.still.2019.04.015
Ma, W., Waffo-T´eguo, P., Jourdes, M., Li, H., and Teissedre, P. L. (2018). First evidence of epicatechin vanillate in grape seed and red wine. Food Chem. 259, 304–310. doi: 10.1016/j.foodchem.2018.03.134
Ma, M. J., Wang, M. Q., Yang, Y. M., and Lu, W. P. (2024). Advance in grape research and evaluation of nutritional resources. Modern Agric. Res. 30, 17–22. doi: 10.19704/j.cnki.xdnyyj.2024.10.007
Ncama, K., Tesfay, S. Z., Faeole, O. A., Opara, U. L., and Magwaza, L. S. (2018). Non-destructive prediction of’Marsh’grapefruit susceptibility to postharvest rind pitting disorder using reflectance VIS /NIR spectroscopy. Scientia Hortic-Amsterdam. 231, 265–271. doi: 10.1016/j.scienta.2017.12.028
Nicolaï, B. M., Beullens, K., Bobelyn, E., Peirs, A., Saeys, W., Theron, K. I., et al. (2007). Nondestructive measurement of fruit and vegetable quality by means of NIR spectroscopy: A review. Postharvest Biol. Technol. 46, 99–118. doi: 10.1016/j.postharvbio.2007.06.024
Pissard, A., Marques, E. J., Dardenne, P., Lateur, M., Pasquini, C., Pimentel, M. F., et al. (2021). Evaluation of a handheld ultra-compact NIR spectrometer for rapid and non-destructive determination of apple fruit quality. Postharvest Biol. Technol. 172, 131–175. doi: 10.1016/j.postharvbio.2020.111375
Roberto, B., Valentina, G., Alessio, T., and Guidetti, R. (2018). Application of visible/near infrared spectroscopy to quality control of fresh fruits and vegetables in large-scale mass distribution channels: a preliminary test on carrots and tomatoes. J. Sci. Food d Agr. 98, 2729–2734. doi: 10.1002/jsfa.8768
Su, W. H., Bakalis, S., and Sun, D. W. (2019). Chemometrics in tandem with near infrared (NIR) hyperspectral imaging and Fourier transform mid infrared (FT-MIR) microspectroscopy for variety identification and cooking loss determination of sweet potato. Biosyst. Eng. 180, 70–86. doi: 10.1016/j.biosystemseng.2019.01.005
Su, Y., He, K., Liu, W. Z., Li, L., Hou, K. Y., Lv, S. Y., et al. (2025). Detection of soluble solid content in table grapes during storage based on visible-near-infrared spectroscopy. Food Innovation Advances. 4, 10–18. doi: 10.48130/fia-0025-0005
Sun, Q. M., Luo, X. Z., He, K., Jing, B. W., and Tang, X. Y. (2023). Assessment of kiwifruit firmness by using airflow and laser technique. J. Texture Stud. 54, 237–244. doi: 10.1111/jtxs.12740
Tang, J., Deng, C., and Huang, G. B. (2016). Extreme learning machine for multilayer perceptron. IEEE T Neur Net Lear. 27, 809–821. doi: 10.1109/TNNLS.2015.2424995
Wan, G. L., Liu, G. S., He, J. G., Luo, R. M., Cheng, L. J., and Ma, C. (2020). Feature wavelength selection and model development for rapid determination of myoglobin content in nitrite cured mutton using hyperspectral imaging. J. Food Eng. 287, 110090. doi: 10.1016/j.jfoodeng.2020.110090
Wu, H. Z., Cai, H. X., Ren, Y., Wang, T. T., Zhou, J. W., Li, D. L., et al. (2024). Non-destructive detection of soluble solid content based on visible-near infrared spectroscopy. J. Light Scattering. 36, 44–51. doi: 10.13883/j.issn1004-5929.202401006
Xiao, H., Li, A., Li, M. Y., Sun, Y., Tu, K., Wang, S. J., et al. (2018). Quality assessment and discrimination of intact white and red grapes from Vitis vinifera L. at five ripening stages by visible and near-infrared spectroscopy. Scientia Hortic-Amsterdam. 233, 99–107. doi: 10.1016/j.scienta.2018.01.041
Xing, J. F., He, X. W., Sun, X. Y., Liu, W. Z., Li, J., He, K., et al. (2025). Feasibility quantitative analysis of NIR spectroscopy coupled with Si-PLS to predict total acidity of Seedless White table grapes. Food Innovation Advances. 4, 183–190. doi: 10.48130/fia-0025-0018
Xu, J. L., Riccioli, C., and Sun, D. W. (2016). Development of an alternative technique for rapid and accurate determination of fish caloric density based on hyperspectral imaging. J. Food Eng. 190, 185–194. doi: 10.1016/j.jfoodeng.2016.06.007
Yang, J., Luo, X., Zhang, X., Passos, D., Xie, L., Rao, X. Q., et al. (2022). A deep learning approach to improving spectral analysis of fruitquality under interseason variation. Food Control. 140, 109108. doi: 10.1016/j.foodcont.2022.109108
Yu, S., Huan, K., and Liu, X. X. (2023). Application of quantitative non-destructive determination of protein in wheat based on pretreatment combined with parallel convolutional neural network. Infrared Phys. Techn. 135, 104958. doi: 10.1016/j.infrared.2023.104958
Zeng, X. T., Lin, J. S., Chen, L. Q., Zhang, C. H., Luo, S. S., and Wei, W. (2024). A study of polysaccharides content and antioxidant activities in vitro of different varieties of grape. Sichuan Univ. Arts Sci. J. 34, 38–43. doi: 10.3969/j.issn.1674-5248.2024.02.006
Zhang, L. G., Li, Y. Q., Huang, W., Ni, L. J., and Ge, J. (2020). The method of calibration model transfer by optimizing wavelength combinations based on consistent and stable spectral signals. Spectrochimica Acta A. 227, 117647. doi: 10.1016/j.saa.2019.117647
Zhang, Z. Y., Li, Y. X., Wang, Z. Y., and Li, C. X. (2022). NIR Model Optimization Study of Larch Wood Density Based on IFSR Abnormal Sample Elimination. Spectroscopy Spectral Analysis. 42 (11), 3395–3402. doi: 10.3964/j.issn.1000-0593(2022)11-3395-08
Zheng, X., Li, Y., Wei, W., and Peng, Y. (2019). Detection of adulteration with duck meat in minced lamb meat by using visible near-infrared hyperspectral imaging. Meat Sci. 149, 55–62. doi: 10.1016/j.meatsci.2018.11.005
Keywords: Vis-NIR, table grape, ssc, Ta, pH, prediction model
Citation: He K, Su Y, He L, Hu C, Xing J and Alisher N (2025) Modeling of table grape soluble solids content, titratable acidity and pH prediction during storage based on Vis-NIR spectroscopy. Front. Plant Sci. 16:1723949. doi: 10.3389/fpls.2025.1723949
Received: 13 October 2025; Accepted: 31 October 2025;
Published: 01 December 2025.
Edited by:
Yanlong Han, Northeast Agricultural University, ChinaReviewed by:
Chenlong Fan, Nanjing Forestry University, ChinaHuihui Zhao, Henan Agricultural University, China
Copyright © 2025 He, Su, He, Hu, Xing and Alisher. This is an open-access article distributed under the terms of the Creative Commons Attribution License (CC BY). The use, distribution or reproduction in other forums is permitted, provided the original author(s) and the copyright owner(s) are credited and that the original publication in this journal is cited, in accordance with accepted academic practice. No use, distribution or reproduction is permitted which does not comply with these terms.
*Correspondence: Lei He, Y2h1YW55dW55aWhlQDE2My5jb20=; Jianfei Xing, MjgxMDYxOTMwNkBxcS5jb20=
†These authors share first authorship