 Chun li Wang1,2,3
 Chen-yang Xu
 Fei-nan Hu
- 1College of Natural Resources and Environment, Northwest A&F University, Yangling, China
- 2College of Land Science and Technology, China Agricultural University, Beijing, China
- 3Institute of Bio- and Geosciences, Agrosphere Institute (IBG-3), Forschungszentrum Jülich GmbH, Jülich, Germany
- 4State Key Laboratory of Soil Erosion and Dryland Farming on the Loess Plateau, Institute of Soil and Water Conservation, Northwest A&F University, Yangling, China
- 5College of Agriculture, Henan University of Science and Technology, Luoyang, China
- 6Institute of Soil and Water Conservation, Chinese Academy of Sciences, Ministry of Water Resources, Yangling, China
Fulvic acid (FA) and humic acid (HA) are organic materials that can form complexes with metal ions, playing a crucial role in predicting the behavior of organic colloids. The colloidal stability values of FA and HA vary with pH and specific cations, but this has rarely been comprehensively examined. This study systematically compared the aggregation kinetics and colloidal stability of FA and HA and the mechanisms behind their behavior based on particle interaction theory. The results showed that higher pH values stabilized FA and HA colloids by increased electrostatic repulsive energy. Additionally, increased electrolyte concentration destabilized FA and HA colloids by cationic polarization (chemical bond formation). The cation aggregation ability followed the order Ca2+ > Mg2+ > K+ > Na+, showing that the specific ion effects induced by non-classical polarization resulted from the strong electric field of the highly negatively charged FA and HA. With pH values ranging from 5 to 7 and 9, FA and HA were stabilized through raising the critical coagulation concentrations (CCCs) in NaCl and KCl. With increasing pH, the enhanced electrostatic repulsive energies in the Na+ and K+ systems resulted in weaker aggregation behaviors due to the deprotonation of the hydroxyl and carboxyl groups of colloids. Compared with HA, FA had a lower Hamaker constant, higher surface negative charges, larger CCCs, and stronger dispersion stability. This work will contribute to the understanding of organic colloidal aggregation mechanisms and act as a reference to predict their environmental behaviors.
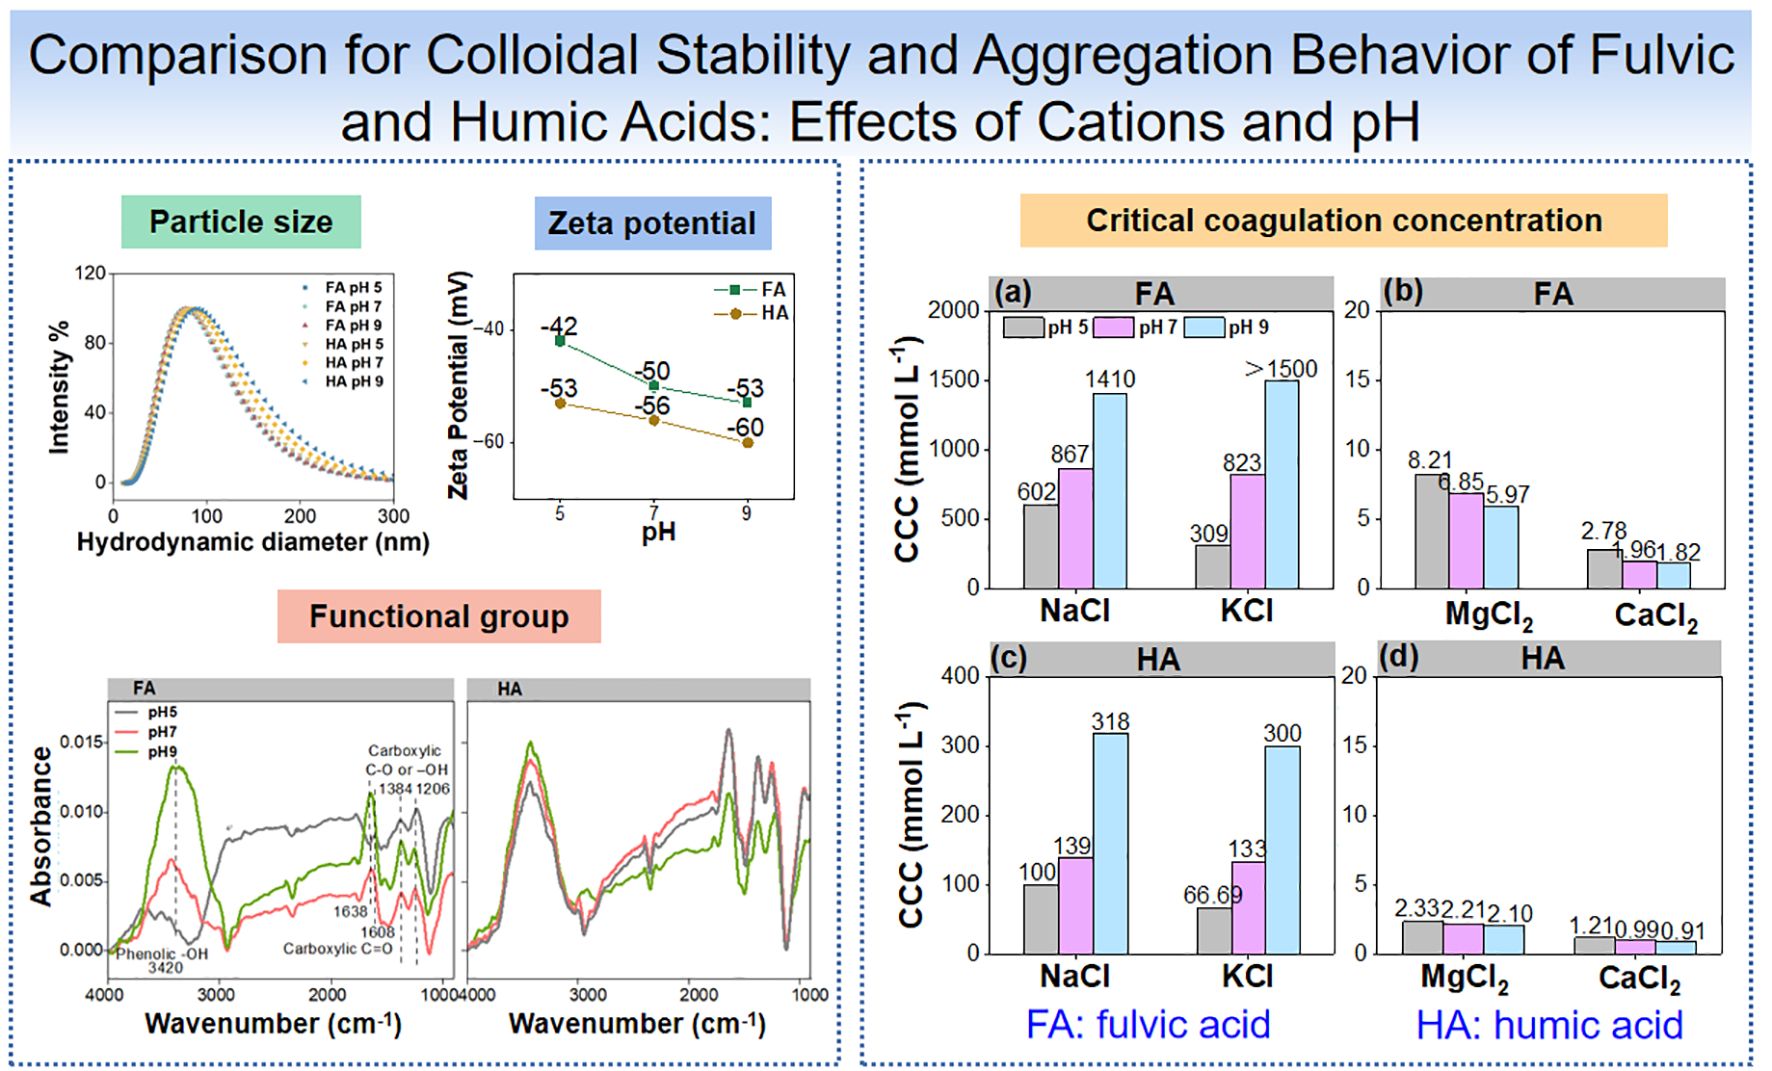
Graphical Abstract.
1 Introduction
Humus, an essential and special component of soil organic matter, possesses a complex and stable structure (1, 2). Two of its primary components, fulvic acid (FA) and humic acid (HA), exhibit strong colloidal properties. The abundance of reactive functional groups on their surfaces does enable them to form stable physical, chemical, and biological complexes with metal ions and organic pollutants, thereby strictly controlling the transport, storage, and migration potential of organic colloids and environmental pollutants (3–6). Given their aforementioned role in soil fertility, environmental protection, and sustainable agriculture, it is necessary to have a detailed understanding of the stability of the coalescence kinetics of FA and HA (7).
The aggregation and dispersion of FA and HA colloids are strongly modulated by the type and strength of electrolyte cations in the surrounding media (8–11)—for example, Tan et al. (12) showed that HA increased the aggregation of silica aerogels at high Mg2+ concentrations due to the HA–Mg2+ chemical bonds formed in the reaction process that act as a bridge among silica aerogel aggregates. Generally, monovalent cations neutralize the negative surface charges of the gel, whereas polyvalent cations form bridging bonds that condense the FA and HA colloids (8, 10).
The pH value has also been reported to strongly regulate the aggregation and dispersion behavior of FA and HA colloids in various electrolyte solutions (13–15). Functional groups, such as hydroxyl and carboxyl, on the colloid surface gradually deprotonate as pH increases, resulting in a negative charge that increases colloid dispersion stability through the higher electrostatic repulsion between molecules (14–17). Transmission electron microscopy imaging revealed that HA globular aggregates exhibit a rough periphery (facilitating condensation) at pH 5.26 and a smooth spherical shape (promoting dispersion) at pH 10, which was attributed to varying degrees of protonation or deprotonation of carboxyl and phenolic -OH groups (14).
The stability of humus in solutions containing cations of different valence values also varied with pH (15, 16). The aggregation value of HA in NaCl solution at different pH values followed the order acidic > neutral > alkaline while having a higher binding efficiency with divalent ions such as Ca2+ and Mg2+ at high pH (14, 17). Additionally, compared to HA, there have been fewer studies on the colloidal stability of FA.
The colloidal stability values of FA and HA colloids are influenced by the type and activity of their surface functional groups (2, 14, 18, 19). The FA and HA colloids contain active functional groups such as hydroxyl, carboxyl, quinone, methoxy, and others (2). The diprotonation dissociation of the carboxyl and phenolic hydroxyl groups does increase with pH, leading to a higher negative charge of the colloid. This enhances electrostatic repulsion, making the colloid more prone to dispersion (20, 21). Additionally, the optimal conditions for the deprotonation of various functional groups differ: carboxyl protons dissociate at pH 3, while phenolic hydroxyl groups dissociate at pH >7. These transformations have been well observed using Fourier transform infrared (FTIR) spectroscopy and atomic force microscopy (AFM) (5, 22–24).
The molecular weight and type of the colloids also determine their electrochemical properties (15, 18, 20). Larger organic matter molecules, such as HA, tend to aggregate more than smaller ones, like FA (20, 25, 26). So far, only a few studies have quantified the differences between surface functional groups on HA and FA and compared their aggregation kinetics. Therefore, a systematic study of the pH dependence of ion-specific effects on FA and HA is of great practical importance for improved guidance for environmental remediation, water purification, and soil improvement.
Herein AFM, dynamic light scattering (DLS), and FTIR techniques were used to investigate the environmental condition dependence of FA and HA colloids. This was done through cross-tabulations of colloid type, pH, metal ion type, and ionic strength in order to evaluate the aggregation kinetics of HA and FA colloids under different conditions. This study will enrich the theoretical foundation for pollution control which uses FA and HA approaches, improve the kinetic theory of FA and HA agglomeration, and provide insights into their behavioral mechanisms.
2 Materials and methods
2.1 Preparation of FA and HA colloids
FA (CAS: 1415-93-6, FA content: ≥90%, ash: 0%–1%) and HA (CAS: 68131-04-4, HA content: 50%–60%, ash: 15%–25%) were purchased from Aladdin Bio-Chem Technology (Shanghai, China) to prepare the corresponding colloid suspensions. Briefly, FA suspension was prepared by dissolving 1 g FA in 1 L deionized water, followed by 1 h of stirring. The commercial HA was purified before use based on its acid insolubility (27). HA (10 g) was first dissolved with 0.1 mol L-1 HCl solution (the ratio of HA to HCl was 1 g to 10 ml) and stirred for 1 h. The suspension was adjusted to approximately pH 1.0 using a concentrated HCl solution and was left to stand for 12 h. The HA suspension was centrifuged at 5,000 rpm for 15 min, and the supernatant was discarded. The abovementioned processes were repeated three times. The HAs were dispersed in 1 L deionized water and dialyzed (semipermeable membrane with a molecular weight cutoff of 1,000 Da) to remove dissolved ions until the conductivity was constant and <10 μS cm-1. The mass concentration of the HA suspension was measured by the oven-dry method to be 5,671.1 mg L-1.
2.2 Characterization of FA and HA
Part of the FA and HA suspension was freeze-dried for characterization. Mass spectrometry (MS) analysis for the molecular weight determination of FA and HA was conducted using an Agilent 6545 Q-TOF LC/MS system (Agilent Technologies, USA) equipped with an electrospray ionization (ESI) source operating in negative ion mode. The K+, Na+, Ca2+, and Mg2+ content of FA and HA, respectively, were analyzed using an inductively coupled plasma emission spectrometer (5110 ICP-OES/MS; Agilent, Santa Clara, CA, USA). The organic elemental composition (including C, H, O, and N) of FA and HA, respectively, were determined by an element analyzer (Vario EL Cube, Elementar, Germany).
The morphology values (diameter and height) of FA and HA were recorded by atomic force microscopy (AFM, Dimension Icon with ScanAsyst, Bruker, USA). The FA and HA suspensions were diluted to 100 mg L-1; the pH values were adjusted to 5, 7, and 9 with HCl or NaOH, respectively. All AFM images were obtained by depositing the FA and HA suspensions on a freshly cleaved mica wafer substrate. The images were recorded after 24 h of dehydration at room temperature (23). The PeakForce Tapping mode was adopted to observe the samples, and all images were examined using the NanoScope Analysis software.
The size distribution curves of the FA and HA samples (100 mg L-1 at pH 5, 7, and 9) were measured using dynamic light scattering (DLS, Nanobrook Omni, Brookhaven Instruments Corporation, USA).
The electrophoretic mobility values of the FA and HA samples (100 mg L-1 at pH 5, 7, and 9) were analyzed using a zeta potential analyzer (Zeta PALS, Brookhaven, USA), and the Smoluchowski equation was used to convert the electrophoretic mobility into zeta potential (28) (Equation 1).
where ζ is the zeta potential; μep is the electrophoretic mobility of the colloid, which is the velocity of the particle per unit electric field; η is the dynamic viscosity of the medium; ϵ is the dielectric constant of the medium; and ϵ0 is the vacuum permittivity (a constant value, 8.854 × 10⁻¹² F/m).
2.3 ATR-FTIR spectra measurements
The infrared spectra of the FA and HA samples at pH 5, 7, and 9 were recorded using FTIR spectroscopy (Bruker, Vertex7003040404, German) equipped with an attenuated total reflectance (ATR) unit (Ge crystal). Each sample was collected with 16 scans at a resolution of 8 cm-1 in the range of 600–4,000 cm-1. The spectrum of water was taken as background before sample scanning. The absorbance spectra of FA and HA in NaCl (1,000 mmol L-1), KCl (1,000 mmol L-1), CaCl2 (10 mmol L-1), and MgCl2 (10 mmol L-1) solutions at pH 5, 7, and 9 were also recorded using the ATR-FTIR spectrometer. The samples were allowed to stand for 30 min after mixing, ensuring consistency between ATR-FTIR recording and DLS measurements in terms of aggregation kinetics. At each time, a drop of the liquid sample is collected to cover the crystal for FTIR spectroscopy measurement. Spectral data were smoothed and baseline-corrected using OMNIC software. The peak areas of these bands were integrated using a tangential baseline from the onset to the offset of each peak, and then a relative peak area of each band was also calculated.
2.4 Evaluation of FA and HA colloidal stability
The aggregation kinetics of FA and HA colloids was measured using the DLS apparatus. The incident wavelength and scattering angle were 635 nm and 90°, respectively. The measurements were done at pH 5, 7, and 9, respectively; the mass concentration was 100 mg L-1. Electrolyte solutions of NaCl, KCl, CaCl2, and MgCl2 with different gradient concentrations were prepared. A 0.22-μm membrane filter was used to filter the electrolyte solutions before use. The effective diameter of the suspension was recorded in 2-min intervals; the testing time of each sample was 30 min. The electrolyte solutions at different concentrations were used to induce the aggregation of the HA or FA suspension. The zeta potential values of HA and FA were measured at the same conditions using the DLS measurements. The kinetic aggregation curves of the effective diameter (ah(t)) with time (t) were obtained for each electrolyte, based on which the aggregation rate (k11) was calculated (29). The slope of the fitted line between the effective diameter and time was dependent on the particle concentration N0 and the aggregation rate (Equation 2).
The aggregation rate is dependent on the electrolyte concentration in the reaction-limited aggregation (RLA) regime, and with the aggregation rate being no longer related to the electrolyte concentration in the diffusion-limited aggregation (DLA) regime for the electrolyte concentration had reached critical coagulation concentration (CCC), the energy barrier between particles had be eliminated. Hence, CCC is defined as the minimum electrolyte concentration required to fast aggregation. It is also the critical point of aggregation attachment efficiency (α), which can be calculated by the ratio of aggregation rate in the RLA regime (k11) to the diffusion-limited aggregation (DLA) regime ((k11)fast), also known as the inverse stability ratio 1/W (Equation 3).
The range of the attachment efficiency was in 0–1 for a specific system.
2.5 Calculation of Hamaker constant and particle interaction energy
The Derjaguine–Landaue–Verweye–Overbeek (DLVO) theory was used to analyze the particle interactions for FA and HA colloids (30) (Equation 4). The total potential energy VT is the total sum of van der Waals potential energy VA and the electrostatic potential energy VR.
VA was accounted as:
where h (m) is the distance between adjacent particle surfaces; s = H/r, of which H (m) is the distance between the centers of adjacent particles; r (m) is the particle radius; and A (J) is the Hamaker constant for colloids in water (Equation 6).
Let the Hamaker constant of colloids in vacuum be A1 and the Hamaker constant of water in vacuum be A0 = 2.43 × 10⁻²⁰ J. Then:
VR was accounted as:
where ϵ is the dielectric constant of the medium, 6.95 × 10⁻¹⁰ C2 J-1 m-1; φ0 (V) is the particle surface potential, was replaced here by the zeta potential; and k−1 (m) is the thickness of the double electric layer (Equation 8).
where F is the Faraday constant, 96,485 C mol-1; ni (mol m-3) is the concentration of the i-th ion; Zi is the chemical valence of the i-th ion; R is the ideal gas constant, equal to 8.314 J mol−1 K−1; and T (K) is the absolute temperature.
The theoretical bonding coefficient α0 of colloid coalescence can also be calculated using the following equation:
where kB is the Boltzmann constant, equal to 1.381 × 10⁻²³ J K−1; h is a dimensionless constant used to correct for hydrodynamic interactions and is calculated as to the following Equation 10:
According to the DLVO theory, the theoretical bonding coefficient α0 can be calculated by combining (Equations 5, 7, 9) when the Hamaker constant is known. Therefore, the Hamaker constant is used as an adjustable parameter, and the value of the Hamaker constant for FA and HA colloids can be obtained by fitting it with MATLAB software (29).
3 Results and discussion
3.1 Characteristics and properties of FA and HA colloids
HA had a higher molecular weight (3,094 Da) compared to FA (1,741 Da) (Supplementary Table S1). The result was further proved by the distinct color difference between HA and FA (Supplementary Figure S4). The organic carbon (C) and nitrogen (N) contents (weight percent) of FA were lower than those of HA, while the hydrogen (H) and oxygen (O) contents of FA were higher than those of HA (Supplementary Table S1). Consequently, the H/C and O/C ratios of FA were 33% and 44% higher than those of HA, suggesting that FA contained more hydrogen- and oxygen-containing functional groups (e.g., hydroxyl and carboxyl groups) than HA (31).
The AFM images revealed that the FA and HA colloids had irregular edges and appeared to be in an aggregated and stacked state (Figure 1a). The lengths of the colloids were 11–23 times larger than their heights (Figures 1b, c). The diameters of the FA and HA colloids observed in AFM gradually decreased as the pH increased from 5 to 9, while the heights changed less (Supplementary Table S2). This suggesting that the FA and HA were prone to aggregation and the colloids were prone to dispersing with increasing pH. Indeed FA and HA are known polydisperse systems. The height and diameter of HA were found to be larger than those of FA (Supplementary Table S2). The diameters of both FA and HA colloids were about 80 nm (lognormal median diameter by number) at pH 5, 7, and 9, which were larger than those captured by AFM (Figure 1d, Supplementary Table S3). The diameters measured directly by DLS were hydrodynamic diameter, also intensity-weighted average diameter, which can be interpreted as the particles’ diameter plus the electric double layer (32), while the diameters from AFM represented the diameter of the dried sample, and the AFM is primarily good at measuring height (23).
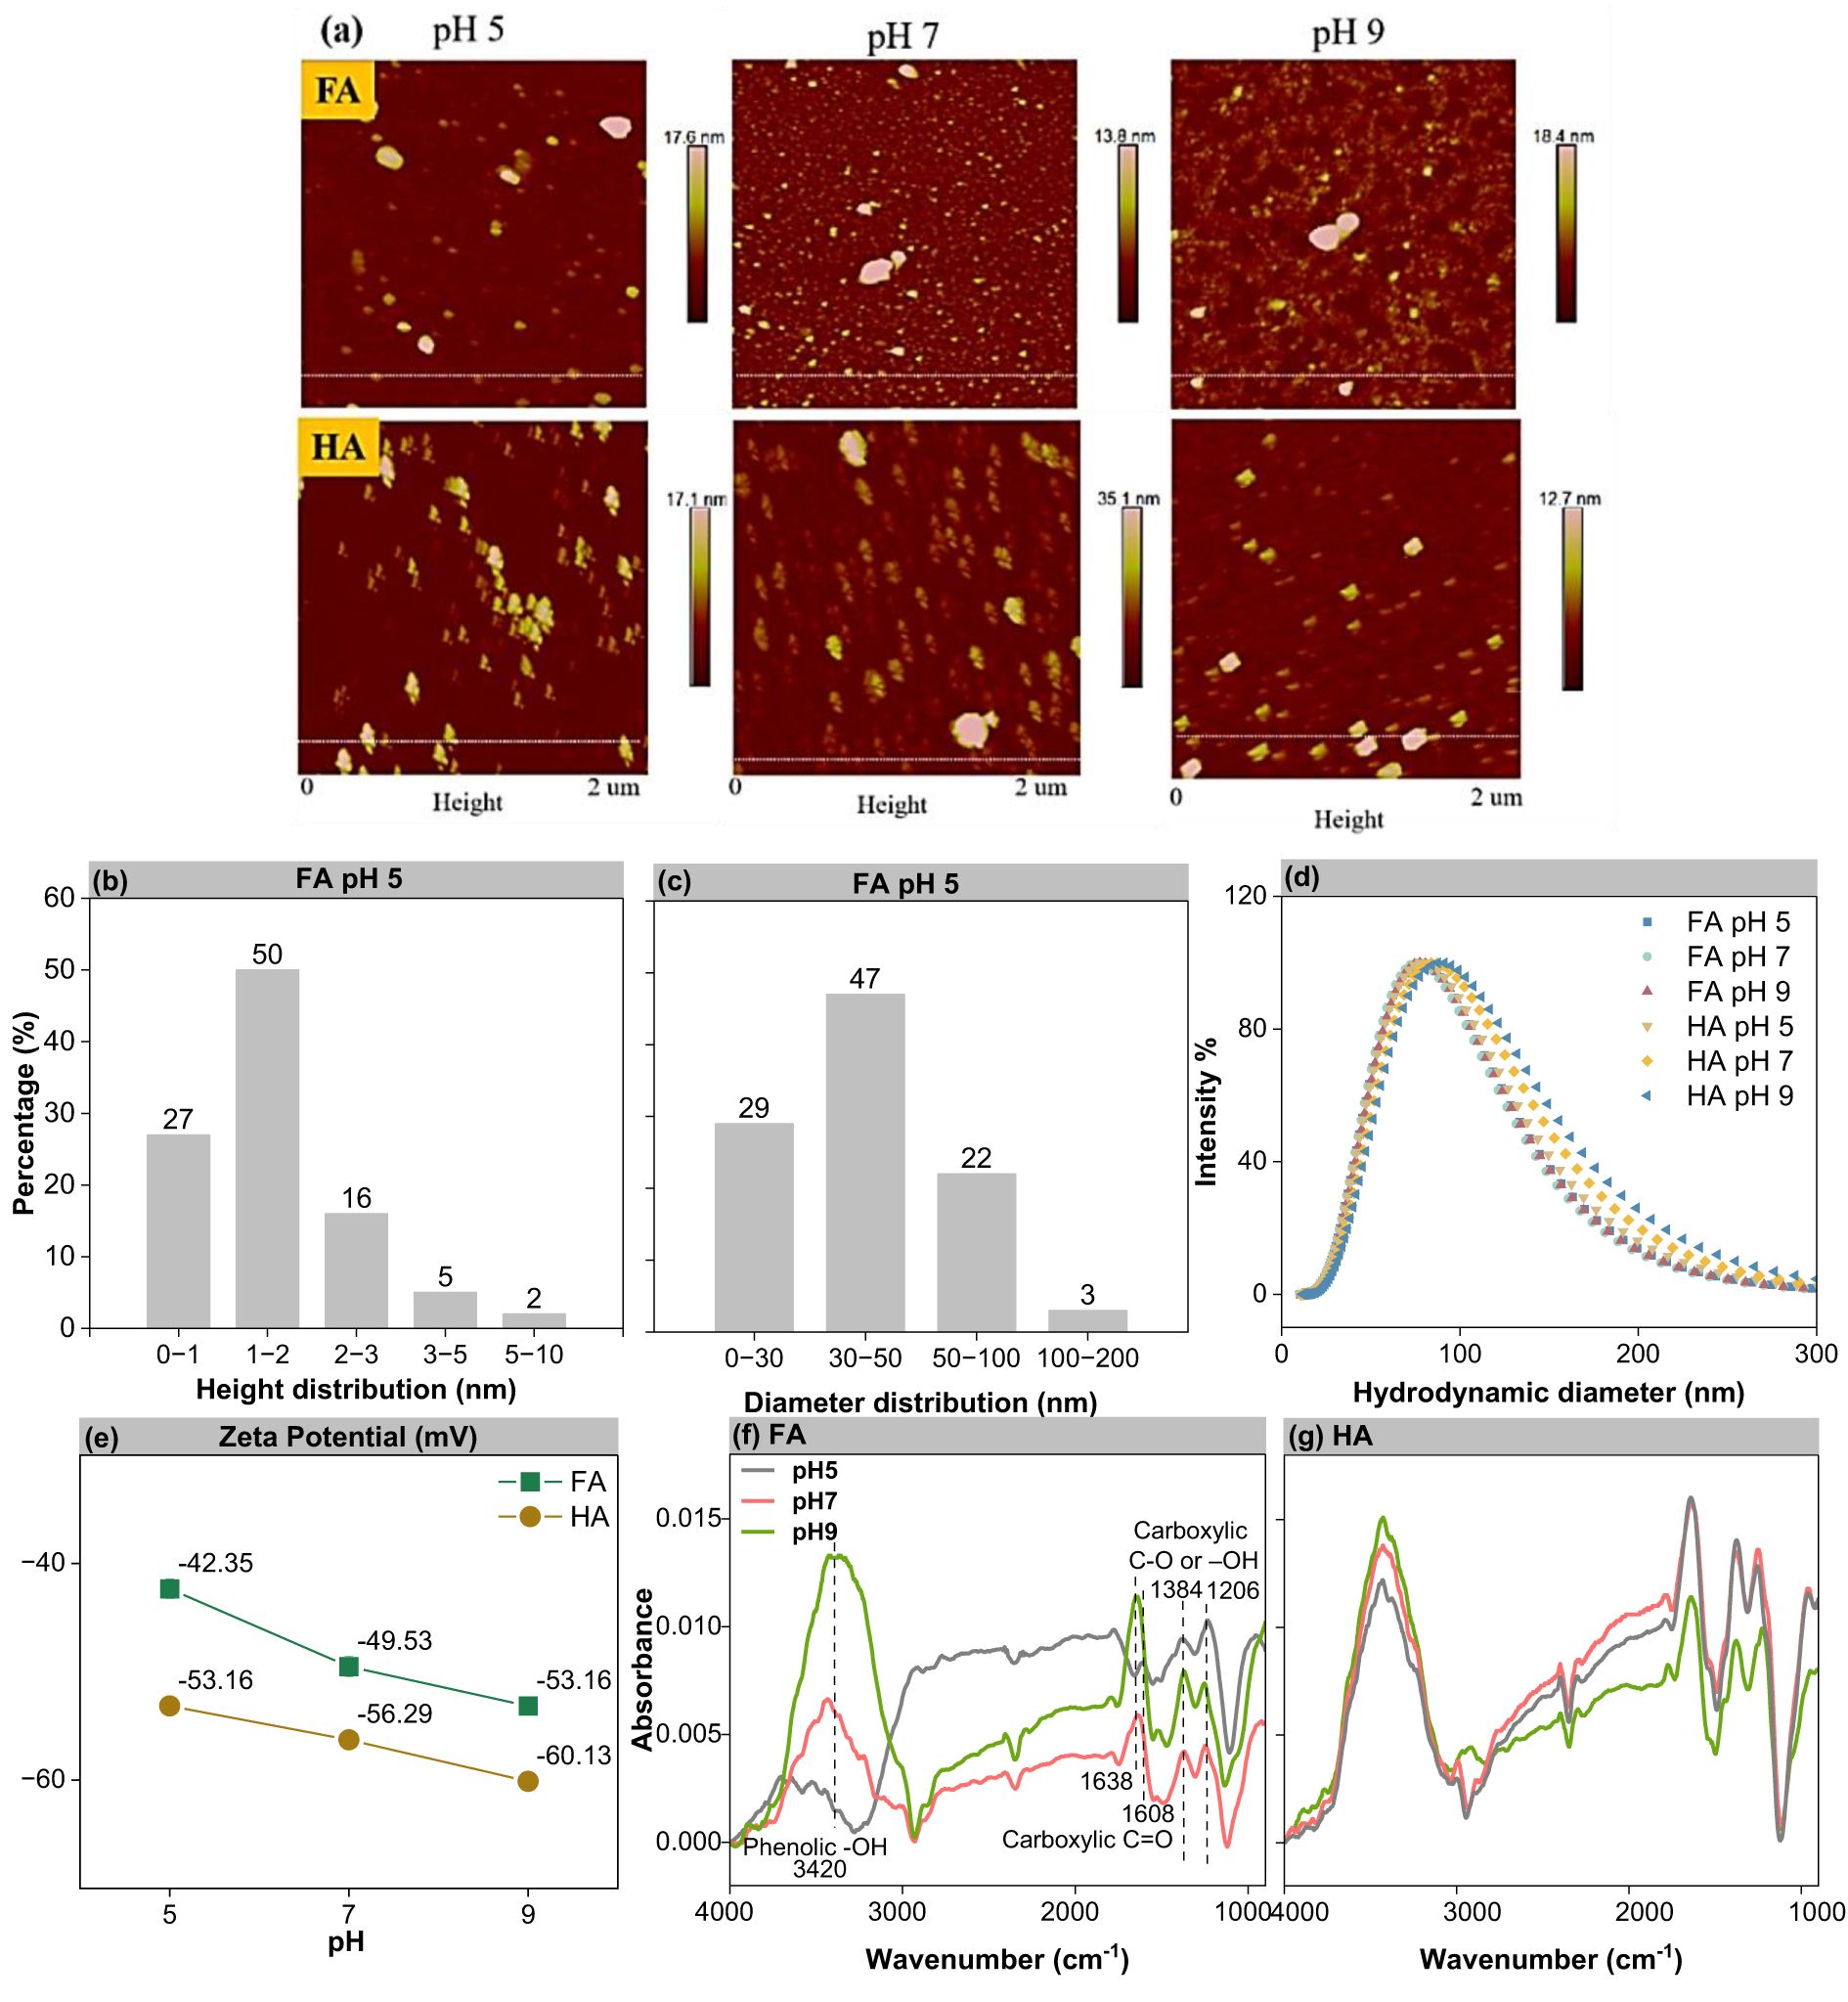
Figure 1. Characterization of FA and HA colloids. (a) AFM images of FA and HA colloids (100 mg L-1 FA and HA at pH 5, 7, and 9). (b) Height distribution of FA at pH 5 in the AFM image. (c) Diameter distribution of FA at pH 5 in the AFM image. (d) Intensity-weighted hydrodynamic diameter distribution of FA and HA colloids at pH 5, 7, and 9 using DLS. (e) Zeta potentials of FA and HA colloids at pH 5, 7, and 9. (f, g) FTIR spectrum of FA and HA colloids at pH 5, 7, and 9.
The zeta potential of the FA colloid was -42.35, -49.53, and -53.16 mV at pH 5, 7, and 9, respectively, and that of HA colloid was -53.16, -56.29, and -60.13 mV, respectively (Figure 1e). With increasing pH, the negative charge density of the colloids increases due to the deprotonation of the active functional groups on the colloidal surface. Consequently, the zeta potentials became more negative with increasing pH (33). The FA had lower zeta values than HA, which might be attributed to the lower C content of FA (34).
The FTIR spectra of FA and HA are presented in Figures 1f, g. The spectra of the main chemical structures of FA and HA peaked at 1,384 and 1,206 cm-1 (C–O stretch and OH deformation of carboxylic groups), 1,638 and 1,608 cm-1 (-COOH, stretching vibrations of vC=O), and 3,420 cm-1 (-OH, stretching vibrations of vO-H). These characteristic peaks were in agreement with previous reports (31, 35). Phenolic -OH was the dominant functional group, comprising 50%–82% of the total abundance (Supplementary Table S4). The relative proportion of carboxylic C=O in FA was lower than that in HA, while the relative proportion of carboxylic C–O or -OH in FA was higher than that in HA (Supplementary Table S4; except at pH 7). This result suggested that FA contained more phenolic -OH and carboxyl groups than HA (31, 36), consistent with the higher H/C and O/C ratios of FA than HA (shown in Supplementary Table S1).
The FTIR of FA and HA showed that pH influenced the quantity of surface functional groups on the colloids (Figures 1f, g; Supplementary Table S4). The intensities of the hydroxyl groups and carboxyl C=O peaks on the FA and HA colloids increased with pH from 5 to 9. This indicated the deprotonation of surface functional groups with increasing pH, hence more oxygen-containing functional groups on their surface under higher pH conditions (33). This then primarily contributes to the increased zeta value at a higher pH (Figure 1e). Meanwhile, the intensity of the absorption peaks of hydroxyl group on FA varied more than between pH 7 and 9, while the opposite was true for carboxyl groups. This indicated that hydroxyl groups tend to deprotonate more at high pH, while carboxyl groups tend to deprotonate at low pH (Figure 1f). Deprotonation of the carboxyl groups occurs in pH 2–5. The other functional groups, such as phenolic -OH, are deprotonated when the pH >5 (5, 22–24). The deprotonations are related to the dissociation constant of the hydroxyl and carboxyl groups (18, 20). This result also supported the increased zeta potential values of FA and HA with increasing pH as well as the higher zeta potential of FA over HA (Figure 1e).
3.2 Effects of cations and pH on FA and HA colloidal aggregation
The aggregation kinetics of FA and HA colloids were first investigated in the presence of cations (Na+, K+, Ca2+, and Mg2+). The size evolution of FA and HA colloids, respectively, as a function of cation type and concentration are plotted in Supplementary Figures S1, S2. The hydrodynamic diameters of FA and HA colloids increased with time and electrolyte concentrations. Typical transitions from reaction-limited (RLA) aggregation to diffusion-limited (DLA) aggregation were observed for both FA and HA colloids (except FA in K+ at pH 9; Supplementary Figures S1, S2) (14). At the RLA stage, the hydrodynamic size of FA and HA colloids increased slightly over time, suggesting good dispersion stability at lower cation concentrations. At the DLA stage, the FA and HA aggregation rates leveled off at high cation concentrations due to the complete elimination of the energy barrier between FA and HA colloids. Figure 2a shows that the FA at pH 5 had a similar aggregation rate in the presence of 800 mmol L-1 NaCl, 400 mmol L-1 KCl, 10 mmol L-1 MgCl2, and 4 mmol L-1 CaCl2 solutions. At pH 5, HA had an approachable aggregation rate in 1,200 mmol L-1 NaCl, 1,000 mmol L-1 KCl, 8 mmol L-1 MgCl2, and 3 mmol L-1 CaCl2 (Figure 2b). The cohesive effects of the four ions on colloids were in the following order: Ca2+ > Mg2+ > K+ > Na+. The divalent cations (Ca2+ and Mg2+) had a stronger influence on FA and HA colloids’ aggregation rates than the monovalent cations (Na+ and K+). The effect of pH on the aggregation kinetics of FA and HA is illustrated in Figures 2c–f. For example, the colloidal aggregation rates significantly decreased with pH from 5 to 9 with FA in Na+ and HA in K+ (Figures 2c, d). In contrast, the aggregation rates of FA in Ca2+ and HA in Mg2+ increased with increasing pH (Figures 2e, f). Monovalent cations (Na+ and K+) increased the hydrodynamic size of FA and HA colloids at a lower pH, while divalent cations (Ca2+ and Mg2+) promoted colloid aggregation at a higher pH. The largest FA and HA clusters were approximately 2,500 and 3,000 nm, respectively (Supplementary Figures S2, S3). A similar tendency was found between the initial diameter (Supplementary Tables S2, S3) and the diameter of the largest cluster.
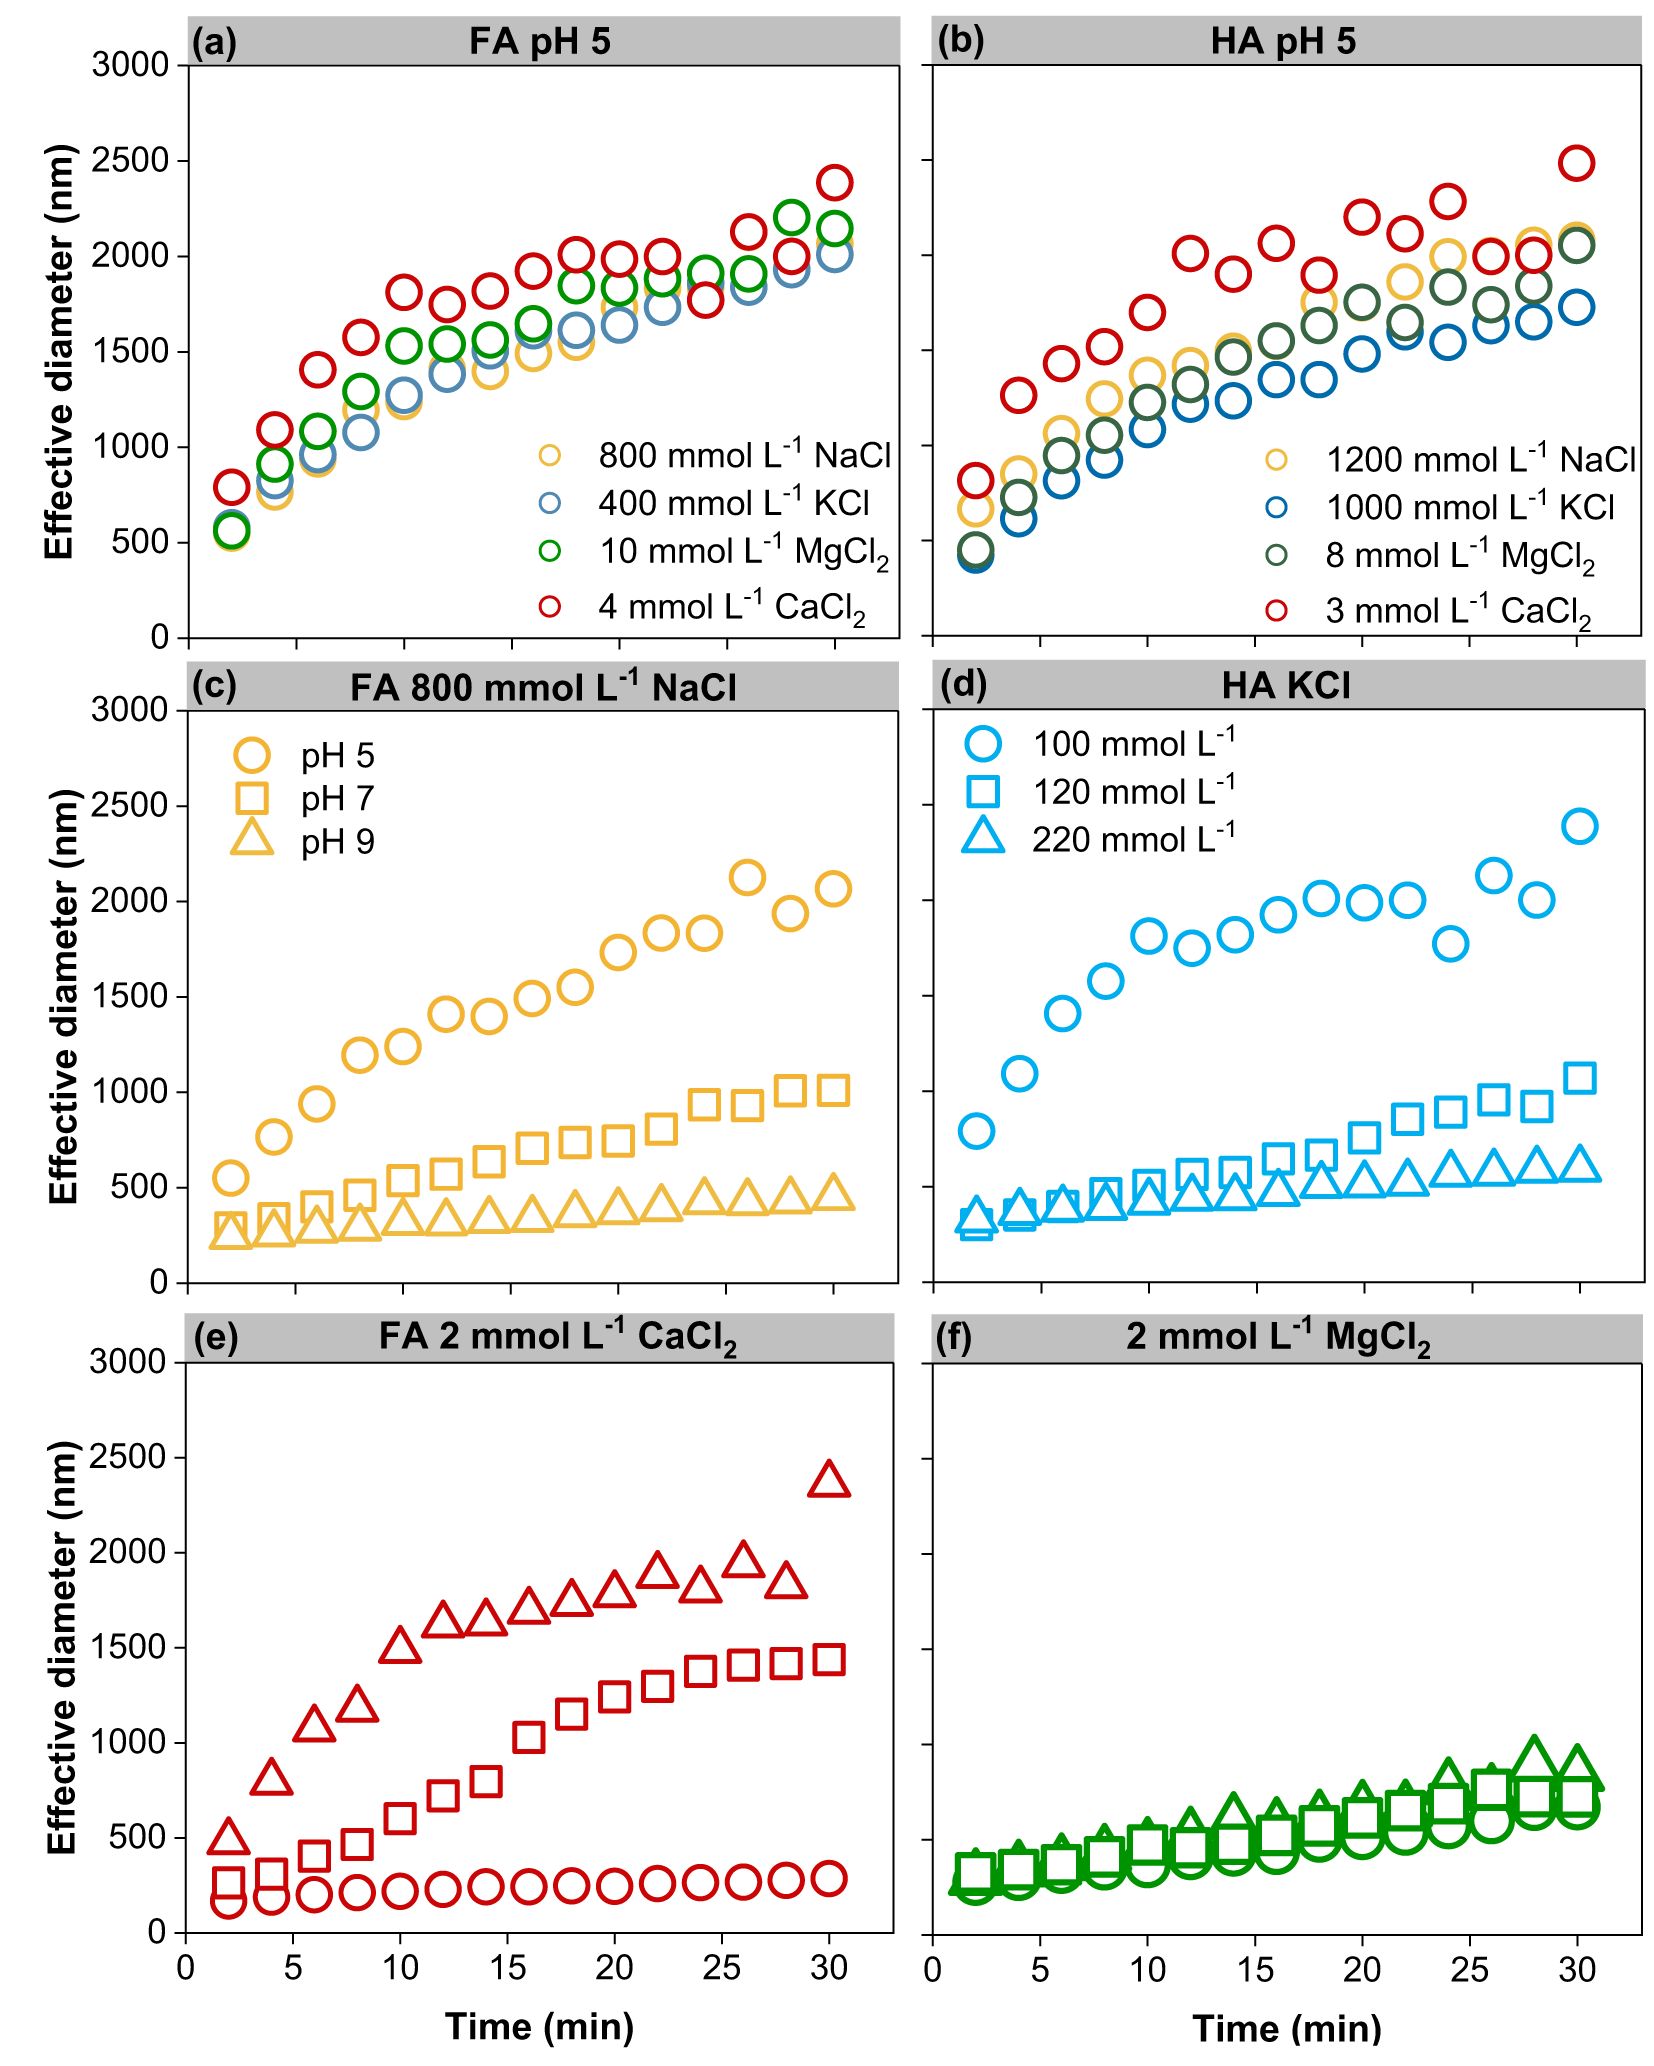
Figure 2. Contrastive analysis of representative aggregation kinetics curves of FA and HA. (a) FA in Na, K, Ca, and Mg electrolyte solution at pH 5 (b) HA in Na, K, Ca, and Mg electrolyte solution at pH 5 (c) FA in Na electrolyte solution at pH 5, 7, and 9 (d) HA in K electrolyte solution at pH 5, 7, and 9 (e) FA in Ca electrolyte solution at pH 5, 7, and 9 (f) HA in Mg electrolyte solution at pH 5, 7, and 9.
3.3 Effects of cations and pH on FA and HA colloidal stability
The CCC values were used to evaluate the stability of FA and HA colloids as a function of cations. Figure 3 illustrates that the cations destabilized FA and HA, with CCC values in the following order: Ca2+ > Mg2+ > K+ > Na+. The CCC values of FA and HA in divalent cations were 50%–84% lower than those of monovalent cations due to the higher charge screening by divalent electrolytes, consistent with the results of the aggregation experiments (37). The generally accepted Schulze–Hardy’s law predicted the same aggregation behaviors for cations with the same valence (38). Here the CCC values of the colloidal aggregates of FA and HA induced by cations with the same valence were also disparate, demonstrating a specific ion effect (39–42). The specific ion effects were also seen in suspension systems of montmorillonite and soil HA colloids (41, 43). It was suggested that ion specificity resulted from quantum fluctuation caused by the electric field of charged colloids that was responsible for differences in CCC between cations with the same valence (41, 44, 45). For charged colloids, there was a strong electric field, as strong as 108 V/m, around the charged colloids, which could result in non-classical polarization of cations around the colloids (46, 47). Taking the divalent system, for example, there was an extra electron shell for Ca2+ compared with Mg2+. The polarization effect of Ca2+ was stronger; thus, the screening effect of Ca2+ was stronger (48). Due to the presence of specific ion effects, if taking Na+ as a refence cation, then the effective charges of K+, Mg2+, and Ca2+ were 1.531, 2.414, and 3.665, respectively (49). Therefore, the CCCs in the KCl and CaCl2 solutions were lower than those in the NaCl and MgCl2 systems, respectively.
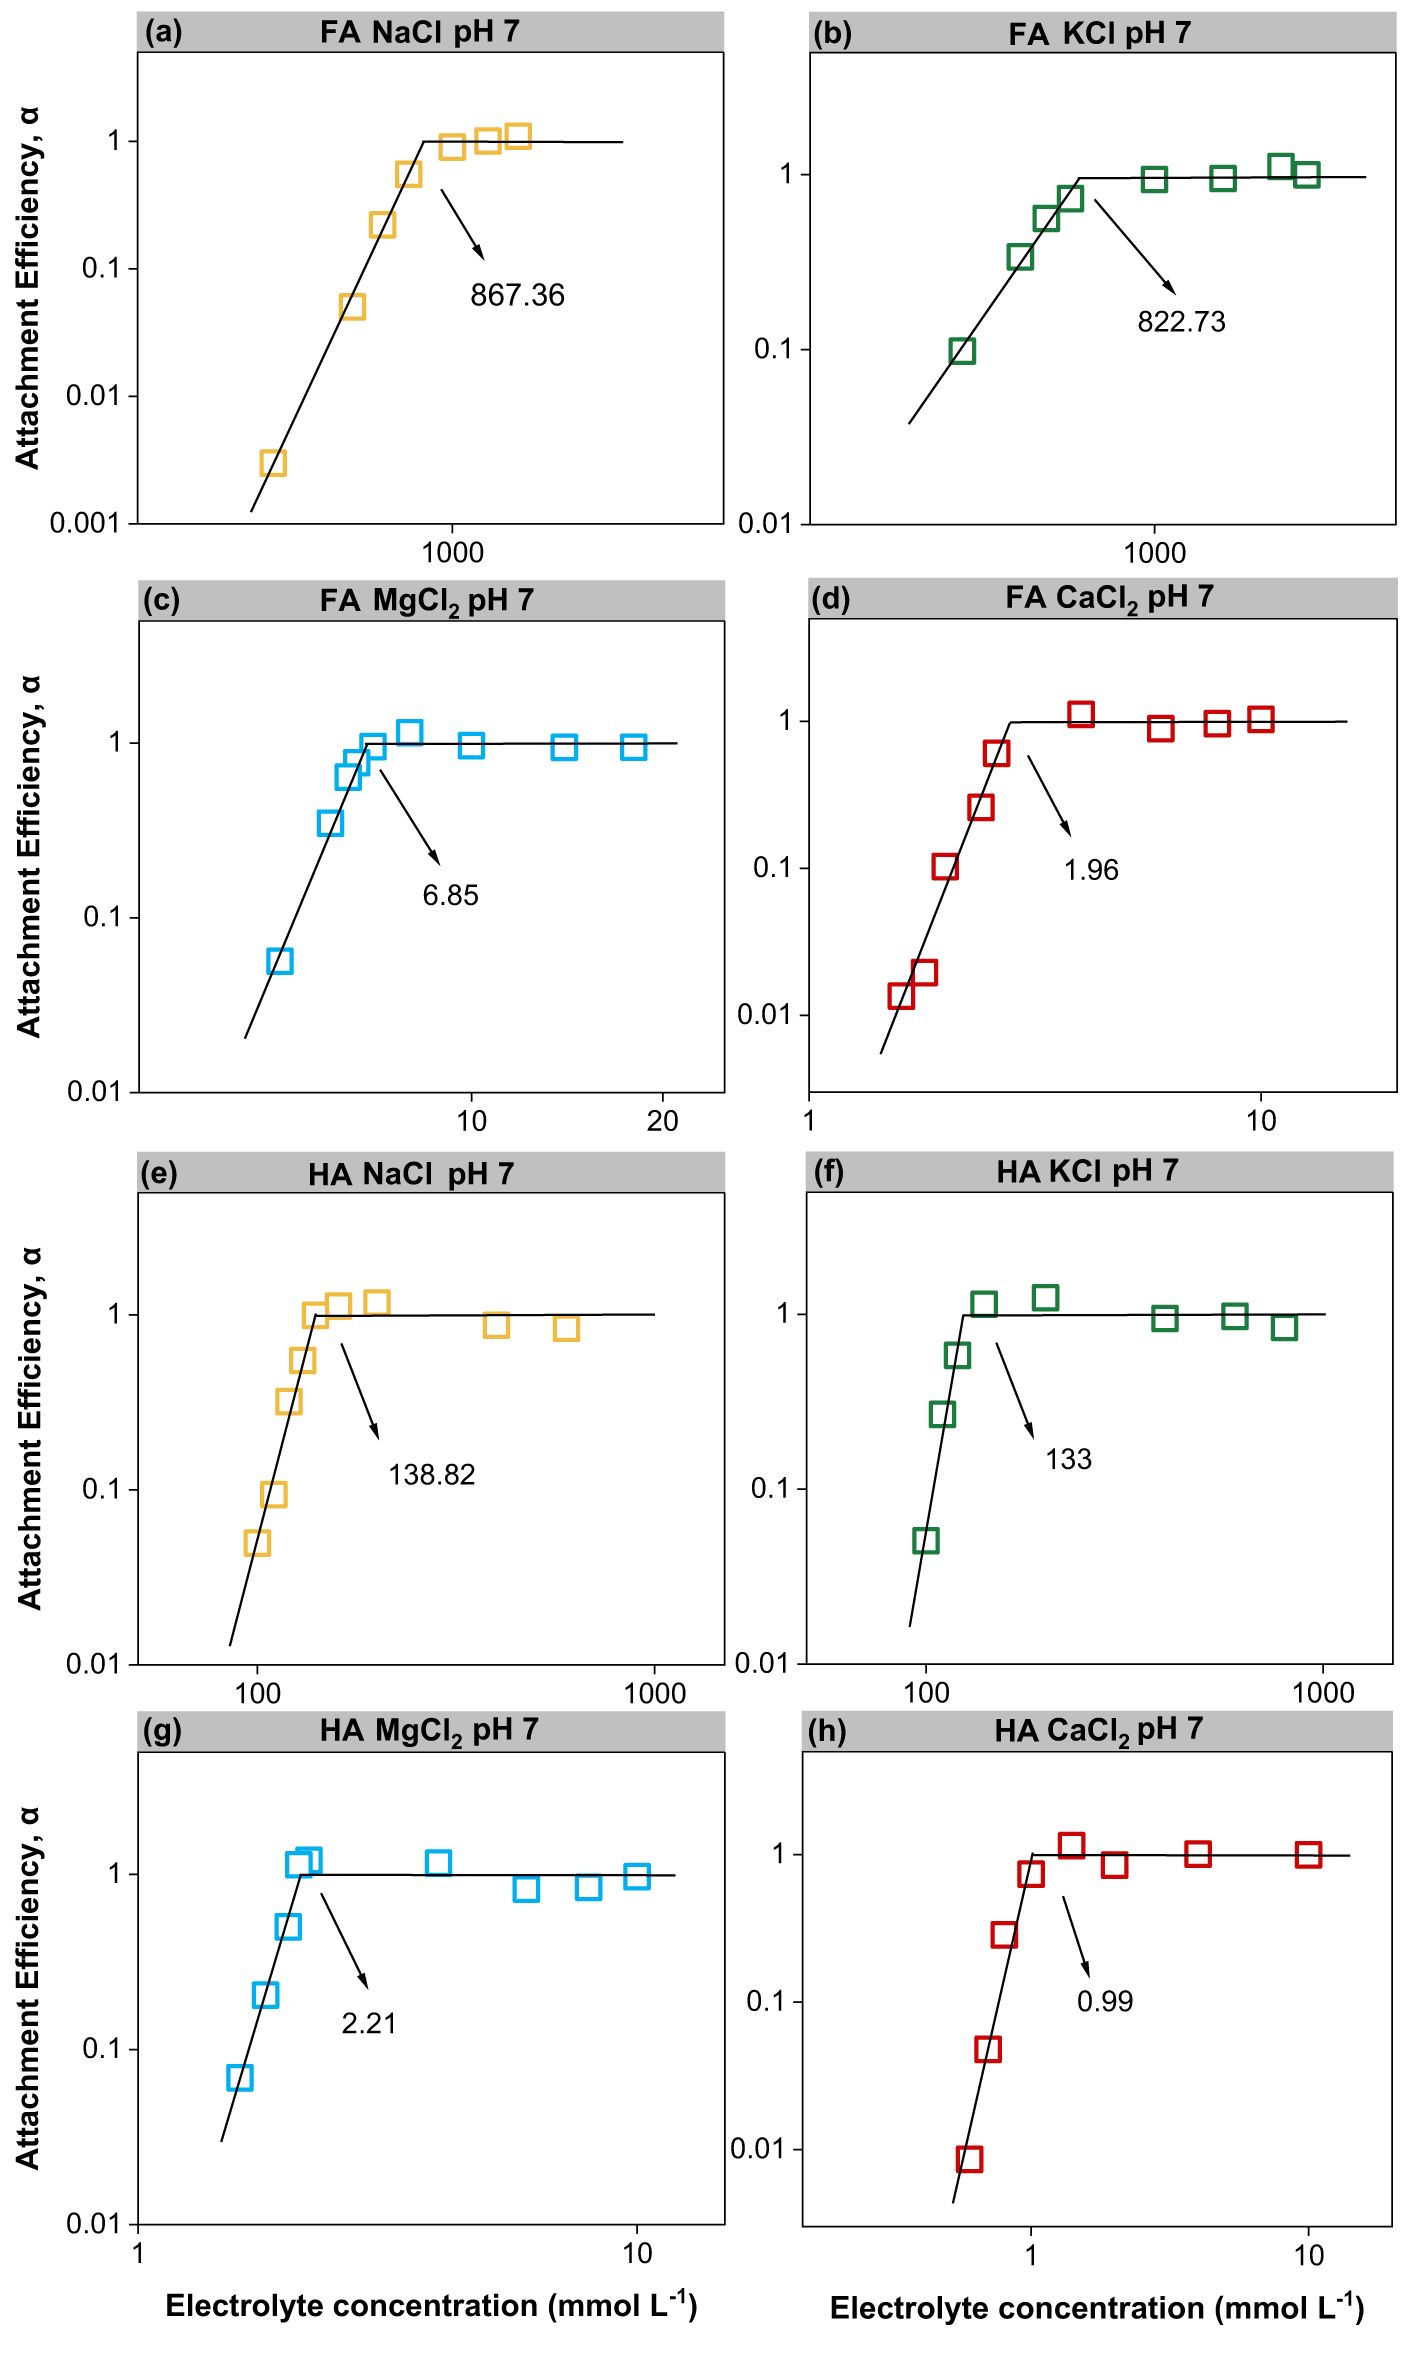
Figure 3. Attachment efficiency (α) of FA and HA as a function of monovalent and divalent cation concentrations at pH 7, and the lines represent the theoretical fits from which the CCC could be evaluated. FA (a–d). HA (e–h).
For FA and HA in NaCl and KCl, the CCC varied with pH in the following order: pH 5 < pH 7 < pH 9 (Figures 4a, c). The CCC of FA and HA in CaCl2 and MgCl2 did not increase with increasing pH (Figures 4b, d). Since FA in KCl (at pH 9) did not lead to any aggregation, only a range of CCC values was obtained (at this point, the KCl solution concentration to be tested was 3 mol L-1; the maximum test condition was 1.5 mol L-1; the concentration of saturated KCl at room temperature was 3.4 mol L-1). The monovalent cations stabilized the FA and HA colloids at high pH values, increasing the CCCs from 602 to 1,410 mM (1.3 times) and 100 to 318 mM (2.2 times) in NaCl and similarly from 309 to over 1,500 mM (over 3.9 times) and 67 to 300 mM (3.5 times) in KCl (Figures 4a, c). Usually, both the negative surface charge and the active functional groups of the colloid do increase with pH, enhancing the colloidal CCC, which is consistent with the colloidal CCC values in NaCl and KCl (Figures 4a, c). The increased electrostatic repulsion between particles due to an increase in negative charge was the primary reason for the enhanced stability of colloids (37). The CCC values of FA were higher than those of HA, indicating that the former exhibited stronger colloidal stability due to the smaller molecular weight of FA. The aggregating role of pH and cation was also visually corroborated by naked-eye observations of FA and HA colloids (in 1,000 mmol L-1 NaCl and KCl, 10 mmol L-1 CaCl2, and MgCl2 for 30 min), respectively (Supplementary Figure S4).
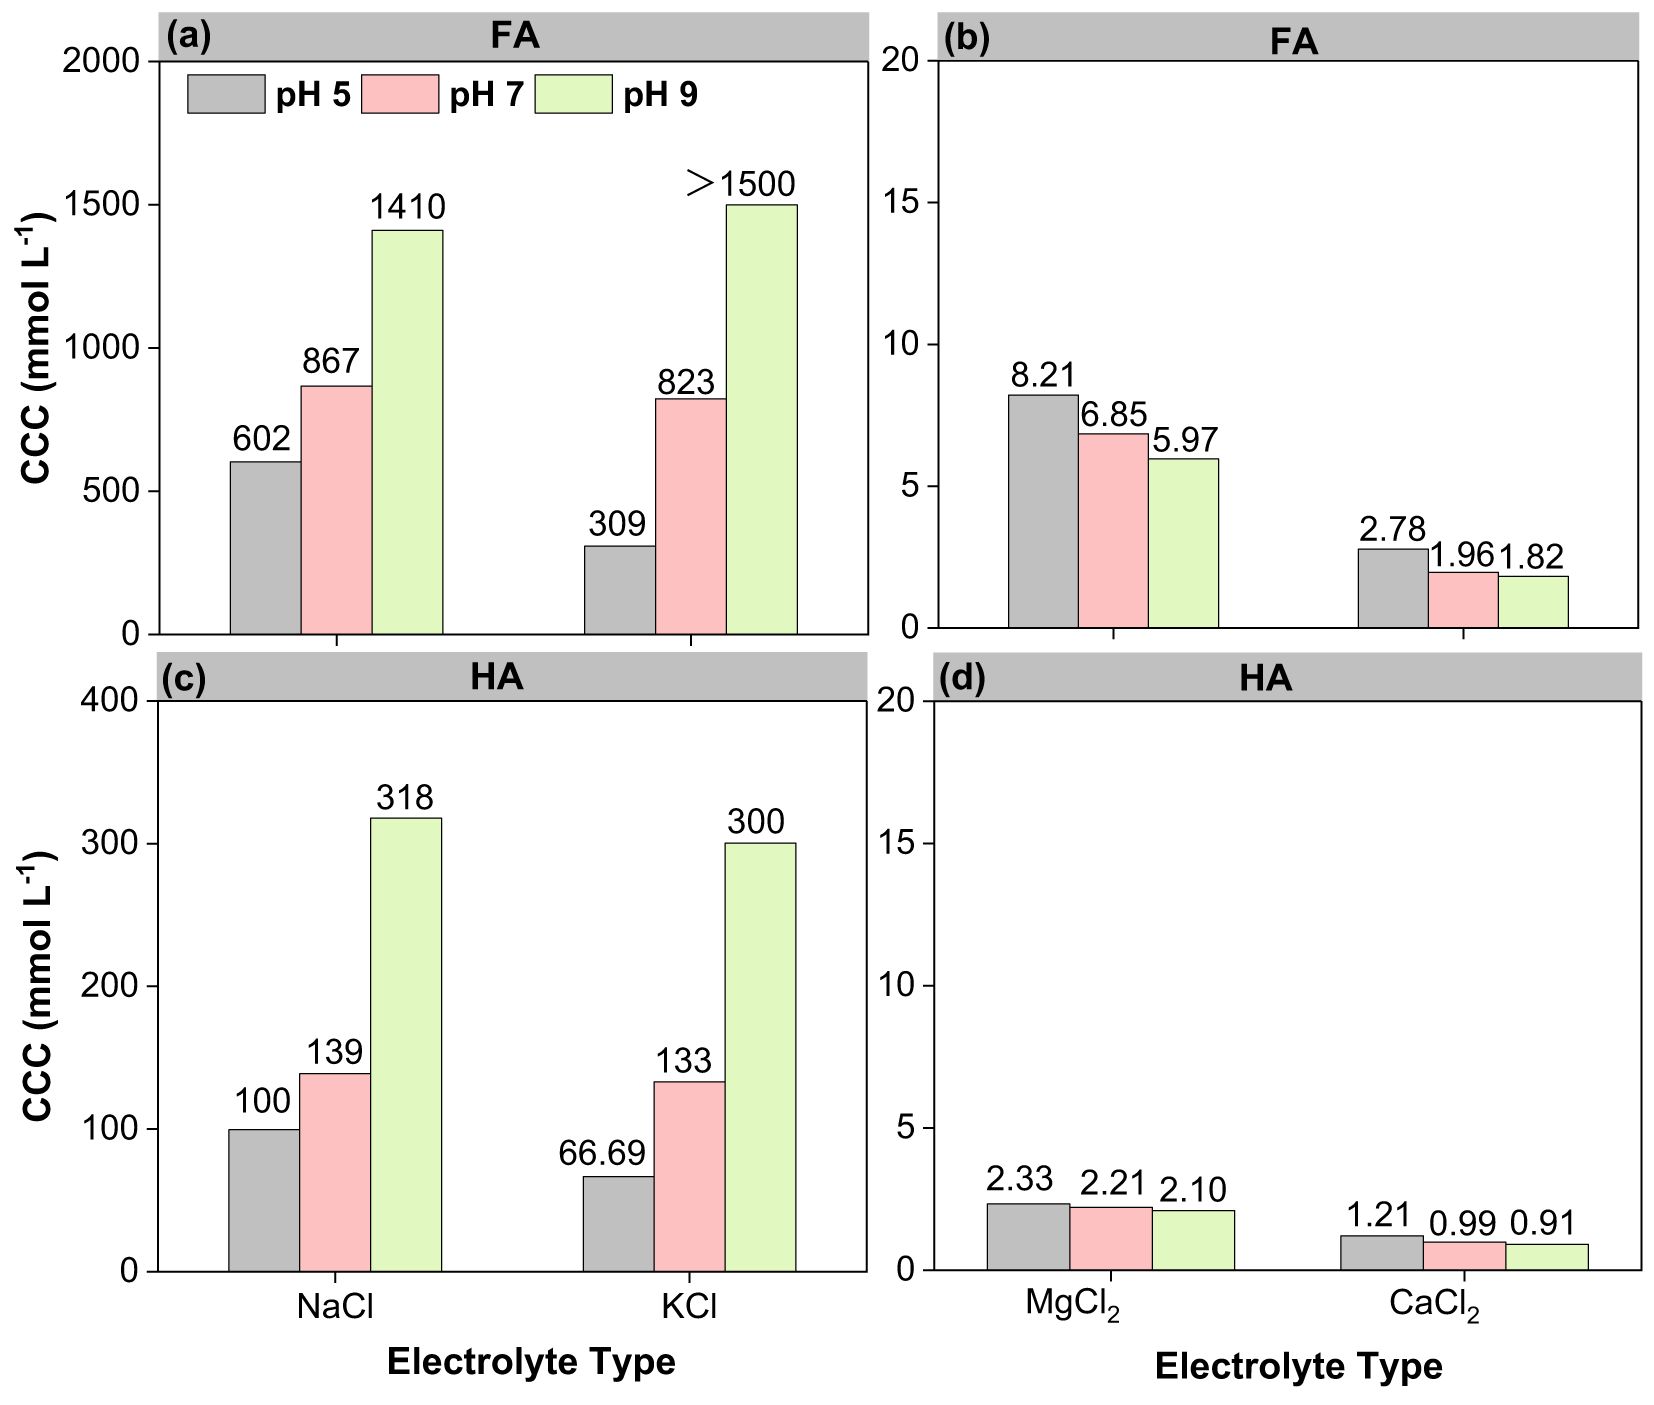
Figure 4. The CCCs of FA (a, b) and HA (c, d) in monovalent and divalent cations at pH 5, 7, and 9.
3.4 Electrostatic repulsive energy increased the FA and HA colloidal stability
VA depended on the Hamaker constants of FA and HA in water, which were simulated to be 1.47 × 10⁻²⁰ and 2.55 × 10⁻²⁰ J, respectively. The Hamaker constants of FA and HA in vacuum were 7.68 × 10⁻²⁰ and 9.96 × 10⁻²⁰ J, respectively. The smaller Hamaker constant of FA actually determined its higher CCC value and greater colloidal stability than that of HA (Figure 4). Under the constant van der Waals force, the inter-particle electrostatic repulsion (favoring colloidal stability) was jointly regulated by the effects of pH and cations on the charge density of the colloidal surface (31). Compared to the initial zeta potentials (Figure 1b), the zeta potentials of the FA and HA colloids became less negative as cation concentrations increased (Supplementary Figure S3). Ca2+ and Mg2+ significantly decreased the zeta values of FA and HA, ranging from about -15 to -10 mV (Supplementary Figure S3). The colloidal zeta values in Ca2+ and Mg2+ were considerably less negative than those in Na+ and K+. It is difficult to obtain the corresponding zeta potentials due to the high concentration of monovalent ions triggering the aggregation. However, the colloidal surface potential hardly changed in the presence of 10 mmol L-1 of monovalent ions (which exceeds the CCC values of colloid in divalent cations). Cations neutralize the negative charges on the colloid surface, promoting colloidal aggregation by reducing the electrostatic repulsion (31). The divalent cations are more effective in reducing the energy barrier for colloids than monovalent cations. This is due to the higher charge density in the diffusion layer for divalent cations versus monovalent cations (at the same molarity) (31).
Generally, the negative charge of the colloidal surface increased with pH (Figure 1b), resulting in higher electrostatic repulsion and colloidal stability (37). When the pH increased, the energy barrier also increased, leading to a slower aggregation of colloids (31). This trend explains the slower aggregation rate and higher CCC values of FA and HA in Na+ and K+ with increasing pH (Supplementary Figures S1, S4). However, the stability of divalent ion colloids is less affected by changes in pH—the aggregation behaviors of FA and HA in divalent cation with increasing pH could not be accurately described by the DLVO theory.
In order to quantify the specific ion effects between cations with the same valence, the effective charges of Mg2+ (2.414) and Ca2+ (3.665) have been adopted to revise the DLVO theory (31, 48, 50). Figure 5 shows the particle interaction energy profiles for FA and HA colloids as a function of divalent cation type (Ca2+ and Mg2+) at pH 7 after taking the specific ion effects caused by the quantum fluctuation into consideration. When the distance between colloids was 2 nm, the van der Waals attractive force energy (VA) between FA colloid particles was -1.89 × 10⁻²⁰ J. The total interaction energy (VT) and electrostatic repulsive force energy (VR) of FA in 6 mmol L-1 Ca2+ were -1.50 × 10⁻²⁰ and 4.33 × 10⁻²¹ J (Figure 5a) and in 6 mmol L-1 Mg2+ were -1.20 × 10⁻²⁰ and 6.97 × 10⁻²¹ J (Figure 5b), respectively. The VT and VA of FA in Mg2+ were higher than that of FA in Ca2+; hence, FA has higher CCC and greater colloidal stability in Mg2+ than in Ca2+ (Figure 4b). Additionally, the VA of HA in 4 mM Ca2+ and Mg2+ was -1.89 × 10⁻²⁰ J. The VT and VR of HA in Mg2+ (-1.90 × 10⁻²⁰ and 1.40 × 10⁻²⁰ J) were also stronger than that in Ca2+ (-2.63 × 10⁻²⁰ and 6.68 × 10⁻²¹ J) (Figures 5c, d). This also demonstrated the stronger aggregation effect of Ca2+ than Mg2+.
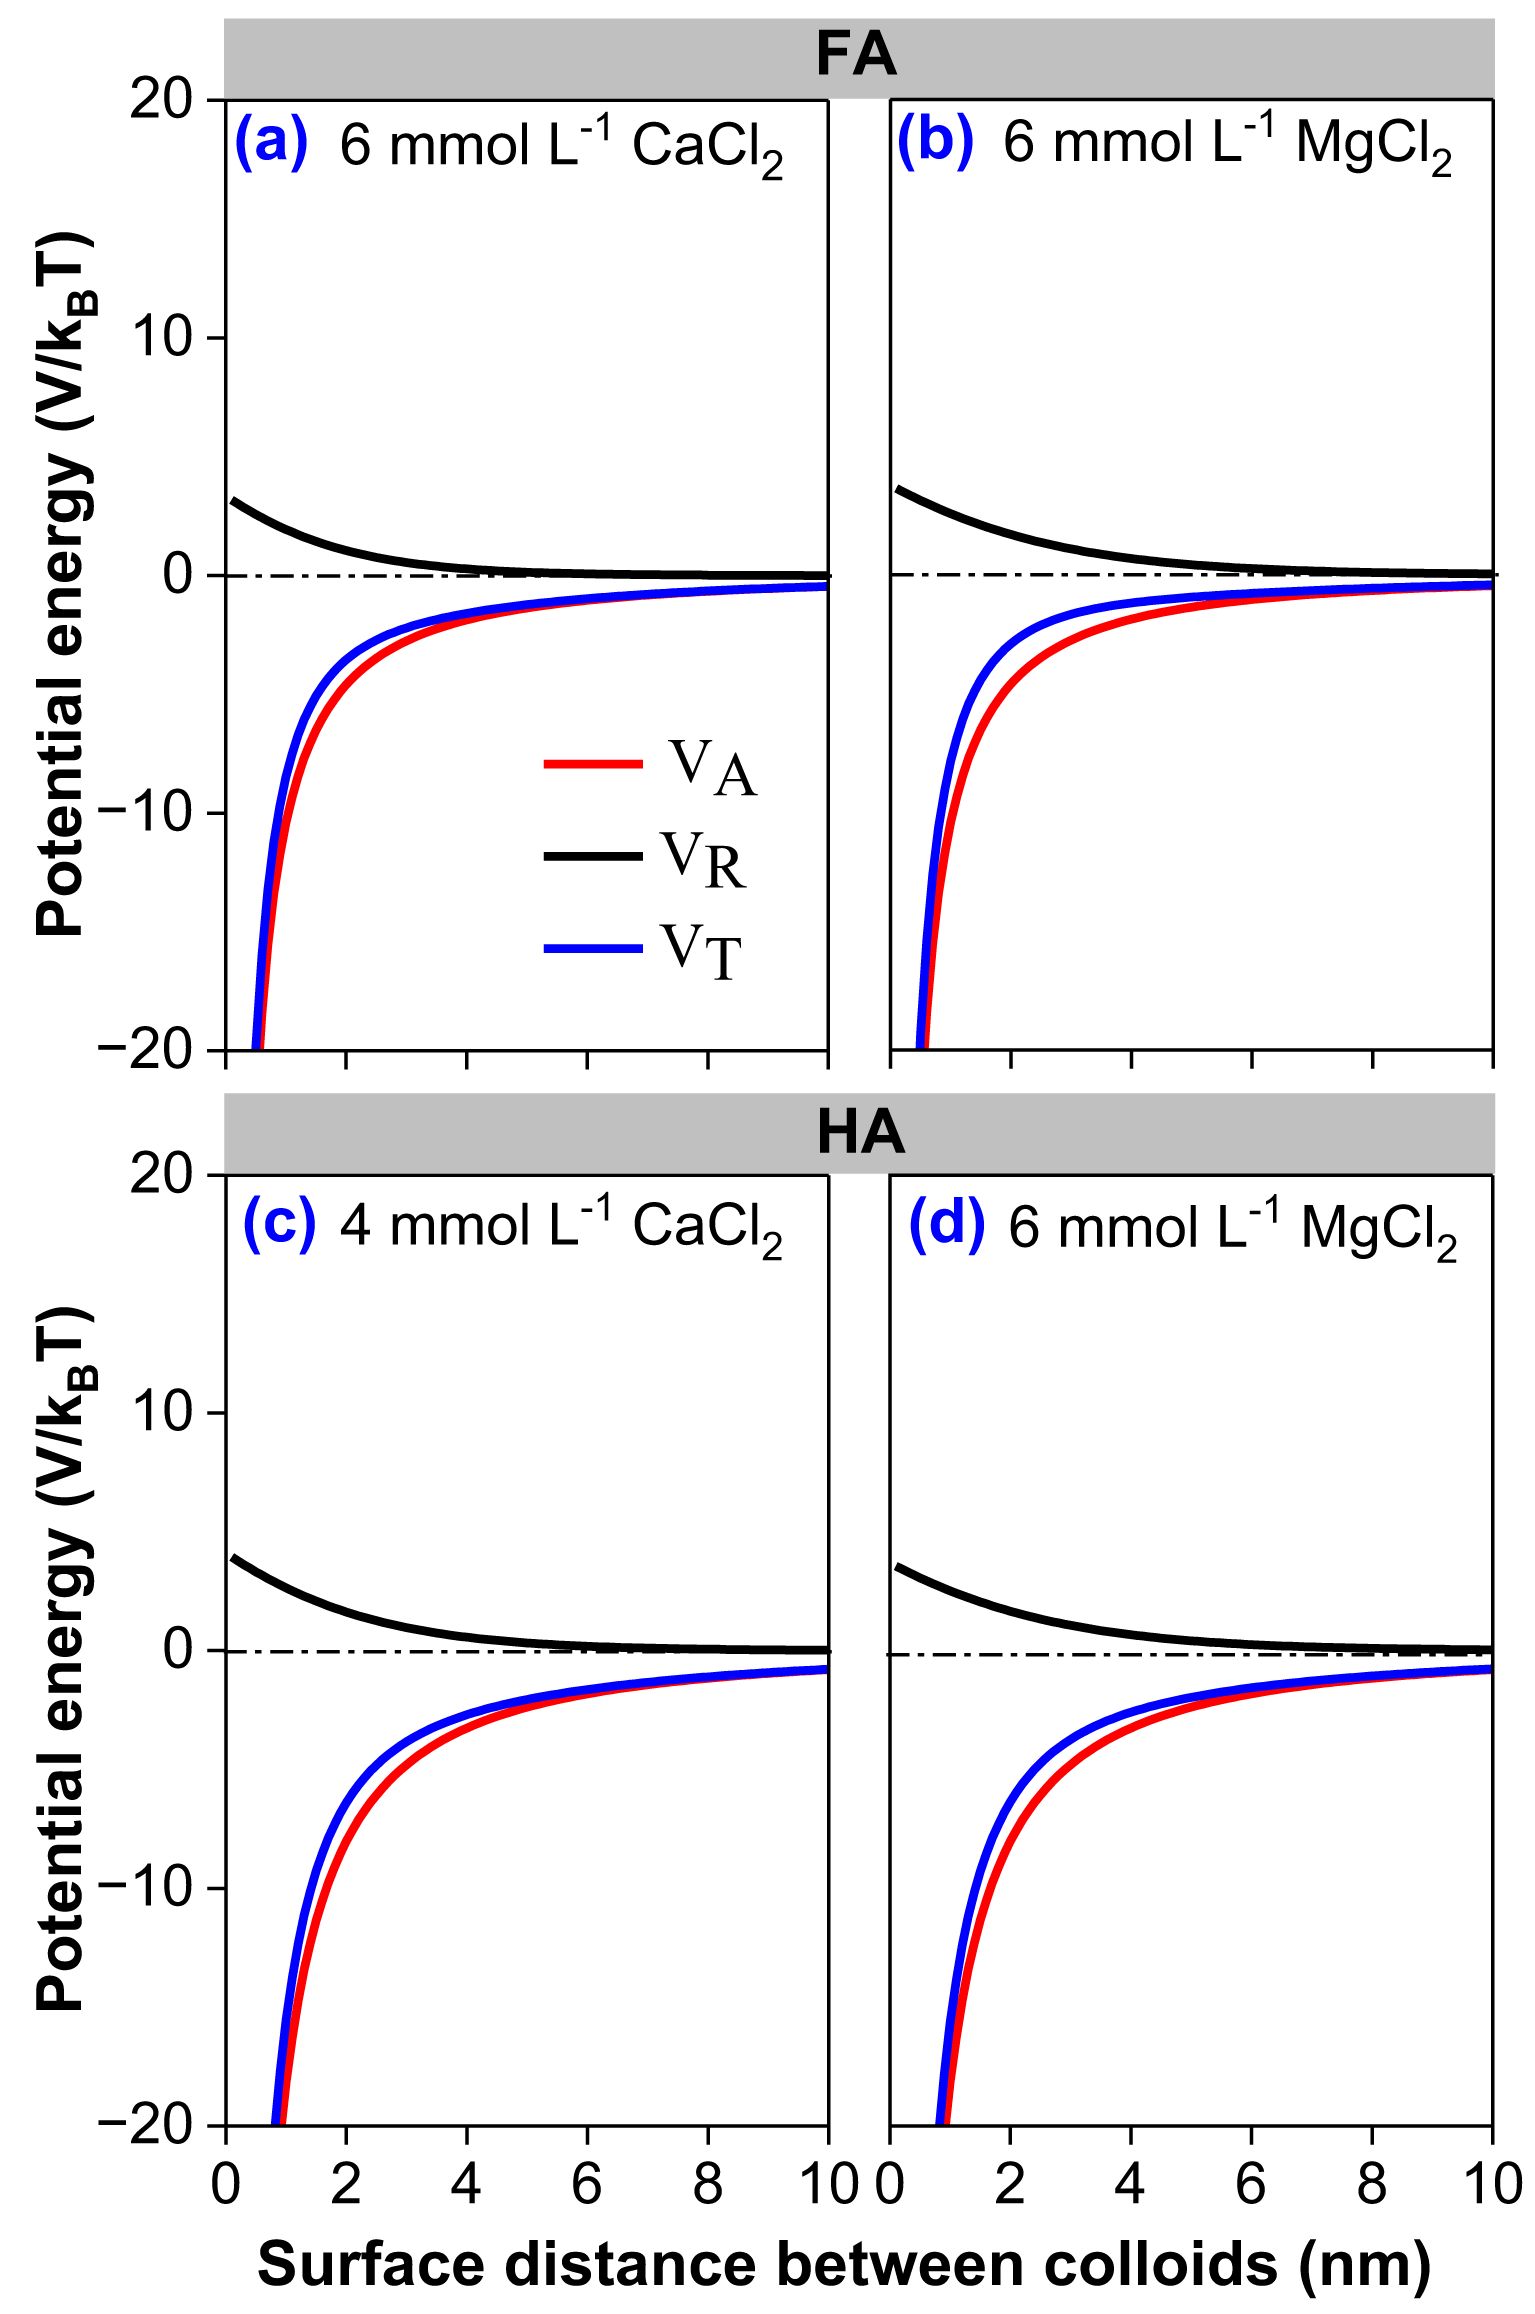
Figure 5. Interaction energy profiles for FA (a, b) and HA (c, d) in CaCl2 and MgCl2 solution, where VA is the van der Waals attractive energy, VR is the electrostatic repulsive energy, and VT is the total interaction energy.
Notably, the steric hindrance was also the major stabilization mechanism for FA and HA, whereas the stronger stabilization effect of FA than HA in our study was attributed to the higher molecular weight, longer carbon chain, and more compact structure of HA (31).
3.5 Cationic polarization and ionic bridging reduce the FA and HA colloidal stability
FTIR spectroscopy was applied to further gain an insight into the interaction involved in FA, HA, and ions (Figure 6). To clarify the dominating functional groups participating in binding with cations, FTIR spectroscopy for the complexation of FA and HA with Na+, K+, Ca2+, and Mg2+ was determined (Figure 6). Compared to FA and HA at pH 5, 7, and 9, the intensity and relative content of the functional groups at 3,420, 1,638 or 1,608, 1,384, and 1,206 cm-1 in the FTIR spectra increased significantly after the binding of Na+ (1,000 mmol L-1), K+ (1,000 mmol L-1), Ca2+ (10 mmol L-1), and Mg2+ (10 mmol L-1) to FA and HA (Figures 6; Supplementary Table S4). This is clear evidence of ionic bridging and highlights that the hydroxyl and carboxyl groups are the main sites for interaction with ions (37).
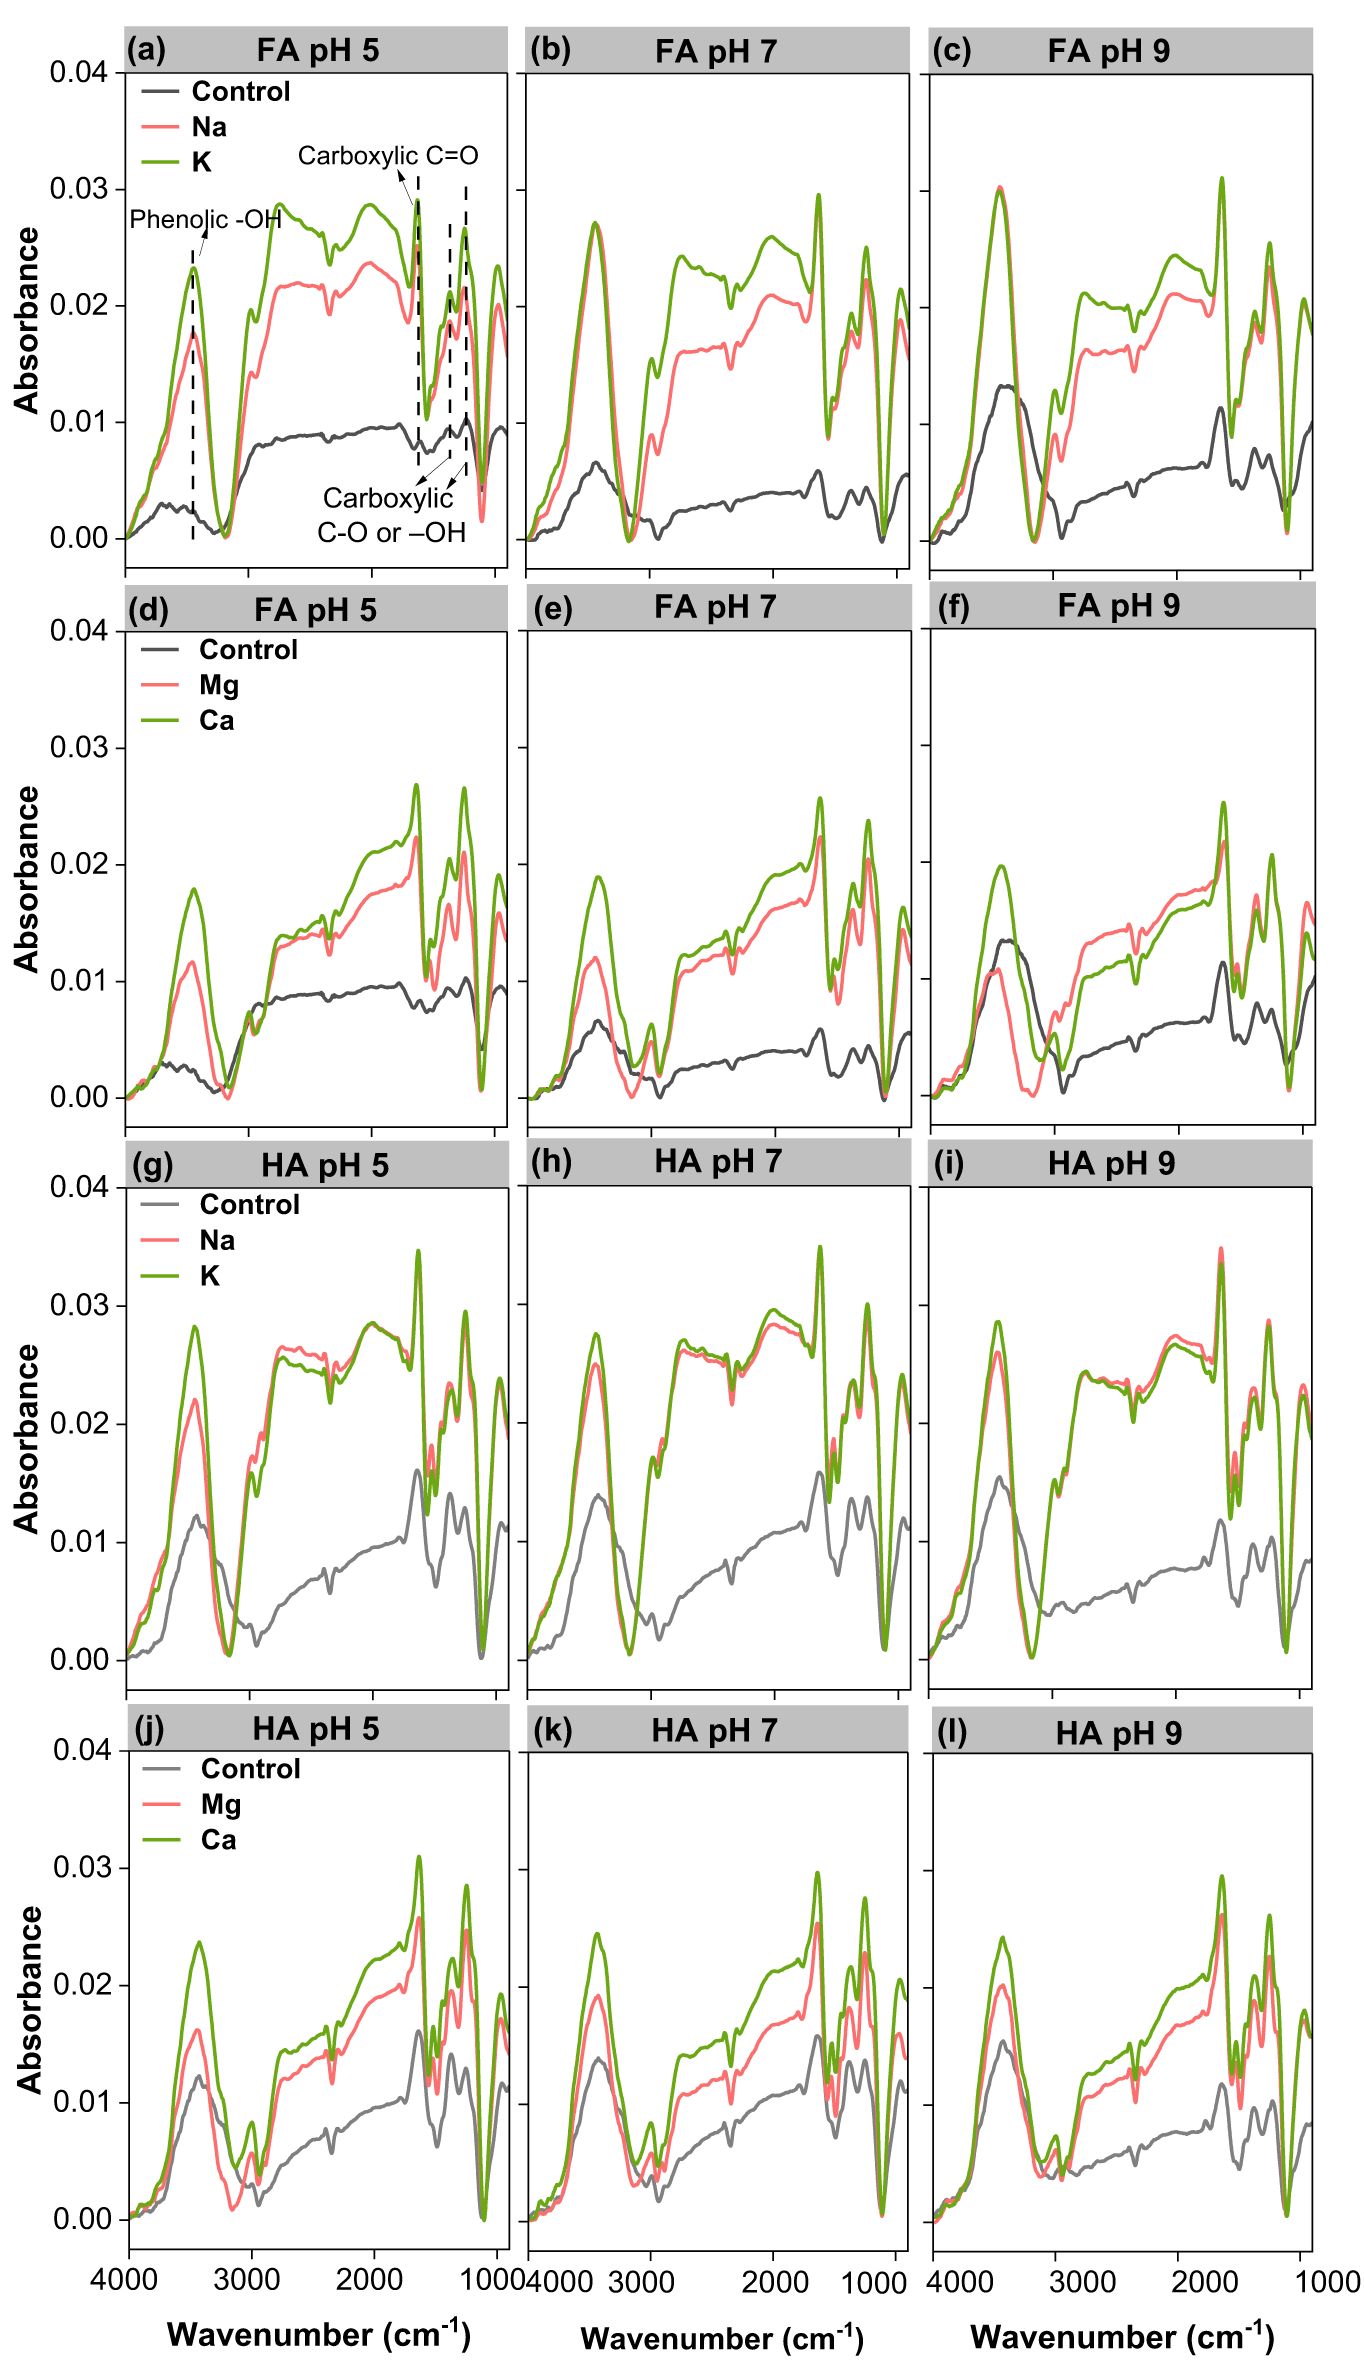
Figure 6. FTIR spectrum of 100 mg L-1 FA (a–f) and HA (g–l) colloids in Na/K/Mg/Ca solutions at pH 5, 7, and 9, respectively.
The ionization of H on the functional group causes it to carry a large charge and generates a strong electric field around the colloid, which affects the interaction of the counterions with the boundary around the colloid. Ions with different electron-layer structures therefore undergo strong polarization due to the induction of a strong electric field. This polarization affects the condensation and dispersion of colloidal particles by affecting the interfacial behavior of ions (49).
The pH-promoted deprotonation of the active functional groups on the colloidal surface generated negative charges and increased the inter-particle electrostatic repulsion potential energy. Thus, the charge neutralization between the cations and the negative charges on the colloidal surface was enhanced to break this repulsion barrier (33, 51). However, the divalent ions reduce the colloidal stability more than the monovalent ions. We know that the negative electric field of colloids can be much more effectively screened by Ca2+ and Mg2+ than by Na+ and K+ (49, 52). That is also why the CCC (colloidal stability) in NaCl and KCl solutions increases with increasing pH, while the CCC in MgCl2 and CaCl2 solutions remained relatively unchanged with pH (Figure 4).
4 Conclusions
Both FA and HA colloids are polydisperse systems of lamellar particles with irregular edges, negatively charged surfaces, and several active functional groups, including hydroxyl and carboxyl. Increased electrolyte concentration destabilized FA and HA colloids by charge screening (i.e., ionic bridging). The aggregation ability of cations showed the specific ion effects of Ca2+ > Mg2+ > K+ > Na+ due to the differences in non-classical polarization of cations around the negatively charged FA and HA. There were higher CCCs of FA and HA in Na+ and K+ solutions with increasing pH from 5 to 7 and 9. The increased zeta potential values (i.e., negative charge) of colloid and electrostatic repulsion between particles resulted in weaker aggregation behaviors in NaCl and KCl solutions due to the enhanced deprotonation of hydroxyl and carboxyl groups on the colloidal surface. Ionic bridging was the main cause of the destabilization of the colloids. Compared to HA, FA had smaller particle sizes, a lower Hamaker constant, high surface negative charges, larger CCC, and greater colloidal dispersion stability. These findings will improve the understanding of FA and HA colloids’ aggregation mechanisms and help predict their environmental behaviors, such as the absorption of pollutants.
Data availability statement
The raw data supporting the conclusions of this article will be made available by the authors, without undue reservation.
Author contributions
CW: Conceptualization, Data curation, Formal Analysis, Investigation, Methodology, Software, Writing – original draft, Writing – review & editing. C-YX: Formal Analysis, Funding acquisition, Methodology, Project administration, Supervision, Writing – review & editing. R-TM: Writing – review & editing. Q-RL: Writing – review & editing. F-NH: Writing – review & editing. S-WZ: Supervision, Writing – review & editing. RB: Supervision, Writing – review & editing.
Funding
The author(s) declare that financial support was received for the research and/or publication of this article. This work was supported by the Natural Science Foundation of Shaanxi Province (2023-JC-YB-263), Natural Science Foundation of China (42442036 and 42277311), the Fundamental Research Funds for the Central Universities (2452020165), and the China Scholarship Council (CSC Number: 202306350107) to CW.
Acknowledgments
Thanks to Yuqing Ma for editing this article.
Conflict of interest
Authors CW and RB were employed by the company Forschungszentrum Jülich GmbH.
The remaining authors declare that the research was conducted in the absence of any commercial or financial relationships that could be construed as a potential conflict of interest.
Publisher’s note
All claims expressed in this article are solely those of the authors and do not necessarily represent those of their affiliated organizations, or those of the publisher, the editors and the reviewers. Any product that may be evaluated in this article, or claim that may be made by its manufacturer, is not guaranteed or endorsed by the publisher.
Supplementary material
The Supplementary Material for this article can be found online at: https://www.frontiersin.org/articles/10.3389/fsoil.2025.1452870/full#supplementary-material
References
1. Sutton R and Sposito G. Molecular structure in soil humic substances: The new view. Environ Sci Technol. (2005) 39:9009–15. doi: 10.1021/es050778q
2. Kou B, Hui KL, Miao F, He Y, Qu CT, Yuan Y, et al. Differential responses of the properties of soil humic acid and fulvic acid to nitrogen addition in the North China Plain. Environ Res. (2022) 214:113980. doi: 10.1016/j.envres.2022.113980
3. Oldham VE, Mucci A, Tebo BM, and Luther GW. Soluble Mn(III)-L complexes are abundant in oxygenated waters and stabilized by humic ligands. Geochim Cosmochim Ac. (2017) 2:238–46. doi: 10.1016/j.gca.2016.11.043
4. Jin PK, Song JN, Yang L, Jin X, and Wang XC. Selective binding behavior of humic acid removal by aluminum coagulation. Environ pollut. (2018) 2:290–8. doi: 10.1016/j.envpol.2017.10.058
5. Liu SS, Liu LZ, Zhu YR, He ZQ, Giesy JP, Bai YC, et al. Cation-induced coagulation of aquatic plant-derived dissolved organic matter: investigation by EEM-PARAFAC and FT-IR spectroscopy. Environ pollut. (2018) 3:726–34. doi: 10.1016/j.envpol.2017.11.076
6. Gao Y, Song X, Liu K, Li T, Zheng W, Wang Y, et al. Mixture of controlled-release and conventional urea fertilizer application changed soil aggregate stability, humic acid molecular composition, and maize nitrogen uptake. Sci Total Environ. (2021) 789:147778. doi: 10.1016/j.scitotenv.2021.147778
7. Nguyen HVM, Lee SY, Hur J, and Shin HS. Changes in structural characteristics of humic and fulvic acids under chlorination and their association with trihalomethanes and haloacetic acids formation. Sci Total Environ. (2021) 790:148142. doi: 10.1016/j.scitotenv.2021.148142
8. Kalinichev AG, Iskrenova-Tchoukova E, Ahn WY, Clark MM, and Kirkpatrick RJ. Effects of Ca2+ on supramolecular aggregation of natural organic matter in aqueous solutions: A comparison of molecular modeling approaches. Geoderma. (2011) 12:27–32. doi: 10.1016/j.geoderma.2010.09.002
9. Yang K, Chen B, Zhu X, and Xing B. Aggregation, adsorption, and morpho logical transformation of graphene oxide in aqueous solutions containing different metal cations. Environ. Sci. Technol. (2016) 50(20):11066–75. doi: 10.1021/acs.est.6b04235
10. Zhu S, Avadiar L, and Leong YK. Yield stress- and zeta potential-pH behaviour of washed α-Al2O3 suspensions with relatively high Ca(II) and Mg(II) concentrations: Hydrolysis product and bridging. Int J Miner Process. (2016) 148:1–8. doi: 10.1016/j.minpro.2016.01.004
11. Tan LQ, Yu ZW, Tan XL, Fang M, Wang XX, Wang JF, et al. Systematic studies on the binding of metal ions in aggregates of humic acid: Aggregation kinetics, spectroscopic analyses and MD simulations. Environ pollut. (2019) 246:999–1007. doi: 10.1016/j.envpol.2019.01.007
12. Tan LQ, Tan XL, Fang M, Yu ZM, and Wang XK. Effects of humic acid and Mg. sup.2+ on morphology and aggregation behavior of silica aerogels. J Mol Liq. (2018) 264:261–8. doi: 10.1016/j.molliq.2018.05.064
13. Alvarez Puebla RA and Garrido JJ. Effect of pH on the aggregation of a gray humic acid in colloidal and solid states. Chemosphere. (2005) 5(59):659–67. doi: 10.1016/j.chemosphere.2004.10.021
14. Wang LF, Wang LL, Ye XD, Li WW, Ren XM, Sheng GP, et al. Coagulation kinetics of humic aggregates in mono- and di-valent electrolyte solutions. Environ Sci Technol. (2013) 10:5042–9. doi: 10.1021/es304993j
15. Xu HC, Houghton EM, Houghton CJ, and Guo LD. Variations in size and composition of colloidal organic matter in a negative freshwater estuary. Sci Total Environ. (2018) 615:931–41. doi: 10.1016/j.scitotenv.2017.10.019
16. Klučáková M. Characterization of pH-fractionated humic acids with respect to their dissociation behavior. Environ Sci.Pollut R. (2016) 8:7722–31. doi: 10.1007/s11356-015-5932-2
17. Azizul H and Motoyoshi K. Strength of humic acid aggregates: effects of divalent cations and solution pH. ACS Omega. (2019) 5:8559–67. doi: 10.1021/acsomega.9b00124
18. Chen SY, Huang SW, Chiang PN, Liu JC, Kuan WH, Hung JT, et al. Influence of chemical compositions and molecular weights of humic acids on Cr(VI) photo-reduction. J Hazard Mater. (2011) 12:337–44. doi: 10.1016/j.jhazmat.2011.09.091
19. Xu F, Wei C, Zeng Q, Li X, Alvarez PJJ, Li Q, et al. Aggregation behavior of dissolved black carbon: implications for vertical mass flux and fraction in aquatic systems. Environ Sci Technol. (2017) 51:13723–32. doi: 10.1021/acs.est.7b04232
20. Klučáková M. Size and charge evaluation of standard humic and fulvic acids as crucial factors to determine their environmental behavior and impact. Front Chem. (2018) 6:235. doi: 10.3389/fchem.2018.00235
21. Song FH, Wu FC, Feng WY, Tang Z, Giesy JP, Guo F, et al. Fluorescence regional integration and differential fluorescence spectroscopy for analysis of structural characteristics and proton binding properties of fulvic acid sub-fractions. J Environ Sci. (2018) 74:116–25. doi: 10.1016/j.jes.2018.02.015
22. Chen W, Nuzahat H, Liu XY, Sheng GP, and Yu HQ. FTIR and synchronous fluorescence heterospectral two-dimensional correlation analyses on the binding characteristics of copper onto dissolved organic matter. Environ Sci Technol. (2015) 4:2052–8. doi: 10.1021/es5049495
23. Claudio C, Giuseppe P, Ruggero A, Hyen GC, Ornella F, Andre E, et al. Spontaneous aggregation of humic acid observed with AFM at different pH. Chemosphere. (2015) 11:821–8. doi: 10.1016/j.chemosphere.2015.08.010
24. Zhang J, Chen LP, Yin HL, Jin S, Liu F, and Chen HH. Mechanism study of humic acid functional groups for Cr(VI) retention: Two-dimensional FTIR and 13C CP/MAS NMR correlation spectroscopic analysis. Environ pollut. (2017) 225:86–92. doi: 10.1016/j.envpol.2017.03.047
25. Klučáková M and Kalina M. Composition, particle size, charge, and colloidal stability of pH-fractionated humic acids. J Soil Sediment. (2015) 9:1900–8. doi: 10.1007/s11368-015-1142-2
26. Li JP, Li NQ, Ding Y, Wang KL, Qian GR, Xu YF, et al. Comparison of humic and fulvic acid on remediation of arsenic contaminated soil by electrokinetic technology. Chemosphere. (2020) 241:125038. doi: 10.1016/j.chemosphere.2019.125038
27. Lamar RT, Olk DC, Mayhew L, and Bloom PR. A new standardized method for quantification of humic and fulvic acids in humic ores and commercial products. J AOAC Int. (2014) 97:721–30. doi: 10.5740/jaoacint.13-393
28. Sobolev VD, Filippov AN, and Starov VM. Influence of flow and charge transfer inside membranes on measurements of membrane zeta potential. J Mol Liq. (2021) 323:114865. doi: 10.1016/j.molliq.2020.114865
29. Xu CY, Deng KY, Li JY, and Xu RK. Impact of environmental conditions on aggregation kinetics of hematite and goethite nanoparticles. J Nanopart Res. (2015) 17:394. doi: 10.1007/s11051-015-3198-8
30. Xu CY, Zhou TT, Wang CL, Liu HY, Zhang CT, Hu FN, et al. Aggregation of polydisperse soil colloidal particles: Dependence of Hamaker constant on particle size. Geoderma. (2020) 359:113999. doi: 10.1016/j.geoderma.2019.113999
31. Liu B, Guo CL, Ke CD, Chen K, and Dang Z. Colloidal stability and aggregation behavior of CdS colloids in aquatic systems: Effects ofmacromolecules, cations, and pH. Sci Total Environ. (2023) 869:161814. doi: 10.1016/j.scitotenv.2023.161814
32. Geißler D, Gollwitzer C, Sikora A, Minelli C, Krumrey M, and Resch-Genger U. Effect of fluorescent staining on size measurements of polymeric nanoparticles using DLS and SAXS. Anal Methods-UK. (2015) 7:9785. doi: 10.1039/C5AY02005K
33. Uygunerdemirel CS and Bekbolet M. Significance of analytical parameters for the understanding of natural organic matter in relation to photocatalytic oxidation. Chemosphere. (2011) 84:1009–31. doi: 10.1016/j.chemosphere.2011.05.003
34. Li QR, Zhang X, Mao M, Wang X, and Shang JY. Carbon content determines the aggregation of biochar colloids from various feedstocks. Sci Total Environ. (2023) 880:163313. doi: 10.1016/j.scitotenv.2023.163313
35. Aranganathan L, Rajasree SRR, Govindaraju K, Kumar SS, Gayathri R, Remya RR, et al. Spectral and microscopic analysis of fulvic acids isolated from marine fish waste and sugarcane bagasse co-compost. Biocatalysis Agric Biotechnol. (2020) 29:101762. doi: 10.1016/j.bcab.2020.101762
36. Rodríguez FJ, Schlenger P, and García-Valverde M. A comprehensive structural evaluation of humic substances using several fluorescence techniques before and after ozonation, Part I: Structural characterization of humic substances. Sci Total Environ. (2014) 476-477:718–30. doi: 10.1016/j.scitotenv.2013.11.150
37. Liu N, Zhao G, Ye WS, and Liu G. Effects of UV-irradiation on Cd2+ and Pb2+ binding to humic/fulvic acids: Methodological guidance to eliminating the interference of dissolved organic matter on SWASV detection of heavy metals in soil extracts. Environ Technol Innov. (2023) 31:103232. doi: 10.1016/j.eti.2023.103232
38. Petosa AR, Jaisi DP, and Quevedo IR. Aggregation and deposition of engineered nanomaterials in aquatic environments: Role of physicochemical interactions. Environ Sci Technol. (2010) 44:6532–49. doi: 10.1021/es100598h
39. Kunz W, Henle J, and Ninham BW. ‘Zur lehre von der wirkung der salze’ (about the science of the effect of salts): franz hofmeister’s historical papers. Curr Opin Colloid In. (2004) 9:19–37. doi: 10.1016/j.cocis.2004.05.005
40. dos Santos AP and Levin Y. Ion specificity and the theory of stability of colloidal suspensions. Phys Rev Lett. (2011) 106:167801–4. doi: 10.1103/PhysRevLett.106.167801
41. Tian R, Yang G, Li H, Gao X, Liu X, Zhu H, et al. Activation energies of colloidal particle aggregation: Towards a quantitative characterization of specific ion effects. Phys Chem Chem Phys. (2014) 16:8828–36. doi: 10.1039/c3cp54813a
42. Luo H, Chen X, Liu LX, Zhang M, and Tian AM. Theoretical researches on the charge transport properties of humic acid coordinating with Fe3+\Cu2+\Al3+ metal ions. Chin J Struc Chem. (2019) 38:439–47. doi: 10.14102/j.cnki.0254-5861.2011-2056
43. Tian R, Liu XM, Gao XD, Li R, and Li H. Observation of specific ion effects in humus aggregation process. Pedosphere. (2021) 31:736–45. doi: 10.1016/S1002-0160(21)60033-4
44. Parsons DF and Ninham BW. Surface charge reversal and hydration forces explained by ionic dispersion forces and surface hydration. Colloid Surface A. (2011) 383:2–9. doi: 10.1016/j.colsurfa.2010.12.025
45. Salis A, Boström M, Medda L, Cugia F, Barse B, Parsons DF, et al. Measurements and theoretical interpretation of points of zero charge/potential of BSA protein. Langmuir. (2011) 27:11597–604. doi: 10.1021/la2024605
46. Hou J, Li H, Zhu HL, and Wu LS. Determination of clay surface potential: A more reliable approach. Soil Sci Soc Am J. (2009) 73:1658–63. doi: 10.2136/sssaj2008.0017
47. Xu CY, Li H, Hu FN, Li S, Liu XM, and Li Y. Non-classical polarization of cations increases the stability of clay aggregates: specific ion effects on the stability of aggregates. Eur J Soil Sci. (2015) 66:615–23. doi: 10.1111/ejss.12252
48. Liu X, Li H, Du W, Tian R, Li R, and Jiang X. Hofmeister effects on cation exchange equilibrium: quantification of ion exchange selectivity. J Phys Chem C. (2013) 117:6245–51. doi: 10.1021/jp312682u
49. Liu XM, Ding WQ, Tian R, Li R, and Li H. How ionic polarization affects stern potential: an insight into hofmeister effects. Soil Sci Soc Am J. (2016) 80:1181–9. doi: 10.2136/sssaj2016.04.0095
50. Hotze EM, Phenrat T, and Lowry GV. Nanoparticle aggregation: challenges to understanding transport and reactivity in the environment. J Environ Qual. (2010) 39:1909–24. doi: 10.2134/jeq2009.0462
51. Tso CP, Zhung CM, and Shih YH. Stability of metal oxide nanoparticles in aqueous solutions. Water Sci Technol. (2010) 61:127–33. doi: 10.2166/wst.2010.787
Keywords: critical coagulation concentration, electrostatic repulsive energy, fourier transformed infrared, hamaker constant, specific ion effects
Citation: Wang Cl, Xu C-y, Ma R-t, Li Q-r, Hu F-n, Zhao S-w and Bol R (2025) Comparison for colloidal stability and aggregation behavior of fulvic and humic acids: effects of cations and pH. Front. Soil Sci. 5:1452870. doi: 10.3389/fsoil.2025.1452870
Received: 21 June 2024; Accepted: 21 May 2025;
Published: 20 June 2025.
Edited by:
Emmanuel Arthur, Aarhus University, DenmarkReviewed by:
Davey Jones, Bangor University, United KingdomMartina Klucakova, Brno University of Technology, Czechia
Copyright © 2025 Wang, Xu, Ma, Li, Hu, Zhao and Bol. This is an open-access article distributed under the terms of the Creative Commons Attribution License (CC BY). The use, distribution or reproduction in other forums is permitted, provided the original author(s) and the copyright owner(s) are credited and that the original publication in this journal is cited, in accordance with accepted academic practice. No use, distribution or reproduction is permitted which does not comply with these terms.
*Correspondence: Chen-yang Xu, eHVjaGVueWFuZ0Bud2FmdS5lZHUuY24=