 Alžběta Němečková1Pavla Christelová1Jana Čížková1
 Moses Nyine1,2Ines Van den houwe3Radim Svačina1
 Brigitte Uwimana2Rony Swennen3,4,5
 Jaroslav Doležel1
 Eva Hřibová1*
- 1Institute of Experimental Botany, Centre of the Region Haná for Biotechnological and Agricultural Research, Olomouc, Czechia
- 2International Institute of Tropical Agriculture, Banana Breeding, Kampala, Uganda
- 3Bioversity International, Banana Genetic Resources, Heverlee, Belgium
- 4Division of Crop Biotechnics, Laboratory of Tropical Crop Improvement, Katholieke Universiteit Leuven, Leuven, Belgium
- 5International Institute of Tropical Agriculture, Banana Breeding, Arusha, Tanzania
East African highland bananas (EAHBs) are staple food crop in Uganda, Tanzania, Burundi, and other countries in the African Great Lakes region. Even though several morphologically different types exist, all EAHBs are triploid and display minimal genetic variation. To provide more insights into the genetic variation within EAHBs, genotyping using simple sequence repeat (SSR) markers, molecular analysis of ITS1-5.8S-ITS2 region of ribosomal DNA locus, and the analysis of chromosomal distribution of ribosomal DNA sequences were done. A total of 38 triploid EAHB accessions available in the Musa germplasm collection (International Transit Centre, Leuven, Belgium) were characterized. Six diploid accessions of Musa acuminata ssp. zebrina, ssp. banksii, and ssp. malaccensis representing putative parents of EAHBs were included in the study. Flow cytometric estimation of 2C nuclear DNA content revealed small differences (max ~6.5%) in genome size among the EAHB clones. While no differences in the number of 45S and 5S rDNA loci were found, genotyping using 19 SSR markers resulted in grouping the EAHB accessions into four clusters. The DNA sequence analysis of the internal transcribed spacer region indicated a relation of EAHB clones with M. acuminata and, surprisingly, also with M. schizocarpa. The results suggest that EAHB cultivars originated from a single hybrid clone with M. acuminata ssp. zebrina and ssp. banksii being its most probable parents. However, M. schizocarpa seems to have contributed to the formation of this group of banana.
Introduction
Bananas and plantains are giant monocotyledonous plants of major importance in tropical and subtropical areas. Their domestication is not well-understood, but it is considered to have begun some 7000 years ago in Southeast Asia, which is considered the primary center of diversity from where bananas expanded to other parts of the world (D'Hont et al., 2012). Most of the edible banana cultivars are parthenocarpic triploid clones that originated from intra- and interspecific hybridization between subspecies of Musa acuminata with the A genome and M. balbisiana with the B genome. Among the nine subspecies of M. acuminata (banksii, burmannica, burmannicoides, errans, malaccensis, microcarpa, siamea, truncata, and zebrina), banksii is reported to have contributed to most of the domesticated bananas. New Guinea, where banksii originated, is considered to be the earliest and most active center of diversity for Musa (Perrier et al., 2009).
Based on genomic constitution, triploid edible banana clones are classified as AAA, AAB, and ABB and further assigned into subgroups based on morphological characteristics. It is believed that most of the modern edible triploids arose from their ancestors, brought by human migration to the secondary centers of diversification (e.g., Africa and Pacific Islands), where different clones evolved by accumulation of somatic mutations and selection by early farmers (Shepherd, 1957; Kitavi et al., 2016). Some edible clones are diploid or tetraploid and are believed to have originated in a similar way as the triploids. Minor groups of cultivated bananas are derived from interspecific hybridization of diploid M. schizocarpa (S genome) and M. textilis (T genome) in combination with M. acuminata and M. balbisiana (Carreel et al., 1994).
East African Highland bananas (EAHBs; genus Musa, family Musaceae, section Musa) are vegetatively propagated triploid clones also known as the Lujugira/Mutika subgroup with AAA genomic constitution. This subgroup is mostly grown in Burundi, Democratic Republic of Congo, Kenya, Rwanda, Tanzania, and Uganda, and consists of about 120 farmer-selected landrace cultivars. Despite their enormous socio-economic importance, little is known about their genetic variation and origin (Karamura, 1998; Ssebuliba et al., 2005, 2006), and almost no differences in their genetic diversity have been found using molecular tools (Kitavi et al., 2016; Christelová et al., 2017).
Recent studies suggest that the EAHBs evolved by clonal selection from one ancestor, and their phenotypic variability is a result of accumulation of somatic mutations (Crane and Lawrance, 1956; Shepherd, 1957; De Langhe, 1961; Ude et al., 2003). It is believed that the African Great Lakes region is a secondary center of Musa genetic diversity where phenotypic diversification of the EAHB took place (Tugume et al., 2002). Recent studies on the genetic diversity of EAHB indicated that diploid M. acuminata subspecies zebrina and banksii are putative parents of EAHBs (Li et al., 2013; Kitavi et al., 2016). A recent genotyping study by Christelová et al. (2017) using simple sequence repeat (SSR) markers on more than 600 representatives of wild diploid and cultivated triploid clones of bananas and plantains confirmed that M. acuminata subspecies zebrina and banksii as the closest relatives of EAHB clones.
The sequence of ITS1-5.8S-ITS2 region of ribosomal rRNA locus is highly polymorphic, and its analysis proved to be useful for resolving phylogenetic relationships in many plant species, including Musa spp. (e.g., Liu et al., 2010; Hřibová et al., 2011; Li et al., 2017). In Musa, ITS analysis facilitated identification of individual species as well as subspecies, and species-specific ITS types were found conserved in hybrid clones (Hřibová et al., 2011).
Unlike the analysis of genetic diversity using different types of molecular markers (Pillay et al., 2001; Christelová et al., 2017), chromosome studies on EAHB representatives are scarce. In this work, we performed a detailed cyto-molecular analysis of a set of 38 EAHB clones available from the International Musa Germplasm Transit Centre (https://www.bioversityinternational.org/banana-genebank/). A combination of flow cytometric and cytogenetic and molecular methods was used to (1) examine the variability in genome size; (2) determine genomic distribution of rRNA genes; (3) evaluate the relationships of EAHBs to other species within the Musaceae family; and (4) identify putative Musa species and subspecies that contributed to the evolution of EAHB clones. The multidisciplinary approach provided new information on genome organization and diversity of this important group of edible bananas.
Materials and Methods
Plant Material and Genomic DNA Extraction
The accessions of Musa analyzed in this work are listed in Table 1. In vitro rooted plants of 38 accessions representing the EAHB cultivars and six diploid subspecies of M. acuminata representing putative parents of EAHB were obtained from the International Musa Transit Centre (ITC, Katholieke Universiteit, Leuven, Belgium). The in vitro plants were transferred to soil, and all plants were maintained in a heated greenhouse.
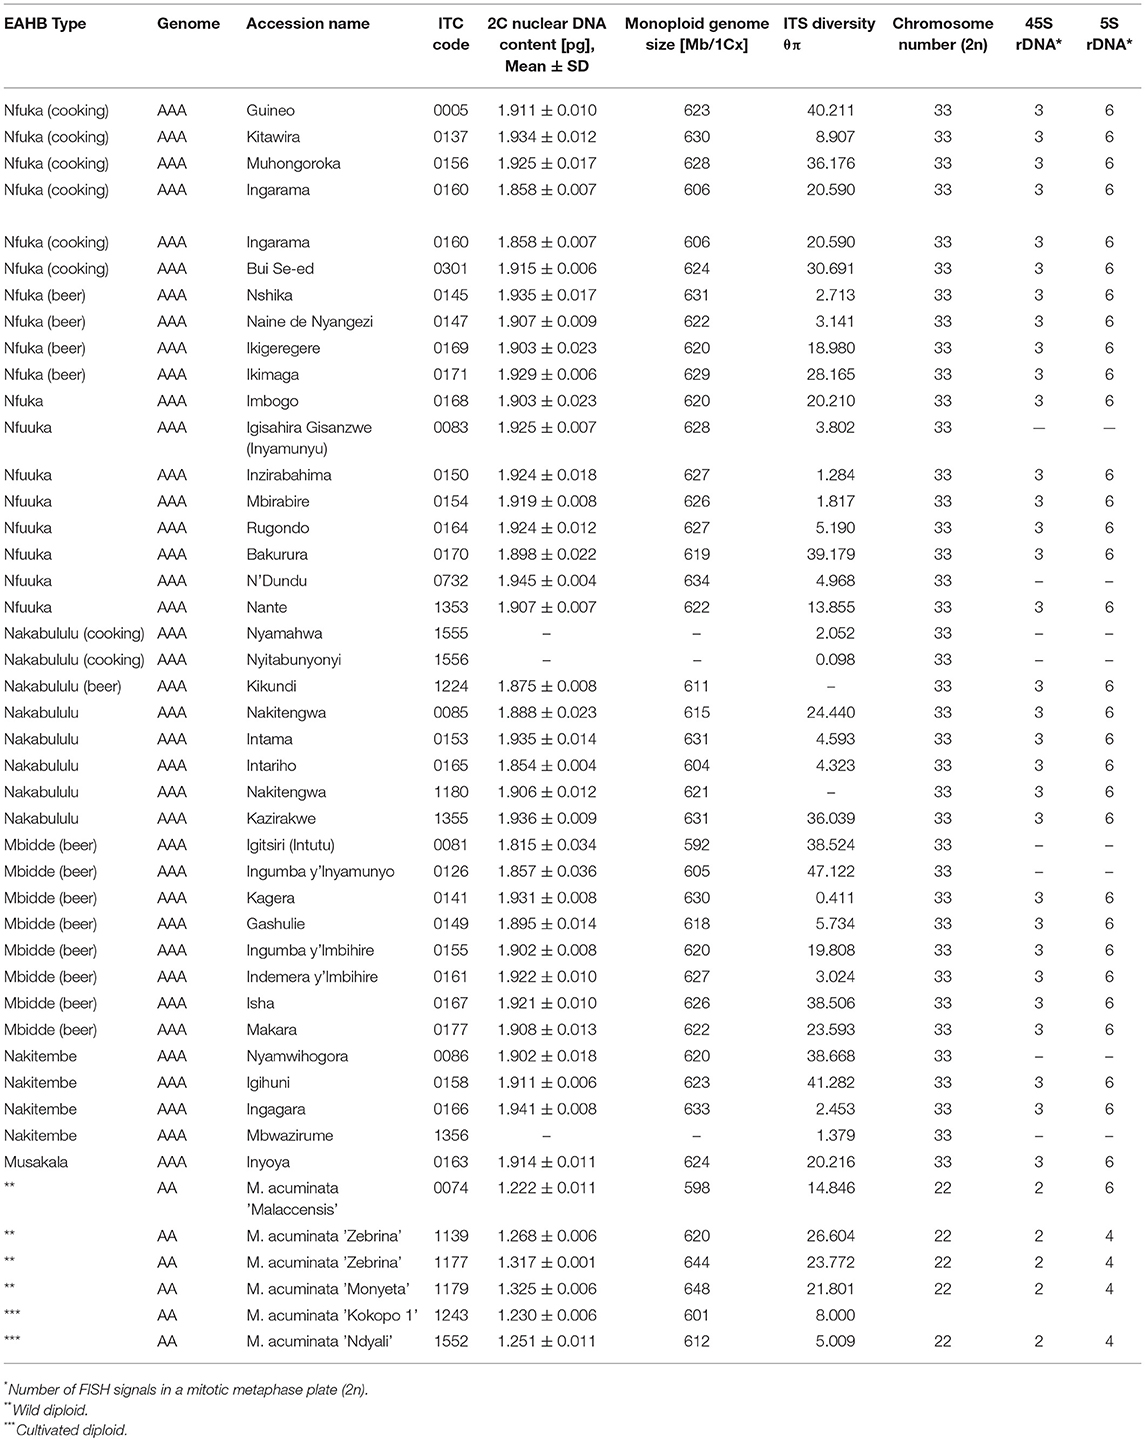
Table 1. Nuclear DNA content, chromosome number, and the number of 45S and 5S rDNA loci and ITS diversity in East African highland banana (EAHB) and wild diploid species of Musa acuminate.
Genomic DNA was isolated from lyophilized leaves using NucleoSpin Plant II kit (Macherey-Nagel, Düren, Germany) following the manufacturer's recommendations.
Flow Cytometric Analysis
Nuclear DNA content was estimated by flow cytometry according to Bartoš et al. (2005) and Čížková et al. (2015). Glycine max L. cv. Polanka (2C = 2.5 pg DNA; Doležel et al., 1994) served as the internal reference standard. The relative fluorescence intensity of propidium iodide-stained nuclei isolated from leaf tissues was analyzed using Partec PAS flow cytometer (Partec, Münster, Germany) equipped with a high-pressure mercury lamp as excitation light source. Five individuals were measured in each accession, each of them in three independent runs performed on different days. At least 5,000 nuclei were analyzed per sample and nuclear DNA content was calculated following the formula:
2C DNA content [pg] = 2.5 x G1 peak mean of Musa / G1 peak mean of Glycine
Mean DNA content of nuclei in the G1 phase of cell cycle (2C) was calculated for each accession, and monoploid genome size (1Cx) representing DNA content of a basic chromosome set x was determined considering 1 pg DNA equal to 0.978 × 10⁹ bp (Doležel et al., 2003).
SSR Genotyping
The SSR genotyping was performed using the pipeline established by Christelová et al. (2011). Briefly, 19 SSR loci (Crouch et al., 1998; Lagoda et al., 1998; Hippolyte et al., 2010) were amplified using a set of M13 tailed fluorescently labeled primers. Allele sizes were estimated using internal size standard (GeneScanTM-500 LIZ size standard; Applied Biosystems, Foster City, USA) on ABI 3730xl DNA analyzer (Applied Biosystems). The resulting data were analyzed using GeneMarker® v1.75 (Softgenetics, State College, USA), manually checked, and integrated into the existing database of Musa SSR profiles (core subset of accessions), which represents the subset of true-to-type Musa accessions verified by SSR genotyping (Christelová et al., 2017). For ease and clarity of interpretation, Callimusa accessions and triploid species with the B genome (AAB, ABB), which are part of the core subset (Christelová et al., 2017), were excluded from the final dendrogram. Genetic distances among individual accessions were calculated in PowerMarker v 3.25 (Liu and Muse, 2005) and hierarchical clustering analysis of resulting distance matrix was done using the UPGMA (Michener and Sokal, 1957). The output was visualized as a dendrogram using FigTree v1.4.0 (http://tree.bio.ed.ac.uk/software/figtree/). The SSR data are publically available at http://olomouc.ueb.cas.cz/projects/Musa/SSR and at Dryad Digital Repository: https://doi.org/10.5061/dryad.1759h94.
Analysis of ITS1-5.8S-ITS2 Region
The ITS sequence analysis was performed according to Hřibová et al. (2011). The ITS region was amplified from genomic DNA using polymerase chain reaction (PCR) with specific primers ITS-L and ITS-4 (Nwakanma et al., 2003). The PCR products were purified using ExoSAP-IT® (USB Corporation, Cleveland, USA) following the manufacturer's instructions, cloned into TOPO vector, and transformed into Escherichia coli-electrocompetent cells (Invitrogen Life Technologies, Carlsbad, USA). At least 48 and 96 cloned PCR products were sequenced in diploid and triploid accessions, respectively. The sequencing was carried out using the BigDye Terminator v3.1 Cycle Sequencing kit (Applied Biosystems) according to the manufacturer's instructions and run on ABI 3730xl DNA analyzer (Applied Biosystems). Nucleotide sequences were edited using Staden Package (Staden, 1996) and phylogenetic analysis was performed according to Hřibová et al. (2011). Sequence diversity was identified using DnaSAM program (Eckert et al., 2010) with 5,000 simulations. The sequences were aligned by MAFFT program v7.029 (–localpair –maxiterate 1000) (Katoh et al., 2005) and graphically displayed in SeaView v4.2.1 (Gouy et al., 2010). Datasets for this analysis comprised ITS sequences of the Musa accessions previously described in Hřibová et al. (2011) and Čížková et al. (2015). Phylograms were constructed based on Juke–Cantor distance matrix of the concatenated region containing ITS1 and ITS2 spacer sequences including putative pseudogenic sequences by BioNJ (Gascuel, 1997) and PhyML (Guindon and Gascuel, 2003) and by SplitsTree4 v4.1.11 (Huson and Bryant, 2006). The tree was rooted on Ensete ventricosum (ITC 1387). Nonparametric bootstrapping with 1000 pseudoreplicates was performed to assess the nodal support. Phylogenetic trees were drawn and edited using FigTree v1.4.0 (http://tree.bio.ed.ac.uk/software/figtree/). The ITS sequence alignments are publically available at http://olomouc.ueb.cas.cz/projects/Musa/ITS and at Dryad Digital Repository: https://doi.org/10.5061/dryad.1759h94.
Chromosome Preparation and Fluorescence in situ Hybridization (FISH)
Mitotic metaphase chromosome spreads were prepared according to Doleželová et al. (1998). Probes for 45S rDNA and 5S rDNA were prepared by labeling Radka1 (45S rDNA) and Radka2 (5S rDNA) DNA clones (Valárik et al., 2002) with digoxigenin-11-dUTP or biotin-16-dUTP (Roche Applied Science, Penzberg, Germany) using PCR with M13 forward and reverse primers (Invitrogen). Probes for tandem repeats CL18 and CL33 were amplified using specific primers (Hřibová et al., 2010) and labeled as the rDNA probes using PCR. Hybridization mixture consisting of 50% formamide, 10% dextran sulfate in 1×SSC, and 1 μg/ml of each labeled probe was added onto slides and denatured at 80°C for 3 min. The hybridization was carried out at 37°C overnight. The sites of probe hybridization were detected using anti-digoxigenin-FITC (Roche Applied Science) and streptavidin-Cy3 (Vector Laboratories, Burlingame, USA), and the chromosomes were counterstained with diamidino-2-phenylindole. The slides were examined with Axio Imager Z.2 Zeiss microscope (Zeiss, Oberkochen, Germany) equipped with Cool Cube 1 camera (Metasystems, Altlussheim, Germany) and appropriate optical filters. The capture of fluorescence signals and layers merging were performed with ISIS software (Metasystems); the final image adjustment was done in Adobe Photoshop 12.0.
Results
SSR Genotyping
A dendrogram reflecting genetic diversity among the accessions was constructed after cluster analysis based on scores of 19 SSR markers (Christelová et al., 2011). The final dendrogram (Figure 1), which contains all EAHB representatives analyzed in this work, six diploid M. acuminata subspecies representing putative parents of EAHB, and the core subset of Musa accessions (Christelová et al., 2017) were adjusted as described in section Materials and Methods. The resulting tree showed clear groups of clustered accessions with the cluster of B-genome representatives (Figure 1, green cluster I. containing M. balbisiana samples) as outgroup. The clustering pattern was resolved after inspecting the dissimilarity index values (Nei, 1973). Values above 0.4 together with morphology-based classification track of the accessions extracted from the MGIS database (Musa Germplasm Information System; https://www.crop-diversity.org/mgis/) set the basis for fundamental division of the individuals into clusters and cluster description.
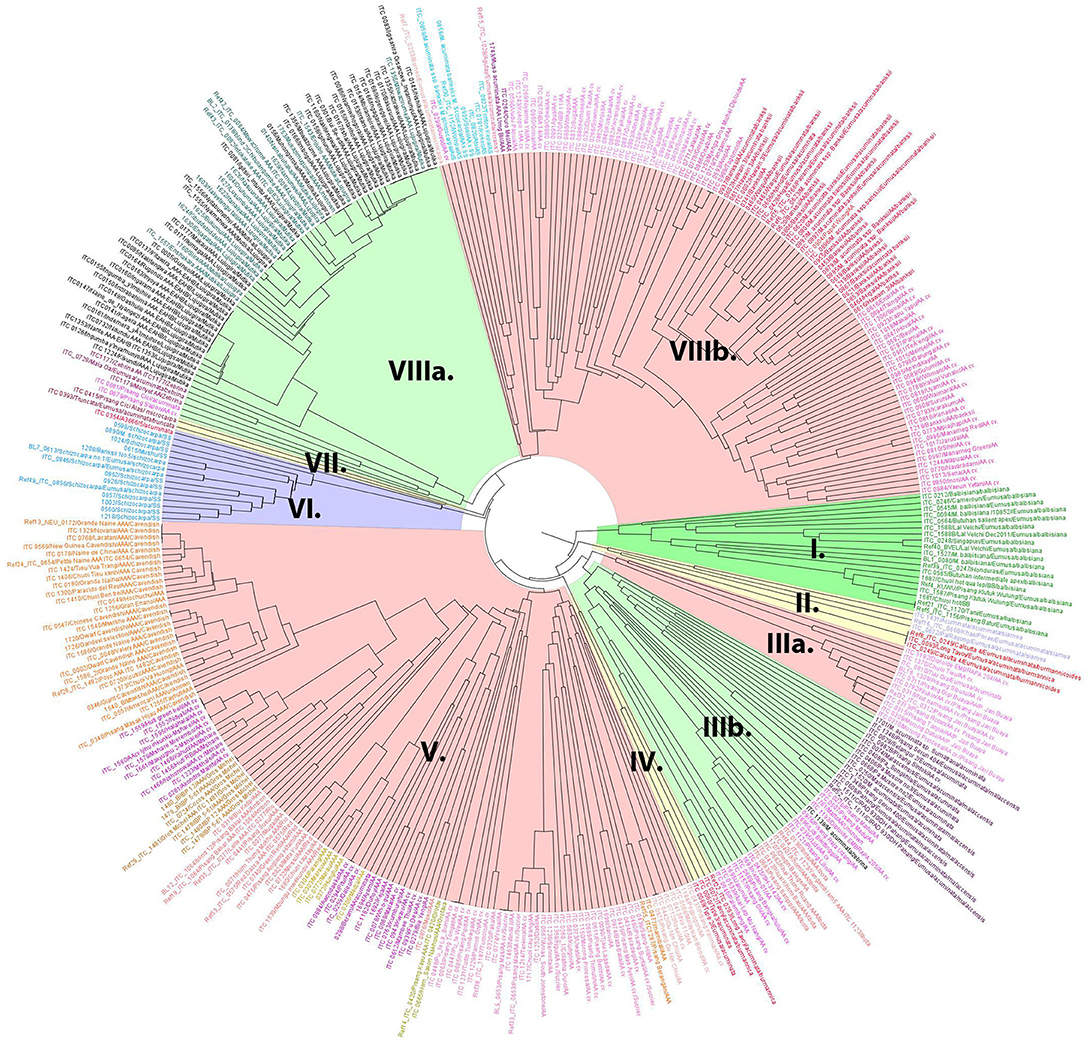
Figure 1. The UPGMA dendrogram constructed with SSR data of EAHB accessions obtained in this study, and the AA diploid and AAA triploid entries selected from the study of Christelová et al. (2011). M. balbisiana served as an outgroup species and was represented by a subset of M. balbisiana accessions (cluster I). Main clades and subclades are discriminated by colors. The EAHBs accessions analyzed in this study are included in cluster VIIIa (highlighted in green) and discriminated from the core subset accession by their names printed in black.
Wild A-genome representatives were interspersed among the related cultivated diploid and triploid accessions. Subspecies of M. acuminata ssp. burmannicoides and ssp. siamea were clustered within two small subclusters: subcluster II superimposed to the rest of the A-genome representatives (Figure 1, yellow cluster II) and subcluster IV. Cluster III comprised two subclusters (IIIa and IIIb). Subcluster IIIa (Figure 1, highlighted in light red) comprised diploid AA cultivars of the Pisang Jari Buaya subgroup, while subgroup IIIb (Figure 1, highlighted in light green) comprised M. acuminata ssp. malaccensis accessions grouped closely with triploid AAA subgroup Ibota representatives and diploid AA cultivars denoted as ISEA I group (Christelová et al., 2017). Except for Ibota and Lujugira/Mutika subgroups representing all EAHB accessions analyzed in this work, all other triploid AAA representatives formed cluster V (Figure 1, highlighted in light red). Apart from AAA cultivars Cavendish, Gros Michel, Ambon, Red, Rio, and Orotava, cluster V also contains diploid AA cultivars from groups denoted as AA cv. African, AA cv. ISEA 2, AA cv. IndonTriNG, AA cv. IndonTriPh (cluster names as described in Christelová et al., 2017). Accessions representing M. schizocarpa (S genome representatives) formed a separate cluster VI (Figure 1, highlighted in violet), followed by a small subcluster VII comprising M. acuminata ssp. microcarpa and M. acuminata ssp. truncata. Cluster VIII could be divided into two subclusters, where VIIIa (Figure 1, highlighted in green) contained the AAA EAHBs from subgroup Lujugira/Mutika, together with wild M. acuminata ssp. zebrina representatives and AA cv. Pisang Sapon accession, while the VIIIb subcluster (highlighted in light red) comprised subspecies M. acuminata ssp. banksii and their related AA cultivars (AA cv. banksii sensu lato and AA cv. banksii derivatives). Accessions representing hybrids between M. acuminata and M. schizocarpa species were also grouped within cluster VIIIb.
Variability in Genome Size and Cytogenetic Analysis
Nuclear genome size was estimated in all 38 EAHB accessions as well as in six subspecies of diploid M. acuminata selected to represent putative parents of EAHB clones (Table 1). Flow cytometric analyses resulted in histograms of relative nuclear DNA content (Figures 2A,B) comprising two dominant peaks representing G1 nuclei of Musa and Glycine, the latter serving as internal reference standard. Nuclear DNA content (2C value) was determined based on the ratio of G1 peak positions and ranged from 1.222 to 1.325 pg in diploid species (with the smallest DNA amount in M. acuminata ssp. malaccensis ITC 0074, and the largest in M. acuminata ssp. zebrina “Monyet” ITC 1179), and from 1.815 to 1.945 pg in triploid EAHB clones (Table 1). Thus, there was a difference of 0.13 pg between EAHB clones with the lowest and the highest 2C DNA amount. This corresponds to 42 Mbp/1Cx, where Cx stands for the monoploid genome size. Figure 2C shows 1Cx genome sizes in Mbp for all accessions analyzed.
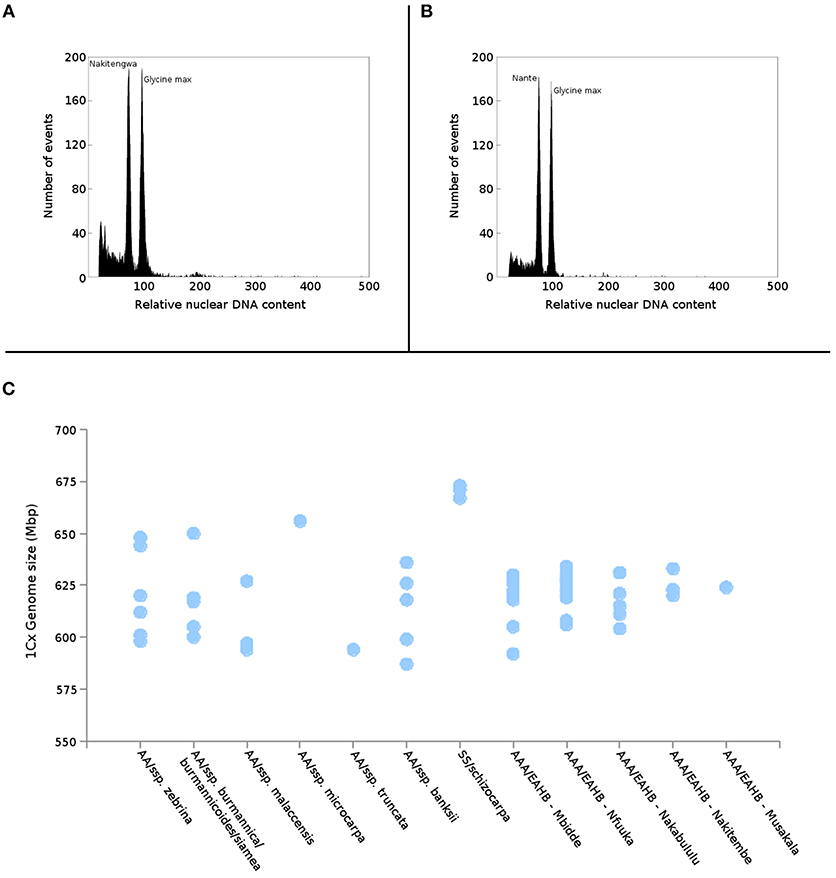
Figure 2. Estimation of genome size of EAHB. Histograms of relative nuclear DNA content obtained after flow cytometric analysis of propidium iodide-stained nuclei isolated from (A) “Nakitengwa” (2C = 1.888 pg) and (B) “Nante” (2C = 1.907 pg); nuclei isolated from soybean (Glycine max, 2C = 2.5 pg) were included as an internal reference standard. (C) Relationship between nuclear monoploid genome size (1Cx) in M. acuminata subspecies, M. schizocarpa estimated by Čížková et al. (2013) and five groups of EAHBs clones analyzed in the present study.
Cytogenetic localization of 5S and 45S rDNA on mitotic metaphase chromosomes of diploid M. acuminata species (Figure 3) revealed a constant number of 45S rDNA loci, which localized to nuclear organizing region (NOR) on one chromosome pair. On the contrary, variability was observed in the number 5S rDNA loci in diploid Musa accessions. M. acuminata ssp. zebrina (ITC 1139, ITC 1177, and ITC 1179) as well as diploid M. acuminata cultivar “Ndyali” (Mchare, ITC 1552) contained two pairs of 5S rDNA loci, while M. acuminata ssp. malaccensis (ITC 0074) contained three pairs of 5S rDNA loci (Figure 3). In contrast to the variability in the number of 5S rDNA loci among wild diploid Musa species, triploid EAHBs showed uniform pattern of rDNA loci organization. The 45S rDNA localized to NORs on three chromosomes and 5S rDNA localized on six chromosomes in all analyzed EAHB accessions (Figure 4).
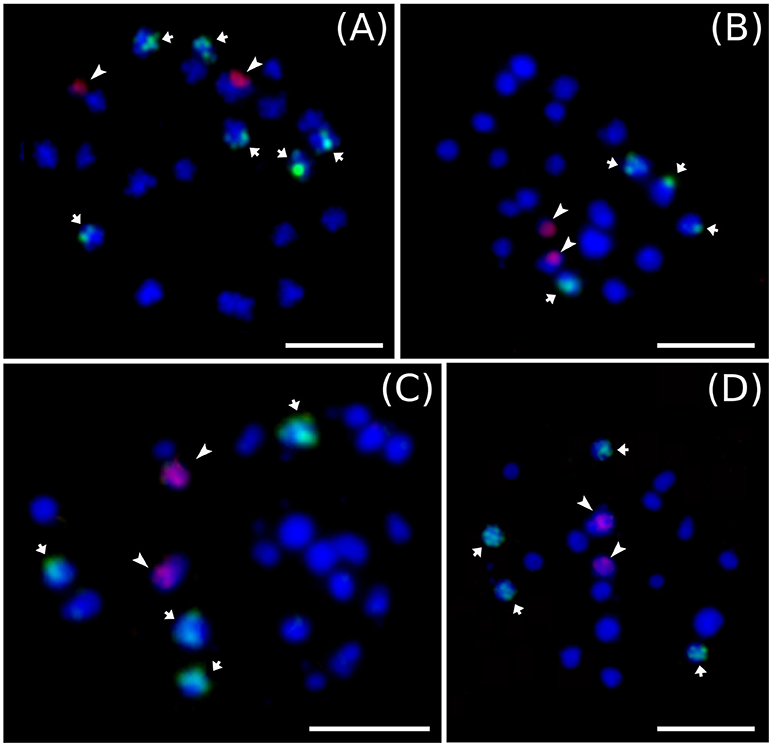
Figure 3. Examples of genomic distribution of 45S rRNA (green) and 5S rRNA (red) genes on mitotic metaphase chromosomes of diploid representatives of M. acuminata as revealed by FISH. (A) “Malaccensis” ITC 0074, (B) “Ndyali” ITC 1552, (C) “Monyeta” ITC 1179, and (D) “Zebrina” ITC 1177. Bar = 5 μm.
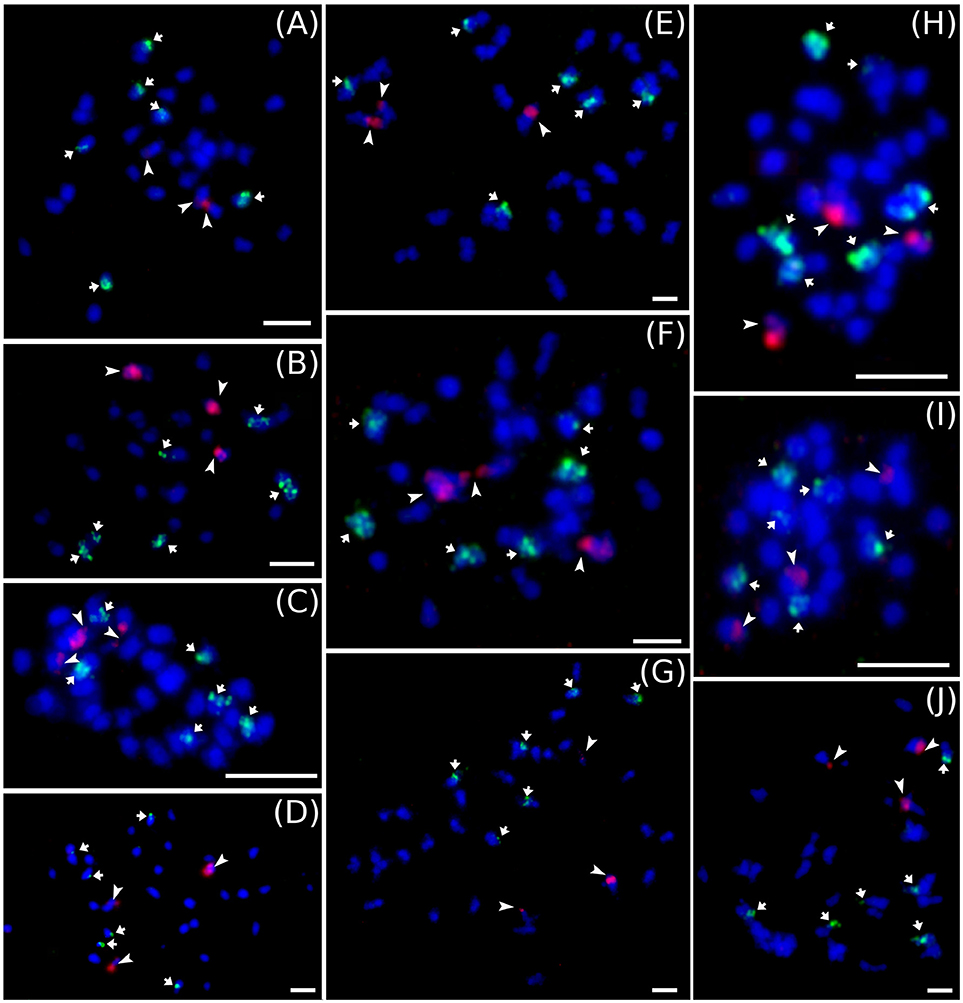
Figure 4. Examples of genomic distribution of 45S (red) and 5S rRNA (green) genes localized on mitotic metaphase chromosomes of EAHB as revealed by FISH. (A) “Nshika” ITC 0145, (B) “Bakurura” ITC 0170, (C) “Ingagara” ITC 0166, (D) “Naine de Nyangezi” ITC 0147, (E) “Kazirakwe” ITC 1355, (F) “Isha” ITC 0167, (G) “Guineo” ITC 0005, (H) “Muhongoroka” ITC 0156, (I) “Ikimaga” ITC 0171, (J) “Bui Se-ed” ITC 0301. Bar = 5 μm.
Analysis of ITS1-5.8S-ITS2 Sequence Region
The length of ITS1 and ITS2 spacers in all analyzed Musa accessions varied from 213 to 223 bp and from 205 to 219 bp, respectively, and the total length of ITS1-5.8S-ITS2 sequence region ranged from 566 to 593 bp in accessions. The lowest nucleotide diversity of the ITS1-5.8S-ITS2 sequence region was observed in EAHB clones “Nyitabunyonyi” (ITC 1556) and “Kagera” (ITC 0141) (Table 1). The highest sequence diversity was observed in EAHB accessions “Ingumba y'Imbihire” (ITC 0155), “Kazirakwe” (ITC 1355), “Muhongoroka” (ITC 0156), “Isha” (ITC 0167), “Igitsiri” (ITC 0081), “Nyamwihogora” (ITC 0086), “Bakurura” (ITC 0170), and “Igihuni” (ITC 0158). Relatively high sequence diversity of ITS region was observed in three accessions of M. acuminata ssp. zebrina (ITC 1139, ITC1177, and ITC 1179) (Table 1, Supplementary Table 1). The GC content of ITS1 varied from 56.94 to 64.13% and was slightly lower than GC content of ITS2 (62.26 to 70.89%). The 5.8S rDNA sequence region had a conserved length of 154 or 155 bp and its GC content varied between 50.32 and 58.06%, and was significantly lower than the GC content in ITS1 and ITS2 based on Student's t-test (P < 0.001).
Prior to using the concatenated region of ITS1-ITS2 for phylogenetic analysis, secondary structures of ITS2 and 5.8S rDNA sequence regions were reconstructed for all accessions with the aim to identify putative pseudogenic sequences. The ITS2 sequences formed specific four-helices structure with typical pyrimidine–pyrimidine bulge in helix II and the most conserved primary sequence included TGGT motif in the helix III (Hřibová et al., 2011). The secondary structure of 5.8S rDNA sequence was reconstructed following specific settings for base pairing as described by Hřibová et al. (2011) and the presence of three conserved motifs in the 5.8S rRNA gene was identified (Harpke and Peterson, 2008). The information on nucleotide variation in conserved motifs of 5.8S rDNA; GC content; presence of conserved motifs in 5.8S rDNA sequence, and the ability of ITS2 and 5.8S rDNA sequences to fold conserved secondary structures was used to identify putative pseudogenes (Supplementary Table 1). The information on pseudogenic ITS sequences was used during further phylogenetic analysis.
Phylogenetic analysis of a dataset, which did not contain putative pseudogenic ITS sequences, was done by BioNj, PhyML, and SplitsTree (split decomposition). The analysis showed that ITS sequence types obtained from EAHB clones clustered together with the A genome-specific and S genome-specific ITS sequences (Figure 5). The ITS types obtained by clone-based sequencing in EAHB accessions did not cluster with M. acuminata subspecies burmannica, burmannicoides and siamea. Also, the cluster specific for M. acuminata ssp. malaccensis did not comprise ITS types from triploid EAHB clones. Phylogenetic analysis done on a dataset containing putative pseudogenic ITS sequences showed that most of them clustered together with ITS specific for M. schizocarpa genome (Supplementary Figure 1).
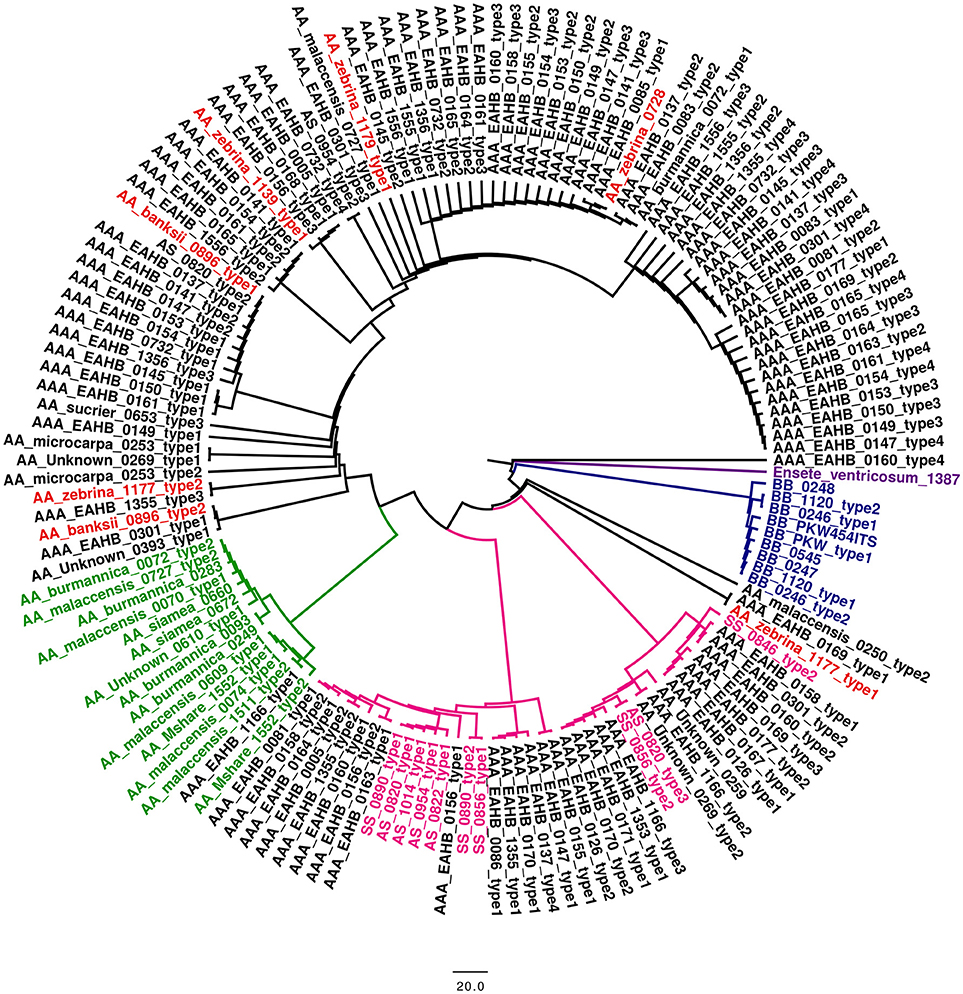
Figure 5. Phylogenetic analysis based on the ITS1-ITS2 sequence region. BioNJ tree constructed from a Jukes–Cantor distance matrix of the concatenated region contained ITS1 and ITS2 spacer sequence. The tree was rooted on Ensete ventricosum (ITC 1387). The main clades and subclades are distinguished by colors. The BB genotypes in blue; SS genotypes in pink; burmannica/burmanicoides/siamea and malaccensis subspecies of M. acuminata (AA genome) in green; zebrina and banksii subspecies of M. acuminata in red. ITS sequences of accessions analyzed in this study are shown in black.
Discussion
Nuclear DNA Content and Distribution of rDNA
As shown by Poggio et al. (2014) and Duchoslav et al. (2013), nuclear genome size can be used to characterize individual accessions in mixed populations, especially in polyploid plants (Duchoslav et al., 2013; Poggio et al., 2014). In our study, we provide the first analysis of genome size in such a group of edible banana cultivars. The difference between EAHB clones with the lowest and the largest genome size was ~42 Mbp/1Cx (i.e., ~5% of EAHB monoploid genome; Figure 2). Considering the relatively small genome of M. acuminata (~ 600 Mbp/1C, Doležel et al., 1994), the difference corresponds to less than one chromosome. Importantly, the differences in genome size among the EAHB accessions were not significant enough to reveal any grouping. The occurrence of EAHB accessions with lower DNA content indicated a loss of DNA during the clonal selection from a common progenitor.
Although the evolution of EAHB clones remains obscure, based on previous studies (Karamura, 1998; Pillay et al., 2001; Li et al., 2013; Kitavi et al., 2016; Christelová et al., 2017) and the results obtained in the present study, it seems probable that the hybridization event that led to the formation of EAHB clones was followed by a loss of DNA sequences. If EAHB originated from a single ancestor, which came to Africa ~6000 years ago (Lejju et al., 2005, 2006), the variation in genome size among individual EAHB clones observed here would reflect genome changes accompanying secondary diversification.
In contrast to the variation in genome size, we did not observe differences in number of 45S and 5S rRNA chromosome loci (Figure 4). The 45S rDNA are localized to secondary constriction on three chromosomes and 5S rRNA gene clusters localized to six chromosomes in mitotic metaphase plates of all examined EAHB clones. In all clones, the large 45S rDNA subunit was on different mitotic chromosomes than the small 5S rDNA subunit. Due to the small size of condensed mitotic chromosomes (1–2 μm), it was not possible to ascertain if individual EAHB clones differed in chromosomal position of 5S rDNA loci. Thus, our results do not permit drawing any conclusions regarding the presence of structural chromosomal rearrangements.
The results of Boonruangrod et al. (2009), Perrier et al. (2009) and Hippolyte et al. (2012), pointed to M. acuminata ssp. zebrina and ssp. banksii as putative parents of EAHB clones. However, the number of 5S rDNA loci in EAHB clones, as determined in this work, does not correspond to the number of 5S rDNA loci expected in a triploid hybrid from a cross between ssp. banksii and ssp. zebrina, which have three and two 5S rDNA loci per haploid chromosome set, respectively (Bartoš et al., 2005; Čížková et al., 2013) (Supplementary Figure 2). Depending on the donor of unreduced gamete, the hybrid should have either seven or eight 5S rDNA loci. However, we have observed only six loci in all EAHB clones. While the same number of 5S rDNA loci in all EAHB clones indicates their origin from a single clone as proposed by Perrier et al. (2011) and Li et al. (2013), the discrepancy between the expected and observed number of 5S rDNA loci in EAHB can be explained either by a loss of 5S rDNA loci in a hybrid, different parent(s) than those indicated in previous studies, or a more complicated origin of EAHB involving more than two parental species. The latter hypothesis seems to be corroborated by our results on SSR genotyping and the presence of ITS sequences from M. schizocarpa in EAHB clones.
SSR and ITS Analysis
As mentioned earlier, based on morphological characterization, five main groups of EAHB can be recognized (Karamura, 1998). Unfortunately, these morphological groups do not correspond to the reported genetic diversity within EAHBs (Kitavi et al., 2016). The genetic variability of EAHB clones as analyzed in our study by SSR markers was very low (Nei's dissimilarity index < 0.16), which is in line with the previous results obtained on a set of Ugandan and Kenyan EAHB accessions (Kitavi et al., 2016) and on a small set of EAHB bananas analyzed by Christelová et al. (2017). The studies using SSR markers and other genotyping approaches, including genotyping by sequencing (GBS) and diversity array technology (DArT), failed to identify DNA markers discriminating the five morphological groups (Perrier et al., 2011; Hippolyte et al., 2012; Sardos et al., 2016). It this thus possible that epigenetic modifications played a role in the evolution and diversification of the triploid EAHB. Epigenetic changes, such as DNA methylation, might have affected the morphology of EAHB clones as shown in other plants, e.g., oil palm (Ong-Abdullah et al., 2015) and mangroves (Lira-Medeiros et al., 2010).
This work not only evaluated genetic diversity within EAHBs, but also expanded the database of Musa SSR profiles gathered during our long-term project aiming at genotyping all accessions in the International Musa Germplasm Transit Centre (Christelová et al., 2017). Addition of new accessions increases the resolution of genotyping, thereby, increasing a probability of identifying the closest relative or an exact match for unknown accession (Christelová et al., 2011, 2017; Čížková et al., 2015). The inclusion of the EAHB SSR profiles into the existing dataset of diploid Musa accessions suggested M. acuminata ssp. zebrina and ssp. banksii as parents of EAHB clones. At the same time, the SSR genotyping suggested that triploid EAHB clones did not evolve from East African diploids (Mchare cultivars with AA genome), which are common in Tanzania. These findings are in agreement with the recent studies of Hippolyte et al. (2012) and Sardos et al. (2016).
To ascertain the phylogenetic position of EAHB, we also analyzed nucleotide sequences of the ITS1-5.8S-ITS2 region (Alvarez and Wendel, 2003; Hřibová et al., 2011; Čížková et al., 2015). We also wanted to verify if the ITS region is suitable for unambiguous identification of the five morphological groups of EAHB (Karamura, 1998), which could not be resolved using SSR genotyping in our previous study (Christelová et al., 2017) and in the present work.
Previously, sequencing of ITS1-5.8S-ITS2 was employed to study phylogenetic relationships within the family (Li et al., 2010; Liu et al., 2010; Hřibová et al., 2011; Čížková et al., 2015) and characterize genomic constitution of intra- and interspecific hybrids (Hřibová et al., 2011). The latter studies showed that interspecific Musa hybrids contained conserved parental ITS sequences, indicating incomplete concerted evolution of rDNA loci. Independent evolution of parental rDNA in hybrids makes the analysis of ITS sequences suitable for determination of their genomic constitution.
Because of the polyploid status of EAHBs, we used clone-based sequencing, and at least 48 / 96 ITS clones from individual accessions were sequenced and used to identify ITS sequence types. Contrasting with the highly conserved pattern of genomic distribution of 45S rDNA as revealed by FISH, sequence analysis revealed relatively high variability of the ITS1-5.8S-ITS2 region in some of the EAHB representatives. Based on ITS region diversity, EAHB accessions could be classified into three groups: accessions with low ITS diversity (θπ ≤ 10), accessions with moderate ITS diversity (θπ > 10 & θπ ≤ 30), and accessions with relatively high level of ITS sequence diversity (θπ > 30, Table 1). This observation indicates a different evolutionary history of the locus. Unfortunately, the missing common ancestor of extant EAHB clones does not help to decide if the secondary diversification process in Africa led to homogenization of rDNA loci in some of the hybrids or vice versa.
The reconstruction of the ITS1-5.8S-ITS2 sequence region in triploid EAHB clones provided an opportunity to assess their relationships within Musaceae and identify putative parents. Phylogenetic reconstruction showed that EAHB clones do not contain burmanicca/burmannicoides/siamea ITS types, which is in agreement with the SSR genotyping. Moreover, ITS analysis did not confirm the presence of malaccensis ITS type, which is in agreement with our results obtained using SSR markers as well as the study by Perrier et al. (2009).
Almost all subspecies of M. acuminata, which were included in this study to enlarge the set of putative EAHB parents, clustered together with the respective subspecies of the core set both after SSR genotyping and ITS. The only exception being M. acuminata “Zebrina” ITC 1139, for which the results of SSR genotyping and ITS analysis did not agree with each other, suggesting a hybrid nature of the accession. While in the SSR cladogram, this accession clustered together with diploid acuminata representatives labeled as ISEA I and with malaccensis accessions, ITS analysis identified two ITS sequence types, one of them the zebrina type and one pseudogenic, thus pointing to a hybrid origin.
Our results indicate that the evolution of triploid EAHB clones was accompanied by a loss of rDNA loci and/or by homogenization of these loci. However, we cannot exclude one or more backcrosses to one of the parents during the evolution of EAHB (De Langhe et al., 2010), which would result in changes in the number and organization of rDNA loci. The analysis of the ITS region indicated the presence of M. schizocarpa ITS sequences in the genome of triploid EAHBs, pointing to a possible contribution of M. schizocarpa to EAHB formation. Participation of M. schizocarpa in the evolution of cultivated banana was suggested by Carreel et al. (2002) and Heslop-Harrison and Schwarzacher (2007). To conclude, the results of this study indicate that triploid Musa clones known as EAHBs, which are grown in the African Great Lakes region, probably arose from a single clone that originated from hybridization between M. acuminata ssp. zebrina and ssp. banksii, and that M. schizocarpa also contributed to the formation of this economically important group of banana.
Author Contributions
EH and JD designed the experiments. AN, PC, JČ, MN, and RSv conducted the study and processed the data. AN, PC, and EH wrote the manuscript. AN, PC, IV, RSw, BU, JD, and EH discussed the results and contributed to manuscript writing. All authors have read and approved the final manuscript.
Conflict of Interest Statement
The authors declare that the research was conducted in the absence of any commercial or financial relationships that could be construed as a potential conflict of interest.
The reviewer MB and handling editor declared their shared affiliation at the time of the review.
Acknowledgments
We thank Marie Seifertová, Eva Jahnová, Zdenka Dubská, and Ludvík Urda for excellent technical assistance. This work was supported by the Ministry of Education, Youth and Sports of the Czech Republic (award INGO II No. LG12021) and the National Program of Sustainability I (award LO1204). The computing was supported by the National Grid Infrastructure MetaCentrum (grant No. LM2010005 under the program Projects of Large Infrastructure for Research, Development, and Innovations). The authors would furthermore like to thank all donors who supported this work through their contributions to the CGIAR Fund (https://www.cgiar.org/funders/), and, in particular, to the CGIAR Research Program Roots, Tubers and Bananas (RTB-CRP).
Supplementary Material
The Supplementary Material for this article can be found online at: https://www.frontiersin.org/articles/10.3389/fpls.2018.01371/full#supplementary-material
Supplementary Table 1. Sequence characterization of ITS1-5.8S-ITS2 sequence region.
Supplementary Figure 1. Phylogenetic analysis based on the ITS1-ITS2 sequence region. BioNJ tree constructed from a Jukes–Cantor distance matrix of the concatenated region contained ITS1 and ITS2 spacer sequence. The tree was rooted on Ensete ventricosum (ITC 1387). The main clades and subclades are distinguished by colors: BB genotypes in blue; SS genotypes in pink; burmannica/burmanicoides/siamea and malaccensis subspecies of M. acuminata (AA genome) in green; zebrina and banksii subspecies of M. acuminata in red. Putative pseudogenic ITS sequence regions are marked by asterisk.
Supplementary Figure 2. Scheme of genomic constitution of expected banana hybrid between M. acuminata ssp. zebrina and ssp. banksii. Red and violet marks in idiograms correspond to 45S rDNA and 5SrDNA loci, respectively.
References
Alvarez, I., and Wendel, J. F. (2003). Ribosomal ITS sequences and plant phylogenetic inference. Mol. Phylogenet. Evol. 29, 417–434. doi: 10.1016/S1055-7903(03)00208-2
Bartoš, J., Alkhimova, O., Doleželová, M., DeLanghe, E., and Doležel, J. (2005). Nuclear genome size and genomic distribution of ribosomal DNA in Musa and Ensete (Musaceae): taxonomic implications. Cytogenet. Genome Res. 109, 50–57. doi: 10.1159/000082381
Boonruangrod, R., Fluch, S., and Burg, K. (2009). Elucidation of origin of the present day hybrid banana cultivars using the 5′ETS rDNA sequence information. Mol. Breed. 24, 77–91. doi: 10.1007/s11032-009-9273-z
Carreel, F., De Leon, D. G., Lagoda, P., Lanaud, C., Jenny, C., Horry, J. P., et al. (2002). Ascertaining maternal and paternal lineage within Musa by chloroplast and mitochondrial DNA RFLP analyses. Genome 45, 679–692. doi: 10.1139/g02-033
Carreel, F., Fauré, S., González de León, D., Lagoda, P. J. L., Perrier, X., Bakry, F., et al. (1994). Evaluation of the genetic diversity in diploid bananas (Musa sp.). Genet. Sel. Evol. 26, 125s−136s.
Christelová, P., De Langhe, E., Hřibová, E., Čížková, J., Sardos, J., Hušáková, M., et al. (2017). Molecular and cytological characterization of the global Musa germplasm collection provides insights into the treasure of banana diversity. Biodivers. Conserv. 26, 801–824. doi: 10.1007/s10531-016-1273-9
Christelová, P., Valárik, M., Hřibová, E., Van den Houwe, I., Channeliere, S., Roux, N., et al. (2011). A platform for efficient genotyping in Musa using microsatellite markers. AoB Plants 2011:plr024. doi: 10.1093/aobpla/plr024
Čížková, J., Hřibová, E., Christelová, P., Van den Houwe, I., Häkkinen, M., Roux, N., et al. (2015). Molecular and cytogenetic characterization of wild Musa species. PLoS ONE 10:e0134096. doi: 10.1371/journal.pone.0134096
Čížková, J., Hřibová, E., Humplíková, L., Christelová, P., Suchánková, P., Doležel, J. (2013). Molecular analysis and genomic organization of major DNA satellites in banana (Musa spp.). PLoS ONE 8:e54808. doi: 10.1371/journal.pone.0054808
Crane, M. B., and Lawrance, W. J. C. (1956). The Genetics of Garden Plants, 4th Edn. London: Macmillan.
Crouch, H. K., Crouch, J. H., Jarret, R. L., Cregan, P. B., and Ortiz, R. (1998). Segregation of microsatellite loci in haploid and diploid gametes of Musa. Crop Sci. 38, 211–217. doi: 10.2135/cropsci1998.0011183X003800010035x
De Langhe, E., Hřibová, E., Carpentier, S., Doležel, J., and Swennen, R. (2010). Did backcrossing contribute to the origin of hybrid edible bananas? Ann. Bot. 106, 849–857. doi: 10.1093/aob/mcq187
De Langhe, E. A. L. (1961). La taxonomie du bananier plantain en Afrique Equatoriale. J. Agric. Trop. Bot. Appl. 8, 419–449.
D'Hont, A., Denoeud, F., Aury, J. M., Baurens, F. C., Carreel, F., Garsmeur, O., et al. (2012). The banana (Musa acuminata) genome and the evolution of monocotyledonous plants. Nature 488, 213–217. doi: 10.1038/nature11241
Doležel, J., Bartos, J., Voglmayr, H., and Greilhuber, J. (2003). Nuclear DNA content and genome size of trout and human. Cytometry A 51, 127–128. doi: 10.1002/cyto.a.10013
Doležel, J., Doleželová, M., and Novák, F. J. (1994). Flow cytometric estimation of nuclear DNA amount in diploid bananas (Musa acuminata and M. balbisiana). Biol. Plant. 36, 351–357. doi: 10.1007/BF02920930
Doleželová, M., Valárik, M., Swennen, R., Horry, J. P., and Doležel, J. (1998). Physical mapping of the 18S-25S and 5S ribosomal RNA genes in diploid bananas. Biol. Plant. 41, 497–505. doi: 10.1023/A:1001880030275
Duchoslav, M., Šafářová, L., and Jandová, M. (2013). Role of adaptive and non-adaptive mechanisms forming complex patterns of genome size variation in six cytotypes of polyploid Allium oleraceum (Amaryllidaceae) on a continental scale. Ann. Bot. 111, 419–431. doi: 10.1093/aob/mcs297
Eckert, A. J., Liechty, J. D., Tearse, B. R., Pande, B., and Neale, D. B. (2010). DnaSAM: software to perform neutrality testing for large datasets with complex null models. Mol. Ecol. Resour. 10, 542–545. doi: 10.1111/j.1755-0998.2009.02768.x
Gascuel, O. (1997). BIONJ: an improved version of the NJ algorithm based on a simple model of sequence data. Mol. Biol. Evol. 14, 685–695. doi: 10.1093/oxfordjournals.molbev.a025808
Gouy, M., Guindon, S., and Gascuel, O. (2010). SeaView version 4: a multiple graphical user interface for sequence alignment and phylogenetic tree building. Mol. Biol. Evol. 27, 221–224. doi: 10.1093/molbev/msp259
Guindon, S., and Gascuel, O. (2003). A simple, fast, and accurate algorithm to estimate large phylogenies by maximum likelihood. Syst. Biol. 52, 696–704. doi: 10.1080/10635150390235520
Harpke, D., and Peterson, A. (2008). 5.8S motifs for identification of pseudogenic ITS regions. Botany 86, 300–305. doi: 10.1139/B07-134
Heslop-Harrison, J. S., and Schwarzacher, T. (2007). Domestication, genomics and the future for banana. Ann. Bot. 100, 1073–1084. doi: 10.1093/aob/mcm191
Hippolyte, I., Bakry, F., Seguin, M., Gardes, L., Rivallan, R., Risterucci, A. M., et al. (2010). A saturated SSR/DArT linkage map of Musa acuminata addressing genome rearrangements among bananas. BMC Plant Biol. 10:65. doi: 10.1186/1471-2229-10-65
Hippolyte, I., Jenny, C., Gardes, L., Bakry, F., Rivallan, R., Pomies, V., et al. (2012). Foundation characteristics of edible Musa triploids revealed from allelic distribution of SSR markers. Ann. Bot. 109, 937–951. doi: 10.1093/aob/mcs010
Hřibová, E., Čížková, J., Christelová, P., Taudien, S., De Langhe, E., and Doležel, J. (2011). The ITS-5.8S-ITS2 sequence region in the Musaceae: structure, diversity and use in molecular phylogeny. PLoS ONE 6:e17863. doi: 10.1371/journal.pone.0017863
Hřibová, E., Neumann, P., Matsumoto, T., Roux, N., Macas, J., and Doležel, J. (2010). Repetitive part of the banana (Musa acuminata) genome investigated by low-depth 454 sequencing. BMC Plant Biol. 10:204. doi: 10.1186/1471-2229-10-204
Huson, D. H., and Bryant, D. (2006). Application of phylogenetic networks in evolutionary studies. Mol. Biol. Evol. 23, 254–267. doi: 10.1093/molbev/msj030
Karamura, D. A. (1998). Numerical Taxonomic Studies of the East African Highland Bananas (Musa AAA-East Africa) in Uganda. Montpelier: INIBAP.
Katoh, K., Kuma, K., Toh, H., and Miyata, T. (2005). MAFFT version 5: improvement in accuracy of multiple sequence alignment. Nucleic Acids Res. 33, 511–518. doi: 10.1093/nar/gki198
Kitavi, M., Downing, T., Lorenzen, J., Karamura, D., Onyango, M., Nyine, M., et al. (2016). The triploid East African Highland Banana (EAHB) genepool is genetically uniform arising from a single ancestral clone that underwent population expansion by vegetative propagation. Theor. Appl. Genet. 129, 547–561. doi: 10.1007/s00122-015-2647-1
Lagoda, P. J., Noyer, J. L., Dambier, D., Baurens, F. C., Grapin, A., and Lanaud, C. (1998). Sequence tagged microsatellite site (STMS) markers in the Musaceae. Mol. Ecol 7, 659–663.
Lejju, B. J., Robertshaw, P., and Taylor, D. (2006). Africa's earliest bananas? J. Archaeol. Sci. 33, 102–113. doi: 10.1016/j.jas.2005.06.015
Lejju, B. J., Taylorl, D., and Robertshaw, P. (2005). Late-Holocene environmental variability at Munsa archaeological site, Uganda: a multicore, multiproxy approach. Holocene 15, 1044–1061. doi: 10.1191/0959683605hl877ra
Li, L.-F., Hakkinen, M., Yuan, Y.-M., Hao, G., and Ge, X.-J. (2010). Molecular phylogeny and systematics of the banana family (Musaceae) inferred from multiple nuclear and chloroplast DNA fragments, with a special reference to the genus Musa. Mol. Phylogenet. Evol. 57, 1–10. doi: 10.1016/j.ympev.2010.06.021
Li, L. F., Wang, H. Y., Zhang, C., Wang, X. F., Shi, F. X., Chen, W. N., et al. (2013). Origins and domestication of cultivated banana inferred from chloroplast and nuclear genes. PLoS ONE 8:e80502. doi: 10.1371/journal.pone.0080502
Li, P., Qi, Z. C., Liu, L. X., Ohi-Toma, T., Lee, J., Hsieh, T. H., et al. (2017). Molecular phylogenetics and biogeography of the mint tribe Elsholtzieae (Nepetoideae, Lamiaceae), with an emphasis on its diversification in East Asia. Sci. Rep. 7:2057. doi: 10.1038/s41598-017-02157-6
Lira-Medeiros, C. F., Parisod, C., Fernandes, R. A., Mata, C. S., Cardoso, M. A., and Ferreira, P. C. (2010). Epigenetic variation in mangrove plants occurring in contrasting natural environment. PLOS ONE 5:e10326. doi: 10.1371/journal.pone.0010326
Liu, A. Z., Kress, W. J., and Li, D. Z. (2010). Phylogenetic analyses of the banana family (Musaceae) based on nuclear ribosomal (ITS) and chloroplast (trnL-F) evidence. Taxon 59, 20–28. doi: 10.2307/27757047
Liu, K., and Muse, S. V. (2005). PowerMarker: integrated analysis environment for genetic marker data. Bioinformatics 21, 2128–2129. doi: 10.1093/bioinformatics/bti282
Michener, C. D., and Sokal, R. R. (1957). A quantitative approach to a problem of classification. Evolution 11, 490–499. doi: 10.1111/j.1558-5646.1957.tb02884.x
Nei, M. (1973). Analysis of gene diversity in subdivided populations. Proc. Natl. Acad. Sci. U.S.A. 70, 3321–3323. doi: 10.1073/pnas.70.12.3321
Nwakanma, D. C., Pillay, M., Okoli, B. E., and Tenkouano, A. (2003). PCR-RFLP of ribosomal DNA internal transcribed spacer (ITS) provides markers for the A and B genomes in Musa L. Theor. Appl. Genet. 108, 154–159. doi: 10.1007/s00122-003-1402-1
Ong-Abdullah, M., Ordway, J. M., Jiang, N., Ooi, S. E., Kok, S. Y., Sarpan, N., et al. (2015). Loss of Karma transposon methylation underlies the mantled somaclonal variant of oil palm. Nature 525, 533–537. doi: 10.1038/nature15365
Perrier, X., Bakry, F., Carreel, F., Jenny, C., Horry, J. P., Lebot, V., et al. (2009). Combining biological approaches to shed light on the evolution of edible bananas. Ethnobot. Res. Appl. 7, 199–216. doi: 10.17348/era.7.0.199-216
Perrier, X., De Langhe, E., Donohue, M., Lentfer, C., Vrydaghs, L., Bakry, F., et al. (2011). Multidisciplinary perspectives on banana (Musa spp.) domestication. Proc. Natl. Acad. Sci. U.S.A. 108, 11311–11318. doi: 10.1073/pnas.1102001108
Pillay, M., Ogundiwin, E., Nwakanma, D. C., Ude, G., and Tenkouano, A. (2001). Analysis of genetic diversity and relationships in East African banana germplasm. Theor. Appl. Genet. 102, 965–970. doi: 10.1007/s001220000500
Poggio, L., Realini, M. F., Fourastie, M. F., Garcia, A. M., and Gonzalez, G. E. (2014). Genome downsizing and karyotyping constancy in diploid and polyploid congeners: a model of genome size variation. AoB Plants 6:plu029. doi: 10.1093/aobpla/plu029
Sardos, J., Perrier, X., Doležel, J., Hřibová, E., Christelová, P., Van den houwe, I., et al. (2016). DArT whole genome profiling provides insights on the evolution and taxonomy of edible Banana (Musa spp.). Ann. Bot. 118, 1269–1278. doi: 10.1093/aob/mcw170
Ssebuliba, R., Talengera, D., Makumbi, D., Namanya, P., Tenkouano, A., Tushemereirwe, W., et al. (2006). Reproductive efficiency and breeding potential of East African highland (Musa AAA-EA) bananas. Field Crops Res. 95, 250–255. doi: 10.1016/j.fcr.2005.03.004
Ssebuliba, R. N., Rubaihayo, P., Tenkouano, A., Makumbi, D., Talengera, D., and Magambo, M. (2005). Genetic diversity among East African Highland bananas for female fertility. Afr. Crop Sci. J 13, 13–26.
Staden, R. (1996). The Staden sequence analysis package. Mol Biotechnol. 5, 233–241. doi: 10.1007/BF02900361
Tugume, A. K., Lubega, G. W., and Rubaihayo, P. R. (2002). Genetic diversity of East African Highland bananas using AFLP. Infomusa 11, 28–32.
Ude, G., Pillay, M., Ogundiwin, E., and Tenkouano, A. (2003). Genetic diversity in an African plantain core collection using AFLP and RAPD markers. Theor. Appl. Genet. 107, 248–255. doi: 10.1007/s00122-003-1246-8
Keywords: East African highland bananas, fluorescence in situ hybridization (FISH), ITS phylogeny, Musa, rRNA genes, simple sequence repeats genotyping
Citation: Němečková A, Christelová P, Čížková J, Nyine M, Van den houwe I, Svačina R, Uwimana B, Swennen R, Doležel J and Hřibová E (2018) Molecular and Cytogenetic Study of East African Highland Banana. Front. Plant Sci. 9:1371. doi: 10.3389/fpls.2018.01371
Received: 15 December 2017; Accepted: 29 August 2018;
Published: 04 October 2018.
Edited by:
Edward Hollox, University of Leicester, United KingdomReviewed by:
Xue-jun Ge, South China Institute of Botany (CAS), ChinaFernando Cardona, Consejo Superior de Investigaciones Científicas (CSIC), Spain
Manosh Kumar Biswas, University of Leicester, United Kingdom
Copyright © 2018 Němečková, Christelová, Čížková, Nyine, Van den houwe, Svačina, Uwimana, Swennen, Doležel and Hřibová. This is an open-access article distributed under the terms of the Creative Commons Attribution License (CC BY). The use, distribution or reproduction in other forums is permitted, provided the original author(s) and the copyright owner(s) are credited and that the original publication in this journal is cited, in accordance with accepted academic practice. No use, distribution or reproduction is permitted which does not comply with these terms.
*Correspondence: Eva Hřibová, aHJpYm92YUB1ZWIuY2FzLmN6