- 1Plant Sciences Unit, Applied Genetics and Breeding, Flanders Research Institute for Agriculture, Fisheries and Food (ILVO), Melle, Belgium
- 2Department of Plants and Crops, Faculty of Bioscience Engineering, Ghent University, Ghent, Belgium
- 3Lushan Botanical Garden, Jiangxi Province and Chinese Academy of Sciences, Jiujiang, China
Rhododendrons are typically known to be calcifuges that cannot grow well in lime soils. Data on lime tolerance of different taxa in Rhododendron are scarce. Habitats of naturally distributed specimens of genus Rhododendron were compiled as Chinese text-based locations from the Chinese Virtual Herbarium. The locations were then geocoded into latitude/longitude pairs and subsequently connected to soil characteristics including pH and CaCO3 from the Harmonized World Soil Database (HWSD). Using the upper quartile values of pH > 7.2 and CaCO3 > 2% weight in topsoil as threshold, we predicted the lime tolerant taxa. A dataset of 31,146 Rhododendron specimens including the information on taxonomy, GPS locations and soil parameters for both top- and subsoil was built. The majority of the specimens were distributed in soils with moderately acidic pH and without presence of CaCO3. 76 taxa with potential lime tolerance were predicted out of 525 taxa. The large scale data analysis based on combined data of geocoded herbarium specimens and HWSD allows identification of valuable Rhododendron species, subspecies or botanical varieties with potential tolerance to lime soils with higher pH. The predicted tolerant taxa are valuable resources for an in-depth evaluation of lime tolerance or for further use in horticulture and breeding.
Introduction
The tolerance of various plant species to abiotic stresses evolves according to environmental changes in their habitats (Dimichele et al., 1987; Amtmann et al., 2005; Marais and Juenger, 2010). The evolutionary processes influenced by environmental change as well as the modern regionalization and dispersal of natural habitats have resulted in diverse biogeographical distribution patterns among different plants (Wen, 1999; Xing et al., 2015). Predicting plant species’ tolerance to abiotic stresses using distribution and geochemical data has been accepted as a potentially useful approach (Saslis-Lagoudakis et al., 2015). However, collection of large-scale distribution data of plants through field study is time-consuming. An alternative method of extracting the distribution information from the specimens in herbaria, which were collected and identified by botanists and experienced plant hunters including the location data, is effective and meaningful (Hart et al., 2014; Romeiras et al., 2014; Zhang et al., 2015).
Rhododendron is the largest genus in the family of Ericaceae, comprising nine subgenera, and with about 1000 species, primarily distributed in Asia, Europe, and North America. In China 571 species, 180 botanical varieties and 72 subspecies are reported (Fang et al., 2005). Although rhododendrons are of high ornamental value, they are typically recognized as calcifugous plants (which cannot grow well on lime/calcareous soils), and they usually grow well in soils with pH of 4.5 to 6.0 (Kinsman, 1999). Rhododendrons growing in pH-neutral or alkaline soils frequently suffer from iron (Fe) deficiency chlorosis symptoms: interveinal chlorosis in newly formed leaves, shoot and root growth reduction, leaf wilting, defoliation, and finally, plant death (Demasi et al., 2015a). Fe deficiency may be caused by physical or chemical properties of lime soils, which contain high bicarbonate (HCO3-) concentrations in their soil solution (Mengel, 1994). Mordhorst et al. (1993) found that high calcium cation ([Ca2+]) supply (in absence of HCO3-) does not suppress growth in Rhododendron. Other researchers found that the influence of calcium compounds on the development of Rhododendron micro-cuttings did not depend on the amount of assimilated Ca2+ ions but rather on the type of anions present in given salts (Giel and Bojarczuk, 2002). Further work showed that the major factor limiting Rhododendron growth in calcareous soils is the increase in substrate pH, rather than an increase in the concentration of calcium ions (Giel and Bojarczuk, 2011).
The Chinese Virtual Herbarium (CVH1), an online portal allowing access to herbarium specimen information, is a collaboration of more than 30 major herbaria in China and consists of more than 6 million specimens. CVH lists about 90 thousand Rhododendron specimens. However, the information on the collection locations of the specimens are mostly recorded in Chinese text instead of Global Position System (GPS) data due to the absence of portable precise positioning devices at the time of collection. Therefore, this information cannot be used directly for visualization of plant distribution and it hampers the automatic connection with other databases such as the Harmonized World Soil Database (HSWD). The HSWD is a 30 arc-second raster database with over 15,000 different soil mapping units that combines existing regional and national updates of soil information worldwide (Batjes et al., 2012).
Geocoding is often described as the process of converting text-based address data into digital geographic coordinates, most commonly resulting in latitude/longitude pairs (Goldberg, 2011). Geocoding technology is increasingly important in the coming era of big data to bridge the gap between non-spatial and spatial data in various fields, such as epidemiology (Bergman et al., 2012; Nuvolone et al., 2016), environmental health (Faure et al., 2017), land or forest economy (Johnston et al., 2016; Moeltner et al., 2017), and so on. Because of its great importance, many geocoding methods have been developed including online services, commercial in-house services, as well as no-cost strategies using R (Goldstein et al., 2014; Faure et al., 2017). However, Chinese geocoding faces great challenges due to the complexity of the address string format in Chinese, which contains no delimiters between Chinese words, and limited address reference resources (Tian et al., 2016).
In this study, the distribution map of Rhododendron natural taxa including species, subspecies and varieties in China were generated according to the latitude/longitude pairs geocoded from Chinese text-based addresses of herbarium specimens. We connected the obtained GPS data of the herbarium specimens with the HWSD, which enabled us to derive data on soil pH and CaCO3 concentrations for each specimen location. The influence of soil characteristics on the distributions of Rhododendron taxa and the tolerance potential of rhododendrons to high pH and CaCO3 concentration were evaluated. By analyzing Rhododendron specimens and geochemical data, we aim to illustrate and predict their potential tolerance to abiotic stress at taxon level. The large scale data analysis, which concerns a multitude of taxa and a large area, allowed us to identify valuable Rhododendron species, subspecies or natural varieties with tolerance potential to lime soils with higher pH.
Materials and Methods
Data Collection of Herbarium Specimens and Geocoding
In this study, Rhododendron species, subspecies, and botanical varieties were regarded as independent taxa (taxonomic units). Data on Rhododendron taxa were collected from CVH. Approximately 90,000 Rhododendron specimens were present in that database. Taxonomic data as well as the Chinese text-based locations of herbarium specimens were extracted in R (R Development Core Team2), using packages “RCurl” (version 1.95-4.8) and “XML” (version 3.98-1.5). The Latin names and subgenus information were subsequently revised and uniformed according to Flora of China (Fang et al., 2005).
The Chinese text-based locations of each specimen were geocoded to GPS latitude/longitude pairs using the R package “REmap” (Lang, 2016) based on Baidu Maps API (Application Program Interface).
Soil Parameters and Data Cleaning
The Harmonized World Soil Database (HWSD, version 1.21) (Batjes et al., 2012) was used to obtain the soil data information. “MU_GLOBAL” (Global Mapping Unit Identifier) provided the link between the Geographic Information System (GIS) layer and the attribute database. Mainland China can be recognized by “MU_GLOBAL” from 11000 to 11935. For each of these 936 mapping units, there is only one set of soil data with physical and chemical parameters. First “MU_GLOBAL” of the specimens with obtained latitude/longitude pairs were extracted in ArcGIS 10.2 (ESRI, Redlands, CA, United States) based on HWSD projected in spatial reference of WGS_1984 at a resolution of 0.0083 decimal degrees, which covered a grid cell of about 1 km × 1 km. Then soil parameters, including pH measured in a soil-water solution and CaCO3 of both topsoils (0 ∼ 30 cm) and subsoils (30 ∼ 100 cm) were obtained by connecting the specimen location data and HWSD data using the same “MU_GLOBAL”.
The specimens from which the calculated location was linked via “MU_GLOBAL” to areas identified as either ‘inland water,’ ‘rock debris,’ ‘glaciers and permanent snow,’ or ‘urban area’ were removed from the soil parameters dataset. These areas are indicated by the symbols “WR,” “RK,” “GG,” or “UR,” respectively, under the soil unit symbol “SU_SYM90”. Specimens lacking subsoil data were also deleted.
Data Analysis
Accuracy of the geocoding algorithm was evaluated by calculating the distance between the automated geocoded locations and the original field-recorded locations by “distVincentyEllipsoid()” in R package “geosphere” (Hijmans, 2017). The number of specimens for each taxon were counted and taxa were classified according to the nine subgenera of Rhododendron listed in Flora of China (Fang et al., 2005). Heat maps (Kernel Density) were generated in ArcGIS 10.2 to visualize the distribution centers of the genus Rhododendron. The number and percentage of grid cells, specimens and taxa were calculated according to the different pH and CaCO3 ranges for both top- and subsoil. For pH, five ranges (<4.5, 4.5–5.5, 5.5–7.2, 7.2–8.5, and >8.5) and for CaCO3 (% weight), four classes (<2, 2–5, 5–15, and >15), were defined according to HWSD. For each taxon with at least 10 specimens in our database, we determined lower quartile (LQ), median and upper quartile (UQ) for both pH and CaCO3 of topsoil. Median values hereby provide the taxon’s central tendency to environmental conditions (pH and CaCO3) in their distributions, while LQ and UQ values represent more extreme conditions that rhododendrons counter within their habitats. Because we aimed to predict the tolerance potential of rhododendrons to lime soils with high pH and CaCO3 concentration, we considered the UQ as tolerance indicator. The taxa with UQ of pH > 7.2 and CaCO3 > 2% weight in topsoils were predicted as being potentially tolerant to lime soils. To evaluate the results of prediction, the number of specimens distributed in lime (pH > 7.2 and CaCO3 > 2%) or non-lime (pH ≤ 7.2 and CaCO3 ≤ 2%) top soils of predicted tolerant and non-tolerant taxa were calculated, a Chi-square test in R was then performed. The distribution of the taxa as predicted in this study and based on literature reports of taxa with lime tolerance potential was mapped using ArcGIS 10.2.
Results
Database Construction
Of the nearly 90,000 Rhododendron specimens present in the CVH, 69,129 specimens containing Chinese text-based locations could be collected. Of those, the locations of 35,574 specimens were geocoded to GPS latitude/longitude pairs with a labeled text that best matched the location text of specimen. As a vast majority of specimens didn’t include the field-recorded GPS locations, we randomly selected 60 specimens with GPS information which could be found from the scanned picture of specimens in CVH. The average distance between the automated geocoded locations and the field-recorded locations was 31.2 ± 7.5 km (1st quantile 3.7 km, median 7.0 km, 3rd quantile 22.2 km). From these 35,574 specimens, the “MU_GLOBAL” data were extracted based on specimen GPS locations and HWSD. The obtained data showed that “MU_GLOBAL” of 382 specimens were located outside of mainland China. Furthermore, 458 specimens were located in ‘inland water,’ ‘rock debris,’ ‘glaciers and permanent snow,’ or ‘urban area’ and 3,588 specimens lacked subsoil data. All of these specimens were discarded from the dataset. Finally, we built a database of 31,146 specimens including the information on taxonomy, GPS locations and soil parameters for both top- and subsoil. This database was used for subsequent data analysis.
Rhododendron Taxa and Distribution
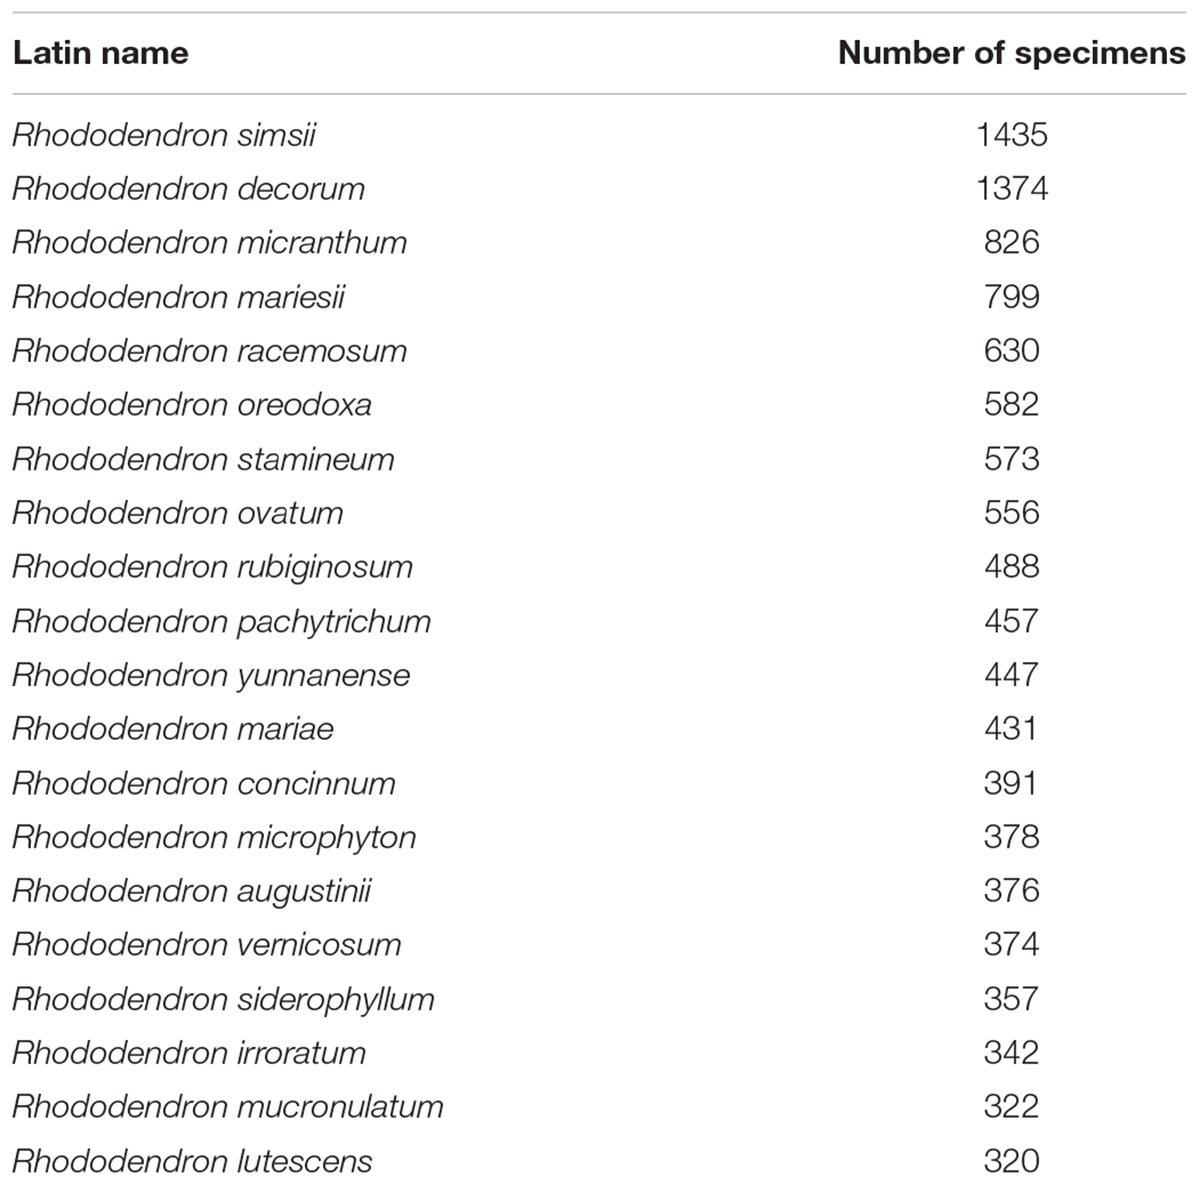
The 31,146 specimens of our dataset were divided into 413 species, 78 varieties and 34 subspecies. The species represented 72.3% of the described species in China and covered all nine subgenera (Table 1), while varieties and subspecies represented 43.3 and 47.2% of the described Chinese Rhododendron varieties and subspecies, respectively. For subsequent analyses the varieties and subspecies were treated at the same level as species as separate taxa: in total, 525 taxa were analyzed. The number of specimens for each taxon varied from 1 to 1435 (Supplementary Table S1). For 302 of these, at least 10 specimens were present, while 37 had more than 200 specimens. Rhododendron simsii, one of the most common species in genus Rhododendron, has the most specimens, followed by R. decorum, R. micranthum, and R. mariesii, etc. The 20 species with most specimens represented 36.8% of the complete database (Table 2). The heat map made from the 31,146 specimens showed that genetic resources of genus Rhododendron were mainly distributed in southwest China, with two hotspots in Sichuan and Yunnan province (Figure 1).
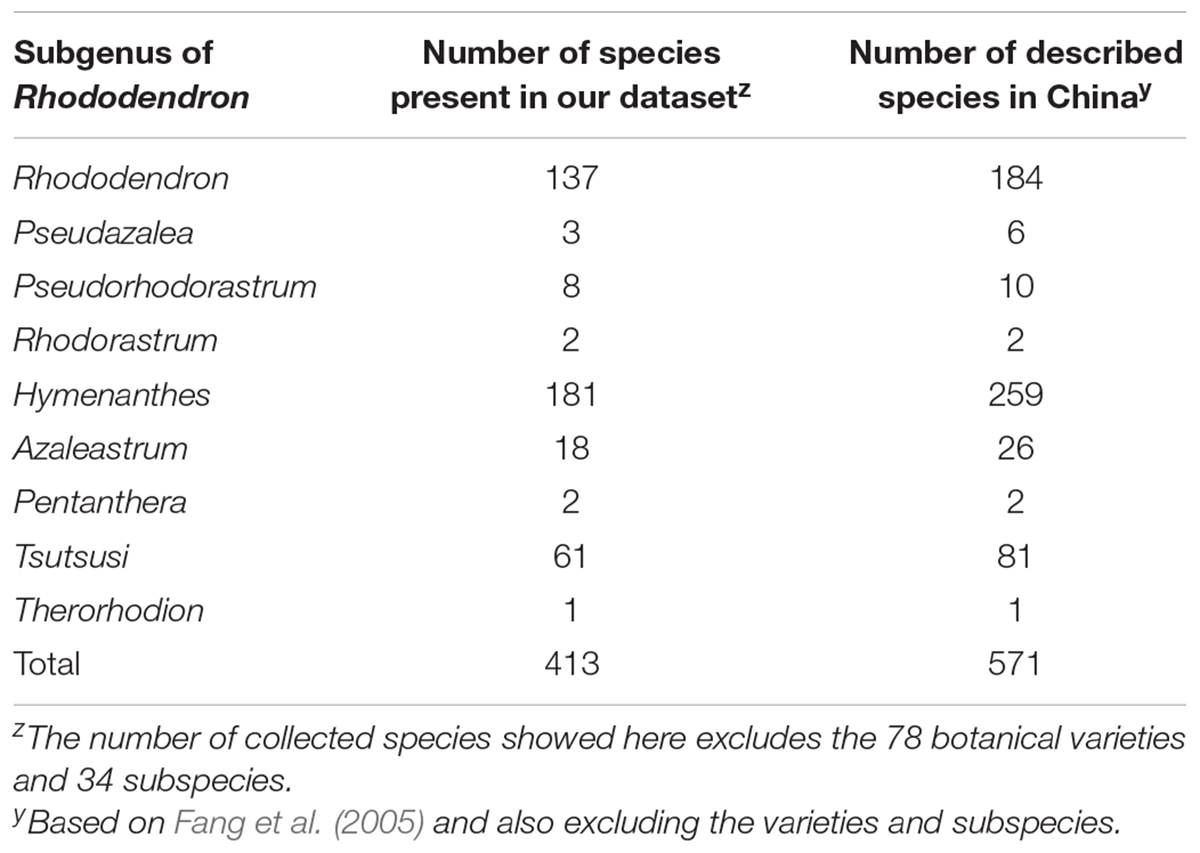
TABLE 1. Distribution of the different species present in the database in nine subgenera of Rhododendron.
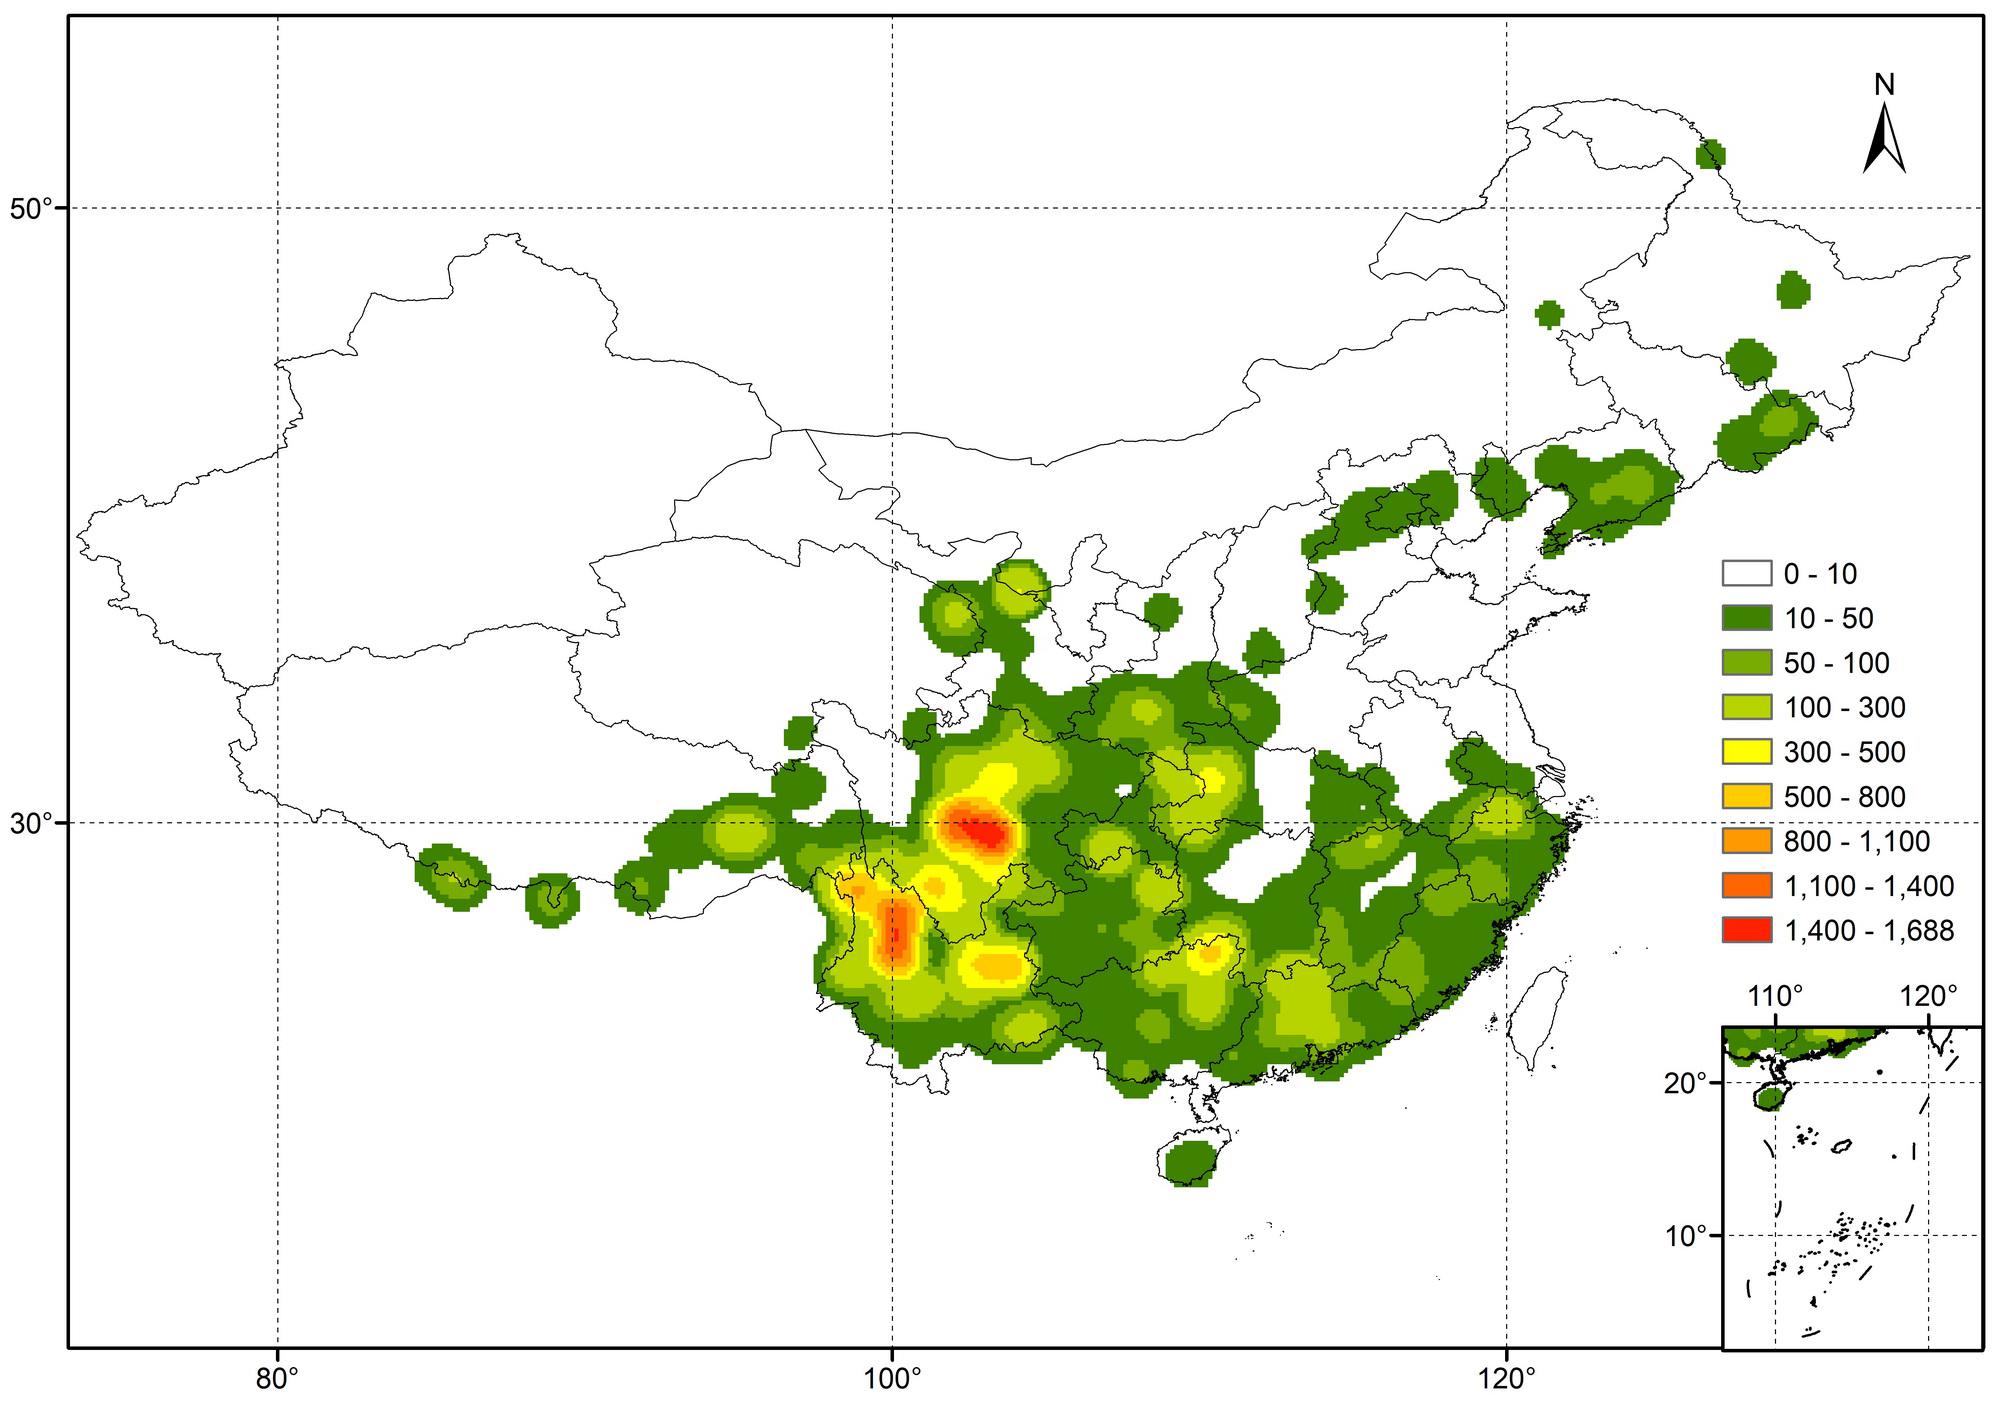
FIGURE 1. Heat map (Kernel Density) showing the distribution in China of the 31,146 Rhododendron specimens present in our dataset.
Effect of Soil pH
A total of 10,804,183 grid cells in China were mainly distributed at pH range of 5.5–7.2 (41.2%) and 7.2–8.5 (38.8%) of topsoil, with more at 7.2–8.5 (44.9%) than 5.5–7.2 (36.0%) of subsoil (Table 3). More than 75% of Rhododendron specimens were located in areas with top- and subsoil pH ranging between 4.5 and 7.2 (Table 3). About 20% of the specimens were linked to a topsoil pH between 7.2 and 8.5. Almost no specimens or taxa were distributed in areas with pH lower than 4.5 or higher than 8.5. In topsoil, grid cells distributed at four humps around pH of 6.5 (12.5%), 8 (11%), 5.7 (7.9%), and 4.8 (6.7) (Figure 2). pH 6.5 grouped the most specimens (9,898, 31.8%), followed by 4.9 (3,858, 12.4%) and 4.8 (3,399, 10.9%), then 7.8 (2,735, 8.8%) and 8 (2,727, 8.8%). Similarly, most taxa (393, 74.9%) distributed in topsoil pH of 6.5, followed by 4.9 (284, 54.1%), 4.8 (248, 47.2%), 7.8 (218, 41.5%), and 8 (202, 38.5%) (Figure 2).

TABLE 3. Distribution of grid cells, Rhododendron specimens and corresponding taxa (525 in total) according to different pH ranges in top and subsoil.
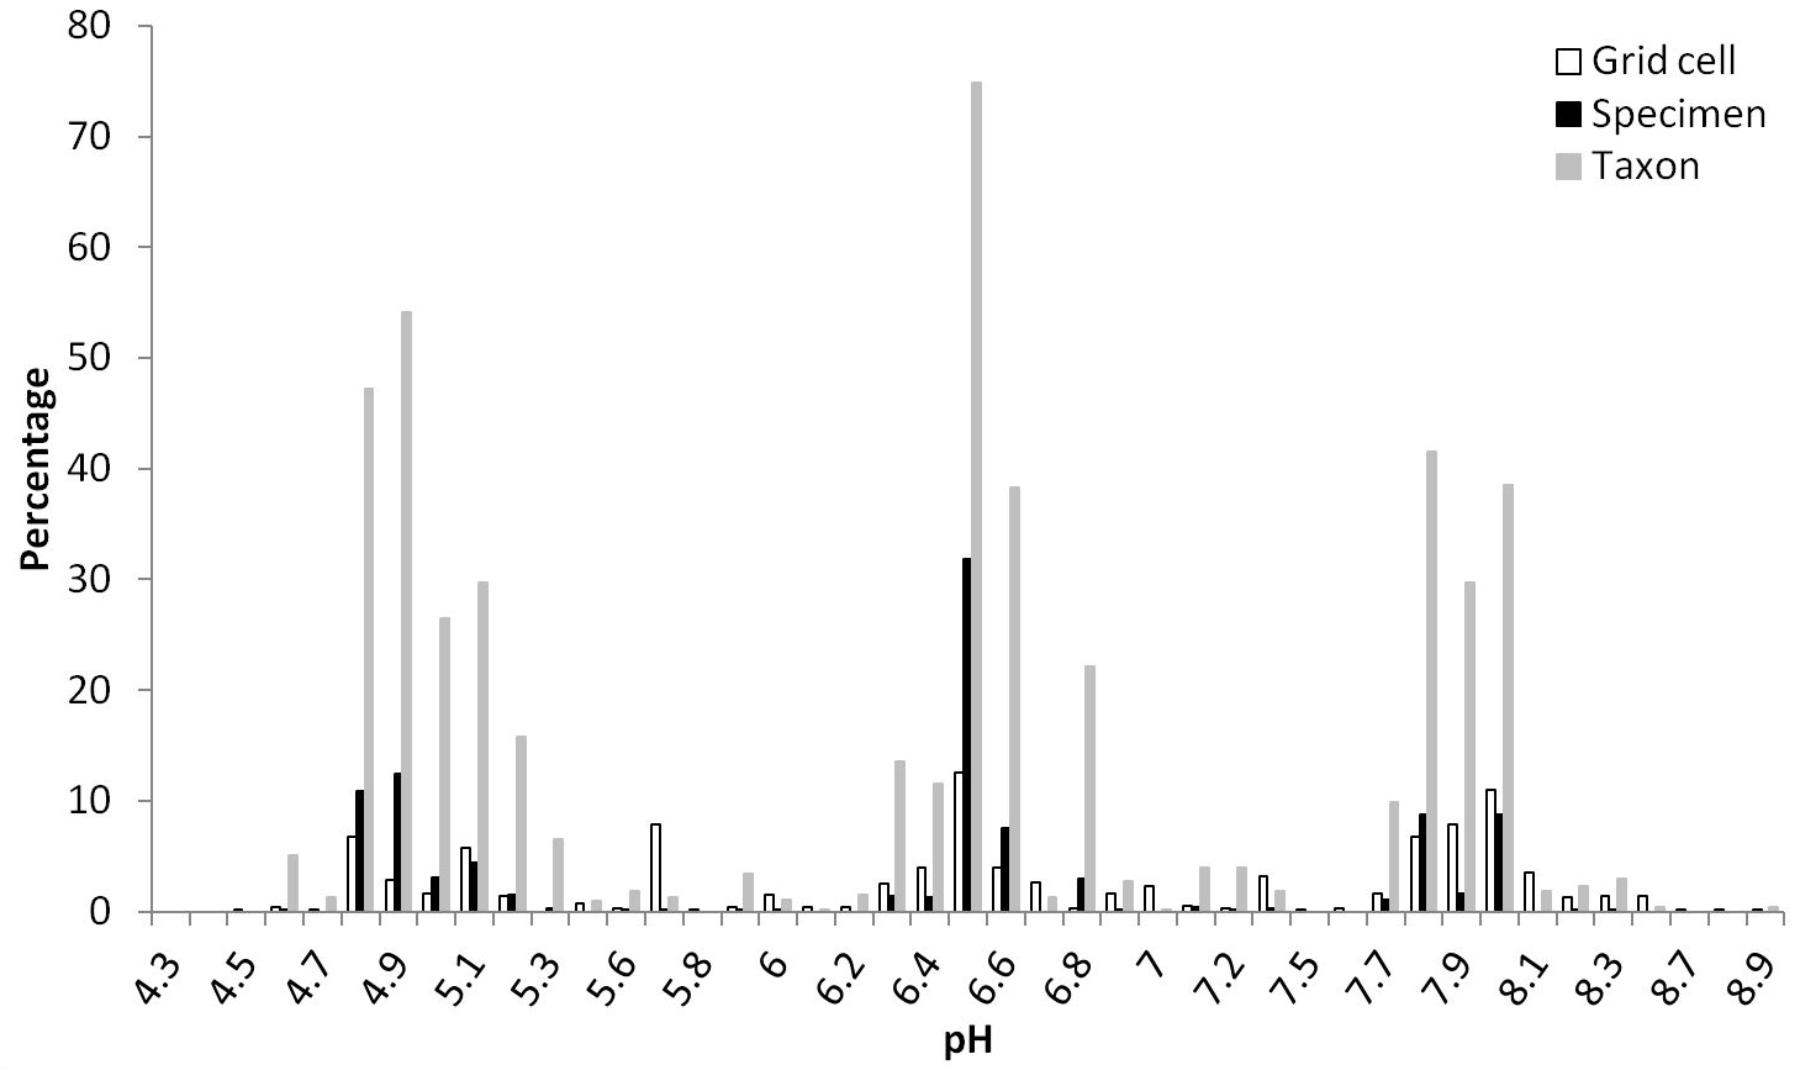
FIGURE 2. Percentages of grid cells (10,804,183 in total), Rhododendron specimens (31,146 in total) and taxa (525 in total) in different pH values for topsoil (pH measured in a soil-water solution and different specimens of one taxon could be found at diverse pH values).
Effect of Soil CaCO3
More than a half of grid cells in China were linked with CaCO3 concentration less than 2% for both top (59.8%) and subsoils (52.5%), followed by concentration rang of 5–15 and 2–5 (% weight) (Table 4). A vast majority of specimens (>75%) and taxa (>95%) were distributed in top or subsoil with CaCO3 less than 2% weight, followed by CaCO3 ranging between 5–15 and 2–5 (% weight) (Table 4). Almost no Rhododendron taxa were distributed in soils with CaCO3 higher than 15% weight. In topsoils, 52.9, 5.5, 4.6, 3.8, and 2.1% of grid cells were linked with CaCO3 concentration of 0, 9.3, 7, 3, 0.1 (% weight) respectively (Figure 3). In topsoils without any CaCO3, 20,788 (66.7%) specimens and 497 (94.7%) taxa were distributed, followed by a concentration of 0.1% weight, with 2,730 (8.8%) specimens and 218 (41.5%) taxa, and 9.3% weight with 2,674 (8.6%) specimens and 217 (41.3%) taxa (Figure 3).

TABLE 4. Distribution of grid cells, Rhododendron specimens and taxa (525 in total) according to different CaCO3 ranges in top and subsoil.
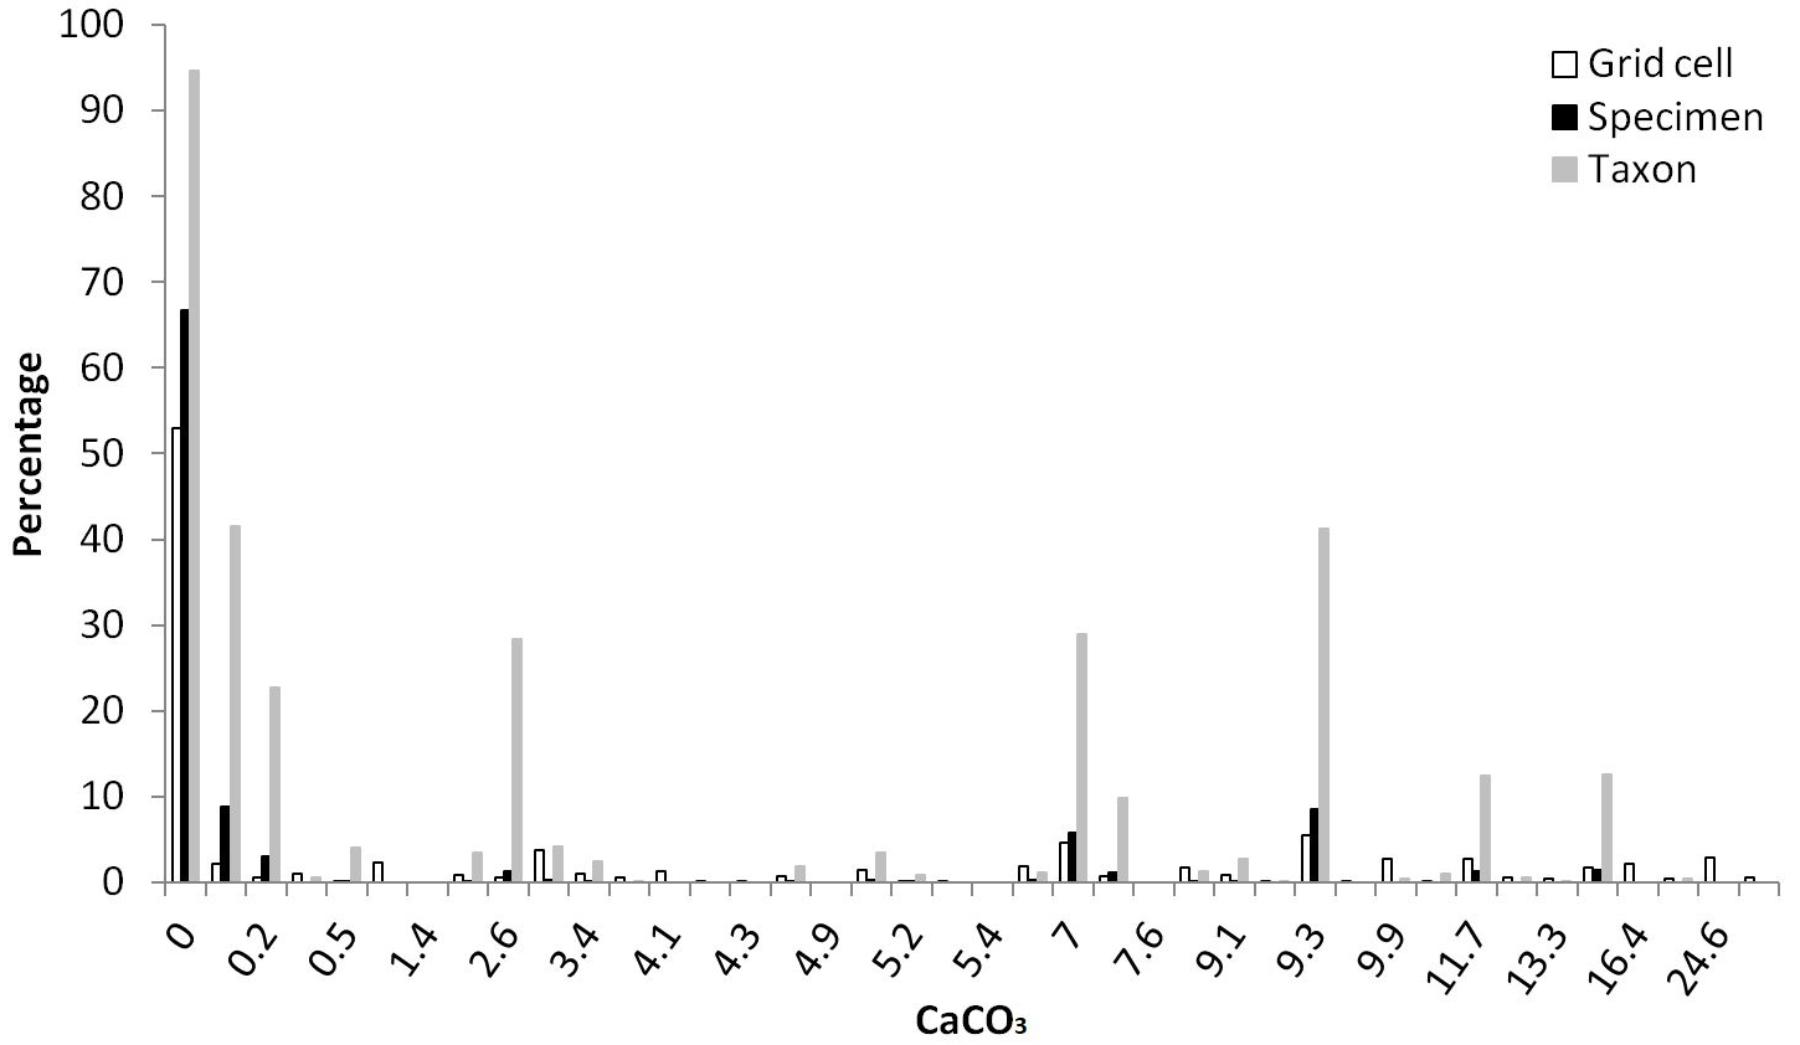
FIGURE 3. Percentages of grid cells (10,804,183 in total), Rhododendron specimens (31,146 in total) and taxa (525 in total) in different concentrations (% weight) of CaCO3 in topsoil (Different specimens of one taxon could be found at diverse CaCO3 concentrations).
Tolerance Potential of Rhododendron Taxa to Lime Soils
Using the UQ values of pH > 7.2 and CaCO3 > 2% weight in topsoil as a threshold, 76 Rhododendron taxa were identified as potentially tolerant to lime soils, which are characterized by a higher pH and higher CaCO3 content (Table 5). The different taxa belong to the nine Rhododendron subgenera. In the predicted tolerant taxa, 2,995 and 5,443 specimens were distributed in lime and non-lime soils, respectively. And in the predicted non-tolerant taxa, 3,475 and 19,111 specimens were distributed in lime and non-lime soils, respectively. The Chi-square test showed that the distribution of specimens in lime and non-lime soils was significant different between predicted tolerant and non-tolerant taxa (X2 was 1503.7, df = 1 and p-value < 2.2 × 10⁻¹⁶). Using our geocoding method, we observed that in 20 taxa, more than half of the specimens were located in soils with pH > 7.2; for 53 taxa, at least one-third of the specimens were located in soils with topsoil pH > 7.2. For 10 taxa, whose tolerance potential was also supported by literature (R. davidsonianum, R. fortunei, R. micranthum, R. nivale, R. phaeochrysum, R. primuliflorum, R. telmateium, R. trichocladum, R. vernicosum, R. yunnanense), the geocoded locations of the specimens growing in topsoil with pH > 7.2 and CaCO3 > 2% weight were compared with the location of the other specimens (Figure 4).
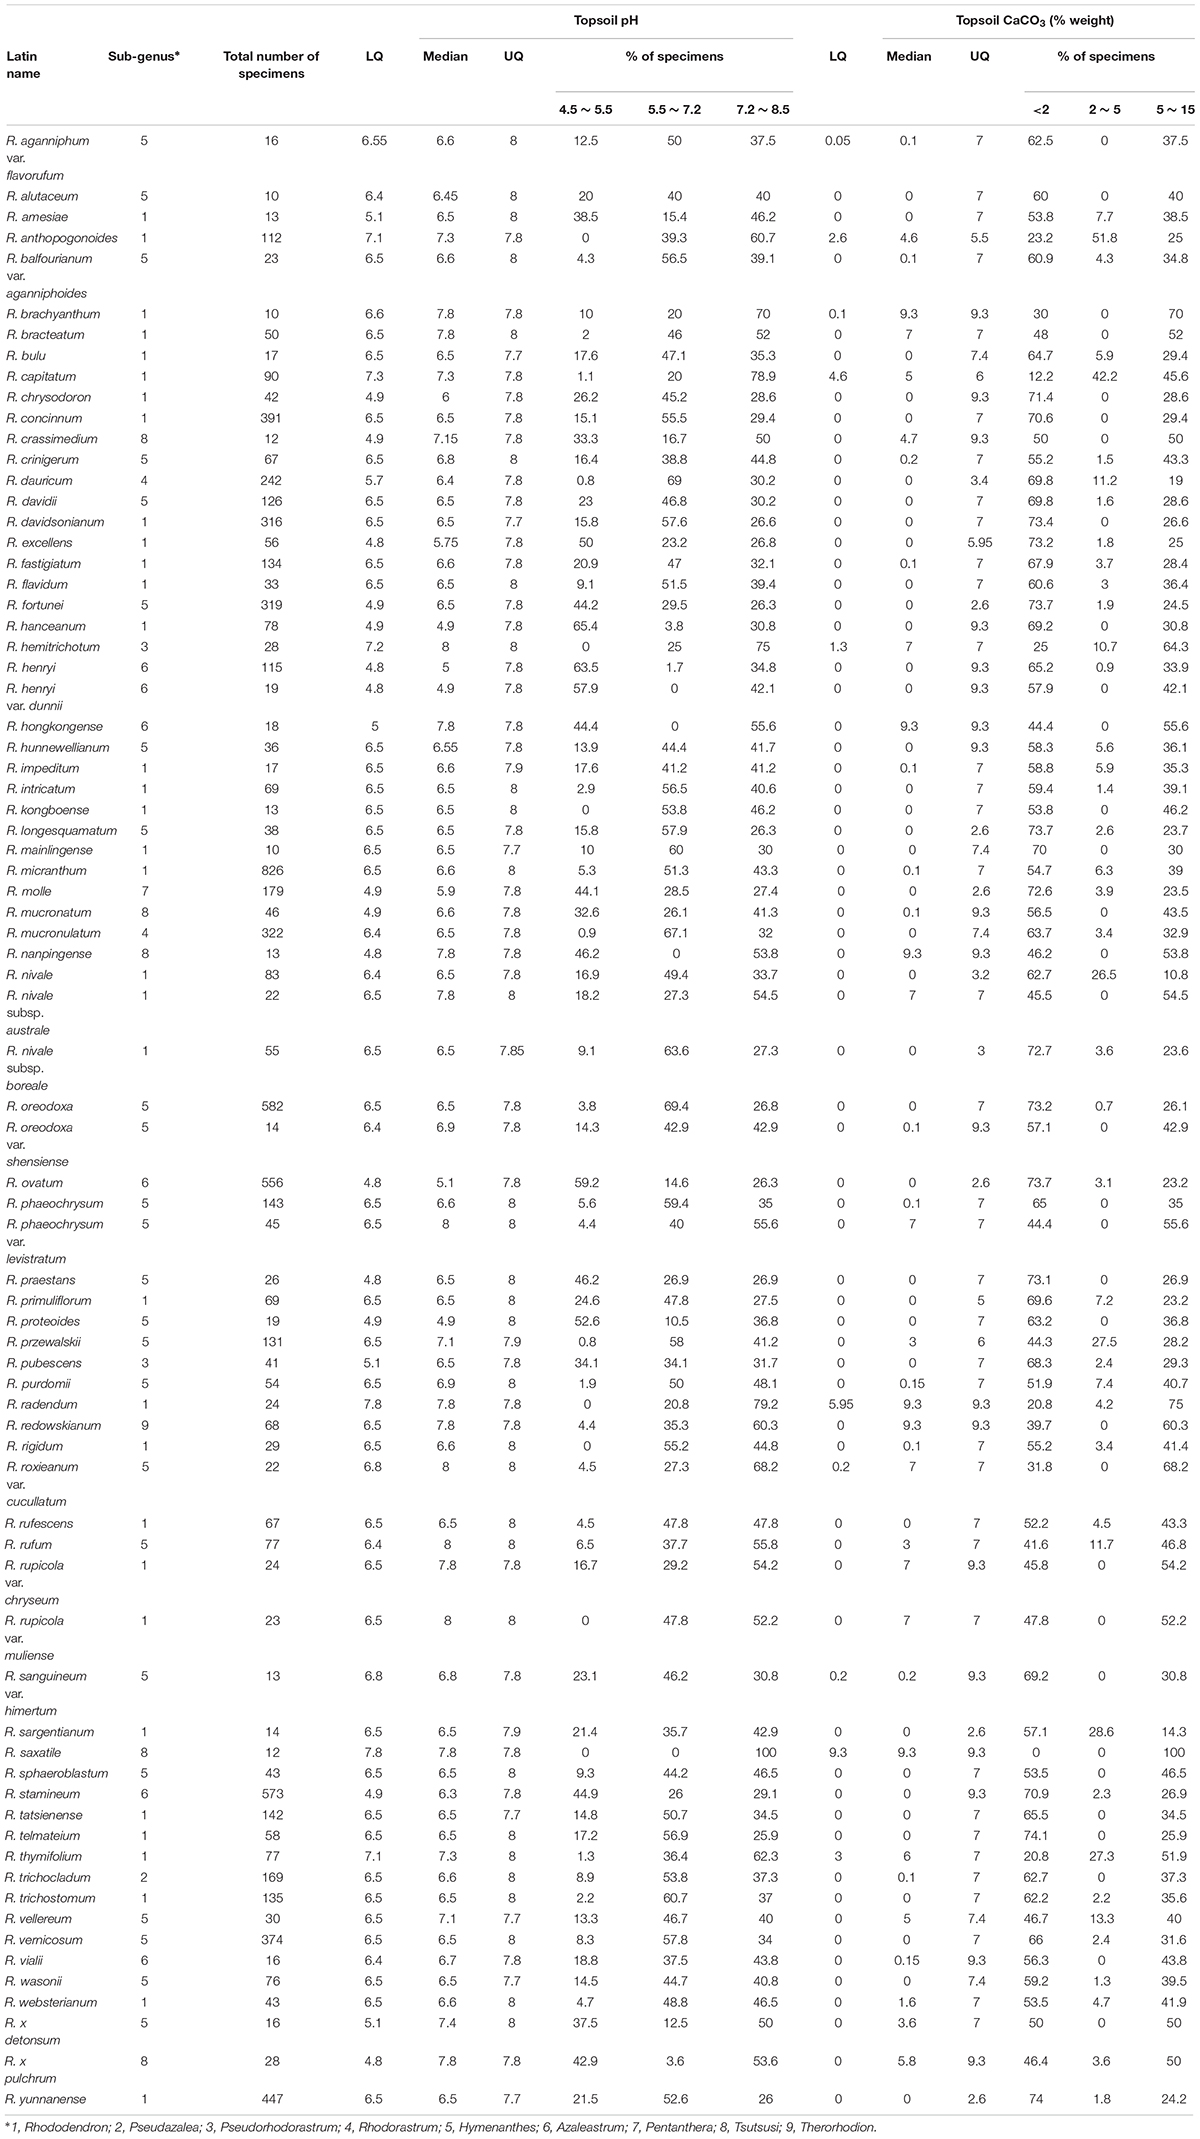
TABLE 5. Lower quartile (LQ), median and upper quartile (UQ) values of pH and CaCO3 in topsoils and specimen distribution for the 76 taxa with UQ values of topsoil pH > 7.2, CaCO3 > 2% weight and a minimum of 10 specimens.
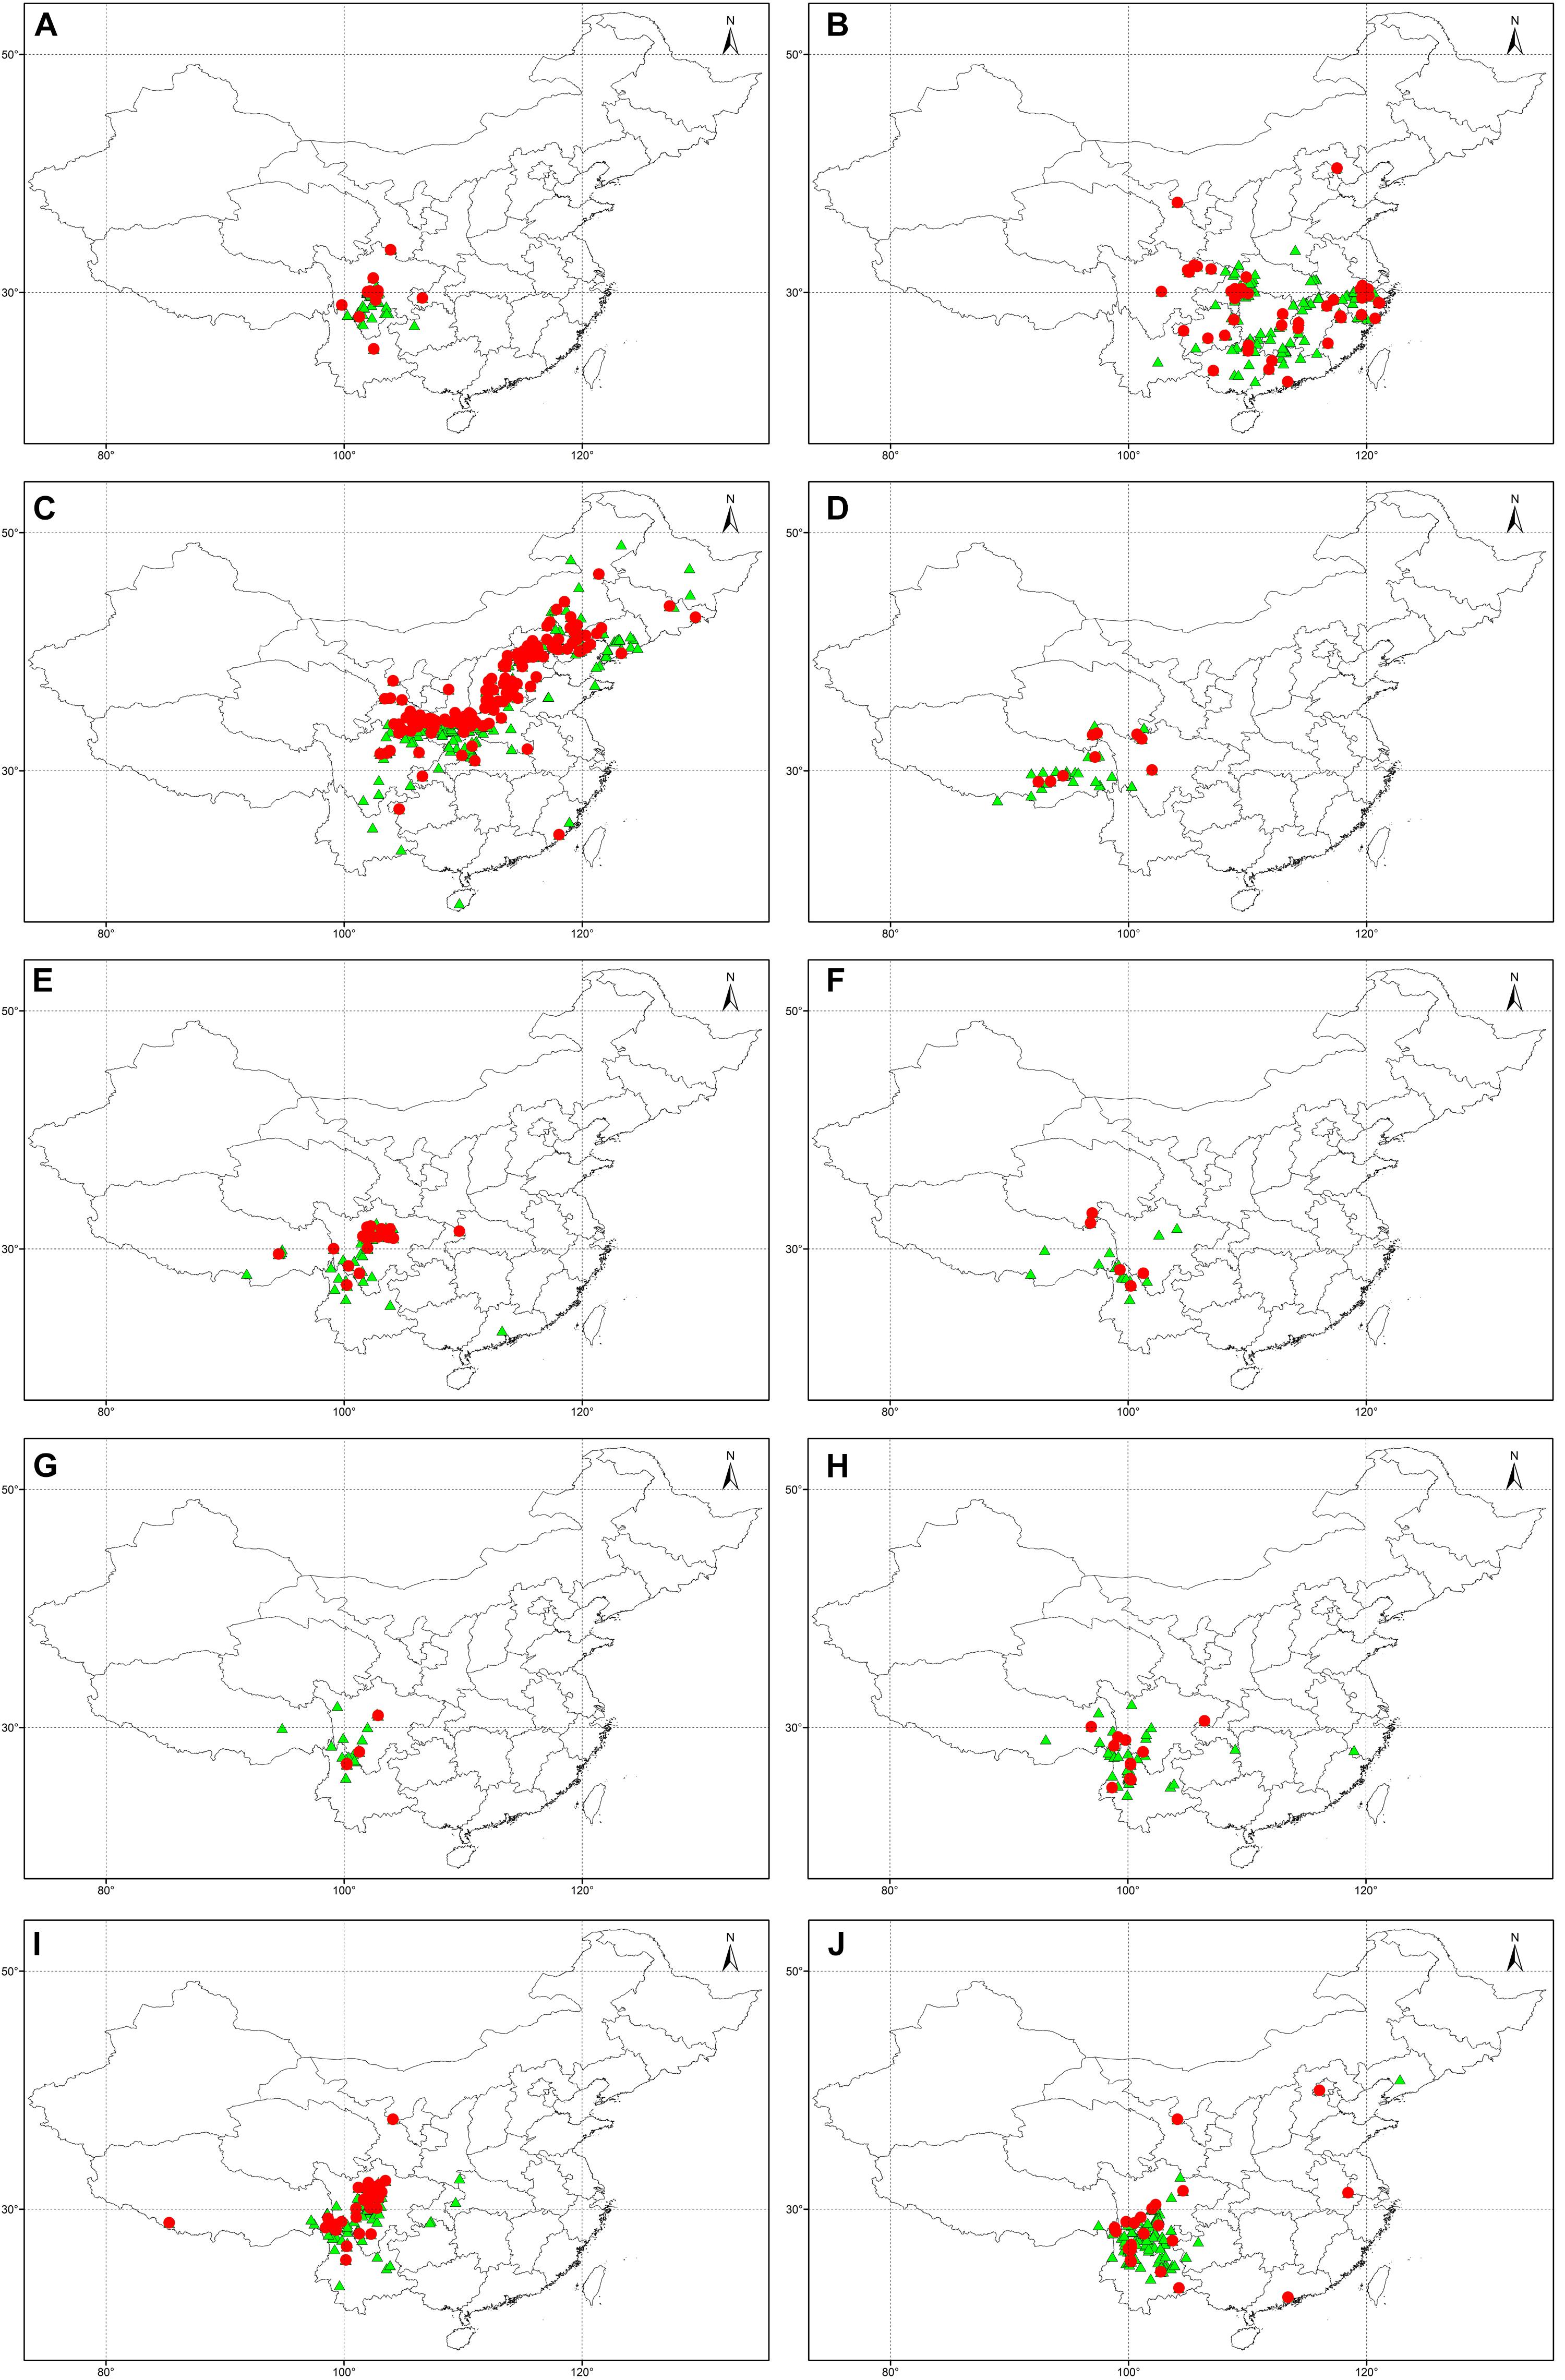
FIGURE 4. Geocoded locations of herbarium specimens from 10 Rhododendron taxa predicted in this study and supported by literature as being lime tolerant: R. davidsonianum (A), R. fortunei (B), R. micranthum (C), R. nivale (D), R. phaeochrysum (E), R. primuliflorum (F), R. telmateium (G), R. trichocladum (H), R. vernicosum (I), R. yunnanense (J).


Discussion
China is considered to be a center of origin for Rhododendron. Chinese herbaria, accessible via the CVH, conserved tens of thousands of specimens collected by botanists and plant hunters since 1884 and this number is still increasing. Using the statistical software R with package “REmap,” we geocoded 51.5% of the Chinese text-based locations into latitude/longitude pairs with an acceptable accuracy (31.2 ± 7.5 km) in terms of a continental-scale dataset. Faure et al. (2017) reported in their epidemiological study 81.4 and 84.4% of geocoded addresses using a free-online geocoding service and an in-house geocoder system, respectively. They concluded that the geocoding accuracy was higher in urban areas compared to rural areas, but comparable for the two automatic geocoding methods. The lower geocoding rate in our study might be due to the quality of the Chinese texts which described the locations. The possibility for geocoding drops when the textual description of a location is written in an irregular manner, or a location has more than one synonym which occurs among different Chinese authorities in different governmental agencies. Besides, the whole analysis relied upon data being recorded on the herbarium specimen label. If specific locality information was not recorded, no geocoding scheme could be able to resolve an accurate location. Likewise, Hart et al. (2014) excluded ∼90% of specimens in their study mostly because specific information, such as altitude and date of collection was not recorded on the herbarium specimen label. Despite availability of commercial and no-cost geocoding strategies (Goldstein et al., 2014; Faure et al., 2017), the automated geocoding of textual documents faces challenges, especially for development of language modeling methods for textual document geocoding (Faure et al., 2017). The complexity of the address string format in Chinese text-based geocoding compounds these challenges (Tian et al., 2016).
In our final extracted dataset of 31,146 specimens, the majority (72.3%) of reported Chinese Rhododendron taxa were present and covered all nine subgenera. This was representative of the genus Rhododendron in China. The heat map showed that the hotspots were mainly distributed in the Himalaya–Hengduan Mountains area in Sichuan and Yunnan province, which is consistent with previously reports of the general distribution of Rhododendron species in China (Milne et al., 2010; Liu et al., 2014; Yan et al., 2015). Furthermore, the heat map (Figure 1) matched well with the spatial patterns of total Rhododendron species richness in China estimated in 50 km × 50 km grid cells resulted from analyzing 556 Rhododendron species out of 571 species occurring in China by Shrestha et al. (2018). However, the hotspots still had a regional distribution, even within the Himalaya–Hengduan Mountains area. The factors that influence Rhododendron distribution cannot be only attributed to the climate (Kumar, 2012), soil conditions also influence Rhododendron growth in a specific region (Esen et al., 2004; Kamei et al., 2009). By geocoding the specimens, we were able to link specimen location to the soil characteristics of HWSD, thus leading to a metadata analysis of soil conditions for rhododendrons in nature. Rhododendrons have shallow, fibrous root systems that are restricted to the upper soil (Kinsman, 1999; Hales et al., 2009), thus our analysis focused primarily on topsoil (0–30 cm). The majority of the plants were located in topsoils with low pH (below or around 6.5), without presence of CaCO3. Importantly, the pH values reported in the HWSD database are soil-water pH, which is approximately 0.9 unit higher than pH in 1 M KCl (Kabala et al., 2016). The results are in accordance with the general trend that Rhododendron cannot grow well in neutral or alkaline soils and is considered to be a calcifugous genus (Kinsman, 1999; Demasi et al., 2015a). Kinsman (1999) reported that at almost all sites in Northwest Yunnan where Rhododendrons grow in shallow soils overlying limestone, the soils still had pH values of less than 6. The pH values in Kinsman’s report were also measured in soil-water solutions, but in Kinsman’s study most soil samples were taken 3–10 cm below ground surface while the topsoil pH measured in HWSD contains the 0–30 cm layer. The lower pH in topsoils (0–10 cm) can be explained by organic horizon acidification and rhizosphere interaction of plant roots (James and Riha, 1987; Wang et al., 2016).
Using data analysis, we tried to predict at taxon level (species, subspecies or varieties) which potential genetic resources might exhibit lime tolerance. Thresholds were set at UQ for pH > 7.2 and CaCO3 content > 2% weight. According to HWSD, pH values from 7.2 to 8.5 are indicative of carbonate rich soils which chemically form less available carbonates affecting nutrient availability (P, Fe) (Batjes et al., 2012). Further, the bioavailability of trace element cations such as copper (Cu), Zn, nickel (Ni), cadmium (Cd), and lead (Pb) and their concentration in plants is significantly reduced at pH > 7.0 (Valentinuzzi et al., 2015). In addition, calcifugous plants are intolerant to high concentrations of Ca2+ when combined with high pH (Vicherova et al., 2015). Using these thresholds, we compiled a list of 76 potentially lime-tolerant taxa. For 61 of these, at least 30% of the specimens were geocoded in locations from which the topsoil pH was above 7.2 and CaCO3 > 2% weight.
For several taxa mentioned in our prediction, support was found in literature for their lime tolerance. McAleese and Rankin (2000) showed that R. primuliflorum could grow in soil with pH > 7 (sampled in topsoil 10–20 cm), as well as R. telmateium and R. yunnanense, followed by R. vernicosum. R. yunnanense was also found on gravely loam soils of high pH in the Sichuan region of China, the same as R. davidsonianum (Reid et al., 1998). Kaisheva (2006) classified R. phaeochrysum, R. balfourianum, R. primuliflorum, R. telmateium, R. yunnanense, and R. trichocladum as lime tolerant species. R. fortunei was mentioned as a promising gene resource for breeding lime tolerant rhododendrons (Shujun et al., 2008). Kinsman (1999) determined R. primuliflorum definitely to be growing under alkaline soil conditions (pH 7.4–7.9), while R. rupicola var. chryseum and R. proteoides, which were also in our prediction list, were found in soil pH values below 6.
Evidence for lime tolerance can also be found in species that co-occur in similar habitats. An example is R. nivale, a perennial evergreen undershrub with a height of 30–120 cm, distributed in the northeastern and southeastern areas of the Tibet Autonomous Region of China, Nepal, India, Bhutan, and Sikkim (Guo et al., 2017). This species co-occurred with R. primuliflorum as the representative alpine species in the snowy mountains in the northwest of Yunnan (Xu et al., 1996), which grows in limestone crevices shared with Paraquilegia anemonoides, another species associated uniquely with limestone. This shows that R. nivale has a similar habitat as R. primuliflorum, indicating R. nivale may also has a good lime tolerance potential, as well as its subspecies R. nivale subsp. austral and R. nivale subsp. boreale. Moreover, R. rupicola was also found together with R. primuliflorum in limestone crevices shared with P. anemonoides (McAleese and Rankin, 2000). Although R. rupicola was included in our dataset but not predicted as a lime tolerant taxon, its two varieties R. rupicola var. chryseum and R. rupicola var. muliense were predicted with lime tolerance. The bias of geocoding or soil data of HWSD may result in the fact that R. rupicola was not predicted as a lime tolerant taxon in our study. It does, however, not exclude a lime tolerant potential because congeneric species often have similar ecological characteristics and use similar resources. Furthermore, similar interspecific associations can strengthen their competitive ability and promote local exclusion to non-congeneric species to obtain more living space (Yuan et al., 2018). Field and experimental work should be carried out to confirm this in the future.
In addition, some predicted lime tolerant taxa can also be supported from horticultural and physiological studies. R. micranthum was proven to be able to grow in containers on lime-supplemented media (McAleese and Rankin, 2000). R. x pulchrum is a well-known taxon for landscaping and breeding. It’s cultivar R. x pulchrum ‘Sen-e-oomurasaki’ showed extremely low chlorosis and mortality rates and high ferric chelate reductase activity in high pH hydroponic conditions, resulted in iron efficient genetic resources for azalea cultivation and gardening in calcareous soils (Demasi et al., 2015a,b).
This information demonstrates that our strategy to use UQ values of pH > 7.2 and CaCO3 > 2% weight in topsoils at the habitats of Rhododendron taxa can be used as an efficient indicator for prediction of lime tolerance. As a supplement to the identification of taxa where lime tolerance was already reported, our work has also identified some potentially interesting taxa for which (to our knowledge) no information is available on potential lime tolerance.
Other studies confirmed the value of herbarium specimens, especially those with detailed locations, as a source of information. Contrasting phenological responses of Rhododendron species to the Himalayan climate were reported by analyzing Rhododendron herbarium specimens located in Lijiang County, Yunnan, China (Hart et al., 2014). Elevational distribution of native orchid species compiled from CVH were investigated and the results illustrated that the elevational pattern of orchid species richness in Yunnan was collectively shaped by several mechanisms related to geometric constraints, size of the land area, and environments (Zhang et al., 2015). The research location of above two studies were at county or provincial level, the geocoded locations of Rhododendron specimens in our study is valuable to extract continental climate, altitude, physical and chemical data of soil, or other environmental databases with GIS layer, and extend the research area to the national level. For instance, a continent-wide dataset of occurrence records with geographical coordinates of Australian grasses were used for predicting species’ tolerance to salinity and alkalinity (Saslis-Lagoudakis et al., 2015). An increasing number of plant specimens, especially those with GPS information, have been collected in recent decades. These herbarium specimens can be used to study the plants’ tolerance to abiotic stresses, their phylogenesis, evolution, conservation efforts for endangered plants, effects of climate change or land/forest economy studies assisted by field or experimental work.
Conclusion
Our results showed that information present in herbarium specimens might be used to identify potentially interesting genetic resources in Rhododendron. Geocoding of the Chinese text-based locations of plant specimens into latitude/longitude pairs makes it possible to study plant distribution as well as to connect the distribution data to soil database of the habitats. This approach makes use of a large number of plant samples, which increases the reliability of the obtained results. The combination of geocoded specimen information and the soil database led to identification of valuable resources at taxon level for tolerance against lime soils characterized by a high pH and high CaCO3 concentrations. The predicted tolerant taxa in this study pave the way for an in depth evaluation of potential resources for lime tolerance and in the long term for using genetic material in breeding or studies of abiotic stress. Moreover, the continental-scale dataset with both comprehensive taxonomic coverage and geocoded locations can be connected with other GIS layers such as the WorldClim database3 for ecological or evolutionary researches.
Author Contributions
SW and JVH originally formulated the idea. M-CVL and LL developed methodology. SW performed statistical analyses and wrote the manuscript. All authors edited and approved the final manuscript.
Funding
This work was supported by the Chinese Scholarship Council (201608360101).
Conflict of Interest Statement
The authors declare that the research was conducted in the absence of any commercial or financial relationships that could be construed as a potential conflict of interest.
Acknowledgments
Biodiversity occurrence data were provided by: Chengdu Institute of Biology, Chinese Academy of Sciences; Wuhan Botanical Garden, Chinese Academy of Sciences; Xishuangbanna Tropical Botanical Garden, Chinese Academy of Sciences; Northwest Institute of Plateau Biology, Chinese Academy of Sciences; Guangxi Institute of Botany, Chinese Academy of Sciences; South China Botanical Garden, Chinese Academy of Sciences; Institute of Applied Ecology, Chinese Academy of Sciences; Kunming Institute of Botany, Chinese Academy of Sciences; Lushan Botanical Garden, Jiangxi Province and Chinese Academy of Sciences; Institute of Botany, Jiangsu Province and Chinese Academy of Sciences; Chinese National Herbarium, Institute of Botany, Chinese Academy of Sciences; WUK Herbarium, Northwest Agriculture & Forestry University. [Accessed through Chinese Virtual Herbarium (CVH) data portal, http://www.cvh.ac.cn/ (latest portal: www.cvh.ac.cn), in October, 2016].
Supplementary Material
The Supplementary Material for this article can be found online at: https://www.frontiersin.org/articles/10.3389/fpls.2018.01538/full#supplementary-material
TABLE S1 | The number of specimens for each taxon in 525 Rhododendron taxa.
Footnotes
References
Amtmann, A., Bohnert, H. J., and Bressan, R. A. (2005). Abiotic stress and plant genome evolution. Search New models. Plant Physiol. 138, 127–130. doi: 10.1104/pp.105.059972
Batjes, N., Dijkshoorn, K., Van Engelen, V., Fischer, G., Jones, A., et al. (2012). Harmonized World Soil Database, 1.2 Edn, eds F. Nachtergaele, H. Van Velthuizen, L. Verelst, and D. Wiberg. Rome: Food and Agricultural Organisation of United Nations.
Bergman, E. J., Nieto, F. J., Bersch, A. J., Buckingham, W. R., and Malecki, K. (2012). Using tax parcel data to compare geocoding accuracy of urban and non-urban addresses in Wisconsin. Am. J. Epidemiol. 175, S116–S116.
Demasi, S., Caser, M., Kobayashi, N., Kurashige, Y., and Scariot, V. (2015a). Hydroponic screening for iron deficiency tolerance in evergreen azaleas. Notulae Botanicae Horti Agrobotanici Cluj Napoca 43, 210–213. doi: 10.15835/nbha4319929
Demasi, S., Handa, T., and Scariot, V. (2015b). Ferric chelate reductase activity under iron deficiency stress in azalea. Int. J. Hortic. Floric. 3, 157–160.
Dimichele, W. A., Phillips, T. L., and Olmstead, R. G. (1987). Opportunistic evolution - abiotic environmental-stress and the fossil record of plants. Rev. Pal. Palynol. 50, 151–178. doi: 10.1016/0034-6667(87)90044-3
Esen, D., Zedaker, S. M., Kirwan, J. L., and Mou, P. (2004). Soil and site factors influencing purple-flowered rhododendron (Rhododendron ponticum L.) and eastern beech forests (Fagus orientalis Lipsky) in Turkey. For. Ecol. Manag. 203, 229–240. doi: 10.1016/j.foreco.2004.07.052
Fang, M. Y., Fang, R. Z., He, M. Y., Hu, L. Z., Yang, H. B., et al. (2005). “Rhododendron,” in Flora of China, eds Z. Y. Wu, P. H. Raven, and D. Y. Hong (Beijing: Science Press and Missouri Botanical Garden Press),260–455.
Faure, E., Danjou, A. M. N., Clavel-Chapelon, F., Boutron-Ruault, M. C., and Dossus, L. (2017). Accuracy of two geocoding methods for geographic information system-based exposure assessment in epidemiological studies. Environ. Health 16:1. doi: 10.1186/s12940-017-0217-5
Giel, P., and Bojarczuk, K. (2002). The effect of high concentration of selected calcium salts on development of microcuttings of rhododendron R. ‘Catawbiense Grandiflorum’ in in vitro cultures. Dendrobiology 48,23–29.
Giel, P., and Bojarczuk, K. (2011). Effects of high concentrations of calcium salts in the substrate and its pH on the growth of selected rhododendron cultivars. Acta Soc. Bot. Pol. 80, 105–114. doi: 10.5586/asbp.2011.021
Goldberg, D. W. (2011). Advances in geocoding research and practice. Trans. GIS 15, 727–733. doi: 10.1111/j.1467-9671.2011.01298.x
Goldstein, N. D., Auchincloss, A. H., and Lee, B. K. (2014). A no-cost geocoding strategy using R. Epidemiology 25, 311–313. doi: 10.1097/Ede.0000000000000052
Guo, X., Shang, X. F., Li, B., Zhou, X. Z., and Wen, H. (2017). Acaricidal activities of the essential oil from Rhododendron nivale Hook. f. and its main compound, delta-cadinene against Psoroptes cuniculi. Vet. Parasitol. 236, 51–54. doi: 10.1016/j.vetpar.2017.01.028
Hales, T. C., Ford, C. R., Hwang, T., Vose, J. M., and Band, L. E. (2009). Topographic and ecologic controls on root reinforcement. J. Geophys. Res. Earth Surface 114, F03013. doi: 10.1029/2008jf001168
Hart, R., Salick, J., Ranjitkar, S., and Xu, J. C. (2014). Herbarium specimens show contrasting phenological responses to Himalayan climate. Proc. Natl. Acad. Sci. U.S.A. 111, 10615–10619. doi: 10.1073/pnas.1403376111
James, B. R., and Riha, S. J. (1987). Forest soil organic horizon acidification - effects of temperature, time, and solution soil ratio. Soil Sci. Soc. Am. J. 51, 458–462. doi: 10.2136/sssaj1987.03615995005100020037x
Johnston, R. J., Holland, B. M., and Yao, L. Y. (2016). Individualized geocoding in stated preference questionnaires: implications for survey design and welfare estimation. Land Econ. 92, 737–759. doi: 10.3368/le.92.4.737
Kabala, C., Musztyfaga, E., Galka, B., Labunska, D., and Manczynska, P. (2016). Conversion of soil pH 1:2.5 KCl and 1:2.5 H2O to 1:5 H2O: Conclusions for soil management, environmental monitoring, and international soil databases. Polish J. Environ. Stud. 25, 647–653. doi: 10.15244/pjoes/61549
Kaisheva, M. V. (2006). The Effect of Metals and Soil pH on the Growth of Rhododendron and Other Alpine plants in Limestone Soil. Doctoral thesis, University of Edinburgh, London.
Kamei, J., Pandey, H. N., and Barik, S. K. (2009). Tree species distribution and its impact on soil properties, and nitrogen and phosphorus mineralization in a humid subtropical forest ecosystem of northeastern India. Can. J. For. Res. Rev. Canadienne De Recherche Forestiere 39, 36–47. doi: 10.1139/X08-151
Kinsman, D. J. J. (1999). Rhododendrons in yunnan, China - pH of associated soils. J. Am. Rhododendr. Soc. Available at: https://scholar.lib.vt.edu/ejournals/JARS/v54n3/v54n3-mcaleese.htm
Kumar, P. (2012). Assessment of impact of climate change on Rhododendrons in Sikkim Himalayas using Maxent modelling: limitations and challenges. Biodiv. Conserv. 21, 1251–1266. doi: 10.1007/s10531-012-0279-1
Liu, J. Q., Duan, Y. W., Hao, G., Ge, X. J., and Sun, H. (2014). Evolutionary history and underlying adaptation of alpine plants on the Qinghai-Tibet Plateau. J. Syst. Evol. 52, 241–249. doi: 10.1111/jse.12094
Marais, D. L. D., and Juenger, T. E. (2010). Pleiotropy, plasticity, and the evolution of plant abiotic stress tolerance. Year Evol. Biol. 1206, 56–79. doi: 10.1111/j.1749-6632.2010.05703.x
McAleese, A. J., and Rankin, D. W. H. (2000). Growing rhododendrons on limestone soils: is it really possible? J. Am. Rhododendr. Soc. 54, 126–134.
Mengel, K. (1994). Iron availability in plant tissues-iron chlorosis on calcareous soils. Plant Soil 165, 275–283. doi: 10.1007/BF00008070
Milne, R. I., Davies, C., Prickett, R., Inns, L. H., and Chamberlain, D. F. (2010). Phylogeny of Rhododendron subgenus Hymenanthes based on chloroplast DNA markers: between-lineage hybridisation during adaptive radiation? Plant Syst. Evol. 285, 233–244. doi: 10.1007/s00606-010-0269-2
Moeltner, K., Blinn, C. E., and Holmes, T. P. (2017). Forest pests and home values: the importance of accuracy in damage assessment and geocoding of properties. J. For. Econ. 26, 46–55. doi: 10.1016/j.jfe.2017.02.002
Mordhorst, A. P., Kullik, C., and Preil, W. (1993). Ca uptake and distribution in Rhododendron selected for lime tolerance. Gartenbauwissenschaft 58,111–116.
Nuvolone, D., Santini, M., Pepe, P., and Cipriani, F. (2016). Impacts of geocoding quality in environmental epidemiology studies: two case-studies in Tuscany Region (Central Italy). Epidemiol. Prev. 40, 44–50. doi: 10.19191/EP16.1.P044.013
Reid, M. S., Dodge, L. L., and Zagory, E. M. (1998). High pH tolerant rootstocks for rhododendrons and azaleas. Slosson Rep. 3, 96–98.
Romeiras, M. M., Figueira, R., Duarte, M. C., Beja, P., and Darbyshire, I. (2014). Documenting biogeographical patterns of African Timber species using herbarium records: A conservation perspective based on native trees from Angola. PLoS One 9:e103403. doi: 10.1371/journal.pone.0103403
Saslis-Lagoudakis, C. H., Hua, X., Bui, E., Moray, C., and Bromham, L. (2015). Predicting species’ tolerance to salinity and alkalinity using distribution data and geochemical modelling: a case study using Australian grasses. Ann. Bot. 115, 343–351. doi: 10.1093/aob/mcu248
Shrestha, N., Su, X. Y., Xu, X. T., and Wang, Z. H. (2018). The drivers of high Rhododendron diversity in south-west China: does seasonality matter? J. Biogeogr. 45, 438–447. doi: 10.1111/jbi.13136
Shujun, Y., Ximing, C., and Jeongsik, L. E. E. (2008). Alkali tolerance of Rhododendron fortunei in subirrigated ebb & flow bench systems with hydroponics. Acta Hortic. Sin. 35, 715–720.
Tian, Q., Ren, F., Hu, T., Liu, J. T., and Li, R. C. (2016). Using an optimized Chinese address matching method to develop a geocoding service: a case study of Shenzhen, China. ISPRS Int. J. Geo Inf. 5:65. doi: 10.3390/ijgi5050065
Valentinuzzi, F., Mimmo, T., Cesco, S., Al Mamun, S., and Santner, J. (2015). The effect of lime on the rhizosphere processes and elemental uptake of white lupin. Environ. Exp. Bot. 118, 85–94. doi: 10.1016/j.envexpbot.2015.06.010
Vicherova, E., Hajek, M., and Hajek, T. (2015). Calcium intolerance of fen mosses: Physiological evidence, effects of nutrient availability and successional drivers. Persp. Plant Ecol. Evol. Syst. 17, 347–359. doi: 10.1016/j.ppees.2015.06.005
Wang, X. J., Tang, C. X., Severi, J., Butterly, C. R., and Baldock, J. A. (2016). Rhizosphere priming effect on soil organic carbon decomposition under plant species differing in soil acidification and root exudation. New Phytol. 211, 864–873. doi: 10.1111/nph.13966
Wen, J. (1999). Evolution of eastern Asian and eastern North American disjunct distributions in flowering plants. Annu. Rev. Ecol. Syst. 30, 421–455. doi: 10.1146/annurev.ecolsys.30.1.421
Xing, Y. W., Gandolfo, M. A., and Linder, H. P. (2015). The Cenozoic biogeographical evolution of woody angiosperms inferred from fossil distributions. Glob. Ecol. Biogeogr.24, 1290–1301. doi: 10.1111/geb.12383
Xu, L. H., Li, Q. R., and Jiang, C. L. (1996). Diversity of soil actinomycetes in Yunnan. China. Appl. Environ. Microbiol. 62, 244–248.
Yan, L. J., Liu, J., Moller, M., Zhang, L., and Zhang, X. M. (2015). DNA barcoding of Rhododendron (Ericaceae), the largest Chinese plant genus in biodiversity hotspots of the Himalaya-Hengduan Mountains. Mol. Ecol. Resour. 15, 932–944. doi: 10.1111/1755-0998.12353
Yuan, Z. L., Wei, B. L., Chen, Y., Jia, H. R., and Wei, Q. N. (2018). How do similarities in spatial distributions and interspecific associations affect the coexistence of Quercus species in the Baotianman National Nature Reserve. Henan, China. Ecol. Evol. 8, 2580–2593. doi: 10.1002/ece3.3863
Keywords: Rhododendron, lime tolerance, pH, calcium carbonate, herbarium specimen, geocoding
Citation: Wang S, Leus L, Van Labeke M-C and Van Huylenbroeck J (2018) Prediction of Lime Tolerance in Rhododendron Based on Herbarium Specimen and Geochemical Data. Front. Plant Sci. 9:1538. doi: 10.3389/fpls.2018.01538
Received: 21 June 2018; Accepted: 28 September 2018;
Published: 23 October 2018.
Edited by:
Erik T. Nilsen, Virginia Tech, United StatesReviewed by:
Juliana S. Medeiros, The Holden Arboretum, United StatesRobbie Hart, Missouri Botanical Garden, United States
Copyright © 2018 Wang, Leus, Van Labeke and Van Huylenbroeck. This is an open-access article distributed under the terms of the Creative Commons Attribution License (CC BY). The use, distribution or reproduction in other forums is permitted, provided the original author(s) and the copyright owner(s) are credited and that the original publication in this journal is cited, in accordance with accepted academic practice. No use, distribution or reproduction is permitted which does not comply with these terms.
*Correspondence: Shusheng Wang, c2h1c2hlbmcud2FuZ0BpbHZvLnZsYWFuZGVyZW4uYmU=
 Shusheng Wang
 Leen Leus
 Marie-Christine Van Labeke
 Johan Van Huylenbroeck