 Danilo Augusto Sforça1
 Sonia Vautrin2
 Claudio Benicio Cardoso-Silva1
 Melina Cristina Mancini1
 María Victoria Romero-da Cruz1
 Guilherme da Silva Pereira3Mônica Conte1
 Arnaud Bellec2Nair Dahmer1Joelle Fourment2
 Nathalie Rodde2
 Marie-Anne Van Sluys4
 Renato Vicentini1
 Antônio Augusto Franco Garcia3Eliana Regina Forni-Martins1
 Monalisa Sampaio Carneiro5
 Hermann Paulo Hoffmann5
 Luciana Rossini Pinto6Marcos Guimarães de Andrade Landell6Michel Vincentz1
 Helene Berges2
 Anete Pereira de Souza1*
- 1Universidade Estadual de Campinas (UNICAMP), Campinas, Brazil
- 2Centre National de Ressources Genomiques Vegetales (CNRGV), Institut National de la Recherche Agronomique (INRA), Castanet Tolosan, France
- 3Escola Superior de Agricultura Luiz de Queiroz (ESALQ), USP, Piracicaba, Brazil
- 4Instituto de Biociências, Universidade de São Paulo (USP), São Paulo, Brazil
- 5Centro de Ciências Agrárias, Universidade Federal de São Carlos (UFSCAR), Araras, Brazil
- 6Centro de Cana, Instituto Agronômico de Campinas (IAC), Ribeirão Preto, Brazil
Sugarcane (Saccharum spp.) is highly polyploid and aneuploid. Modern cultivars are derived from hybridization between S. officinarum and S. spontaneum. This combination results in a genome exhibiting variable ploidy among different loci, a huge genome size (~10 Gb) and a high content of repetitive regions. An approach using genomic, transcriptomic, and genetic mapping can improve our knowledge of the behavior of genetics in sugarcane. The hypothetical HP600 and Centromere Protein C (CENP-C) genes from sugarcane were used to elucidate the allelic expression and genomic and genetic behaviors of this complex polyploid. The physically linked side-by-side genes HP600 and CENP-C were found in two different homeologous chromosome groups with ploidies of eight and ten. The first region (Region01) was a Sorghum bicolor ortholog region with all haplotypes of HP600 and CENP-C expressed, but HP600 exhibited an unbalanced haplotype expression. The second region (Region02) was a scrambled sugarcane sequence formed from different noncollinear genes containing partial duplications of HP600 and CENP-C (paralogs). This duplication resulted in a non-expressed HP600 pseudogene and a recombined fusion version of CENP-C and the orthologous gene Sobic.003G299500 with at least two chimeric gene haplotypes expressed. It was also determined that it occurred before Saccharum genus formation and after the separation of sorghum and sugarcane. A linkage map was constructed using markers from nonduplicated Region01 and for the duplication (Region01 and Region02). We compare the physical and linkage maps, demonstrating the possibility of mapping markers located in duplicated regions with markers in nonduplicated region. Our results contribute directly to the improvement of linkage mapping in complex polyploids and improve the integration of physical and genetic data for sugarcane breeding programs. Thus, we describe the complexity involved in sugarcane genetics and genomics and allelic dynamics, which can be useful for understanding complex polyploid genomes.
Introduction
The Saccharum species are C4 grasses and present a high level of ploidy. S. officinarum L. is an octaploid (2n = 80) with x = 10 chromosomes, while S. spontaneum L. has x = 8 but presents great variations in the number of chromosomes, with main the cytotypes of 2n = 62, 80, 96, 112, or 128. Modern sugarcane cultivars originated from hybridization between these two species (Daniels and Roach, 1987; Paterson et al., 2013). The development of these cultivars involved the process of “nobilization” of the hybrid, with successive backcrosses using S. officinarum as the recurrent parent (D'Hont et al., 1998). The resulting hybrids are highly polyploid and aneuploid (Irvine, 1999; D'Hont and Glaszmann, 2001; Grivet and Arruda, 2002) and have an estimated whole-genome size of 10 Gb (D'Hont and Glaszmann, 2001). An in situ hybridization study has shown that the genomes of the commercial hybrids consist of 10–20% chromosomes from S. spontaneum and 5–17% recombinant chromosomes between the two species, while the remaining majority of the genome consists of chromosomes from S. officinarum (Piperidis and D'Hont, 2001; D'Hont, 2005).
Molecular evidence suggests that polyploid genomes can present dynamic changes in DNA sequences and gene expression, probably in response to genomic shock (genomic remodeling due to the activation of previously deleted heterochromatic elements), and this phenomenon is implicated in epigenetic changes in homologous genes due to intergenomic interactions (McClintock, 1984). The evolutionary success of polyploid species is related to their ability to present greater phenotypic novelty than is observed in their diploid counterparts or even absent in parents (Ramsey and Schemske, 2002). Among other factors, this increase in the capacity for phenotypic variation capacity may be caused by regulation of the allelic dosage (Birchler et al., 2005).
The Brazilian sugarcane variety SP80-3280 is derived from a cross between the varieties SP71-1088 × H57-5028 and is resistant to brown rust caused by Puccinia melanocephala (Landell et al., 2005). SP80-3280, which is one of the main Brazilian cultivars (Manechini et al., 2018), was chosen for transcriptome sequencing by SUCEST-FUN (Vettore et al., 2003) and RNAseq (Cardoso-Silva et al., 2014; Nishiyama et al., 2014; Mattiello et al., 2015). Biparental crossing of SP80-3280 has also been used to analyze rust resistance (Balsalobre et al., 2016), quantitative trait loci (QTL) mapping (Costa et al., 2016), and genotyping by sequencing (GBS) (Balsalobre et al., 2017). A Brazilian initiative (Souza et al., 2011) is producing a gene-space genome sequence from SP80-3280, and a draft sugarcane genome based on whole-genome shotgun sequencing was produced (Riaño-Pachón and Mattiello, 2017). Additionally, QTL gene synteny from sorghum has been used to map corresponding bacterial artificial chromosomes (BACs) in SP80-3280 (Mancini et al., 2018).
Three BAC libraries for different sugarcane varieties have been constructed. The oldest one is for the French variety R570 (Tomkins et al., 1999) and contains 103,296 clones with an average insert size of 130 kb, representing 1.2 total genome equivalents. A mix of four individuals derived from the self-fertilization of the elite cultivar R570 (pseudo F2) was reported by Le Cunff et al. (2008) and contains 110,592 clones with an average insert size of 130 kb, representing 1.4x coverage of the whole genome. Additionally, a SP80-3280 library published by Figueira et al. (2012) contains 36,864 clones with an average insert size of 125 kb, representing 0.4 total genome equivalents of coverage.
Sugarcane and sorghum [Sorghum bicolor (L.) Moench] share a high level of collinearity, gene structure and sequence conservation. de Setta et al. (2014) contributed to understanding the euchromatic regions from R570 and a few repetitive-rich regions, such as centromeric and ribosomal regions, as well as defining a basic transposable element dataset. The genomic similarity between sugarcane and sorghum has been frequently used to characterize the sugarcane genome (Jannoo et al., 2007; Garsmeur et al., 2011, 2018; Vilela et al., 2017; Mancini et al., 2018), demonstrating the high synteny of sugarcane × sorghum and the high gene structure retention among the different sugarcane homeologs. Additionally, these works contribute to understanding the genomic and evolutionary relationships among important genes in sugarcane using BAC libraries.
Genome organization and expression dynamics are poorly understood in complex polyploid organisms, such as sugarcane, mainly because reconstructing large and complex regions of the genome is a challenge. However, an intriguing question is how such a complex genome can function while handling different copy numbers of genes, different allelic dosages and different ploidies of its homo/homeolog groups. To address this question, we investigated two physically linked genes: an unknown function gene HP600 with a single copy in the diploid grass group (OrthoDB, Kriventseva et al., 2018) and the gene CENP-C (Centromere Protein C, Talbert et al., 2004; Gopalakrishnan et al., 2009; Kato et al., 2013; Sandmann et al., 2017), involved in cell division, localized next to HP600. We examined the genome, transcriptome, evolutionary patterns and genetic interactions/relationships of HP600 and CENP-C in a genomic region from the SP80-3280 sugarcane variety (a Saccharum hybrid). First, we defined the genome architecture and evolutionary relationships of HP600 and CENP-C in detail. Second, we used the sugarcane SP80-3280 transcriptome to investigate transcription interactions in each gene (HP600 and CENP-C). Ultimately, we used molecular markers developed from these genes to genotype a segregating population and construct a linkage map and compare it with the physical map.
Materials and Methods
Plant Material
The sugarcane varieties were collected from germplasms from the Sugarcane Plant Breeding Program at the active site located in the Agronomic Institute of Campinas (IAC) Sugarcane Center in Ribeirão Preto, São Paulo, Brazil. The youngest leaves from one plant each of SP80-3280 and SPIAC93-3046 were collected from adult plants and immediately stored on dry ice for transportation and finally stored at −80°C until use. These leaves were used for BAC library construction. For the cytogenetic experiments, IACSP95-3018, IACSP93-3046, RB835486, SP80-3280, and SP81-3250 internodes were collected from adult plants. The internodes were placed in cotton soaked in water and left to root. Root tips were collected when they reached 5–15 mm.
Sequence Analysis and Gene Annotation
The BAC library construction, BAC selection and BAC assembly are described in Supplementary Material. All the BACs were aligned to verify the presence of redundant homeolog sequences. BAC clones with more than 99% similarity were considered the same homeolog. BACs that represented the same homeologs were not combined. The BACs were annotated with the gene prediction programs EUGENE (Sylvain et al., 2008) and Augustus (Keller et al., 2011). The BAC sequences were also searched for genes with BLASTN and BLASTX against the transcripts from the SUCEST-FUN database (http://sucest-fun.org/; Vettore et al., 2003), the CDS of S. bicolor, Z. mays, and O. sativa from Phytozome v12.0 Goodstein et al., 2012 and the transcripts published by Cardoso-Silva et al. (2014). The BACs were also subjected to BLASTX against Poaceae proteins. The candidate genes were manually annotated using S. bicolor, O. sativa, and Z. mays CDS. The sequences with more than 80% similarity and at least 90% coverage were annotated as genes.
Repetitive content in the BAC clone sequences was identified with the web program LTR_FINDER (Xu and Wang, 2007). Afterward, the BAC sequences were tested by CENSOR (Kohany et al., 2006) against Poaceae (Supplementary Material 2).
The phylogenic trees were built by the Neighbor-Joining method (Saitou and Nei, 1987) with nucleic distances calculated with the Jukes-Cantor model (Jukes and Cantor, 1969) in the MEGA 7 software (Kumar et al., 2016). The Kimura 2-parameter (Kimura, 1980) was used as the distance mode.
Duplication Divergence Time
The gene contents of HP600 and CENP-C in the duplication regions were compared, and the distance “d” for coding regions was determined by Nei-Gojobori with Jukes-Cantor, which is available in the MEGA 7 software (Kumar et al., 2016). The divergence times of the sequences shared by the duplicated regions in the BACs were estimated by T = d/2r. The duplicated sequences were used to calculate the pairwise distances (d), and “r” was replaced by the mutation rate of 6.5 × 10⁻⁹ mutations per site per year as proposed by Gaut et al. (1996). For the whole duplication, the distance “d” for noncoding regions was determined with the Kimura 2-parameter model and a mutation rate of 1.3 × 10⁻⁸ mutations per site per year as described by Ma and Bennetzen (2004).
The insertion ages of the long terminal repeat (LTR) retrotransposons were estimated based on the accumulated number of substitutions between the two LTRs (d) (SanMiguel et al., 1998) using a mutation rate of 1.3 × 10⁻⁸ mutations per site per year as described by Ma and Bennetzen (2004).
Gene Expression
The transcriptomes of the sugarcane variety SP80-3280 from the roots, shoots and stalks were mapped on HP600 and CENP-C (NCBI SRR7274987). The reads from the sugarcane transcriptomes were mapped to a reference gene with the Bowtie2 software 2.2.5 (Langmead and Salzberg, 2012) with default parameters; low-quality reads and unmapped reads were filtered out (SAMtools -b -F 4), bam files were sorted (SAMtools sort), and only mapped reads to the genes were extracted from the bam files (SAMtools fastq) and recorded in a FASTQ format file.
The resulting reads mapped in the reference gene sequence of HP600 and CENP-C were mapped against each gene haplotype with 100% identity. A haplotype was considered to be expressed when the transcript reads covered the entire gene or mapped exclusively to haplotype SNPs. SNPs not found in the dataset were searched in the SP80-3280 transcriptomes from Vettore et al. (2003), Talbert et al. (2004), and Cardoso-Silva et al. (2014) to verify the SNP presence in transcripts, but they were not used in the expression analysis.
To test whether the haplotypes had the same proportional ratio in the genome and transcriptome, the transcriptomes were mapped against one haplotype of the HP600 and one of the CENP-C with a 90% similarity in Region01. The SNPs found in the transcripts were identified and the coverage and raw variant reads count was used to verify the presence of SNPs not found in BACs. An SNP was considered present in the transcripts if it was represented by at least six transcriptome reads (Kim et al., 2016).
We assumed that one haplotype from each region was missing in the BAC clone data and tested the following two genomic frequencies for comparison with the transcriptome sequences: (1) the missing haplotype had the more common SNP, and (2) the missing haplotype had the variant SNP. When the SNP was not found in the genomic data, we assumed that only the missing haplotype contained the variant SNP.
The frequency of the genomic data was used to test the transcriptome data with R Studio Team (2015) and the exact binomial test [binom.test—(Clopper and Pearson, 1934; Conover, 1971; Hollander et al., 1973)]. A p ≥ 0.05 is equivalent to a 95% confidence interval for considering the genomic ratio equal to the transcriptome ratio.
Chromosome Number Determination and BAC-FISH
The chromosome number was performed as described by Guerra (1983) with root tips that were 5–15 mm in length and treated with 5 N HCl for 20 min. The slides were stained with 2% Giemsa for 15 min. Chromosome number was performed for the SP80-3280, SP81-3250, RB83-5486, IACSP95-3018, and IACSP93-3046 varieties. CMA/DAPI coloration was performed by enzymatic digestion as described by Guerra and Souza (2002). The slides were stained with 10 μg/ml DAPI for 30 min and 10 μg/ml CMA for 1 h. Afterwards, the slides were stained with 1:1 glycerol/McIlvaine buffer and visualized.
BAC-FISH was performed using the SP803280 variety. For the mitotic chromosome preparations, root tips that were 5–15 mm in length were collected and treated in the dark with p-dichlorobenzene-saturated solution at room temperature for 2 h, fixed in a freshly prepared 3:1 mixture (ethanol:glacial acetic acid) at 4°C for 24 h and stored at −20°C until use. After being washed in water, the root tips were digested with the following enzyme solution: 2% cellulase (w/v) (Serva, Heidelberg, Baden-Wurtemberg State, Germany), 20% pectinase (v/v) (Sigma, Munich, Baviera State, Germany), and 1% Macerozyme (w/v) (Sigma) at 37°C for 1–2 h (Schwarzacher et al., 1980). The meristems were squashed in a drop of 45% acetic acid and fixed in liquid nitrogen for 15 min. After air-drying, slides with good metaphase chromosome spreads were stored at −20°C.
The Shy064N22 and Shy048L15 BACs, both from the BAC library for the SP80-3280 variety, were used as probes. The probes were labeled with digoxigenin-11-dUTP (Roche) by nick translation. Bacterial artificial chromosome-fluorescence in situ hybridization (BAC-FISH) was performed as described by Schwarzacher and Heslop-Harrison (2000) with minor modifications. The Cot-100 fraction of the SP80-3280 sugarcane variety genomic DNA, which was used to block repetitive sequences, was prepared according to Zwick et al. (1997). Preparations were counterstained and mounted with 2 μg/ml DAPI in Vectashield (Vector, Burlingame, CA, USA).
The sugarcane metaphase chromosomes were observed and photographed, depending on the procedure, with transmitted light or epifluorescence under an Olympus BX61 microscope equipped with the appropriate filter sets (Olympus, Shinjuku-ku, Tokyo, Japan) and a JAI® CV-M4 + CL monochromatic digital camera (JAI, Barrington, N.J., USA). Digital images were imported into Photoshop 7.0 (Adobe, San Jose, Calif., USA) for pseudocoloration and final processing.
Genetic Map Construction
The BAC haplotypes were used to identify 44 sugarcane SNPs in the HP600 and CENP-C exons. The SNP genotyping method was based on MALDI-TOF analysis performed on a mass spectrometer platform from Sequenom Inc.,® as described by Garcia et al. (2013). The mapping population consisted of 151 full siblings derived from a cross between the SP80-3280 (female parent) and RB835486 (male parent) sugarcane cultivars, and the genetic map was constructed as described by Balsalobre et al. (2017) using SuperMASSA software (Serang et al., 2012). The SuperMASSA software calculates all possible ploidies for a locus and produces the most likely ploidy.
Results
Relationship Between Region01 and Region02
Annotation of HP600 and CENP-C in the 16 BAC haplotypes revealed two groups of BACs. One group had the expected exon/intron organization compared with S. bicolor HP600 (five exons in sorghum) and CENP-C (14 exons in sorghum). This region was further designated as Region01 (see Supplementary Table 1, Supplementary Material - 10 BACs and 7 haplotypes—Figure 1 - haplotype I to haplotype VII). The other group was found to have fewer exons than expected (compared with S. bicolor) for both HP600 and CENP-C and was designated Region02 (see Supplementary Table 1, Supplementary Material−13 BACs and 9 haplotypes—Figure 1 - haplotype VIII to haplotype XVI).
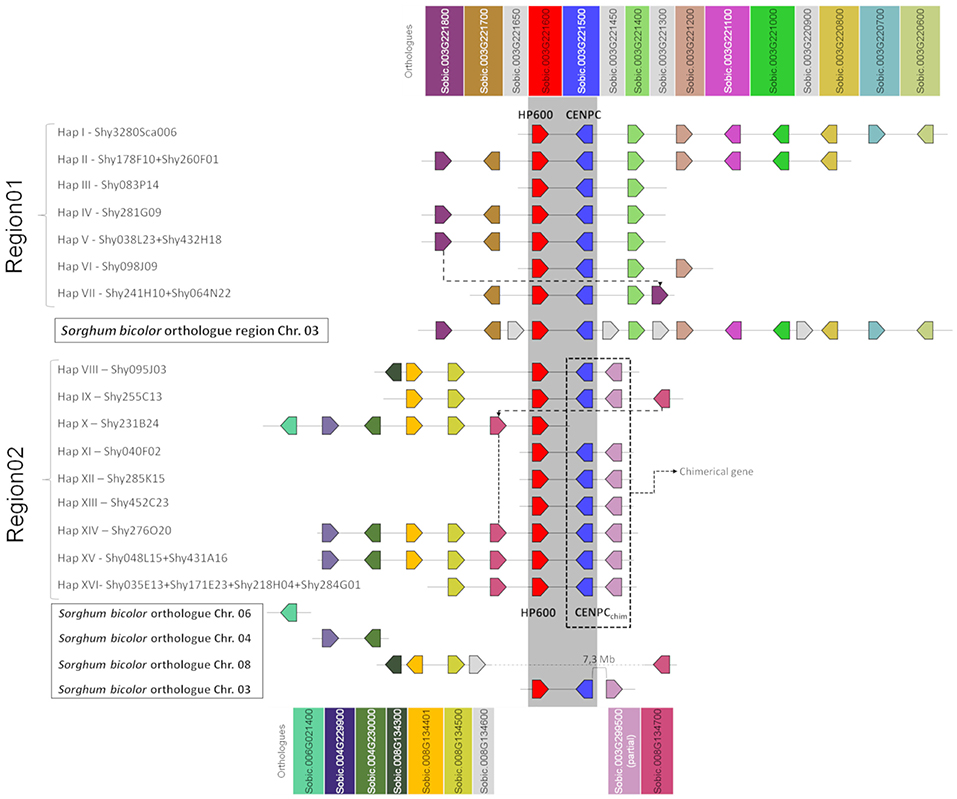
Figure 1. Schematic representation of the sugarcane BAC haplotypes from Region01 and Region02. Squares of the same color represent sugarcane genes orthologous to Sorghum bicolor genes. Dotted lines connect the homologous genes in sugarcane at different positions. In sugarcane Region02, the CENP-C haplotypes in Region02 are represented by two squares (blue and pink), where each square represents a partial gene fusion. The dark gray strip represents the shared region from Region01 and Region02 (duplication). The genes in light gray (from S. bicolor) are not found in the sugarcane BACs. The representation is not to scale. The orientation of transcription is indicated by the direction of the arrow at the end of each gene.
A comparison of the BAC haplotypes from Region01 and Region02 revealed an 8-kb shared region in sugarcane. The 8-kb duplication spanned from the last three exons of HP600 to the last seven exons of CENP-C. HP600 and CENP-C were physically linked, but the orientation of the genes was opposite (see Supplementary Figure 2B). A phylogenetic tree was constructed to examine the relationships among this 8-kb region (see Supplementary Figure 2A). The orthologous region from S. bicolor was used as an outgroup, and the separation in the two groups (Region01 and Region02) suggests that the shared 8-kb sequence appeared as a consequence of a sugarcane-specific duplication.
Region01 BACs exhibited high gene collinearity with S. bicolor. However, in the BAC haplotype VII, a change in gene order involving the sorghum orthologs Sobic.003G221800 and Sobic.003G221400 was observed (Figure 1, dotted line). Sobic.003G221800 is missing in this position from haplotypes I, II, and VI. Region01 and Region02, except for the genes HP600 and CENP-C, contain different sorghum orthologous genes (Figure 1). Region02 was found to be non-collinear with S. bicolor (Figures 1, 2), which reinforces the notion of a specific duplication in sugarcane. Region02 appeared as a mosaic formed by different sorghum orthologous genes distributed in different chromosomes and arose by duplication after the separation of sorghum and sugarcane.
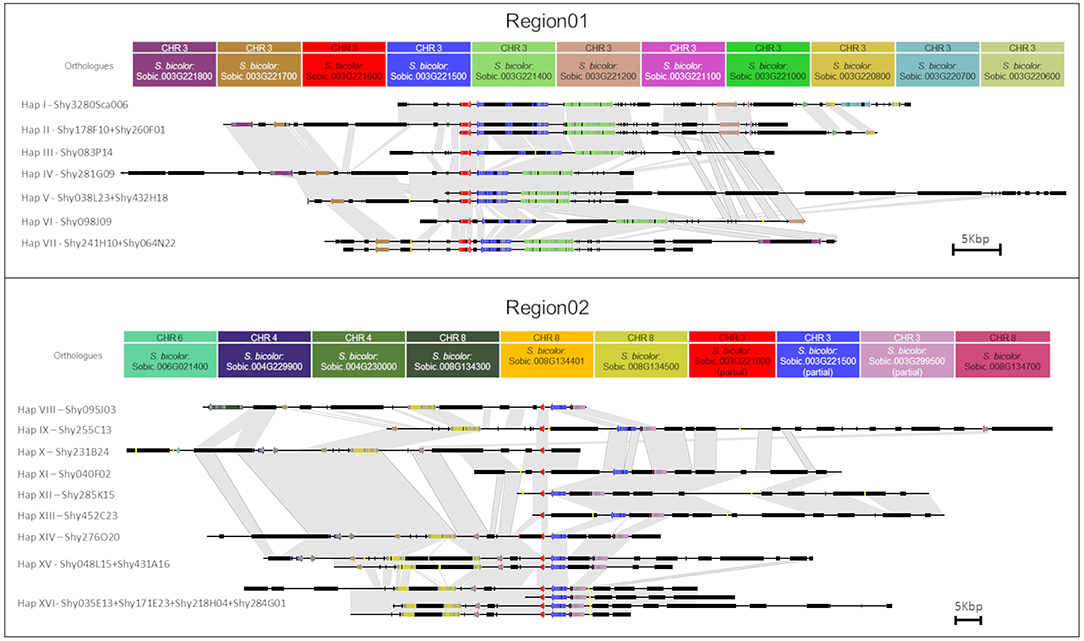
Figure 2. Representation of each sugarcane BAC from Region01 and Region02. Arrows and rectangles of the same color represent the homologous genes in sugarcane. Black rectangles represent repeat regions. Yellow lines represent gaps. Similar regions are represented by a gray shadow connecting the BACs. The orientation of transcription is indicated by the direction of the arrow at the end of each gene. Scale representation.
In Region02, the Sobic.008G134300 orthologous gene was found only in haplotype VIII, and the Sobic.008G134700 ortholog was found in a different position in haplotype IX (Figure 1, dotted line in Region02 and Figure 2). The phylogenetic analysis of Sobic.008G134700 and sugarcane orthologs demonstrated that sugarcane haplotype IX is more closely related to sorghum than to other sugarcane homeologs (see Supplementary Figure 3). Additionally, the orientation of transcription of the Sobic.008G134700 ortholog in haplotype IX is opposite that of the other sugarcane haplotypes (Figures 1, 2). This finding suggests that this gene could be duplicated (paralogs) or translocated (orthologs) in haplotypes X, XIV, XV, and XVI. No S. bicolor orthologous region that originated from Region02 could be determined, as it contained genes from multiple sorghum chromosomes.
Twenty LTR retrotransposons were located in the two regions, but no LTR retrotransposons were shared among the haplotypes from Region01 and Region02. The oldest LTR retrotransposon insertions were dated from 2.3 Mya (from haplotype VIII from Region02, a DNA/MuDR transposon, similar to MUDR1N_SB). Four LTR retrotransposons, localized in the non-shared duplicated region similar to RLG_scAle_1_1-LTR, had identical sequences (Region01: Sh083P14_TE0360—haplotype III and Sh040F02_TE0180—haplotype XI; Region02: Sh285K15_TE0060—haplotype XII and Sh452C23_TE0090—haplotype XIII).
To estimate the genomic diversity in sugarcane haplotypes from both regions (analyzed together and separately), the shared 8-kb region (duplication) was used (see Supplementary Table 4), and the SNPs were identified. The diversity in the HP600 and CENP-C genes was analyzed, and one SNP was observed every 43 bases (Region02) and 70 bases (Region01). We searched for SNPs that could distinguish each region (see Supplementary Table 5) in the HP600 and CENP-C genes, and one SNP was found for every 56 bases (20 SNPs in total). Additionally, small (3–10 bases) and large (30–200 bases) insertions were found.
HP600 and CENP-C Haplotypes and Phylogenetics
Gene haplotypes, i.e., genes with the same coding sequences (CDSs), from HP600 and CENP-C that have the same coding sequence (i.e., exons) in different BAC haplotypes were considered the same gene haplotype. In Region01, four haplotypes of HP600 were identified. In sorghum, the size of HP600 is 187 amino acids (561 base pairs). HP600 has two different sizes in sugarcane haplotypes: one of 188 amino acids (564 base pairs—haplotype I/II/VI, haplotype IV/V and haplotype VII) and another of 120 amino acids (360 base pairs—haplotype III). The HP600 haplotype III has a base deletion at position 77, causing a frameshift that results in a premature stop codon.
In Region02, HP600 exhibited the following six haplotypes: haplotype VIII, haplotype IX, haplotype X/XI/XII/XIII/XIV, haplotype XV, and haplotype XVI. HP600 haplotype IX carried an insertion of eight bases in the last exon that caused a frameshift.
In S. bicolor, CENP-C is formed by 14 exons (Talbert et al., 2004) encoding 694 amino acids (2,082 base pairs). In sugarcane, the haplotypes from Region01 had 14 exons that gave rise to a 708 or 709 amino acid (2,124 or 2,127 bases) protein. Talbert et al. (2004) described two haplotypes in sugarcane EST clones (Vettore et al., 2003), CENP-C1, and CENP-C2, which correspond to haplotypes I/II and IV/V, respectively. In addition to CENP-C1 and CENP-C2, three other CENP-C haplotypes were observed, including haplotype III, haplotype VI, and haplotype VIII.
In Region02, the sugarcane duplication of CENP-C consisted of the last seven exons (exons 8–14 from CENP-C in Region01), and the following six haplotypes were found: haplotype VIII, haplotype IX, haplotypes XI/XII/XIII, haplotype XIV, haplotype XV, and haplotype XVI. The haplotype X BAC sequence finished before the CENP-C gene (Figure 1).
To reconstruct a phylogenetic tree for HP600 and CENP-C from both regions, the orthologs from O. sativa and Zea mays L. were searched. The rice HP600 and CENP-C orthologs, LOC_Os01g43060 and LOC_Os01g43050, respectively, were recovered. Maize has gone through tetraploidization since its divergence from sorghum ~12 million years ago (Woodhouse et al., 2010). The maize HP600 ortholog search returned the following three possible genes with high similarity: GRMZM2G114380 (chromosome 03), GRMZM2G018417 (chromosome 01), and GRMZM2G056377 (chromosome 01). The CENP-C maize ortholog search returned the following three possible genes with high similarity: GRMZM2G114315 (chromosome 03), GRMZM2G134183 (chromosome 03), and GRMZM2G369014 (chromosome 01).
Two phylogenetic trees were constructed (see Supplementary Figure 4), one for HP600 (see Supplementary Figure 4A) and the other for CENP-C (see Supplementary Figure 4B), using sugarcane HP600 and CENP-C haplotypes from both regions. The results demonstrated that the haplotypes from Region01 and Region02 are more similar to themselves than they are to those of sorghum or rice.
The divergence times among sugarcane HP600 haplotypes and sorghum ranged from 1.5 to 4.5 Mya. For CENP-C, the haplotype divergence time rates were 0.3–0.7 Mya, and the comparison with sorghum indicated 4.2–4.5 Mya for the highest values. The estimated sugarcane x sorghum divergence time was 5 Mya (Ming et al., 1998) to 8–9 Mya (Jannoo et al., 2007; Zhang et al., 2018a).
Chromosome Number Determination and BAC-FISH
The determination of the range of CENP-C and HP600 loci that are present in the sugarcane genome was performed using in situ hybridization. First, the number of chromosomes in the SP80-3280 sugarcane variety was defined, but the number of clear and well-spread metaphases for the SP80-3280 variety was < 10 for each chromosome number (see Supplementary Table 6). We expanded the analysis to four more sugarcane varieties (SP81-3250, RB835486, IACSP95-3018, and IACSP93-3046) to improve the conclusions (see Supplementary Figures 5A–E and Supplementary Table 6). The most abundant number of chromosomes was 2n = 112 (range: 2n = 98–2n = 118 chromosomes). The chromosome number for the Saccharum hybrid cultivar SP80-3280 was found to be 2n = 112 (range: 2n = 108–2n = 118 chromosomes—see Supplementary Table 6). Vieira et al. (2018) also identified 2n = 112 chromosomes in the IACSP93-3046 variety.
As a second step, we used two varieties with the best chromosome spreads, i.e., IACSP93-3046 and IACSP95-3018, for the CMA/DAPI banding patterns (see Supplementary Figures 5F–I). The IACSP93-3046 variety exhibited at least six terminal CMA+/DAPI− bands, one chromosome with CMA+/DAPI° and two chromosomes with adjacent intercalations of CMA+ and DAPI+ in the same chromosome (see Supplementary Figures 5F,G). The IACSP95-3018 variety revealed seven terminal CMA+/DAPI− bands, and at least two chromosomes exhibited adjacent CMA+ and DAPI+, one of which was in the intercalary position and the other was in the terminal position (see Supplementary Figures 5H,I).
Finally, we performed BAC-FISH in the better metaphases from the SP80-3280 variety using Shy064N22 (haplotype VII) from Region01; 64 metaphases with some signal of hybridization were obtained, while 69 were obtained for the BAC-FISH of Shy048L15 (haplotype XI) from Region02. At least six metaphases for each region were used to determine the number of signals. For BAC Shy064N22 Region01, eight signals could be counted (Figure 3A), and for BAC Shy048L15 in Region02, 10 signals could be defined (Figure 3B).
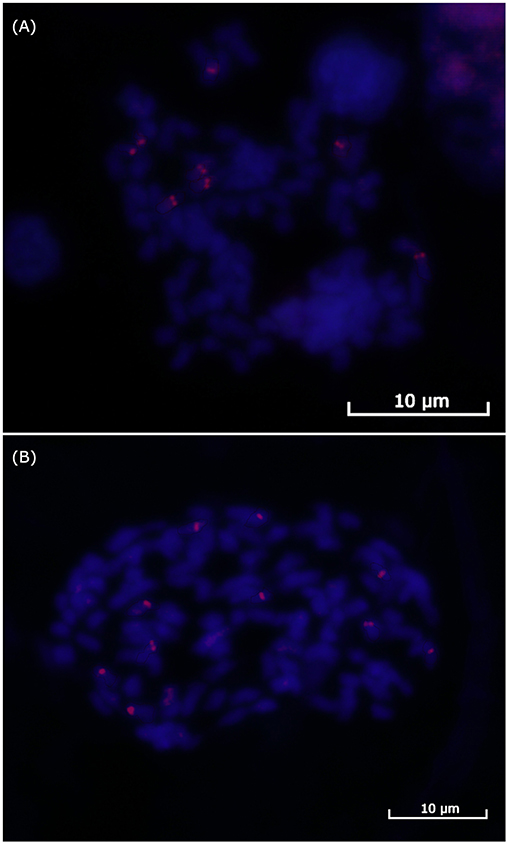
Figure 3. FISH of the sugarcane BACs. (A) BAC Shy065N22 hybridization in sugarcane variety SP-803280 mitosis showing eight signals for Region01. (B) BAC Shy048L15 hybridization in sugarcane variety SP-803280 mitosis showing 10 signals for Region02.
The results observed so far suggest differences between the haplotypes, i.e., different TEs, insertions and even gene insertions/translocations. We used an identity of 99% to determine the presence of the same BAC haplotype. The possibility of haplotypes with more than 99% similarity in vivo could not be tested with our data, since it is not possible distinguish a mismatch in a sequence assembly from a real haplotype.
Expression of HP600 and CENP-C Haplotypes
The transcriptomes of the SP80-3280 sugarcane variety from the roots, shoots, and stalks were mapped on HP600 and CENP-C (NCBI SRR7274987), and the set of transcripts was used for the transcription analyses. All of the HP600 haplotypes from Region01 were covered by the reads, including haplotype III with a premature stop codon. None of the HP600 haplotypes from Region02 were found, suggesting that HP600 is not expressed from Region02 (see Supplementary Figure 2).
For the CENP-C gene from Region01, haplotypes IV/V were found to be expressed. Furthermore, haplotypes I/II, haplotype VI and haplotype VII were fully covered by the reads, except for the first three SNPs, but these SNPs were described in the work of Talbert et al. (2004) under the CENP-C1 haplotype, suggesting that the set of reads did not cover this region. For haplotype III, one SNP was not found, but nine exclusive SNPs from this haplotype were represented. Therefore, all CENP-C haplotypes from Region01 were considered to be expressed.
The CENP-C haplotypes I/II, III, and VI from Region01 have large retrotransposons in the introns (Figure 2—black rectangles). Additionally, no evidence of substantial influence on expression could be found for this gene, which may indicate the silencing of these LTR retrotransposons, as discussed by Kim and Zilberman (2014).
The mapping of the transcript reads in the CENP-C haplotypes from Region02 revealed evidence of a chimeric gene (Figure 1, dotted rectangle, and Figure 4). The chimeric gene was formed by the first five exons from the Sobic.003G299500 sugarcane orthologous gene and the eighth to fourteenth exons from CENP-C (Figure 4C). RNAseq reads overlapped the region corresponding to the union of the chimeric gene (position 1253 from the CENP-C haplotypes from Region02 by 38 reads; Figure 4F).
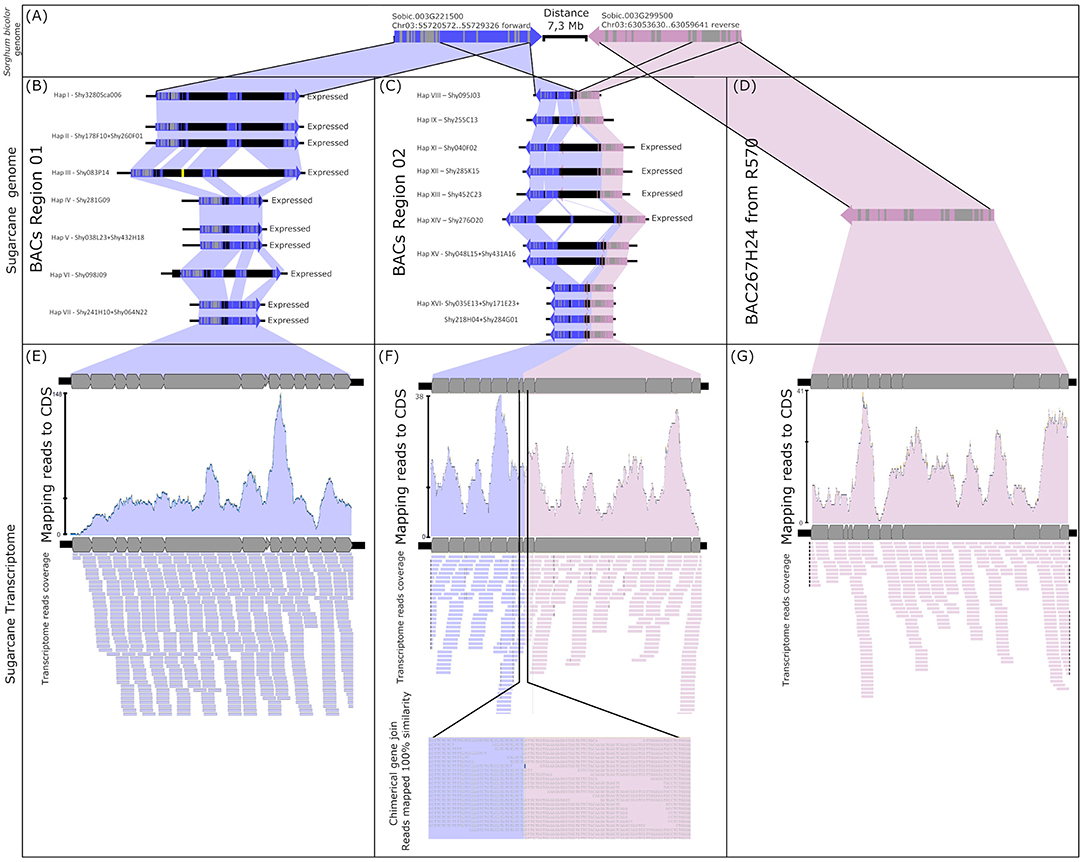
Figure 4. Fusion gene formation of CENP-C and Sobic003G299500. (A) Sorghum CENP-C and Sobic003G299500 genome location. (B) Sugarcane genomic CENP-C haplotypes in Region01 (all expressed). (C) Partially duplicated sugarcane paralogs of CENP-C and Sobic003G299500 haplotypes in Region02 (only haplotypes XI/XII/XIII and haplotype XIV have evidence of expression). (D) Sugarcane ortholog of Sobic003G299500 found in the sugarcane R570 BAC library. (E) Transcripts from sugarcane SP80-3280 mapped against the CDS of sugarcane CENP-C haplotypes from Region01. (F) Transcripts from sugarcane SP80-3280 mapped against the sugarcane chimeric paralogs of CENP-C and Sobic003G299500. As evidence of fusion gene formation, the transcripts show the fusion point of the paralogs. (G) Transcripts from sugarcane SP80-3280 mapped against the CDS of the sugarcane R570 Sobic003G299500 ortholog.
The sugarcane gene orthologous to Sobic.003G299500 was represented by BAC BAC267H24 (GenBank KF184671) from the sugarcane hybrid R570 as published by de Setta et al. (2014) under the name “SHCRBa_267_H24_F_10” (Figure 4D). This finding indicated that the ancestral genes from sorghum (orthologs) were retained in the sugarcane genome (Figures 4B–D) and that the chimeric gene was formed by the fusion of a partial duplication of CENP-C and the sorghum ortholog gene Sobic.003G299500 (Figure 4C).
Two chimeric CENP-C haplotypes from Region02 were fully mapped with transcripts, i.e., haplotypes XI/XII/XIII and haplotype XIV. The chimeric CENP-C haplotypes IX and XVI from Region02 were not fully mapped, but exclusive SNPs from these haplotypes were recovered. The CENP-C haplotypes VIII and XV from Region02 exhibited no exclusive SNPs in the transcriptome, and evidence for the expression of these two haplotypes remains undefined.
Comparison With Other Saccharum Genomes
A search for the HP600 and CENP-C genes against the sugarcane R570 mosaic monoploid genome (Garsmeur et al., 2018) returned no hits, indicating that both genes were not represented in the R570 BACs. Comparisons of the BAC sequences against the sugarcane SP80-3280 genome draft using BLASTN (Riaño-Pachón and Mattiello, 2017) resulted in matches within gene regions, but no genome contig covered a whole BAC, and the BAC TEs matched with several genome contigs (see Supplementary Figure 6). The matches with gene regions provide further support for our assembly process.
A BLAST search of the all genes recovered from Region01 and Region02 against the S. spontaneum genome (Zhang et al., 2018b) resulted in the recovery of the chromosome of each gene in S. spontaneum (see Supplementary Tables 2, 3). HP600 was found in chromosomes Chr2D, Chr3B, Chr3C and Chr3D from S. spontaneum. In chromosome Chr2D, HP600 was found as in Region02 BACs, and in chromosomes Chr3B and Chr3C, as in Region02 BACs. In chromosome Chr3D, HP600 was duplicated at positions 14833330 and 35428849, both of which had the same architecture as in Region01 (five exons).
Both the CENP-C and chimeric CENP-C sequences were used to search for the CENP-C gene. The CENP-C gene was found in S. spontaneum chromosomes Chr3B and Chr3C. Chromosome Chr3D had a duplication of CENP-C at position 14835786 (complete gene) and position 35431299 (partial, last six exons—not found in our data). In chromosome Chr7B, the 9 first exons were found, but this architecture was not found in our data. The chimeric CENP-C gene was found in chromosomes Chr2A and Chr2D.
Regarding these results, Region01 is present in Chr03B, Chr3C, and Chr3D (only in position 14835786), with HP600 and CENP-C physically side by side (see Supplementary Figure 7). Region02 is only represented in chromosome Chr02D with a duplication composed of HP600 and the CENP-C chimera physically side by side. Another copy of the CENP-C chimera was found in chromosome Chr2A, but without the presence of HP600. Additionally, the Sobic.003G299500 ortholog gene, which was fused with CENP-C, was also found with its complete sequence (as demonstrated in Figure 4D) in chromosome Chr3A at position 16992405 and duplicated in two positions, 32628152 and 60347125, in chromosome Chr3C.
How the Locus Number of Homeologs Influences Expression
We searched the SNPs in the BAC sequences and RNAseq reads (i.e., only in the transcriptome of the SP80-3280 sugarcane variety from the roots, shoots and stalks—NCBI SRR7274987) and compared the correspondences to the HP600 and CENP-C genes. For Region01 and Region02, we defined the ploidies as 8 and 10, respectively, based on the BAC-FISH data. The numbers of BAC haplotypes recovered for Region01 and Region02 were seven and nine, respectively, which indicated one missing BAC haplotype in each region.
The missing BAC haplotypes were determined by searching for SNPs present only in the transcriptome. For the HP600 haplotypes from Region01 (Table 1), six SNPs were found in the transcriptome and not in the BAC haplotypes, including a (GAG)3 -> (GAG)2 deletion. For the CENP-C gene (Table 2), eight SNPs were not represented in the genomic haplotypes. The presence of SNPs only in the transcript data corroborates the assumption that (at least) one genomic haplotype was missing in each region.
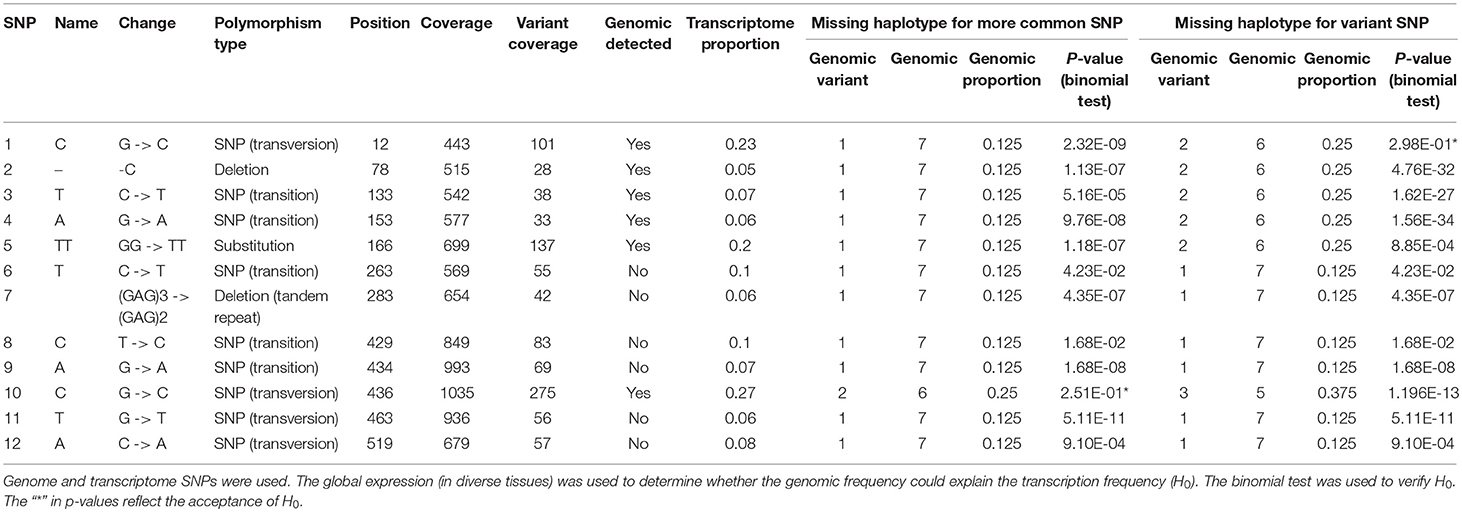
Table 1. Genomic frequencies of the SNPs in the HP600 haplotypes in Region01.
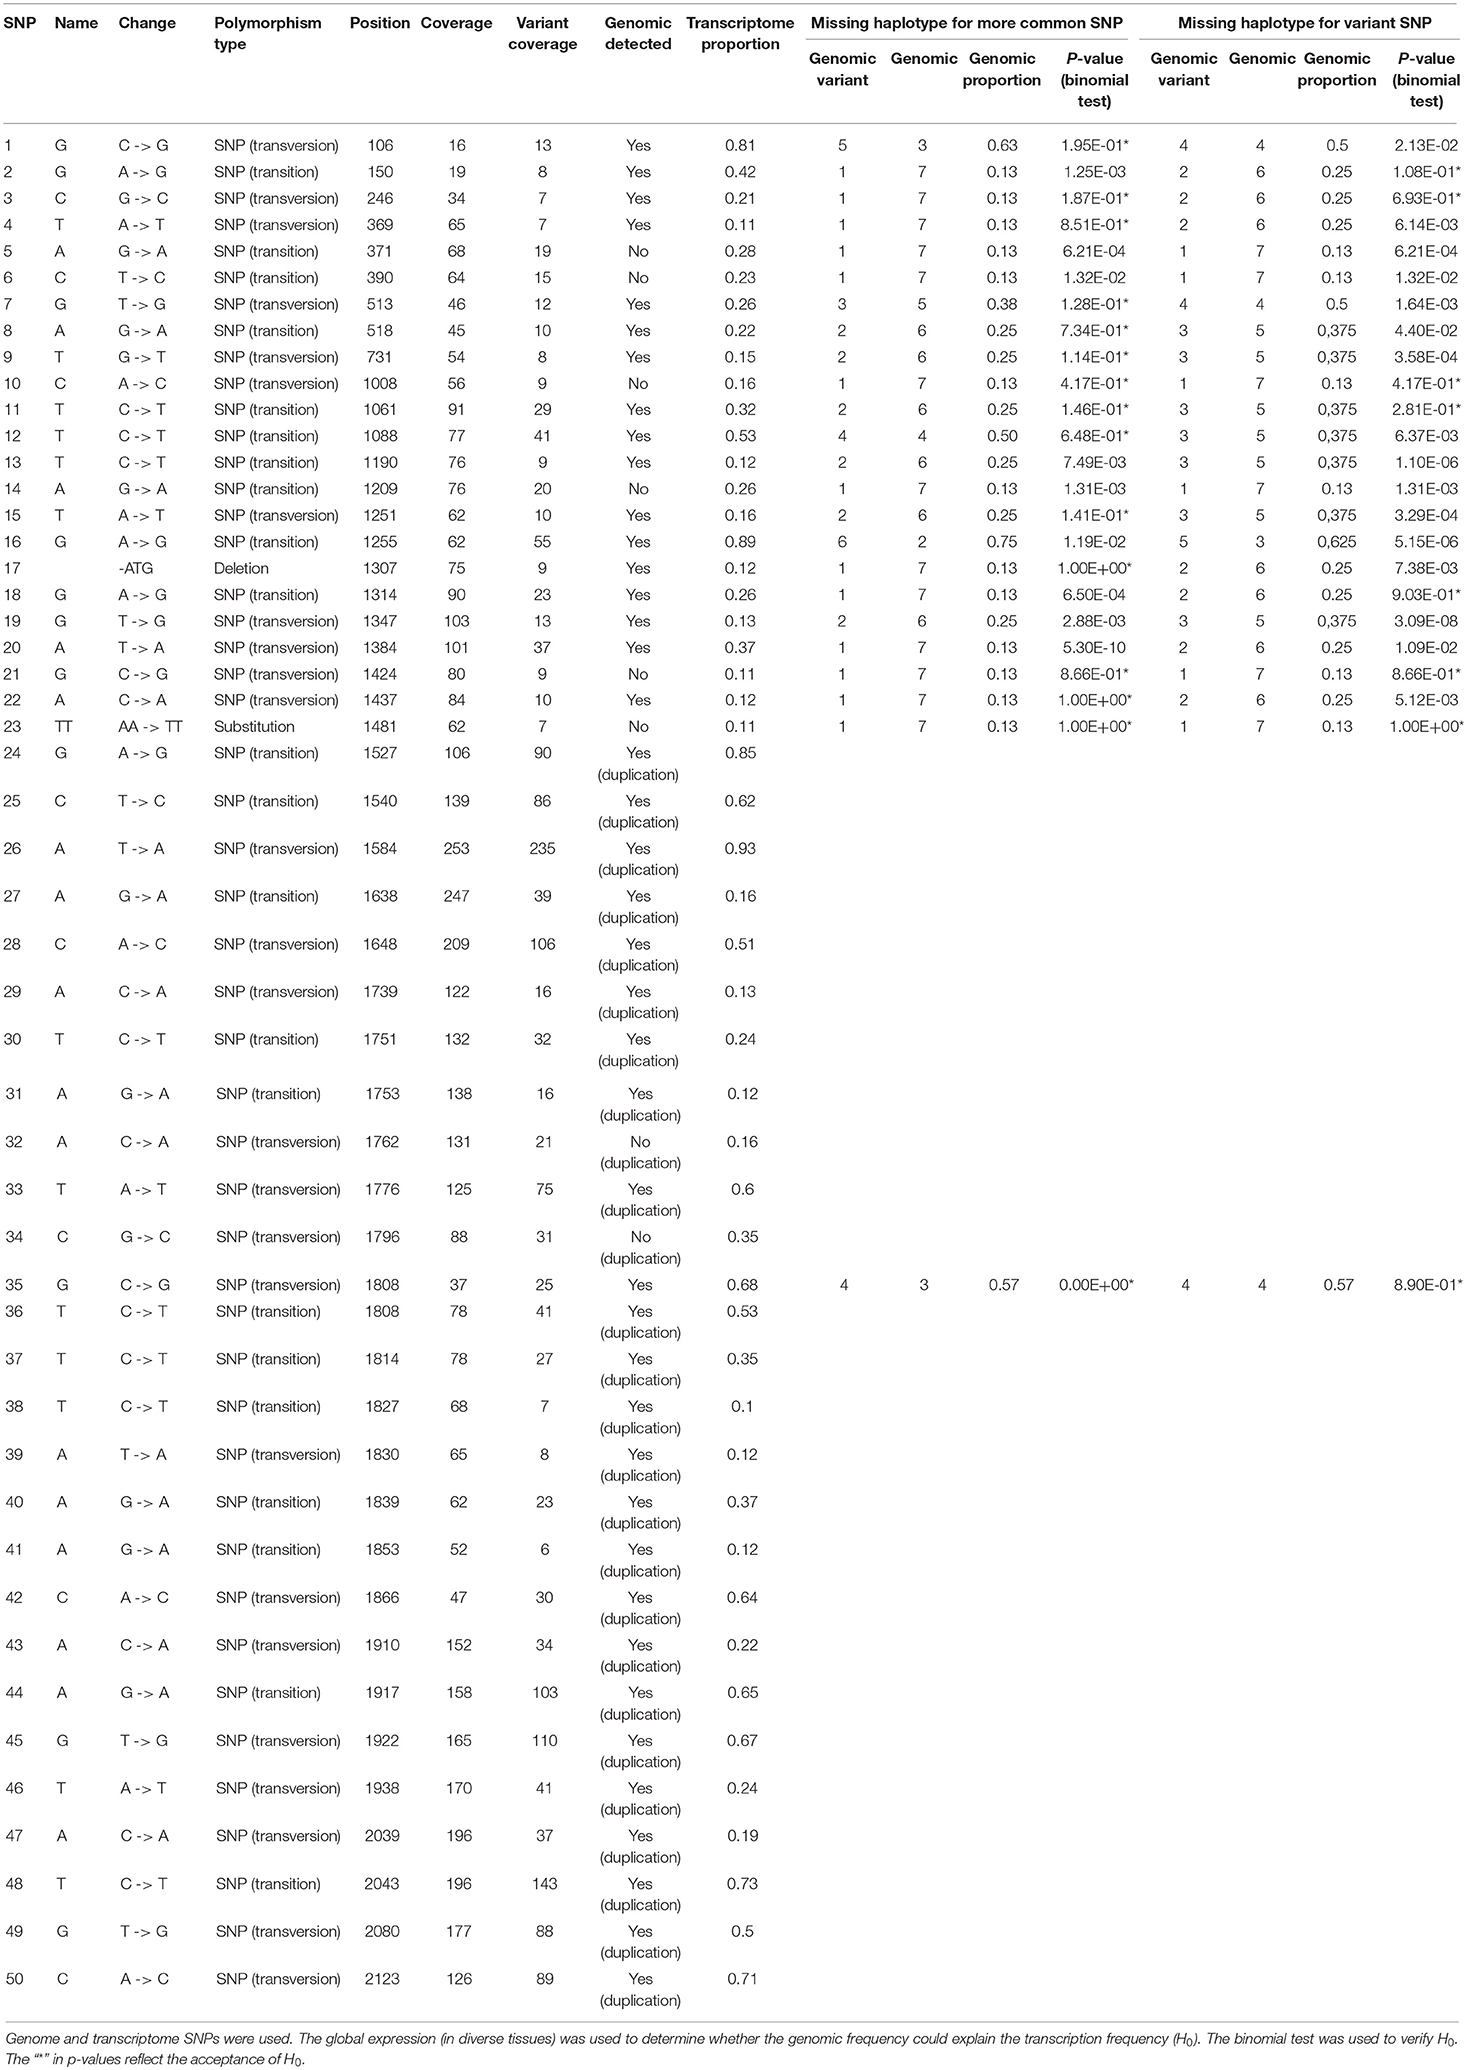
Table 2. Genomic frequencies of the SNPs in the CENP-C haplotypes in Region01 and Region02.
Using the results obtained from the RNAseq mapping of the haplotypes, we also assumed that all haplotypes for the HP600 gene were expressed in Region01 and that none were expressed in Region02. For CENP-C, all haplotypes from Region01 were considered expressed, and it was not possible to identify how many haplotypes were expressed in Region02 (chimeric gene); thus, we used only the non-duplicated portion of CENP-C (exons one to seven from the CENP-C gene).
We formed the following three assumptions using the previous results: (I) there is a missing haplotype for each region; (II) all HP600 haplotypes from Region01 are expressed, and there is no expression of HP600 in Region02; and (III) CENP-C is expressed in both regions, but it is only possible to infer that all haplotypes are expressed in Region01. Using these premises, we investigated the possibilities of the genome SNP ratio (or BAC haplotype) being expressed as the transcript SNP ratio. Therefore, if the haplotypes contribute equally to expression, one SNP found in a BAC should have the same ratio (dosage) for the transcriptome data. Since we found evidence for a missing haplotype, the following two tests were performed: (I) we determined whether the missing BAC haplotype contributed to the dosage of more common SNPs and (II) we determined whether the missing BAC haplotype contributed to the dosage of the variant SNP.
For the HP600 haplotypes from Region01 (Table 1), only SNPs 10 and 1 had significant p-values for hypotheses (I) and (II), respectively. These results suggested that the BAC haplotype ratio does not explain the transcriptome ratio. The transcript frequencies of SNPs 2, 3, and 4 (Table 1) were < 0.125 (the minimum expected ratio for 1:7). To explain these frequencies, the dosage of the SNPs should be higher than a ploidy of eight (i.e., more than twelve), and our data do not support this possibility. The three variant SNPs came from HP600 haplotype III. This finding could be evidence of some differential expression of the gene haplotypes, which could suggest that haplotype III is expressed at a lower level than the others for the HP600 gene.
For CENP-C, only the non-duplicated portions of the haplotypes from Region01 were used. At least one hypothesis was accepted for 17 (70%) SNPs (Table 2). The mean coverage of the SNPs was 64 reads per SNP, which could be considered low coverage when an eight-ploidy region (Region01) is being inspected (Table 2). Moreover, the result suggests that the haplotypes from Region01 are equally expressed.
Genetic Mapping
For the genetic mapping, 44 SNPs (see Supplementary Table 7) were used to develop molecular markers (Figure 5) and construct a genetic map. The markers from introns and exons were drawn along Region01 (Figure 5, “Location” column), including the duplicated region found in Region02. Among them, seven exhibited no variants presence in genotyping (Figure 5—“ × ” marked), but five were detected in the RNAseq reads. Two markers (Figure 5—“+” marked) were only detected for the “SuperMASSA best ploidy,” which was a ploidy higher than the “SuperMASSA expected ploidy.” Moreover, two SNP loci were genotyped two times using different capture primer pairs (SugSNP_sh061/SugSNP_sh084 and SugSNP_sh067/SugSNP_sh092), and, as expected, the dosages of the loci diverge at higher ploidy levels (>12). These results could be explained by intrinsic problems in the molecular biology that occur during the preparation of the samples, which affects the signal intensity of the Sequenom iPLEX MassARRAY® (Sequenom Inc., San Diego, CA, USA) data.
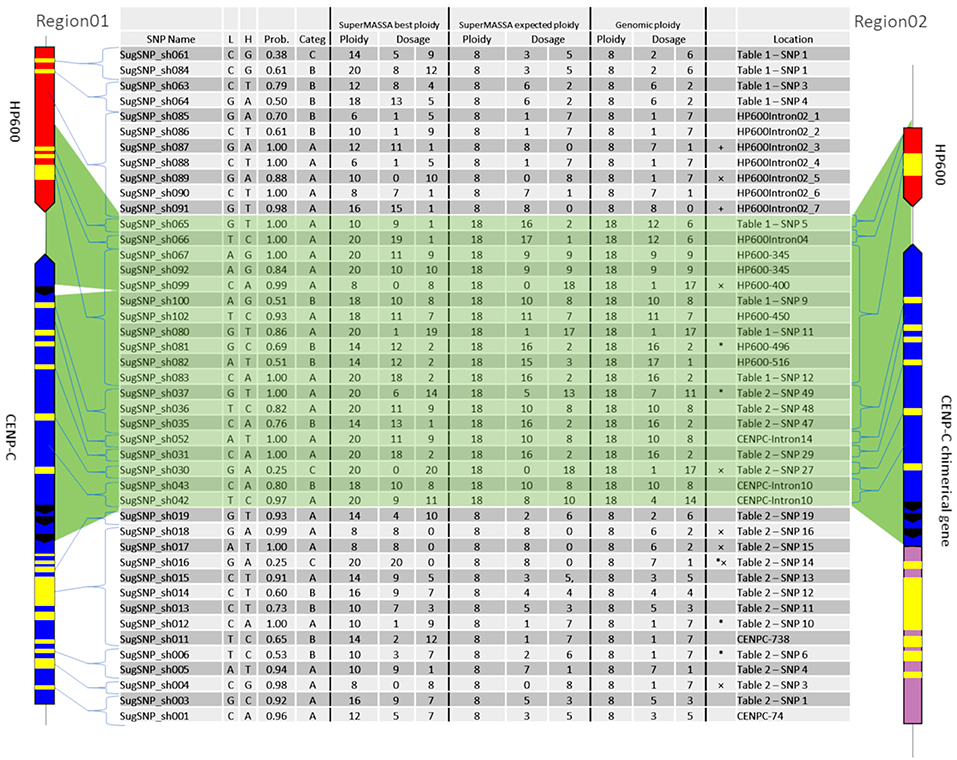
Figure 5. Ploidy and dosage in the sugarcane genomic DNA (BACs) and the SuperMASSA estimation. The location of each SNP is shown by one haplotype from Region01 and one haplotype from Region02. “SuperMASSA Best Ploidy” means the SuperMASSA best ploidy with a posteriori probability >0.8. “SuperMASSA Expected Ploidy” means we fixed the ploidy of the loci in SuperMASSA according to the BAC-FISH and BAC sequencing results. “Genomic Ploidy” means the ploidy of the loci according to the BAC-FISH and BAC sequencing results. “*” means the SNP was found only in the transcriptome.
The SuperMASSA best ploidy was equal to the genomic ploidy for six SNPs (Figure 5), and the allelic dosage confirmed in four of them. When the ploidy for the loci was fixed (8 for Region01 and 18 for Region01 and Region02 SNPs), 24 SNPs had their dosage confirmed by SuperMASSA (Figure 5—“SuperMASSA expected ploidy” columns). Notably, the estimation of the ploidy could also be a difficult task (Garcia et al., 2013), but when the ploidy used was found in BAC-FISH, the estimated dosage was in agreement with the dosage found in the BACs in 63% (28) of the SNPs (Figure 5).
For the genetic mapping, 10 markers were used according to the SuperMASSA best ploidy results. First, attempts were made to add each marker to the existing linkage groups published by Balsalobre et al. (2017), but none of the markers could be linked to the groups. Then, the markers were tested for linkage among themselves. Two linkage groups could be created (Figure 6A) with 27.4 and 32.7 cM. The SugSNP_sh065 and SugSNP_sh099 markers were physically located in Region01 and Region02, respectively. It was unexpected that duplicated markers were linked to a linkage group, even weakly (the long distance between the markers and Supplementary Figure 8).
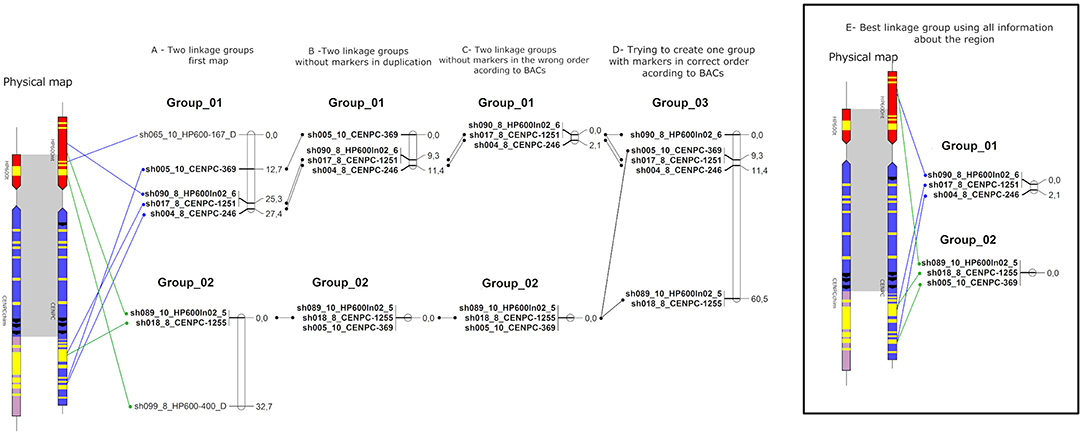
Figure 6. Schematic representation of the sugarcane linkage map. The sugarcane variety SP80-3280 SNPs were used to create multiple linkage maps with information about the sugarcane genome (BACs). (A) Linkage groups using markers in Figure 6. (B) Linkage groups without markers duplicated according to BACs. (C) Linkage groups without markers in the wrong order according to BACs. (D) Linkage group formed trying to create one group. (E) Best linkage groups using BACs information.
Using all the physical information, the duplicated markers (SugSNP_sh065 and SugSNP_sh099) were excluded (Figure 6B). Then, attempts were made to add the remaining markers to the groups again, and the SugSNP_sh005 marker was inserted into Linkage group 02 (Figure 6C). The markers that were in the wrong positions according to the physical map (BACs) were also excluded, and the SugSNP_sh005 marker was excluded from Linkage group 01 but remained in Linkage group 02 (Figure 6C). Then, an attempt was made to form one linkage group with the remaining markers by forcing OneMap to place the markers in a single group. Again, the size of the group was too large (60.3 cM—Figure 6D). Therefore, the best representation of the region was two linkage groups, with Linkage group 01 at 2.1 cM, and Linkage group 02 at 0 cM (Figure 6E).
Discussion
For genetic and genomic studies, information about genomic organization is very important. Here, we report the construction of two new BAC libraries for two important Brazilian cultivars, SP80-3280 and SPIAC93-3046, with a larger number of clones and higher sugarcane genome coverage than previously reported (Tomkins et al., 1999; Le Cunff et al., 2008; Figueira et al., 2012). The number of clones in a library is directly related to the number of homeologous regions that can be recovered.
The genomic SNP variation in sugarcane coding regions has been estimated to be one SNP every 50 bp (Cordeiro et al., 2006) and one every 86 bp (Cardoso-Silva et al., 2014). For coding Region01, one SNP was found per 70 bases. When we compared Region01 and Region02, one SNP was found per 12 bases using only the data for the SP80-3280 sugarcane variety. These results revealed a high level of diversity in sugarcane, i.e., a high number of SNPs in each region, which could be used to generate molecular markers and to improve genetic maps. Moreover, the diversity rate of both regions together could be used as an indicator of a duplicated gene, i.e., a rate < 20 (see Supplementary Table 4). However, different ratios of SNPs occur across the genome (Feltus et al., 2004).
The hypothetical gene HP600 and the CENP-C gene were used in this work as a case study. The function of HP600 is unknown, but an ortholog of this gene is present in the genomes of rice (LOC_Os01g43060), maize (GRMZM2G114380) and sorghum (Sobic.003G221600). Sobic.003G221600 (ortholog of HP600) was also found in a QTL for BRIX (Murray et al., 2008; Mace and Jordan, 2011; Mancini et al., 2018). The CENP-C protein is a kinetochore component (Kato et al., 2013; Sandmann et al., 2017) physically located next to HP600. Here, we have demonstrated the existence of paralogous genes for HP600 and CENP-C that are localized in two different homeologous sugarcane chromosome groups. The BAC haplotypes could be separated into two sugarcane homeologous groups as follows: (1) Region01 contained the collinearity region between sorghum and sugarcane HP600 and CENP-C genes and (2) Region02 contained their paralogs.
Region01 was a recurrent case of high gene conservation and collinearity among sugarcane homeologs and the S. bicolor genome as reported by other authors (Jannoo et al., 2007; Garsmeur et al., 2011; de Setta et al., 2014; Vilela et al., 2017; Mancini et al., 2018). Region02 had a more complex genomic structure than that of Region01. Region02 contains parts of the HP600 and CENP-C (paralogs) genes, and no synteny was found with sorghum genome. In Region02, a third partial gene (ortholog of Sobic.003G299500) was also found next to CENP-C, and transcriptome analysis revealed the fusion of partial CENP-C exons with the partial exons from the sugarcane ortholog of Sobic.003G299500 to form a chimeric gene. Region02 is a scrambled sugarcane sequence that was possibly formed from different noncollinear ancestral sequences, but the exonic structure of the genes was retained. Multiple events may have resulted in Region02, but the number and types (TE, translocations) of events could not be determined with our data.
No LTR retrotransposons were shared among the haplotypes from Region01 and Region02, suggesting that all LTR retrotransposon insertions occurred after the duplication. The oldest LTR retrotransposon insertions in Region02 were dated from 2.3 Mya, representing a possible age for this duplication. The presence of a set of sugarcane homeologs with very similar gene structures leads us to speculate that an ancestral event occurred prior to polyploidization (Daniels and Roach, 1987; Paterson et al., 2013) and that nobilization (Bremer, 1961) resulted in this structure.
The phylogenetic analysis of gene haplotypes from HP600 and CENP-C provided evidence that the multiple genes found in maize are the result of specific duplications in the maize taxa. Given the gene organization among the BACs, sorghum and rice revealed that HP600 and CENP-C were side by side, and the expected orthologs from maize could be GRMZM2G114380 (HP600) and GRMZM2G114315 (CENP-C) because only these two genes are physically side by side. The other maize orthologs were probably maize paralogs that resulted from specific duplications of the Z. mays genome.
The chromosome number determination of five Brazilian varieties (including SP80-3280) showed an equal number of chromosomes (2n = 112). A number of differences in the CMA/DAPI patterns were found among the different varieties analyzed in this study, suggesting differences in chromosome contents, i.e., differences in homeologous arrangement. BAC-FISH hybridization was used to indicate a ploidy of eight for Region01 and 10 for Region02. The aneuploid nature of sugarcane hybrid cultivars (D'Hont, 2005; Piperidis et al., 2010) means that they contain different numbers of homeologous chromosomes. These results suggest that the sugarcane HP600 and the CENP-C gene haplotypes in Region01 were duplicated in another group of homeologous chromosomes. Moreover, the numbers of BAC haplotypes found in each region are appropriate considering the BAC-FISH results, suggesting a missing haplotype for each region. Casu et al. (2012), Xue et al. (2014), and Sun and Joyce (2017) reported different methods to quantify the copy number of endogenous genes, some of which resulted in odd copy numbers. The absence of orthologs Sobic.003G221800 and Sobic.008G134700 (see Figure 1) in some BAC haplotypes suggest a possible explanation for the odd copy numbers. We were unable to determine whether this alteration resulted from a duplication or a translocation since we do not have a single haplotype that covers the entire region.
The homologous gene expression in polyploids can be affected in different ways, i.e., the homologous genes may retain their original function, one or more copies may be silenced, or the genes may diversify in function or expression (Ohno, 1970; Lynch and Force, 2000; Hegarty et al., 2006; Buggs et al., 2011). In complex polyploids, the roles of ploidy and genome composition in possible changes in gene expression are poorly understood (Shi et al., 2015). Even in diploid organisms, this task is difficult, as different interactions can affect the expression of a gene, and not all homologs are guaranteed to contribute to a function (Birchler et al., 2005). In Region02, the haplotypes of HP600 were not found in the transcriptome dataset (Cardoso-Silva et al., 2014; Mattiello et al., 2015), but at least two haplotypes of the CENP-C in Region02 (chimerical gene) were expressed. The gene haplotypes of HP600 from Region01 exhibited unbalanced expression; i.e., for some reason, the SNP ratio in the genome did not explain the transcriptome SNP ratio. These findings could mean that apart from the duplication, HP600 might be expressed as a single-copy gene wherein only the HP600 haplotypes in Region01 were expressed. Additionally, we could not identify the mechanisms contributing to the unbalanced expression. Therefore, the transcripts from different tissues make us speculate that some kind of tissue-specific expression could be occurring.
These results have several implications for the integration of the transcriptome and genomic data. First, for example, a gene such as HP600 that demonstrates single-copy behavior in the transcriptome data and the genomic behavior of a duplicated gene can cause bias in genetic mapping. Second, a chimeric gene such as the CENP-C haplotypes in Region02 can result in different levels of expression of the duplicated and nonduplicated gene regions in the transcriptome data. Looking at the CENP-C gene, if the gene expression quantification probe recovers the nonduplicated portion of the CENP-C gene, it will give an expression level only for the CENP-C haplotypes in Region01. In contrast, as this probe quantifies the duplicated region of CENP-C, it will result in the quantification of CENP-C from both Region01 and Region02 and thus overestimate the expression of CENP-C. Consequently, analyses of the expression of the gene for functional studies for evaluating the balance of gene expression will be biased.
Numerous molecular mechanisms are involved in the creation of new genes, such as exon shuffling, retrotransposons and gene duplications (reviewed in Long et al., 2003). Gene fusions allow the physical coupling of functions, and their occurrence in the genome increases with the genome size (Snel et al., 2000). The CENP-C motifs described by Sandmann et al. (2017) were compared with those of CENP-C genes in A. thaliana, O. sativa, Z. mays, and S. bicolor (see Supplementary Figure 9). The CENP-C haplotypes from Region02 (chimeric gene) have the same CENP-C motif as that in sorghum. The CENP-C haplotypes from Region01 have one variation in the second residue of the CENP-C motif: a glycine in sorghum and a valine in CENP-C haplotypes from Region01. This result suggests that the CENP-C haplotypes from Region01 and Region02 are able to bind to cenH3 nucleosomes.
When we compared HP600 and CENP-C found in SP80-3280 BACs with the S. spontaneum genome (Zhang et al., 2018b), we confirmed (i) the presence of the duplication region found in Region02 in one chromosome allele (Chr02D); (ii) the existence of a chimeric gene formed by CENP-C and Sobic.003G299500 located in two alleles (Chr02D and Chr02A); and (iii) evidence that the duplication found in Region02 occurred after the separation of sorghum and before the formation of the Saccharum genus.
Molecular markers were also used to compare the ploidy found in BACs with the results from the SuperMASSA software (Garcia et al., 2013). SuperMASSA uses segregation ratios to estimate ploidy, which is not the same as estimating ploidy by chromosome counting because of the differences in the estimation and the real ploidy visualized. The SNPs present in a duplication were mapped in linkage groups (Figure 6A) and demonstrated a high distance between the markers in the linkage map. The size of a genetic map is a function of the recombination fraction, with the following two factors influencing the map size: (I) the number of recombinations and linkage phase found between two markers; (II) genotyping errors. In this case, the mapping of duplicated markers is an error and is interpreted by OneMap in a recombination fraction, which inflates the map.
Two markers classified with a ploidy of 10 and one with a ploidy of 8 formed Linkage group 02 (Figure 6E). The ploidy is not a determinant for the OneMap construction of a linkage group, but the recombination fraction is. In other words, recombination fractions can still be computed between single-dose markers classified in different ploidy levels. In fact, most nulliplex, simplex and duplex individuals will have the same dosage call using either 8 or 10 as the ploidy level. Additionally, the genome data (BACs and BAC-FISH) demonstrated that all markers had the same ploidy of eight and that the physical distances among the markers were too small and thus probably resulted in the lack of recombination. The fact that we obtained two linkage groups can be explained by the possibility that single-dose markers may be linked in repulsion, and insufficient information is available to assemble all of the markers into one group. Trying to calculate the recombination fraction between markers D1 and D2 (according to the nomenclature of Wu et al., 2002) in diploids presents the same obstacle. Indeed, it is a small region where the markers should segregate together, but this segregation was not observed (Figure 6A). We reported that some duplicated markers can be mapped in the linkage map. In data with no information about physical structure, the same phenomenon could occur. Then, the information about the physical structure was used to correct this bias (Figures 6B–D), forming linkage groups with markers segregating together (Figure 6E).
Once established, the polyploidy might now fuel evolution by virtue of its polyploid-specific advantages. Vegetative propagation can lead to the retention of genes (Freeling, 2017). Vegetative propagation is widely used to propagate sugarcane (even for non-domesticated sugarcanes) and could explain the high variation in sugarcane (number of SNPs located) and the high level of gene retention. The combination of divergent genomes within a hybrid can lead to immediate, profound and highly varied genome modifications, which could include chromosomal and molecular structural modifications (Shen et al., 2005; Doyle et al., 2008; Soltis and Soltis, 2009; Jiang et al., 2011) as well as epigenetic changes (Chen et al., 2010) and global transcriptomic changes (Hegarty et al., 2006; Buggs et al., 2011). The integration of the genetic, genomic, and transcriptomic data was used to explain the interaction of the two regions in sugarcane. The HP600 and CENP-C duplication described in this work occurred sometime after the separation of sugarcane and sorghum and before the polyploidization of the Saccharum genus. This result is supported by the following information: (I) the molecular clock time; (II) the genes are present in a homeologous group of chromosomes; (III) the CENP-k motifs from the CENP-C haplotypes in Region02 are more similar to sorghum than to its paralog in sugarcane; and (IV) the duplication was observed in the S. spontaneum genome (Zhang et al., 2018b).
Genetic mapping remains a successful method to improve the production of crop plants. Sugarcane represents one of the crops with difficulties for producing accretive genetic maps, and this impacts the improvement of breeding programs. The variation in ploidy level among the loci and the duplicated genes play a special role in this problem. We used different approaches to show molecular events that affect the genetic mapping as well as the problems associated with defining the ploidy level and dosage among its alleles. Future attention should be given to the relationship between transcription and genomics, as exemplified by the HP600 gene, which has a single-copy gene behavior in the transcriptome but shows a duplicated region in the genome. The genetic, genomic, and transcriptome interactions among sugarcane homeologs remain obscure. Several works have attempted to understand these interactions (Jannoo et al., 2007; Wang et al., 2010; Garsmeur et al., 2011; Casu et al., 2012; Figueira et al., 2012; Garcia et al., 2013; de Setta et al., 2014; Xue et al., 2014; Sun and Joyce, 2017; Vilela et al., 2017; Mancini et al., 2018). The high polyploidy in sugarcane cultivars makes the detection of the ploidy of a locus a challenge (Casu et al., 2012; Garcia et al., 2013; Xue et al., 2014; Sun and Joyce, 2017).
Particular emphasis should be given to the determination studies of the ploidy level and of the duplication loci with the intention of better understanding complex polyploids. These studies remain the most original and challenging in terms of understanding the sugarcane genome. This study sheds light on the influence of the genome arrangement on transcriptome and genetic map analyses in the sugarcane polyploid genome. The integration of genomic sequence arrangements, transcription profiles, cytogenetic organization and the genetic mapping approach might help to elucidate the behavior of gene expression, the genetic structure and successful sequence assembly of the sugarcane genome. Future integrated studies will undoubtedly help to enhance our understanding of complex polyploid genomes including the sugarcane genome.
Author Contributions
AdS, DS, EF-M, HB, MV, and AG designed the study. AB, DS, HH, JF, MC, MM, MR, ND, NR, and SV performed the research. CC-S, DS, GP, MV, M-AV, and RV contributed new analytical or computational tools. AG, AB, AdS, CC-S, DS, GP, HB, LP, MM, ML, MSC, MV, and SV analyzed the data. DS, MV, and AdS wrote the paper. All authors critically read the text and approved the manuscript.
Funding
This study was supported by the São Paulo Research Foundation (FAPESP - 2008/52197-4) and Coordination for the Improvement of Higher Education Personnel (CAPES, Computational Biology Program). DS was supported by a FAPESP Ph.D. fellowship (FAPESP - 2010/50119-6). CC-S and MM were supported by PD fellowships (MM FAPESP - 2014/11482-9 and CBC-S FAPESP - 2015/16399-5). AdS received a research fellowship from the National Council for Scientific and Technological Development (CNPq).
Conflict of Interest Statement
The authors declare that the research was conducted in the absence of any commercial or financial relationships that could be construed as a potential conflict of interest.
Acknowledgments
We gratefully acknowledge Gabriel Rodrigues Alves Margarido for statistical support.
Supplementary Material
The Supplementary Material for this article can be found online at: https://www.frontiersin.org/articles/10.3389/fpls.2019.00553/full#supplementary-material
References
Balsalobre, T. W., da Silva Pereira, G., Margarido, G. R., Gazaffi, R., Barreto, F. Z., and Anoni, C. O., et al. (2017). GBS-based single dosage markers for linkage and QTL mapping allow gene mining for yield-related traits in sugarcane. BMC Genomics 18:72. doi: 10.1186/s12864-016-3383-x
Balsalobre, T. W. A., Mancini, M. C., Pereira, G. D. S., Anoni, C. O., Barreto, F. Z., and Hoffmann, H. P., et al. (2016). Mixed modeling of yield components and brown rust resistance in sugarcane families. Agron. J. 108, 1824–1837. doi: 10.2134/agronj2015.0430
Birchler, J. A., Riddle, N. C., Auger, D. L., and Veitia, R. A. (2005). Dosage balance in gene regulation: biological implications. Trends Genet. 21, 219–226. doi: 10.1016/j.tig.2005.02.010
Bremer, G. (1961). Problems in breeding and cytology of sugar cane. Euphytica 10, 59–78. doi: 10.1007/BF00037206
Buggs, R. J., Zhang, L., Miles, N., Tate, J. A., Gao, L., and Wei, W., et al. (2011). Transcriptomic shock generates evolutionary novelty in a newly formed, natural allopolyploid plant. Curr. Biol. 21, 551–556. doi: 10.1016/j.cub.2011.02.016
Cardoso-Silva, C. B., Costa, E. A., Mancini, M. C., Balsalobre, T. W., Canesin, L. E., and Pinto, L. R., et al. (2014). De novo assembly and transcriptome analysis of contrasting sugarcane varieties. PLoS ONE 9:e88462. doi: 10.1371/journal.pone.0088462
Casu, R. E., Selivanova, A., and Perroux, J. M. (2012). High-throughput assessment of transgene copy number in sugarcane using real-time quantitative PCR. Plant Cell Rep. 31, 167–177. doi: 10.1007/s00299-011-1150-7
Chen, F., He, G., He, H., Chen, W., Zhu, X., and Liang, M., et al. (2010). Expression analysis of miRNAs and highly-expressed small RNAs in two rice subspecies and their reciprocal hybrids. J. Integr. Plant Biol. 52, 971–980. doi: 10.1111/j.1744-7909.2010.00985.x
Clopper, C. J., and Pearson, E. S. (1934). The use of confidence or fiducial limits illustrated in the case of the binomial. Biometrika 26, 404–413. doi: 10.1093/biomet/26.4.404
Cordeiro, G. M., Eliott, F., McIntyre, C. L., Casu, R. E., and Henry, R. J. (2006). Characterisation of single nucleotide polymorphisms in sugarcane ESTs. Theor. Appl. Genet. 113, 331–343. doi: 10.1007/s00122-006-0300-8
Costa, E. A., Anoni, C. O., Mancini, M. C., Santos, F. R. C., Marconi, T. G., and Gazaffi, R., et al. (2016). QTL mapping including codominant SNP markers with ploidy level information in a sugarcane progeny. Euphytica 211, 1–16. doi: 10.1007/s10681-016-1746-7
Daniels, J., and Roach, B. (1987). “Taxonomy and evolution,” in Sugarcane Improvement Through Breeding, ed D. J. Heinz (Amsterdam: Elsevier), 7–84.
de Setta, N., Monteiro-Vitorello, C. B., Metcalfe, C. J., Cruz, G. M., Del Bem, L. E., and Vicentini, R., et al. (2014). Building the sugarcane genome for biotechnology and identifying evolutionary trends. BMC Genomics 15:540. doi: 10.1186/1471-2164-15-540
D'Hont, A. (2005). Unraveling the genome structure of polyploids using FISH and GISH; examples of sugarcane and banana. Cytogenet. Genome Res. 109, 27–33. doi: 10.1159/000082378
D'Hont, A., and Glaszmann, J. (2001). Sugarcane genome analysis with molecular markers, a first decade of research. Proc. Int. Soc. Sugar. Technol. 24, 556–559.
D'Hont, A., Ison, D., Alix, K., Roux, C., and Glaszmann, J. C. (1998). Determination of basic chromosome numbers in the genus Saccharum by physical mapping of ribosomal RNA genes. Genome 41, 221–225. doi: 10.1139/g98-023
Doyle, J. J., Flagel, L. E., Paterson, A. H., Rapp, R. A., Soltis, D. E., and Soltis, P. S., et al. (2008). Evolutionary genetics of genome merger and doubling in plants. Annu. Rev. Genet. 42, 443–461. doi: 10.1146/annurev.genet.42.110807.091524
Feltus, F. A., Wan, J., Schulze, S. R., Estill, J. C., Jiang, N., and Paterson, A. H. (2004). An SNP resource for rice genetics and breeding based on subspecies Indica and Japonica genome alignments. Genome Res. 14, 1812–1819. doi: 10.1101/gr.2479404
Figueira, T. R., Okura, V., da Silva, F. R., da Silva, M. J., Kudrna, D., and Ammiraju, J. S., et al. (2012). A BAC library of the SP80-3280 sugarcane variety (Saccharum sp.) and its inferred microsynteny with the sorghum genome. BMC Res. Notes 5:185. doi: 10.1186/1756-0500-5-185
Freeling, M. (2017). Picking up the ball at the K/Pg boundary: the distribution of ancient polyploidies in the plant phylogenetic tree as a spandrel of asexuality with occasional sex. Plant Cell 29, 202–206. doi: 10.1105/tpc.16.00836
Garcia, A. A., Mollinari, M., Marconi, T. G., Serang, O. R., Silva, R. R., and Vieira, M. L., et al. (2013). SNP genotyping allows an in-depth characterisation of the genome of sugarcane and other complex autopolyploids. Sci. Rep. 3:3399. doi: 10.1038/srep03399
Garsmeur, O., Charron, C., Bocs, S., Jouffe, V., Samain, S., and Couloux, A., et al. (2011). High homologous gene conservation despite extreme autopolyploid redundancy in sugarcane. New Phytol. 189, 629–642. doi: 10.1111/j.1469-8137.2010.03497.x
Garsmeur, O., Droc, G., Antonise, R., Grimwood, J., Potier, B., and Aitken, K., et al. (2018). A mosaic monoploid reference sequence for the highly complex genome of sugarcane. Nat. Commun. 9:2638. doi: 10.1038/s41467-018-05051-5
Gaut, B. S., Morton, B. R., McCaig, B. C., and Clegg, M. T. (1996). Substitution rate comparisons between grasses and palms: synonymous rate differences at the nuclear gene Adh parallel rate differences at the plastid gene rbcL. Proc. Natl. Acad. Sci. U.S.A. 93, 10274–10279. doi: 10.1073/pnas.93.19.10274
Goodstein, D. M., Shu, S., Howson, R., Neupane, R., Hayes, R. D., and Fazo, J., et al. (2012). Phytozome: a comparative platform for green plant genomics. Nucleic Acids Res. 40, D1178–D1186. doi: 10.1093/nar/gkr944
Gopalakrishnan, S., Sullivan, B. A., Trazzi, S., Della Valle, G., and Robertson, K. D. (2009). DNMT3B interacts with constitutive centromere protein CENP-C to modulate DNA methylation and the histone code at centromeric regions. Hum. Mol. Genet. 18, 3178–3193. doi: 10.1093/hmg/ddp256
Grivet, L., and Arruda, P. (2002). Sugarcane genomics: depicting the complex genome of an important tropical crop. Curr. Opin. Plant Biol. 5, 122–127. doi: 10.1016/S1369-5266(02)00234-0
Guerra, M. (1983). O uso de Giemsa em citogenética vegetal-comparação entre a coloração simples eo bandamento. Cienc. Cult. 35, 190–193.
Guerra, M., and Souza, M. J. (2002). Como Observar Cromossomos: Um Guia de Técnicas em Citogenética Vegetal, Animal e Humana. Ribeirão Preto: FUNPEC.
Hegarty, M. J., Barker, G. L., Wilson, I. D., Abbott, R. J., Edwards, K. J., and Hiscock, S. J. (2006). Transcriptome shock after interspecific hybridization in senecio is ameliorated by genome duplication. Curr. Biol. 16, 1652–1659. doi: 10.1016/j.cub.2006.06.071
Hollander, M., Wolfe, D. A., and Chicken, E. (1973). Nonparametric Statistical Methods. New York, NY: John Wiley & Sons.
Irvine, J. E. (1999). Saccharum species as horticultural classes. Theor. Appl. Genet. 98, 186–194. doi: 10.1007/s001220051057
Jannoo, N., Grivet, L., Chantret, N., Garsmeur, O., Glaszmann, J. C., and Arruda, P., et al. (2007). Orthologous comparison in a gene-rich region among grasses reveals stability in the sugarcane polyploid genome. Plant J. 50, 574–585. doi: 10.1111/j.1365-313X.2007.03082.x
Jiang, B., Lou, Q., Wu, Z., Zhang, W., Wang, D., and Mbira, K. G., et al. (2011). Retrotransposon- and microsatellite sequence-associated genomic changes in early generations of a newly synthesized allotetraploid Cucumis x hytivus Chen and Kirkbride. Plant Mol. Biol. 77, 225–233. doi: 10.1007/s11103-011-9804-y
Jukes, T. H., and Cantor, C. R. (1969). “Evolution of protein molecules,” in Mammalian Protein Metabolism, ed H. Munro (New York, NY: Academic Press), 21–132.
Kato, H., Jiang, J., Zhou, B. R., Rozendaal, M., Feng, H., and Ghirlando, R., et al. (2013). A conserved mechanism for centromeric nucleosome recognition by centromere protein CENP-C. Science 340, 1110–1113. doi: 10.1126/science.1235532
Keller, O., Kollmar, M., Stanke, M., and Waack, S. (2011). A novel hybrid gene prediction method employing protein multiple sequence alignments. Bioinformatics 27, 757–763. doi: 10.1093/bioinformatics/btr010
Kim, C., Guo, H., Kong, W., Chandnani, R., Shuang, L. S., and Paterson, A. H. (2016). Application of genotyping by sequencing technology to a variety of crop breeding programs. Plant Sci. 242, 14–22. doi: 10.1016/j.plantsci.2015.04.016
Kim, M. Y., and Zilberman, D. (2014). DNA methylation as a system of plant genomic immunity. Trends Plant Sci. 19, 320–326. doi: 10.1016/j.tplants.2014.01.014
Kimura, M. (1980). A simple method for estimating evolutionary rates of base substitutions through comparative studies of nucleotide sequences. J. Mol. Evol. 16, 111–120. doi: 10.1007/BF01731581
Kohany, O., Gentles, A. J., Hankus, L., and Jurka, J. (2006). Annotation, submission and screening of repetitive elements in repbase: repbase submitter and censor. BMC Bioinformatics 7:474. doi: 10.1186/1471-2105-7-474
Kriventseva, E. V., Kuznetsov, D., Tegenfeldt, F., Manni, M., Dias, R., and Simão, F. A., et al. (2018). OrthoDB v10: sampling the diversity of animal, plant, fungal, protist, bacterial and viral genomes for evolutionary and functional annotations of orthologs. Nucleic Acids Res. 47, D807–D811. doi: 10.1093/nar/gky1053
Kumar, S., Stecher, G., and Tamura, K. (2016). MEGA7: Molecular evolutionary genetics analysis version 7.0 for bigger datasets. Mol. Biol. Evol. 33, 1870–1874. doi: 10.1093/molbev/msw054
Landell, M. G. A., Campana, M. P., Figueiredo, P., Vasconcelos, A. C. M., Xavier, M. A., and Bidoia, M. A., et al. (2005). Variedades de Cana-de-Açúcar para o Centro-Sul do Brasil: 15a Liberação do Programa Cana IAC (1959-2005). Technical Bulletin IAC 197. Campinas: IAC.
Langmead, B., and Salzberg, S. L. (2012). Fast gapped-read alignment with bowtie 2. Nat. Methods 9, 357–359. doi: 10.1038/nmeth.1923
Le Cunff, L., Garsmeur, O., Raboin, L. M., Pauquet, J., Telismart, H., and Selvi, A., et al. (2008). Diploid/polyploid syntenic shuttle mapping and haplotype-specific chromosome walking toward a rust resistance gene (Bru1) in highly polyploid sugarcane (2n approximately 12x approximately 115). Genetics 180, 649–660. doi: 10.1534/genetics.108.091355
Long, M., Betran, E., Thornton, K., and Wang, W. (2003). The origin of new genes: glimpses from the young and old. Nat. Rev. Genet. 4, 865–875. doi: 10.1038/nrg1204
Lynch, M., and Force, A. G. (2000). The origin of interspecific genomic incompatibility via gene duplication. Am. Nat. 156, 590–605. doi: 10.1086/316992
Ma, J., and Bennetzen, J. L. (2004). Rapid recent growth and divergence of rice nuclear genomes. Proc. Natl. Acad. Sci. U.S.A. 101, 12404–12410. doi: 10.1073/pnas.0403715101
Mace, E. S., and Jordan, D. R. (2011). Integrating sorghum whole genome sequence information with a compendium of sorghum QTL studies reveals uneven distribution of QTL and of gene-rich regions with significant implications for crop improvement. Theor. Appl. Genet. 123, 169–191. doi: 10.1007/s00122-011-1575-y
Mancini, M. C., Cardoso-Silva, C. B., Sforca, D. A., and de Souza, A. P. (2018). “Targeted sequencing by gene synteny,” a new strategy for polyploid species: sequencing and physical structure of a complex sugarcane region. Front. Plant Sci. 9:397. doi: 10.3389/fpls.2018.00397
Manechini, J. R. V., da Costa, J. B., Pereira, B. T., Carlini-Garcia, L. A., Xavier, M. A., and Landell, M. G. A., et al. (2018). Unraveling the genetic structure of Brazilian commercial sugarcane cultivars through microsatellite markers. PLoS ONE 13:e0195623. doi: 10.1371/journal.pone.0195623
Mattiello, L., Riaño-Pachón, D. M., Martins, M. C., da Cruz, L. P., Bassi, D., and Marchiori, P. E., et al. (2015). Physiological and transcriptional analyses of developmental stages along sugarcane leaf. BMC Plant Biol. 15:300. doi: 10.1186/s12870-015-0694-z
McClintock, B. (1984). The significance of responses of the genome to challenge. Science 226, 792–801. doi: 10.1126/science.15739260
Ming, R., Liu, S. C., Lin, Y. R., da Silva, J., Wilson, W., and Braga, D., et al. (1998). Detailed alignment of Saccharum and Sorghum chromosomes: comparative organization of closely related diploid and polyploid genomes. Genetics 150, 1663–1682.
Murray, S. C., Sharma, A., Rooney, W. L., Klein, P. E., Mullet, J. E., and Mitchell, S. E., et al. (2008). Genetic improvement of sorghum as a biofuel feedstock: I. QTL for stem sugar and grain nonstructural carbohydrates. Crop Sci. 48, 2165–2179. doi: 10.2135/cropsci2008.01.0016
Nishiyama, M. Y. Jr., Ferreira, S. S., Tang, P. Z., Becker, S., Portner-Taliana, A., and Souza, G. M. (2014). Full-length enriched cDNA libraries and ORFeome analysis of sugarcane hybrid and ancestor genotypes. PLoS ONE 9:e107351. doi: 10.1371/journal.pone.0107351
Paterson, A. H., Moore, P. H., and Tew, T. L. (2013). “The gene pool of Saccharum species and their improvement,” in Genomics of the Saccharinae, ed A. H. Paterson (New York, NY: Springer New York), 43–71.
Piperidis, G., and D'Hont, A. (2001). “Chromosome composition analysis of various Saccharum interspecific hybrids by genomic in situ hybridization (GISH),” in Proceedings of the XXIV Congress, International Society of Sugar Cane Technologists (Brisbane, QLD), 565–566.
Piperidis, G., Piperidis, N., and D'Hont, A. (2010). Molecular cytogenetic investigation of chromosome composition and transmission in sugarcane. Mol. Genet. Genomics 284, 65–73. doi: 10.1007/s00438-010-0546-3
Ramsey, J., and Schemske, D. W. (2002). Neopolyploidy in flowering plants. Annu. Rev. Ecol. Syst. 33, 589–639. doi: 10.1146/annurev.ecolsys.33.010802.150437
Riaño-Pachón, D. M., and Mattiello, L. (2017). Draft genome sequencing of the sugarcane hybrid SP80-3280. F1000Res. 6:861. doi: 10.12688/f1000research.11859.1
Saitou, N., and Nei, M. (1987). The neighbor-joining method: a new method for reconstructing phylogenetic trees. Mol. Biol. Evol. 4, 406–425.
Sandmann, M., Talbert, P., Demidov, D., Kuhlmann, M., Rutten, T., and Conrad, U., et al. (2017). Targeting of Arabidopsis KNL2 to centromeres depends on the conserved CENPC-k motif in its C Terminus. Plant Cell 29, 144–155. doi: 10.1105/tpc.16.00720
SanMiguel, P., Gaut, B. S., Tikhonov, A., Nakajima, Y., and Bennetzen, J. L. (1998). The paleontology of intergene retrotransposons of maize. Nat. Genet. 20, 43–45. doi: 10.1038/1695
Schwarzacher, T., Ambros, P., and Schweizer, D. (1980). Application of Giemsa banding to orchid karyotype analysis. Plant Syst. Evol. 134, 293–297. doi: 10.1007/BF00986805
Schwarzacher, T., and Heslop-Harrison, P. (2000). Practical in situ Hybridization. Didcot: BIOS Scientific Publishers.
Serang, O., Mollinari, M., and Garcia, A. A. (2012). Efficient exact maximum a posteriori computation for bayesian SNP genotyping in polyploids. PLoS ONE 7:e30906. doi: 10.1371/journal.pone.0030906
Shen, Y., Lin, X.-Y., Shan, X.-H., Lin, C.-J., Han, F.-P., and Pang, J.-S., et al. (2005). Genomic rearrangement in endogenous long terminal repeat retrotransposons of rice lines introgressed by wild rice (Zizania latifolia Griseb.). J. Integr. Plant Biol. 47, 998–1008. doi: 10.1111/j.1744-7909.2005.00103.x
Shi, X., Zhang, C., Ko, D. K., and Chen, Z. J. (2015). Genome-wide dosage-dependent and -independent regulation contributes to gene expression and evolutionary novelty in plant polyploids. Mol. Biol. Evol. 32, 2351–2366. doi: 10.1093/molbev/msv116
Snel, B., Bork, P., and Huynen, M. (2000). Genome evolution. Gene fusion versus gene fission. Trends Genet. 16, 9–11. doi: 10.1016/S0168-9525(99)01924-1
Soltis, P. S., and Soltis, D. E. (2009). The role of hybridization in plant speciation. Annu. Rev. Plant Biol. 60, 561–588. doi: 10.1146/annurev.arplant.043008.092039
Souza, G. M., Berges, H., Bocs, S., Casu, R., D'Hont, A., and Ferreira, J. E., et al. (2011). The sugarcane genome challenge: strategies for sequencing a highly complex genome. Trop. Plant Biol. 4, 145–156. doi: 10.1007/s12042-011-9079-0
Sun, Y., and Joyce, P. A. (2017). Application of droplet digital PCR to determine copy number of endogenous genes and transgenes in sugarcane. Plant Cell Rep. 36, 1775–1783. doi: 10.1007/s00299-017-2193-1
Sylvain, F., Jerome, G., Stephane, R., Catherine, M., Joelle, A., and Lieven, S., et al. (2008). Genome annotation in plants and fungi: EuGene as a model platform. Curr. Bioinform. 3, 87–97. doi: 10.2174/157489308784340702
Talbert, P. B., Bryson, T. D., and Henikoff, S. (2004). Adaptive evolution of centromere proteins in plants and animals. J. Biol. 3:18. doi: 10.1186/jbiol11
Tomkins, J. P., Yu, Y., Miller-Smith, H., Frisch, D. A., Woo, S. S., and Wing, R. A. (1999). A bacterial artificial chromosome library for sugarcane. Theor. Appl. Genet. 99, 419–424. doi: 10.1007/s001220051252
Vettore, A. L., da Silva, F. R., Kemper, E. L., Souza, G. M., da Silva, A. M., and Ferro, M. I., et al. (2003). Analysis and functional annotation of an expressed sequence tag collection for tropical crop sugarcane. Genome Res. 13, 2725–2735. doi: 10.1101/gr.1532103
Vieira, M. L. C., Almeida, C. B., Oliveira, C. A., Tacuatia, L. O., Munhoz, C. F., and Cauz-Santos, L. A., et al. (2018). Revisiting meiosis in sugarcane: chromosomal irregularities and the prevalence of bivalent configurations. Front. Genet. 9:213. doi: 10.3389/fgene.2018.00213
Vilela, M. M., Del Bem, L. E., Van Sluys, M. A., de Setta, N., Kitajima, J. P., and Cruz, G. M., et al. (2017). Analysis of three sugarcane homo/homeologous regions suggests independent polyploidization events of Saccharum officinarum and Saccharum spontaneum. Genome Biol. Evol. 9, 266–278. doi: 10.1093/gbe/evw293
Wang, J., Roe, B., Macmil, S., Yu, Q., Murray, J. E., and Tang, H., et al. (2010). Microcollinearity between autopolyploid sugarcane and diploid Sorghum genomes. BMC Genomics 11:261. doi: 10.1186/1471-2164-11-261
Woodhouse, M. R., Schnable, J. C., Pedersen, B. S., Lyons, E., Lisch, D., and Subramaniam, S., et al. (2010). Following tetraploidy in maize, a short deletion mechanism removed genes preferentially from one of the two homologs. PLoS Biol. 8:e1000409. doi: 10.1371/journal.pbio.1000409
Wu, R., Ma, C. X., Painter, I., and Zeng, Z. B. (2002). Simultaneous maximum likelihood estimation of linkage and linkage phases in outcrossing species. Theor. Popul. Biol. 61, 349–363. doi: 10.1006/tpbi.2002.1577
Xu, Z., and Wang, H. (2007). LTR_FINDER: an efficient tool for the prediction of full-length LTR retrotransposons. Nucleic Acids Res. 35, W265–W268. doi: 10.1093/nar/gkm286
Xue, B., Guo, J., Que, Y., Fu, Z., Wu, L., and Xu, L. (2014). Selection of suitable endogenous reference genes for relative copy number detection in sugarcane. Int. J. Mol. Sci. 15, 8846–8862. doi: 10.3390/ijms15058846
Zhang, J., Zhang, Q., Li, L., Tang, H., Zhang, Q., and Chen, Y., et al. (2018a). Recent polyploidization events in three Saccharum founding species. Plant Biotechnol. J. 17, 264–274. doi: 10.1111/pbi.12962
Zhang, J., Zhang, X., Tang, H., Zhang, Q., Hua, X., and Ma, X., et al. (2018b). Publisher correction: allele-defined genome of the autopolyploid sugarcane Saccharum spontaneum L. Nat. Genet. 50, 1754.
Keywords: chimerical gene, genetic mapping, homologs, physical mapping, polyploid, sugarcane
Citation: Sforça DA, Vautrin S, Cardoso-Silva CB, Mancini MC, Romero-da Cruz MV, Pereira GdS, Conte M, Bellec A, Dahmer N, Fourment J, Rodde N, Van Sluys M-A, Vicentini R, Garcia AAF, Forni-Martins ER, Carneiro MS, Hoffmann HP, Pinto LR, Landell MGdA, Vincentz M, Berges H and Souza AP (2019) Gene Duplication in the Sugarcane Genome: A Case Study of Allele Interactions and Evolutionary Patterns in Two Genic Regions. Front. Plant Sci. 10:553. doi: 10.3389/fpls.2019.00553
Received: 16 January 2019; Accepted: 11 April 2019;
Published: 07 May 2019.
Edited by:
Jacqueline Batley, University of Western Australia, AustraliaReviewed by:
Robert VanBuren, Michigan State University, United StatesAureliano Bombarely, University of Milan, Italy
Copyright © 2019 Sforça, Vautrin, Cardoso-Silva, Mancini, Romero-da Cruz, Pereira, Conte, Bellec, Dahmer, Fourment, Rodde, Van Sluys, Vicentini, Garcia, Forni-Martins, Carneiro, Hoffmann, Pinto, Landell, Vincentz, Berges and de Souza. This is an open-access article distributed under the terms of the Creative Commons Attribution License (CC BY). The use, distribution or reproduction in other forums is permitted, provided the original author(s) and the copyright owner(s) are credited and that the original publication in this journal is cited, in accordance with accepted academic practice. No use, distribution or reproduction is permitted which does not comply with these terms.
*Correspondence: Anete Pereira de Souza, YW5ldGVAdW5pY2FtcC5icg==